school of advanced study metrics, 2013-14 - sas.ac.uk metrics 2013-14... · sas used 2013-14 to...
TRANSCRIPT

School of Advanced Study Metrics, 2013-14
Table of content:
1. Promotion and facilitation: .......................................................................................... 2• Events ..................................................................................................................... 2• Events Footfall and Podcast Views ......................................................................... 3• Research training provision and delivery ................................................................. 4• Networks and collaborations (hosted and/or supported by the school) .................... 5
2. Research support: ...................................................................................................... 6• Usage of SAS Libraries ........................................................................................... 6• SAS Libraries’ Collections ....................................................................................... 7• Number and Use of digital resources ...................................................................... 8• Range of digital resources ...................................................................................... 9• SAS Publishing: books and monographs .............................................................. 10• SAS Publishing: journals ....................................................................................... 11• Fellowships ........................................................................................................... 12
3. Quality of SAS Research Base: ................................................................................ 13• Staff Research ...................................................................................................... 13• PhD registrations 2013 ......................................................................................... 13• External research grant performance: Applications, Awards, Success rate ........... 14• External Income (spend 2013-14) ......................................................................... 15
December 2014 School Strategic Advisory Group
1 School of Advanced Study Metrics, 2013-14
1. Promotion and facilitation:
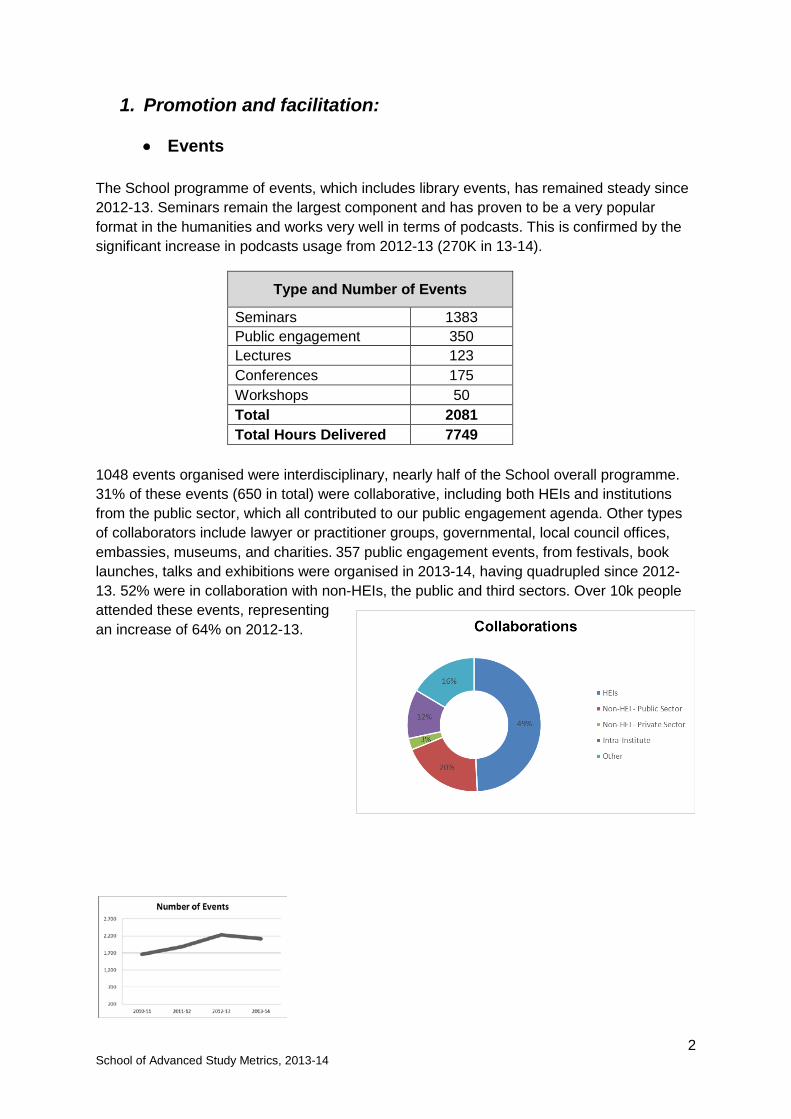
• Events The School programme of events, which includes library events, has remained steady since 2012-13. Seminars remain the largest component and has proven to be a very popular format in the humanities and works very well in terms of podcasts. This is confirmed by the significant increase in podcasts usage from 2012-13 (270K in 13-14).
1048 events organised were interdisciplinary, nearly half of the School overall programme. 31% of these events (650 in total) were collaborative, including both HEIs and institutions from the public sector, which all contributed to our public engagement agenda. Other types of collaborators include lawyer or practitioner groups, governmental, local council offices, embassies, museums, and charities. 357 public engagement events, from festivals, book launches, talks and exhibitions were organised in 2013-14, having quadrupled since 2012-13. 52% were in collaboration with non-HEIs, the public and third sectors. Over 10k people attended these events, representing an increase of 64% on 2012-13.
Type and Number of Events
Seminars 1383 Public engagement 350 Lectures 123 Conferences 175 Workshops 50 Total 2081 Total Hours Delivered 7749
2 School of Advanced Study Metrics, 2013-14

• Events Footfall and Podcast Views
The School has recorded an increase in its events footfall of 10% with the majority of speakers coming from outside the UK.
While attendance varies widely from within the UK, the number of streams and downloads is much higher from outside the UK, with an increase of 35% from last year. The School holds 96 collections on ITunes and 15 playlists on YouTube.
Footfall
Origin Speakers Participants
UoL 1,472 19,653
London 1,201 16,971
Rest of the UK 2,200 14,527
Rest of World 2,389 5,602 Total 7,203 56,752
Podcasts
Record Views Total
Streams 66.7K
Downloads 63.1K
Views/visits 151.2K
3 School of Advanced Study Metrics, 2013-14

• Research training provision and delivery The number of research training events held this year was higher than 2012-13. Events vary in format from one-to-one sessions, to curriculum-led as well as graduate-led workshops and seminars. We expect the figures to continue to increase with the programme of training associated with the new London Arts and Humanities Partnership.
19% of events were collaborative with HEIs, another 6% between institutes, and 14% with non-HEIs and organizations from both the public and private sectors including the British Library, English Heritage and TNA. Footfall has increased since 2012-13 by about 20%.
Overall usage of our portals, (inc. PORT, which offers online research training and resources in modern languages) shows the wide geographical reach of the School research training progamme and has recorded 221K page views in 2013-14, which nearly tripled since 2012-13, which recorded 86K page views then.
Number of Events
Research Training Summer Schools Number of Events Total Hours Number of Events Total Hours
213 1328:40 11 435
Footfall
Origin Speakers Participants
UoL 341 3448
London 101 331 Rest of the UK 108 758
Rest of the World 40 387
Total 591 4924
4 School of Advanced Study Metrics, 2013-14

• Networks and collaborations (hosted and/or supported by the school)
The School actively supports over 300 networks and collaborations and is a member of over 120 (excluding staff’s personal networks). This represents a 12% increase from 2012-13. These networks attract over 18k of researchers and over 4k of institutions, which are predominantly UK-based.
The number of networks varies, from institute to institute, between 11 up to 70 per institute. Among the 300 it actively supports, the School itself hosts 192 networks, mostly national in scope, which represents 46% of the overall number. Over 53% of these networks contribute to the School event programme and 21% to School publishing activities. 62% of networks hosted by the School are national in remit. The majority of outputs from these networks are events, publications, digital partnerships, grant applications and funding partnerships.
Number of Networks and Collaborations
Research related 223 Subject field/discipline-specific 124
Event related 140
Publications Related 50 Digital Resources Related 24 Research Training 31 Fellowship related 14 Policy-making 13 Library related 12 Teaching related 10 Total 423
5 School of Advanced Study Metrics, 2013-14

2. Research support:
• Usage of SAS Libraries
Visits to SAS libraries record a much higher number of students than are registered users. These statistics include four of the SAS-owned libraries: Legal, Classical, Historical and Warburg libraries, and exclude the Germanic, Latin American and Commonwealth collections which are comingled with Senate House Library.
SAS Libraries’ usage
MPhil/ PhD
Academic Staff
MA Students
Independent Scholars
Non-HEI commercial
/private companies
Non-HEI Public Sector
Other Total
Readers Registrations 3,559 6,690 3,561 2,640 687 196 988 18,321
Footfall 49,692 35,913 73,926 8,341 1,366 1,035 6,295 202,891
E-Resources (page views) 147,020 162,725 397,289 668 707,702
Loans 6,806 4,697 210 777 23 25,925 38,438
The number of readers registered remains consistent with 2012-13 figures. However, the number of footfall is 4% higher than 2012-13 with an additional 8k of visitors in 2013-14.
6 School of Advanced Study Metrics, 2013-14

• SAS Libraries’ Collections SAS libraries collections have increased overall since 2012-13, in particular electronic resources which have quadrupled (2,614 items recorded in 2012-13).
Physical Stock No. of Books and
Pamphlets No. of
Serial titles No. of
Microfilms No. of
Microfiches No. of
Cassettes Total
688,946 206,884 5,007 44,796 204 945,837
The annual survey conducted by BAILII demonstrated in 2013: 93 university and college libraries in the UK and Ireland responded and 70% stated that the British and Irish Legal Information Institute at www.bailii.org/ was ‘The most popular free website with legal content which assists teaching staff and students in their law studies and which they access frequently.‘
Catalogue additions have doubled since 2012-13, when recorded 18,994 items were recorded.
Electronic Resources
Electronic Databases
Electronic Journal
Collections
Electronic Books
Electronic Primary
Resources
CD-ROMs - stand alone
CD-ROMs - networked DVDs Total
27 290 0 6,881 857 301 68 8,424
Serial Titles
Periodical Titles Added 2013-14
Total Periodical Titles
Book Serial Titles
14 61 4,534
Acquisitions 2013-14
Books and Pamphlets Serial Volumes Withdrawals Total
8,325 2,864 251 10,938
Catalogue additions 2013-14 New
Records Records Edited Total
10,261 36,151 46,412
7 School of Advanced Study Metrics, 2013-14

• Number and Use of Digital Resources The number of resources has increased since 2012-13, in particular project blogs and other scholarly communication platforms, though usage figures remain relatively constant in comparison with last year. Downloads of particular resources available at the School such as papers on our institutional repository SAS-Space, images via the Iconographic collection of the Warburg Institute, or PDF files such as the BAILII quick guide available via the Institute of Advanced Legal Studies website, represent 4.3m overall. Streams have increased overall by 32% since 2012-13.
Unique users have increased by 22% since 12-13
Subscribers represent over 45k of individuals across all platforms. Usage of social media and blogs has also increased from 2012-13, from 10K ‘likes’ and 20k followers, to 23.7k and 24.2k respectively.
Record Views
Total Visits Total Unique Visitors Total Page Views Total Streams Total Downloads
20,780,395 11,066,989 85,246,630 66,796 4,386,210
Subscribers and users
Total Subscribers Total Likes Total Followers
45,390 23,714 24,226
8 School of Advanced Study Metrics, 2013-14

• Range of Digital Resources
The range of digital resources continues to grow and diversify, and while overall the usage has remained consistent with the previous year, SAS e-repositories’ usage doubled since 2012-13 (from a record view of 29.8k), our events websites (including PhilEvents and HistEvents) have also nearly doubled allowing SAS to pass 1 million views with this type of resources. As noted earlier, portals have more than doubled their record views from 81.2K in 2012-13. Resources which include data platforms have increased by 300,000 views,
teaching and learning resources have increased by 100,000 views.
Type Number Page Views % of total page views
Society’s websites, including friends and alumni 8 113,276 0.13%
School centres’ websites 16 299,279 0.35% School and Institute main websites 11 7.1m 8.37% E-journals hosted/run by the School 8 1.46m 1.72% E-repositories; 3 65k 0.08 Events websites 10 1.12m 1.32% Online databases (Digital repositories of primary and secondary sources…) 8 62m 72.77%
Portals 5 221k 0.26%
Project websites (active) 25 2.4m 2.86%
Project websites (no longer active) 5 367k 0.43% Research resources 39 9.4m 11.06% Teaching and learning resources. 3 426.6k 0.50% Blogs 25 84.5k 0.10% Podcast Platforms 4 see downloads 0.00% Social media and network platforms 42 49.8k 0.06% Total 212 85,246,630 100%
9 School of Advanced Study Metrics, 2013-14
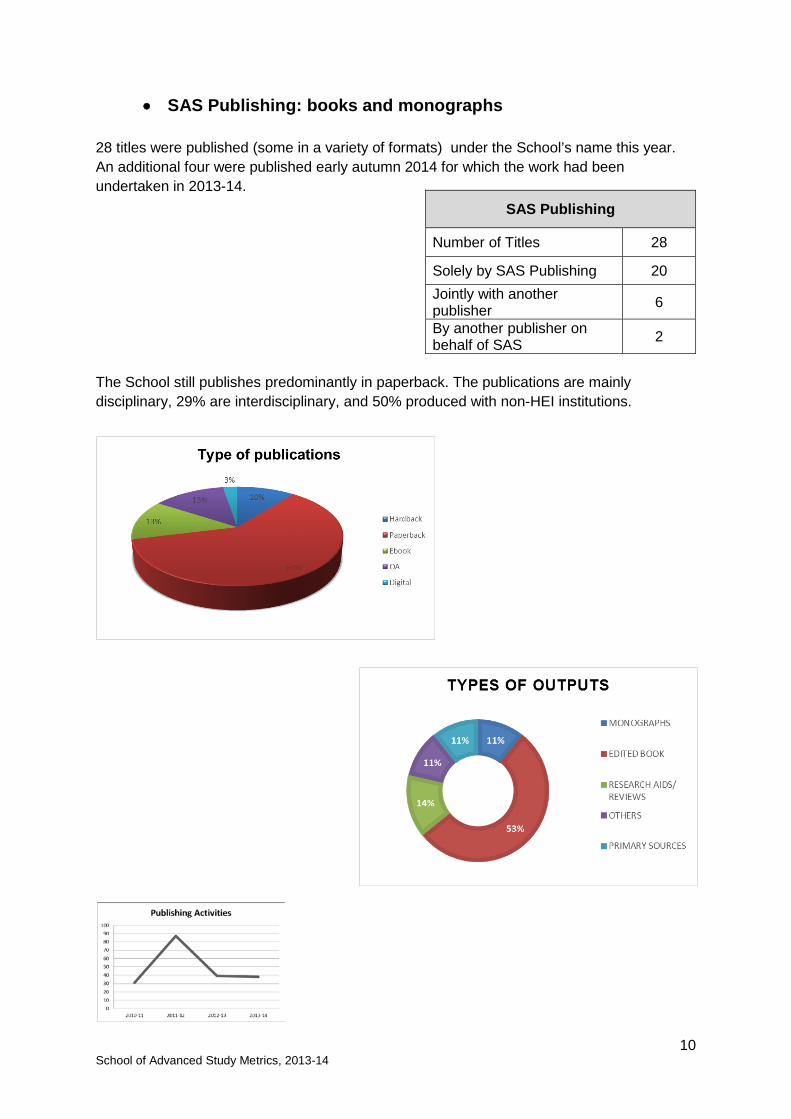
• SAS Publishing: books and monographs 28 titles were published (some in a variety of formats) under the School’s name this year. An additional four were published early autumn 2014 for which the work had been undertaken in 2013-14.
The School still publishes predominantly in paperback. The publications are mainly disciplinary, 29% are interdisciplinary, and 50% produced with non-HEI institutions.
SAS Publishing
Number of Titles 28
Solely by SAS Publishing 20 Jointly with another publisher 6
By another publisher on behalf of SAS 2
10 School of Advanced Study Metrics, 2013-14

• SAS Publishing: journals The School manages 15 journals and 52 issues were published in 2013-14: 67% of our journals are interdisciplinary.
SAS Journals
Number of Journals Solely by SAS Jointly with another publisher By another publisher on behalf of SAS
15 3 6 6
E-journals’ usage show 1.4m page views in 2013-14. While this represents 2% of the total record views across the School’s resources, it is an important increase from 2012-13, which recorded 1.15m. There are approximately 24K users of open-access journals. Like the publishing activities, SAS journals show an equal split between disciplinary (53%) and interdisciplinary (47%) coverage.
11 School of Advanced Study Metrics, 2013-14

• Fellowships The School fellowship schemes aim to provide a supportive and well-resourced research environment for scholars at all levels and from all around the world. In 2013-14, 135 fellows visited the School and 56% contributed to the School programme of activities, whether by speaking at events in SAS or at partner institutions. 70% of these visiting fellows came from Europe or the Rest of the World, which represents a 23% increase of international fellows from 2012-13. 45% were early-career researchers, while 36% were mid-career to professorial level.
Visiting fellowships attract primarily overseas scholars (EU and US). All other fellows are mainly from the UK and the EU. 38 % or 51 visiting fellows conducted interdisciplinary research and around 50% contributed to the School outputs in 2013-14, primarily the School’s event programme.
Fellows
Type Number
Visiting Fellows 135 Honorary Senior Research Fellows 304
Associate Fellows 292 Other 12 Total 743
Number of visiting fellows at the stage of their careers
Early - C Mid - C Prof level
61 28 22
Number of visiting fellows per subject fields
Disciplinary interdisciplinary
66 51
12 School of Advanced Study Metrics, 2013-14

3. Quality of SAS Research Base:
• Staff Research Members of the School, and members of staff in particular, produce and disseminate research which underpin the School’s research promotion and facilitation mission. In 2013-14, SAS recorded over 400 publications produced by staff and senior research fellows.
Representing 25.5 FTE*, our core academic members of staff generated over 300 different outputs in 2013-14 (which, with outputs from non-core and senior fellows, increase to more than 700). Outputs include talks, keynote speeches, radio and TV interviews, editing, reviews, conference papers, as well as the publication of articles and other works, whether linked to personal research, to the externally-funded project they are leading or collaborating on, or consultancy for which their particular expertise was sought. (Item 9d provides a sample of the publications over the last five years from the current School academic staff.)
• PhD registrations 2013 Overall the number of PhD students increased by 13% in 2013-14 (56 FT/29PT/16W). No PRES was conducted this year. The next national survey on postgraduate research experience will be conducted in 2014-15.
Academic Staff and Senior Fellows’ Publications
Total Publications
Total Core Staff (headcount)
Total Non-Core Staff (headcount)
Total Senior Research Fellows
Average number of publications
397 33* 29 77 2.89
Publications by members of staff include for 2013-14 Monographs 4 Jointly authored or edited works 10 Edited Books 20 Chapters in Books 31 Papers 77 Research Aids 7 Reviews 14 Total 164
Number of Postgraduate Students, 2013 (headcount) Full Time Part Time Writing up
67 35 20
13 School of Advanced Study Metrics, 2013-14

• External research grant performance: Applications, Awards, Success rate
Fewer grant applications were made in 2013-14, however some immediate successes were recorded such as 3 Big Data projects, 1 led by the SAS and two by The National Archives. The sums of money involved are reflective of the collaborative nature of the projects. However the data does not take into account the increasing number of partnerships (inc UNHABITAT) or consultancies being developed in 2013-14. Results on two large grant applications made in 2013-14 are also still pending at the time of writing this report.
SAS has not attained the same success rate as in 2012-13 (42%), but 34% is still at the national average. 2013-14 saw the start of two large projects, including the AHRC funded projects Rethinking the Senses, and Make Do and Mend, and also the HERA project Encounters with Orient in Early Modern Scholarship. Outputs from ongoing research project such as Pushing the Boundaries, funded by the ESRC, included the presentation of a paper in Spanish based on a research article 'The New Wave: Forced Displacement caused by Organised Crime in Central America and Mexico' in Antigua, Guatemala, at an event co-organised with UN Office for the Coordination of Humanitarian Affairs (OCHA).
While SAS continues to apply mainly to the RCUK, the Leverhulme Trust and the British Academy, applications to the ERC and REA are increasing, either as lead applicant or collaborator. SAS used 2013-14 to become familiar with Horizon 2020 and EU funding opportunities. This was the first year that six Marie Curie Fellowship applications were submitted on behalf of the School. The School currently holds two Marie-Curie Fellowships.
Number of applications
Submitted Successful Waiting for results Unsuccessful SAS
PI SAS Co-I
SAS sole PI
44 15 7 24 5 8 30
Funding Analysis
Funding sought £4.25m worth of projects / £942.3k (SAS part only)
Funding awarded £240k
Success Rate 34%
14 School of Advanced Study Metrics, 2013-14

• External Income (spend 2013-14) Having had a very successful year in 2012-13, the School research income increased by 37% in 2013-14. Other external income (noted under other sources in the table and graph below) includes consultancies, sponsorships, donations and grants for RPF activities. This has also increased by 22% since 2012-13.
Digital income included projects which were coming to an end, such as the JISC-funded project SMART: the Social Media Assessment for Research Transfer. Fellowships income included the large Andrew Mellon- funded fellowship programme. Additionally, the School holds collaborative doctoral awards and training grants such as the Quantitative Research Skills Training grant, for which income appears under RT. Sources of funding, while predominantly from the UK, also include EU and overseas funds, bringing the total external funding for the School to a little over £3m.
External funding Analysis
Research Income Other external income Core FTE staff (academic only)
Research Income per FTE
£1.84m £1.28m 25.5 £71.7K
1%3% 3%
13%
17%
4%
59%
External Income
Digital
Publications
Events
Other
Fellowships
RT
Research
15 School of Advanced Study Metrics, 2013-14