using function point metrics for software economic studies...
TRANSCRIPT
FPEcon\1Copyright © 2008. All Rights Reserved.
Using Function Point MetricsFor Software Economic Studies
Email: [email protected]://www.spr.com
Software Productivity Research LLC
June 27, 2008
Capers Jones, Chief Scientist Emeritus
FPEcon\2Copyright © 2008. All Rights Reserved.
REASONS FOR SUCCESS OF FUNCTION POINTS
• Function points match standard economic definitionsfor productivity analysis:
“Goods or services produced per unitof labor or expense.”
• Function points do not distort quality and productivityas do “Lines of Code” or LOC metrics.
• Function points support activity-based cost analysis,baselines, benchmarks, quality, cost, and value studies.
FPEcon\3Copyright © 2008. All Rights Reserved.
REASONS FOR SUCCESS OF FUNCTION POINTS
• Lines of code metrics penalize high-level programminglanguages.
• If used for economic studies with more than one languageLOC metrics should be considered professional malpractice.
• Cost per defect metrics penalize quality and make buggysoftware look best. For quality economic studies cost perdefect metrics are invalid. Function points are best.
• Function point metrics have the widest range of useof any software metric in history: they work for botheconomic and quality analyses.
FPEcon\4Copyright © 2008. All Rights Reserved.
MAJOR FUNCTION POINT USES CIRCA 2008• Function points are now a standard sizing metric.
• Function points are now a standard productivity metric.
• Function points are now a powerful quality metric.
• Function points are now a powerful schedule metric.
• Function points are now a powerful staffing metric.
• Function points are now used in software litigation.
• Function points are now used for outsource contracts.
• Function points can be used for cost analysis (with care).
• Function points can be used for value analysis (with care.)
FPEcon\5Copyright © 2008. All Rights Reserved.
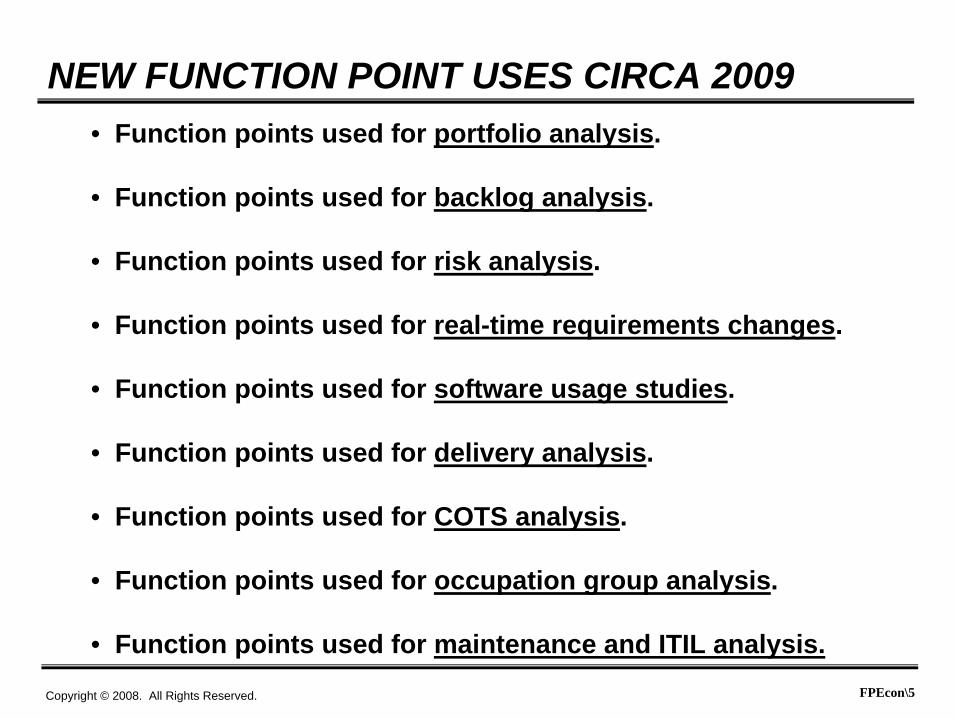
NEW FUNCTION POINT USES CIRCA 2009• Function points used for portfolio analysis.
• Function points used for backlog analysis.
• Function points used for risk analysis.
• Function points used for real-time requirements changes.
• Function points used for software usage studies.
• Function points used for delivery analysis.
• Function points used for COTS analysis.
• Function points used for occupation group analysis.
• Function points used for maintenance and ITIL analysis.
FPEcon\6Copyright © 2008. All Rights Reserved.
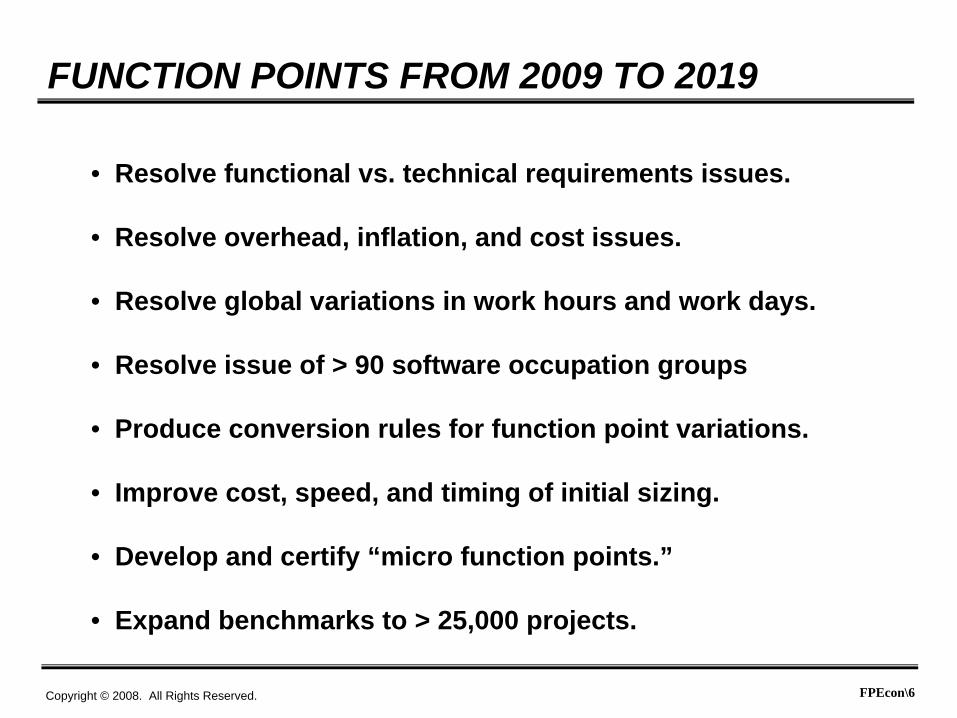
FUNCTION POINTS FROM 2009 TO 2019
• Resolve functional vs. technical requirements issues.
• Resolve overhead, inflation, and cost issues.
• Resolve global variations in work hours and work days.
• Resolve issue of > 90 software occupation groups
• Produce conversion rules for function point variations.
• Improve cost, speed, and timing of initial sizing.
• Develop and certify “micro function points.”
• Expand benchmarks to > 25,000 projects.
FPEcon\7Copyright © 2008. All Rights Reserved.
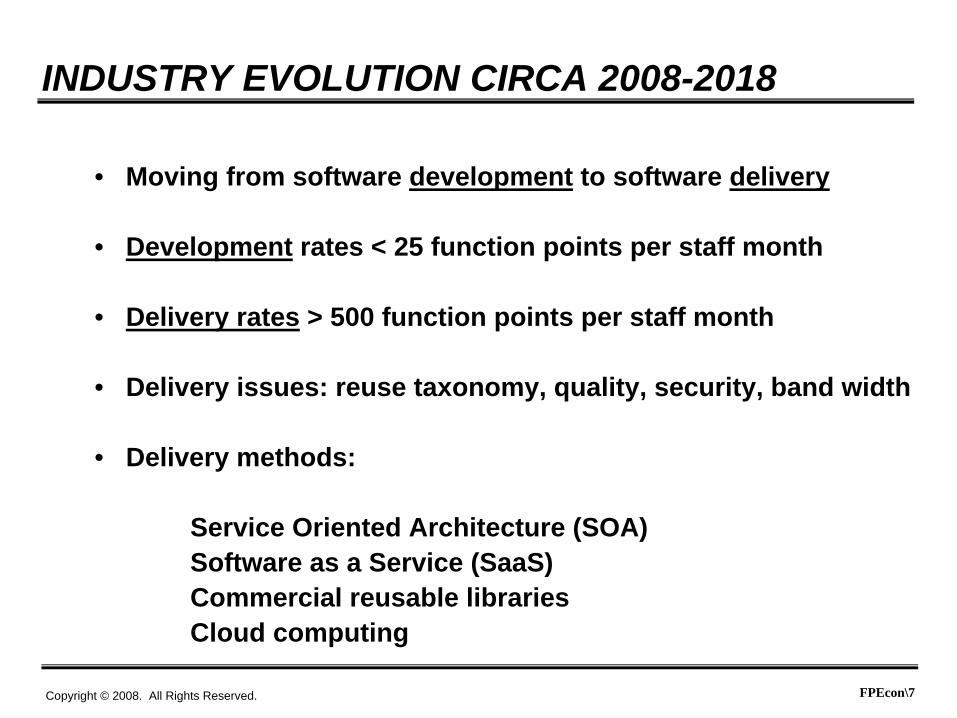
INDUSTRY EVOLUTION CIRCA 2008-2018
• Moving from software development to software delivery
• Development rates < 25 function points per staff month
• Delivery rates > 500 function points per staff month
• Delivery issues: reuse taxonomy, quality, security, band width
• Delivery methods:
Service Oriented Architecture (SOA)Software as a Service (SaaS)Commercial reusable librariesCloud computing
FPEcon\8Copyright © 2008. All Rights Reserved.
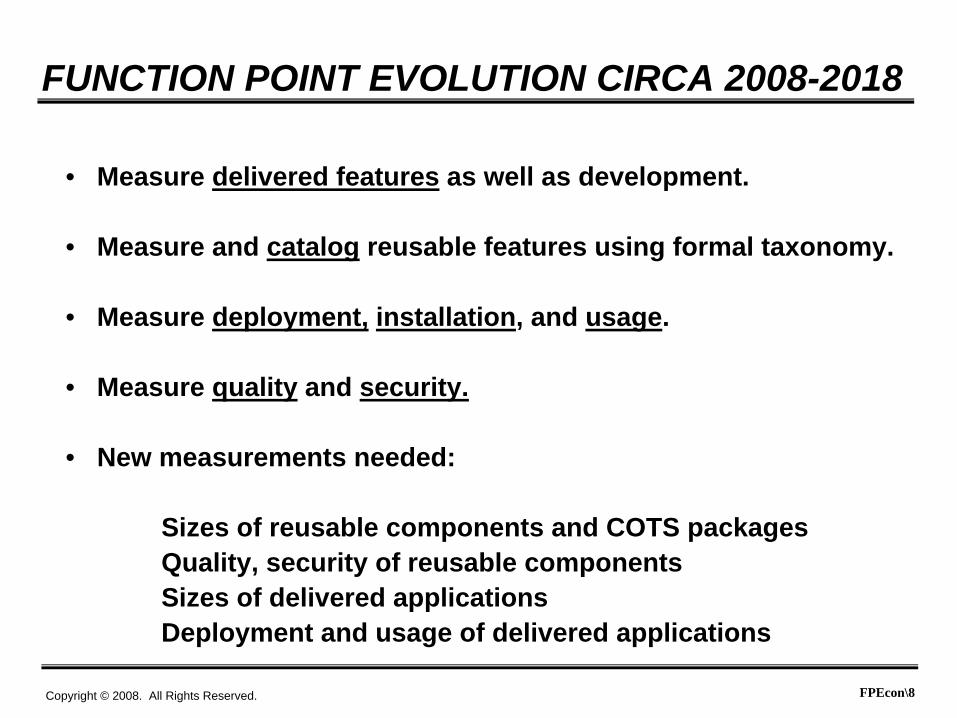
FUNCTION POINT EVOLUTION CIRCA 2008-2018
• Measure delivered features as well as development.
• Measure and catalog reusable features using formal taxonomy.
• Measure deployment, installation, and usage.
• Measure quality and security.
• New measurements needed:
Sizes of reusable components and COTS packagesQuality, security of reusable componentsSizes of delivered applicationsDeployment and usage of delivered applications

FPEcon\9Copyright © 2008. All Rights Reserved.
MIGRATION TO FUNCTIONAL METRICS
100%90%80%70%60%50%40%30%20%10%0%
1980 1985 1990 1995 2000 2005 2010
Other Metrics (Functional)
Measurements Based onIFPUG Function Points
GQM measures are alsoexpanding rapidly
Measurements Based onLines of Source Code
No Measurements At All
Calendar Year
Expansion of function point metricsIs urgently needed!
LOC usage:Professional
Malpractice
FPEcon\10Copyright © 2008. All Rights Reserved.
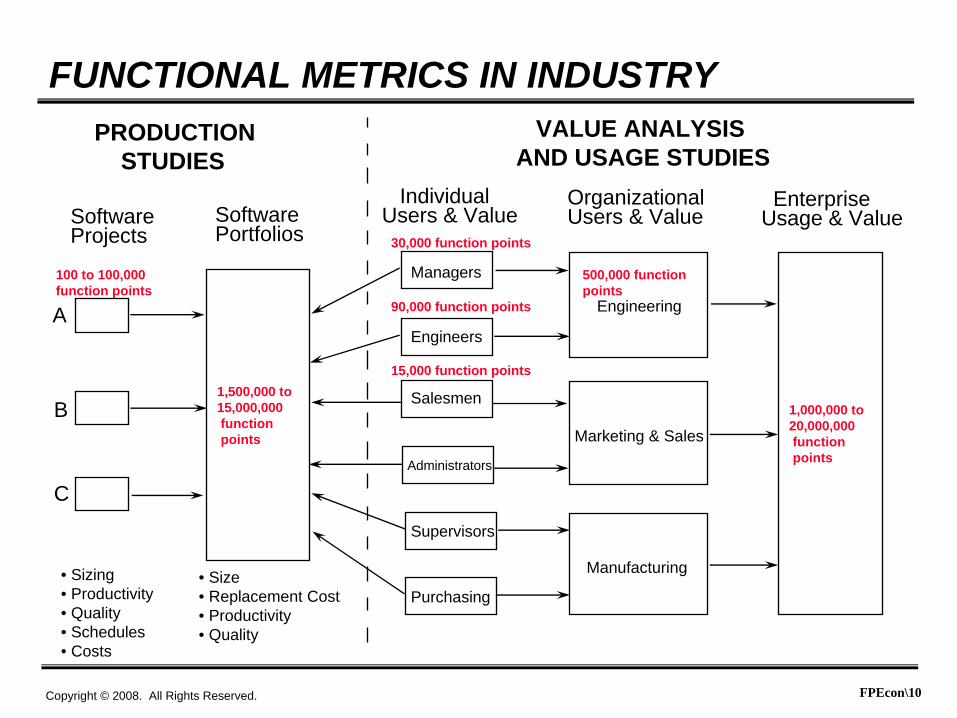
FUNCTIONAL METRICS IN INDUSTRYPRODUCTION
STUDIESVALUE ANALYSIS
AND USAGE STUDIES
SoftwareProjects
Software Portfolios
1,500,000 to15,000,000functionpoints
A
B
C
• Sizing• Productivity• Quality• Schedules• Costs
• Size• Replacement Cost• Productivity• Quality
IndividualUsers & Value
Organizational Users & Value
EnterpriseUsage & Value
1,000,000 to20,000,000functionpoints
Managers
Engineers
Salesmen
Administrators
Supervisors
Purchasing
Manufacturing
Marketing & Sales
Engineering
100 to 100,000function points
30,000 function points
500,000 functionpoints
90,000 function points
15,000 function points

FPEcon\11Copyright © 2008. All Rights Reserved.
ESTIMATED U.S. SOFTWARE CIRCA 2008
Size of Application Number of Applications
1 630,00010 320,000
100 131,5001,000 70,500
10,000 21,750100,000 185
1,000,000 30TOTAL 1,173,965
• Small updates are most numerous.
• Large applications are most hazardous and expensive.

FPEcon\12Copyright © 2008. All Rights Reserved.
ESTIMATED FUNCTION POINT PENETRATION
Size of Application Function Point Usage
1 0.00%10 0.00%
100 25.00%1,000 15.00%
10,000 5.00%100,000 0.00%
1,000,000 0.00%
• Function point rules do not work < 15 function points.
• Counting is too slow and costly > 15,000 function points.
FPEcon\13Copyright © 2008. All Rights Reserved.
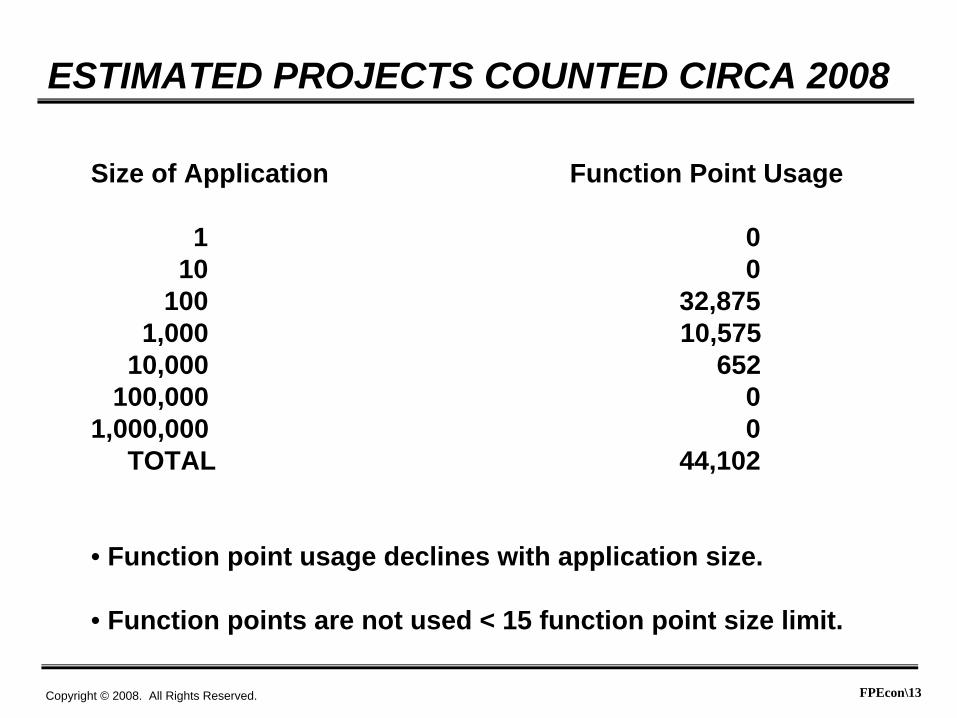
ESTIMATED PROJECTS COUNTED CIRCA 2008
Size of Application Function Point Usage
1 010 0
100 32,8751,000 10,575
10,000 652100,000 0
1,000,000 0TOTAL 44,102
• Function point usage declines with application size.
• Function points are not used < 15 function point size limit.

FPEcon\14Copyright © 2008. All Rights Reserved.
FUNCTION POINT EXPANSION CIRCA 2009
Function points need to extend their range of use:
• “Micro function points” are needed for small updatesbelow 15 function points in size.
• About 20% of all software effort goes to small updates.
• Function point costs and speed need improvementto work effectively > 15,000 function points in size.
• More than 45% of all effort goes to large applications.
• Function point range should run from 1 to 1,000,000function points.
FPEcon\15Copyright © 2008. All Rights Reserved.
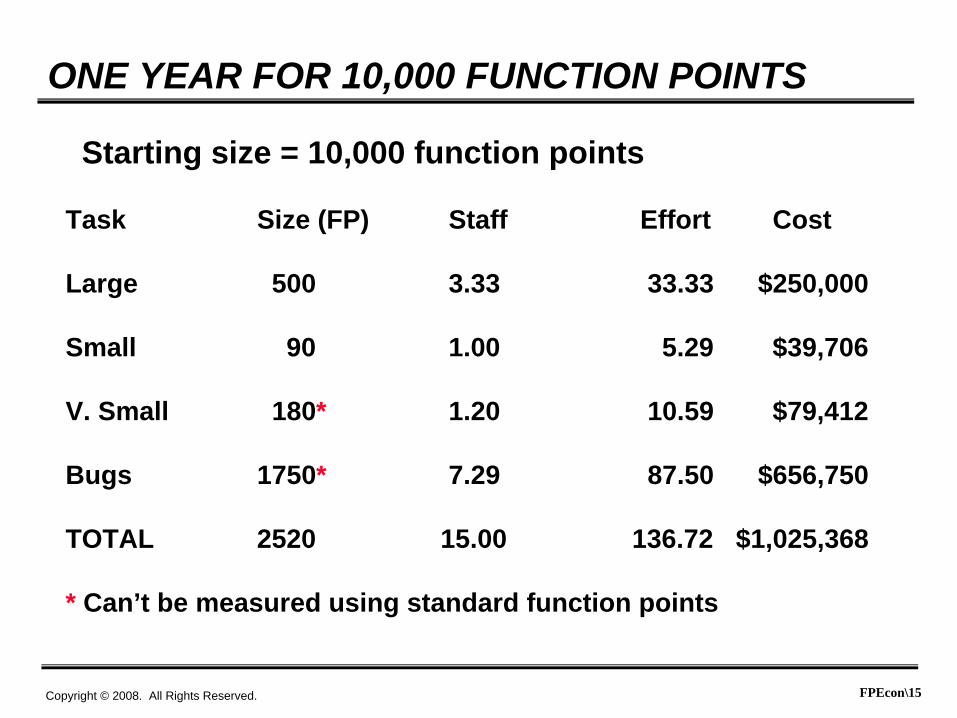
ONE YEAR FOR 10,000 FUNCTION POINTS
Starting size = 10,000 function points
Task Size (FP) Staff Effort Cost
Large 500 3.33 33.33 $250,000
Small 90 1.00 5.29 $39,706
V. Small 180* 1.20 10.59 $79,412
Bugs 1750* 7.29 87.50 $656,750
TOTAL 2520 15.00 136.72 $1,025,368
* Can’t be measured using standard function points

FPEcon\16Copyright © 2008. All Rights Reserved.
THE NEED FOR “MICRO FUNCTION POINTS”
About 70% of small updates can’t be measured
Small changes run from 0.001 to 15 FP
Each change is small, but total > 25,000 per year
Total volume per year > 100,000 function points
Micro function points are needed to expand usage:
• New counting rules with negative adjustments• Backfiring• Pattern matching
FPEcon\17Copyright © 2008. All Rights Reserved.
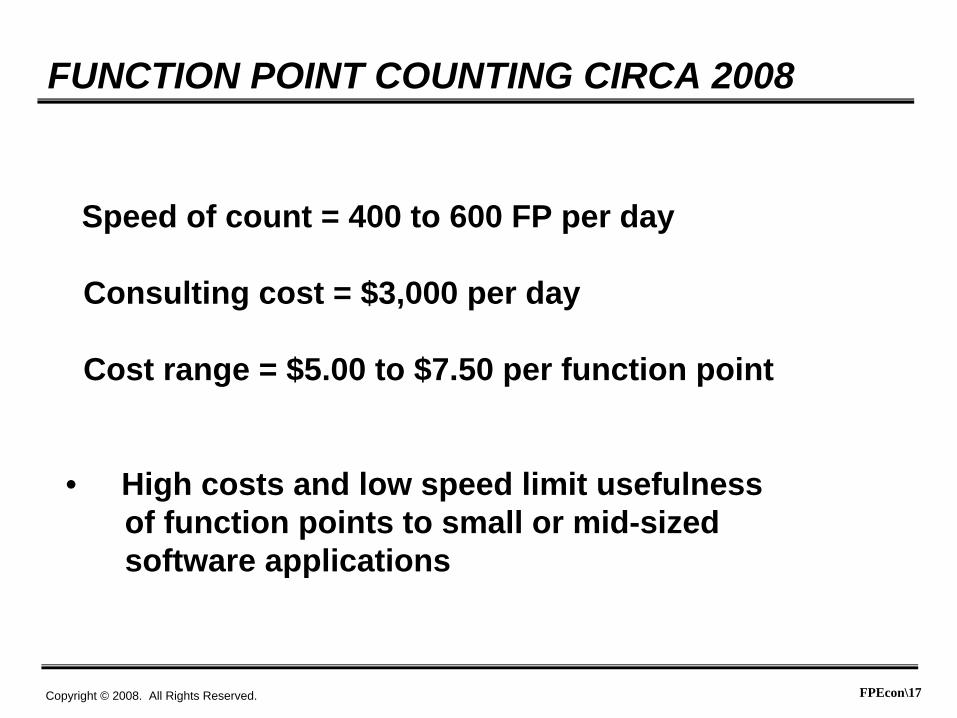
FUNCTION POINT COUNTING CIRCA 2008
Speed of count = 400 to 600 FP per day
Consulting cost = $3,000 per day
Cost range = $5.00 to $7.50 per function point
• High costs and low speed limit usefulnessof function points to small or mid-sizedsoftware applications
FPEcon\18Copyright © 2008. All Rights Reserved.
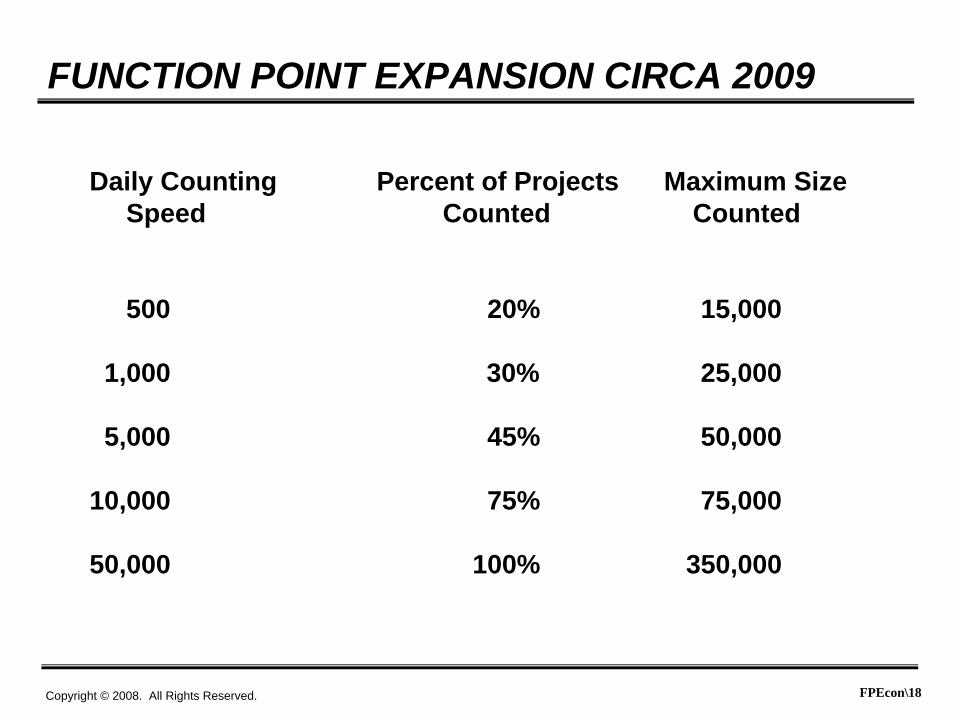
FUNCTION POINT EXPANSION CIRCA 2009
Daily Counting Percent of Projects Maximum SizeSpeed Counted Counted
500 20% 15,000
1,000 30% 25,000
5,000 45% 50,000
10,000 75% 75,000
50,000 100% 350,000

FPEcon\19Copyright © 2008. All Rights Reserved.
MAJOR APPLICATION SIZES CIRCA 2009
Applications Approximate Sizein Function Points
Star Wars Missile Defense 350,000
ERP (SAP, Oracle, etc.) 300,000
Microsoft Vista 159,000
Microsoft Office 98,000
Airline Reservations 50,000
NASA space shuttle 25,000
• Major applications are too large for low-speed counting
FPEcon\20Copyright © 2008. All Rights Reserved.
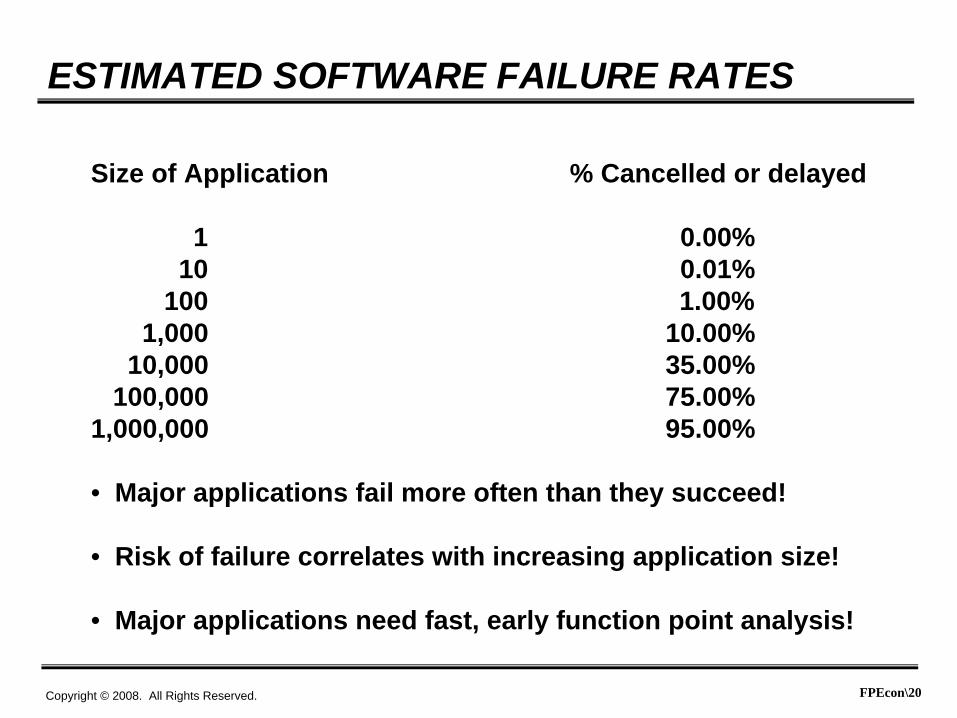
ESTIMATED SOFTWARE FAILURE RATES
Size of Application % Cancelled or delayed
1 0.00%10 0.01%
100 1.00%1,000 10.00%
10,000 35.00%100,000 75.00%
1,000,000 95.00%
• Major applications fail more often than they succeed!
• Risk of failure correlates with increasing application size!
• Major applications need fast, early function point analysis!
FPEcon\21Copyright © 2008. All Rights Reserved.
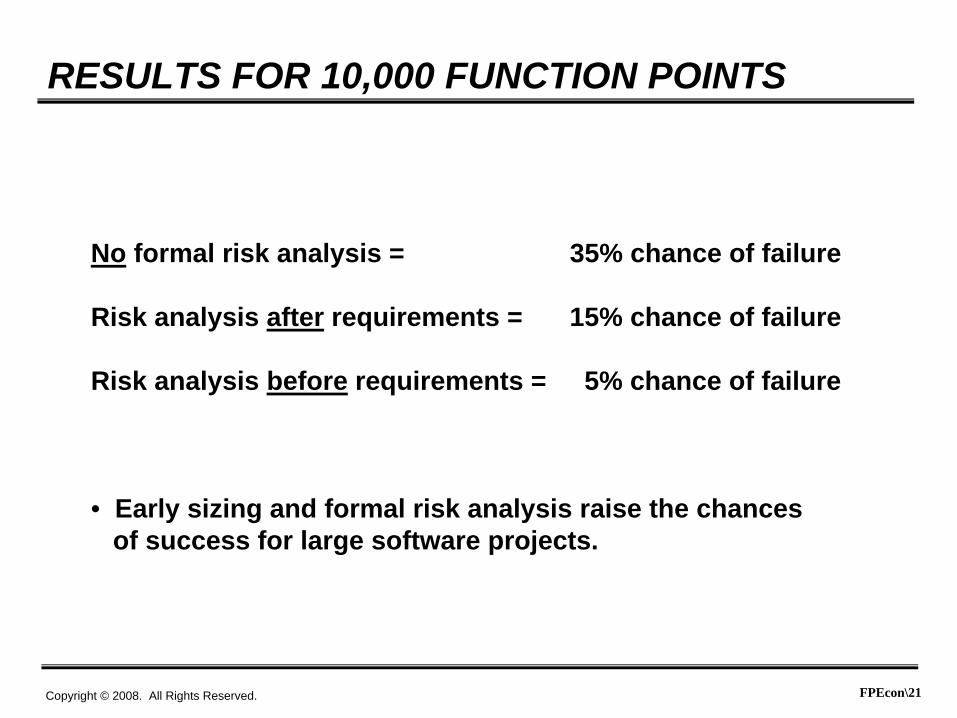
RESULTS FOR 10,000 FUNCTION POINTS
No formal risk analysis = 35% chance of failure
Risk analysis after requirements = 15% chance of failure
Risk analysis before requirements = 5% chance of failure
• Early sizing and formal risk analysis raise the chancesof success for large software projects.
FPEcon\22Copyright © 2008. All Rights Reserved.
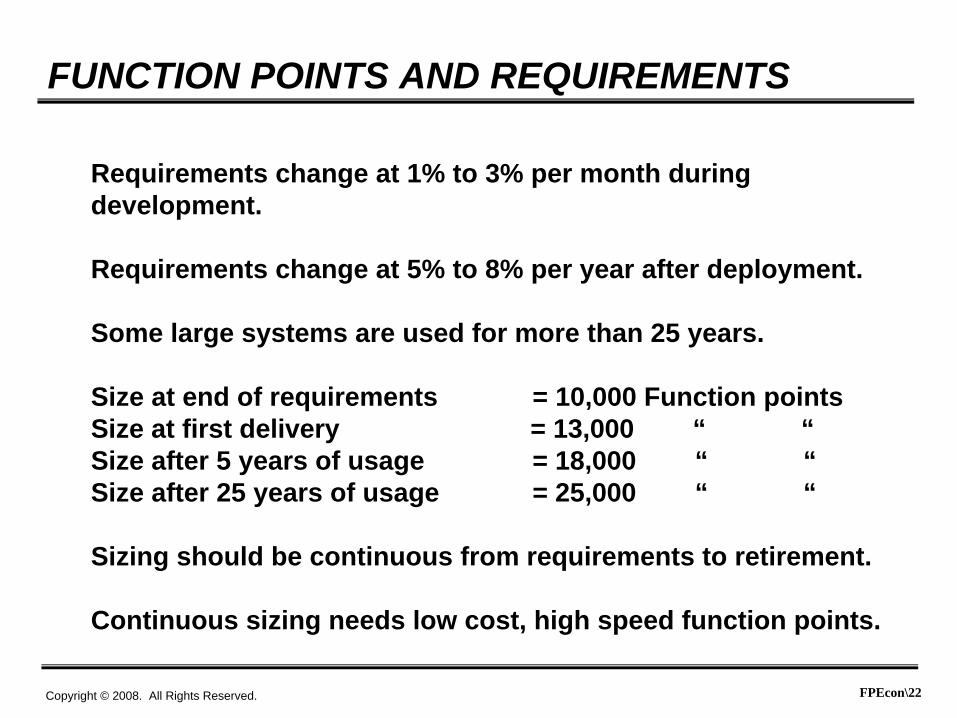
FUNCTION POINTS AND REQUIREMENTS
Requirements change at 1% to 3% per month during development.
Requirements change at 5% to 8% per year after deployment.
Some large systems are used for more than 25 years.
Size at end of requirements = 10,000 Function pointsSize at first delivery = 13,000 “ “Size after 5 years of usage = 18,000 “ “Size after 25 years of usage = 25,000 “ “
Sizing should be continuous from requirements to retirement.
Continuous sizing needs low cost, high speed function points.
FPEcon\23Copyright © 2008. All Rights Reserved.
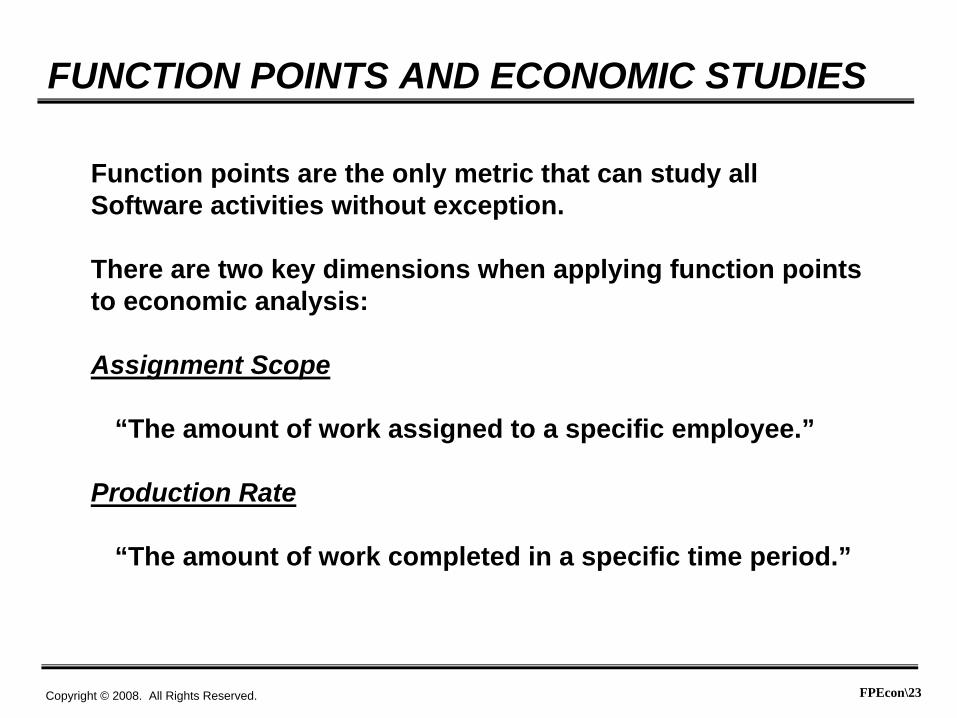
FUNCTION POINTS AND ECONOMIC STUDIES
Function points are the only metric that can study allSoftware activities without exception.
There are two key dimensions when applying function pointsto economic analysis:
Assignment Scope
“The amount of work assigned to a specific employee.”
Production Rate
“The amount of work completed in a specific time period.”
FPEcon\24Copyright © 2008. All Rights Reserved.
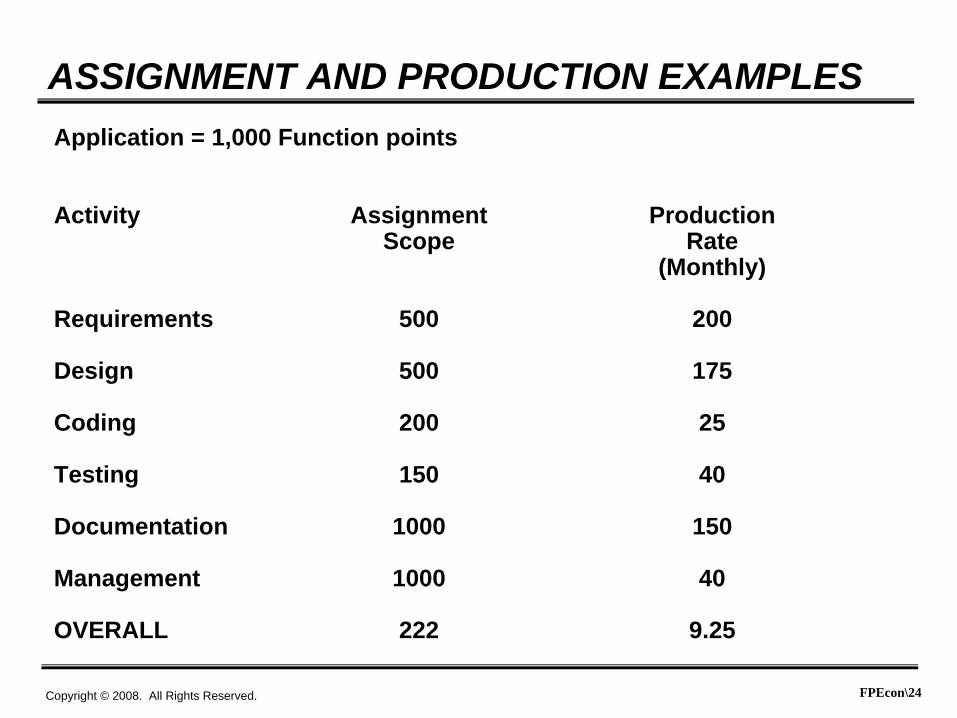
ASSIGNMENT AND PRODUCTION EXAMPLESApplication = 1,000 Function points
Activity Assignment ProductionScope Rate
(Monthly)
Requirements 500 200
Design 500 175
Coding 200 25
Testing 150 40
Documentation 1000 150
Management 1000 40
OVERALL 222 9.25

FPEcon\25Copyright © 2008. All Rights Reserved.
ASSIGNMENT AND PRODUCTION EXAMPLES
Application = 1,000 Function points
Activity Staff Effort Schedule(months) (months)
Requirements 2 5 2.5
Design 2 6 3.0
Coding 5 40 8.0
Testing 7 25 7.0
Documentation 1 7 7.0
Management 1 25 24.0
OVERALL 4.5 108 24.0
FPEcon\26Copyright © 2008. All Rights Reserved.
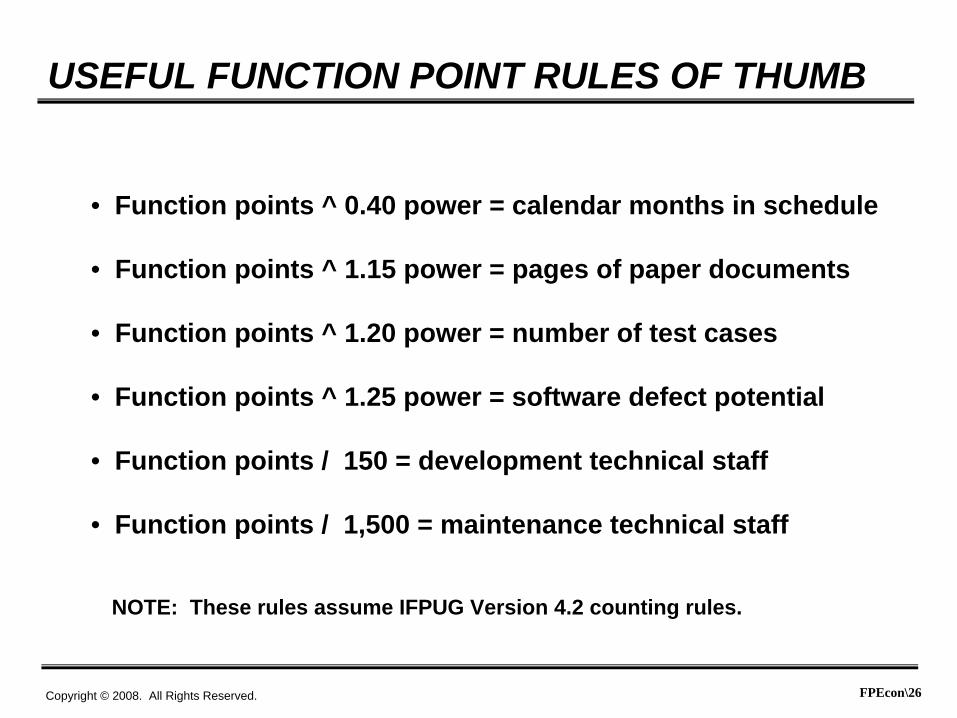
USEFUL FUNCTION POINT RULES OF THUMB
• Function points ^ 0.40 power = calendar months in schedule
• Function points ^ 1.15 power = pages of paper documents
• Function points ^ 1.20 power = number of test cases
• Function points ^ 1.25 power = software defect potential
• Function points / 150 = development technical staff
• Function points / 1,500 = maintenance technical staff
NOTE: These rules assume IFPUG Version 4.2 counting rules.
FPEcon\27Copyright © 2008. All Rights Reserved.
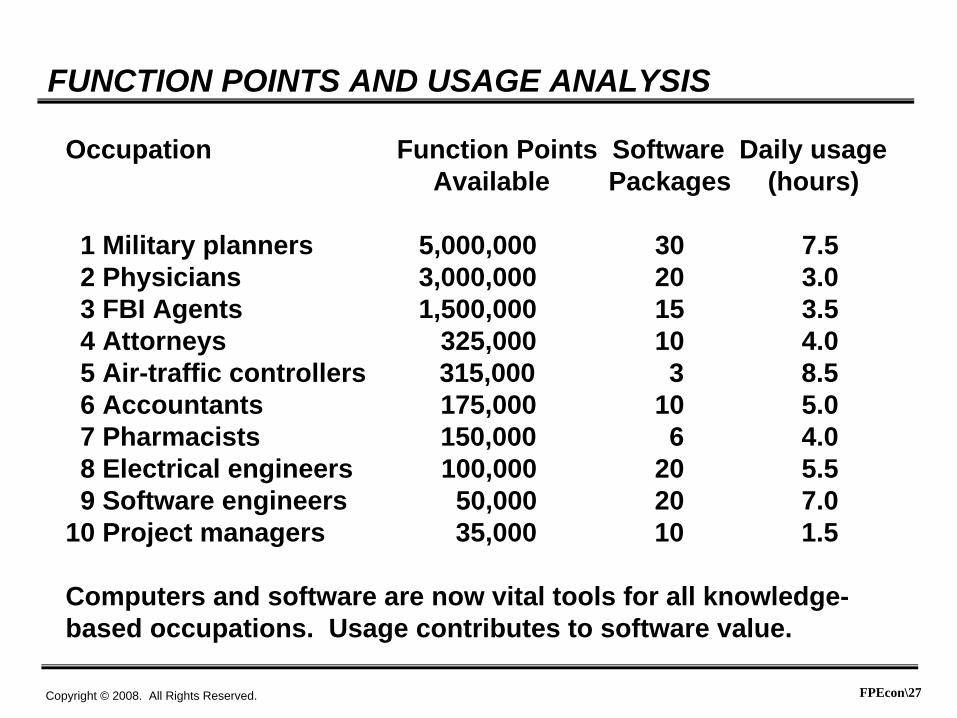
FUNCTION POINTS AND USAGE ANALYSIS
Occupation Function Points Software Daily usageAvailable Packages (hours)
1 Military planners 5,000,000 30 7.52 Physicians 3,000,000 20 3.03 FBI Agents 1,500,000 15 3.54 Attorneys 325,000 10 4.05 Air-traffic controllers 315,000 3 8.56 Accountants 175,000 10 5.07 Pharmacists 150,000 6 4.08 Electrical engineers 100,000 20 5.59 Software engineers 50,000 20 7.0
10 Project managers 35,000 10 1.5
Computers and software are now vital tools for all knowledge-based occupations. Usage contributes to software value.

FPEcon\28Copyright © 2008. All Rights Reserved.
PERSONAL FUNCTION POINTS
Products Circa 2008 Circa 2018 Daily usageAvailable Available (hours)
1 Home computer 1,000,000 2,000.000 2.52 Automobile 300,000 750,000 3.03 Smart appliances 100,000 750.000 24.04 Televisions 25,000 125,000 4.05 Home alarms 5,000 15,000 24.06 Home music 7,500 20,000 2.57 I-Phone 20,000 30.000 3.08 Digital camera 2,000 5,000 0.59 Electronic books 10,000 20,000 2.5
10 Social networks 25,000 75,000 2.5 TOTAL 1,494,500 3,790,000 20.5
Personal software is expanding rapidly in all developed countries.
FPEcon\29Copyright © 2008. All Rights Reserved.
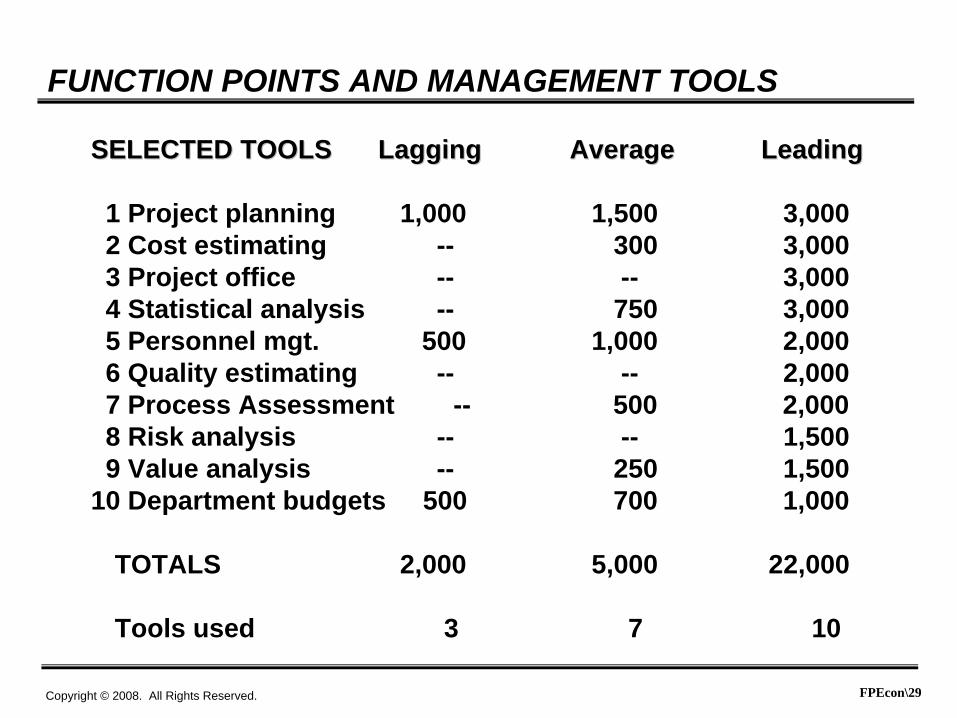
FUNCTION POINTS AND MANAGEMENT TOOLS
SELECTED TOOLSSELECTED TOOLS LaggingLagging AverageAverage LeadingLeading
1 Project planning 1,000 1,500 3,0002 Cost estimating -- 300 3,0003 Project office -- -- 3,0004 Statistical analysis -- 750 3,0005 Personnel mgt. 500 1,000 2,0006 Quality estimating -- -- 2,0007 Process Assessment -- 500 2,0008 Risk analysis -- -- 1,5009 Value analysis -- 250 1,500
10 Department budgets 500 700 1,000
TOTALS 2,000 5,000 22,000
Tools used 3 7 10

FPEcon\30Copyright © 2008. All Rights Reserved.
FUNCTION POINTS AND SOFTWARE TOOLS
SELECTED AREASSELECTED AREAS LaggingLagging AverageAverage LeadingLeading
1 Project mgt. 2,000 5,000 22,0002 Quality Assur. 0 2,500 10,0003 Development 14,000 19,000 25,0004 Maintenance 2,500 10,500 20,0005 Testing 2,000 4,000 15,0006 Documentation 3,000 5,000 12,0007 Training 2,000 4,500 10,0008 Nationalization 0 3,000 7,5009 Customer supp. 2,500 5,500 10,500
10 Change control 3,000 6,000 12,000
TOTALS 31,000 65,000 144,000
Tools used 20 35 75

FPEcon\31Copyright © 2008. All Rights Reserved.
PORTFOLIO FUNCTION POINT ANALYSISSize in terms of IFPUG function points
Unit In-house COTS Open-Source TOTAL
Headquarters 500,000 500,000 50,000 1,050,000
Sales/Market. 750,000 750,000 75,000 1,575,000
Manufacture. 1,500,000 500,000 100,000 2,100,000
Acct/Finance 500,000 1,000,000 10,000 1,510,000
Research 750,000 250,000 150,000 1,150,000
Cust. Support 300,000 250,000 50,000 600,000
Human Res. 100,000 250,000 350,000
Purchasing 250,000 500,000 750,000
Legal 200,000 750,000 950,000
TOTAL 4,850,000 4,750,000 435,000 10,035,000

FPEcon\32Copyright © 2008. All Rights Reserved.
Software portfolios are major business assets.
Software portfolios are large and growing: > 10,000,000 FP
Portfolios include:
• IT, systems, embedded, and web applications• In-house applications• Outsourced applications• Commercial applications (COTS)• Open-source applications• SOA and SaaS
PORTFOLIO ANALYSIS WITH FUNCTION POINTS

FPEcon\33Copyright © 2008. All Rights Reserved.
NEW USES FOR FUNCTION POINTS
Usage analysis is a key factor in value analysis.
Portfolio analysis is a key factor in market planning.
Portfolio analysis is a key factor in both corporate and government operations.
When function points are used for development, delivery, maintenance, usage studies, and portfolio analysis theywill become a major metric for global economic studies.
Usage analysis and portfolio analysis deal with millions ofFunction points. Speed and cost of counting are barriers that must be overcome.
FPEcon\34Copyright © 2008. All Rights Reserved.
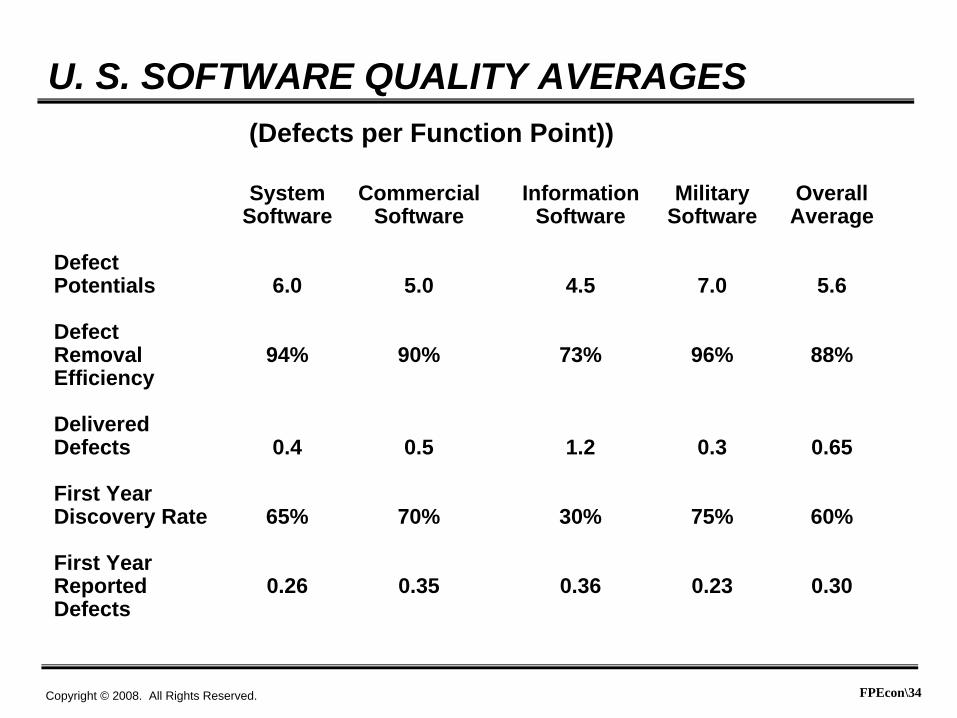
U. S. SOFTWARE QUALITY AVERAGES(Defects per Function Point))
System Commercial Information Military OverallSoftware Software Software Software Average
DefectPotentials 6.0 5.0 4.5 7.0 5.6
DefectRemoval 94% 90% 73% 96% 88%Efficiency
DeliveredDefects 0.4 0.5 1.2 0.3 0.65
First YearDiscovery Rate 65% 70% 30% 75% 60%
First YearReported 0.26 0.35 0.36 0.23 0.30Defects

FPEcon\35Copyright © 2008. All Rights Reserved.
0
1
2
3
4
5
6
7
8
9
10
50% 55% 60% 65% 70% 75% 80% 85% 90% 95% 100%
Defect Removal Efficiency
Defectsper FP
Malpractice
U.S. Average
Best in Class
.
..
SOFTWARE QUALITY RANGES

FPEcon\36Copyright © 2008. All Rights Reserved.
Defect Removal DeliveredDefect Origins Potential Efficiency Defects
Requirements 1.00 77% 0.23Design 1.25 85% 0.19Coding 1.75 95% 0.09Documents 0.60 80% 0.12Bad Fixes 0.40 70% 0.12
TOTAL 5.00 85% 0.75
(Data expressed in terms of defects per function point)
U.S. AVERAGES FOR SOFTWARE QUALITY
(Function points show all defect sources - not just coding defects)
FPEcon\37Copyright © 2008. All Rights Reserved.
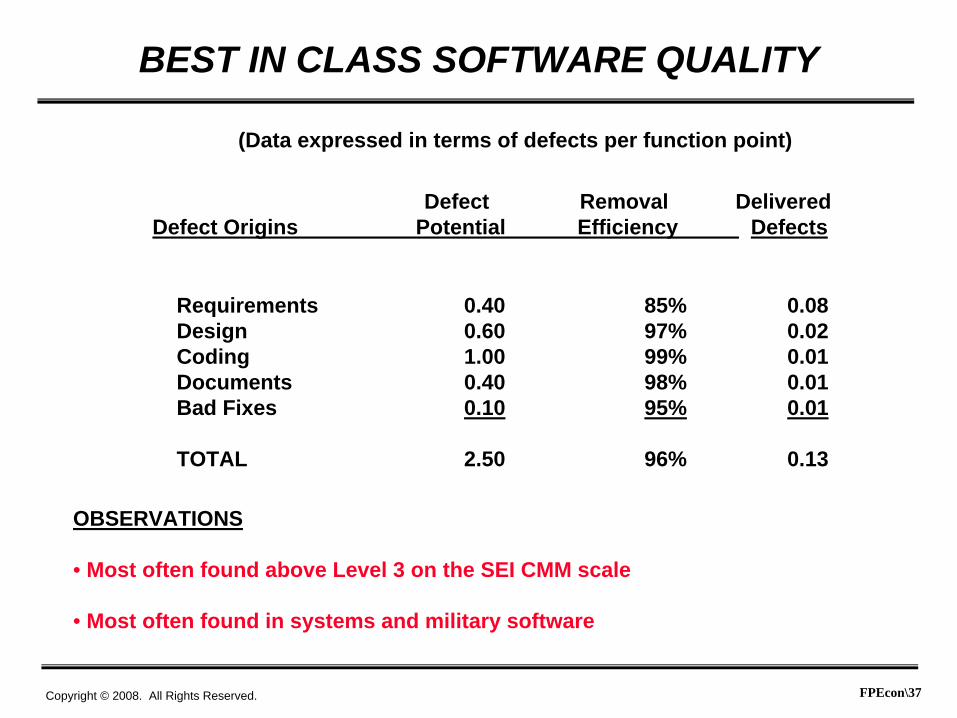
OBSERVATIONS
• Most often found above Level 3 on the SEI CMM scale
• Most often found in systems and military software
Defect Removal DeliveredDefect Origins Potential Efficiency Defects
Requirements 0.40 85% 0.08Design 0.60 97% 0.02Coding 1.00 99% 0.01Documents 0.40 98% 0.01Bad Fixes 0.10 95% 0.01
TOTAL 2.50 96% 0.13
(Data expressed in terms of defects per function point)
BEST IN CLASS SOFTWARE QUALITY
FPEcon\38Copyright © 2008. All Rights Reserved.
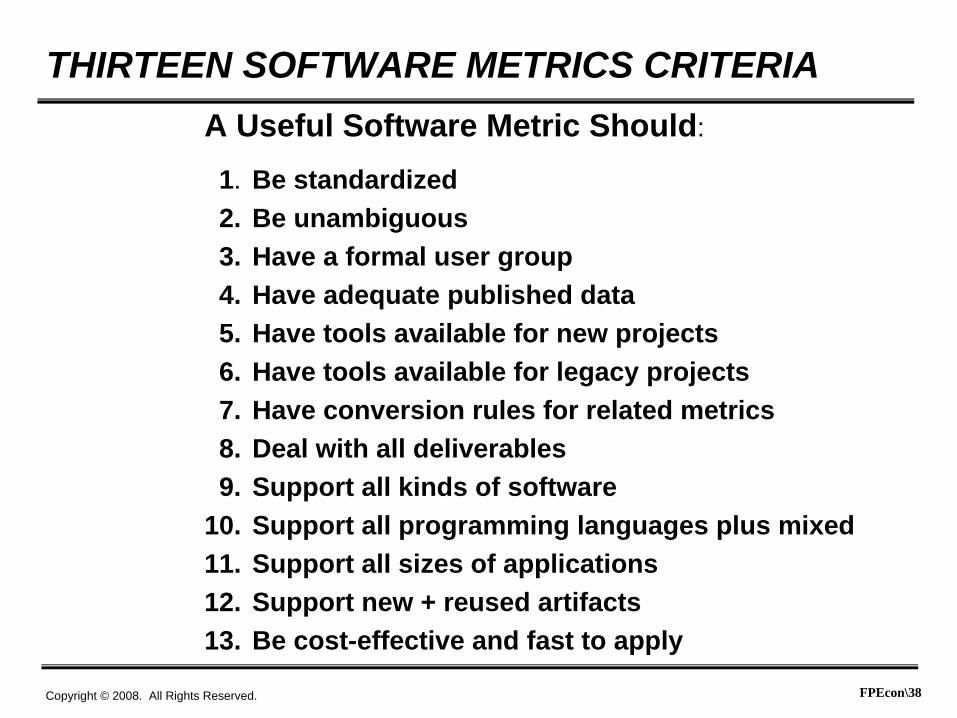
THIRTEEN SOFTWARE METRICS CRITERIAA Useful Software Metric Should:
1. Be standardized2. Be unambiguous3. Have a formal user group4. Have adequate published data5. Have tools available for new projects6. Have tools available for legacy projects7. Have conversion rules for related metrics8. Deal with all deliverables9. Support all kinds of software
10. Support all programming languages plus mixed11. Support all sizes of applications12. Support new + reused artifacts13. Be cost-effective and fast to apply
FPEcon\39Copyright © 2008. All Rights Reserved.
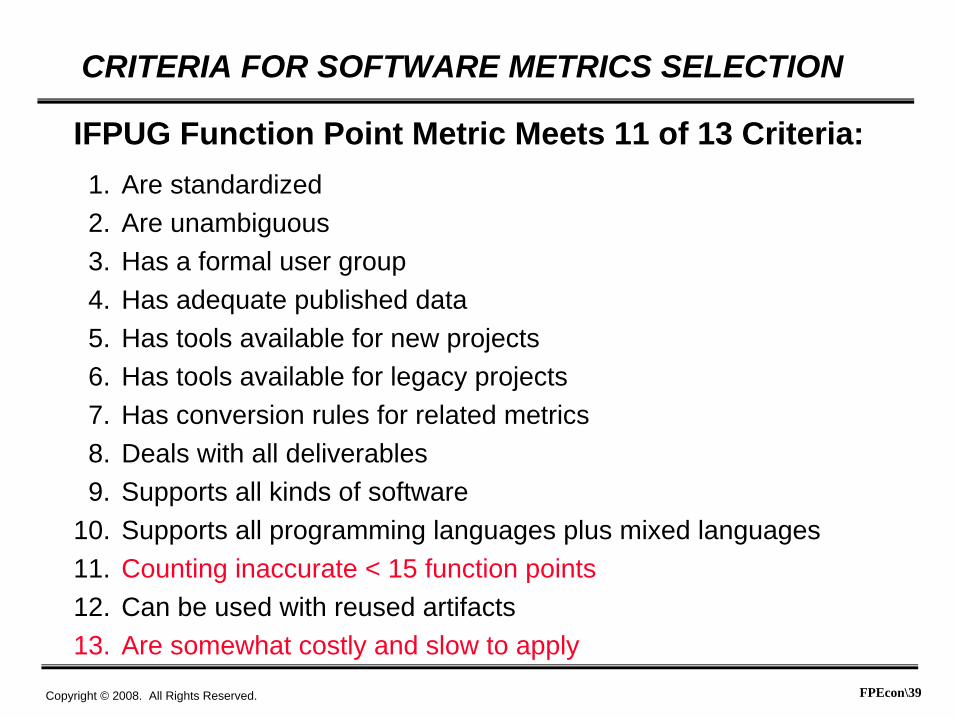
CRITERIA FOR SOFTWARE METRICS SELECTION
IFPUG Function Point Metric Meets 11 of 13 Criteria:1. Are standardized2. Are unambiguous 3. Has a formal user group4. Has adequate published data5. Has tools available for new projects6. Has tools available for legacy projects7. Has conversion rules for related metrics8. Deals with all deliverables9. Supports all kinds of software
10. Supports all programming languages plus mixed languages11. Counting inaccurate < 15 function points12. Can be used with reused artifacts13. Are somewhat costly and slow to apply

FPEcon\40Copyright © 2008. All Rights Reserved.
CRITERIA FOR SOFTWARE METRICS SELECTION
Pattern Matching Meets 9 of 13 Criteria:1. Are not standardized2. Are unambiguous (with exceptions)3. Has no formal user group4. Has little published data5. Has tools available for new projects6. Has tools available for legacy projects7. Has conversion rules for related metrics8. Deals with all deliverables9. Supports all kinds of software
10. Supports all programming languages plus mixed languages11. Counting accurate < 15 function points12. Can be used with reused artifacts13. Is very fast and inexpensive, but of uncertain accuracy
FPEcon\41Copyright © 2008. All Rights Reserved.
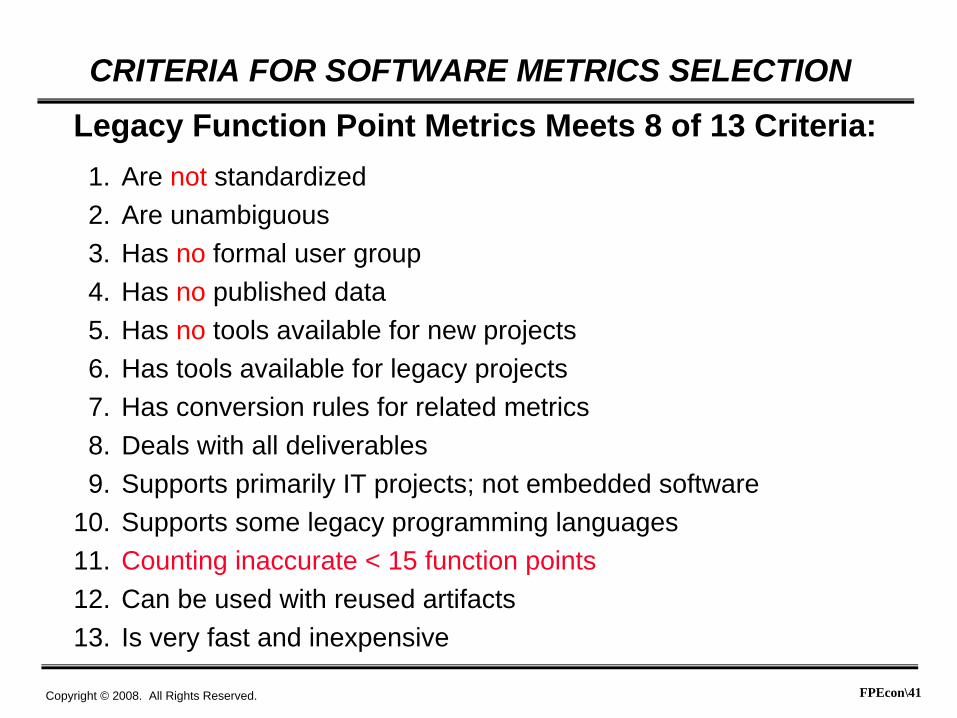
CRITERIA FOR SOFTWARE METRICS SELECTION
Legacy Function Point Metrics Meets 8 of 13 Criteria:1. Are not standardized2. Are unambiguous3. Has no formal user group4. Has no published data5. Has no tools available for new projects6. Has tools available for legacy projects7. Has conversion rules for related metrics8. Deals with all deliverables9. Supports primarily IT projects; not embedded software
10. Supports some legacy programming languages11. Counting inaccurate < 15 function points12. Can be used with reused artifacts13. Is very fast and inexpensive
FPEcon\42Copyright © 2008. All Rights Reserved.
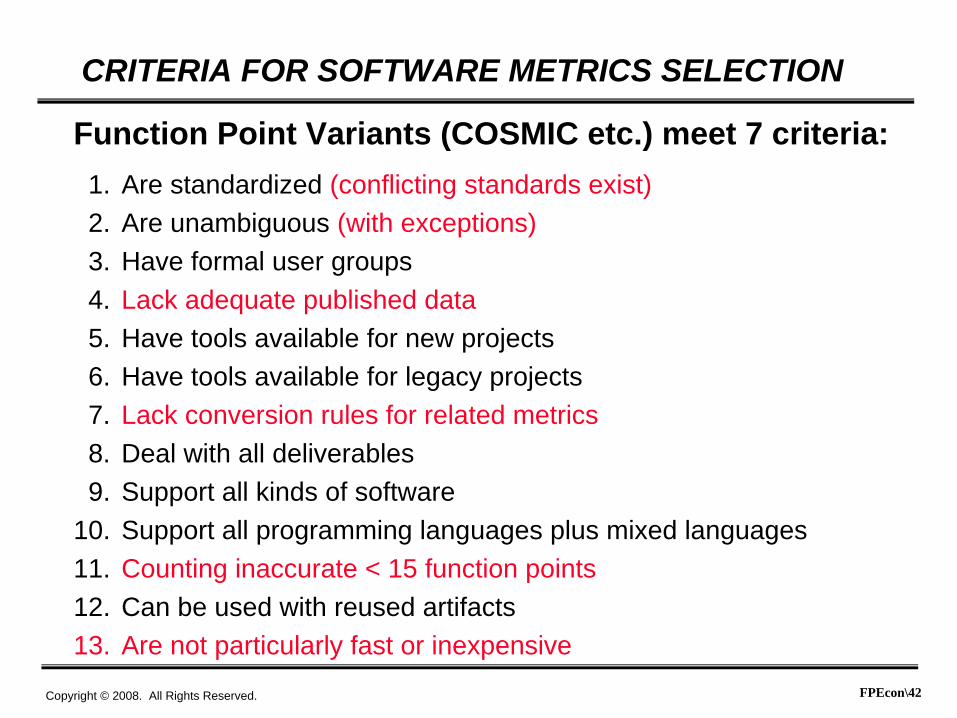
CRITERIA FOR SOFTWARE METRICS SELECTION
Function Point Variants (COSMIC etc.) meet 7 criteria:1. Are standardized (conflicting standards exist)2. Are unambiguous (with exceptions)3. Have formal user groups4. Lack adequate published data5. Have tools available for new projects6. Have tools available for legacy projects7. Lack conversion rules for related metrics8. Deal with all deliverables9. Support all kinds of software
10. Support all programming languages plus mixed languages11. Counting inaccurate < 15 function points12. Can be used with reused artifacts13. Are not particularly fast or inexpensive
FPEcon\43Copyright © 2008. All Rights Reserved.
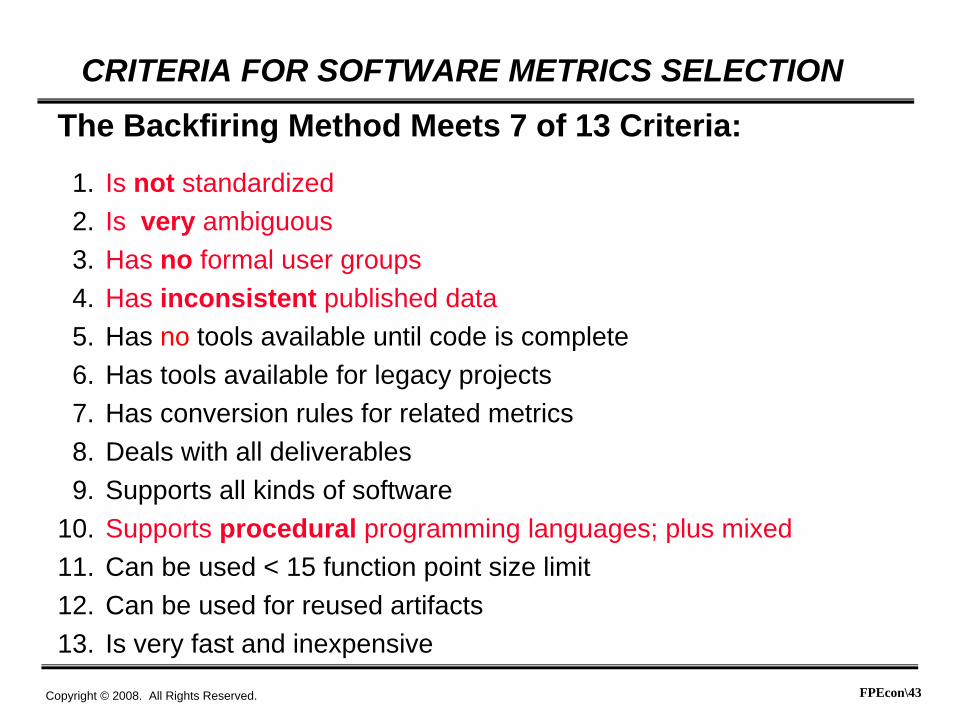
CRITERIA FOR SOFTWARE METRICS SELECTION
The Backfiring Method Meets 7 of 13 Criteria:
1. Is not standardized2. Is very ambiguous3. Has no formal user groups4. Has inconsistent published data5. Has no tools available until code is complete6. Has tools available for legacy projects7. Has conversion rules for related metrics8. Deals with all deliverables9. Supports all kinds of software
10. Supports procedural programming languages; plus mixed11. Can be used < 15 function point size limit12. Can be used for reused artifacts13. Is very fast and inexpensive
FPEcon\44Copyright © 2008. All Rights Reserved.
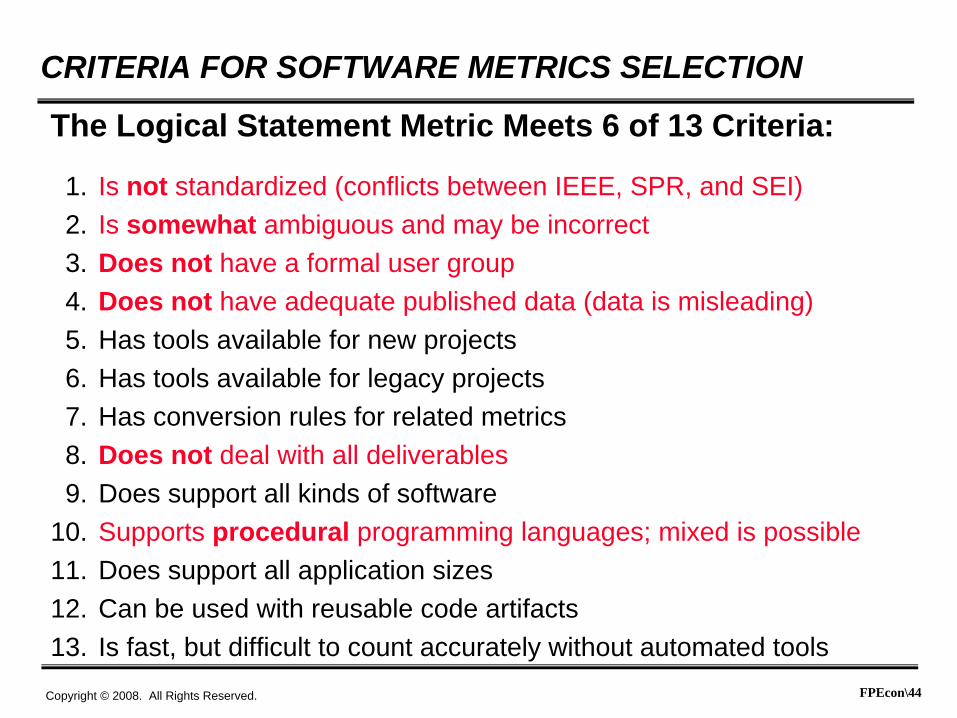
CRITERIA FOR SOFTWARE METRICS SELECTION
The Logical Statement Metric Meets 6 of 13 Criteria:
1. Is not standardized (conflicts between IEEE, SPR, and SEI)2. Is somewhat ambiguous and may be incorrect3. Does not have a formal user group4. Does not have adequate published data (data is misleading)5. Has tools available for new projects6. Has tools available for legacy projects7. Has conversion rules for related metrics8. Does not deal with all deliverables9. Does support all kinds of software
10. Supports procedural programming languages; mixed is possible11. Does support all application sizes12. Can be used with reusable code artifacts13. Is fast, but difficult to count accurately without automated tools
FPEcon\45Copyright © 2008. All Rights Reserved.
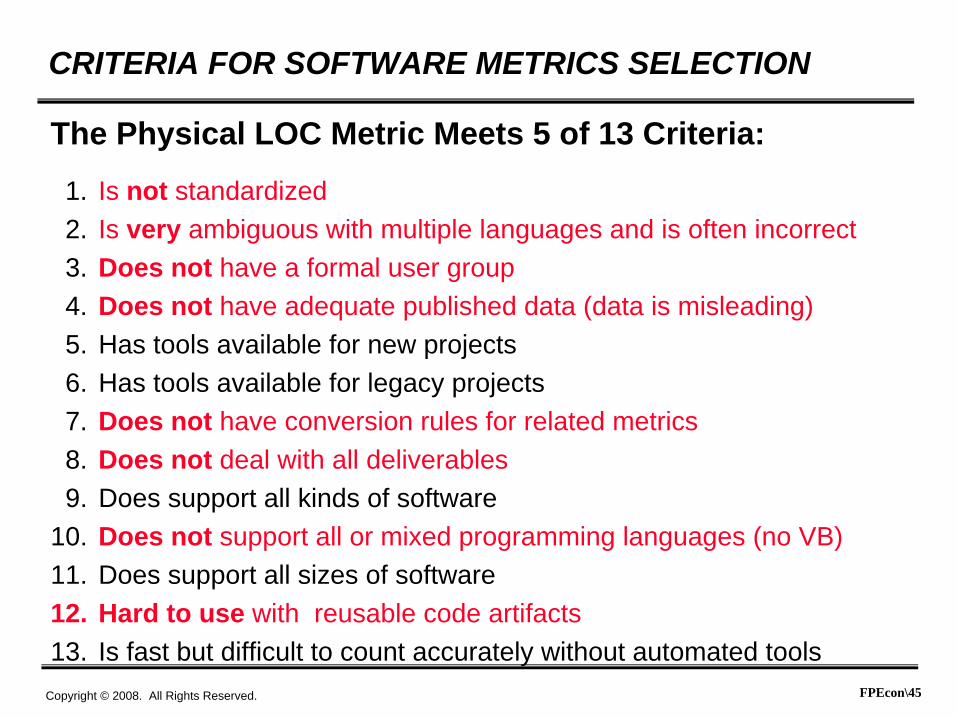
The Physical LOC Metric Meets 5 of 13 Criteria:
1. Is not standardized2. Is very ambiguous with multiple languages and is often incorrect3. Does not have a formal user group4. Does not have adequate published data (data is misleading)5. Has tools available for new projects6. Has tools available for legacy projects7. Does not have conversion rules for related metrics8. Does not deal with all deliverables9. Does support all kinds of software
10. Does not support all or mixed programming languages (no VB)11. Does support all sizes of software12. Hard to use with reusable code artifacts13. Is fast but difficult to count accurately without automated tools
CRITERIA FOR SOFTWARE METRICS SELECTION

FPEcon\46Copyright © 2008. All Rights Reserved.
CRITERIA FOR SOFTWARE METRICS SELECTION
Goal-Question Metrics Meet 3 of 13 Criteria:
1. Is not standardized2. Is often unambiguous3. Does not have a formal user group4. Does have adequate published data5. Does not have tools available for new projects6. Does not have tools available for legacy projects7. Does not have conversion rules for related metrics8. Can be designed for use with all deliverables9. Does not support all kinds of software
10. Does not support all or mixed programming languages11. Does support all application sizes12. Partial support for reusable artifacts13. Is somewhat slow and expensive to use
FPEcon\47Copyright © 2008. All Rights Reserved.
CRITERIA FOR SOFTWARE METRICS SELECTION
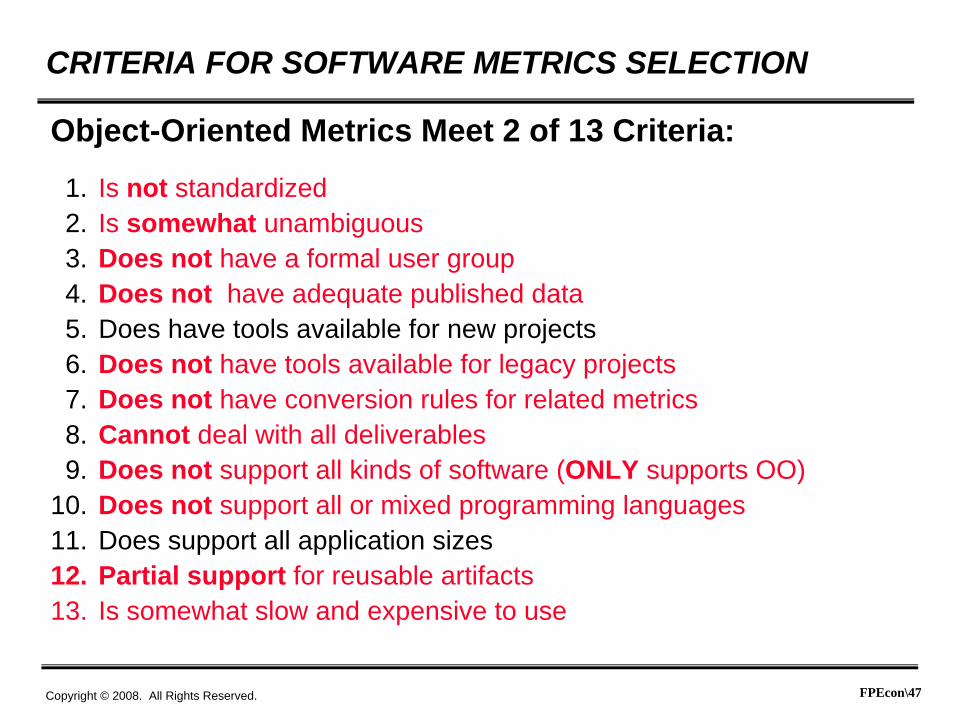
Object-Oriented Metrics Meet 2 of 13 Criteria:
1. Is not standardized2. Is somewhat unambiguous3. Does not have a formal user group4. Does not have adequate published data5. Does have tools available for new projects6. Does not have tools available for legacy projects7. Does not have conversion rules for related metrics8. Cannot deal with all deliverables 9. Does not support all kinds of software (ONLY supports OO)
10. Does not support all or mixed programming languages11. Does support all application sizes12. Partial support for reusable artifacts13. Is somewhat slow and expensive to use
FPEcon\48Copyright © 2008. All Rights Reserved.
CRITERIA FOR SOFTWARE METRICS SELECTION
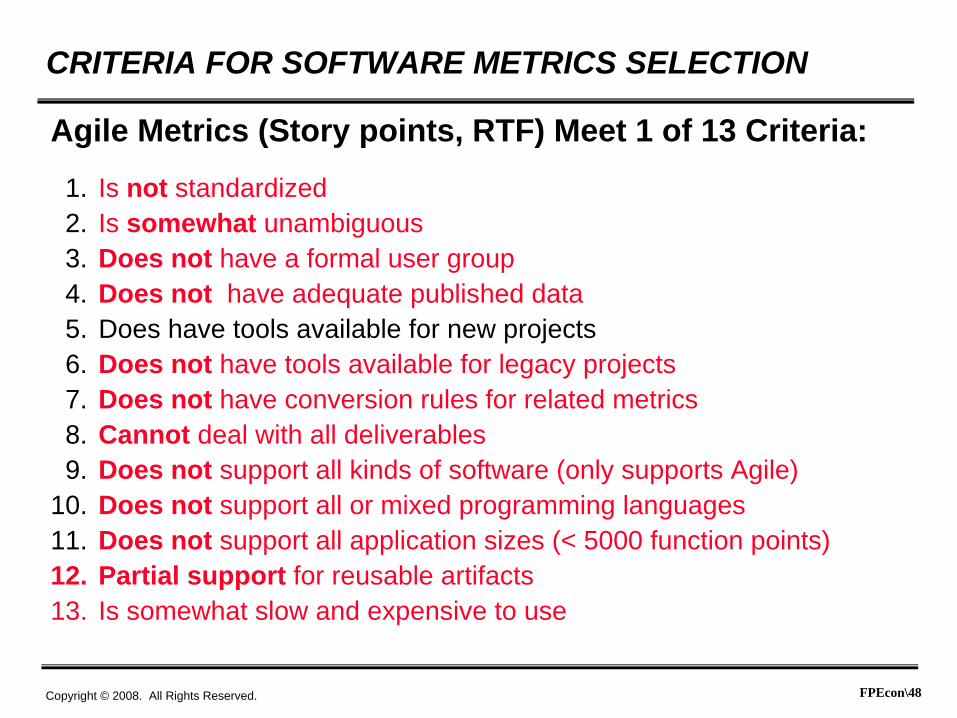
Agile Metrics (Story points, RTF) Meet 1 of 13 Criteria:
1. Is not standardized2. Is somewhat unambiguous3. Does not have a formal user group4. Does not have adequate published data5. Does have tools available for new projects6. Does not have tools available for legacy projects7. Does not have conversion rules for related metrics8. Cannot deal with all deliverables 9. Does not support all kinds of software (only supports Agile)
10. Does not support all or mixed programming languages11. Does not support all application sizes (< 5000 function points)12. Partial support for reusable artifacts13. Is somewhat slow and expensive to use
FPEcon\49Copyright © 2008. All Rights Reserved.
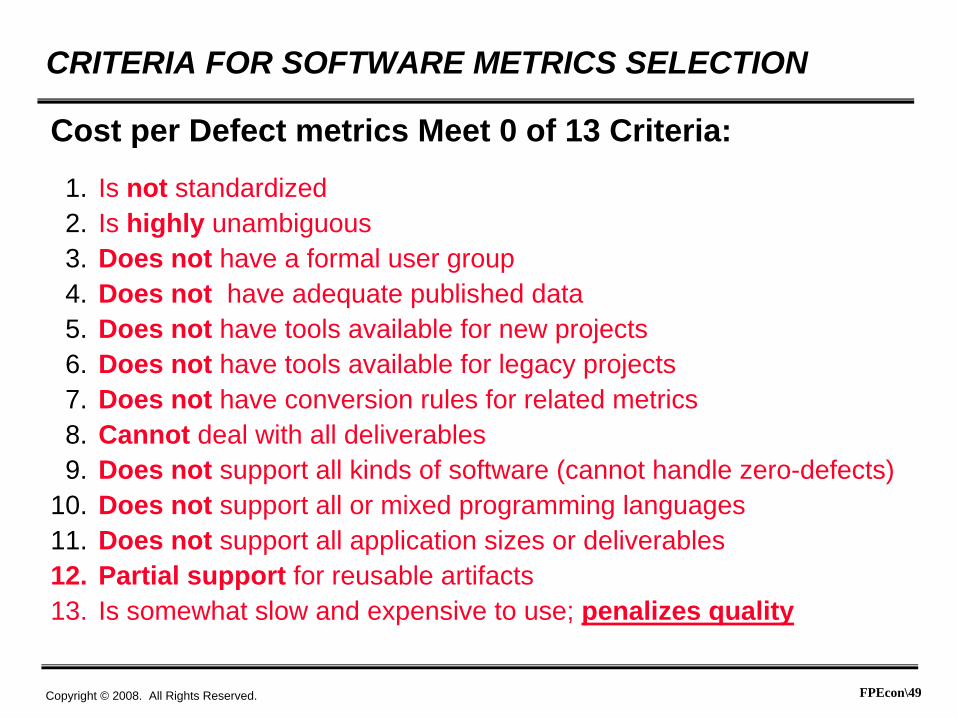
CRITERIA FOR SOFTWARE METRICS SELECTION
Cost per Defect metrics Meet 0 of 13 Criteria:
1. Is not standardized2. Is highly unambiguous3. Does not have a formal user group4. Does not have adequate published data5. Does not have tools available for new projects6. Does not have tools available for legacy projects7. Does not have conversion rules for related metrics8. Cannot deal with all deliverables 9. Does not support all kinds of software (cannot handle zero-defects)
10. Does not support all or mixed programming languages11. Does not support all application sizes or deliverables 12. Partial support for reusable artifacts13. Is somewhat slow and expensive to use; penalizes quality

FPEcon\50Copyright © 2008. All Rights Reserved.
METRICS CONVERSION - A CRITICAL GAP
N-DIRECTION METRICS CONVERSION IS NEEDED BETWEEN:
• IFPUG VERSIONS 1, 2, 3, 4, 4.1, and 4.2 COUNTING RULES
• CURRENT IFPUG, MARK II, 3D, COSMIC, AND OTHER VARIATIONS
• FUNCTION POINTS AND PHYSICAL LOC METRICS
• FUNCTION POINTS AND LOGICAL STATEMENT METRICS
• PHYSICAL LOC AND LOGICAL STATEMENTS
• OBJECT-ORIENTED, AGILE, GQM METRICS AND OTHERS
ALL OTHER SCIENTIFIC AND ENGINEERING METRICS HAVEPUBLISHED CONVERSION RULES BETWEEN VARIANT METRICS.
FPEcon\51Copyright © 2008. All Rights Reserved.
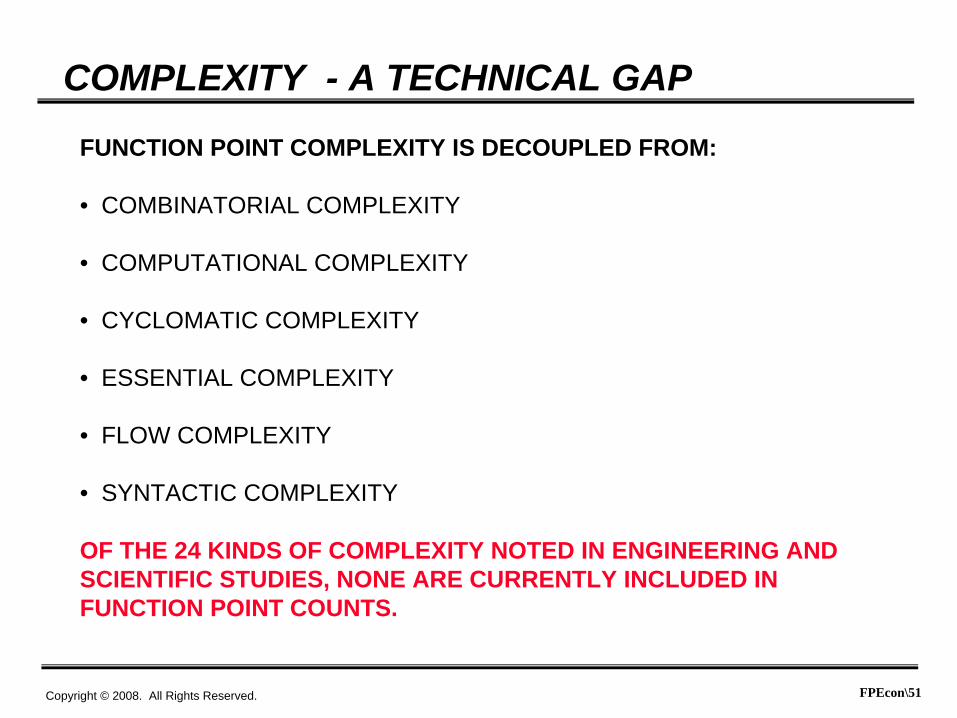
COMPLEXITY - A TECHNICAL GAP
FUNCTION POINT COMPLEXITY IS DECOUPLED FROM:
• COMBINATORIAL COMPLEXITY
• COMPUTATIONAL COMPLEXITY
• CYCLOMATIC COMPLEXITY
• ESSENTIAL COMPLEXITY
• FLOW COMPLEXITY
• SYNTACTIC COMPLEXITY
OF THE 24 KINDS OF COMPLEXITY NOTED IN ENGINEERING ANDSCIENTIFIC STUDIES, NONE ARE CURRENTLY INCLUDED INFUNCTION POINT COUNTS.
FPEcon\52Copyright © 2008. All Rights Reserved.
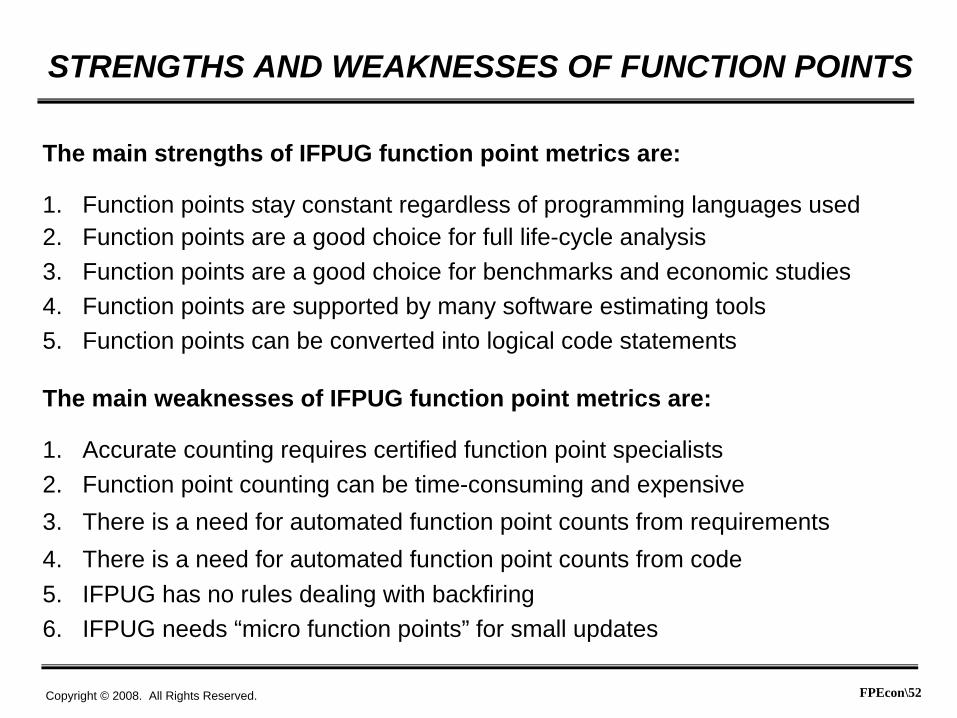
The main strengths of IFPUG function point metrics are:
1. Function points stay constant regardless of programming languages used2. Function points are a good choice for full life-cycle analysis3. Function points are a good choice for benchmarks and economic studies4. Function points are supported by many software estimating tools5. Function points can be converted into logical code statements
The main weaknesses of IFPUG function point metrics are:
1. Accurate counting requires certified function point specialists2. Function point counting can be time-consuming and expensive3. There is a need for automated function point counts from requirements4. There is a need for automated function point counts from code5. IFPUG has no rules dealing with backfiring6. IFPUG needs “micro function points” for small updates
STRENGTHS AND WEAKNESSES OF FUNCTION POINTS
FPEcon\53Copyright © 2008. All Rights Reserved.
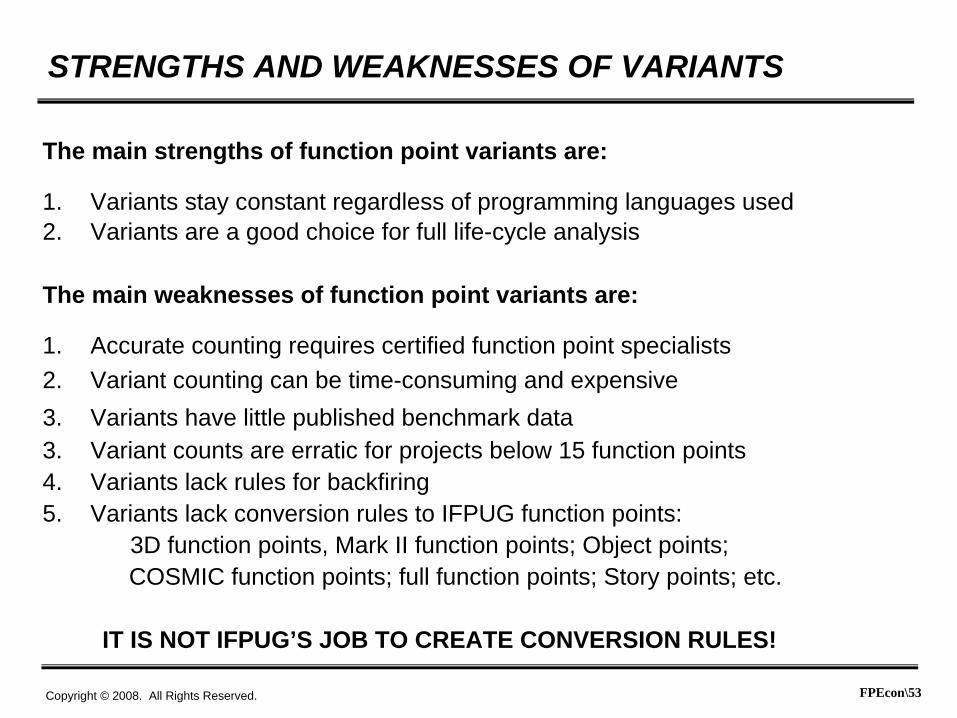
The main strengths of function point variants are:
1. Variants stay constant regardless of programming languages used2. Variants are a good choice for full life-cycle analysis
The main weaknesses of function point variants are:
1. Accurate counting requires certified function point specialists2. Variant counting can be time-consuming and expensive3. Variants have little published benchmark data3. Variant counts are erratic for projects below 15 function points4. Variants lack rules for backfiring5. Variants lack conversion rules to IFPUG function points:
3D function points, Mark II function points; Object points;COSMIC function points; full function points; Story points; etc.
IT IS NOT IFPUG’S JOB TO CREATE CONVERSION RULES!
STRENGTHS AND WEAKNESSES OF VARIANTS

FPEcon\54Copyright © 2008. All Rights Reserved.
The main strengths of backfiring are:
1. A fairly convenient method for aging legacy applications2. One method for small applications < 15 function points3. Costs less than < $0.25 per function point 4. Backfiring is supported by many software estimating tools5. Function points can be converted into code statements and vice versa
The main weaknesses of backfiring are:
1. Accuracy of backfiring is never equal to counts by function point specialists2. Backfiring varies between physical LOC and logical statements3. Backfiring varies between individual programming styles4. Backfiring varies between published lists for same languages5. Backfiring is not endorsed by any function point association6. Backfiring research is sparse and literature is scarce7. Backfiring needs adjustment for dead code and complexity
STRENGTHS AND WEAKNESSES OF BACKFIRING
FPEcon\55Copyright © 2008. All Rights Reserved.
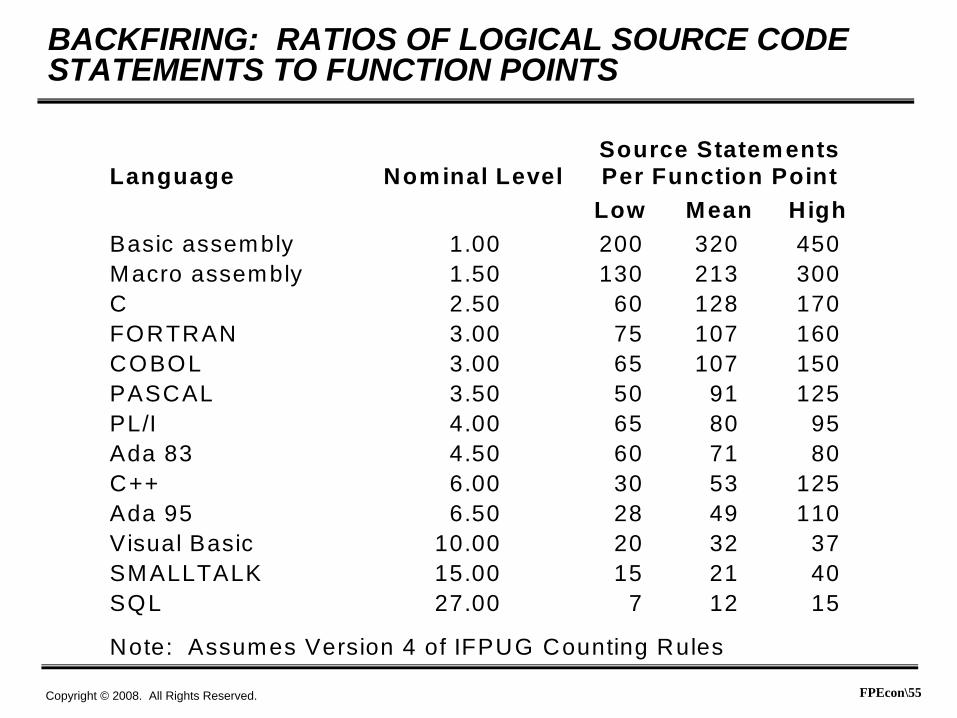
BACKFIRING: RATIOS OF LOGICAL SOURCE CODE STATEMENTS TO FUNCTION POINTS
Language Nominal LevelSource StatementsPer Function Point
Low Mean HighBasic assembly 1.00 200 320 450Macro assembly 1.50 130 213 300C 2.50 60 128 170FORTRAN 3.00 75 107 160COBOL 3.00 65 107 150PASCAL 3.50 50 91 125PL/I 4.00 65 80 95Ada 83 4.50 60 71 80C++ 6.00 30 53 125Ada 95 6.50 28 49 110Visual Basic 10.00 20 32 37SMALLTALK 15.00 15 21 40SQL 27.00 7 12 15
Note: Assumes Version 4 of IFPUG Counting Rules

FPEcon\56Copyright © 2008. All Rights Reserved.
The main strengths of pattern matching are:
1. Only convenient method for applications > 100,000 function points2. Also useful for small applications < 15 function points3. Fastest, cheapest known approach for sizing software4. Costs less than $0.01 per function point4. Pattern matching takes < 1 minute to size any known application5. Only known method for sizing software with hidden requirements6. Only known method for sizing COTS or Open Source by customers
The main weaknesses of pattern matching are:
1. Requires large volumes of historical data to get started2. Requires a full taxonomy of software classes and types3. Pattern matching is experimental in 20084. Pattern matching is proprietary in 20085. Pattern matching is not endorsed by any function point association
STRENGTHS AND WEAKNESSES OF PATTERN MATCHES
FPEcon\57Copyright © 2008. All Rights Reserved.
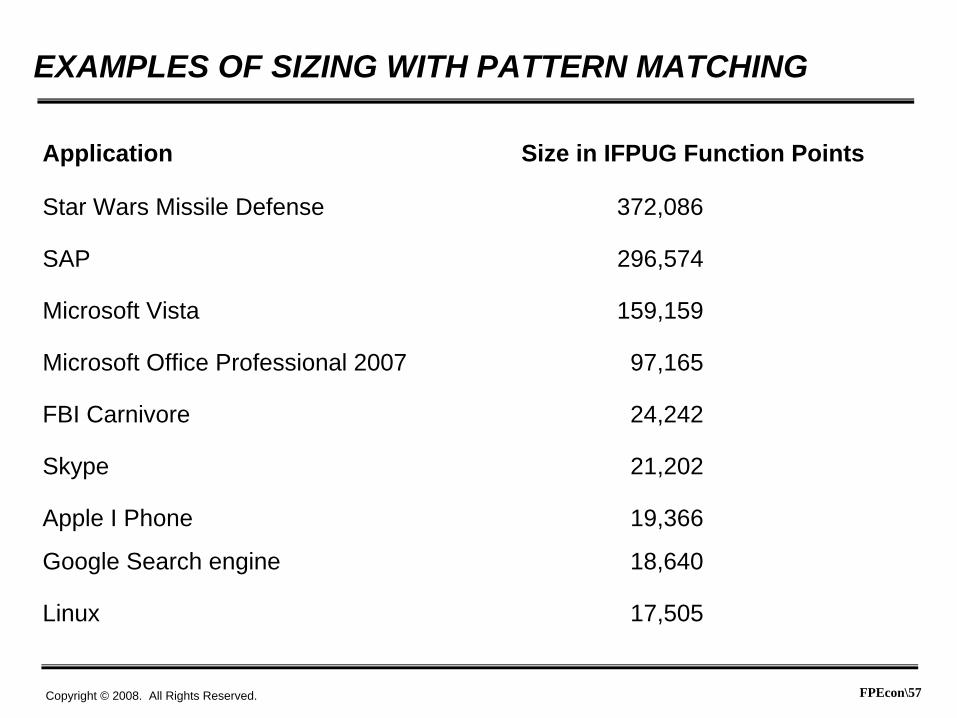
Application Size in IFPUG Function Points
Star Wars Missile Defense 372,086
SAP 296,574
Microsoft Vista 159,159
Microsoft Office Professional 2007 97,165
FBI Carnivore 24,242
Skype 21,202
Apple I Phone 19,366
Google Search engine 18,640
Linux 17,505
EXAMPLES OF SIZING WITH PATTERN MATCHING
FPEcon\58Copyright © 2008. All Rights Reserved.
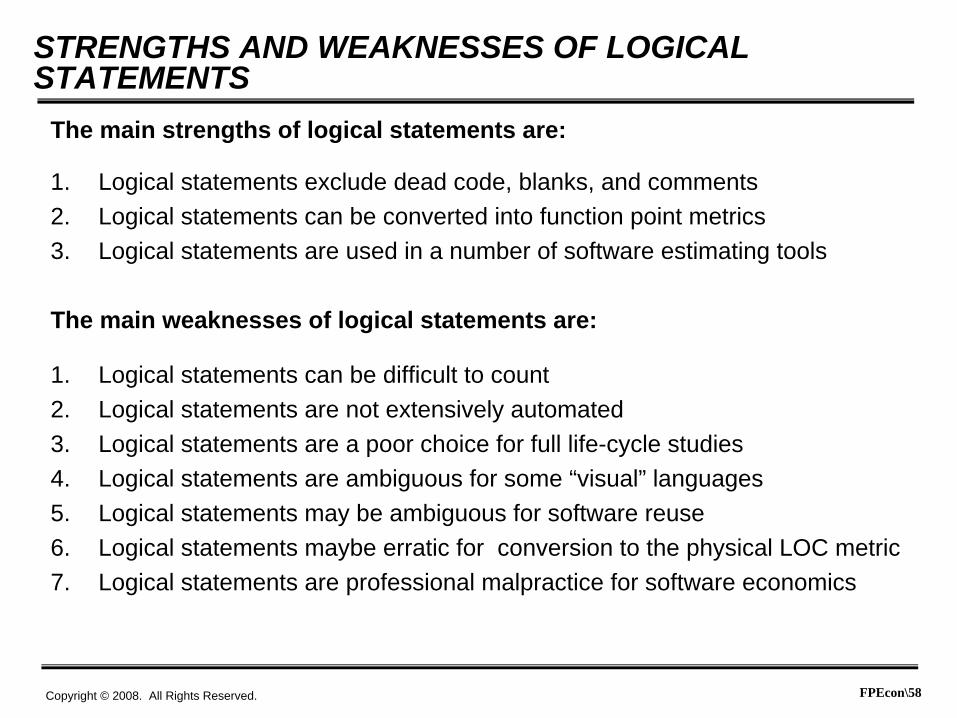
STRENGTHS AND WEAKNESSES OF LOGICAL STATEMENTS
The main strengths of logical statements are:
1. Logical statements exclude dead code, blanks, and comments2. Logical statements can be converted into function point metrics3. Logical statements are used in a number of software estimating tools
The main weaknesses of logical statements are:
1. Logical statements can be difficult to count2. Logical statements are not extensively automated3. Logical statements are a poor choice for full life-cycle studies4. Logical statements are ambiguous for some “visual” languages5. Logical statements may be ambiguous for software reuse6. Logical statements maybe erratic for conversion to the physical LOC metric7. Logical statements are professional malpractice for software economics
FPEcon\59Copyright © 2008. All Rights Reserved.
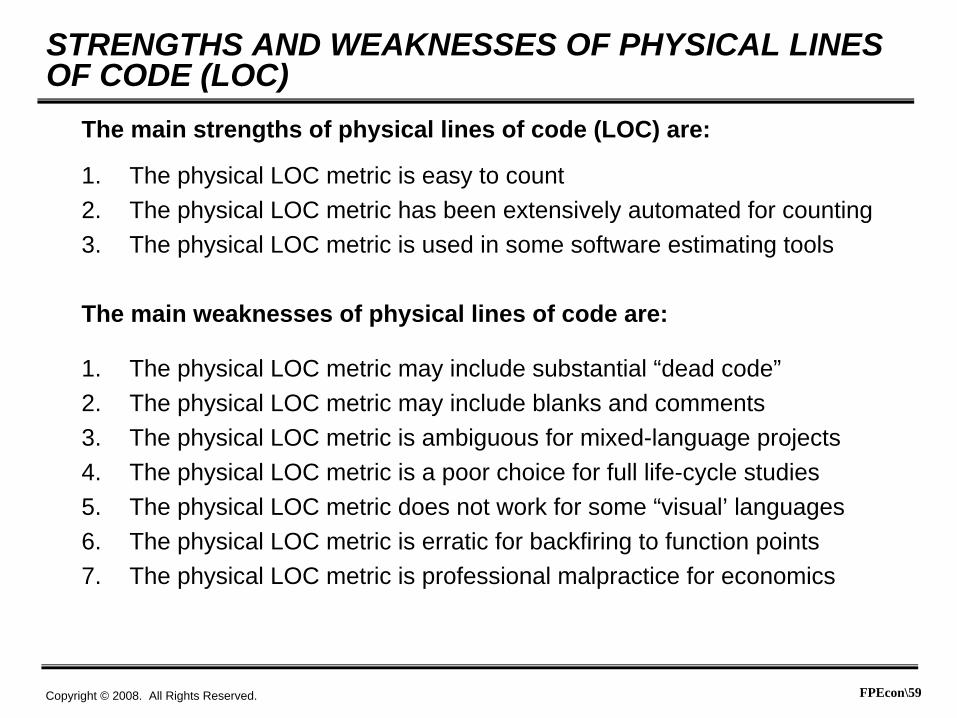
STRENGTHS AND WEAKNESSES OF PHYSICAL LINES OF CODE (LOC)
The main strengths of physical lines of code (LOC) are:
1. The physical LOC metric is easy to count2. The physical LOC metric has been extensively automated for counting3. The physical LOC metric is used in some software estimating tools
The main weaknesses of physical lines of code are:
1. The physical LOC metric may include substantial “dead code”2. The physical LOC metric may include blanks and comments3. The physical LOC metric is ambiguous for mixed-language projects4. The physical LOC metric is a poor choice for full life-cycle studies5. The physical LOC metric does not work for some “visual’ languages6. The physical LOC metric is erratic for backfiring to function points7. The physical LOC metric is professional malpractice for economics
FPEcon\60Copyright © 2008. All Rights Reserved.
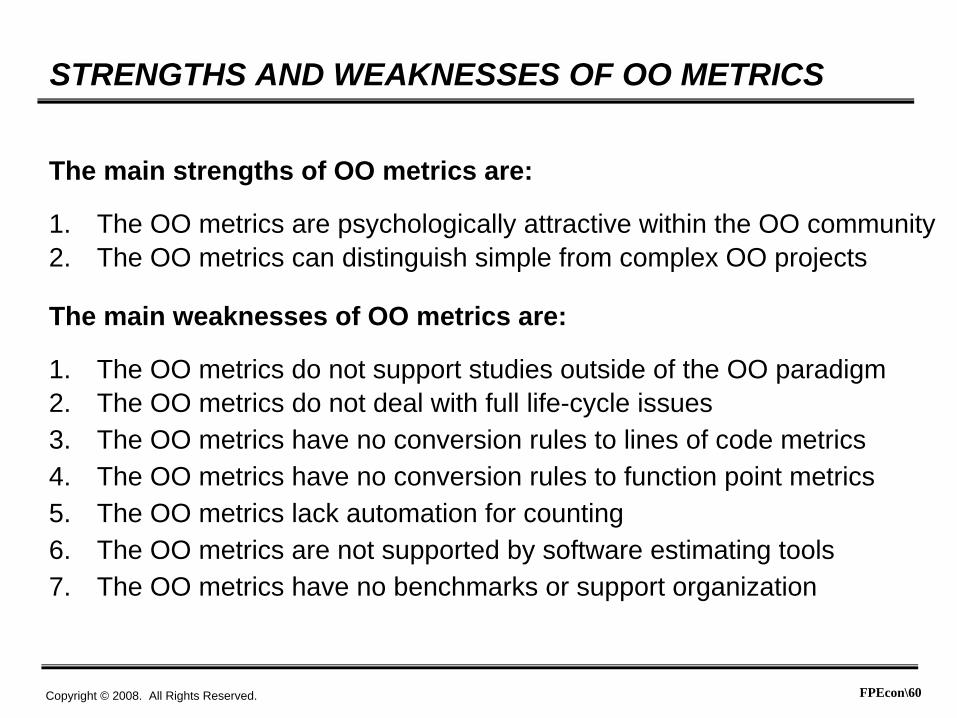
STRENGTHS AND WEAKNESSES OF OO METRICS
The main strengths of OO metrics are:
1. The OO metrics are psychologically attractive within the OO community2. The OO metrics can distinguish simple from complex OO projects
The main weaknesses of OO metrics are:
1. The OO metrics do not support studies outside of the OO paradigm2. The OO metrics do not deal with full life-cycle issues3. The OO metrics have no conversion rules to lines of code metrics4. The OO metrics have no conversion rules to function point metrics5. The OO metrics lack automation for counting6. The OO metrics are not supported by software estimating tools7. The OO metrics have no benchmarks or support organization
FPEcon\61Copyright © 2008. All Rights Reserved.
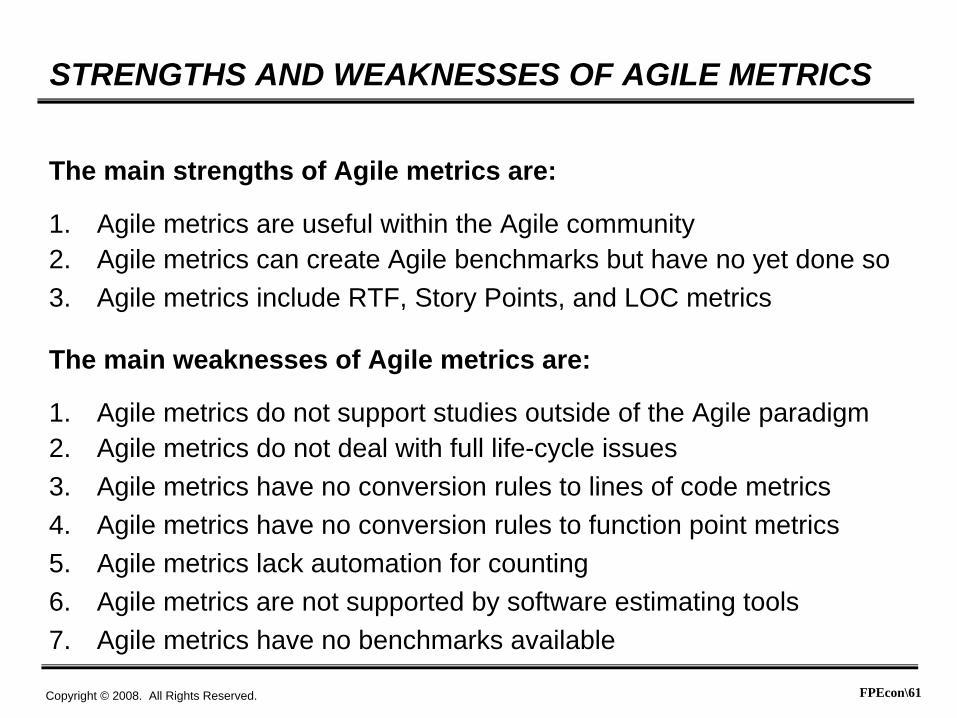
STRENGTHS AND WEAKNESSES OF AGILE METRICS
The main strengths of Agile metrics are:
1. Agile metrics are useful within the Agile community2. Agile metrics can create Agile benchmarks but have no yet done so3. Agile metrics include RTF, Story Points, and LOC metrics
The main weaknesses of Agile metrics are:
1. Agile metrics do not support studies outside of the Agile paradigm2. Agile metrics do not deal with full life-cycle issues3. Agile metrics have no conversion rules to lines of code metrics4. Agile metrics have no conversion rules to function point metrics5. Agile metrics lack automation for counting6. Agile metrics are not supported by software estimating tools7. Agile metrics have no benchmarks available

FPEcon\62Copyright © 2008. All Rights Reserved.
STRENGTHS AND WEAKNESSES OF GQM METRICS
The main strengths of Goal-Question-Metrics (GQM) are:
1. GQM metrics are useful for a wide range of problems2. GQM metrics are useful for executive reporting3. GQM metrics support innovative solutions
The main weaknesses of GQM metrics are:
1. GQM metrics are unique, and difficult to use for benchmarks2. GQM metrics collect random kinds of data3. GQM metrics have no conversion rules to lines of code metrics4. GQM metrics have no conversion rules to function point metrics5. GQM metrics lack automation for counting6. GQM metrics are not supported by software estimating tools7. GQM metrics have no user group or support organization
FPEcon\63Copyright © 2008. All Rights Reserved.
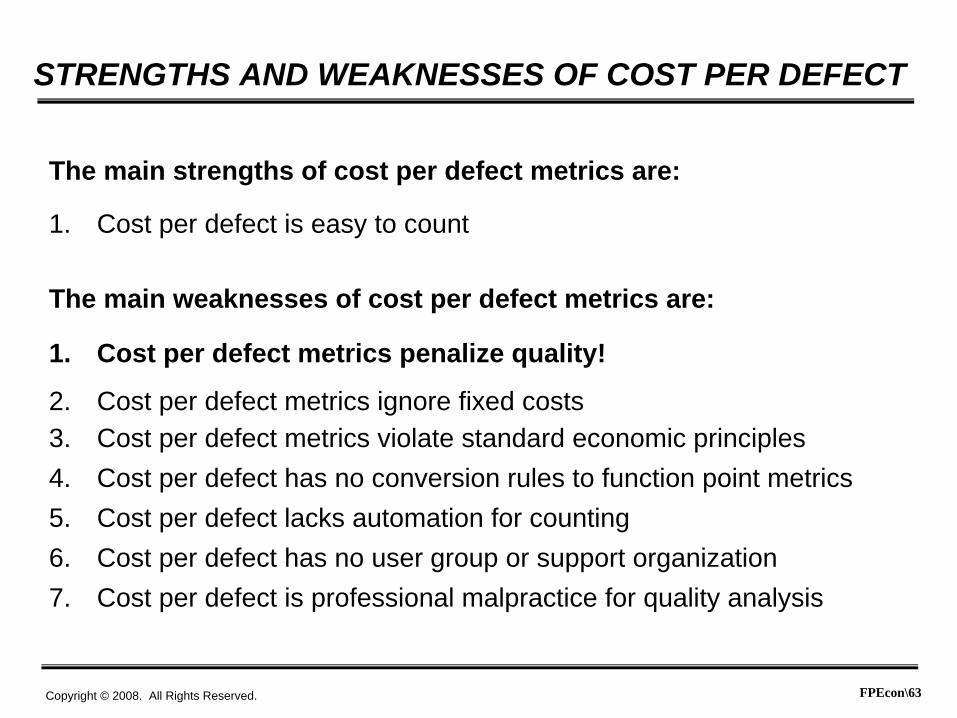
STRENGTHS AND WEAKNESSES OF COST PER DEFECT
The main strengths of cost per defect metrics are:
1. Cost per defect is easy to count
The main weaknesses of cost per defect metrics are:
1. Cost per defect metrics penalize quality!
2. Cost per defect metrics ignore fixed costs3. Cost per defect metrics violate standard economic principles4. Cost per defect has no conversion rules to function point metrics5. Cost per defect lacks automation for counting6. Cost per defect has no user group or support organization7. Cost per defect is professional malpractice for quality analysis
FPEcon\64Copyright © 2008. All Rights Reserved.
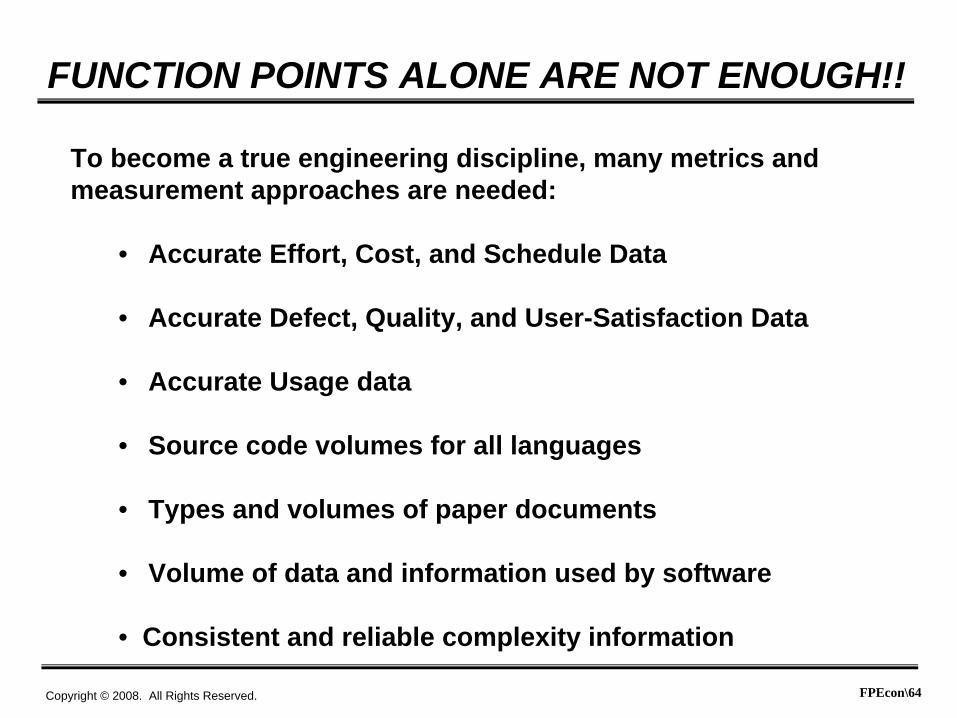
FUNCTION POINTS ALONE ARE NOT ENOUGH!!
To become a true engineering discipline, many metrics andmeasurement approaches are needed:
• Accurate Effort, Cost, and Schedule Data
• Accurate Defect, Quality, and User-Satisfaction Data
• Accurate Usage data
• Source code volumes for all languages
• Types and volumes of paper documents
• Volume of data and information used by software
• Consistent and reliable complexity information
FPEcon\65Copyright © 2008. All Rights Reserved.
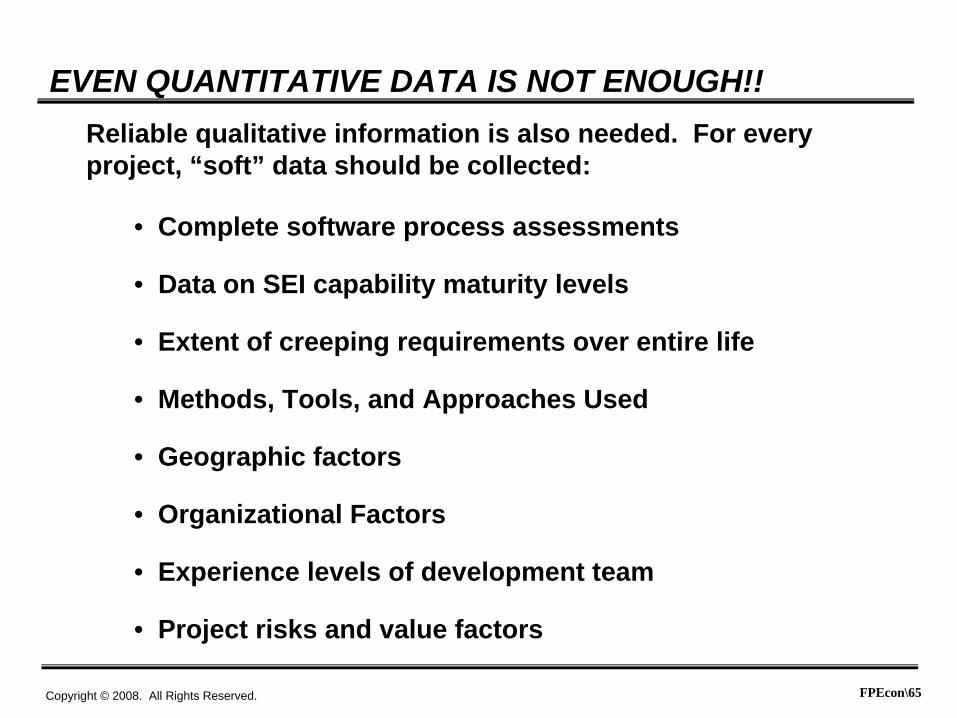
EVEN QUANTITATIVE DATA IS NOT ENOUGH!!Reliable qualitative information is also needed. For everyproject, “soft” data should be collected:
• Complete software process assessments
• Data on SEI capability maturity levels
• Extent of creeping requirements over entire life
• Methods, Tools, and Approaches Used
• Geographic factors
• Organizational Factors
• Experience levels of development team
• Project risks and value factors

FPEcon\66Copyright © 2008. All Rights Reserved.
FUNCTION POINTS AND FUTURE METRICS
• Software is only one technology used in modern business, in manufacturing, in government,and in military organizations.
• Can function points be expanded to other businessactivities?
• Can we build a suite of metrics similar to function points,for other aspects of modern business?
FPEcon\67Copyright © 2008. All Rights Reserved.
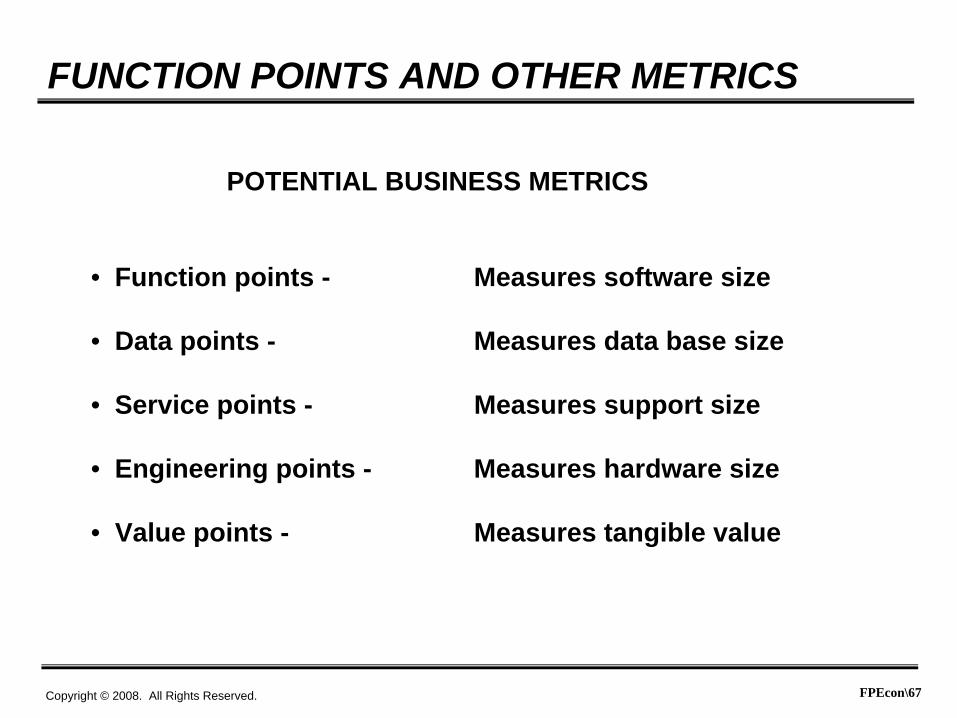
FUNCTION POINTS AND OTHER METRICS
POTENTIAL BUSINESS METRICS
• Function points - Measures software size
• Data points - Measures data base size
• Service points - Measures support size
• Engineering points - Measures hardware size
• Value points - Measures tangible value

FPEcon\68Copyright © 2008. All Rights Reserved.
PROPOSED SUITE OF METRICS
Function Points Data Points Value PointsInputs Entities Time to marketOutputs Sets Cost reductionInquiries Attributes Revenue increaseLogical files Interfaces Market shareInterfaces Constraints Morale
Health/SafetyService Points Engineering Points Risk reduction
Customers Algorithms National securityInputs Inventions Mandates/statutesOutputs References Customer satisfactionInquiries Feedback SynergyLogical files Constraints CompetitivenessInterfaces Inputs Performance increasesConstraints OutputsReferences Interfaces

FPEcon\69Copyright © 2008. All Rights Reserved.
POTENTIAL INTEGRATED COST ANALYSIS
Unit of Measure Size Unit $ Total Costs
Function points 1,000 $500 $500,000
Data points 2,000 $300 $600,000
Service points 1,500 $250 $375,000
Engineering points 1,500 $700 $1,050,000
TOTAL 6,000 $420 $2,525,000
Value points 10,000 $600 $6,000,000
ROI $2.37 per $1.00 spent
FPEcon\70Copyright © 2008. All Rights Reserved.
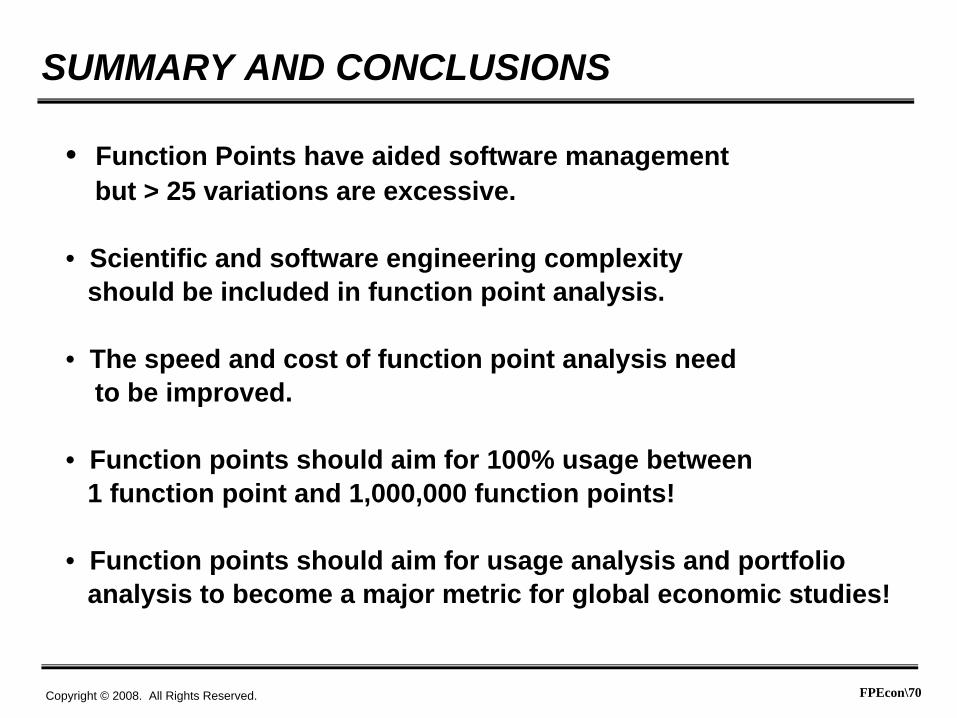
SUMMARY AND CONCLUSIONS
• Function Points have aided software managementbut > 25 variations are excessive.
• Scientific and software engineering complexityshould be included in function point analysis.
• The speed and cost of function point analysis needto be improved.
• Function points should aim for 100% usage between1 function point and 1,000,000 function points!
• Function points should aim for usage analysis and portfolio analysis to become a major metric for global economic studies!

FPEcon\71Copyright © 2008. All Rights Reserved.
SUMMARY AND CONCLUSIONS
• Software is a major business tool for all industries, alllevels of government, and all military organizations.
• Function points are the only metric that can measure quality,productivity, costs, value, and economics without distortion.
• Function points can become a key tool for large-scale economicanalysis in every industry and country in the world!
• Function points can also become a key factor in softwarerisk analysis and risk avoidance. No other metric can do this.
• Function points can improve the professional status of software and turn “software engineering” into a true engineeringdiscipline instead of a craft as it is today.
FPEcon\72Copyright © 2008. All Rights Reserved.
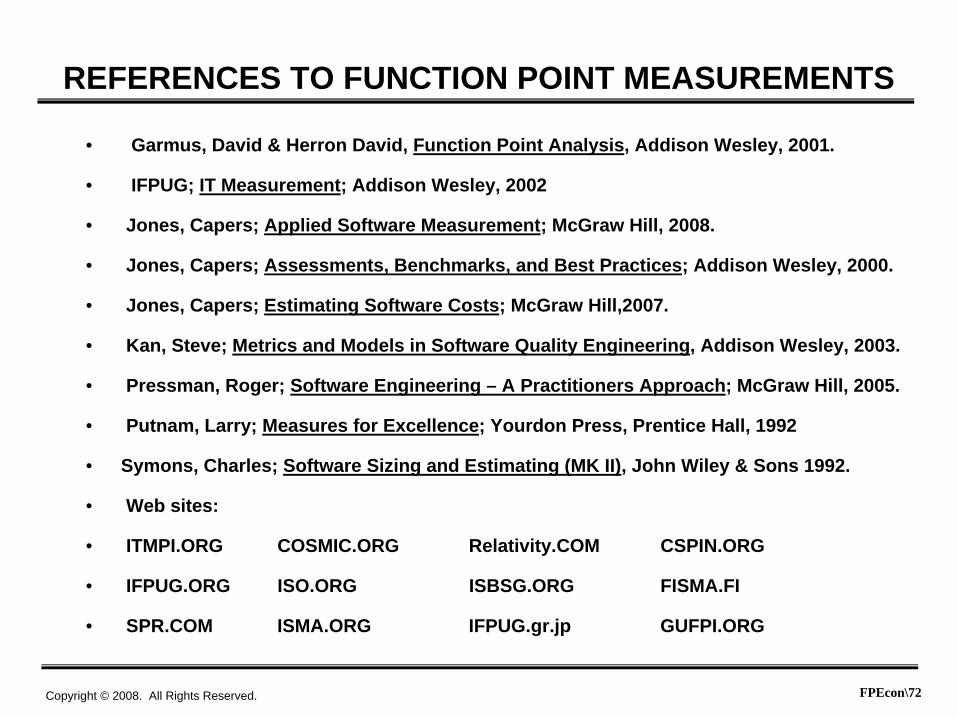
REFERENCES TO FUNCTION POINT MEASUREMENTS
• Garmus, David & Herron David, Function Point Analysis, Addison Wesley, 2001.
• IFPUG; IT Measurement; Addison Wesley, 2002
• Jones, Capers; Applied Software Measurement; McGraw Hill, 2008.
• Jones, Capers; Assessments, Benchmarks, and Best Practices; Addison Wesley, 2000.
• Jones, Capers; Estimating Software Costs; McGraw Hill,2007.
• Kan, Steve; Metrics and Models in Software Quality Engineering, Addison Wesley, 2003.
• Pressman, Roger; Software Engineering – A Practitioners Approach; McGraw Hill, 2005.
• Putnam, Larry; Measures for Excellence; Yourdon Press, Prentice Hall, 1992
• Symons, Charles; Software Sizing and Estimating (MK II), John Wiley & Sons 1992.
• Web sites:
• ITMPI.ORG COSMIC.ORG Relativity.COM CSPIN.ORG
• IFPUG.ORG ISO.ORG ISBSG.ORG FISMA.FI
• SPR.COM ISMA.ORG IFPUG.gr.jp GUFPI.ORG