science 20 unit b: chapter and unit review questions 1 review questions knowledge 1. define uniform...
TRANSCRIPT

SCIENCE 20UNIT B: CHANGES IN MOTION
CHAPTER AND UNIT REVIEW QUESTIONS
You may find the following Internet sites useful:
• Alberta Education, http://www.education.gov.ab.ca • Learning Technologies Branch, http://www.education.gov.ab.ca/ltb • Learning Resources Centre, http://www.lrc.education.gov.ab.ca
Science 20Unit B: Changes in MotionChapter and Unit Review Questions
Exploring the electronic information superhighway can be educational and entertaining. However, be aware that these computer networks are not censored. Students may unintentionally or purposely find articles on the Internet that may be offensive or inappropriate. As well, the sources of information are not always cited and the content may not be accurate. Therefore, students may wish to confirm facts with a second source.
This document is intended for
Students ✓
Teachers ✓
Administrators
Home Instructors
General Public
Other
Copyright © 2006, Alberta Education. This resource is owned by the Crown in Right of Alberta, as represented by the Minister of Education, Alberta Education, 10155 – 102 Street, Edmonton, Alberta, Canada T5J 4L5. All rights reserved.
This resource was developed by or for Alberta Education. It may be reproduced in any form, including photocopying, without written permission from Alberta Education provided that associated copyright notices are also reproduced.
THIS RESOURCE IS NOT SUBJECT TO THE TERMS OF A LICENCE FROM A COLLECTIVE OR LICENSING BODY, SUCH AS ACCESS COPYRIGHT.

Chapter 1 Review Questions
Knowledge
1. Define uniform motion.
2. List four quantities that are scalars.
3. List four quantities that are vectors.
4. Distinguish between scalar and vector quantities.
5. Demonstrate the proper use of conversion factors by finding the missing values.
a. 5.4 h = s b. 900 s = h c. 1500 m = km d. 4.75 km = m e. 35.5 m/s = km/h f. 85 km/h = m/s
6. Define the term velocity in the following ways.
a. using a sentence b. referring to a position–time graph c. stating an equation
7. Define the term acceleration in the following ways.
a. using a sentence b. referring to a velocity–time graph c. stating an equation
8. Distinguish between the following terms: reaction distance, braking distance, and stopping distance.
9. Distinguish between the following terms: applied force, force of friction, and net force.
10. State Newton’s first law of motion, and give an example of how it is used.
11. State Newton’s second law of motion, and give an example of how it is used.
Science 20: Unit B 3 Chapter and Unit Review Questions
Science 20 © 2006 Alberta Education (www.education.gov.ab.ca)

Applying Concepts
A great place for Canadians to visit is the nation’s capital. Ottawa is a beautiful city with outstanding museums and other attractions that are surrounded by fabulous parks and gardens. Suppose you just arrived in Ottawa and you are planning the next few days of activities using this map.
?
?
Scale:
1 cm = 100 m
Ottawa River
Parliament Buildings
PeaceTower
SupremeCourt ofCanadaNational Archives
& National Library
CurrencyMuseum
Bank ofCanada
CapitalInfo. Centre
NationalArts Centre
OntarioCourthouse
ConfederationPark
OttawaLocks
MajorsHill
Park
Slater St.Slater St.
Albert St.Albert St.
Laurier Ave Laurier Ave
Wellington St.
Queen St.
Sparks St. Sparks St.
Queen St.
Sus
sex
Driv
e
Bay
St.
Lyon
St.
Ken
t S
t.
Ban
k S
t.
O'C
onno
r S
t.
Met
calfe
St.
Elg
in S
t.
Gloucester St.
Wellington St.
N
S
EW
ConferenceCentre
Figure B1.54: The National Arts Centre and the Ottawa Locks are only two of many fascinating sights to see in Ottawa.
Use a ruler and the map of Ottawa to answer questions 12 to 15. This map is available as a handout, called “Map of Ottawa,” on the Science 20 Textbook CD. In terms of a sign convention, when dealing with things moving east-west, consider the positive direction to be east. North can be considered the positive direction for north-south motions.
Science 20: Unit B 4 Chapter and Unit Review Questions
Science 20 © 2006 Alberta Education (www.education.gov.ab.ca)
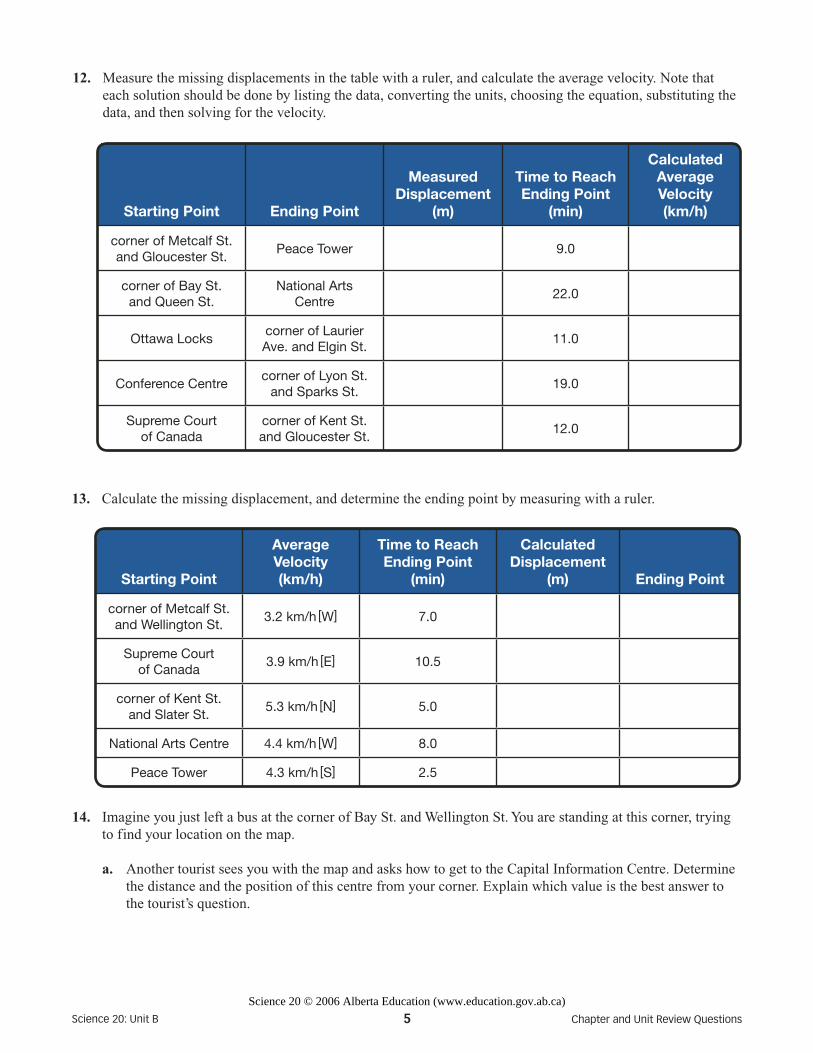
12. Measure the missing displacements in the table with a ruler, and calculate the average velocity. Note that each solution should be done by listing the data, converting the units, choosing the equation, substituting the data, and then solving for the velocity.
Starting Point Ending Point
Measured Displacement
(m)
Time to Reach Ending Point
(min)
Calculated Average Velocity (km/h)
corner of Metcalf St. and Gloucester St.
Peace Tower 9.0
corner of Bay St. and Queen St.
National Arts Centre
22.0
Ottawa Lockscorner of Laurier Ave. and Elgin St.
11.0
Conference Centrecorner of Lyon St.
and Sparks St.19.0
Supreme Court of Canada
corner of Kent St. and Gloucester St.
12.0
13. Calculate the missing displacement, and determine the ending point by measuring with a ruler.
Starting Point
AverageVelocity(km/h)
Time to Reach Ending Point
(min)
Calculated Displacement
(m) Ending Point
corner of Metcalf St. and Wellington St.
3.2 km/h [W] 7.0
Supreme Court of Canada
3.9 km/h [E] 10.5
corner of Kent St. and Slater St.
5.3 km/h [N] 5.0
National Arts Centre 4.4 km/h [W] 8.0
Peace Tower 4.3 km/h [S] 2.5
14. Imagine you just left a bus at the corner of Bay St. and Wellington St. You are standing at this corner, trying to find your location on the map.
a. Another tourist sees you with the map and asks how to get to the Capital Information Centre. Determine the distance and the position of this centre from your corner. Explain which value is the best answer to the tourist’s question.
Science 20: Unit B 5 Chapter and Unit Review Questions
Science 20 © 2006 Alberta Education (www.education.gov.ab.ca)

b. One way to show the tourist how to go from the corner of Bay and Wellington to the Capital Information Centre is to take him or her there yourself. If this walk takes 12.0 min, determine your velocity in kilometres per hour.
c. Having dropped off the tourist at the Capital Information Centre, you decide to walk to the Currency Museum, which takes an additional 5.0 min. Use a scale diagram and the head-to-tail method to determine the resultant displacement from the corner of Bay and Wellington to the Currency Museum.
d. Determine your average speed and average velocity, both in kilometres per hour, for the total journey from the corner of Bay and Wellington to the Capital Information Centre to the Currency Museum. Explain why these values are so different even though they describe the same trip.
15. Eventually, you end up at the Peace Tower in front of the Parliament buildings. You try to find your location on the map.
a. Determine the displacement of the Supreme Court of Canada from your location.
b. If you were able to walk with an average velocity of 3.0 km/h, west, along footpaths from the Peace Tower to the Supreme Court of Canada, determine the number of minutes this should take.
c. You walk with an average velocity of 3.6 km/h, south, from the Peace Tower for 8.0 min. Determine your final displacement and the point of your location on the map.
16. You have seen in this chapter that a graph can tell a story about the corresponding motion it describes. By carefully inspecting a velocity–time graph, you should be able to determine the
• time interval for the motion • initial and final velocities • acceleration during the time interval • displacement during the time interval
Complete the process described for each of the following graphs. In each case, clearly communicate your answers.
a. b.
c. d.
Time (s)
Velo
city
(m/s
)
Velocity–Time
10.0
20.0
10.05.00
Time (s)
Velo
city
(cm
/s)
Velocity–Time
2.5
5.0
50.025.00
Time (s)
Velo
city
(m/s
)
Velocity–Time
2.5
5.0
20.010.00
Time (h)
Velo
city
(km
/h)
Velocity–Time
50
100
2.01.00
Science 20: Unit B 6 Chapter and Unit Review Questions
Science 20 © 2006 Alberta Education (www.education.gov.ab.ca)
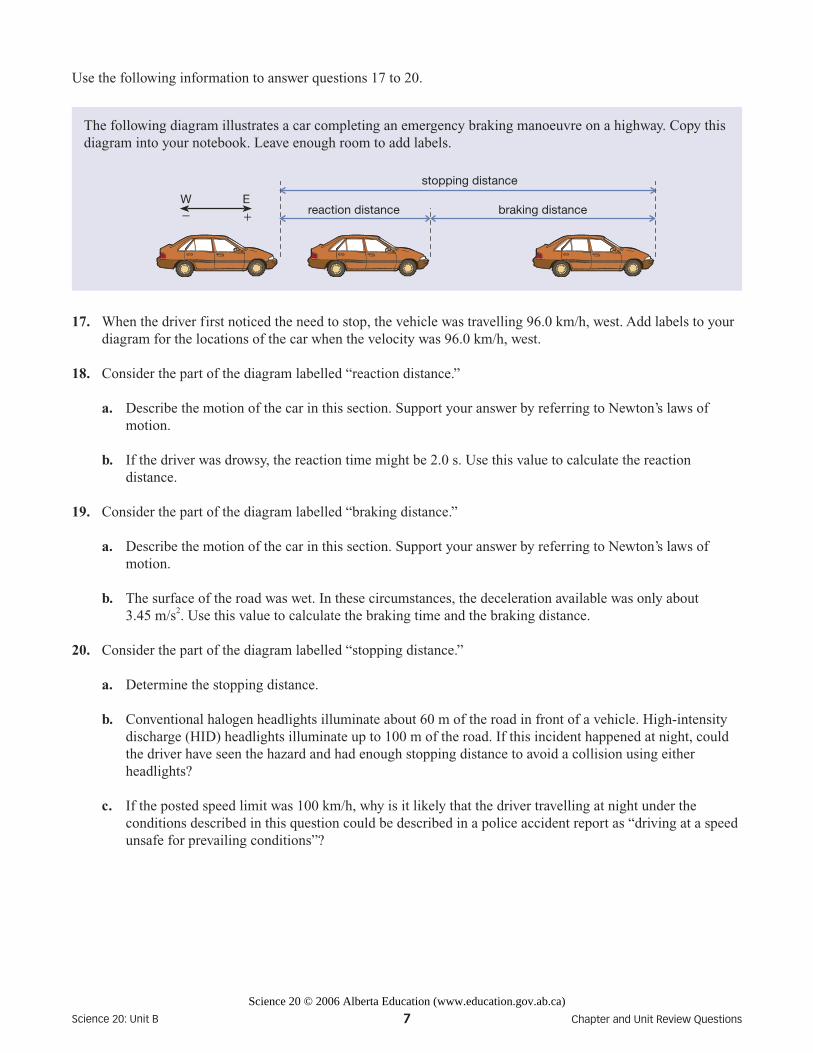
17. When the driver first noticed the need to stop, the vehicle was travelling 96.0 km/h, west. Add labels to your diagram for the locations of the car when the velocity was 96.0 km/h, west.
18. Consider the part of the diagram labelled “reaction distance.”
a. Describe the motion of the car in this section. Support your answer by referring to Newton’s laws of motion.
b. If the driver was drowsy, the reaction time might be 2.0 s. Use this value to calculate the reaction distance.
19. Consider the part of the diagram labelled “braking distance.”
a. Describe the motion of the car in this section. Support your answer by referring to Newton’s laws of motion.
b. The surface of the road was wet. In these circumstances, the deceleration available was only about 3.45 m/s2. Use this value to calculate the braking time and the braking distance.
20. Consider the part of the diagram labelled “stopping distance.”
a. Determine the stopping distance.
b. Conventional halogen headlights illuminate about 60 m of the road in front of a vehicle. High-intensity discharge (HID) headlights illuminate up to 100 m of the road. If this incident happened at night, could the driver have seen the hazard and had enough stopping distance to avoid a collision using either headlights?
c. If the posted speed limit was 100 km/h, why is it likely that the driver travelling at night under the conditions described in this question could be described in a police accident report as “driving at a speed unsafe for prevailing conditions”?
Use the following information to answer questions 17 to 20.
The following diagram illustrates a car completing an emergency braking manoeuvre on a highway. Copy this diagram into your notebook. Leave enough room to add labels.
stopping distance
reaction distance braking distanceW E- +
Science 20: Unit B 7 Chapter and Unit Review Questions
Science 20 © 2006 Alberta Education (www.education.gov.ab.ca)
Chapter 2 Review Questions
Knowledge
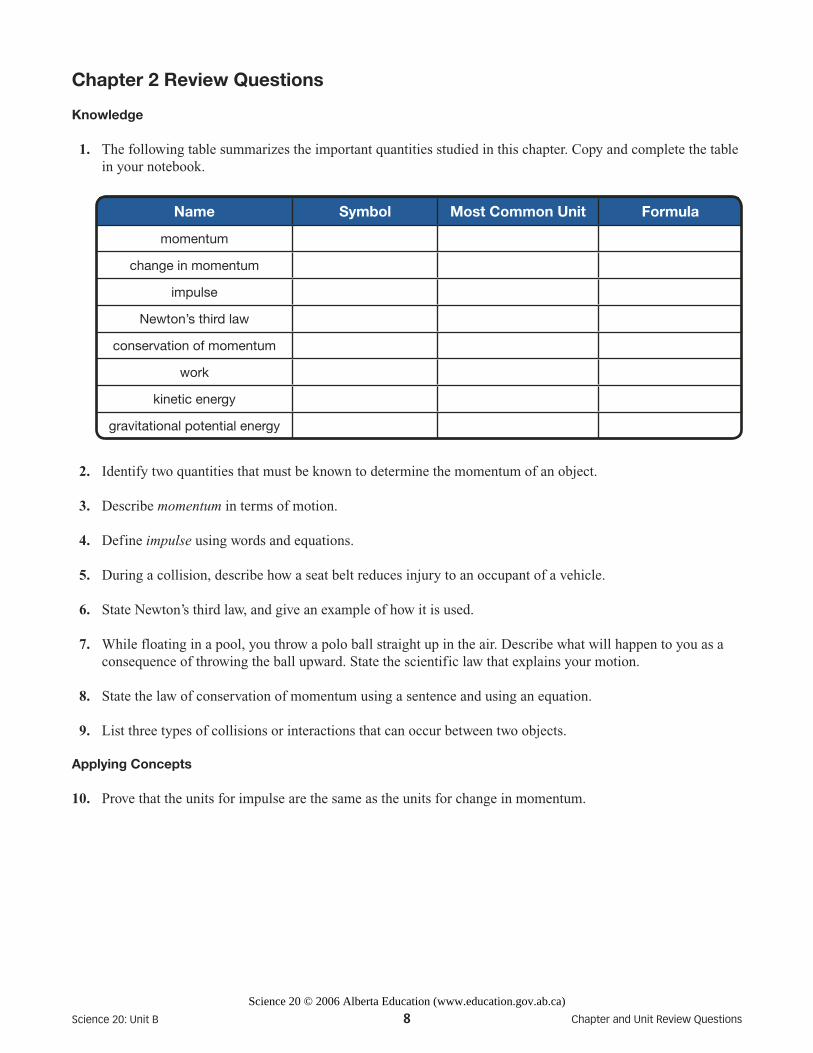
1. The following table summarizes the important quantities studied in this chapter. Copy and complete the table in your notebook.
2. Identify two quantities that must be known to determine the momentum of an object.
3. Describe momentum in terms of motion.
4. Define impulse using words and equations.
5. During a collision, describe how a seat belt reduces injury to an occupant of a vehicle.
6. State Newton’s third law, and give an example of how it is used.
7. While floating in a pool, you throw a polo ball straight up in the air. Describe what will happen to you as a consequence of throwing the ball upward. State the scientific law that explains your motion.
8. State the law of conservation of momentum using a sentence and using an equation.
9. List three types of collisions or interactions that can occur between two objects.
Applying Concepts
10. Prove that the units for impulse are the same as the units for change in momentum.
Name Symbol Most Common Unit Formula
momentum
change in momentum
impulse
Newton’s third law
conservation of momentum
work
kinetic energy
gravitational potential energy
Science 20: Unit B 8 Chapter and Unit Review Questions
Science 20 © 2006 Alberta Education (www.education.gov.ab.ca)

11. A skateboarder and a skateboard have a total mass of 66 kg and are initially gliding on a smooth concrete surface at a velocity of 2.6 m/s[E]. They crash into a vertical foam barrier, coming to a stop in 0.12 s. Assuming that the skateboarder and skateboard act as one combined mass throughout the interaction, calculate the following values.
a. initial momentum b. final momentum c. change in momentum d. impulse provided by the foam barrier on the skateboarder and the skateboard e. force provided by the foam barrier on the combined mass f. acceleration of the combined mass g. initial kinetic energy of the combined mass h. final kinetic energy of the combined mass i. change in kinetic energy of the combined mass
12. Answer the following if the foam barrier in question 11 exerted a resisting force of 1.5 ¥ 103 N to stop the skateboarder and the skateboard in 0.15 m.
a. Calculate the work done by the foam barrier in stopping the combined mass. b. Describe the relationship between the work done by the foam barrier and the change in kinetic energy of
the skateboarder and the skateboard.
13. A 900-kg compact car is travelling 60 km/h[N].
a. Calculate the initial momentum of the car.
b. The compact car crashes into the rear of a 1500-kg truck travelling 10 km/h[N]. After the collision, the compact car remains at rest. Calculate the final velocity of the truck.
c. Determine the change in momentum of the car.
d. If the time of impact during the collision was 0.15 s, calculate the force exerted by the truck in stopping the car.
e. The force of the truck on the car compressed the bumper of the car a displacement of 0.060 m. Calculate
the work done by the truck on the car.
f. Describe the energy changes in the car during the entire interaction.
14. If the compact car in question 13 hits and sticks to the truck, calculate the final velocity of the combined masses.
15. A 500-g ball is thrown against a wall with a velocity of 6.00 m/s. If the ball rebounds with a velocity of 5.00 m/s, calculate the
a. change in momentum of the ball b. force provided by the wall on the ball if the time of impact was 0.22 s
16. Will a primary collision cause injury to a passenger? Explain your answer.
Science 20: Unit B 9 Chapter and Unit Review Questions
Science 20 © 2006 Alberta Education (www.education.gov.ab.ca)
17. A 4.0-kg ball travelling 4.0 m/s[N] strikes another 2.0-kg ball travelling 1.0 m/s[N]. The two balls stick together after the collision and travel 3.0 m/s[N].
a. Show that momentum is conserved. b. Show that kinetic energy is not conserved.
18. A 50-kg goalkeeper at rest catches a 0.700-kg soccer ball travelling directly towards him at 12.0 m/s.
a. Describe why it is less painful to catch the ball by letting your arms “give” while catching the ball rather than catching the ball with “rigid” arms.
b. If the goalkeeper lets his arms “give,” the ball comes to rest in 1.2 s. If his arms are rigid, the ball comes to rest in 0.40 s. Calculate the force exerted by his arm on the ball in both cases.
19. A 1500-kg car travelling 90 km/h[N] collides with a 1200-kg minivan travelling 40 km/h[S]. After the collision, the two vehicles stick together.
a. Calculate the initial momentum of the car and the minivan.
b. Using the law of conservation of momentum, determine the total momentum of the two vehicles after the collision.
c. Calculate the final velocity of the two vehicles after the collision in metres per second.
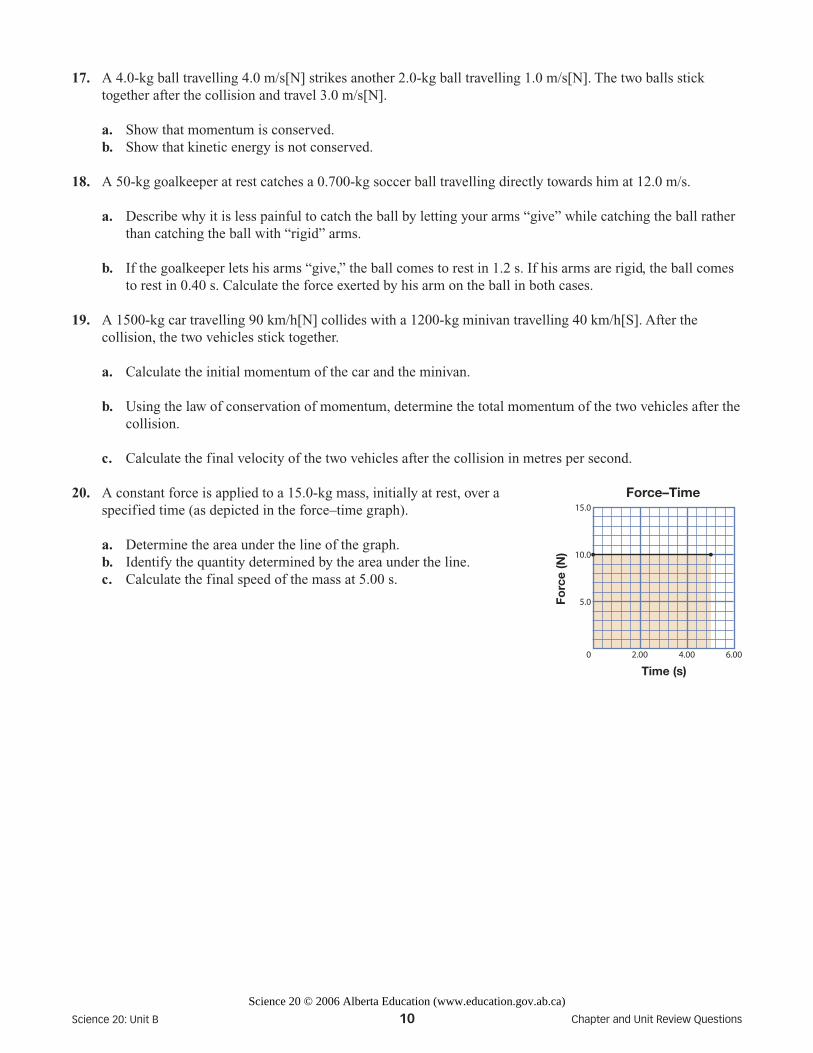
20. A constant force is applied to a 15.0-kg mass, initially at rest, over a specified time (as depicted in the force–time graph).
a. Determine the area under the line of the graph. b. Identify the quantity determined by the area under the line. c. Calculate the final speed of the mass at 5.00 s.
Time (s)
Forc
e (N
)
0
5.0
10.0
15.0
4.00 6.002.00
Force–Time
Science 20: Unit B 10 Chapter and Unit Review Questions
Science 20 © 2006 Alberta Education (www.education.gov.ab.ca)

Unit B Review Questions
1. This table summarizes the important quantities used in this unit. Copy and complete this table in your notebook. Remember to leave enough room for your answers. The first entry has been done for you.
Quantity SymbolScalar or
VectorMost Common
Unit(s)
distance D d scalarmkm
time
average speed
position
displacement
average velocity
acceleration
net force
mass
momentum
impulse
kinetic energy
Science 20: Unit B 11 Chapter and Unit Review Questions
Science 20 © 2006 Alberta Education (www.education.gov.ab.ca)

2. In this unit you were introduced to a number of equations involving the variables listed in question 1. Copy the following table into your notebook. Complete this table by matching at least one application to each of the key equations from this unit. The first equation from this unit has been completed as an example.
EquationApplication
“This equation can be used to determine the . . .”
v dt
= D
D
• average velocity of a glacier’s retreat• displacement of a vehicle on a highway during a driver’s reaction time• time a vehicle takes to reach an object illuminated at the end of the
headlights’ beam
av v
t
=-( )
Df i
D = +( ) Dd v v t 1
2 i f
D = D + D( )d v t a t
i
12
2
F ma
net=
p mv
=
Fpt
=DD
F F
1 2 to 2 to 1= -
p p
before after= ÂÂ
E mvk
= 12
2
W Fd=
Science 20: Unit B 12 Chapter and Unit Review Questions
Science 20 © 2006 Alberta Education (www.education.gov.ab.ca)

Applying Concepts
Use the following information to answer questions 3 and 4.
3. Consider the photo of the pregnant woman driving the car. Suppose this car was moving and was then involved in a collision and suddenly came to a stop.
a. Use Newton’s laws of motion to explain the motion of the driver in the fraction of a second immediately after impact.
b. List at least three technologies that would act to help reduce her injuries.
c. Use the idea of impulse to explain how a seat belt would reduce the severity of the injuries to the driver.
d. Explain why the design of the seat belt and the position of the steering wheel is particularly important if the driver is a pregnant woman.
Young children are protected while travelling in vehicles with specially designed car seats and booster seats. When pregnant women are in the last stages of pregnancy, their unborn children are much harder to protect during a motor vehicle collision.
It is estimated that each year there are three times as many fetuses in the second and third trimesters killed in motor vehicle collisions than there are children under 4 years of age killed in motor vehicle collisions. Researchers are investigating solutions to this problem by developing computer models geared to improve the designs of seat belts, air bags, and steering wheels for pregnant women.
Figure B.1: In a collision, it is difficult to protect unborn children of pregnant women in their last stage of pregnancy.
© VIRGINIA POLYTECHNIC INSTITUTE AND DR. S. DUMAS
Figure B.2: Researchers are trying to improve the design of seat belts and related vehicle safety features for pregnant women.
© VIRGINIA POLYTECHNIC INSTITUTE AND DR. S. DUMAS
Science 20: Unit B 13 Chapter and Unit Review Questions
Science 20 © 2006 Alberta Education (www.education.gov.ab.ca)
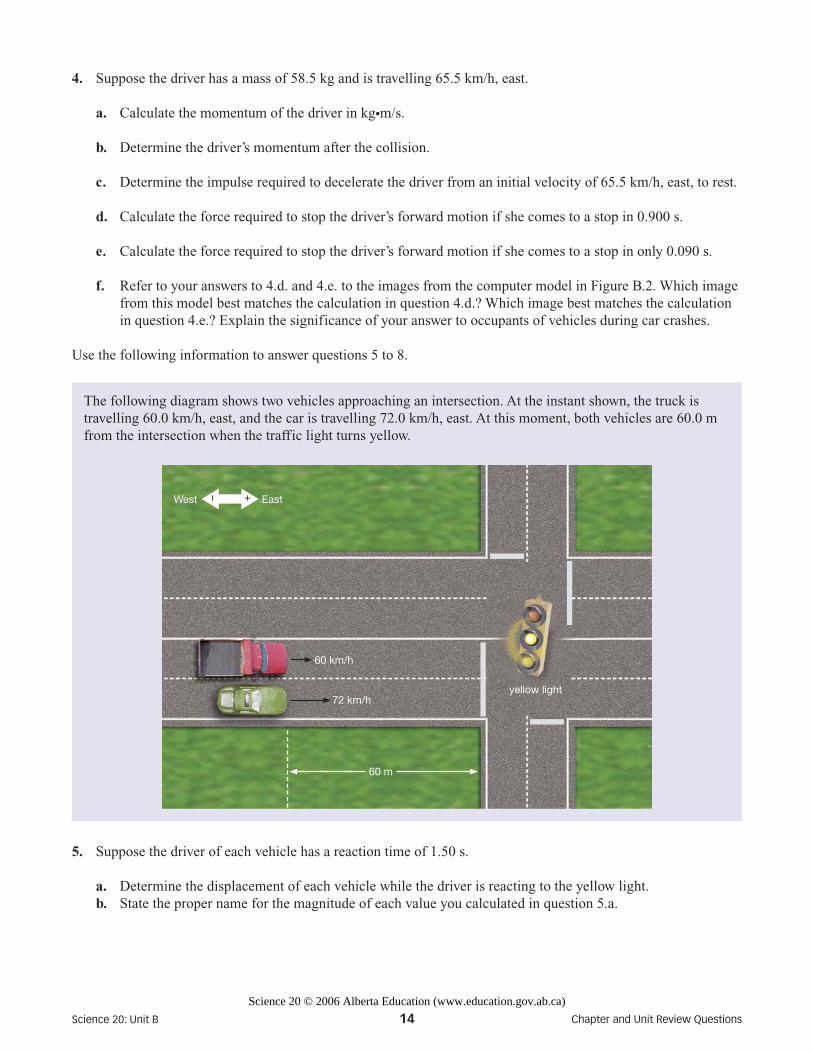
5. Suppose the driver of each vehicle has a reaction time of 1.50 s.
a. Determine the displacement of each vehicle while the driver is reacting to the yellow light. b. State the proper name for the magnitude of each value you calculated in question 5.a.
The following diagram shows two vehicles approaching an intersection. At the instant shown, the truck is travelling 60.0 km/h, east, and the car is travelling 72.0 km/h, east. At this moment, both vehicles are 60.0 m from the intersection when the traffic light turns yellow.
EastWest
yellow light
60 m
60 km/h
72 km/h
+–
4. Suppose the driver has a mass of 58.5 kg and is travelling 65.5 km/h, east.
a. Calculate the momentum of the driver in kgim/s.
b. Determine the driver’s momentum after the collision.
c. Determine the impulse required to decelerate the driver from an initial velocity of 65.5 km/h, east, to rest. d. Calculate the force required to stop the driver’s forward motion if she comes to a stop in 0.900 s.
e. Calculate the force required to stop the driver’s forward motion if she comes to a stop in only 0.090 s.
f. Refer to your answers to 4.d. and 4.e. to the images from the computer model in Figure B.2. Which image from this model best matches the calculation in question 4.d.? Which image best matches the calculation in question 4.e.? Explain the significance of your answer to occupants of vehicles during car crashes.
Use the following information to answer questions 5 to 8.
Science 20: Unit B 14 Chapter and Unit Review Questions
Science 20 © 2006 Alberta Education (www.education.gov.ab.ca)

6. At the end of the 1.50-s time interval, each driver begins to brake.
a. Use the standard deceleration value of 5.85 m/s2 to determine the additional time required for each vehicle to stop. Use the time values to determine the distance travelled by each vehicle while braking.
b. State the proper name for the values that you calculated in question 6.a.
7. The total distance travelled by each vehicle can be found by adding the distance travelled by the vehicle while the driver was reacting to the distance travelled by the vehicle while the driver was braking.
a. Determine the stopping distance for each vehicle.
b. Each vehicle began the process of coming to a stop at a displacement of 60.0 m, west of the intersection. Use a scale diagram to determine the final position of each vehicle relative to the intersection. On your scale diagram, let the start of the intersection be considered the reference position (zero point) and let the initial position of the vehicles have a value of - 60.0 m.
8. For this intersection, the light remained yellow for 2.8 s. Suppose the driver of the car decided not to stop for the yellow light, but instead decided to continue through the intersection while the light was yellow.
a. Determine the displacement of the car during the 2.8-s time interval of the yellow light if the driver maintained the velocity of 72 km/h.
b. Use a scale diagram to determine the final position of the car relative to the intersection. On your diagram, let the start of the intersection be considered the reference position (zero point) and let the initial position of the car to be - 60.0 m.
c. Should the driver of the car maintain the car’s velocity, or should the driver brake? Evalulate the options for dealing with the yellow light for the driver of the car. If neither option is satisfactory, identify the possible causes of this driver’s dilemma.
Science 20: Unit B 15 Chapter and Unit Review Questions
Science 20 © 2006 Alberta Education (www.education.gov.ab.ca)
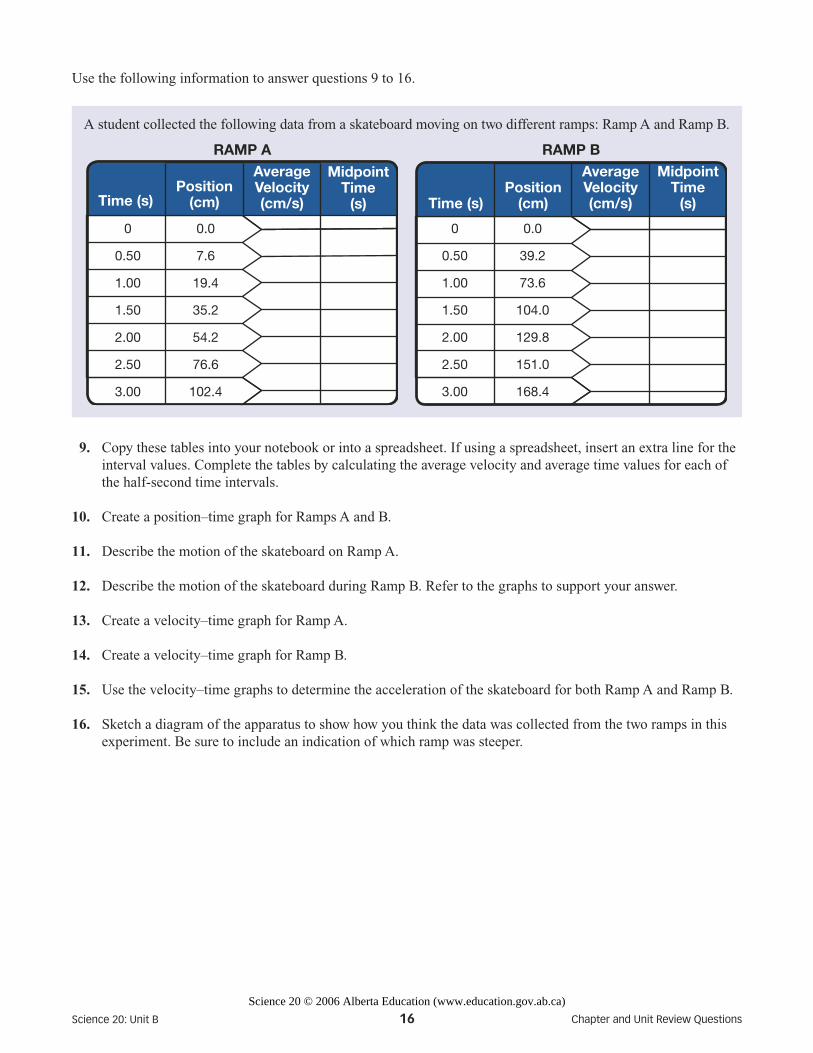
9. Copy these tables into your notebook or into a spreadsheet. If using a spreadsheet, insert an extra line for the interval values. Complete the tables by calculating the average velocity and average time values for each of the half-second time intervals.
10. Create a position–time graph for Ramps A and B.
11. Describe the motion of the skateboard on Ramp A.
12. Describe the motion of the skateboard during Ramp B. Refer to the graphs to support your answer.
13. Create a velocity–time graph for Ramp A.
14. Create a velocity–time graph for Ramp B.
15. Use the velocity–time graphs to determine the acceleration of the skateboard for both Ramp A and Ramp B.
16. Sketch a diagram of the apparatus to show how you think the data was collected from the two ramps in this experiment. Be sure to include an indication of which ramp was steeper.
A student collected the following data from a skateboard moving on two different ramps: Ramp A and Ramp B.
RAMP A
Time (s)
Average Velocity (cm/s)
Position (cm)
0
0.50
1.00
1.50
2.00
2.50
3.00
0.0
7.6
19.4
35.2
54.2
76.6
102.4
Midpoint Time
(s) Time (s)
Average Velocity (cm/s)
Position (cm)
Midpoint Time
(s)
RAMP B
0
0.50
1.00
1.50
2.00
2.50
3.00
0.0
39.2
73.6
104.0
129.8
151.0
168.4
Use the following information to answer questions 9 to 16.
Science 20: Unit B 16 Chapter and Unit Review Questions
Science 20 © 2006 Alberta Education (www.education.gov.ab.ca)
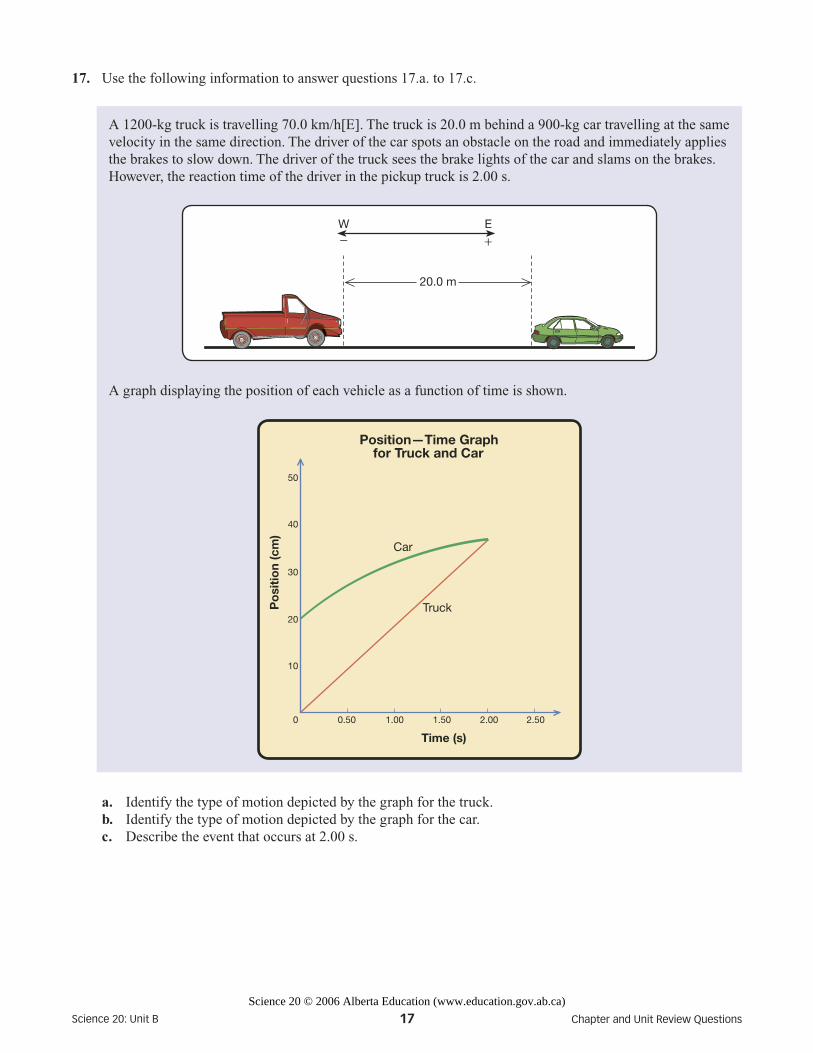
a. Identify the type of motion depicted by the graph for the truck. b. Identify the type of motion depicted by the graph for the car. c. Describe the event that occurs at 2.00 s.
A 1200-kg truck is travelling 70.0 km/h[E]. The truck is 20.0 m behind a 900-kg car travelling at the same velocity in the same direction. The driver of the car spots an obstacle on the road and immediately applies the brakes to slow down. The driver of the truck sees the brake lights of the car and slams on the brakes. However, the reaction time of the driver in the pickup truck is 2.00 s.
A graph displaying the position of each vehicle as a function of time is shown.
Time (s)
Po
siti
on
(cm
)
Position—Time Graphfor Truck and Car
0
40
10
20
30
50
0.50 1.00 1.50 2.00 2.50
Car
Truck
20.0 m
W E- +
17. Use the following information to answer questions 17.a. to 17.c.
Science 20: Unit B 17 Chapter and Unit Review Questions
Science 20 © 2006 Alberta Education (www.education.gov.ab.ca)

18. Collisions are often the consequence of one vehicle following another vehicle too closely. This is commonly referred to as “tail gating.” A truck, with a mass of 1200 kg and a velocity of 19.4 m/s[E], rear-ends a 900-kg car travelling 7.20 m/s[E]. After the impact, the two vehicles stick together.
a. Use the law of conservation of momentum to determine the velocity of the two vehicles after the collision. b. Calculate the change in momentum of the truck. c. Determine the impulse on the truck. d. If the time of impact was 1.30 s, calculate the force on the truck.
19. Suppose the truck, with a mass of 1200-kg and velocity of 19.4 m/s[E], rear-ends the 900-kg car. At the moment of impact, the car had decelerated to a velocity of 7.20 m/s[E]. After an impact time of 1.30 s, the truck slows to 12.0 m/s[E] while the car is propelled forward by the collision.
a. Using the law of conservation of momentum, calculate the final velocity of the car.
b. Determine the change in momentum of the truck.
c. Determine the change in momentum of the car.
d. Are the magnitudes of the change in momentums the same for both vehicles? State the law that justifies your answer.
e. Calculate the impulse of the truck on the car.
f. Calculate the impulse of the car on the truck.
g. Are the impulses on both vehicles the same?
h. Determine the force of the truck on the car.
i. Determine the force of the car on the truck.
j. Are the forces on each vehicle the same? State the law that justifies your answer.
k. If the force compresses the rear of the car by 0.300 m, how much work was done?
l. How much energy is required to do this work?
Science 20: Unit B 18 Chapter and Unit Review Questions
Science 20 © 2006 Alberta Education (www.education.gov.ab.ca)

Data Collected by Forensic Engineer at
Scene of Collision
Science Terms and Concepts Used in
Analyzing Data
Information About Collision Derived from
Data
length of skid marks left on roadway
amount of crumpling or deformation of metal parts
rest positions of the vehicles at the scene of a collision
COLLISION RECONSTRUCTION
From the Science 20 Textbook CD, view the video “Career Profile: Accident Reconstruction.” Use the information provided to answer questions 20 and 21.
20. Do forensic engineers determine who was at fault in a collision?
21. Complete the following chart.
Science 20: Unit B 19 Chapter and Unit Review Questions
Science 20 © 2006 Alberta Education (www.education.gov.ab.ca)