science motivation questionnaire ii: validation with ... · journal of research in science teaching...
TRANSCRIPT
JOURNAL OF RESEARCH IN SCIENCE TEACHING VOL. 48, NO. 10, PP. 1159–1176 (2011)
Science Motivation Questionnaire II:Validation With Science Majors and Nonscience Majors
Shawn M. Glynn,1 Peggy Brickman,2 Norris Armstrong,3 and Gita Taasoobshirazi4
1Department of Educational Psychology and Instructional Technology, Department of Mathematics
and Science Education, 329 Aderhold, University of Georgia, Athens, Georgia 306022Department of Plant Biology, University of Georgia, Athens, Georgia
3Department of Genetics, University of Georgia, Athens, Georgia4Department of Educational Psychology, University of Nevada, Las Vegas, Nevada
Received 16 June 2010; Accepted 28 August 2011
Abstract: From the perspective of social cognitive theory, the motivation of students to learn
science in college courses was examined. The students—367 science majors and 313 nonscience
majors—responded to the Science Motivation Questionnaire II, which assessed five motivation compo-
nents: intrinsic motivation, self-determination, self-efficacy, career motivation, and grade motivation.
Exploratory and confirmatory factor analyses provided evidence of questionnaire construct validity.
The motivation components, especially self-efficacy, were related to the students’ college science grade
point averages. The science majors scored higher than the nonscience majors on all of the motivation
components. Among both science majors and nonscience majors, men had higher self-efficacy than
women, and women had higher self-determination than men. The findings suggest that the questionnaire
is a valid and efficient tool for assessing components of students’ motivation to learn science in college
courses, and that the components play a role in students’ science achievement. � 2011 Wiley
Periodicals, Inc. J Res Sci Teach 48: 1159–1176, 2011
ey
s th
ene
aki
apa
vide
orl
itera
ot r
eed
dop
ppli
K
i
g
m
c
e
w
l
n
n
a
a
words: motivation; assessment; validation; college science
Accompanying the rapid pace of scientific discovery and growth of scientific knowledge
e need to make public-policy decisions about complex issues in areas such as health care,
tic engineering, and energy sources. In order to participate effectively in the decision-
ng process, citizens need to be scientifically literate, which means that they have the
bility to understand scientific knowledge, identify important scientific questions, draw
nce-based conclusions, and make decisions about how human activity affects the natural
d (Organisation for Economic Cooperation and Development, 2007).
Unfortunately, recent surveys reveal that many citizens in the United States lack scientific
cy: They cannot provide correct answers to basic questions about scientific facts and do
eason well about scientific issues (National Science Board, 2008). To address the critical
for scientific literacy, the American Association of Colleges and Universities (2011) has
ted a goal to build and sustain strong undergraduate education in science. The goal
es to both science majors and nonscience majors because it is essential that all students
ecome scientifically literate citizens who are able to understand the complex issues that
Correspondence to: S.M. Glynn; E-mail: [email protected]
DOI 10.1002/tea.20442
Published online 20 September 2011 in Wiley Online Library (wileyonlinelibrary.com).
2� 011 Wiley Periodicals, Inc.
b

criterion-related validity, and construct validity (Osterlind, 2006). In earlier studies (Glynn,
Taasoobshirazi, & Brickman, 2007, 2009), the Science Motivation Questionnaire was foun
to have good content validity and criterion-related validity, but the results of an explorator
factor analysis in the 2009 study suggested that the questionnaire should be revise
to improve its construct validity, the extent to which the questionnaire assesses the laten
motivational variables it targets. Thus, one purpose of the present study was to revise th
questionnaire to improve its construct validity.
A related purpose of the present study was to evaluate the revised questionnaire wit
science majors and nonscience majors. Most studies of the motivation to learn science, in
cluding earlier studies with the questionnaire, focused on nonscience majors because instruc
tors often find it challenging to motivate them (Druger, 2006). But the motivation of scienc
majors also merits attention. Too many science majors are not making it through the academ
ic ‘‘pipeline’’ leading to careers in science, and some groups of science majors are underrep
resented in the pipeline, such as women in the physical sciences (National Scienc
Foundation, 2002; Xie & Shauman, 2003). It is, therefore, important to assess the motivatio
of science majors and nonscience majors.
Theoretical Framework
Social cognitive theory, developed by Bandura (1986, 2001, 2006) and extende
by others (e.g., Pajares & Schunk, 2001; Pintrich, 2003), construes human functioning as
series of reciprocal interactions among personal characteristics, environmental contexts, an
behaviors. In social cognitive theory, students’ learning is viewed as most effective when it i
self-regulated, which occurs when students understand, monitor, and control their motivatio
and behavior, leading to desirable learning outcomes. Motivation is defined in this theor
as an internal state that arouses, directs, and sustains goal-oriented behavior. By extension
d
y
d
t
e
h
-
-
e
-
-
e
n
d
a
d
s
n
y
,
the motivation to learn science can be defined as an internal state that arouses, directs, and
sustains science-learning behavior. Motivated students achieve academically by engaging in
Journal of Research in Science Teaching
1160 GLYNN ETAL.
confront them. But it is difficult to achieve this goal because many students lack or lose the
motivation to learn science—and these students include both science majors and nonscience
majors.
By means of individual and group advisement sessions, science instructors can help
students who lack motivation to learn science (Druger, 2006). But, at the beginning of
courses, how can instructors know which students lack motivation? And why do they lack
motivation? These are important questions for instructors, yet answering these questions is
difficult, particularly at institutions with large-enrollment science courses where it is hard
to know students personally. To help answer these questions, the Science Motivation
Questionnaire was developed (Glynn & Koballa, 2006). The questionnaire provides instruc-
tors with a tool for efficiently gathering information that can increase the effectiveness of
advisement sessions with students. The questionnaire also provides researchers with a tool for
investigating students’ motivation to learn science in college courses, the relationship of moti-
vation to other student characteristics, and the interaction of motivation with instructional
methods.
Validity is the most fundamental consideration in developing, evaluating, and revising a
questionnaire. Validity is theoretically and practically important: It refers to the degree to
which theory and evidence support the uses and interpretations of questionnaire scores
(American Educational Research Association, 1999). Validity is a unitary concept, and many
sources of evidence contribute to it. Traditionally, three of these sources are content validity,
that no single component captures the essence of what instructors, such as Druger, mean
when they describe students who are motivated to learn science. That is because the motiva-
tion to learn, as conceptualized in social cognitive theory, is a multicomponent construct: The
components are types and attributes of motivation, which were reviewed by Glynn and
Koballa (2006), Koballa and Glynn (2007), Eccles and Wigfield (2002), Pintrich (2003), and
Schunk et al. (2008). Examples of these components are intrinsic motivation, which involves
the inherent satisfaction in learning science for its own sake (e.g., Eccles, Simpkins, & Davis-
Kean, 2006); self-determination, which refers to the control students believe they have over
their learning of science (e.g., Black & Deci, 2000); self-efficacy, which refers to students’
belief that they can achieve well in science (e.g., Lawson, Banks, & Logvin, 2007); and
extrinsic motivation, which involves learning science as a means to a tangible end, such
as a career or a grade (e.g., Mazlo et al., 2002). These mutually supporting components
of motivation contribute positively to the arousal, direction, and sustainment of students’
science-learning behavior. Together, these components constitute a componential model of
motivation derived from social cognitive theory.
When measuring the motivation to learn science, science education researchers attempt
to determine why students strive to learn science, what emotions they feel as they strive, how
intensively they strive, and how long they strive. Measuring the motivation to learn science is
challenging because a construct and its components are not directly observable variables. For
this reason, they are called latent variables. Although latent variables cannot be directly ob-
served, they can be measured by means of observed variables (items) that serve as empirical
indicators. The items on the Science Motivation Questionnaire were designed to serve as
empirical indicators of components of students’ motivation to learn science in college
courses. It is theoretically and practically important to ensure that these indicators are valid.
Valid indicators can make a significant contribution to science education by providing
researchers and instructors with the means of assessing students’ motivation to learn science.
The Present Study
The Science Motivation Questionnaire was revised in the present study based on social
cognitive theory and the results of an earlier exploratory factor analysis (Glynn et al., 2009).
Exploratory factor analyses are used in the initial stages of questionnaire development to
examine relationships among items and identify sets of items (factors) that have common
characteristics. The factors represent latent variables—in this case, the motivation compo-
nents. By providing information about the internal structure of a questionnaire, exploratory
factor analyses are important steps toward establishing its construct validity, the extent to
which it assesses the latent motivational variables it targets. In subsequent stages of question-
naire development, ‘‘confirmatory factor analysis needs to be used to establish construct
validity’’ (Pett, Lackey, & Sullivan, 2003, p. 239).
The exploratory factor analysis by Glynn et al. (2009) provided insight into how students
conceptualized their motivation to learn science. The psychometric factors indicated that
the students conceptualized some components of motivation differently—broader in some
Journal of Research in Science Teaching
MOTIVATION 1161
behavior such as question asking, advice seeking, studying, and participating in classes, labs,
and study groups (Schunk, Pintrich, & Meece, 2008).
Druger (2006) argues that one of the most important goals of an instructor of introducto-
ry college science courses is to help students become motivated self-learners. Like many
science instructors, he evokes a variety of motivation components when expressing this goal:
‘‘We want students to enjoy science, recognize its role in the world, gain greater self-confi-
dence about learning science, and want to learn more about science’’ (p. 39). It is noteworthy

that target more precisely the primary ‘‘ends’’ that college students focus on (Lin,
McKeachie, & Kim, 2003). Grades are important short-term goals because they are measures
of college success and part of the entry criteria for many careers. Careers are important long-
term goals: In a series of nationwide student focus groups conducted by the American
Association of Colleges and Universities, ‘‘professional success was identified. . .as the prima-
ry reason for pursuing a college degree, which students recognize as a basic requirement for
success in today’s competitive job marketplace’’ (Humphreys & Davenport, 2005, p. 36).
The revised questionnaire was evaluated with science majors and nonscience majors be-
cause it is important for researchers and instructors to assess all students’ motivation to learn
in their core curriculum science courses. Too many science majors are not making it through
the academic programs that lead to science careers, and some groups of science majors are
underrepresented in some programs, such as women in the physical sciences (National
Science Foundation, 2002). And too many nonscience majors lack or lose the motivation to
learn science (Druger, 2006). Science majors and nonscience majors are often in separate
core-curriculum science courses in large colleges and in the same courses in small colleges.
Regardless of how the core-curriculum science courses of a college are constituted, the
revised questionnaire can be used to assess all students’ motivation to learn science.
In conclusion, our goal in revising the questionnaire was to improve its construct validity.
A related goal was to evaluate the revised questionnaire with science majors and nonscience
majors. Associated with these goals were the following research questions:
� How valid is the revised questionnaire in terms of its scales, which are based on a
componential model of motivation?
� What similarities and differences in motivation exist between students who are
science majors and students who are nonscience majors?
Method
The assessment of personal characteristics such as motivation, attitudes, beliefs, and
mood states encompasses a wide variety of constructs that are conceptualized on different
theoretical levels (Embretson & Reise, 2000). Consequently, the development of these kinds
of items poses complex challenges, which are discussed in detail by Boone, Townsend, and
Journal of Research in Science Teaching
1162 GLYNN ETAL.
respects and narrower in others—than researchers have done when discussing these compo-
nents in the social cognitive literature. Broader conceptualizations were that intrinsic motiva-
tion involved personal relevance (e.g., Learning science makes my life more meaningful),
and self-efficacy involved assessment anxiety (e.g., I worry about failing science tests). A
narrower conceptualization was that extrinsic motivation was differentiated as grade motiva-
tion (e.g., Getting a good science grade is important to me) and career motivation (e.g., My
career will involve science). The students’ conceptualizations were reasonable: As they
explained in interviews and essays in the 2009 study, what is intrinsically motivating to them
is relevant; their low self-efficacy often leads to high anxiety; and, extrinsically, grades and
careers primarily motivate them.
In light of the students’ conceptualizations, the Science Motivation Questionnaire was
revised to assess intrinsic motivation, self-determination, self-efficacy, career motivation, and
grade motivation. The revised questionnaire targets positive, mutually supporting motivators
and, therefore, includes items about self-efficacy but not anxiety, a negative motivator. In
addition, one of the original scales—extrinsic motivation or ‘‘learning science as a means to a
tangible end’’—has been transformed into two scales, grade motivation and career motivation,

In classical theory, items are assumed to be roughly parallel indicators of the underlying
latent variable. Each item is assumed to be approximately equivalent in its sensitivity to
the phenomenon of interest. These assumptions fit well when assessing many personal
characteristics, such as attitudes, beliefs, and mood states (DeVellis, 2003, p. 150).
In CTT, items target features and qualities of the latent variable, as well as tasks an
ks o
T fit
wid
the
2000
avail
plie
nite
ienc
este
rolle
non
non
-hou
pro
D. i
d
r
s
e
m
,
-
d
d
e
r
d
-
-
r
-
n
behaviors associated with it. In IRT, in comparison, items tend to target specific tas
behaviors assumed to be hierarchical or progressive indicators of the latent variable. IR
well when assessing cognitive and physical variables, but ‘‘in personality assessment a
variety of constructs are conceptualized on different theoretical levels. . .and not all of
are appropriately assessed by an IRT measurement framework’’ (Embretson & Reise,
p. 324). CTT was also chosen because many widely used CTT-based questionnaires are
able that served as exemplars for items assessing motivation, and CTT is frequently ap
to multidimensional constructs as well as unidimensional ones.
Participants
At a public university with 25,335 undergraduate students in the southern U
States, we studied 680 undergraduate students: 367 science majors and 313 nonsc
majors. The science majors were enrolled fall semester (n ¼ 198) or spring sem
(n ¼ 169) in Principles of Biology for science majors; the nonscience majors were en
fall semester (n ¼ 161) or spring semester (n ¼ 152) in Basic Concepts in Biology for
science majors. These courses are core-curriculum counterparts for science majors and
science majors, respectively. Both courses are 15-week semester courses with three 1
large-enrollment lectures (ns ¼ 150 to 300) and a 2-hour lab (ns ¼ 20) each week. The
fessor (second author) who taught Basic Concepts in Biology is a woman with a Ph.
genetics and 14 years of college teaching experience; the professor (third author) who taught
Principles of Biology is a man with a Ph.D. in zoology and 14 years of college teaching
experience.
The students had previously taken two or more science courses. They participated in the
study between week 12 and week 14 of the 15-week semesters. All provided complete data.
Voluntary participation, rather than compulsory, was specified by the university’s guidelines
for research with human participants. Informed consent forms were signed by the students,
who volunteered ‘‘to help us better understand the goals of students in science courses’’ and
Journal of Research in Science Teaching
MOTIVATION 1163
Staver (2011), Bradburn, Sudman, and Wansink (2004), DeVellis (2003), Embretson and
Reise (2000), Liu (2010), and Wilson (2005).
There are a number of measurement theories—e.g., classical test theory (CTT), item
response theory (IRT), and generalizability theory (G theory)—that can be used to develop
and revise questionnaire items. CTT has been used most often for this purpose, but IRT and
G theory are being used increasingly because they can produce stronger results due to their
stronger psychometric assumptions. Despite stronger assumptions, IRT and G theory ‘‘are not
in opposition to CTT, nor do they supersede CTT. In fact their roots are firmly grounded in
CTT. A more accurate view of modern theories is to hold that they extend CTT; they do not
replace it’’ (Osterlind, 2006, p. 58). And, regarding the methodologies used to develop
and revise questionnaire items, ‘‘no single methodology is considered universally best’’
(Osterlind, 2006, p. 102).
CTT was chosen as an approach to developing and revising the Science Motivation
Questionnaire items for this reason:

In an earlier study (Glynn & Koballa, 2006), following guidelines by DeVellis (2003)
and Bradburn et al. (2004), the Science Motivation Questionnaire was developed to assess
the motivation to learn science, a social cognitive construct defined as an internal state that
arouses, directs, and sustains science-learning behavior. The results of an exploratory factor
analysis (Glynn et al., 2009) indicated that construct validity could be improved by revising
the questionnaire. These revisions were undertaken in the present study following procedures
specified by Pett et al. (2003).
To revise the questionnaire, we used the 2009 results, the social cognitive research litera-
ture, focus groups of science majors (ns ¼ 10 and 9) and nonscience majors (ns ¼ 9 and 7),
a table of specifications, evaluation by four science instructors (2 women and 2 men), and
pilot testing. The instructors read transcripts of the students’ focus-group comments as back-
ground information, discussed an initial pool of 44 candidate items in relation to the motiva-
tion to learn science, and concurred that 38 items were relevant. These items were pilot
tested with samples of science majors (n ¼ 31) and nonscience majors (n ¼ 34). A set
of preliminary analyses determined those items with characteristics—mean, variance, and
intercorrelations—best suited for scales assessing the positive, mutually supporting motivation
components.
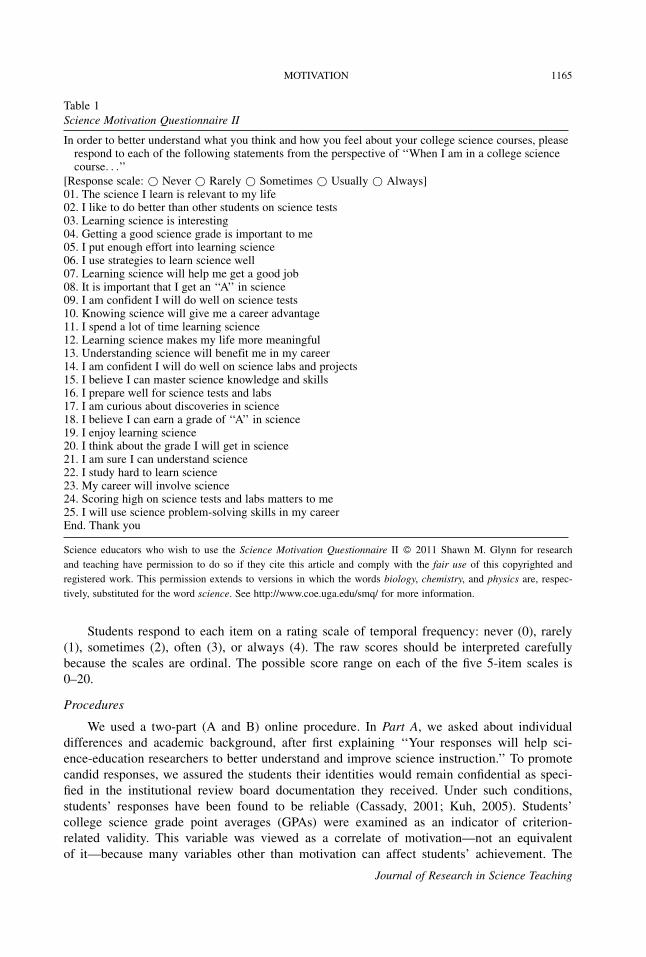
In its final version, the Science Motivation Questionnaire II (see Table 1) included the
following scales, each with 5 items: intrinsic motivation, self-determination, self-efficacy, ca-
reer motivation, and grade motivation. These 25 items included 16 from the original question-
naire—identically worded or with syntactic changes to improve comprehensibility—and
9 new items. As DeVellis (2003) recommends, the items are randomly ordered, strongly
worded, unambiguous declarative statements in the form of short, simple sentences
without jargon. The statements are easy to read: The Flesch-Kincaid formula indicates
readability at the sixth-grade level. The items are focused on the motivation to learn science
in courses rather than a multitude of contexts, such as hobbies. Because of this focus, the
scales are not long, and the entire questionnaire can be completed efficiently in about
15 minutes.
Journal of Research in Science Teaching
1164 GLYNN ETAL.
to earn a small amount of extra credit. Some non-participants said later in the courses that
they ‘‘didn’t have time,’’ ‘‘had a conflict,’’ ‘‘lost the announcement,’’ or ‘‘forgot.’’
The 367 science majors included 240 (65%) women and 127 (35%) men; the 313
nonscience majors included 215 (69%) women and 98 (31%) men. In studies of this kind
(e.g., Lawson et al., 2007), women often outnumber men for three reasons, all of which apply
here. First, women now earn more than 50% of the science undergraduate degrees in
the U.S., with most of these degrees in the life sciences (Stine & Matthews, 2009). Second,
women now earn more than 59% of all undergraduate degrees in the U.S., and more than
70% of the nonscience degrees in education, family and consumer sciences, the arts, and the
humanities (Marsden, 2006; Toppo & DeBarros, 2007). And third, women volunteer more
often than men for academic research studies of this kind (Porter & Whitcomb, 2005).
In the present study, compared to the percentages of women and men in the courses, 12%
more women than men volunteered.
Some of the participating students were from underrepresented groups, African American
(7%), Hispanic or Latino (3.1%), Multiracial (0.6%), and Native American (0.2%). These
percentages were similar to those of the university population. Minority status was not treated
as a statistical variable because there were relatively small numbers in each underrepresented
group and statistical inferences might be misleading.
Questionnaire Development and Revision
and teaching have permission to do so if they cite this article and comply with the fair use of this copyrighted and
registered work. This permission extends to versions in which the words biology, chemistry, and physics are, respec-
tively, substituted for the word science. See http://www.coe.uga.edu/smq/ for more information.
Students respond to each item on a rating scale of temporal frequency: never (0), rarely
(1), sometimes (2), often (3), or always (4). The raw scores should be interpreted carefully
because the scales are ordinal. The possible score range on each of the five 5-item scales is
0–20.
Procedures
We used a two-part (A and B) online procedure. In Part A, we asked about individual
differences and academic background, after first explaining ‘‘Your responses will help sci-
ence-education researchers to better understand and improve science instruction.’’ To promote
candid responses, we assured the students their identities would remain confidential as speci-
fied in the institutional review board documentation they received. Under such conditions,
students’ responses have been found to be reliable (Cassady, 2001; Kuh, 2005). Students’
college science grade point averages (GPAs) were examined as an indicator of criterion-
related validity. This variable was viewed as a correlate of motivation—not an equivalent
of it—because many variables other than motivation can affect students’ achievement. The
Journal of Research in Science Teaching
MOTIVATION 1165
Table 1
Science Motivation Questionnaire II
In order to better understand what you think and how you feel about your college science courses, pleaserespond to each of the following statements from the perspective of ‘‘When I am in a college sciencecourse. . .’’
[Response scale: * Never * Rarely * Sometimes * Usually * Always]01. The science I learn is relevant to my life02. I like to do better than other students on science tests03. Learning science is interesting04. Getting a good science grade is important to me05. I put enough effort into learning science06. I use strategies to learn science well07. Learning science will help me get a good job08. It is important that I get an ‘‘A’’ in science09. I am confident I will do well on science tests10. Knowing science will give me a career advantage11. I spend a lot of time learning science12. Learning science makes my life more meaningful13. Understanding science will benefit me in my career14. I am confident I will do well on science labs and projects15. I believe I can master science knowledge and skills16. I prepare well for science tests and labs17. I am curious about discoveries in science18. I believe I can earn a grade of ‘‘A’’ in science19. I enjoy learning science20. I think about the grade I will get in science21. I am sure I can understand science22. I study hard to learn science23. My career will involve science24. Scoring high on science tests and labs matters to me25. I will use science problem-solving skills in my careerEnd. Thank you
Science educators who wish to use the Science Motivation Questionnaire II � 2011 Shawn M. Glynn for research

observed and latent variables are uncertain. We used exploratory factor analysis to examine
students’ responses to the revised questionnaire because it included new items.
Adequacy of Correlation Matrix of Items. We computed correlations for all pair-wise
combinations of the 25 items and determined that the resulting matrix of correlations was
appropriate for factor analysis by means of a Bartlett’s test of sphericity, x2 ¼ 5,054.39,
df ¼ 300, p < 0.001, and a Kaiser–Meyer–Olkin measure of sampling adequacy,
KMO ¼ 0.91. These tests of multivariate normality and sampling adequacy indicated that the
matrix was of good quality.
Factor Extraction. To extract factors, we performed a principal component analysis on
the items. A principal component analysis uses eigenvalues, which represent the proportion of
variance accounted for by the factors. Eigenvalues are used to derive factor loadings, which
indicate how strongly particular items are related to particular factors. Because with any
factor extraction method there are advantages and disadvantages (reviewed by Fabrigar,
Wegener, MacCallum, & Strahan, 1999), we also performed a principal axis factoring, with
similar results.
Using the Kaiser–Guttman rule, we identified five factors that had eigenvalues greater
than 1, indicating that they accounted for significant amounts of the total variance in the
items. Together, these five factors accounted for 67.64% of that variance, which is considered
good. We also used a scree plot: We examined potential factors by plotting them against their
eigenvalues in descending order of magnitude to identify breaks in the slope of this plot. The
scree plot supported the 5-factor solution obtained using the Kaiser–Guttman rule.
Journal of Research in Science Teaching
1166 GLYNN ETAL.
college science GPAs were based on courses such as ecology, geography, geology, chemistry,
astronomy, and physics. The grade scale (to one decimal place) was 4.0 ¼ A, 3.0 ¼ B,
2.0 ¼ C, 1.0 ¼ D, and 0 ¼ F.
In Part B of the online procedure, we asked the students to respond to the items of the
revised questionnaire. The items were presented without the questionnaire title and with the
instructions: ‘‘In order to better understand what you think and how you feel about
your college science courses, please respond to each of the following statements from the
perspective of: When I am in a college science course. . .’’
Results
First, with the Statistical Program for the Social Sciences, version 17.0 (SPSS, Inc.,
2008), we computed descriptive statistics for students in the fall and spring sections and
found no significant differences, so the sections were combined. Second, using a cross-valida-
tion approach (Byrne, 2001), the 680 students were randomly split into two samples of 340
students each. Third, the data of one sample were examined by means of an exploratory
factor analysis (SPSS, Inc., 2008). Fourth, the data of the other sample were examined by
means of a confirmatory factor analysis using the Analysis of Moment Structures (AMOS)
program, version 7.0 (Arbuckle, 2006): This analysis was a test of the measurement model
that examined relationships among items and scales (motivation components). Fifth, building
on the measurement model, AMOS was used to test a structural model that examined rela-
tionships between the students’ motivation components and college science GPAs. Finally,
science majors and nonscience majors were compared on the motivation components and,
within majors, women and men were compared.
Exploratory Factor Analysis
Exploratory factor analysis is designed for situations where the relationships between the
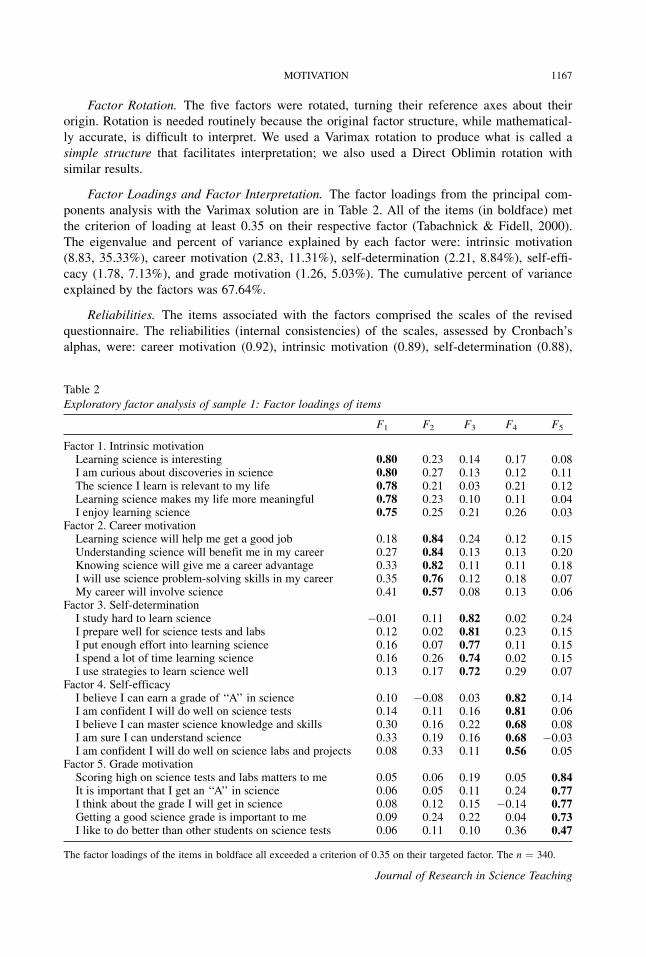
Table 2
Exploratory factor analysis of sample 1: Factor loadings of items
F1 F2 F3 F4 F5
Factor 1. Intrinsic motivationLearning science is interestingI am curious about discoveries in scienceThe science I learn is relevant to my lifeLearning science makes my life more meaningfulI enjoy learning science
Factor 2. Career motivationLearning science will help me get a good jobUnderstanding science will benefit me in my careerKnowing science will give me a career advantageI will use science problem-solving skills in my careerMy career will involve science
Factor 3. Self-determinationI study hard to learn scienceI prepare well for science tests and labsI put enough effort into learning scienceI spend a lot of time learning scienceI use strategies to learn science well
Factor 4. Self-efficacyI believe I can earn a grade of ‘‘A’’ in scienceI am confident I will do well on science testsI believe I can master science knowledge and skillsI am sure I can understand scienceI am confident I will do well on science labs and projects
Factor 5. Grade motivationScoring high on science tests and labs matters to meIt is important that I get an ‘‘A’’ in scienceI think about the grade I will get in scienceGetting a good science grade is important to meI like to do better than other students on science tests
0.800.800.780.780.75
0.180.270.330.350.41
�0.010.120.160.160.13
0.100.140.300.330.08
0.050.060.080.090.06
0.230.270.210.230.25
0.840.840.820.760.57
0.110.020.070.260.17
�0.080.110.160.190.33
0.060.050.120.240.11
0.140.130.030.100.21
0.240.130.110.120.08
0.820.810.770.740.72
0.030.160.220.160.11
0.190.110.150.220.10
0.170.120.210.110.26
0.120.130.110.180.13
0.020.230.110.020.29
0.820.810.680.680.56
0.050.24
�0.140.040.36
0.080.110.120.040.03
0.150.200.180.070.06
0.240.150.150.150.07
0.140.060.08
�0.030.05
0.840.770.770.730.47
The factor loadings of the items in boldface all exceeded a criterion of 0.35 on their targeted factor. The n ¼ 340.
Journal of Research in Science Teaching
MOTIVATION 1167
Factor Rotation. The five factors were rotated, turning their reference axes about their
origin. Rotation is needed routinely because the original factor structure, while mathematical-
ly accurate, is difficult to interpret. We used a Varimax rotation to produce what is called a
simple structure that facilitates interpretation; we also used a Direct Oblimin rotation with
similar results.
Factor Loadings and Factor Interpretation. The factor loadings from the principal com-
ponents analysis with the Varimax solution are in Table 2. All of the items (in boldface) met
the criterion of loading at least 0.35 on their respective factor (Tabachnick & Fidell, 2000).
The eigenvalue and percent of variance explained by each factor were: intrinsic motivation
(8.83, 35.33%), career motivation (2.83, 11.31%), self-determination (2.21, 8.84%), self-effi-
cacy (1.78, 7.13%), and grade motivation (1.26, 5.03%). The cumulative percent of variance
explained by the factors was 67.64%.
Reliabilities. The items associated with the factors comprised the scales of the revised
questionnaire. The reliabilities (internal consistencies) of the scales, assessed by Cronbach’s
alphas, were: career motivation (0.92), intrinsic motivation (0.89), self-determination (0.88),
positive, mutually supporting components of the construct, and (3) the factors are related to
students’ college science GPAs.
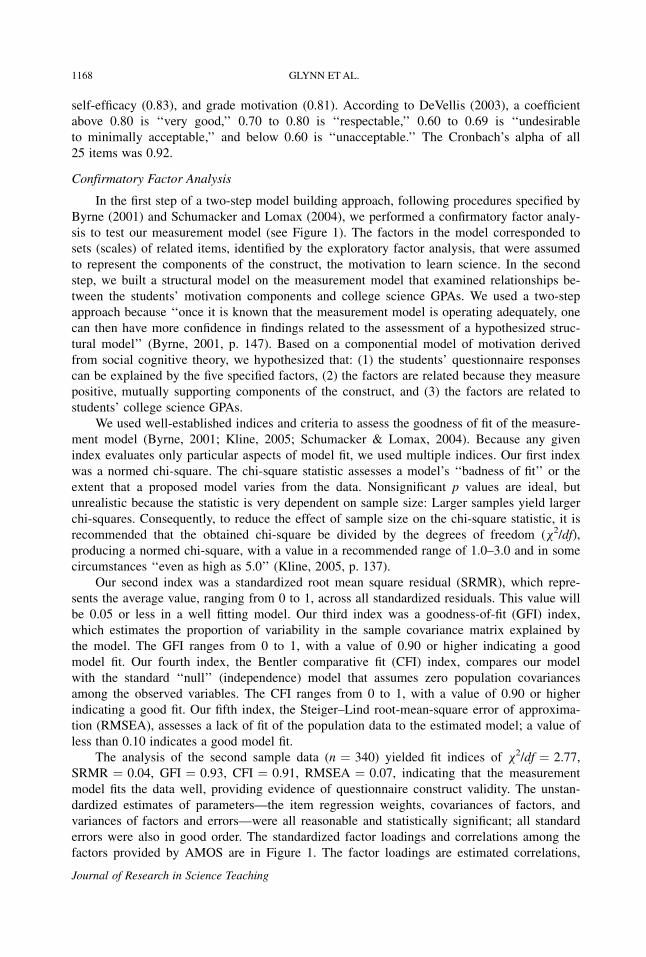
We used well-established indices and criteria to assess the goodness of fit of the measure-
ment model (Byrne, 2001; Kline, 2005; Schumacker & Lomax, 2004). Because any given
index evaluates only particular aspects of model fit, we used multiple indices. Our first index
was a normed chi-square. The chi-square statistic assesses a model’s ‘‘badness of fit’’ or the
extent that a proposed model varies from the data. Nonsignificant p values are ideal, but
unrealistic because the statistic is very dependent on sample size: Larger samples yield larger
chi-squares. Consequently, to reduce the effect of sample size on the chi-square statistic, it is
recommended that the obtained chi-square be divided by the degrees of freedom (x2/df),
producing a normed chi-square, with a value in a recommended range of 1.0–3.0 and in some
circumstances ‘‘even as high as 5.0’’ (Kline, 2005, p. 137).
Our second index was a standardized root mean square residual (SRMR), which repre-
sents the average value, ranging from 0 to 1, across all standardized residuals. This value will
be 0.05 or less in a well fitting model. Our third index was a goodness-of-fit (GFI) index,
which estimates the proportion of variability in the sample covariance matrix explained by
the model. The GFI ranges from 0 to 1, with a value of 0.90 or higher indicating a good
model fit. Our fourth index, the Bentler comparative fit (CFI) index, compares our model
with the standard ‘‘null’’ (independence) model that assumes zero population covariances
among the observed variables. The CFI ranges from 0 to 1, with a value of 0.90 or higher
indicating a good fit. Our fifth index, the Steiger–Lind root-mean-square error of approxima-
tion (RMSEA), assesses a lack of fit of the population data to the estimated model; a value of
less than 0.10 indicates a good model fit.
The analysis of the second sample data (n ¼ 340) yielded fit indices of x2/df ¼ 2.77,
SRMR ¼ 0.04, GFI ¼ 0.93, CFI ¼ 0.91, RMSEA ¼ 0.07, indicating that the measurement
model fits the data well, providing evidence of questionnaire construct validity. The unstan-
dardized estimates of parameters—the item regression weights, covariances of factors, and
variances of factors and errors—were all reasonable and statistically significant; all standard
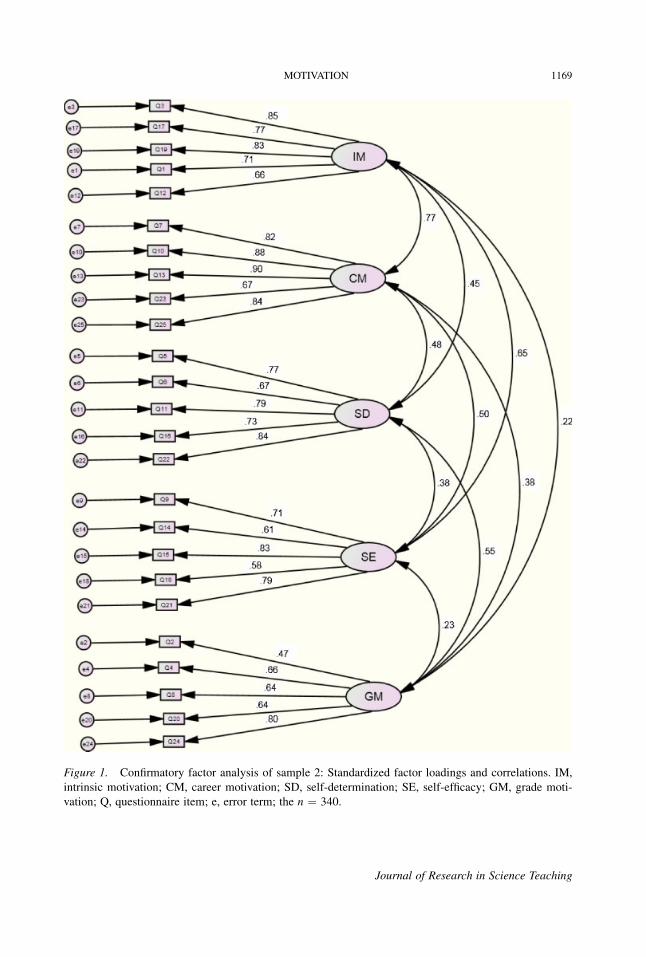
errors were also in good order. The standardized factor loadings and correlations among the
factors provided by AMOS are in Figure 1. The factor loadings are estimated correlations,
1168 GLYNN ETAL.
self-efficacy (0.83), and grade motivation (0.81). According to DeVellis (2003), a coefficient
above 0.80 is ‘‘very good,’’ 0.70 to 0.80 is ‘‘respectable,’’ 0.60 to 0.69 is ‘‘undesirable
to minimally acceptable,’’ and below 0.60 is ‘‘unacceptable.’’ The Cronbach’s alpha of all
25 items was 0.92.
Confirmatory Factor Analysis
In the first step of a two-step model building approach, following procedures specified by
Byrne (2001) and Schumacker and Lomax (2004), we performed a confirmatory factor analy-
sis to test our measurement model (see Figure 1). The factors in the model corresponded to
sets (scales) of related items, identified by the exploratory factor analysis, that were assumed
to represent the components of the construct, the motivation to learn science. In the second
step, we built a structural model on the measurement model that examined relationships be-
tween the students’ motivation components and college science GPAs. We used a two-step
approach because ‘‘once it is known that the measurement model is operating adequately, one
can then have more confidence in findings related to the assessment of a hypothesized struc-
tural model’’ (Byrne, 2001, p. 147). Based on a componential model of motivation derived
from social cognitive theory, we hypothesized that: (1) the students’ questionnaire responses
can be explained by the five specified factors, (2) the factors are related because they measure
Journal of Research in Science Teaching
MOTIVATION 1169
Figure 1. Confirmatory factor analysis of sample 2: Standardized factor loadings and correlations. IM,
intrinsic motivation; CM, career motivation; SD, self-determination; SE, self-efficacy; GM, grade moti-
vation; Q, questionnaire item; e, error term; the n ¼ 340.
Journal of Research in Science Teaching
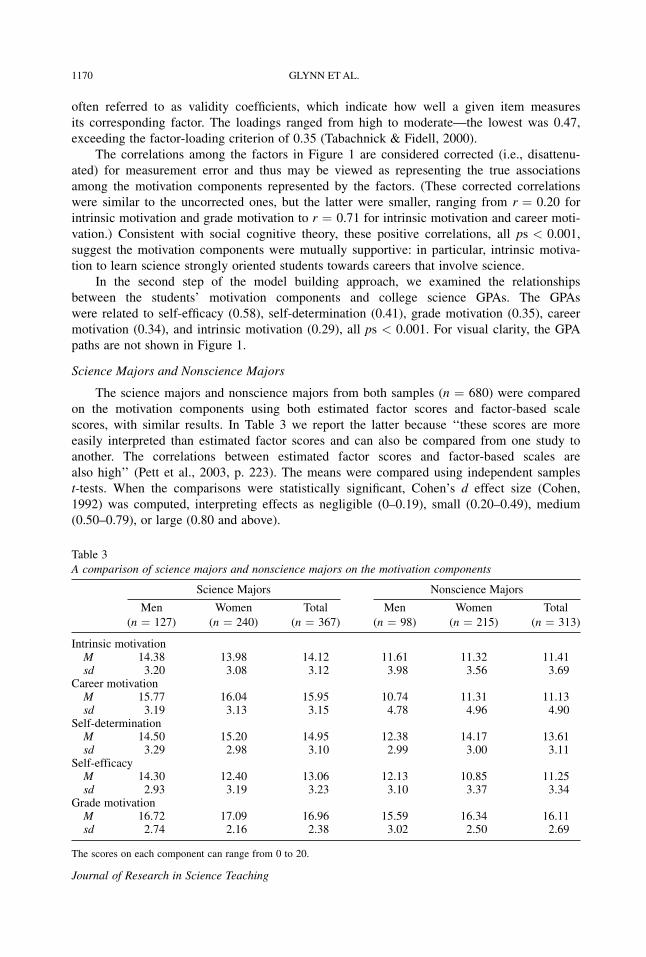
Table 3
A comparison of science majors and nonscience majors on the motivation components
Science Majors Nonscience Majors
Men
(n ¼ 127)
Women
(n ¼ 240)
Total
(n ¼ 367)
Men
(n ¼ 98)
Women
(n ¼ 215)
Total
(n ¼ 313)
Intrinsic motivationM 14.38sd 3.20
Career motivationM 15.77sd 3.19
Self-determinationM 14.50sd 3.29
Self-efficacyM 14.30sd 2.93
Grade motivationM 16.72sd 2.74
13.983.08
16.043.13
15.202.98
12.403.19
17.092.16
14.123.12
15.953.15
14.953.10
13.063.23
16.962.38
11.613.98
10.744.78
12.382.99
12.133.10
15.593.02
11.323.56
11.314.96
14.173.00
10.853.37
16.342.50
11.413.69
11.134.90
13.613.11
11.253.34
16.112.69
The scores on each component can range from 0 to 20.
1170 GLYNN ETAL.
often referred to as validity coefficients, which indicate how well a given item measures
its corresponding factor. The loadings ranged from high to moderate—the lowest was 0.47,
exceeding the factor-loading criterion of 0.35 (Tabachnick & Fidell, 2000).
The correlations among the factors in Figure 1 are considered corrected (i.e., disattenu-
ated) for measurement error and thus may be viewed as representing the true associations
among the motivation components represented by the factors. (These corrected correlations
were similar to the uncorrected ones, but the latter were smaller, ranging from r ¼ 0.20 for
intrinsic motivation and grade motivation to r ¼ 0.71 for intrinsic motivation and career moti-
vation.) Consistent with social cognitive theory, these positive correlations, all ps < 0.001,
suggest the motivation components were mutually supportive: in particular, intrinsic motiva-
tion to learn science strongly oriented students towards careers that involve science.
In the second step of the model building approach, we examined the relationships
between the students’ motivation components and college science GPAs. The GPAs
were related to self-efficacy (0.58), self-determination (0.41), grade motivation (0.35), career
motivation (0.34), and intrinsic motivation (0.29), all ps < 0.001. For visual clarity, the GPA
paths are not shown in Figure 1.
Science Majors and Nonscience Majors
The science majors and nonscience majors from both samples (n ¼ 680) were compared
on the motivation components using both estimated factor scores and factor-based scale
scores, with similar results. In Table 3 we report the latter because ‘‘these scores are more
easily interpreted than estimated factor scores and can also be compared from one study to
another. The correlations between estimated factor scores and factor-based scales are
also high’’ (Pett et al., 2003, p. 223). The means were compared using independent samples
t-tests. When the comparisons were statistically significant, Cohen’s d effect size (Cohen,
1992) was computed, interpreting effect
(0.50–0.79), or large (0.80 and above).
s as negligible (0–0.19), small (0.20–0.49), medium
Journal of Research in Science Teaching
student’s profile during a course or a series of courses. This profile—shared with the student
and explained—can serve as a blueprint for the student to build on areas of strength and
improve areas of relative weakness.
Components of Students’ Motivation to Learn Science
A componential model of motivation was implemented in the questionnaire by means of
scales assessing intrinsic motivation, self-determination, self-efficacy, career motivation, and
grade motivation. Exploratory and confirmatory factor analyses provided evidence supporting
the construct validity of these scales. The scales were positively related, consistent with the
view that the components were mutually supporting. In particular, intrinsic motivation and
career motivation were strongly related, suggesting that intrinsic motivation oriented students
to careers that involve science.
The scales were also related to students’ college science GPAs, providing evidence
of criterion-related validity. It is noteworthy that self-efficacy was the scale most related to
science GPAs. Self-efficacy affects achievement by predisposing students to work harder,
persist longer, and overcome barriers when pursuing academic goals (Britner, 2008). The
self-efficacy finding is consistent with the emphasis placed upon it in social cognitive theory:
Among the mechanisms of human agency, none is more central or pervasive than beliefs
of personal efficacy. Whatever other factors serve as guides and motivators, they are
rooted in the core belief that one has the power to produce desired effects; otherwise
one has little incentive to act or to persevere in the face of difficulties. (Bandura &
Locke, 2003, p. 87)
The scales were found to be useful in assessing the motivation of both science majors
and nonscience majors. The science majors scored higher than the nonscience majors on all
scales, providing additional evidence of construct validity. Among both science majors and
nonscience majors, men had higher self-efficacy than women, and women had higher self-
determination than men (see also Cavallo, Potter, & Rozman, 2004; Glynn et al., 2009). Self-
determination is manifested in a variety of ways: Not only do women have higher college
enrollment and completion than men, but women are more likely than men to engage in
MOTIVATION 1171
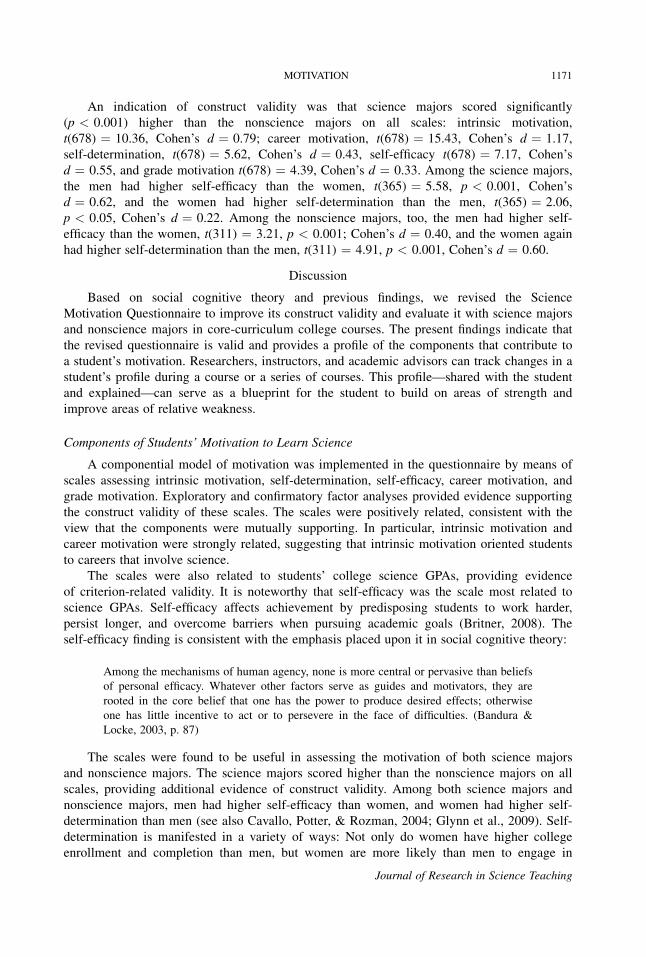
An indication of construct validity was that science majors scored significantly
(p < 0.001) higher than the nonscience majors on all scales: intrinsic motivation,
t(678) ¼ 10.36, Cohen’s d ¼ 0.79; career motivation, t(678) ¼ 15.43, Cohen’s d ¼ 1.17,
self-determination, t(678) ¼ 5.62, Cohen’s d ¼ 0.43, self-efficacy t(678) ¼ 7.17, Cohen’s
d ¼ 0.55, and grade motivation t(678) ¼ 4.39, Cohen’s d ¼ 0.33. Among the science majors,
the men had higher self-efficacy than the women, t(365) ¼ 5.58, p < 0.001, Cohen’s
d ¼ 0.62, and the women had higher self-determination than the men, t(365) ¼ 2.06,
p < 0.05, Cohen’s d ¼ 0.22. Among the nonscience majors, too, the men had higher self-
efficacy than the women, t(311) ¼ 3.21, p < 0.001; Cohen’s d ¼ 0.40, and the women again
had higher self-determination than the men, t(311) ¼ 4.91, p < 0.001, Cohen’s d ¼ 0.60.
Discussion
Based on social cognitive theory and previous findings, we revised the Science
Motivation Questionnaire to improve its construct validity and evaluate it with science majors
and nonscience majors in core-curriculum college courses. The present findings indicate that
the revised questionnaire is valid and provides a profile of the components that contribute to
a student’s motivation. Researchers, instructors, and academic advisors can track changes in a
Journal of Research in Science Teaching

(Bandura, 2006; Schunk, Pintrich, & Meece, 2008; Zimmerman, 2008). For this reason, the
instructor should explain the purpose of the questionnaire. The instructor should also help
students to understand their questionnaire scores and provide advisement sessions for low-
motivation students, emphasizing the importance of motivation and recommending strategies
(Slater, Prather, & Zeilik, 2006) to increase their motivation and science-learning behavior.
The questionnaire also can identify high-motivation students: This is important informa-
tion for an instructor who wishes to organize collaborative-learning groups of students and
ensure that each group includes at least some highly motivated students. The instructor can
request that these students act as group leaders, who encourage all students to engage fully in
the work of the group.
Academic advisors can administer the questionnaire to students before they begin their
core-curriculum science courses. The questionnaire can be one tool in a set of psychometric
tools that advisors use to help students monitor their motivation to learn science in their
courses and think about career possibilities. The questionnaire can be periodically adminis-
tered to both science majors and nonscience majors as they proceed through their program of
coursework to help assess changes in their motivation to learn science. Students with high
motivation are likely to achieve well in science courses. Students with low motivation run the
risk of underachieving and limiting their career options, since science plays an increasingly
important role in most careers.
When using the questionnaire, the students’ raw scores on each scale should be converted
to standard scores, establishing a derived scale consistent with the nature of the items.
Generally, standard scores provide more practical information for decision making than raw
scores (Osterlind, 2006). A commonly used standard score is the z-score: the units are located
(i.e., mean) at 0 with a scale (i.e., standard deviation) of 1. Percentiles can also be calculated,
t for
ind,
atent
in conjunction with norming, the process by which the scales are interpreted in contex
representative groups. The assumptions and limitations of CTT should also be kept in m
such as, ‘‘items are assumed to be roughly parallel indicators of the underlying l
variable’’ (DeVellis, 2003, p. 150) and ordinal scales are analyzed as if they are interval.
Journal of Research in Science Teaching
1172 GLYNN ETAL.
behavior such as attending class on time, sitting in the front of the class, taking notes,
studying the textbook, and studying in an organized way (Zusman, Knox, & Lieberman,
2005). Although not well understood, gender differences in the motivation to learn science
are attributed to socialization by parents, teachers, peers, media, and role modeling rather
than to ‘‘innate or natural differences’’ between women and men (Xie & Shauman, 2003,
p. 215).
Use of the Questionnaire in Research and Instruction
The findings suggest that the Science Motivation Questionnaire II is a good tool
that researchers, instructors, and academic advisors can use to efficiently assess students’
motivation to learn science in college courses. As a research tool, the questionnaire can be
used to examine relationships between students’ motivation and student characteristics such
as cultural background (Lee, 2001), teacher characteristics such as beliefs about science
(Lumpe, Haney, & Czerniak, 2000), and learning methods such as project-based learning
(Krajcik & Blumenfeld, 2006). The questionnaire can also be used with essays, interviews,
case studies, and other qualitative methods to provide comprehensive insight into students’
motivation to learn science (see Glynn et al., 2009).
As an instructional tool, the questionnaire can be administered at the beginning of a
course to assess students’ motivation to learn science. Students who are metacognitively
aware of their motivation are better equipped to self-regulate their science-learning behavior

were designed so that the word science in each item can be replaced with the word biology,
chemistry, or physics, creating a Biology Motivation Questionnaire, Chemistry Motivation
Questionnaire, or Physics Motivation Questionnaire, respectively (e.g., Taasoobshirazi &
Carr, 2009; Taasoobshirazi & Glynn, 2009). By this means it is possible to create discipline-
specific questionnaire versions for these and other science disciplines, but researchers should
examine each item to ensure it is representative of their target discipline and, when using any
version of the questionnaire, establish its validity.
Conclusion
The exponential growth of scientific knowledge is accompanied by the need to make
public-policy decisions about complex issues. In order to participate effectively in the deci-
sion-making process, it is essential that all students—science majors and nonscience
majors—become scientifically literate citizens. Science-education researchers, science instruc-
tors, and academic advisors can support students’ scientific literacy by fostering their motiva-
tion to learn science. This task requires a set of good assessment tools, one of which can
be the Science Motivation Questionnaire II: It is reliable, valid, and efficient. For science-
education researchers, this tool—used in conjunction with qualitative methods—can help
provide a comprehensive understanding of students’ motivation to learn science. For science
MOTIVATION 1173
Directions for Future Research
One direction for future research is continued improvement of the questionnaire because
‘‘construct validity is a never-ending, ongoing, complex process over a series of studies in a
number of different ways’’ (Pett et al., 2003, p. 239). If motivation items can be developed
based on specific tasks or behaviors in a hierarchy or progression, and IRT assumptions met,
then advantages can be gained, such as justified interval scales in logit units (Embretson &
Reise, 2000). There are many widely used tests of cognitive and physical capabilities based
on IRT that serve as exemplars for the construction of items in those domains. An analogous
body of motivation questionnaires based on IRT does not yet exist, so constructing good
items is a challenge, but the challenge provides a rich opportunity for future research. Boone
et al. (2011), Embretson and Reise (2000), Liu (2010), and Wilson (2005) provide guidance
for the development of questionnaire items based on IRT and the Rasch Model.
A second direction for future research is to use the questionnaire—in conjunction with
qualitative methods—to further examine the motivation of science majors. Because lack of
motivation has historically been a serious issue with many nonscience majors, more research
has been conducted with them than science majors. But science majors also merit research
attention to answer important questions. For example, more women than men earn degrees in
the life sciences, but fewer women than men earn degrees in the physical sciences (Ceci &
Williams, 2007). What role does motivation play in these differences? If the motivation to
learn physical sciences is less in women than in men, then how can it be nurtured in women?
A third direction for future research is to examine how students’ motivation changes
during their core-curriculum science courses. If nonscience majors begin college with low
motivation, to what extent can instructional methods foster their motivation? Longitudinal
studies are needed to address questions such as these and suggest how students’ motivation
can be fostered. Ideally, students will retain their motivation to learn science after their core-
curriculum courses are completed. One indicator of this will be students electing to enroll in
science courses that are not required by their programs.
A fourth direction for future research is to use discipline-specific versions of the ques-
tionnaire. The items of the revised questionnaire, like the items of the original questionnaire,
Journal of Research in Science Teaching
Cassady, J. C. (2001). Self-reported GPA and SAT: A methodological note. Practical Assessment,
Research & Evaluation, 7. Retrieved June 6, 2011 from http://PAREonline.net/getvn.asp?v¼7&n¼12.
Cavallo, A. M. L., Potter, W. H., & Rozman, M. (2004). Gender differences in learning constructs,
shifts in learning constructs, and their relationship to course achievement in a structured inquiry, year-
long college physics course for life science majors. School Science and Mathematics, 104, 288–300.
Ceci, S. J., & Williams, W. M. (2007). Why aren’t more women in science? Washington, DC:
American Psychological Association.
Cohen, J. (1992). A power primer. Psychological Bulletin, 112, 155–159.
DeVellis, R. F. (2003). Scale development: Theory and applications (2nd edn.). Thousand Oaks,
CA: Sage.
Druger, M. (2006). Experiential learning in a large introductory biology course. In J. J. Mintzes &
W. H. Leonard (Eds.), Handbook of college science teaching (pp. 37–43). Arlington, VA: National
Science Teachers Association Press.
Eccles, J. S., Simpkins, S. D., & Davis-Kean, P. E. (2006). Math and science motivation: A longitu-
dinal examination of the links between choices and beliefs. Developmental Psychology, 42, 70–83.
Eccles, J. S., & Wigfield, A. (2002). Motivational beliefs, values, and goals. Annual Review of
Psychology, 53, 109–132.
Embretson, S. E., & Reise, S. (2000). Item response theory for psychologists. Mahwah, NJ:
Erlbaum Publishers.
Journal of Research in Science Teaching
1174 GLYNN ETAL.
instructors and academic advisors, this tool—used in conjunction with individual and group
advisement sessions—can help nurture students’ motivation to learn science.
References
American Association of Colleges and Universities. (2011). Science and health. Retrieved June 6,
2011, from http://www.aacu.org/resources/sciencehealth/index.cfm.
American Educational Research Association, American Psychological Association, & National
Council on Measurement in Education. (1999). Standards for educational and psychological testing.
Washington, DC: American Educational Research Association.
Arbuckle, J. L. (2006). Amos 7.0 user’s guide. Chicago: SPSS.
Bandura, A. (1986). Social foundations of thought and action: A social cognitive theory.
Englewood Cliffs, NJ: Prentice-Hall.
Bandura, A. (2001). Social cognitive theory: An agentive perspective. Annual Review of
Psychology, 52, 1–26.
Bandura, A. (2006). Going global with social cognitive theory: From prospect to paydirt. In S. I.
Donaldson, D. E. Berger & K. Pezdek (Eds.), The rise of applied psychology: New frontiers and reward-
ing careers (pp. 53–70). Mahwah, NJ: Erlbaum.
Bandura, A., & Locke, E. (2003). Negative self-efficacy and goal effects revisited. Journal of
Applied Psychology, 88, 87–99.
Black, A. E., & Deci, E. L. (2000). The effects of instructors’ autonomy support and students’
autonomous motivation on learning organic chemistry: A self- determination theory perspective. Science
Education, 84, 740–756.
Boone, W. J., Townsend, J. S., & Staver, J. (2011). Using Rasch theory to guide the practice of
survey development and survey data analysis in science education and to inform science reform efforts:
An exemplar utilizing STEBI self-efficacy data. Science Education, 95, 258–280.
Bradburn, N. M., Sudman, S., & Wansink, B. (2004). Asking questions: The definitive guide to
questionnaire design—For market research, political polls, and social and health questionnaires. San
Francisco: John Wiley & Sons.
Britner, S. L. (2008). Motivation in high school science students: A comparison of gender differ-
ences in life, physical, and earth science classes. Journal of Research in Science Teaching, 45, 955–970.
Byrne, B. M. (2001). Structural equation modeling with AMOS: Basic concepts, applications, and
programming. Hillsdale, NJ: Erlbaum.
Lin, Y. G., McKeachie, W. J., & Kim, Y. C. (2003). College student intrinsic and/or extrinsic
motivation and learning. Learning and Individual Differences, 13, 251–258.
Liu, X. (2010). Using and developing measurement instruments in science education: A Rasch
modeling approach. Charlotte, NC: Information Age Publishing.
Lumpe, A. T., Haney, J. J., & Czerniak, C. M. (2000). Assessing teacher’s beliefs about their
science teaching context. Journal of Research in Science Teaching, 37, 275–292.
Marsden, J. (2006). Gender gap in majors persists. Yale Daily News. Retrieved June 6, 2011, from
http://www.yaledailynews.com/news/2006/apr/27/gender-gap-in-majors-persists/.
Mazlo, J., Dormedy, D. F., Neimoth-Anderson, J. D., Urlacher, T., Carson, G. A., & Kelter, P. B.
(2002). Assessment of motivational methods in the general chemistry laboratory. Journal of College
Science Teaching, 36, 318–321.
National Science Board. (2008). Science and engineering indicators 2008. Arlington, VA: National
Science Foundation.
National Science Foundation. (2002). Women, minorities, and persons with disabilities in science
and engineering 2002. Arlington, VA: National Science Foundation. Retrieved June 6, 2011 http://www.
nsf.gov/statistics/nsf03312/.
Organisation for Economic Cooperation and Development. (2007). Assessing scientific, reading and
mathematical literacy: A framework for PISA 2006. Retrieved June 6, 2011 from http://www.oecd.org/
dataoecd/63/35/37464175.pdf.
Osterlind, S. J. (2006). Modern measurement: Theory, principles, and applications of mental
appraisal. Upper Saddle, NJ: Pearson.
Pajares, F., & Schunk, D. H. (2001). Self-beliefs and school success: Self-efficacy, self- concept,
and school achievement. In R. Riding & S. Rayner (Eds.), BT self-perception (pp. 239–266). London:
Ablex Publishing.
Pett, M. A., Lackey, N. R., & Sullivan, J. J. (2003). Making sense of factor analysis: The use of
factor analysis for instrument development in health care research. London: Sage Publications.
MOTIVATION 1175
Fabrigar, L. R., Wegener, D. T., MacCallum, R. C., & Strahan, E. J. (1999). Evaluating the use of
exploratory factor analysis in psychological research. Psychological Methods, 4, 272–299.
Glynn, S. M., & Koballa, T. R. Jr. (2006). Motivation to learn college science. In J. J. Mintzes &
W. H. Leonard (Eds.), Handbook of college science teaching (pp. 25–32). Arlington, VA: National
Science Teachers Association Press.
Glynn, S. M., Taasoobshirazi, G., & Brickman, P. (2007). Nonscience majors learning science: A
theoretical model of motivation. Journal of Research in Science Teaching, 44, 1088–1107.
Glynn, S. M., Taasoobshirazi, G., & Brickman, P. (2009). Science Motivation Questionnaire:
Construct validation with nonscience majors. Journal of Research in Science Teaching, 46, 127–146.
Humphreys, D., & Davenport, A. (2005). What really matters in college: How students view and
value liberal education. Liberal Education, 91(3), 36–43.
Kline, R. B. (2005). Principles and practice of structural equation modeling. New York: Guilford
Press.
Koballa, T. R. Jr., & Glynn, S. M. (2007). Attitudinal and motivational constructs in science educa-
tion. In S. K. Abell & N. Lederman (Eds.), Handbook for research in science education (pp. 75–102).
Mahwah, NJ: Erlbaum.
Krajcik, J. S., & Blumenfeld, P. C. (2006). Project-based learning. In R. K. Sawyer (Ed.), The
Cambridge handbook of the learning sciences. New York: Cambridge.
Kuh, G. D. (2005). Imagine asking the client: Using student and alumni surveys for accountability
in higher education. In J. C. Burke (Ed.), Achieving accountability in higher education: Balancing pub-
lic, academic, and market demands (pp. 148–172). San Francisco: Jossey-Bass.
Lawson, A. E., Banks, D. L., & Logvin, M. (2007). Self-efficacy, reasoning ability, and achieve-
ment in college biology. Journal of Research in Science Teaching, 44, 706–724.
Lee, O. (2001). Culture and language in science education: What do we know and what do we
need to know? Journal of Research in Science Teaching, 38, 499–501.
Journal of Research in Science Teaching

1176 GLYNN ETAL.
Pintrich, P. R. (2003). A motivational science perspective on the role of student motivation in
f demograph-
on modeling.
edn.). Upper
ent in large
llege science
Washington,
r.cornell.edu/
ton: Allyn &
llege physics.
learning and teaching contexts. Journal of Educational Psychology, 95, 667–686.
Porter, S. R., & Whitcomb, M. E. (2005). Non-response in student surveys: The role o
ics, engagement and personality. Research in Higher Education, 46, 127–152.
Schumacker, R. E., & Lomax, R. G. (2004). A beginner’s guide to structural equati
Mahwah, New Jersey: Lawrence Erlbaum Associates, Inc.
Schunk, D. H., Pintrich, P. R., & Meece, J. L. (2008). Motivation in education (3rd
Saddle River, NJ: Pearson.
Slater, T. F., Prather, E. E., & Zeilik, M. (2006). Strategies for interactive engagem
lecture science survey classes. In J. J. Mintzes & W. H. Leonard (Eds.), Handbook of co
teaching (pp. 25–32). Arlington, VA: National Science Teachers Association Press.
SPSS, Inc. (2008). SPSS Base 17.0 user’s guide. Chicago, IL: SPSS, Inc.
Stine, D. D., & Matthews, C. M. (2009). The U.S. science and technology workforce.
DC: Congressional Research Service. Retrieved June 6, 2011 from http://digitalcommons.il
key_workplace/644.
Tabachnick, B. G., & Fidell, L. (2000). Using multivariate statistics (4th edn.). Bos
Bacon.
Taasoobshirazi, G., & Carr, M. (2009). A structural equation model of expertise in co
Journal of Educational Psychology, 101, 630–643.
Taasoobshirazi, G., & Glynn, S. M. (2009). College students solving chemistry problems: A theo-
retical model of expertise. Journal of Research in Science Teaching, 46, 1070–1089.
Toppo, G., DeBarros, A., (2007). Women feed the jump in college enrollment. USA Today.
Retrieved June 6, 2011, from http://www.navytimes.com/careers/college/military_women_college_
070910/.
Wilson, M. (2005). Constructing measures: An item response modeling approach. Mahwah, NJ:
Lawrence Erlbaum Associates.
Xie, Y., & Shauman, K. A. (2003). Women in science: Career processes and outcomes. Cambridge,
MA: Harvard University Press.
Zimmerman, B. J. (2008). Investigating self-regulation and motivation: Historical background,
methodological developments, and future prospects. American Educational Research Journal, 45, 166–
183.
Zusman, M., Knox, D., & Lieberman, M. (2005). Gender differences in reactions to college course
requirements or ‘‘why females are better students’’. College Student Journal, 39, 621–626.
Journal of Research in Science Teaching