scormarktm supply chain assessment by pwc prepared for client
TRANSCRIPT

www.pwc.com www.pwcbenchmarking.com
Sample Report
SCORmarkTM Supply Chain Assessment by PwC Prepared for Client
How well does your supply chain performance and practice stack up? Date

2 PwC’s SCORmarkTM Readout for Client
This report is exclusively for internal use by the recipient and should not be provided to in writing or otherwise to any other third party under any circumstances.
Sample Report
Outline
• Approach
- Overview of PwC’s Supply Chain Benchmarking Service
- Background, Objectives, and Scope
- Custom Comparison Population Characteristics
• Executive Summary of Results
• Benchmarking Results
- Detailed Results
◦ Quantitative Performance
◦ Complexity
◦ Qualitative Practices
- Value Proposition for Improvement
- Conclusions and Next Steps
• Appendix
- About PwC

3 PwC’s SCORmarkTM Readout for Client
This report is exclusively for internal use by the recipient and should not be provided to in writing or otherwise to any other third party under any circumstances.
Sample Report
Background, Objectives, and Scope of Assessment
Background:
• Client is a Premier Corporate affiliate of APICS/SCC; this affiliation allows Client to complete 3 benchmarks in a year
• Client engaged PwC to do SCORmark for one of its Business Units
Objectives:
• Measure supply chain performances against similarly structured supply chains to identify improvement opportunities and areas of competitive advantage
• Compare to other supply chains with a similar manufacturing strategy
• Help identify target metrics to continuously measure and provide associated performance levels to drive operational improvement efforts
• Provide potential financial opportunities associated with achieving superior levels of performance
Scope:
• Business Unit: TBD
• Market: TBD

4 PwC’s SCORmarkTM Readout for Client
This report is exclusively for internal use by the recipient and should not be provided to in writing or otherwise to any other third party under any circumstances.
Sample Report
PwC’s benchmarking methodology compares client data to Parity, Advantage and Superior performance
Benchmarking is used as a guide to get a fact-based assessment of the opportunities for improvement and the value from achieving these results:
• Understand a company’s position relative to population’s Parity, Advantage and Superior
• Parity indicates the 50th percentile of performance in the SCORmark database
• Advantage is the performance level halfway between Parity and Superior (i.e., 70th percentile).
• Superior indicates the 90th percentile of companies in the database.
• Provide a basis of comparison against similar supply chains
• Provide insight into potential opportunities for growth and improvement
• Establish performance targets

5 PwC’s SCORmarkTM Readout for Client
This report is exclusively for internal use by the recipient and should not be provided to in writing or otherwise to any other third party under any circumstances.
Sample Report
Baseline Population >2000 supply chains
Base Supply Chain Filter ~100 supply chains
Operations Filter ~25-50 supply chains
Business Model Filter ~20-30 supply chains
Final Client Filter ~15-20 supply chains
PwC’s PMG database of >2000 company supply chains enabled selection of comparison supply chains for this assessment
Reve
nu
e /
Sc
ale
of
Op
era
tio
ns
Dis
trib
uti
on
Dyn
am
ics
(V
olu
me, O
rder
Siz
e,
# o
f C
hannels
)
Pro
du
ct
Dyn
am
ics
(S
KU
’s,
Price)
Bu
sin
es
s M
od
el
Illu
str
ative I
ndustr
y G
roup
Why 15-20 supply chains? • Drive statistical significance
• Protect client confidentiality
Consumer
Products
Packaged
Goods
Home
Appliances
Industrial
Products
Others

6 PwC’s SCORmarkTM Readout for Client
This report is exclusively for internal use by the recipient and should not be provided to in writing or otherwise to any other third party under any circumstances.
Sample Report
This assessment’s benchmark population is comprised of supply chains from many comparable companies
Characteristic Population Average Client
Average Selling Price per unit of
volume sold
< = $10 - XX%
$10–$200 - XX%
$200–$500 - XX%
$500–$1K - XX%
> = $1K - XX%
< = $10 - XX%
$10–$200 - XX%
$200–$500 - XX%
$500–$1K - XX%
> = $1K - X%
Primary Manufacturing Strategy
(% of revenue)
XX% MTS, XX% CTO/MTO,
XX% ETO
XX% MTS, XX% CTO/MTO,
XX% ETO
Product Revenue $XXXM $XXXM
54%
22%
24%
Industry Group
Consumer Goods Applied MaterialsIndustrial Products
70%
7%
3%
20%
Geographic Scope
North America Latin AmericaEurope APAC
61% 13%
26%
Product Revenue
<$0.75 billion $0.75 to $1.5 billion >$1.5 billion
Peer Organizations Listed Here

7 PwC’s SCORmarkTM Readout for Client
This report is exclusively for internal use by the recipient and should not be provided to in writing or otherwise to any other third party under any circumstances.
Sample Report
Outline
• Approach
- Overview of PwC’s Supply Chain Benchmarking Service
- Background, Objectives, and Scope
- Custom Comparison Population Characteristics
• Executive Summary of Results
• Benchmarking Results
- Detailed Results
◦ Quantitative Performance
◦ Complexity
◦ Qualitative Practices
- Value Proposition for Improvement
- Conclusions and Next Steps
• Appendix
- About PwC

8 PwC’s SCORmarkTM Readout for Client
This report is exclusively for internal use by the recipient and should not be provided to in writing or otherwise to any other third party under any circumstances.
Sample Report
Executive Summary of Benchmark Results for Client
Attributes Key Observations Performance
Executive Summary of Benchmark Results
On-Track Major
Opportunity Potential
Improvement
9 PwC’s SCORmarkTM Readout for Client
This report is exclusively for internal use by the recipient and should not be provided to in writing or otherwise to any other third party under any circumstances.
Sample Report
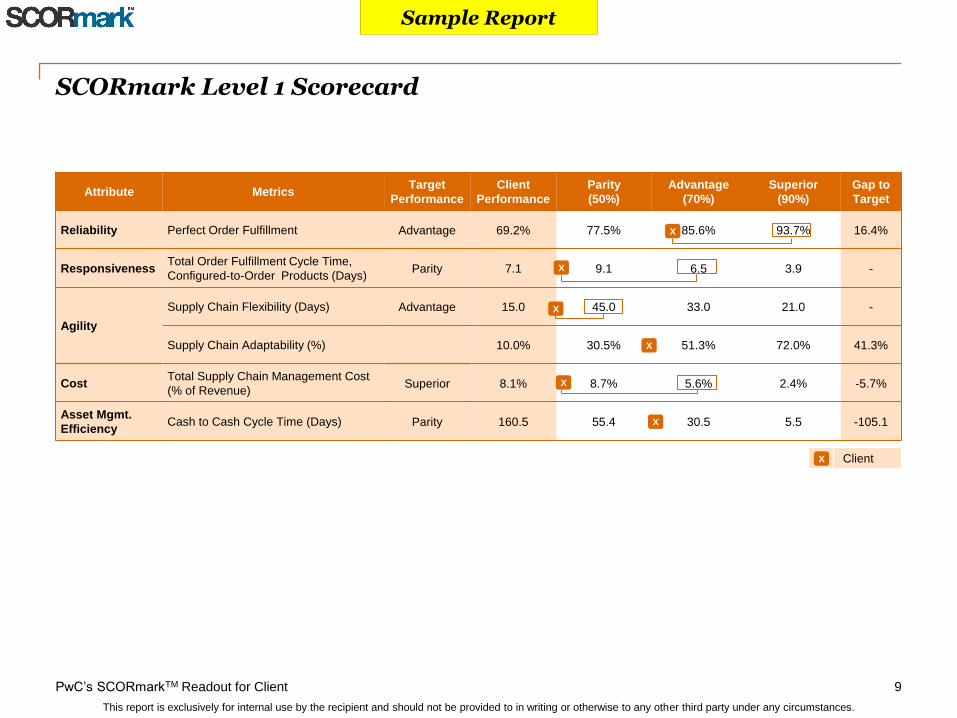
Attribute Metrics Target
Performance
Client
Performance
Parity
(50%)
Advantage
(70%)
Superior
(90%)
Gap to
Target
Reliability Perfect Order Fulfillment Advantage 69.2% 77.5% 85.6% 93.7% 16.4%
Responsiveness Total Order Fulfillment Cycle Time,
Configured-to-Order Products (Days) Parity 7.1 9.1 6.5 3.9 -
Agility
Supply Chain Flexibility (Days) Advantage 15.0 45.0 33.0 21.0 -
Supply Chain Adaptability (%) 10.0% 30.5% 51.3% 72.0% 41.3%
Cost Total Supply Chain Management Cost
(% of Revenue) Superior 8.1% 8.7% 5.6% 2.4% -5.7%
Asset Mgmt.
Efficiency Cash to Cash Cycle Time (Days) Parity 160.5 55.4 30.5 5.5 -105.1
SCORmark Level 1 Scorecard
Client X
X
X
X
X
X
X

10 PwC’s SCORmarkTM Readout for Client
This report is exclusively for internal use by the recipient and should not be provided to in writing or otherwise to any other third party under any circumstances.
Sample Report
Outline
• Approach
- Overview of PwC’s Supply Chain Benchmarking Service
- Background, Objectives, and Scope
- Custom Comparison Population Characteristics
• Executive Summary of Results
• Benchmarking Results
- Detailed Results
◦ Quantitative Performance
◦ Complexity
◦ Qualitative Practices
- Value Proposition for Improvement
- Conclusions and Next Steps
• Appendix
- About PwC

11 PwC’s SCORmarkTM Readout for Client
This report is exclusively for internal use by the recipient and should not be provided to in writing or otherwise to any other third party under any circumstances.
Sample Report
Perfect Order Fulfillment & Delivery Performance
Attribute: Reliability
90%
80%
70%
60%
50%
Client Superior
85%
Advantage
80%
Parity
75%
80%
Performance vs. Request Date
80%
70%
90%
100%
60%
50%
98%
Advantage
95%
Parity
90%
Superior
95%
Client
Performance vs. Commit Date
100%
80%
70%
50%
60%
90%
Client
95%
Superior
98%
Advantage
95%
Parity
90%
Perfect Order Fulfillment

12 PwC’s SCORmarkTM Readout for Client
This report is exclusively for internal use by the recipient and should not be provided to in writing or otherwise to any other third party under any circumstances.
Sample Report
Order Fulfillment Cycle Time (OFCT), Days Configured Products
Note: A benchmark of “0” implies that a) the OFCT component is irrelevant to population companies (e.g. installation is not
applicable), or b) the OFCT component is highly automated/handled electronically.
Cycle Time (Days) Parity Advantage Superior Client
Customer Signature/Authorization to Order Receipt 0.0 0.0 0.0 1.0
Order Receipt to Order Entry Complete 0.5 0.3 0.0 2.0
Order Entry Complete to Start Pick/Pack of Order 0.6 0.3 0.0 3.0
Start Pick/Pack of Order to Order Ready-to-Ship 1.0 0.6 0.3 10.0
Order Ready-to-Ship to Customer Receipt of Order 3.1 1.9 0.6 1.0
Customer Receipt of Order to Installation Complete 0.0 0.0 0.0 0.0
Total Order Fulfillment Cycle Time 20.0 15.0 10.0 17.0
Worse than Parity Close to/Better than Parity Among Superior
Attribute: Responsiveness
17.0
10.0
15.0
20.0
0
10
20
30
Advantage Parity Client Superior
Configured Product OFCT (Days)

13 PwC’s SCORmarkTM Readout for Client
This report is exclusively for internal use by the recipient and should not be provided to in writing or otherwise to any other third party under any circumstances.
Sample Report
Supply Chain Flexibility
Attribute: Agility
Flexibility: number of days required to achieve an unplanned sustainable 20% increase
20.0
30.0
40.040
20
0
Client
37.0
Superior Advantage Parity
Source Flexibility (Days)
20.0
5.0
15.0
25.0
40
20
0
Client Superior Advantage Parity
Make Flexibility (Days)
12.0
1.0
5.0
10.0
0
20
40
Client Superior Advantage Parity
Deliver Flexibility (Days)

14 PwC’s SCORmarkTM Readout for Client
This report is exclusively for internal use by the recipient and should not be provided to in writing or otherwise to any other third party under any circumstances.
Sample Report
Adaptability: maximum sustainable percentage increase that can be achieved in 30 days
Supply Chain Adaptability
Attribute: Agility
30%
40%
0%
50%
10%
20%
Superior
30%
Advantage
20%
Parity
15%
Client
20%
Source Adaptability (%)
10%
0%
50%
20%
30%
40%
Client
25%
Superior
40%
Advantage
30%
Parity
20%
Make Adaptability (%)
20%
30%
40%
0%
10%
50%
Superior
50%
Advantage
40%
Parity
30%
Client
40%
Deliver Adaptability (%)

15 PwC’s SCORmarkTM Readout for Client
This report is exclusively for internal use by the recipient and should not be provided to in writing or otherwise to any other third party under any circumstances.
Sample Report
Total Supply Chain Management Cost as % of Revenue Summary
Attribute: Cost
% of Revenue Parity Advantage Superior Client
Order Management Cost 2.5% 1.9% 1.3% 1.4%
Material Acquisition Cost 1.1% 0.6% 0.0% 2.4%
Inventory Carrying Cost 3.5% 2.1% 0.6% 4.0%
Supply-Chain-Related Finance and Planning Cost 0.3% 0.2% 0.0% 1.2%
Supply-Chain-Related IT Cost 0.2% 0.1% 0.1% 1.0%
Total Supply-Chain Management Cost 8.0% 5.0% 3.0% 10.0%
15%
10%
0%
5%
Client
10.00%
Superior
3.00%
Advantage
5.00%
Parity
8.00%
Total Supply Chain Cost (% Revenue)
Worse than Parity Close to/Better than Parity Among Superior

16 PwC’s SCORmarkTM Readout for Client
This report is exclusively for internal use by the recipient and should not be provided to in writing or otherwise to any other third party under any circumstances.
Sample Report
% of Revenue Parity Advantage Superior Client
New Product Release, Phase In, and Maintenance XX% XX% XX% XX%
Create Customer Order XX% XX% XX% XX%
Order Entry and Maintenance XX% XX% XX% XX%
Contract, Program & Channel Maintenance XX% XX% XX% XX%
Installing Planning XX% XX% XX% XX%
Order Fulfillment XX% XX% XX% XX%
Distribution XX% XX% XX% XX%
Transportation, Outbound Freight and Duties XX% XX% XX% XX%
Installation XX% XX% XX% XX%
Customer Invoicing/Accounting XX% XX% XX% XX%
Total Supply Chain Management Cost as % of Revenue Order Management Cost
Worse than Parity Close to/Better than Parity Among Superior
Attribute: Cost
15%
10%
5%
0%
Client
10.00%
4.00%
Superior
3.00%
1.50%
Advantage
5.00%
2.00%
Parity
8.00%
3.00%
Total Supply Chain Cost (% Revenue) vs. Order Management Cost

17 PwC’s SCORmarkTM Readout for Client
This report is exclusively for internal use by the recipient and should not be provided to in writing or otherwise to any other third party under any circumstances.
Sample Report
Total Supply Chain Management Cost as % of Revenue Material Acquisition Cost
Attribute: Cost
% of Revenue Parity Advantage Superior Client
Materials (Commodity) Management and Planning XX% XX% XX% XX%
Supplier Quality Engineering XX% XX% XX% XX%
Inbound Freight and Duties XX% XX% XX% XX%
Receiving XX% XX% XX% XX%
Incoming Inspection XX% XX% XX% XX%
Component Engineering XX% XX% XX% XX%
Tooling XX% XX% XX% XX%
5%
10%
0%
15%
Client
10.00%
2.00%
Superior
3.00%
0.20%
Advantage
5.00%
0.50%
Parity
8.00%
2.00%
Total Supply Chain Cost (% Revenue) vs. Material Acquisition Cost
Worse than Parity Close to/Better than Parity Among Superior

18 PwC’s SCORmarkTM Readout for Client
This report is exclusively for internal use by the recipient and should not be provided to in writing or otherwise to any other third party under any circumstances.
Sample Report
Total Supply Chain Management Cost as % of Revenue Inventory Carrying Cost
Attribute: Cost
% of Revenue Parity Advantage Superior Client
Opportunity Cost XX% XX% XX% XX%
Shrinkage XX% XX% XX% XX%
Insurance and Taxes XX% XX% XX% XX%
Total Obsolescence for Raw Material, WIP and Finished
Goods XX% XX% XX% XX%
Channel Obsolescence XX% XX% XX% XX%
Field Service Parts Obsolescence XX% XX% XX% XX%
10%
0%
5%
15%
Client
10.00%
2.00%
Superior
3.00%
0.10%
Advantage
5.00%
0.70%
Parity
8.00%
1.00%
Total Supply Chain Cost (% Revenue) vs. Inventory Carrying Cost
Worse than Parity Close to/Better than Parity Among Superior

19 PwC’s SCORmarkTM Readout for Client
This report is exclusively for internal use by the recipient and should not be provided to in writing or otherwise to any other third party under any circumstances.
Sample Report
Total Supply Chain Management Cost as % of Revenue Supply Chain-Related Finance and Planning Cost
Attribute: Cost
% of Revenue Parity Advantage Superior Client
Supply-Chain Finance Cost XX% XX% XX% XX%
Demand/Supply Planning Cost XX% XX% XX% XX%
10%
0%
5%
15%
Client
10.00%
1.00%
Superior
3.00%
0.10%
Advantage
5.00%
0.70%
Parity
8.00%
1.00%
Total Supply Chain Cost (% Revenue) vs. Finance & Planning Cost
Worse than Parity Close to/Better than Parity Among Superior

20 PwC’s SCORmarkTM Readout for Client
This report is exclusively for internal use by the recipient and should not be provided to in writing or otherwise to any other third party under any circumstances.
Sample Report
Total Supply Chain Management Cost as % of Revenue Supply Chain Related IT Cost
Attribute: Cost
% of Revenue Parity Advantage Superior Client
Plan XX% XX% XX% XX%
Source XX% XX% XX% XX%
Make XX% XX% XX% XX%
Deliver XX% XX% XX% XX%
15%
5%
10%
0%
Client
10.00%
1.00%
Superior
3.00%
0.10%
Advantage
5.00%
0.70%
Parity
8.00%
1.00%
Total Supply Chain Cost (% Revenue) vs. Supply Chain IT Cost
Worse than Parity Close to/Better than Parity Among Superior

21 PwC’s SCORmarkTM Readout for Client
This report is exclusively for internal use by the recipient and should not be provided to in writing or otherwise to any other third party under any circumstances.
Sample Report
Cash-to-Cash Cycle Time
Attribute: Asset Management Efficiency
42.0
25.0
40.0
30.0
0
20
40
60
80
Client Superior Advantage Parity
Days Sales Outstanding
60.0
45.0
0
20
40
60
80
Client
55.0
Superior Advantage
55.0
Parity
Average Payment Period
20.0
30.0
40.0
0
20
40
60
80
Client
35.0
Superior Advantage Parity
Inventory Days of Supply
10.0
30.0
45.0
0
20
40
60
80
Client
35.0
Superior Advantage Parity
Cash to Cash Cycle Time

22 PwC’s SCORmarkTM Readout for Client
This report is exclusively for internal use by the recipient and should not be provided to in writing or otherwise to any other third party under any circumstances.
Sample Report
Inventory Management
Metric Parity Advantage Superior Client
Total Inventory Days of Supply 40.0 30.0 20.0 35.0
Raw Material Days of Supply 1.3 1.3 ND 19.0
WIP Days of Supply 0.0 0.0 ND 1.7
Finished Goods Days of Supply 56.1 56.1 ND 6.8
Inventory Turns 5.0 8.4 11.8 2.3
Inventory Days of Supply Breakdown
Attribute: Asset Management Efficiency
Worse than Parity Close to/Better than Parity Among Superior

23 PwC’s SCORmarkTM Readout for Client
This report is exclusively for internal use by the recipient and should not be provided to in writing or otherwise to any other third party under any circumstances.
Sample Report
Forecast Accuracy
Plan: Forecast Accuracy
90.0%
80.0%
90.0%
40%
60%
80%
100%
Client Superior
95.0%
Advantage Parity
Unit Forecast Accuracy
90.0%90.0%
85.0%
40%
60%
80%
100%
Client Superior
95.0%
Advantage Parity
Dollar Forecast Accuracy

24 PwC’s SCORmarkTM Readout for Client
This report is exclusively for internal use by the recipient and should not be provided to in writing or otherwise to any other third party under any circumstances.
Sample Report
Outline
• Approach
- Overview of PwC’s Supply Chain Benchmarking Service
- Background, Objectives, and Scope
- Custom Comparison Population Characteristics
• Executive Summary of Results
• Benchmarking Results
- Detailed Results
◦ Quantitative Performance
◦ Complexity
◦ Qualitative Practices
- Value Proposition for Improvement
- Conclusions and Next Steps
• Appendix
- About PwC

25 PwC’s SCORmarkTM Readout for Client
This report is exclusively for internal use by the recipient and should not be provided to in writing or otherwise to any other third party under any circumstances.
Sample Report
Supply Chain complexity
Complexity is assessed along multiple dimensions
• High levels of supply chain complexity, left unmanaged, reduce operational performance and lead to higher costs
- Complexity-driven costs are often hard to identify, making it difficult to address
Supply Chain Complexity
Configuration and Structure Processes and Systems Products and Services
Physical product flow
– Number of manufacturing plants
– Number of distribution centers
– Number of customer locations
Processes and systems in place to manage complexity, for example:
– Sales and operations planning
– New product introduction
– Postponement and configuration strategy
Number of SKUs offered
Number of annual product introductions
Complexity

26 PwC’s SCORmarkTM Readout for Client
This report is exclusively for internal use by the recipient and should not be provided to in writing or otherwise to any other third party under any circumstances.
Sample Report
Product Portfolio Complexity
Metric 0%-20%
Very Low
20%-40%
Low
40%-60%
Median
60%-80%
High
80%-100%
Very High Client
Number of Finished Product Item Codes (SKUs) 900 20,000 200,000 XX
Number of finished product Item codes purchased
in a finished good state from a co-manufacturer or
other 3rd party
0 1,000 10,000 XX
New Product Introductions 5 500 30,000 XX
End of Life products retired during the year 2 1,000 15,000 XX
Complexity
X
Client X
X
X
X
27 PwC’s SCORmarkTM Readout for Client
This report is exclusively for internal use by the recipient and should not be provided to in writing or otherwise to any other third party under any circumstances.
Sample Report
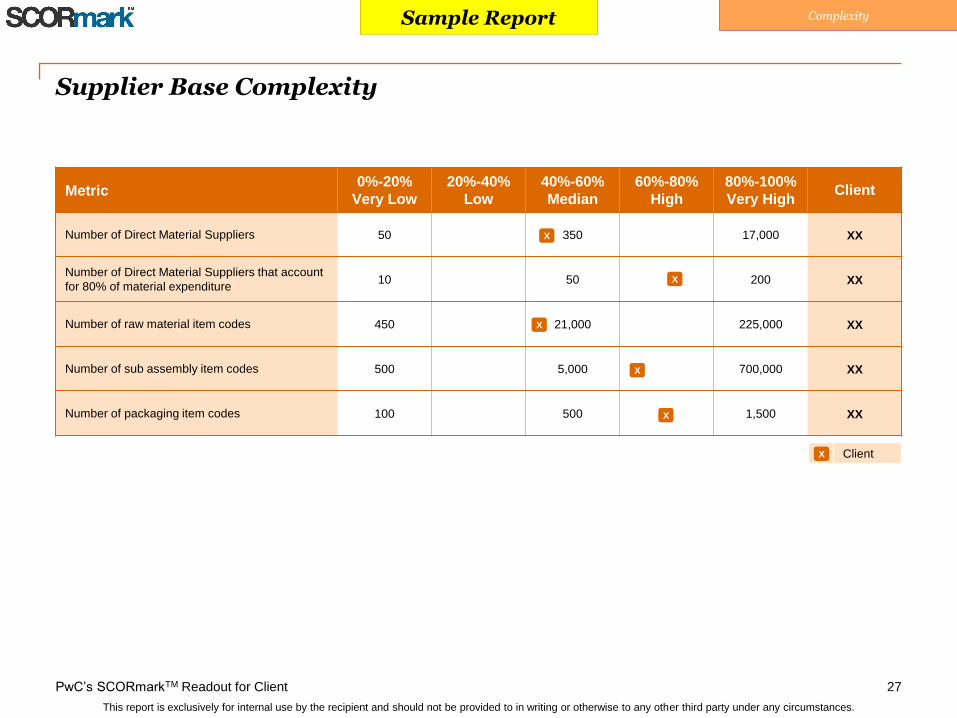
Supplier Base Complexity
Metric 0%-20%
Very Low
20%-40%
Low
40%-60%
Median
60%-80%
High
80%-100%
Very High Client
Number of Direct Material Suppliers 50 350 17,000 XX
Number of Direct Material Suppliers that account
for 80% of material expenditure 10 50 200 XX
Number of raw material item codes 450 21,000 225,000 XX
Number of sub assembly item codes 500 5,000 700,000 XX
Number of packaging item codes 100 500 1,500 XX
Complexity
X
Client X
X
X
X
X

28 PwC’s SCORmarkTM Readout for Client
This report is exclusively for internal use by the recipient and should not be provided to in writing or otherwise to any other third party under any circumstances.
Sample Report
Customer Base Complexity
Metric 0%-20%
Very Low
20%-40%
Low
40%-60%
Median
60%-80%
High
80%-100%
Very High Client
Number of active customers 80 8,000 140,000 XX
Number of active customers that account for 80%
of Total Product Revenue 15 2,000 75,000 XX
Number of orders received 50,000 200,000 500,000 XX
Number of locations performing order entry and
management 2 10 200 XX
Complexity
X
Client K
X
X
X

29 PwC’s SCORmarkTM Readout for Client
This report is exclusively for internal use by the recipient and should not be provided to in writing or otherwise to any other third party under any circumstances.
Sample Report
Metric 0%-20%
Very Low
20%-40%
Low
40%-60%
Median
60%-80%
High
80%-100%
Very High Client
Number of manufacturing locations 5 15 150 XX
Number of manufacturing locations company
owned 1 10 75 XX
Number of manufacturing locations
outsourced 1 5 70 XX
Manufacturing Complexity
Complexity
Client X
X
X
X

30 PwC’s SCORmarkTM Readout for Client
This report is exclusively for internal use by the recipient and should not be provided to in writing or otherwise to any other third party under any circumstances.
Sample Report
Distribution and IT Complexity
Metric 0%-20%
Very Low
20%-40%
Low
40%-60%
Median
60%-80%
High
80%-100%
Very High Client
Number of shipments/delivery notes 50,000 100,000 350,000 XX
Number of ship to locations 307 20,000 150,000 XX
Number of ship from locations 5 20 30 XX
Number of distribution centers 0 8 15 XX
Number of logistics/transportation suppliers 7 15 120 XX
Metric 0%-20%
Very Low
20%-40%
Low
40%-60%
Median
60%-80%
High
80%-100%
Very High Client
Number of unique systems/applications 3 15 300 XX
Complexity
X
X
X
Client X
Client X
X
X
X

31 PwC’s SCORmarkTM Readout for Client
This report is exclusively for internal use by the recipient and should not be provided to in writing or otherwise to any other third party under any circumstances.
Sample Report
Outline
• Approach
- Overview of PwC’s Supply Chain Benchmarking Service
- Background, Objectives, and Scope
- Custom Comparison Population Characteristics
• Executive Summary of Results
• Benchmarking Results
- Detailed Results
◦ Quantitative Performance
◦ Complexity
◦ Qualitative Practices
- Value Proposition for Improvement
- Conclusions and Next Steps
• Appendix
- About PwC

32 PwC’s SCORmarkTM Readout for Client
This report is exclusively for internal use by the recipient and should not be provided to in writing or otherwise to any other third party under any circumstances.
Sample Report
Overview of PwC’s Qualitative Practices Methodology
The qualitative practice assessment framework evaluates how well the organization is integrating processes and information systems across the supply chain
Transitional Supply Chains Mature Supply Chains
Stage 4: Differentiated
Stage 3: Advanced
Stage 2: Emerging
Stage 1: Basic
• Discrete supply chain processes and data flows well documented and understood
• Resources managed at department level and performance measured at functional level
• Company-wide process and data model continuously measured at the company, process, and diagnostic levels
• Resources managed at both functional and cross-functional levels
• Strategic partners throughout the global supply chain collaborate to:
- Identify joint business objectives and action plans
- Enforce common processes and data sharing
- Define, monitor, and react to performance metrics
• IT and eBusiness solutions enable a collaborative supply chain strategy that:
- Aligns participating companies’ business objectives and associated processes
- Results in real-time planning, decision- making, and execution of supply chain responses to customer requirements

33
This report is exclusively for internal use by the recipient and should not be provided to in writing or otherwise to any other third party under any circumstances.
Stage 1 Stage 2 Stage 3 Stage 4
STRATEGY
PLAN
SOURCE
MAKE
DELIVER
RETURN
Client Self Assessed Practices Level 1 Scorecard - Overall Supply Chain Practice Maturity
= Client
= Industry Average
Practice Assessment
34
This report is exclusively for internal use by the recipient and should not be provided to in writing or otherwise to any other third party under any circumstances.
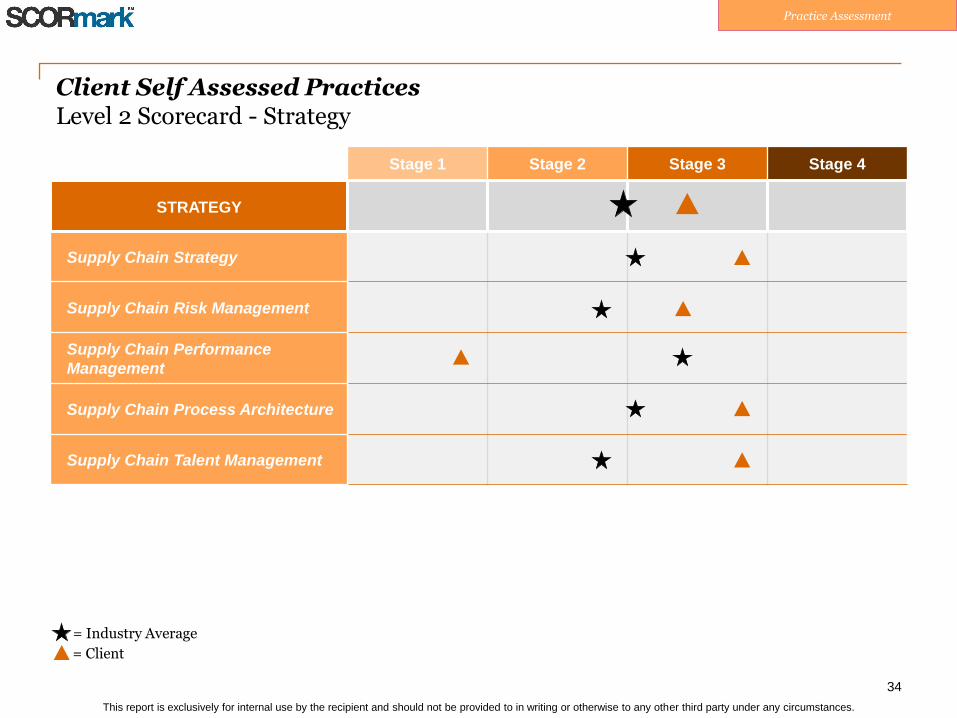
Stage 1 Stage 2 Stage 3 Stage 4
STRATEGY
Supply Chain Strategy
Supply Chain Risk Management
Supply Chain Performance
Management
Supply Chain Process Architecture
Supply Chain Talent Management
Client Self Assessed Practices Level 2 Scorecard - Strategy
= Client
= Industry Average
Practice Assessment

35
This report is exclusively for internal use by the recipient and should not be provided to in writing or otherwise to any other third party under any circumstances.
Stage 1 Stage 2 Stage 3 Stage 4
PLAN
Sales, Inventory, & Operations
Planning (SIOP)
Demand Planning
Supply Planning
Inventory Management
Client Self Assessed Practices Level 2 Scorecard - Plan
= Client
= Industry Average
Practice Assessment

36
This report is exclusively for internal use by the recipient and should not be provided to in writing or otherwise to any other third party under any circumstances.
Stage 1 Stage 2 Stage 3 Stage 4
SOURCE
Procurement Positioning
Sourcing Processes
Order Processing
P2P Systems
Spend Data
Procurement Organization Structure
Procurement and Benefits
Management
Supply Risk Management
Client Self Assessed Practices Level 2 Scorecard - Source
= Client
= Industry Average
Practice Assessment

37
This report is exclusively for internal use by the recipient and should not be provided to in writing or otherwise to any other third party under any circumstances.
Stage 1 Stage 2 Stage 3 Stage 4
MAKE
Product Planning and Management
Maintenance Management
Production Quality Management
Manufacturing Strategy
Material Issue, Move & Tracking
Client Self Assessed Practices Level 2 Scorecard - Make
= Client
= Industry Average
Practice Assessment

38
This report is exclusively for internal use by the recipient and should not be provided to in writing or otherwise to any other third party under any circumstances.
Stage 1 Stage 2 Stage 3 Stage 4
DELIVER
Warehouse
Transportation
Network Design
Order Entry & Scheduling
Invoicing & Cash Collection
Client Self Assessed Practices Level 2 Scorecard - Deliver
= Client
= Industry Average
Practice Assessment

39
This report is exclusively for internal use by the recipient and should not be provided to in writing or otherwise to any other third party under any circumstances.
Stage 1 Stage 2 Stage 3 Stage 4
RETURN
Service Parts Planning
Reverse Logistics
Warranty & Repair
Field Services Operations
Client Self Assessed Practices Level 2 Scorecard - Return
= Client
= Industry Average
Practice Assessment

40 PwC’s SCORmarkTM Readout for Client
This report is exclusively for internal use by the recipient and should not be provided to in writing or otherwise to any other third party under any circumstances.
Sample Report
Outline
• Approach
- Overview of PwC’s Supply Chain Benchmarking Service
- Background, Objectives, and Scope
- Custom Comparison Population Characteristics
• Executive Summary of Results
• Benchmarking Results
- Detailed Results
◦ Quantitative Performance
◦ Complexity
◦ Qualitative Practices
- Value Proposition for Improvement
- Conclusions and Next Steps
• Appendix
- About PwC
41 PwC’s SCORmarkTM Readout for Client
This report is exclusively for internal use by the recipient and should not be provided to in writing or otherwise to any other third party under any circumstances.
Sample Report
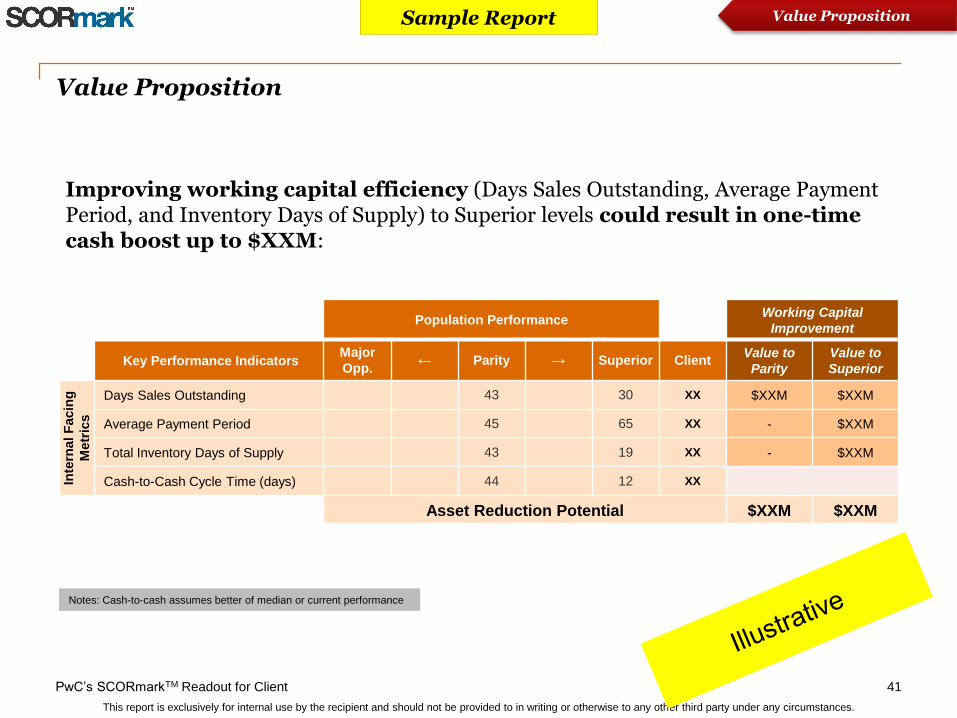
Population Performance Working Capital
Improvement
Key Performance Indicators Major
Opp. ← Parity → Superior Client
Value to
Parity
Value to
Superior
Inte
rnal F
acin
g
Metr
ics
Days Sales Outstanding 43 30 XX $XXM $XXM
Average Payment Period 45 65 XX - $XXM
Total Inventory Days of Supply 43 19 XX - $XXM
Cash-to-Cash Cycle Time (days) 44 12 XX
Asset Reduction Potential $XXM $XXM
Improving working capital efficiency (Days Sales Outstanding, Average Payment Period, and Inventory Days of Supply) to Superior levels could result in one-time cash boost up to $XXM:
Value Proposition
Value Proposition
Notes: Cash-to-cash assumes better of median or current performance

42 PwC’s SCORmarkTM Readout for Client
This report is exclusively for internal use by the recipient and should not be provided to in writing or otherwise to any other third party under any circumstances.
Sample Report
Outline
• Approach
- Overview of PwC’s Supply Chain Benchmarking Service
- Background, Objectives, and Scope
- Custom Comparison Population Characteristics
• Executive Summary of Results
• Benchmarking Results
- Detailed Results
◦ Quantitative Performance
◦ Complexity
◦ Qualitative Practices
- Value Proposition for Improvement
- Conclusions and Next Steps
• Appendix
- About PwC

43 PwC’s SCORmarkTM Readout for Client
This report is exclusively for internal use by the recipient and should not be provided to in writing or otherwise to any other third party under any circumstances.
Sample Report
Conclusions and Next Steps
44 PwC’s SCORmarkTM Readout for Client
This report is exclusively for internal use by the recipient and should not be provided to in writing or otherwise to any other third party under any circumstances.
Sample Report
Outline
• Approach
- Overview of PwC’s Supply Chain Benchmarking Service
- Background, Objectives, and Scope
- Custom Comparison Population Characteristics
• Executive Summary of Results
• Benchmarking Results
- Detailed Results
◦ Quantitative Performance
◦ Complexity
◦ Qualitative Practices
- Value Proposition for Improvement
- Conclusions and Next Steps
• Appendix
- About PwC

45 PwC’s SCORmarkTM Readout for Client
This report is exclusively for internal use by the recipient and should not be provided to in writing or otherwise to any other third party under any circumstances.
Sample Report
Benchmarking is a powerful tool, because “you can’t manage what you don’t measure”; it is an early step in operations improvement
High-Level Benchmarking Process High-Level Benchmarking Benefits
• Compare company performance internally and externally to understand areas of strengths and weaknesses
• Use standard metrics and compare company practices vs. best practices
Benchmark Current
Performance
Perform Gap Analysis
Review and Set Performance
Objectives
Identify Improvement
Initiatives
Execute Improvement
Initiatives
Measure Results
Provide a common language
• Leverage defined metrics for comparison
• Leverage standard calculations • Leverage standard frameworks
for analysis
Understand current performance
• Compare to relevant external benchmark comparison group
• Compare to median and best-in-class
• Compare performance internally between business units
Identify and quantify opportunities
• Establish performance targets • Establish, prioritize initiatives to
achieve targets

46 PwC’s SCORmarkTM Readout for Client
This report is exclusively for internal use by the recipient and should not be provided to in writing or otherwise to any other third party under any circumstances.
Sample Report
A Logical Next Step Is To Prioritize Improvements and Take Action!
PwC is available to help Client continue its supply chain improvement efforts. We are:
Objective and factual
• Supports senior management to make key decisions
• Acts as a “blind trust” manager where information can not be shared
Focused on the value proposition
• Keeps all decisions focused on highest value creation in shortest time frame
• Works across functions and processes where organizations have limits
Experienced in managing the process
• Provides expertise in critical path management: Internal staff do not have a learning curve
• Understands human dimension of change
Committed to knowledge transfer
• Ensures “leave behind” process
• Migrates from “player/coach” to “coach/cheerleader”: Positions owners to be successful
We welcome the opportunity for further conversations with Client
about improvement projects as well as engaging with other divisions
who might also be interested in benchmarking

47 PwC’s SCORmarkTM Readout for Client
This report is exclusively for internal use by the recipient and should not be provided to in writing or otherwise to any other third party under any circumstances.
Sample Report
PwC continues to earn top recognition from clients, industry analysts, and competitors
We have an unparalleled combination of global scale and functional expertise
180,000 professionals worldwide
157 countries and 776 locations
Broad client base across Fortune 1000
Works with Private and Public Companies
Fortune Global 500 are PwC clients
85%
Global Business Consulting firm IDC & Kennedy Information
No. 1
Product and Service Operations Kennedy Information
No. 1
Of 8 named to Kennedy Vanguard of Supply Chain Consulting Kennedy Information
No. 1
In Innovation Solutions Kennedy Information
No. 1
Global Mergers & Acquisitions Advisory Kennedy Information
No. 1 Enterprise Applications Partnerships SAP Oracle Salesforce.com Jive
In Operations Strategy IDC (2012)
Gartner CRM Service Provider
No. 1
Leader

48 PwC’s SCORmarkTM Readout for Client
This report is exclusively for internal use by the recipient and should not be provided to in writing or otherwise to any other third party under any circumstances.
Sample Report
PwC + Strategy& is a recognized, global leader in operations consulting and supply chain benchmarking
PwC established the term “supply chain management” (1982) and co-led development of the SCOR Model (1996), we continue to lead the industry
Change Management Consulting
Kennedy Vanguard Leader [4]
Manufacturing & Production Strategy Consulting
Kennedy Vanguard Leader [3]
Supply Chain Risk Management Consulting
Kennedy Vanguard Leader [6]
New Market Entry Strategy Consulting
Kennedy Vanguard Leader [5]
Oracle Applications Implementation Services
Gartner Magic Quadrant Leader [1]
Business Operations Consulting Services
Gartner Magic Quadrant Leader [2]
Operations Consulting Services
An IDC MarketScape Leader [7]
“PwC is seen as the most capable
of all firms at providing a full
spectrum of business consulting services on
operations engagements.”[8]
[1] Gartner Research, “Magic Quadrant for Oracle Applications Implementation Services, Worldwide,” September 2013, Alex Soejarto, Susanne Matson, [2] “Magic Quadrant for Business Operations Consulting Services, Worldwide,”
December 23, 2013, Dana Stiffler. Gartner does not endorse any vendor, product, or service depicted in its research publications, and does not advise technology users to select only those vendors with the highest ratings. Gartner research publications consist of the
opinions of Gartner's research organization and should not be construed as statements of fact. Gartner disclaims all warranties, expressed or implied, with respect to this research, including any warranties of merchantability or fitness for a particular purpose; [3]
Kennedy Research, “Manufacturing & Production Strategy Consulting,” [4] "Change Management Consulting Market,” [5] New Market Entry Strategy Consulting,” [6] "Supply Chain Risk Management Consulting 2012-2015," © Kennedy Information LLC. Reproduced
under license. [7,8] IDC, IDC MarketScape: Worldwide Operations Consulting Services 2012 Vendor Analysis, Cushing Anderson, July 2012 (IDC #236022).
“Gartner supply chain leaders also hold in high regard (PwC’s) ability to benchmark supply chains….consider PwC, particularly if you are in the market for benchmarking services”
- Gartner
“For precise, end to end supply chain benchmarks, consider (PwC’s) The Performance Measurement Group”
-AMR Research

49 PwC’s SCORmarkTM Readout for Client
This report is exclusively for internal use by the recipient and should not be provided to in writing or otherwise to any other third party under any circumstances.
Sample Report
PwC brings integrated best of the breed supply chain capabilities and thought leadership to its clients
Business Strategy
• Pre-eminent strategic management consulting firm
• Explicit focus on pragmatic capability driven transformation and growth
• Broad operational design capabilities
Operational Excellence
• Leading Operations Strategy Consulting Firm
• Deep expertise in supply chain design and implementation
• Unique benchmarking capabilities through focused Performance Management Group
Technology Strategy & Implementation
• Dominant technology strategy and eBusiness design firm
• Explicit focus on strategic use of technology architecture and capability planning
Digital /Omnichannel Leadership
• Thought-leading boutiques in social media and digital
• Extensive experience in consumer marketing and engagement design
“Category of One”

50 PwC’s SCORmarkTM Readout for Client
This report is exclusively for internal use by the recipient and should not be provided to in writing or otherwise to any other third party under any circumstances.
Sample Report
We help clients address end-to-end supply chain performance challenges while thinking like a “ruthless competitor”
Operational Excellence
Logistics and Distribution
Procurement & Sourcing
Supply Chain Planning
Quality Systems
Operations Strategy &
Transformation
Product Life Cycle Mgt
• Strategic sourcing
• Procurement technology
• Procurement transformation
• Contract manufacturing
• Logistics strategy
• Logistics operations
• Transportation
• Customs & duties
• Track/trace e-pedigree
Tax Efficient Supply Chain
Operational Excellence
Cost Optimization Global Productivity
and Agility
Plan & Execute Effective & Efficient Sense & Respond Agile & Reliable
• Demand planning
• Supply planning
• Sales and operations planning
• Clinical supply chain
• Assessment & analysis
• Network optimization
• Operational strategy
• Performance metrics
• Risk management
• Design for supply chain
• Design collaboration
• NPI process design and optimization
• Technology transfer & scale up
Supply Chain IT Strategy
• Lean operations
• Cycle time reduction
• Inventory optimization
• Cost reduction
• Culture change
• Design controls
• Assessment
• Consent decree remediation
• Governance & infrastructure
People & Change
Governance, Risk, Compliance

51 PwC’s SCORmarkTM Readout for Client
This report is exclusively for internal use by the recipient and should not be provided to in writing or otherwise to any other third party under any circumstances.
Sample Report
Thank you
PricewaterhouseCoopers has exercised reasonable care in the collecting, processing, and reporting of this information but has not independently verified, validated, or audited the data to verify the accuracy or completeness of the information. PricewaterhouseCoopers gives no express or implied warranties, including but not limited to any warranties of merchantability or fitness for a particular purpose or use and shall not be liable to any entity or person using this document, or have any liability with respect to this document. This report is intended for internal use only by the recipient and should not be provided in writing or otherwise to any other third party without PricewaterhouseCoopers express written consent.
© 2016 PricewaterhouseCoopers LLP. All rights reserved. "PricewaterhouseCoopers" refers to PricewaterhouseCoopers LLP, a Delaware limited liability partnership, or, as the context requires, the PricewaterhouseCoopers global network or other member firms of the network, each of which is a separate legal entity. This document is for general information purposes only and should not be used as a substitute for consultation with professional advisors.