scott k. powers edward t. howley theory and application to fitness and performance seventh edition...
TRANSCRIPT
Scott K. Powers • Edward T. HowleyScott K. Powers • Edward T. HowleyScott K. Powers • Edward T. HowleyScott K. Powers • Edward T. Howley
Theory and Application to Fitness and PerformanceTheory and Application to Fitness and PerformanceSEVENTH EDITION
Chapter
Presentation prepared by:
Brian B. Parr, Ph.D.
University of South Carolina AikenCopyright ©2009 The McGraw-Hill Companies, Inc. Permission required for reproduction or display outside of classroom use.
Exercise MetabolismExercise Metabolism
Chapter 4
Copyright ©2009 The McGraw-Hill Companies, Inc. All Rights Reserved.
ObjectivesObjectives
1. Discuss the relationship between exercise intensity/duration and the bioenergetic pathways that are most responsible for the production of ATP during various types of exercise.
2. Define the term oxygen deficit.
3. Define the term lactate threshold.
4. Discuss several possible mechanisms for the sudden rise in blood-lactate concentration during incremental exercise.

Chapter 4
Copyright ©2009 The McGraw-Hill Companies, Inc. All Rights Reserved.
ObjectivesObjectives
5. List the factors that regulate fuel selection during different types of exercise.
6. Explain why fat metabolism is dependent on carbohydrate metabolism.
7. Define the term oxygen debt.
8. Give the physiological explanation for the observation that the O2 debt is greater following intense exercise when compared to the O2 debt following light exercise.
Chapter 4
Copyright ©2009 The McGraw-Hill Companies, Inc. All Rights Reserved.
OutlineOutline
Energy Requirements at Rest
Rest-to-Exercise Transitions
Recovery from Exercise: Metabolic Responses
Metabolic Responses to Exercise: Influence of Duration and IntensityShort-Term, Intense Exercise
Prolonged Exercise
Incremental Exercise
Estimation of Fuel Utilization During Exercise
Factors Governing Fuel SelectionExercise Intensity and Fuel Selection
Exercise Duration and Fuel Selection
Interaction of Fat/ Carbohydrate Metabolism
Body Fuel Sources

Chapter 4
Copyright ©2009 The McGraw-Hill Companies, Inc. All Rights Reserved.
Energy Requirements at RestEnergy Requirements at Rest
• Almost 100% of ATP produced by aerobic metabolism
• Blood lactate levels are low (<1.0 mmol/L)
• Resting O2 consumption:
– 0.25 L/min– 3.5 ml/kg/min
Energy Requirements at Rest

Chapter 4
Copyright ©2009 The McGraw-Hill Companies, Inc. All Rights Reserved.
Rest-to-Exercise Transitions
Rest-to-Exercise TransitionsRest-to-Exercise Transitions
• ATP production increases immediately• Oxygen uptake increases rapidly
– Reaches steady state within 1–4 minutes– After steady state is reached, ATP requirement is met
through aerobic ATP production
• Initial ATP production through anaerobic pathways– ATP-PC system– Glycolysis
• Oxygen deficit– Lag in oxygen uptake at the beginning of exercise

Chapter 4
Copyright ©2009 The McGraw-Hill Companies, Inc. All Rights Reserved.Figure 4.1
The Oxygen Deficit The Oxygen Deficit
Rest-to-Exercise Transitions

Chapter 4
Copyright ©2009 The McGraw-Hill Companies, Inc. All Rights Reserved.
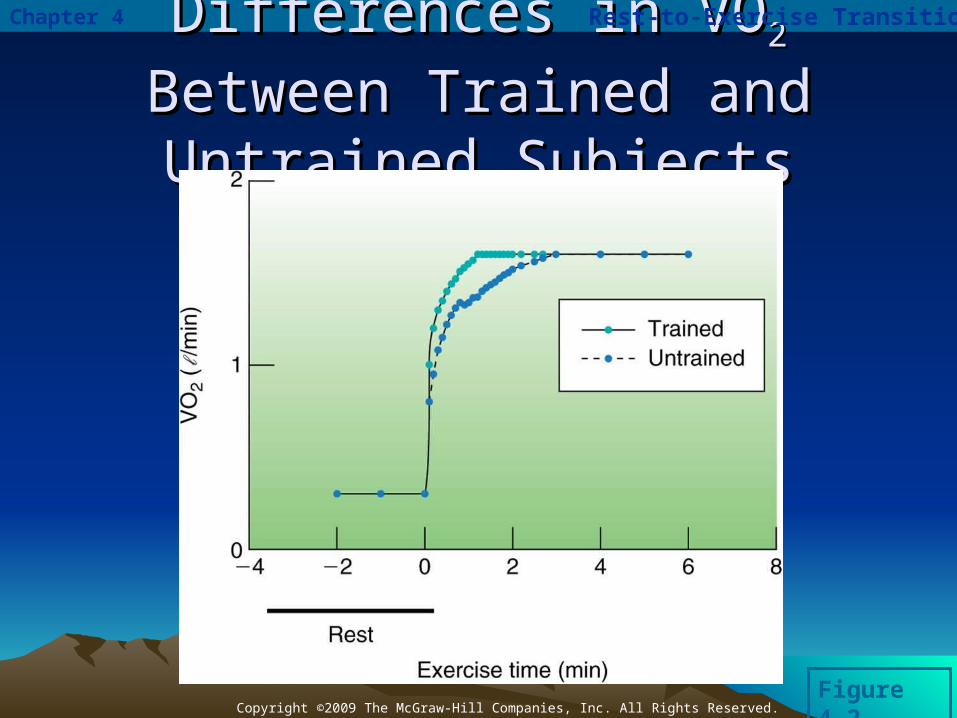
Comparison of Trained and Comparison of Trained and Untrained SubjectsUntrained Subjects
• Trained subjects have a lower oxygen deficit– Better-developed aerobic bioenergetic
capacity– Due to cardiovascular or muscular
adaptations
• Results in less production of lactic acid
Rest-to-Exercise Transitions
Chapter 4
Copyright ©2009 The McGraw-Hill Companies, Inc. All Rights Reserved.
Differences in VODifferences in VO22 Between Between
Trained and Untrained SubjectsTrained and Untrained Subjects
Figure 4.2
Rest-to-Exercise Transitions
Chapter 4
Copyright ©2009 The McGraw-Hill Companies, Inc. All Rights Reserved.
In SummaryIn Summary
In the transition from rest to light or moderate exercise, oxygen uptake increases rapidly, generally reaching a steady state within one to four minutes.
The term oxygen deficit applies to the lag in oxygen uptake in the beginning of exercise.
The failure of oxygen uptake to increase instantly at the beginning of exercise suggests that anaerobic pathways contribute to the overall production on ATP early in exercise. After a steady state is reached, the body’s ATP requirement is met via aerobic metabolism.
Rest-to-Exercise Transitions
Chapter 4
Copyright ©2009 The McGraw-Hill Companies, Inc. All Rights Reserved.
Recovery From Exercise: Metabolic Responses
Recovery From ExerciseRecovery From Exercise
• Oxygen uptake remains elevated above rest into recovery
• Oxygen debt – Term used by A.V. Hill
• Repayment for O2 deficit at onset of exercise
• Excess post-exercise oxygen consumption (EPOC)
– Terminology reflects that only ~20% elevated O2 consumption used to “repay” O2 deficit
• Many scientists use these terms interchangeably
Chapter 4
Copyright ©2009 The McGraw-Hill Companies, Inc. All Rights Reserved.
Recovery From Exercise: Metabolic Responses
Oxygen DebtOxygen Debt
• “Rapid” portion of O2 debt
– Resynthesis of stored PC
– Replenishing muscle and blood O2 stores
• “Slow” portion of O2 debt
– Elevated heart rate and breathing = energy need– Elevated body temperature = metabolic rate– Elevated epinephrine and norepinephrine =
metabolic rate– Conversion of lactic acid to glucose
(gluconeogenesis)
Chapter 4
Copyright ©2009 The McGraw-Hill Companies, Inc. All Rights Reserved.
Recovery From Exercise: Metabolic Responses
EPOC is Greater Following EPOC is Greater Following Higher Intensity ExerciseHigher Intensity Exercise
• Higher body temperature
• Greater depletion of PC
• Greater blood concentrations of lactic acid
• Higher levels of blood epinephrine and norepinephrine

Chapter 4
Copyright ©2009 The McGraw-Hill Companies, Inc. All Rights Reserved.
Oxygen Deficit and Debt During Oxygen Deficit and Debt During Light/Moderate and Heavy Light/Moderate and Heavy
ExerciseExercise
Recovery From Exercise: Metabolic Responses
Figure 4.3
Chapter 4
Copyright ©2009 The McGraw-Hill Companies, Inc. All Rights Reserved.
A Closer Look 4.1A Closer Look 4.1
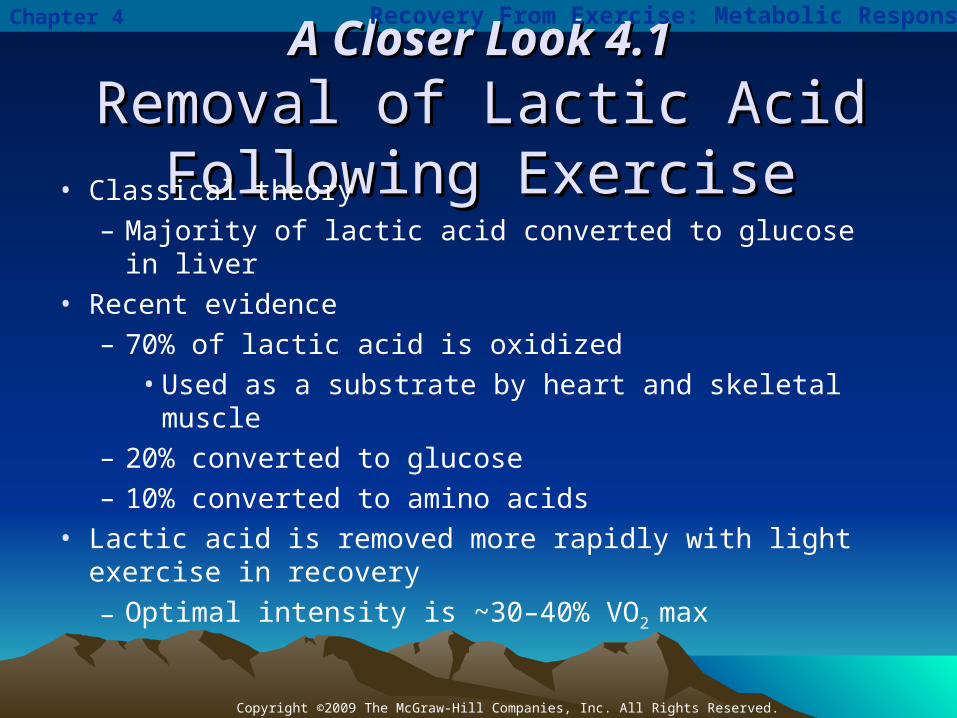
Removal of Lactic Acid Following Removal of Lactic Acid Following ExerciseExercise• Classical theory
– Majority of lactic acid converted to glucose in liver• Recent evidence
– 70% of lactic acid is oxidized• Used as a substrate by heart and skeletal muscle
– 20% converted to glucose– 10% converted to amino acids
• Lactic acid is removed more rapidly with light exercise in recovery
– Optimal intensity is ~30–40% VO2 max
Recovery From Exercise: Metabolic Responses

Chapter 4
Copyright ©2009 The McGraw-Hill Companies, Inc. All Rights Reserved.
Blood Lactate Removal Blood Lactate Removal Following Strenuous ExerciseFollowing Strenuous Exercise
Recovery From Exercise: Metabolic Responses
Figure 4.4

Chapter 4
Copyright ©2009 The McGraw-Hill Companies, Inc. All Rights Reserved.
Factors Contributing to EPOCFactors Contributing to EPOC
Figure 4.5
Recovery From Exercise: Metabolic Responses

Chapter 4
Copyright ©2009 The McGraw-Hill Companies, Inc. All Rights Reserved.
Metabolic Responses to Exercise: Influence of Duration and Intensity
Metabolic Responses to Short-Metabolic Responses to Short-Term, Intense ExerciseTerm, Intense Exercise
• First 1–5 seconds of exercise– ATP through ATP-PC system
• Intense exercise longer than 5 seconds– Shift to ATP production via glycolysis
• Events lasting longer than 45 seconds– ATP production through ATP-PC, glycolysis, and
aerobic systems– 70% anaerobic/30% aerobic at 60 seconds– 50% anaerobic/50% aerobic at 2 minutes
Chapter 4
Copyright ©2009 The McGraw-Hill Companies, Inc. All Rights Reserved.
In SummaryIn Summary
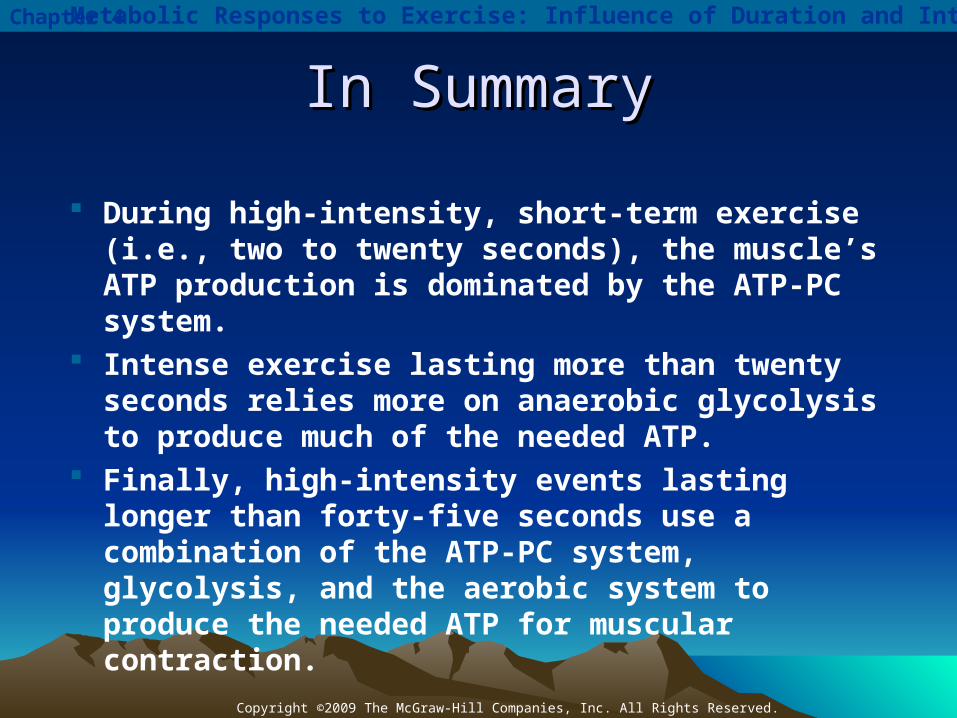
During high-intensity, short-term exercise (i.e., two to twenty seconds), the muscle’s ATP production is dominated by the ATP-PC system.
Intense exercise lasting more than twenty seconds relies more on anaerobic glycolysis to produce much of the needed ATP.
Finally, high-intensity events lasting longer than forty-five seconds use a combination of the ATP-PC system, glycolysis, and the aerobic system to produce the needed ATP for muscular contraction.
Metabolic Responses to Exercise: Influence of Duration and Intensity
Chapter 4
Copyright ©2009 The McGraw-Hill Companies, Inc. All Rights Reserved.
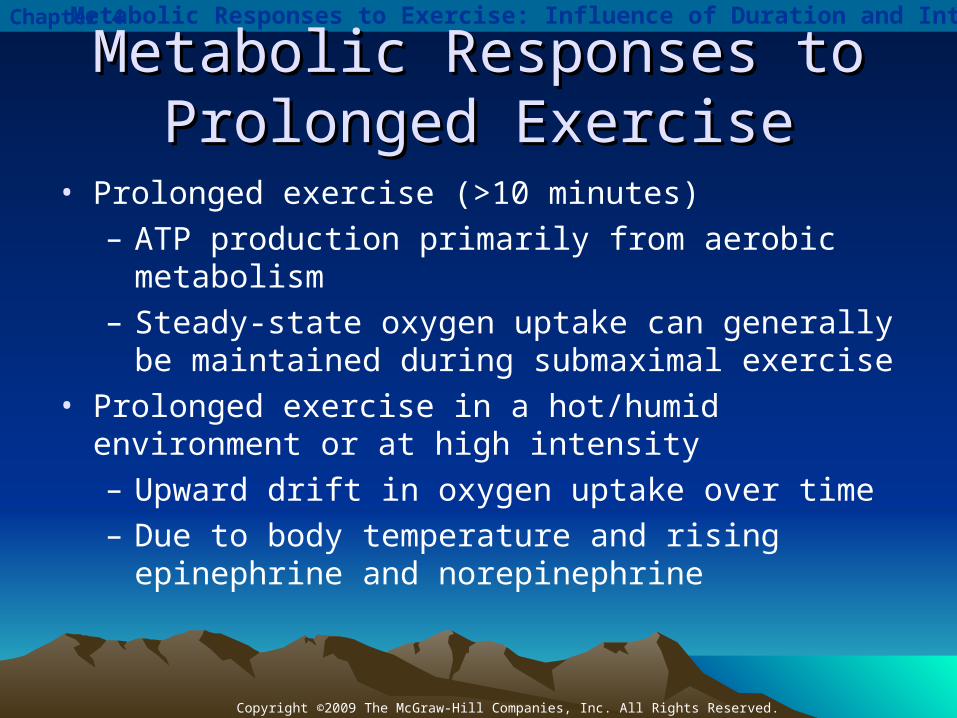
Metabolic Responses to Metabolic Responses to Prolonged ExerciseProlonged Exercise
• Prolonged exercise (>10 minutes)– ATP production primarily from aerobic metabolism– Steady-state oxygen uptake can generally be
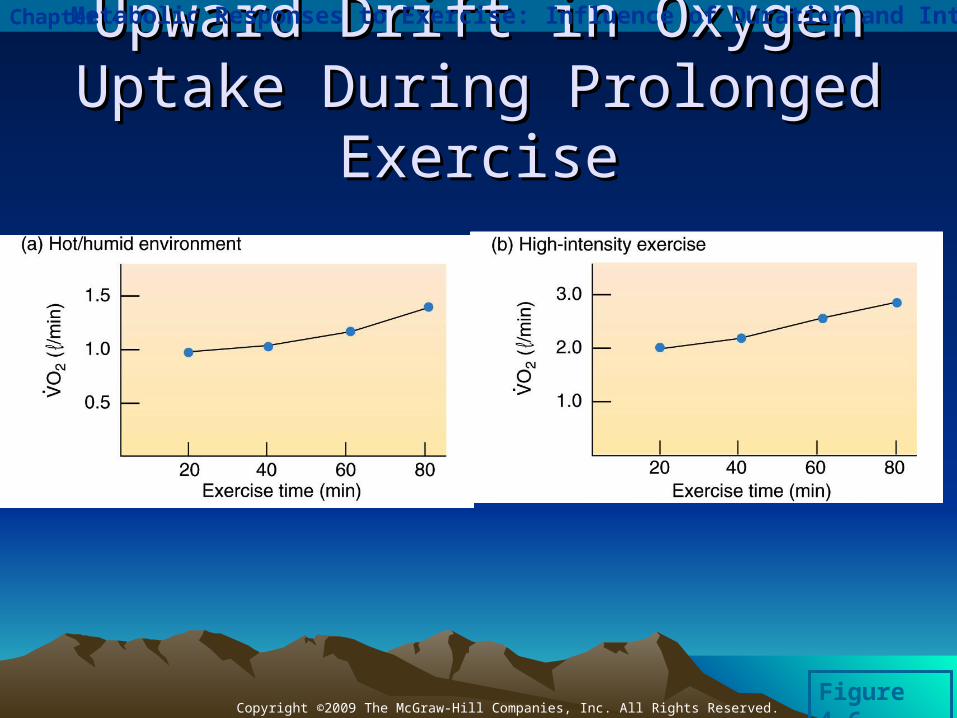
maintained during submaximal exercise• Prolonged exercise in a hot/humid environment or at
high intensity– Upward drift in oxygen uptake over time– Due to body temperature and rising epinephrine and
norepinephrine
Metabolic Responses to Exercise: Influence of Duration and Intensity
Chapter 4
Copyright ©2009 The McGraw-Hill Companies, Inc. All Rights Reserved.
Upward Drift in Oxygen Uptake Upward Drift in Oxygen Uptake During Prolonged ExerciseDuring Prolonged Exercise
Metabolic Responses to Exercise: Influence of Duration and Intensity
Figure 4.6

Chapter 4
Copyright ©2009 The McGraw-Hill Companies, Inc. All Rights Reserved.
Metabolic Responses to Exercise: Influence of Duration and Intensity
Metabolic Responses to Metabolic Responses to Incremental ExerciseIncremental Exercise
• Oxygen uptake increases linearly until maximal oxygen uptake (VO2 max) is reached– No further increase in VO2 with increasing work rate
• VO2 max– “Physiological ceiling” for delivery of O2 to muscle– Affected by genetics and training
• Physiological factors influencing VO2 max– Maximum ability of cardiorespiratory system to deliver
oxygen to the muscle– Ability of muscles to use oxygen and produce ATP
aerobically

Chapter 4
Copyright ©2009 The McGraw-Hill Companies, Inc. All Rights Reserved.
Changes in Oxygen Uptake Changes in Oxygen Uptake During Incremental ExerciseDuring Incremental Exercise
Metabolic Responses to Exercise: Influence of Duration and Intensity
Figure 4.7
Chapter 4
Copyright ©2009 The McGraw-Hill Companies, Inc. All Rights Reserved.
Metabolic Responses to Exercise: Influence of Duration and Intensity
Lactate ThresholdLactate Threshold
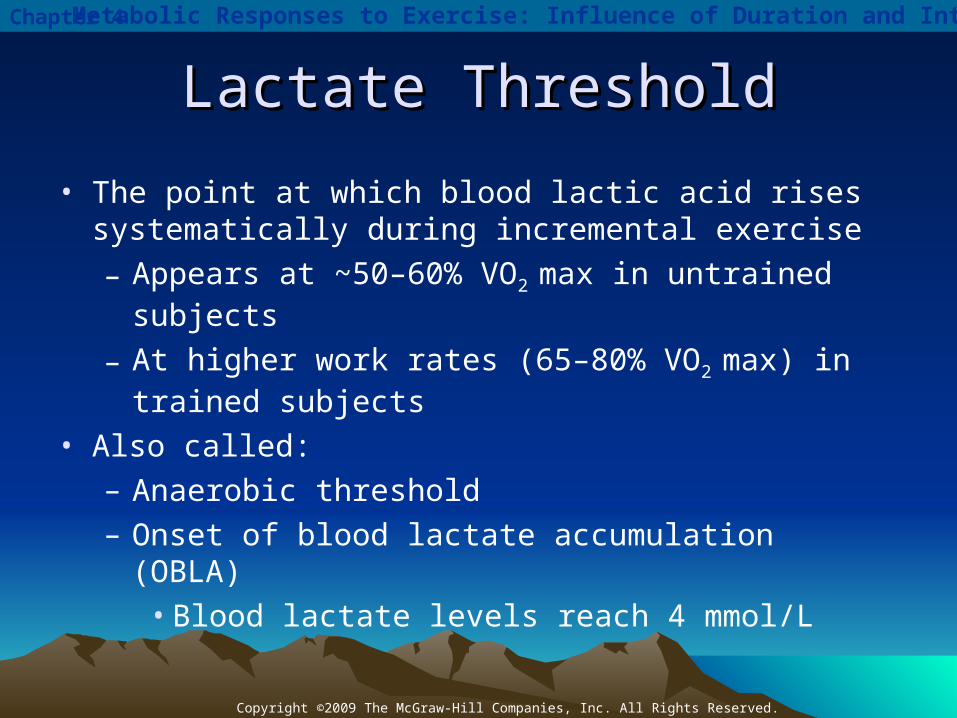
• The point at which blood lactic acid rises systematically during incremental exercise
– Appears at ~50–60% VO2 max in untrained subjects
– At higher work rates (65–80% VO2 max) in trained subjects
• Also called:– Anaerobic threshold– Onset of blood lactate accumulation (OBLA)
• Blood lactate levels reach 4 mmol/L

Chapter 4
Copyright ©2009 The McGraw-Hill Companies, Inc. All Rights Reserved.
Changes in Blood Lactate Concentration Changes in Blood Lactate Concentration During Incremental ExerciseDuring Incremental Exercise
Metabolic Responses to Exercise: Influence of Duration and Intensity
Figure 4.8

Chapter 4
Copyright ©2009 The McGraw-Hill Companies, Inc. All Rights Reserved.
Metabolic Responses to Exercise: Influence of Duration and Intensity
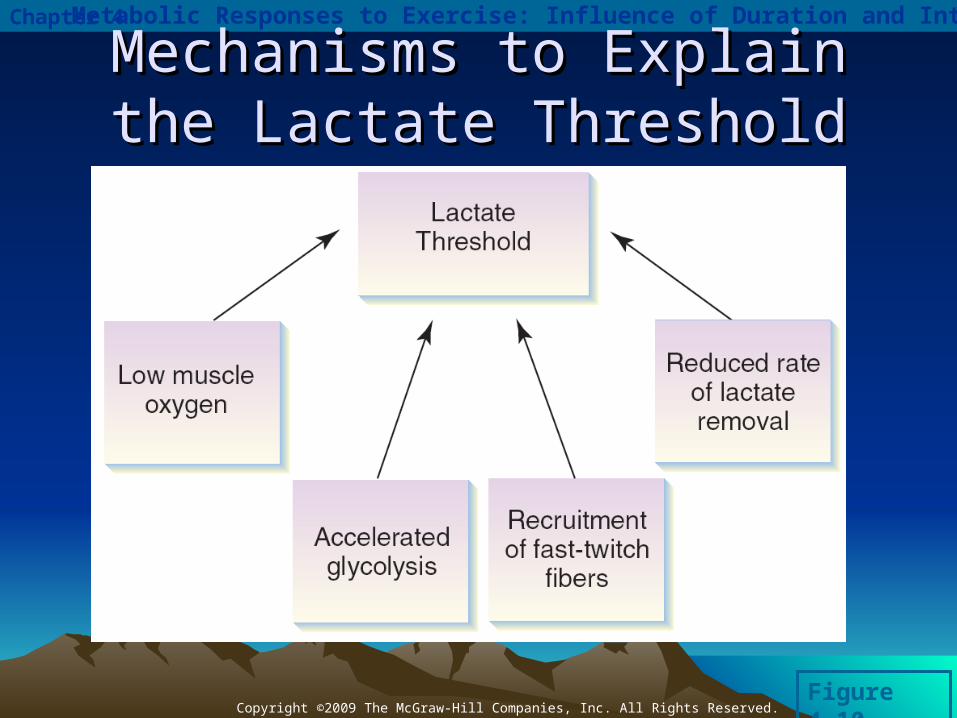
Explanations for the Lactate ThresholdExplanations for the Lactate Threshold
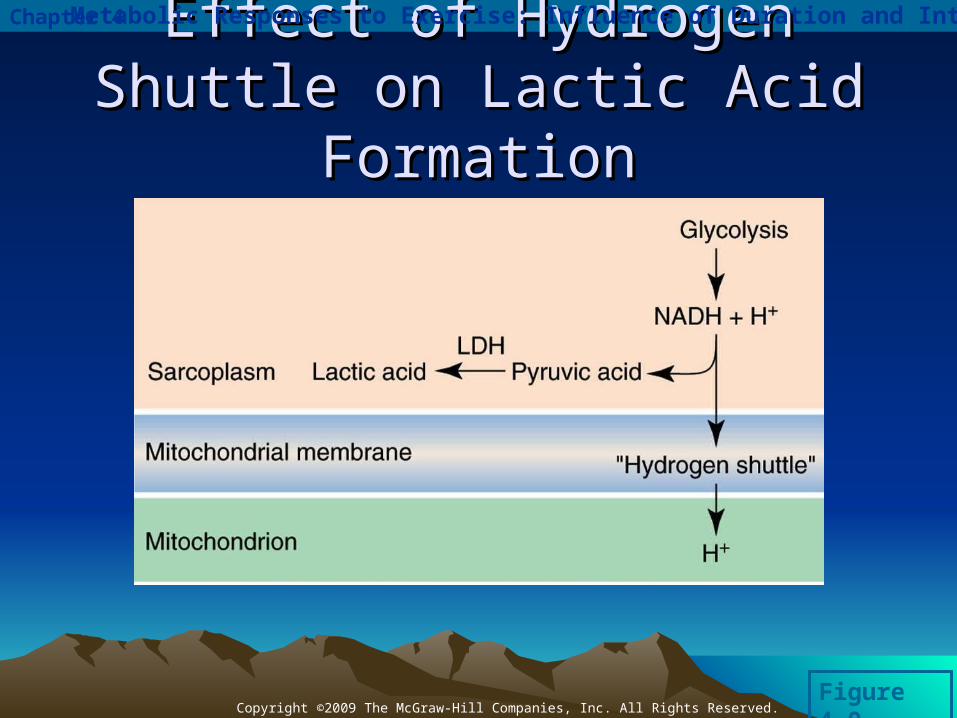
• Low muscle oxygen (hypoxia)• Accelerated glycolysis
– NADH produced faster than it is shuttled into mitochondria
– Excess NADH in cytoplasm converts pyruvic acid to lactic acid
• Recruitment of fast-twitch muscle fibers– LDH isozyme in fast fibers promotes lactic acid
formation• Reduced rate of lactate removal from the blood
Chapter 4
Copyright ©2009 The McGraw-Hill Companies, Inc. All Rights Reserved.
Effect of Hydrogen Shuttle on Effect of Hydrogen Shuttle on Lactic Acid FormationLactic Acid Formation
Metabolic Responses to Exercise: Influence of Duration and Intensity
Figure 4.9
Chapter 4
Copyright ©2009 The McGraw-Hill Companies, Inc. All Rights Reserved.
Mechanisms to Explain the Mechanisms to Explain the Lactate ThresholdLactate Threshold
Metabolic Responses to Exercise: Influence of Duration and Intensity
Figure 4.10
Chapter 4
Copyright ©2009 The McGraw-Hill Companies, Inc. All Rights Reserved.
Metabolic Responses to Exercise: Influence of Duration and Intensity
Practical Uses of the Lactate Practical Uses of the Lactate ThresholdThreshold
• Prediction of performance – Combined with VO2 max
• Planning training programs– Marker of training intensity

Chapter 4
Copyright ©2009 The McGraw-Hill Companies, Inc. All Rights Reserved.
In SummaryIn Summary Oxygen uptake increases in a linear fashion during incremental
exercise until VO2 max is reached. The point at which blood lactic acid rises systematically during
graded exercise is termed the lactate threshold or anaerobic threshold.
Controversy exists over the mechanism to explain the sudden rise in blood lactic acid concentrations during incremental exercise. It is possible that any one or a combination of the following factors might provide an explanation for the lactate threshold: (1) low muscle oxygen, (2) accelerated glycolysis, (3) recruitment of fast fibers, and (4) a reduced rate of lactate removal.
The lactate threshold has practical uses such as in performance prediction and as a marker of training intensity.
Metabolic Responses to Exercise: Influence of Duration and Intensity

Chapter 4
Copyright ©2009 The McGraw-Hill Companies, Inc. All Rights Reserved.
• Respiratory exchange ratio (RER or R)
• R for fat (palmitic acid)
• R for carbohydrate (glucose)
C16H32O2 + 23 O2 16 CO2 + 16 H2O
VCO2
VO2
=R =16 CO2
23 O2
= 0.70
VCO2
VO2
=R =6 CO2
6 O2
= 1.00
C6H12O6 + 6 O2 6 CO2 + 6 H2O
VCO2
VO2
R =
Estimation of Fuel Utilization Estimation of Fuel Utilization During ExerciseDuring Exercise
Estimation of Fuel Utilization During Exercise

Chapter 4
Copyright ©2009 The McGraw-Hill Companies, Inc. All Rights Reserved.
Estimation of Fuel Utilization During Exercise
Estimation of Fuel Utilization Estimation of Fuel Utilization During ExerciseDuring Exercise

Chapter 4
Copyright ©2009 The McGraw-Hill Companies, Inc. All Rights Reserved.
In SummaryIn Summary The respiratory exchange ratio (R) is the
ratio of carbon dioxide produced to the oxygen consumed (VCO2/VO2).
In order for R to be used as an estimate of substrate utilization during exercise, the subject must have reached steady state. This is important because only during steady-state exercise are the VCO2 and VO2 reflective of metabolic exchange of gases in tissues.
Estimation of Fuel Utilization During Exercise
Chapter 4
Copyright ©2009 The McGraw-Hill Companies, Inc. All Rights Reserved.
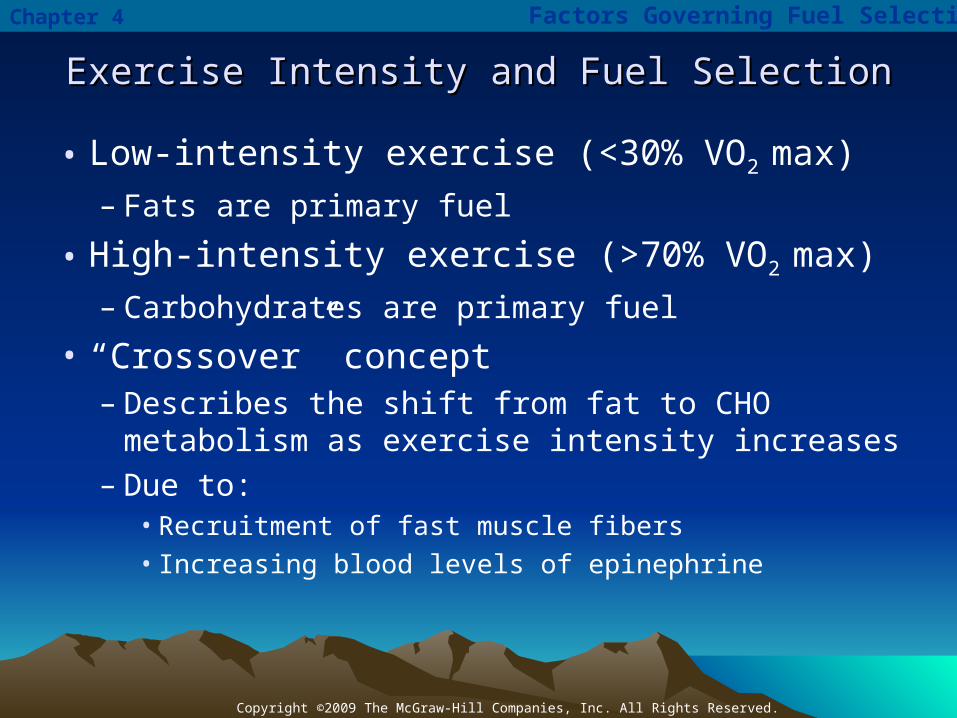
Exercise Intensity and Fuel SelectionExercise Intensity and Fuel Selection
• Low-intensity exercise (<30% VO2 max)
– Fats are primary fuel
• High-intensity exercise (>70% VO2 max)
– Carbohydrates are primary fuel
• “Crossover” concept– Describes the shift from fat to CHO metabolism as
exercise intensity increases– Due to:
• Recruitment of fast muscle fibers• Increasing blood levels of epinephrine
Factors Governing Fuel Selection

Chapter 4
Copyright ©2009 The McGraw-Hill Companies, Inc. All Rights Reserved.
Factors Governing Fuel Selection
Figure 4.11
Illustration of the “Crossover” Illustration of the “Crossover” ConceptConcept

Chapter 4
Copyright ©2009 The McGraw-Hill Companies, Inc. All Rights Reserved.
Factors Governing Fuel Selection
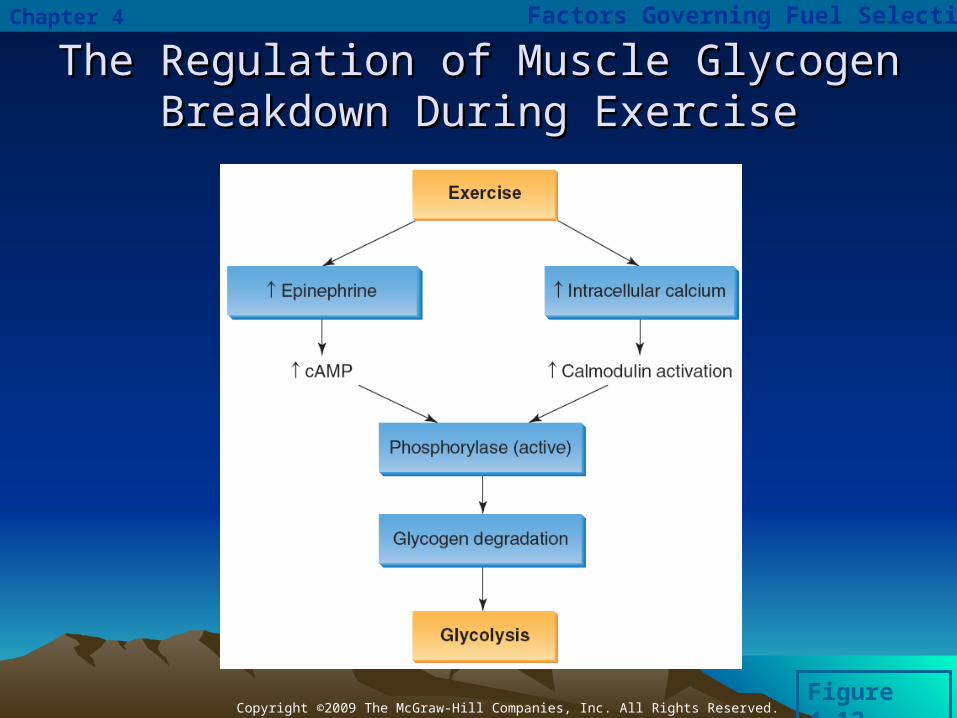
The Regulation of Glycogen Breakdown The Regulation of Glycogen Breakdown During ExerciseDuring Exercise
• Dependent on the enzyme phosphorylase
• Activation of phosphorylase– Calmodulin activated by calcium released
from sarcoplasmic reticulum• Active calmodulin activates phosphorylase
– Epinephrine binding to receptor results in formation of cyclic AMP
• Cyclic AMP activates phosphorylase
Chapter 4
Copyright ©2009 The McGraw-Hill Companies, Inc. All Rights Reserved.
Factors Governing Fuel Selection
Figure 4.12
The Regulation of Muscle Glycogen The Regulation of Muscle Glycogen Breakdown During ExerciseBreakdown During Exercise
Chapter 4
Copyright ©2009 The McGraw-Hill Companies, Inc. All Rights Reserved.
Factors Governing Fuel Selection
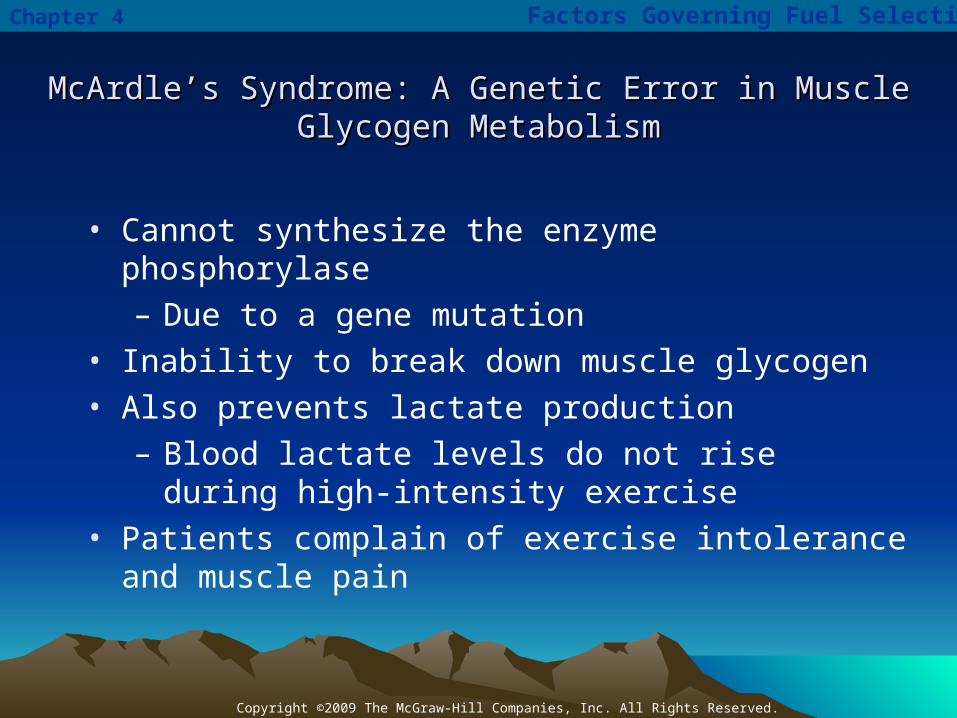
McArdle’s Syndrome: A Genetic Error in Muscle Glycogen McArdle’s Syndrome: A Genetic Error in Muscle Glycogen MetabolismMetabolism
• Cannot synthesize the enzyme phosphorylase– Due to a gene mutation
• Inability to break down muscle glycogen• Also prevents lactate production
– Blood lactate levels do not rise during high-intensity exercise
• Patients complain of exercise intolerance and muscle pain
Chapter 4
Copyright ©2009 The McGraw-Hill Companies, Inc. All Rights Reserved.
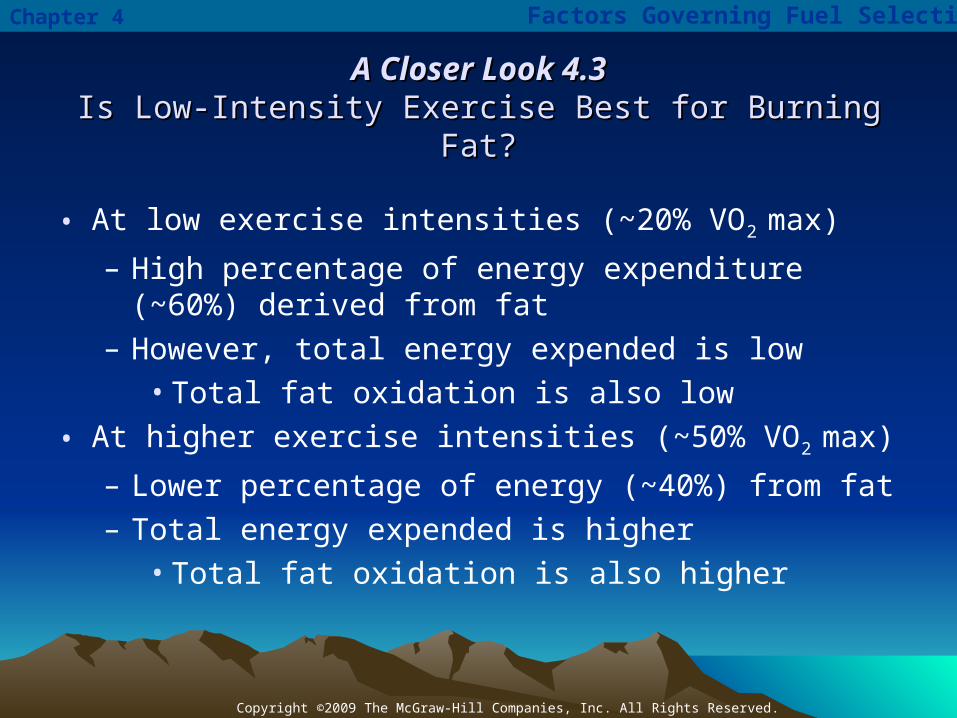
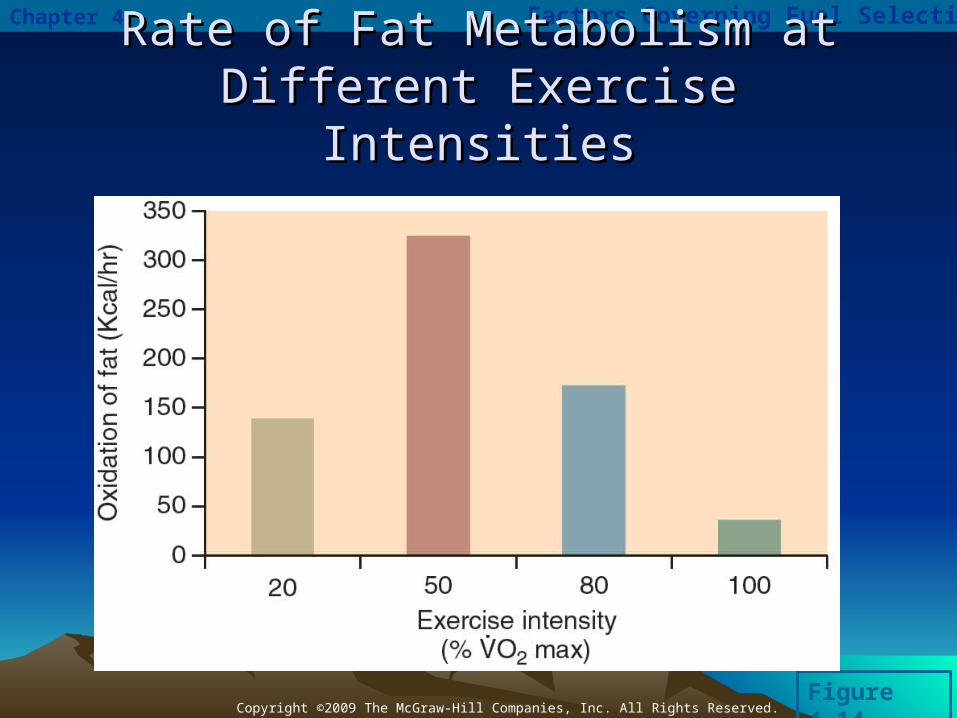
A Closer Look 4.3A Closer Look 4.3Is Low-Intensity Exercise Best for Burning Fat?Is Low-Intensity Exercise Best for Burning Fat?
• At low exercise intensities (~20% VO2 max)
– High percentage of energy expenditure (~60%) derived from fat
– However, total energy expended is low• Total fat oxidation is also low
• At higher exercise intensities (~50% VO2 max)
– Lower percentage of energy (~40%) from fat– Total energy expended is higher
• Total fat oxidation is also higher
Factors Governing Fuel Selection
Chapter 4
Copyright ©2009 The McGraw-Hill Companies, Inc. All Rights Reserved.
Factors Governing Fuel Selection
Figure 4.14
Rate of Fat Metabolism at Different Rate of Fat Metabolism at Different Exercise IntensitiesExercise Intensities

Chapter 4
Copyright ©2009 The McGraw-Hill Companies, Inc. All Rights Reserved.
Factors Governing Fuel Selection
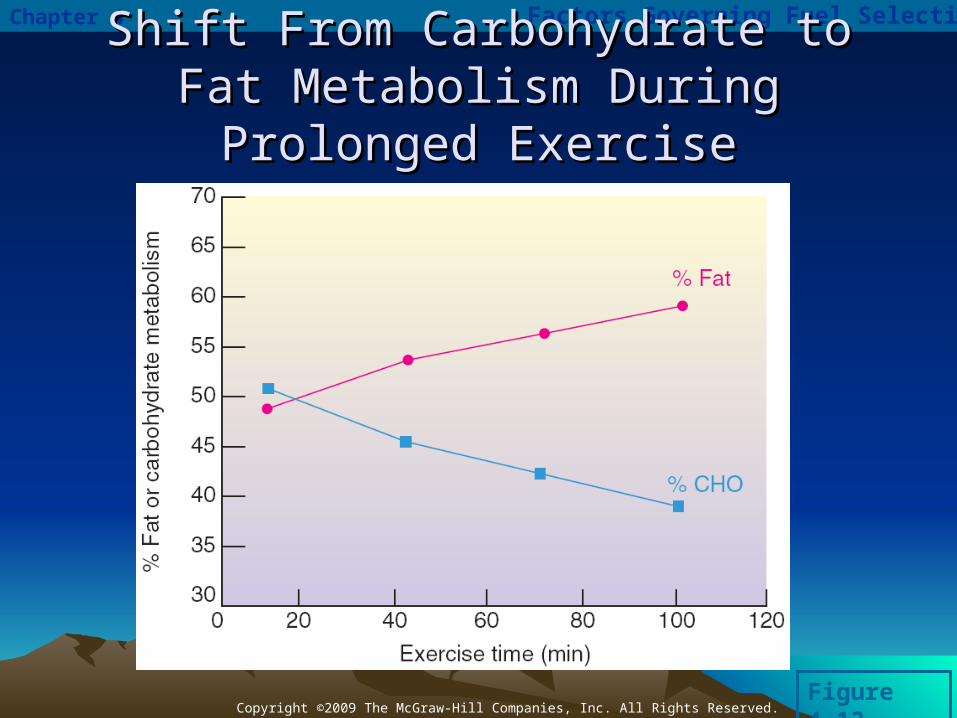
Exercise Duration and Fuel SelectionExercise Duration and Fuel Selection
• Prolonged, low-intensity exercise – Shift from carbohydrate metabolism toward fat
metabolism
• Due to an increased rate of lipolysis– Breakdown of triglycerides glycerol + FFA
• By enzymes called lipases
– Stimulated by rising blood levels of epinephrine
Chapter 4
Copyright ©2009 The McGraw-Hill Companies, Inc. All Rights Reserved.
Factors Governing Fuel Selection
Shift From Carbohydrate to Fat Shift From Carbohydrate to Fat Metabolism During Prolonged ExerciseMetabolism During Prolonged Exercise
Figure 4.13

Chapter 4
Copyright ©2009 The McGraw-Hill Companies, Inc. All Rights Reserved.
Factors Governing Fuel Selection
Interaction of Fat and CHO Metabolism Interaction of Fat and CHO Metabolism During ExerciseDuring Exercise
• “Fats burn in the flame of carbohydrates”
• Glycogen is depleted during prolonged high-intensity exercise– Reduced rate of glycolysis and production of
pyruvate– Reduced Krebs cycle intermediates– Reduced fat oxidation
• Fats are metabolized by Krebs cycle
Chapter 4
Copyright ©2009 The McGraw-Hill Companies, Inc. All Rights Reserved.
Carbohydrate Feeding via Sports Drinks Improves Endurance Carbohydrate Feeding via Sports Drinks Improves Endurance PerformancePerformance
• The depletion of muscle and blood carbohydrate stores contributes to fatigue
• Ingestion of carbohydrates can improve endurance performance
– During submaximal (<70% VO2 max), long-duration (>90 minutes) exercise
– 30–60 g of carbohydrate per hour are required• May also improve performance in shorter, higher
intensity events
Factors Governing Fuel Selection

Chapter 4
Copyright ©2009 The McGraw-Hill Companies, Inc. All Rights Reserved.
Factors Governing Fuel Selection
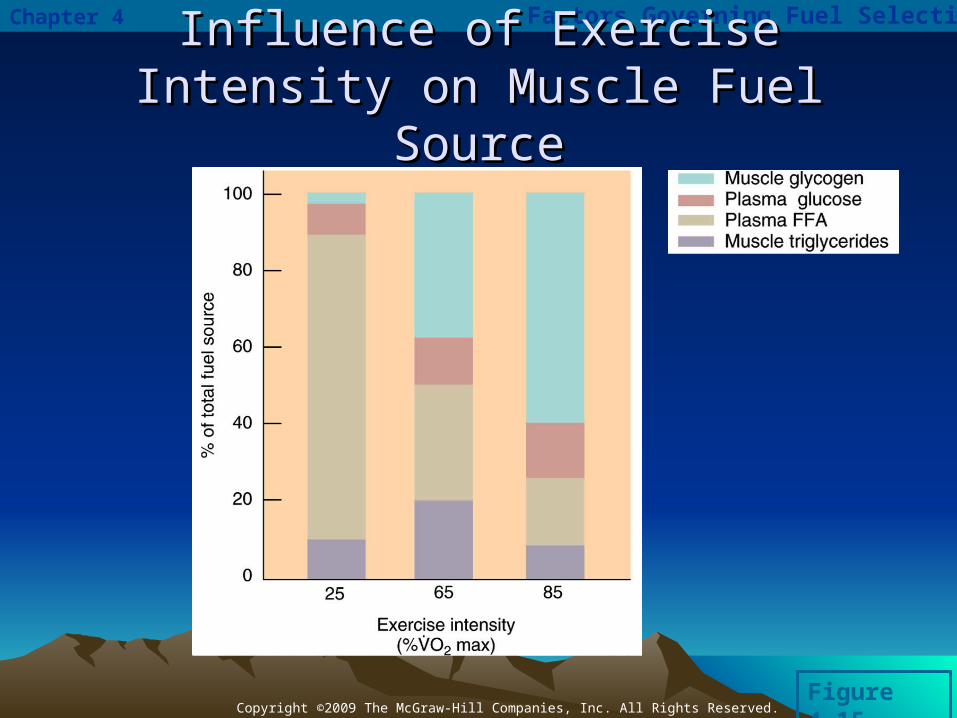
Sources of Carbohydrate During ExerciseSources of Carbohydrate During Exercise
• Muscle glycogen– Primary source of carbohydrate during high-intensity
exercise– Supplies much of the carbohydrate in the first hour of
exercise• Blood glucose
– From liver glycogenolysis– Primary source of carbohydrate during low-intensity
exercise– Important during long-duration exercise
• As muscle glycogen levels decline
Chapter 4
Copyright ©2009 The McGraw-Hill Companies, Inc. All Rights Reserved.
Factors Governing Fuel Selection
Sources of Fat During ExerciseSources of Fat During Exercise
• Intramuscular triglycerides– Primary source of fat during higher intensity exercise
• Plasma FFA – From adipose tissue lipolysis
• Triglycerides glycerol + FFA– FFA converted to acetyl-CoA and enters Krebs cycle– Primary source of fat during low-intensity exercise– Becomes more important as muscle triglyceride levels
decline in long-duration exercise
Chapter 4
Copyright ©2009 The McGraw-Hill Companies, Inc. All Rights Reserved.
Factors Governing Fuel Selection
Figure 4.15
Influence of Exercise Intensity on Influence of Exercise Intensity on Muscle Fuel SourceMuscle Fuel Source

Chapter 4
Copyright ©2009 The McGraw-Hill Companies, Inc. All Rights Reserved.
Factors Governing Fuel Selection
Figure 4.16
Effect of Exercise Duration on Muscle Effect of Exercise Duration on Muscle Fuel SourceFuel Source
Chapter 4
Copyright ©2009 The McGraw-Hill Companies, Inc. All Rights Reserved.
Factors Governing Fuel Selection
Sources of Protein During ExerciseSources of Protein During Exercise
• Proteins broken down into amino acids– Muscle can directly metabolize branch chain
amino acids and alanine– Liver can convert alanine to glucose
• Only a small contribution (~2%) to total energy production during exercise– May increase to 5–10% late in prolonged-
duration exercise
Chapter 4
Copyright ©2009 The McGraw-Hill Companies, Inc. All Rights Reserved.
Factors Governing Fuel Selection
Lactate as a Fuel Source During ExerciseLactate as a Fuel Source During Exercise
• Can be used as a fuel source by skeletal muscle and the heart– Converted to acetyl-CoA and enters Krebs
cycle
• Can be converted to glucose in the liver– Cori cycle
• Lactate shuttle– Lactate produced in one tissue and
transported to another
Chapter 4
Copyright ©2009 The McGraw-Hill Companies, Inc. All Rights Reserved.
A Closer Look 4.4A Closer Look 4.4The Cori Cycle: Lactate as a Fuel SourceThe Cori Cycle: Lactate as a Fuel Source
• Lactic acid produced by skeletal muscle is transported to the liver
• Liver converts lactate to glucose– Gluconeogenesis
• Glucose is transported back to muscle and used as a fuel
Factors Governing Fuel Selection

Chapter 4
Copyright ©2009 The McGraw-Hill Companies, Inc. All Rights Reserved.
The Cori Cycle: Lactate As a Fuel SourceThe Cori Cycle: Lactate As a Fuel Source
Factors Governing Fuel Selection
Figure 4.17

Chapter 4
Copyright ©2009 The McGraw-Hill Companies, Inc. All Rights Reserved.
In SummaryIn Summary
The regulation of fuel selection during exercise is under complex control and is dependent upon several factors, including diet and the intensity and duration of exercise.
In general, carbohydrates are used as the major fuel source during high-intensity exercise.
During prolonged exercise, there is a gradual shift from carbohydrate metabolism toward fat metabolism.
Proteins contribute less than 2% of the fuel used during exercise of less than one hour’s duration. During prolonged exercise (i.e., three to five hours’ duration), the total contribution of protein to the fuel supply may reach 5% to 10% during the final minutes of prolonged work.
Factors Governing Fuel Selection

Chapter 4
Copyright ©2009 The McGraw-Hill Companies, Inc. All Rights Reserved.
Quantifying Body Fuel SourcesQuantifying Body Fuel Sources
Factors Governing Fuel Selection