scottish borders child poverty action plan introduction · although the greatest impact on child...
TRANSCRIPT
1
SCOTTISH BORDERS CHILD POVERTY ACTION PLAN
Introduction
The Child Poverty (Scotland) Act 2017 sets out the Scottish Government’s statement of intent to eradicate child
poverty in Scotland by 2030.
The national Child Poverty Delivery Plan 2018-2022, Every Child, Every Chance recognises that poverty comes
about as a result of three main drivers: household income, living costs, social security arrangements. The
Delivery Plan takes these three drivers as the focus for action. It also recognizes the importance of
preventative measures to improve children's quality of life and help families manage the impacts of poverty.
Even if these actions have no immediate impact on the targets, building children's resilience in the face of
poverty and other adversity is expected boost their long-term outcomes.
Although the greatest impact on child poverty will occur through nationally set policies and strategies, it is
recognised that local agencies and communities have much to contribute to achieving the outcomes desired.
As a result, the Act requires local authorities and Health Boards to prepare a Local Child Poverty Action Plan
Report. Annual progress reports, the first of which is due June 2019, are expected to describe activities
undertaken and planned locally to contribute towards the child poverty targets set out in the Act.
This Local Action Plan for Scottish Borders outlines the challenges faced, how this plan links to existing activity,
what we are committed to delivering over the 2018/19 financial year and areas we would like to develop
further in the future. We recognise that partnership is key to the achievement of the outcomes we want for
our children, young people and families in Scottish Borders.
National Context and Targets
After housing costs, data for the period 2015-18 suggests 240,000 children were living in poverty in Scotland.
This is equivalent to one in every four children. In Scotland, around 7 in 10 children living in poverty live in a
household where at least one adult is working, and 10% of children are living in persistent poverty (living in
poverty in 3 of the last 4 years)1.
1 Source: Scottish Government (2018) Poverty and Income Inequality: 2014-17
2
To address child poverty in Scotland, the Scottish Government has set itself ambitious targets to reduce
poverty by 2030. The four key measurements, after housing costs (AHC) are as follows:
less than 10% of children live in relative poverty (relative poverty is less than 60% of average UK
household income for the year taking account of the size and composition of the household)
less than 5% of children live in absolute poverty (absolute poverty is less than 60% of average UK
household income for the financial year beginning 1 April 2010)
less than 5% of children live in combined low income and material deprivation (low income is defined
as less than 70% of average UK household income for the year, material deprivation is when families
are unable to afford three or more items out of a list of basic necessities)
less than 5% of children live in persistent poverty (persistent poverty is where a child has lived in
relative poverty for three out of the last four years).
The most up to date national figures 2 for these 4 targets are:
In 2016/17 an estimated 23% of children were in relative poverty
In 2016/17 an estimated 20% of children were in absolute poverty
In 2016/17 an estimated 11% of children were in combined low income and material deprivation
In (2012 to) 2016 an estimated 10% of children were in persistent poverty
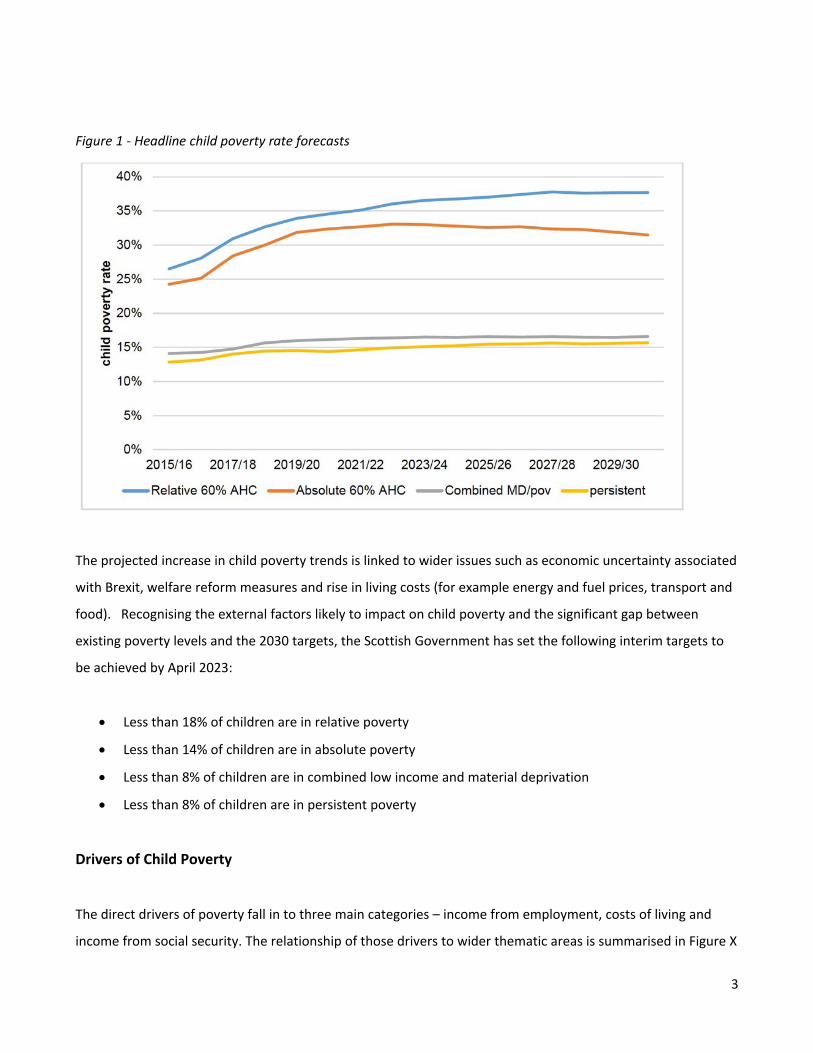
Without intervention and mitigation at both a national and local level, Figure 1 2 forecasts that child poverty
will increase across all 4 measures to 2030 and affect one in three children.
http://www.gov.scot/Publications/2018/03/3017
2 https://www.gov.scot/Resource/0053/00533142.pdf
3
Figure 1 - Headline child poverty rate forecasts
The projected increase in child poverty trends is linked to wider issues such as economic uncertainty associated
with Brexit, welfare reform measures and rise in living costs (for example energy and fuel prices, transport and
food). Recognising the external factors likely to impact on child poverty and the significant gap between
existing poverty levels and the 2030 targets, the Scottish Government has set the following interim targets to
be achieved by April 2023:
Less than 18% of children are in relative poverty
Less than 14% of children are in absolute poverty
Less than 8% of children are in combined low income and material deprivation
Less than 8% of children are in persistent poverty
Drivers of Child Poverty
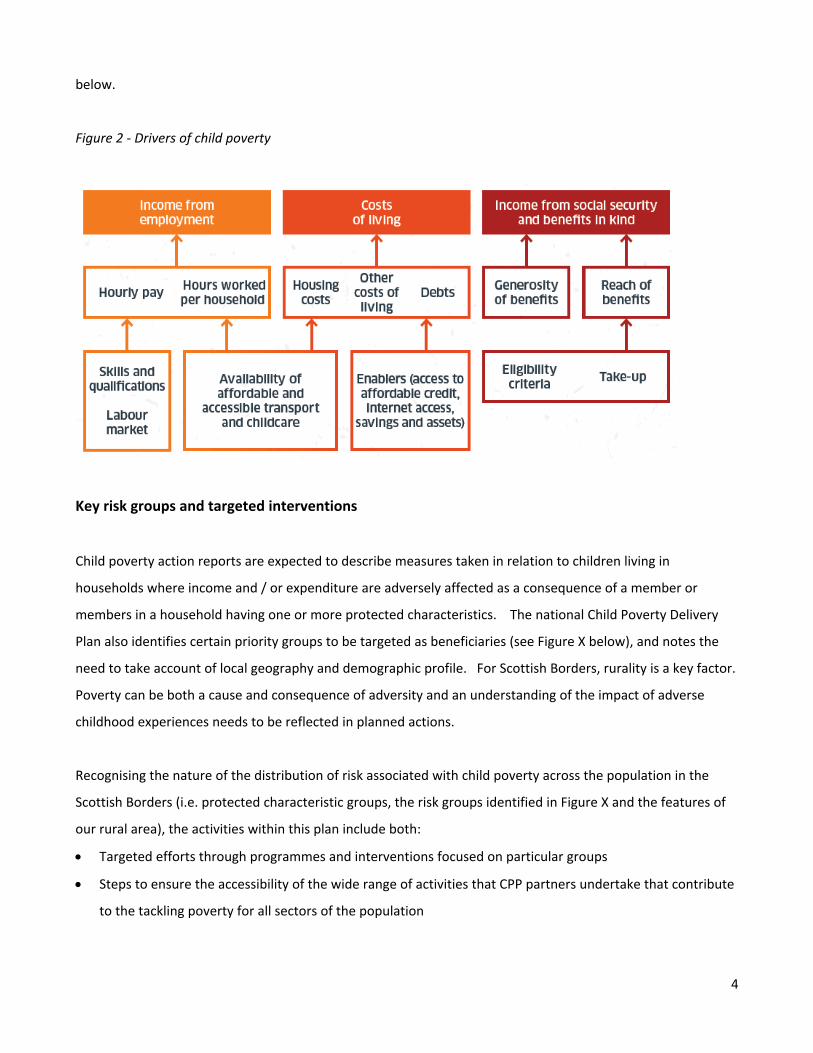
The direct drivers of poverty fall in to three main categories – income from employment, costs of living and
income from social security. The relationship of those drivers to wider thematic areas is summarised in Figure X
4
below.
Figure 2 - Drivers of child poverty
Key risk groups and targeted interventions
Child poverty action reports are expected to describe measures taken in relation to children living in
households where income and / or expenditure are adversely affected as a consequence of a member or
members in a household having one or more protected characteristics. The national Child Poverty Delivery
Plan also identifies certain priority groups to be targeted as beneficiaries (see Figure X below), and notes the
need to take account of local geography and demographic profile. For Scottish Borders, rurality is a key factor.
Poverty can be both a cause and consequence of adversity and an understanding of the impact of adverse
childhood experiences needs to be reflected in planned actions.
Recognising the nature of the distribution of risk associated with child poverty across the population in the
Scottish Borders (i.e. protected characteristic groups, the risk groups identified in Figure X and the features of
our rural area), the activities within this plan include both:
Targeted efforts through programmes and interventions focused on particular groups
Steps to ensure the accessibility of the wide range of activities that CPP partners undertake that contribute
to the tackling poverty for all sectors of the population

5
Figure 3 - Nationally identified priority groups at high risk of poverty
Child Poverty in Scottish Borders Local context
Scottish Borders faces some significant economic challenges that in turn affect family income and prospects.
The structure of the economy locally is predicated on a heavy reliance on the public sector, manufacturing,
farming and service industries. This means that many jobs tend to be lower paid than in other areas of
Scotland (who benefit from sectors such as finance and media). Gross Value Added (GVA) is an economic
measure used to show the monetary value for the amount of goods and services that have been produced/
provided in an area - the higher the value of the goods and services, the higher the GVA. The difference
between Borders and many other regions in Scotland can be seen below:
Figure 4 - Gross Value Added (GVA), Regional Comparison 2024 (£million, constant 2013 prices)3
3 Source: Skills Development Scotland, Oxford Economics analysis

6
2,2082,865
4,1576,4426,488
7,2878,125
9,49211,762
14,54319,466
24,24725,141
0 5,000 10,000 15,000 20,000 25,000 30,000
BordersDumfries and Galloway
West LothianForth Valley
AyrshireFife
West RegionTayside
Highlands and IslandsLanarkshire
Aberdeen City & ShireEdinburgh, East and Midlothian
Glasgow Region
As a consequence of the types of jobs available, median full-time gross weekly earnings (by place of work) in
the Scottish Borders continue to lag behind Scotland at £467 compared to £526 (Annual Survey of Hours and
Earnings, April 2017) and are the fourth lowest in Scotland. This has been the case for some time (see figure
below) and has obvious impacts on children and families, with many families in the Borders who have two
parents in full time employment, ‘just getting by’.
Figure 5- Workplace based gross median weekly pay 1997 to 2015, Nomis
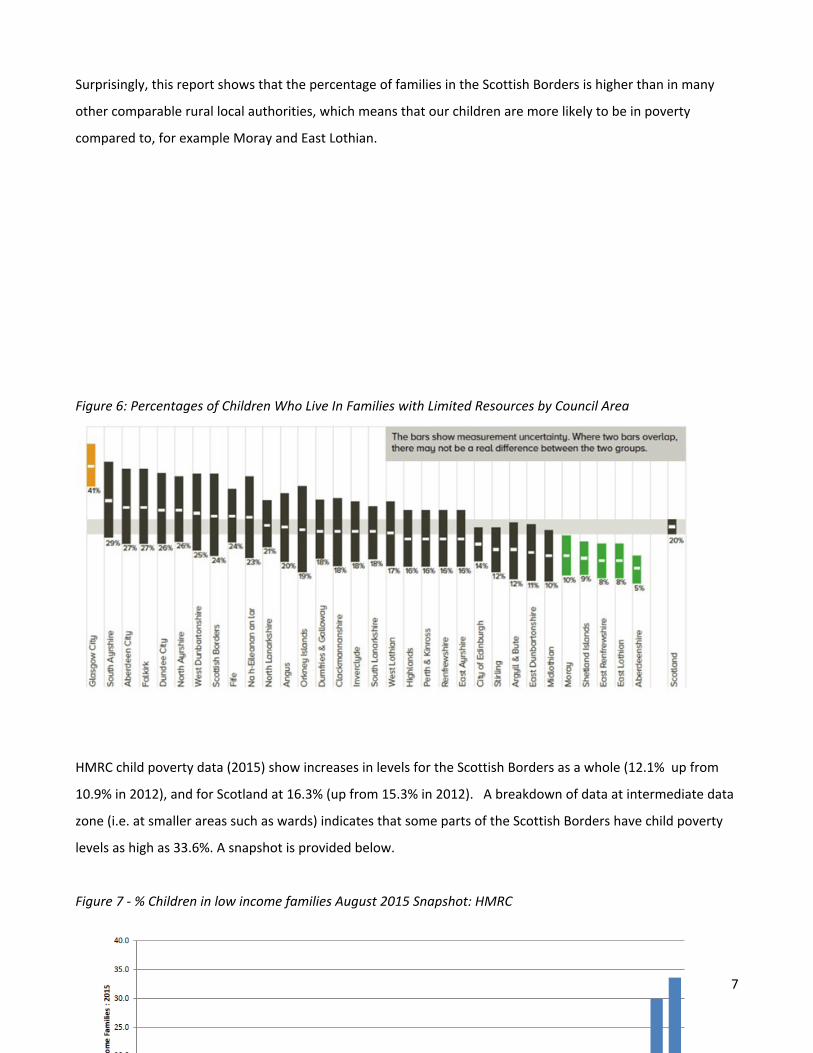
A recent Scottish Government report entitled ‘Children in families with limited resources 2014 - 2016’ shows
that 24% of children in the Scottish Borders live in families with limited resources (see graph below).
7
Surprisingly, this report shows that the percentage of families in the Scottish Borders is higher than in many
other comparable rural local authorities, which means that our children are more likely to be in poverty
compared to, for example Moray and East Lothian.
Figure 6: Percentages of Children Who Live In Families with Limited Resources by Council Area
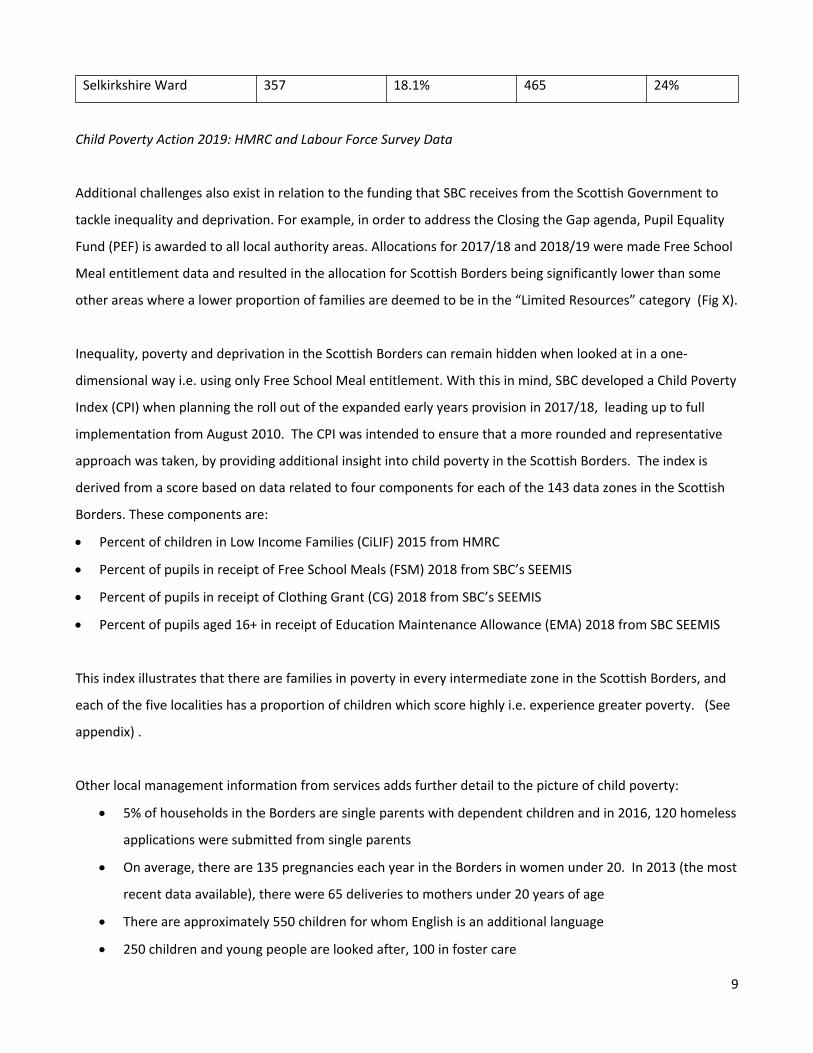
HMRC child poverty data (2015) show increases in levels for the Scottish Borders as a whole (12.1% up from
10.9% in 2012), and for Scotland at 16.3% (up from 15.3% in 2012). A breakdown of data at intermediate data
zone (i.e. at smaller areas such as wards) indicates that some parts of the Scottish Borders have child poverty
levels as high as 33.6%. A snapshot is provided below.
Figure 7 - % Children in low income families August 2015 Snapshot: HMRC

8
Figure8: Child poverty levels after housing costs in 2018
Local Authority Number of
children
% of children Number of
children
% of
children
Scottish Borders 4390 18.5% 5903 25%
Ward
Tweeddale West Ward Number of
children
% of children Number of
children
% of
children
Galashiels and District
Ward
211 14.2% 247 17%
East Berwickshire Ward 762 25.3% 973 32%
Hawick and Hermitage
Ward
324 17.2% 497 26%
Mid Berwickshire Ward 226 17.0% 331 25%
Kelso and District Ward 409 17.8% 628 27%
Jedburgh and District Ward 298 15.6% 474 25%
Leaderdale and 296 17.5% 429 25%
Melrose Ward 415 17.5% 424 18%
Tweeddale East Ward 593 16.6% 649 18%
Hawick and Denholm Ward 532 23.7% 766 34%
9
Selkirkshire Ward 357 18.1% 465 24%
Child Poverty Action 2019: HMRC and Labour Force Survey Data
Additional challenges also exist in relation to the funding that SBC receives from the Scottish Government to
tackle inequality and deprivation. For example, in order to address the Closing the Gap agenda, Pupil Equality
Fund (PEF) is awarded to all local authority areas. Allocations for 2017/18 and 2018/19 were made Free School
Meal entitlement data and resulted in the allocation for Scottish Borders being significantly lower than some
other areas where a lower proportion of families are deemed to be in the “Limited Resources” category (Fig X).
Inequality, poverty and deprivation in the Scottish Borders can remain hidden when looked at in a one-
dimensional way i.e. using only Free School Meal entitlement. With this in mind, SBC developed a Child Poverty
Index (CPI) when planning the roll out of the expanded early years provision in 2017/18, leading up to full
implementation from August 2010. The CPI was intended to ensure that a more rounded and representative
approach was taken, by providing additional insight into child poverty in the Scottish Borders. The index is
derived from a score based on data related to four components for each of the 143 data zones in the Scottish
Borders. These components are:
Percent of children in Low Income Families (CiLIF) 2015 from HMRC
Percent of pupils in receipt of Free School Meals (FSM) 2018 from SBC’s SEEMIS
Percent of pupils in receipt of Clothing Grant (CG) 2018 from SBC’s SEEMIS
Percent of pupils aged 16+ in receipt of Education Maintenance Allowance (EMA) 2018 from SBC SEEMIS
This index illustrates that there are families in poverty in every intermediate zone in the Scottish Borders, and
each of the five localities has a proportion of children which score highly i.e. experience greater poverty. (See
appendix) .
Other local management information from services adds further detail to the picture of child poverty:
5% of households in the Borders are single parents with dependent children and in 2016, 120 homeless
applications were submitted from single parents
On average, there are 135 pregnancies each year in the Borders in women under 20. In 2013 (the most
recent data available), there were 65 deliveries to mothers under 20 years of age
There are approximately 550 children for whom English is an additional language
250 children and young people are looked after, 100 in foster care

10
Linkage with other strategic plans and priorities in Scottish Borders
The Scottish Borders Community Plan (known under the Community Empowerment Act as a Local Outcomes
Improvement Plan) is based around four themes:
1. Our Economy, Skills and Learning: How do we build and improve our economy, skills and learning?
2. Our Health, Care & Wellbeing: How do we promote and improve our health, care and wellbeing?
3. Our Quality of Life: How do we protect and improve our quality of life?
4. Our Place: How do we develop and improve our place?
A key priority for the CPP within the Community Plan is reducing inequalities i.e. closing the gap between our
least and most disadvantaged in our communities. The priorities in the integrated Children and Young
People’s Plan 2018 – 21 are:
Figure 9: Priorities in Children and Young People’s Plan
PRIORITY 1Keeping children and young people safe
OUTCOMEMore children and young people will be protected from abuse, harm or neglect and will be living in a supportive environment, feeling secure and cared for.
PRIORITY 2Improving health and well-being and reducing inequalities
OUTCOMEInequalities in the health and wellbeing of young people are reduced
PRIORITY 3Targeting support to maximise life experiences and opportunities and ensuring inclusion
OUTCOMELife experiences and opportunities are improved for children and young people who require our targeted support
PRIORITY 4Increasing participation and engagement
OUTCOMEAll our children and young people will be encouraged to be involved in
the planning, provision and delivery of services and their rights
respected
The Reducing Inequalities Delivery Team, chaired by the Service Director Children & Young People, is
committed to taking an early intervention and prevention approach across the four community planning
themes.
Monitoring and reporting
11
The Child Poverty Action Planning process relates directly to the work of the Community Planning Partnership
and the integrated children’s services planning. Progress of the Child Poverty Local Action Plan will be
monitored through a multi agency planning group and reported through the CPP. The reporting cycle aligned
with the reporting on the Integrated CYP Plan.
Monitoring will be aligned with the indicator set currently in development for local use through the
Improvement Service. This set includes indicators on: the local context (egg % children in low income
families); key drivers (egg % employees earning less than the Living Wage); and people ( e.g. % of adults
reporting a long term physical or mental health problem – household with children).
Current and planned activity to address child poverty in Scottish Borders
In developing this plan we recognise that partners are already undertaking a wide range of activities and
delivering projects to prevent or mitigate the impact of child poverty. Table 1 outlines the main current areas
of activity in 2018 – 19.
Table 2 sets out the actions we plan to take in the 2019 /20. Both the local authority and NHS Borders are
required to report on income maximisation measures taken in the area to provide pregnant women and
families with children with information, advice and assistance about eligibility for financial support; and
assistance to apply for financial support. This includes work by the NHS Borders and partners to embed
financial inclusion referral pathways in health care settings, as well as other settings.
12
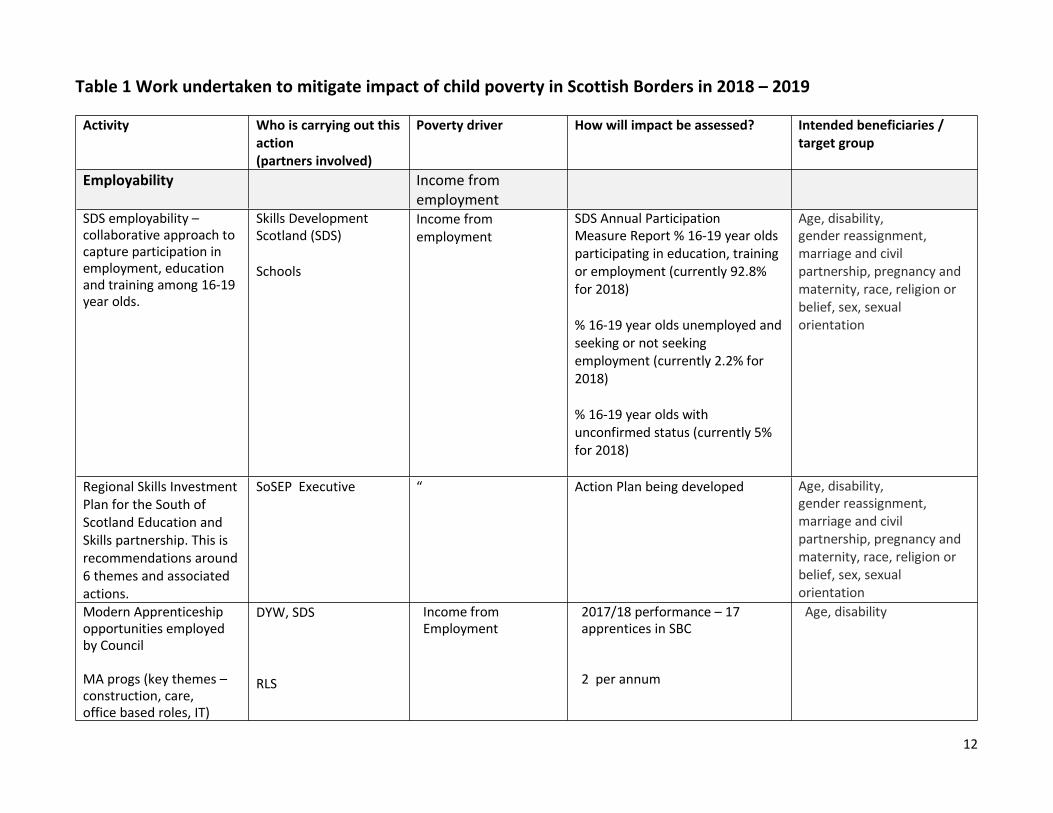
Table 1 Work undertaken to mitigate impact of child poverty in Scottish Borders in 2018 – 2019
Activity Who is carrying out this action(partners involved)
Poverty driver How will impact be assessed? Intended beneficiaries / target group
Employability Income from employment
SDS employability – collaborative approach to capture participation in employment, education and training among 16-19 year olds.
Skills DevelopmentScotland (SDS)
Schools
Income from employment
SDS Annual ParticipationMeasure Report % 16-19 year olds participating in education, training or employment (currently 92.8% for 2018)
% 16-19 year olds unemployed and seeking or not seeking employment (currently 2.2% for 2018)
% 16-19 year olds with unconfirmed status (currently 5% for 2018)
Age, disability,gender reassignment, marriage and civil partnership, pregnancy and maternity, race, religion or belief, sex, sexual orientation
Regional Skills Investment Plan for the South of Scotland Education and Skills partnership. This is recommendations around 6 themes and associated actions.
SoSEP Executive “ Action Plan being developed Age, disability,gender reassignment, marriage and civil partnership, pregnancy and maternity, race, religion or belief, sex, sexual orientation
Modern Apprenticeship opportunities employed by Council
MA progs (key themes – construction, care, office based roles, IT)
DYW, SDS
RLS
Income from Employment
2017/18 performance – 17 apprentices in SBC
2 per annum
Age, disability
13
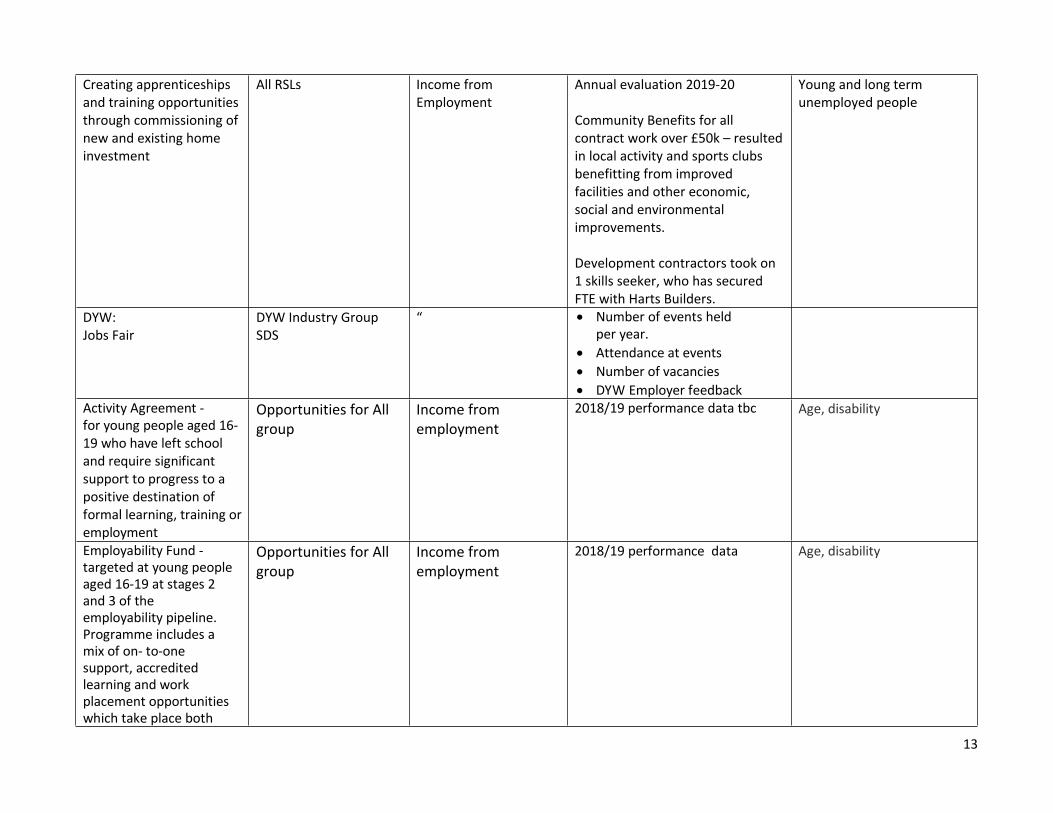
Creating apprenticeships and training opportunities through commissioning of new and existing home investment
All RSLs
Income from Employment
Annual evaluation 2019-20 Community Benefits for all contract work over £50k – resulted in local activity and sports clubs benefitting from improved facilities and other economic, social and environmental improvements. Development contractors took on 1 skills seeker, who has secured FTE with Harts Builders.
Young and long term unemployed people
DYW:Jobs Fair
DYW Industry GroupSDS
“ Number of events heldper year.
Attendance at events Number of vacancies DYW Employer feedback
Activity Agreement -for young people aged 16-19 who have left school and require significant support to progress to a positive destination of formal learning, training or employment
Opportunities for All group
Income from employment
2018/19 performance data tbc Age, disability
Employability Fund - targeted at young people aged 16-19 at stages 2 and 3 of the employability pipeline. Programme includes a mix of on- to-one support, accredited learning and work placement opportunities which take place both
Opportunities for All group
Income from employment
2018/19 performance data Age, disability
14
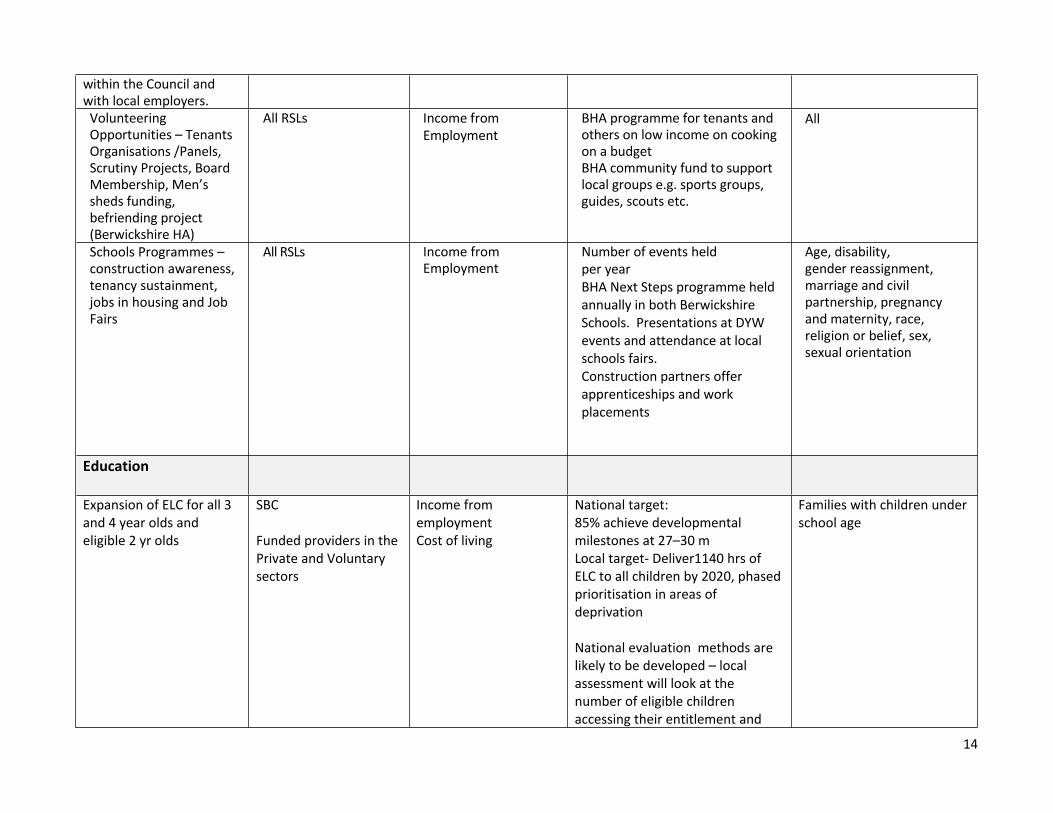
within the Council and with local employers.
Volunteering Opportunities – Tenants Organisations /Panels, Scrutiny Projects, Board Membership, Men’s sheds funding, befriending project (Berwickshire HA)
All RSLs Income fromEmployment
BHA programme for tenants and others on low income on cooking on a budgetBHA community fund to support local groups e.g. sports groups, guides, scouts etc.
All
Schools Programmes – construction awareness, tenancy sustainment, jobs in housing and Job Fairs
All RSLs Income from Employment
Number of events heldper yearBHA Next Steps programme held annually in both Berwickshire Schools. Presentations at DYW events and attendance at local schools fairs.Construction partners offer apprenticeships and work placements
Age, disability,gender reassignment, marriage and civil partnership, pregnancy and maternity, race, religion or belief, sex, sexual orientation
Education
Expansion of ELC for all 3 and 4 year olds and eligible 2 yr olds
SBC
Funded providers in the Private and Voluntary sectors
Income from employment Cost of living
National target:85% achieve developmental milestones at 27–30 mLocal target- Deliver1140 hrs of ELC to all children by 2020, phased prioritisation in areas of deprivation
National evaluation methods are likely to be developed – local assessment will look at the number of eligible children accessing their entitlement and
Families with children under school age
15
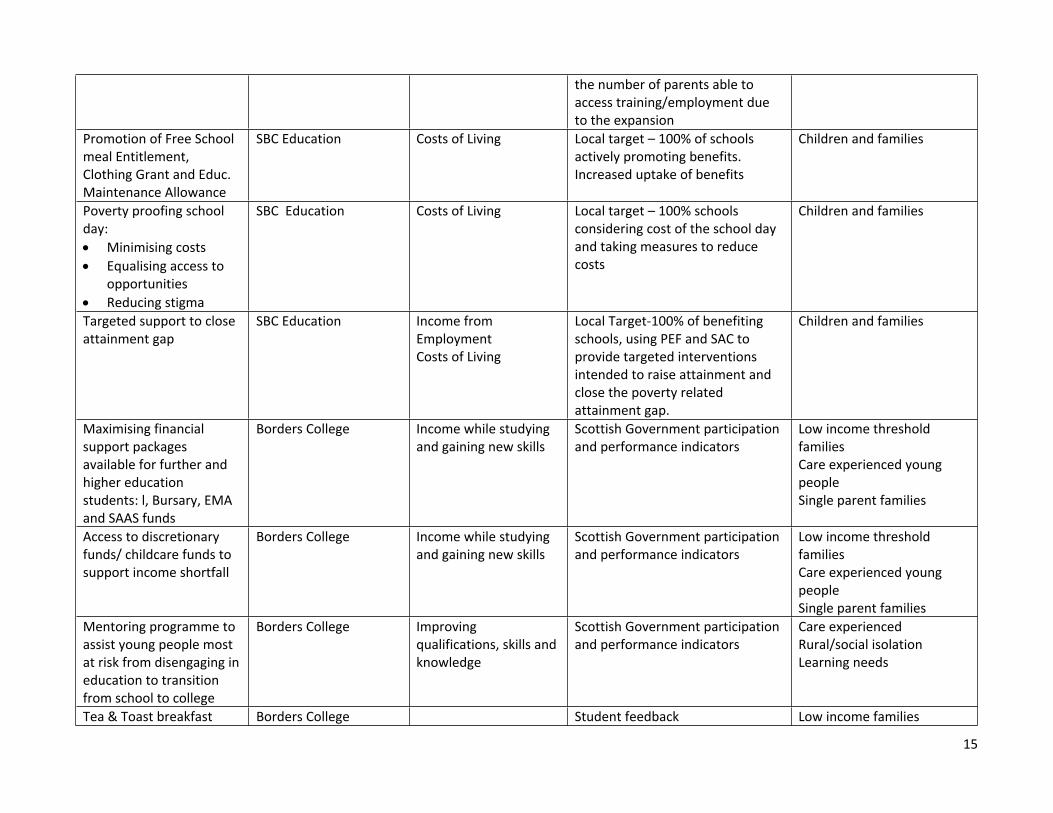
the number of parents able to access training/employment due to the expansion
Promotion of Free School meal Entitlement, Clothing Grant and Educ. Maintenance Allowance
SBC Education Costs of Living Local target – 100% of schools actively promoting benefits. Increased uptake of benefits
Children and families
Poverty proofing school day: Minimising costs Equalising access to
opportunities Reducing stigma
SBC Education Costs of Living Local target – 100% schools considering cost of the school day and taking measures to reduce costs
Children and families
Targeted support to close attainment gap
SBC Education Income from EmploymentCosts of Living
Local Target-100% of benefiting schools, using PEF and SAC to provide targeted interventions intended to raise attainment and close the poverty related attainment gap.
Children and families
Maximising financial support packages available for further and higher education students: l, Bursary, EMA and SAAS funds
Borders College Income while studying and gaining new skills
Scottish Government participation and performance indicators
Low income threshold familiesCare experienced young peopleSingle parent families
Access to discretionary funds/ childcare funds to support income shortfall
Borders College Income while studying and gaining new skills
Scottish Government participation and performance indicators
Low income threshold familiesCare experienced young peopleSingle parent families
Mentoring programme to assist young people most at risk from disengaging in education to transition from school to college
Borders College Improving qualifications, skills and knowledge
Scottish Government participation and performance indicators
Care experiencedRural/social isolationLearning needs
Tea & Toast breakfast Borders College Student feedback Low income families
16
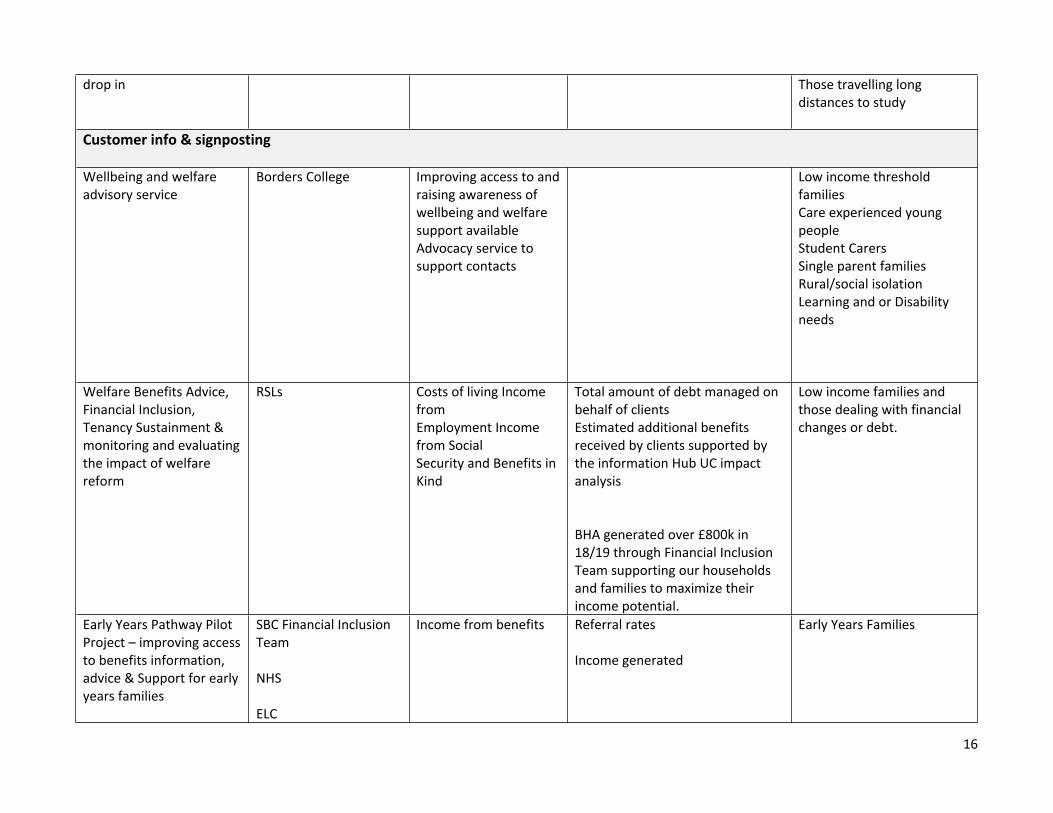
drop in Those travelling long distances to study
Customer info & signposting
Wellbeing and welfare advisory service
Borders College Improving access to and raising awareness of wellbeing and welfare support availableAdvocacy service to support contacts
Low income threshold familiesCare experienced young peopleStudent CarersSingle parent familiesRural/social isolationLearning and or Disability needs
Welfare Benefits Advice, Financial Inclusion, Tenancy Sustainment & monitoring and evaluating the impact of welfare reform
RSLs Costs of living Income fromEmployment Income from SocialSecurity and Benefits inKind
Total amount of debt managed on behalf of clientsEstimated additional benefits received by clients supported by the information Hub UC impact analysis
BHA generated over £800k in 18/19 through Financial Inclusion Team supporting our households and families to maximize their income potential.
Low income families and those dealing with financial changes or debt.
Early Years Pathway Pilot Project – improving access to benefits information, advice & Support for early years families
SBC Financial Inclusion Team
NHS
ELC
Income from benefits Referral rates
Income generated
Early Years Families

17
Early Years Assistant alert new mothers and expectant mothers to their benefit entitlement at each stage during their journey from pregnancy to parenthood.
SBC Financial Inclusion Team
Income from benefits Income generated Early Years Families
Scottish Welfare Fund Awareness Sessions
SBC Scottish Welfare Fund Team Leader
Cost of livingTenancy sustainability
SG Return Low income individuals & families
Increase awareness and training for CASS front line staff in relation to the advice and assistance available for benefit advice in the early years.
SBC Income from benefits Early Years Families
Home Energy Advice & Effective referrals
Home Energy Forum (SBC, All RSLs, Changeworks & Energy Saving Trust
Cost of livingIncome from benefits
Annual report by HEF & referral numbers captured across housing tenures.
All with some targeting through key frontline services
Support to Refugees/minority ethnicfamilies resettled in Scottish Borders
SBHA, Waverley and Eildon
Cost of living Referral numberscaptured
Race and religion
Housing
Assessment of the Housing Needs and Aspirations of Young People to inform the development of an Action Plan
LHS Partnership Group (SBC/RSLs/H&SC)
Cost of living Action plan to address identified needs and priorities
LHS Annual Progress and Monitoring Report
All young people aged between 16-34
Development of the Rapid Re-Housing Transition
Borders Homelessness and Health Strategic
Cost of living Annual Reporting against KPIs established in the Action Plan
All, particularly those at risk of Homelessness
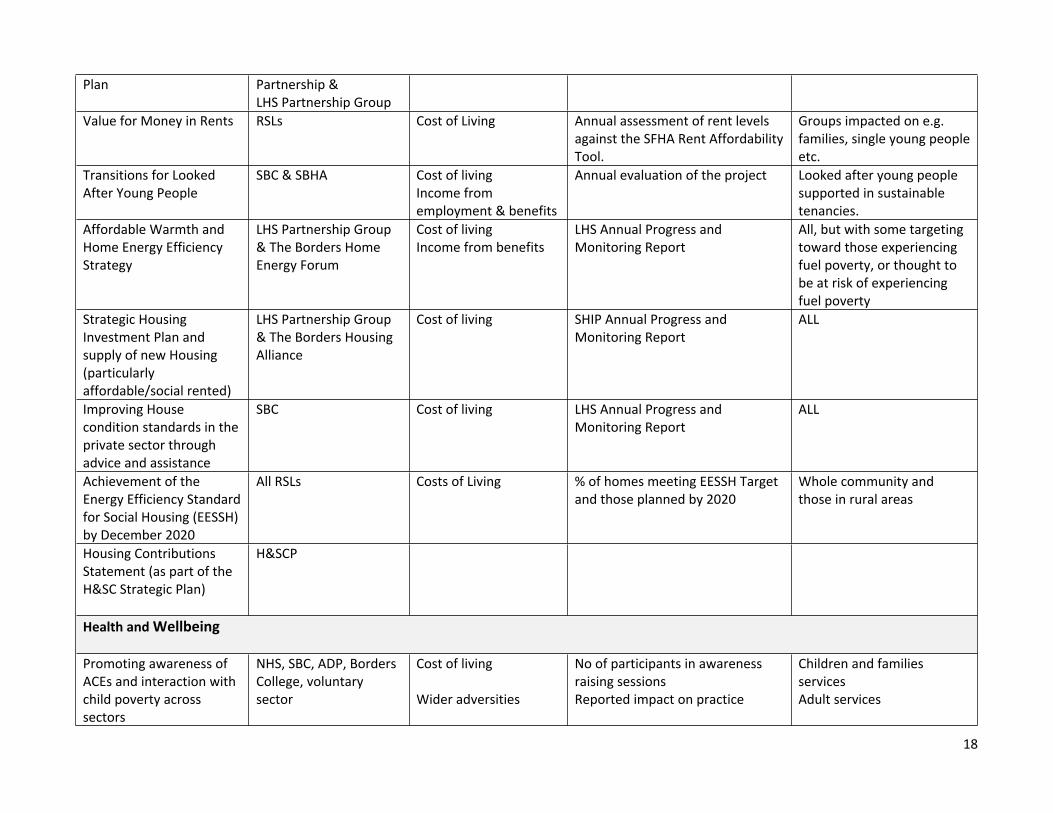
18
Plan Partnership &LHS Partnership Group
Value for Money in Rents RSLs Cost of Living Annual assessment of rent levels against the SFHA Rent Affordability Tool.
Groups impacted on e.g. families, single young people etc.
Transitions for Looked After Young People
SBC & SBHA Cost of livingIncome from employment & benefits
Annual evaluation of the project Looked after young people supported in sustainable tenancies.
Affordable Warmth and Home Energy Efficiency Strategy
LHS Partnership Group & The Borders Home Energy Forum
Cost of livingIncome from benefits
LHS Annual Progress and Monitoring Report
All, but with some targeting toward those experiencing fuel poverty, or thought to be at risk of experiencing fuel poverty
Strategic Housing Investment Plan and supply of new Housing (particularly affordable/social rented)
LHS Partnership Group & The Borders Housing Alliance
Cost of living SHIP Annual Progress and Monitoring Report
ALL
Improving House condition standards in the private sector through advice and assistance
SBC Cost of living LHS Annual Progress and Monitoring Report
ALL
Achievement of the Energy Efficiency Standard for Social Housing (EESSH) by December 2020
All RSLs Costs of Living % of homes meeting EESSH Target and those planned by 2020
Whole community and those in rural areas
Housing Contributions Statement (as part of the H&SC Strategic Plan)
H&SCP
Health and Wellbeing
Promoting awareness of ACEs and interaction with child poverty across sectors
NHS, SBC, ADP, Borders College, voluntary sector
Cost of living
Wider adversities
No of participants in awareness raising sessions Reported impact on practice
Children and families servicesAdult services
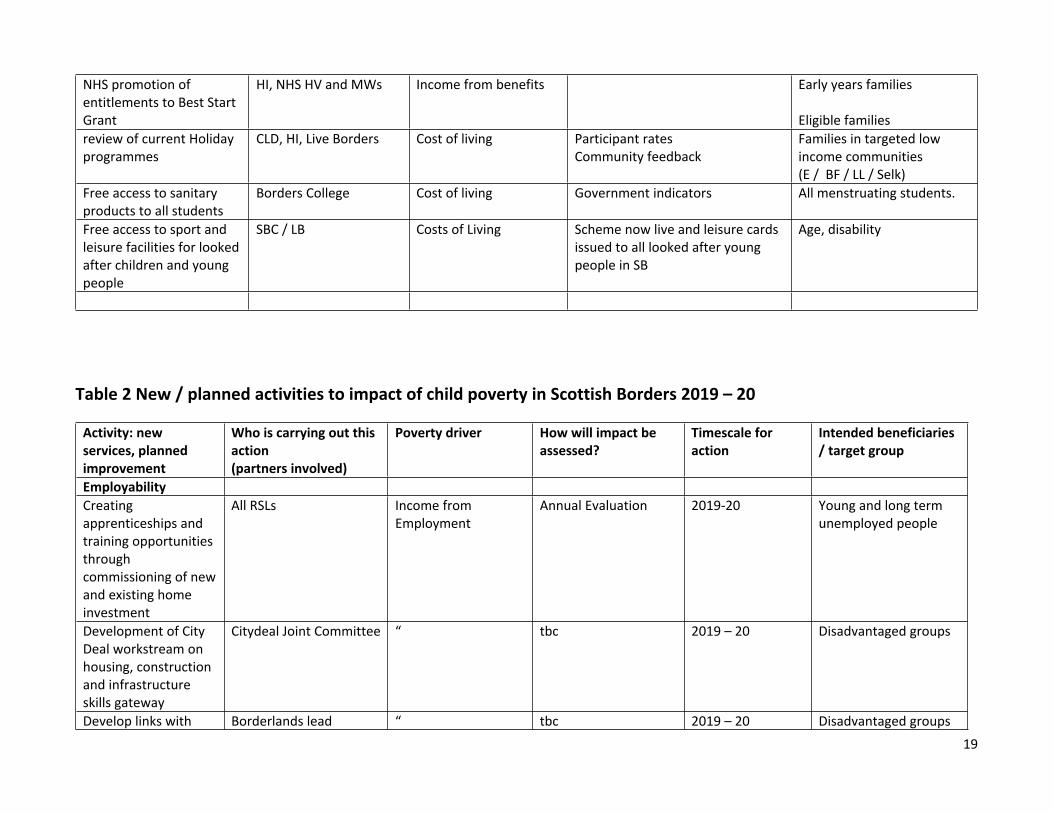
19
NHS promotion of entitlements to Best Start Grant
HI, NHS HV and MWs Income from benefits Early years families
Eligible familiesreview of current Holiday programmes
CLD, HI, Live Borders Cost of living Participant ratesCommunity feedback
Families in targeted low income communities(E / BF / LL / Selk)
Free access to sanitary products to all students
Borders College Cost of living Government indicators All menstruating students.
Free access to sport and leisure facilities for looked after children and young people
SBC / LB Costs of Living Scheme now live and leisure cards issued to all looked after young people in SB
Age, disability
Table 2 New / planned activities to impact of child poverty in Scottish Borders 2019 – 20
Activity: new services, planned improvement
Who is carrying out this action(partners involved)
Poverty driver How will impact be assessed?
Timescale for action
Intended beneficiaries / target group
Employability Creating apprenticeships and training opportunities through commissioning of new and existing home investment
All RSLs Income from Employment
Annual Evaluation 2019-20 Young and long term unemployed people
Development of City Deal workstream on housing, construction and infrastructure skills gateway
Citydeal Joint Committee “ tbc 2019 – 20 Disadvantaged groups
Develop links with Borderlands lead “ tbc 2019 – 20 Disadvantaged groups

20
relevant Borderslands programmes Education Free access to sanitary products in schools and SBC workplaces
SBC Cost of living SG return Local Target-100% of schools actively promoting benefits. Increased uptake of benefits.
Women and girls
Customer Info Signposting Easier and wider access to information, assistance and applications beyond free school meals and clothing grants, via increased digitalisation and self serve work programme.
SBC Cost of living / income from benefits
Uptake rates Ongoing all
Avoidance of digital exclusion via advice and training rolled out as part of the digitalisation and self serve work programme, and the widening of access via provision of the technology and equipment necessary to take advantage of digital options
SBC Cost of living / income from benefits
Ongoing all
Better signposting SBC Cost of living / Ongoing all

21
and cross cutting advice on related topics being included as part of consistent digital offering
income from benefits
Early Years Pathway Pilot Project – improving access to benefits information, advice & Support for early years families
SBC Financial Inclusion TeamNHS
Income from benefits Referral rates
Income generated
May/June 2019 Early years families
Scottish Welfare Fund Awareness Sessions
SBC Scottish Welfare Fund Team Leader
Cost of livingTenancy sustainability
SG Return Ongoing Low income individuals & families
Fareshare Food distribution project – reduce food insecurity. Looking at creation of two new food distribution hubs Hawick and Peebles.
SBC Fareshare
Reduce food insecurity
Ongoing Low income individuals & families
Promotion of CAB Financial Health Check service
SBCCAB
Income from benefits Ongoing All
Increase awareness and training for CASS front line staff in relation to the advice and assistance available for benefit advice in the early years.
SBC Income from benefits Ongoing Early Years Families
Mitigate the impact of Universal Credit through joint working,
SBC, RSLs and Third Sector
Cost of livingIncome from Benefits
??? 2019-20 Families and young people on low incomes

22
advice and supportHousing Deliver 209 new homes by 2021 (Berwickshire)
SBC and All RSLs Cost of living SHIP return 2019-21 All families and young people in housing need
Delivery of the Housing Needs and Aspirations of Young People five year Action Plan
LHS Partnership Group (SBC/RSLs/H&SC)
Cost of living LHS Annual Progress and Monitoring Report
tbc All young people aged between 16-34
Wheelchair Accessible Homes Study
Borders Housing Alliance(SBC/RSLs/H&SC)
Cost of living No. of wheelchair accessible homes
tbc People with disabilities that require wheelchair access
Implementing the Rapid Re-Housing Transition Plan
Borders Homelessness and Health Strategic Partnership &LHS Partnership Group
Cost of living Annual Reporting against KPIs established in the Action Plan
2019 - 21 All, particularly those at risk of Homelessness
The Regeneration of Beech Ave
Waverley Housing, Scottish Borders Council
Cost of Living More people living independently in affordable and sustainable homes;More people able to afford to heat their homes.
Refurbishment Programme – 2019/2020; Demolition and new build 2021 – 2024.
Waverley Housing tenants and families (existing and future).
Health and WellbeingImprovement of financial inclusion pathways: referral tools, improved monitoring, staff awareness and training
NHS
ELC
Income from benefits Referral rates
Income generated
Early years families
Coordination & development of Holiday programmes
CLD, HI, LB Costs of living No of progNo of Participants
2019 – 2020 Targeted communities
Expansion of access to PH, ELC, LB Costs of living tbc 2019 -20 Targeted young people
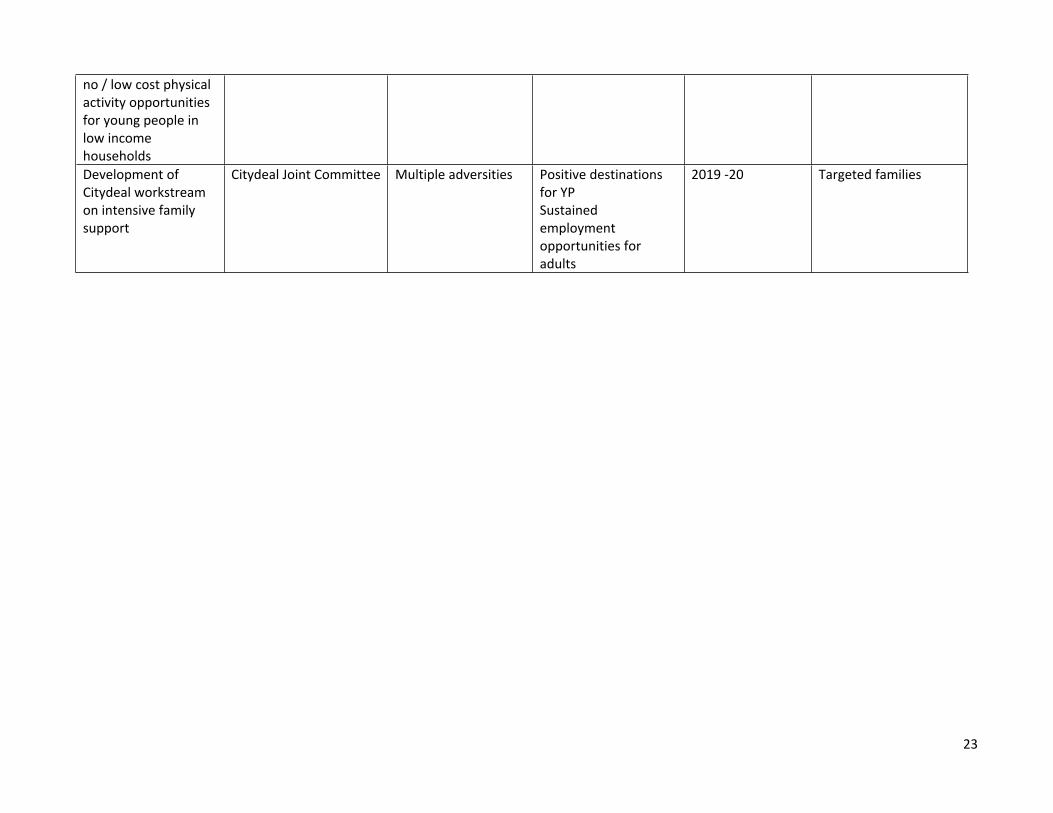
23
no / low cost physical activity opportunities for young people in low income householdsDevelopment of Citydeal workstream on intensive family support
Citydeal Joint Committee Multiple adversities Positive destinations for YP Sustained employment opportunities for adults
2019 -20 Targeted families
24
Appendix
Scottish Borders Child Poverty Index 2018
Child Poverty Index 2018.pdf