screen printing scheduling methodology - digitalcommons
TRANSCRIPT

Screen Printing Scheduling Methodology
A Senior Project
presented to
the Faculty of the Graphic Communication Department
California Polytechnic State University, San Luis Obispo
In Partial Ful!llment
of the Requirements for the Degree
Bachelor of Science
by
Brandon Wolfe & Kyle Naylor
May, 2010
© 2010 Brandon Wolfe, Kyle Naylor

Table of Contents
Abstract.................................................................................................................................................. 1
Chapter 1............................................................................................................................................... 2
Chapter 2............................................................................................................................................... 6
Chapter 3............................................................................................................................................... 13
Chapter 4............................................................................................................................................... 15
Chapter 5............................................................................................................................................... 20
Work Cited............................................................................................................................................ 22

Abstract
As the shi! towards o"shore business within the screen printing industry increases, American
businesses must #nd a way to remain competitive. Due to manufacturing costs and regulation it is
impossible for Americans to compete with the low per unit cost of foreign suppliers. By
decreasing the time to market, American businesses will be able to remain competitive and
recover lost business. In order to achieve this, a $exible scheduling model must be developed in
order to increase throughput of a production process. %is model serves to account for variables
and variances that occur within the screen printing process, allowing for e"ective continuation of
production.
1

Brandon Wolfe | Kyle Naylor
Screen Printing Scheduling Methodology
Chapter 1
In recent years the screen printing industry has experienced a continuous rise in the move
towards o"shore business. Due to low operating costs, foreign companies are able to o"er a low
per unit price, relative to domestic producers, to American businesses wanting to cut costs in an
uncertain economy. Due to labor laws and regulations, competing American businesses are
unable to contend with foreign pricing. %e shi! to o"shore is leaving many of these businesses
unable to survive in a competitive environment. In order to exist in the current business climate
screen printing businesses must remain competitive by o"ering customers bene#ts other than
that of price per unit.
Customers look for three elements when purchasing a product: cost, quality, and service. %e
general belief is that two of the three can be achieved at any one time. To remain competitive with
foreign business, American businesses can o"er the bene#ts of quality, and service, by decreasing
the time to market. If American businesses are unable to compete in price, quality and time to
market are alternatives that will allow them to retain customers. When purchasing from an
o"shore source, there is o!en a long lag time between purchasing and receiving the #nished
product. %e initial cost of the product is low. However, long deliveries and corrections can be
inconvenient. By o"ering quicker time to market and high quality product, businesses will be able
to ful#ll the needs of the customer.
2

%is study answers the question: How can a screen printing business increase throughput and
reduce time to market in order to remain competitive with foreign business? Research for this
study was conducted at Coudray Serigraphics in San Luis Obispo, Calif. under the supervision of
industry leader Mark Coudray. In order to increase throughput and reduce time to market, one
must alter the production scheduling methodology. %e traditional method of scheduling has
mainly used the Gantt Chart System. %e Gantt Chart is a visual reporting device used to convey
a project or a production process schedule. %e Gantt chart lays out the succession of events in a
visual manner and allows for the monitoring of individual activities within a project according to
a speci#ed plan. %e Gantt chart is based on an ideal production situation. Once something goes
wrong with the schedule, everything is thrown o" according to the %eory of Constraints. Due to
related rates, once something happens, there is a “domino e"ect” throughout the rest of the
schedule for the entire day, making it nearly impossible to recover from the incident. Using the
Gantt method leaves a schedule vulnerable to potential threats.
Traditional scheduling methods use a “Rear View Mirror” method of scheduling. Projects and
production plans are based on previous projects. With this type of hind-sight scheduling,
managers are looking to the past in order to plan for the future. %is history-based method of
scheduling prepares a process for what has happened, as opposed to what could or will happen.
In reality, it is necessary to anticipate according to trend lines, rather than base decisions on
previous occurrences.
Traditional scheduling methods lend themselves to a slow reaction time. A!er something has
occurred within a process, it is reported through the “grapevine” and eventually reaches upper
management. At this point, the problem is assessed and necessary action is taken in order to
correct whatever it was that went wrong or needed improving. %is process of recognizing and
3

addressing an issue could take days, weeks, or in some cases months to correct. At this rate, the
problem is not addressed in a timely manner, thus reducing the e"ectiveness of the report. Once a
problem is addressed, it is too late. In an ever changing business environment, reaction time is
key to maximizing the e&ciency and e"ectiveness of a process. %e Forward %inking Scheduling
Model is a lean, $exible scheduling method based on known ine&ciencies and independent and
dependent variables. %e method is an anticipatory method of scheduling that accounts for the
dynamic nature of processes and allows for the maintenance of job $ow in the event of an
occurrence that would normally throw a production schedule o".
William Edwards Deming stated that in order to control a process, it is key to move all variables
possible to the front of that process. Once variables are addressed at the front end, everything else
will fall in line. With regard to screen-printing for example, this may mean addressing problems
such as #le format issues and substrate issues before press, that way, the only variables le! are on-
press issues natural to the process.
%e scheduling method is a $exible activity based method of job scheduling. %is means the
model is $exible enough to account for any situation that arises. Regular job $ow is sequential
having one job a!er another, and in some cases parallel having multiple jobs running at the same
time in order to maximize e"ectiveness of equipment and boost OEE (overall equipment
e"ectiveness). In this model, as soon as something goes wrong, the process switches to $exible
scheduling in order to account for the situation and maintain job $ow. %is calls for the building
of bu"ers into a process to e&ciently substitute another job in the place of the stopped or pending
job. By moving a stopped job into a built in bu"er, jobs waiting in line can then move in taking
the place of the stopped job, maintaining job $ow, and avoiding a possible choke point. With
regard to screen-printing, this may mean keeping six colors on a fourteen-color press as
4

insurance. In the event of a screen break, two three-color jobs, or one #ve color job can then
move onto the press and begin production. %is allows for the necessary maintenance on the
downed job without stopping the press at all.
%e method also calls for a Future-Casting production process. %is is the ability to identify
warning signs that could lead to potential problems. By learning the underlying science to a
process, one will be able to identify irregularities and indicators that a process is going to go out
of variance. Once a process goes out of variance, it is likely that something will occur to halt
production. By recognizing and preventing these potential problems, one insures a high
probability of success for the particular process.
From an accounting standpoint, an activity based scheduling method may enable a business to
increase throughput and pro#t through costing based on activities rather than best-guess hourly
rates. By increasing throughput, the break even day can be moved earlier and earlier within a
month. Instead of reaching the break-even point at day 21, it may now be acquired at day 19.
A!er the break even day has been reached, everything else $ows to the bottom line. %is means
an increase in pro#t and capital.
%e purpose of this study is to establish a forward thinking, $exible scheduling model that will
facilitate the increase in throughput of a production process and decrease time to market. By
creating a scheduling model that is able to withstand potential threats, a production process will
become more e&cient. Businesses will be able to accommodate deadlines of customers while
delivering a quality product. In doing this, we believe businesses will be able to retain customers
who would otherwise look to o"shore business.
5

Screen Printing Scheduling Methodology
Chapter 2
“Screen printing is arguably the most versatile of all printing processes. It can be used to
print on a wide variety of substrates, including paper, paperboard, plastics, glass, metals,
fabrics, and many other materials. including paper, plastics, glass, metals, nylon and
cotton. Some common products from the screen printing industry include posters, labels,
decals, signage, and all types of textiles and electronic circuit boards. %e advantage of
screen-printing over other print processes is that the press can print on substrates of any
shape, thickness and size. A signi#cant characteristic of screen printing is that a greater
thickness of the ink can be applied to the substrate than is possible with other printing
techniques. %is allows for some very interesting e"ects that are not possible using other
printing methods. Because of the simplicity of the application process, a wider range of
inks and dyes are available for use in screen printing than for use in any other printing
process” (PNEAC).
Screen printing has evolved into a form of printing that has many applications. “Everything from
soda bottles, to T-shirts, to co"ee cups, and cars are all screen printed” (Pedretti). Screen printing
is a versatile printing process that has become a staple member of the graphic arts industry
(Coudray).
“Screen printing consists of three elements: the screen which is the image carrier; the
squeegee; and ink. %e screen printing process uses a porous mesh stretched tightly over a
frame made of wood or metal. Proper tension is essential to accurate color registration.
%e mesh is made of porous fabric or stainless steel mesh. A stencil is produced on the
6

screen either manually or photo-chemically. %e stencil de#nes the image to be printed in
other printing technologies this would be referred to as the image plate “(PNEAC).
“Screen printing ink is applied to the substrate by placing the screen over the material. Ink
with a paint-like consistency is placed onto the top of the screen. Ink is then forced
through the #ne mesh openings using a squeegee that is drawn across the screen, applying
pressure thereby forcing the ink through the open areas of the screen. Ink will pass
through only in areas where no stencil is applied, thus forming an image on the printing
substrate. %e diameter of the threads and the thread count of the mesh will determine
how much ink is deposited onto the substrates” (PNEAC).
“Many factors such as composition, size and form, angle, pressure, and speed of the blade
(squeegee) determine the quality of the impression made by the squeegee. At one time
most blades were made from rubber which, however, is prone to wear and edge nicks and
has a tendency to warp and distort. While blades continue to be made from rubbers such
as neoprene, most are now made from polyurethane which can produce as many as 25,000
impressions without signi#cant degradation of the image” (PNEAC).
“If the item was printed on a manual or automatic screen press the printed product will be placed
on a conveyor belt which carries the item into the drying oven or through the UV curing system.
Rotary screen presses feed the material through the drying or curing system automatically. Air
drying of certain inks, though rare in the industry, is still sometimes utilized. %e rate of screen
printing production was once dictated by the drying rate of the screen print inks. Do to
improvements and innovations the production rate has greatly increased. Some speci#c
7

innovations which a"ected the production rate and has also increased screen press popularity
include:
1. Development of automatic presses versus hand operated presses which have comparatively
slow production times.
2. Improved drying systems which signi#cantly improves production rate.
3. Development and improvement of U.V. curable ink technologies
4. Development of the rotary screen press which allows continuous operation of the press. %is
is one of the more recent technology developments” (PNEAC).
%e Gantt Chart was developed by Henry Gantt between 1910-1915. A Gantt chart is a graphical
representation of the duration of tasks against the progression of time. Gantt Chart is a
scheduling tool used to display the status of a project’s tasks. “A Gantt chart shows each task’s
duration as a horizontal line. %e ends of the lines correspond to the task’s start and end
dates” (Georgetown). %ere are some limitations when using the Gantt Chart. “Most of the Gantt
charts are analytically thin, too simple, and lack substantive detail. %e charts should be more
intense. At a minimum, the charts should be annotated--for example, with to-do lists at particular
points on the grid. Costs might also be included in appropriate cells of the table” (Tu!e). Gantt
Charts “encourages a one-step approach to planning. As a result of the presentation capabilities of
modern planning packages, the visual quality of color charts means that they gain an implicit
credibility. %is can result in sta" being unwilling to challenge the charts, and so they gain a
momentum all of their own. %irdly, they encourage the project manager to over-control the
project rather than devolve the responsibility for the time-plan to team members” (Maylor). In
most production processes there are potential constraints that can occur. If one of the screens
brakes during printing it will slow down the whole process. Everything comes to a halt until the
problem is #xed. %is will inevitably change when other jobs will be produced. %e Gantt chart
8

leaves you no bu"ers or $exibility to not only #x what’s going on, but at the same time continue
on with a di"erent job while the other one is being #xed (Coudray).
“A ‘related rates’ problem is a problem which involves at least two changing quantities and asks
you to #gure out the rate at which one is changing given su&cient information on all of the
others. For example, as two vehicles drive in di"erent directions we should be able to deduce the
speed at which they are separating if we know the individual speeds and directions” (Bogley).
Mark Coudray, owner and operator of Coudray Serigraphics in San Luis Obispo, Calif., describes
the screen printing process as involving a related rates based system. In the production process,
operations are sequential; therefore anything that occurs at one stage in the process will
inadvertently a"ect all following stages (Coudray). As soon as an event occurs at the beginning of
the production schedule for the day, the event has a domino e"ect on the rest of the schedule,
therefore throwing o" the initial plan. When this happens, the rest of the day is spent playing
“catch up” in order to recover from the event (Coudray).
In order to illustrate the e"ects of related rates, the screen printing process can be described using
a tra&c $ow model. %e production process is similar to that of the tra&c $ow on a freeway or
highway. As cars are traveling at a constant speed, all units are moving in relation to one another.
When an event occurs, in this case a tra&c accident, there is a domino e"ect throughout the rest
of the freeway. Cars in immediate proximity of the accident must slow to a stop in order to safely
pass the accident. %is slowing of the cars at the accident in turn causes the cars behind them to
slow and so on. An accident that occurs on the freeway a"ects the tra&c $ow a mile behind it due
to related rates. Just like the production process, it takes a long time to move the accident out of
the tra&c $ow and return to maximum speed (Coudray).
9

%e foundation for the scheduling methodology is the theory of constraints. In his 1986 book
entitled !e Goal, Eliyahu Goldratt #rst introduced the theory of constraints that was aimed at
helping organizations e"ectively achieve their goals (Goldratt). According to Robert Stein in his
book titled !e !eory of Constraints, “%e TOC, which is based on the natural laws that govern
every environment, seek to determine the underlying cause(s) of problems and to #nd the best
solutions” (Stein, 1). Any manageable system is limited by a small number of constraints, and
there is always at least one constraint. %e TOC process seeks to identify the constraint, and
restructure the organization around it in order to facilitate the best outcome throughout the use
of a #ve focusing steps (Dettmer, 14).
“Constraint” is de#ned as follows: one that restricts, limits, or regulates; the state of being
restricted or con#ned within prescribed bounds (%e American Heritage Dictionary of the
English Language). In order to identify the constraints within a process, Goldratt has developed
#ve sequential steps to concentrate improvement e"orts on the component that is capable of
producing the most positive impact on the system. %e #ve focusing steps include identifying the
system constraint, deciding how to exploit the constraint, subordinating everything else, elevating
the constraint, and #nally repeating the process by looking for the next constraint (Dettmer, 14).
Identify the system constraint. By identifying the weakest link in a system one can focus
improvement e"orts in order to remedy the constraint. %e weak link can be a physical attribute,
or a $aw in policy. By identifying the type of constraint, the proper measures can be implemented
(Dettmer, 14). “In any chain of events there can be only one weakest link, and if improvement is
to occur only the weakest link needs to be strengthened” (Stein, 8).
10

%e next step is to decide how to exploit the constraint. Changes and upgrades to a system can be
costly. Without committing to such expenses, one must exhaust a constraining component of its
complete capability as it currently exists (Dettmer, 14). In this stage it is important to decide how
best to progress toward the goal of a system within the current constraints (McMullen, 44).
Process planning may include outlining a speci#c plan, or steps that best supports the goal.
Subordinate the constraint. A!er identifying the constraint and establishing a plan of action, the
rest of the system is adjusted in order to accommodate the constraint and allow it to operate at
maximum e"ectiveness (Dettmer, 14). %is includes bringing other considerations in line with
what has been established in steps one and two; identifying the constraint, and deciding how to
exploit the constraint. By altering the system’s policies, processes, and other resources, a support
system is created that facilitates the successful operation of the constraint (McMullen, 44).
A!er implementing the previous steps, if the constraint is still constraining the system’s
performance, elevating the constraint becomes necessary. At this step in the process, the need to
entertain the idea of major changes to the existing system surfaces. %is may come in the form of
reorganization, divestiture, capital improvements, or other substantial system modi#cations.
Necessary action is taken in order to eliminate the constraint and can result in a considerable
investment in time, energy, money, or other resources. At the completion of this step, the
constraint has been broken (Dettmer, 14).
%e last step in the focusing steps involves the principles of continuous improvement process.
“Continuous improvement is an ongoing e"ort to improve products, services or processes. %ese
e"orts can seek “incremental” improvement over time or “breakthrough” improvement all at
once” (ASQ). %is process involves the constant evaluation of a process in order to maintain
11

maximum e"ectiveness. A!er the breaking of the initial constraint, the cycle begins again in
order to identify the next thing constraining performance (Dettmer, 14).
%e ultimate goal of the TOC process is to increase the e"ectiveness of a process in order to
increase throughput. %roughput is the money produced by a system. %roughput is not parts or
production related; a part becomes throughput only when the customer is invoiced. By increasing
the amount of throughput, a production process becomes more pro#table (Woeppel, 6).
12

Screen Printing Scheduling Methodology
Chapter 3
Several research methods were used including Elite and Specialized interviewing as well as
descriptive research. “A procedure that requires asking precise, open-ended questions, but
questions that are open to re#nement as the research and interview continues” describes Elite and
Specialized Interviewing (Levenson). It is important to remember, when conducting an Elite and
Specialized interview, the type of people you are interviewing. Lewis A. Dexter noted that “people
who perceive themselves to be important, such as professionals and executives, must be
interviewed di"erently than the ‘average person on the street’ in maximizing the collection of
useful information in applied research” (Levenson).
Elite and Specialized interviewing was conducted by contacting industry leader, Mark Coudray, of
Coudray Serigraphics in San Luis Obispo, Calif. as well as Prof. Ken Macro of California
Polytechnic State University in San Luis Obispo, Calif. %e following questions were asked:
1. In what ways are scheduling models, e.g. Gantt Charts, bene#cial?
2. How would “%eory of Constraints” be a bene#cial scheduling tool?
3. How bene#cial is it to incorporate bu"ers into a production process in order to
account for errors?
4. How important is it for U.S. companies to lower time-to-market in order to stay
competitive with foreign companies?
5. In what ways is an activity based scheduling model a good alternative for screen
printing?
13

Another research method used was descriptive research. One of the goals of the project was to
develop a visual representation of the screen printing process in order to better understand where
constraints may exist. “Descriptive research studies are designed to determine the nature of a
situation as it exists at the time of the study. %e aim is to describe, ‘what exists’ with respect to
variables or conditions in a situation” (Levenson).
Descriptive research was used in order to gather relevant research data. A research grant through
the company Imagine %at!© was acquired. %e research grant enables unlimited use of the
ExtendSim so!ware. %e so!ware was used to create the visual representation of the screen
printing production process. Each step of the work$ow was represented visually. %e so!ware
modeled and simulated the screen printing process giving us an overview of how each part is
performing. Measurements were taken as to how long the process will take, how many shirts the
could be produced per hour and where possible constraints lie. Further examination of the model
was done in order to organize and draw conclusions from the #ndings. %e goal was to recognize
the necessity and bene#ts of implementing a new scheduling model into the screen printing
process. %e aim was to observe the individual constraints and establish how they e"ect the
process. Since the aim was to lower time-to-market, knowing which constraints slow down the
process was essential to minimize time spent on each part of the process. For example, if a #le was
received that is not ready for print and has improper #le preparation this causes a constraint in
the process. By knowing where the variables lie in the problem and removing the variables we can
speed up the printing process. By creating #le preparation standards and guidelines customers
can follow before sending the #le for print. Hopefully, much less time is spent correcting #les.
14
Screen Printing Scheduling Methodology
Chapter 4
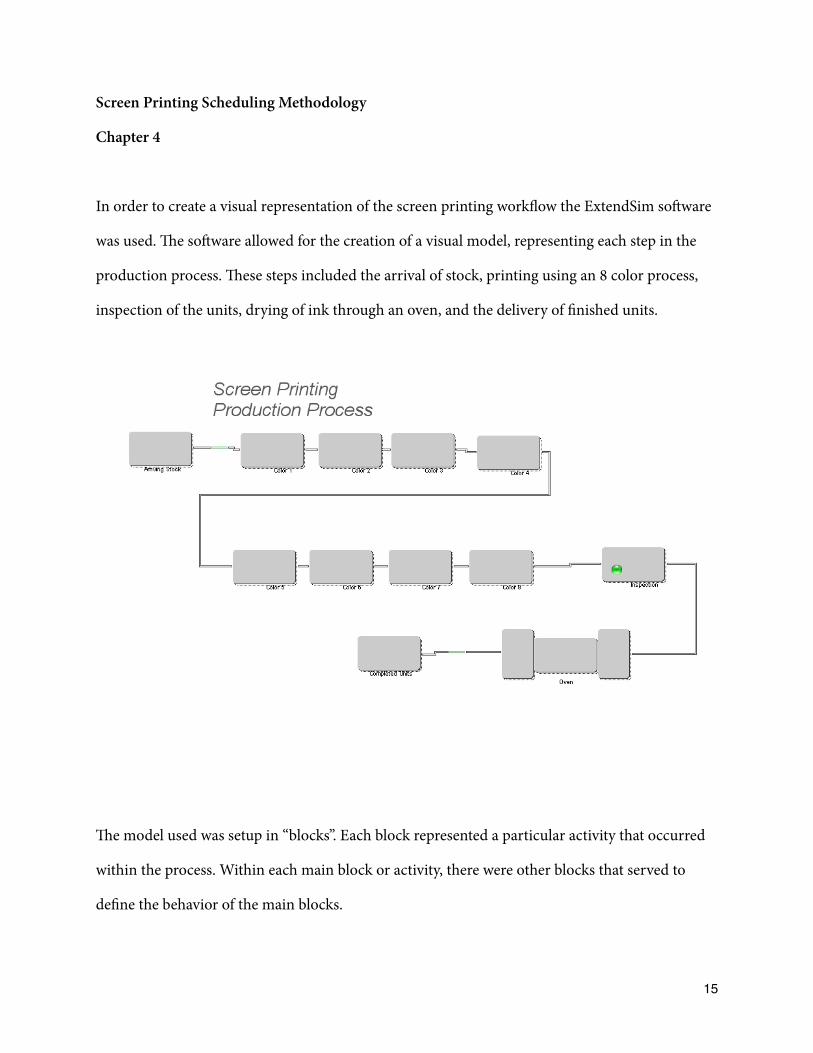
In order to create a visual representation of the screen printing work$ow the ExtendSim so!ware
was used. %e so!ware allowed for the creation of a visual model, representing each step in the
production process. %ese steps included the arrival of stock, printing using an 8 color process,
inspection of the units, drying of ink through an oven, and the delivery of #nished units.
%e model used was setup in “blocks”. Each block represented a particular activity that occurred
within the process. Within each main block or activity, there were other blocks that served to
de#ne the behavior of the main blocks.
15

%e screenshot illustrates the behavior of the “Color 1” activity. %is represents the printing of
one color on the press. Within this block there are other behavioral blocks that determine how
the activity will behave. In this case %ere are a series of blocks that tell the program to spend a
given amount of time performing the activity, as well as an event with a given probability that a
variable will constrain the process and delay production. %ere is also an inspection unit that
addresses the variable.
As the program runs, a visual representation of the process is displayed. From this, one is able to
see each part of the work$ow operate. Constraints become apparent and conclusions can be made
from insight gathered from the program.
16

For Elite and Specialized Interviewing, Professor Ken Macro and Mark Coudray were
interviewed. %e questions asked were:
1. In what ways are scheduling models, e.g. Gantt Charts, bene#cial?
2. How would “%eory of Constraints” be a bene#cial scheduling tool?
3. How bene#cial is it to incorporate bu"ers into a production process in order
to account for errors?
4. How important is it for U.S. companies to lower time-to-market in order to
stay competitive with foreign companies?
5. In what ways is an activity based scheduling model a good alternative for
screen printing?
During the interviews both interviewees explained that Gantt Charts can be bene#cial because it
gives a basic visual idea of when each job is to be performed and how long they estimate to #nish.
%ey said it is a bar chart, more or less, that everyone can read and understand when a job needs
to start and #nish. Alternatives to the Gantt Chart and the bene#ts of incorporating bu"ers and
%eory of Constraints into a scheduling model like the Gantt Chart were discussed. It seemed
unanimous that a main problem with a scheduling model like the Gantt Chart is there is no room
for error. Each job is scheduled one a!er another and has a #xed time of when it needs to be
done. When a problem does occur the whole process is shut down and it inevitably causes a
constraint halting jobs that are behind the current job. Coudray and Macro both agreed that this
is a $aw in the scheduling model. Coudray mentioned it is important to understand where
potential constraints lie in the process so hopefully you can avoid them or eliminate them early
on in the process. Professor Macro agreed that implementing bu"ers into the process to allow for
errors would be bene#cial. It would give you room to move jobs and continue work without
17

having to shut down the whole process losing time and money. Also discussed was the “tra&c
$ow model” and how in a tra&c jam every car has to slow down and eventually come to a stop. If
there’s only one lane then tra&c doesn’t $ow again until the whole jam is cleared. If you have
multiple lanes you can then shi! cars around the jam and continue tra&c $ow. %is allows you to
avoid the constraint and gives you time to eliminate it. %is same concept is what is desirable to
implement in the screen printing process. Mark phrases it as “parallel processes”.
As the interviews came to a close both agreed that creating an activity based model in today’s
screen printing industry is important. Most jobs are short-runs now and customers demand a
short turn-around time. Creating a model with bu"ers so you can have parallel processes is a
more e&cient way to schedule jobs and helps eliminate potential constraints in the process. %ey
understand the importance of bringing jobs back to the U.S. %e way American companies can
18

do that is to compete in time-to-market. %e more e&cient the process is the faster the product
will be produced creating a competitive advantage with overseas manufactures.
19

Screen Printing Scheduling Methodology
Chapter 5
Conclusions and recommendations
A!er building a basic simulation of the screen printing process with a random amount of
variables applied, variables a"ecting the process were exposed. A variable could be anything that
would stall or hinder the process such as a screen break. %e model gave a basic visualization of
how much time it would take to produce a given amount of shirts with random occurrences of
variables in the process. Implementing this simulation along with the enhanced scheduling model
helps to make the screen printing process more e&cient in handling the e"ects of variables within
that process. Not only does the work$ow have bu"ers to allow production to $ow without
shutting down completely, a framework has been developed for a working simulation model that
visually shows how variables e"ect the process and when we can anticipate them. %e new
scheduling model including the simulation model can help screen printers develop a more
“forward thinking” process that allows for more control and $exibility. %e main goal with this
project was to create a forward thinking model that lowers the time-to-market and thus helping
American printers become more competitive with foreign competition.
A!er receiving the grant from Imagine %at©, the basics of how to use the tools and interface
were learned. A!er a couple of months of using the program it became apparent that building a
sophisticated, working model would take at least a year to build and re#ne. Given the narrow
time slot to #nish the project, the basic framework for the simulation was developed. %e
program is for an eight color press and when the simulation is running it provides a minute by
minute rundown of how the process is performing with a random number of variables applied to
20

the process. A!er #nishing the project, recommendations were made to engage students in the
Graphic Communications department in learning the so!ware and the fundamentals of the
forward-thinking scheduling model. %e basic program that was started has a lot of potential to
be more dynamic and give more real-time analysis. %e intent is to pass on the simulation to the
department in hopes that it will continue to be built on and re#ned. As the industry continues to
change and everything is going from long runs to short runs the project is a step forward in
making the printing process more e&cient and timely. Learning the basics of the %eory of
Constraints and the tra&c $ow model is highly recommended. A!er understanding the
fundamentals of the scheduling model it is encouraged that students and sta" use the model and
build on it to make it even more functional. Further project extensions may include the real time
quanti#cation of data using the production model. Many modern printing presses are equipped
with technology that allows for the feeding of information from the press into a spreadsheet. %e
data contained in the spreadsheet can then be used within the program to re#ne an accurate
production model to a speci#c operation. Future projects along with this foundation model will
serve to provide a valuable business tool for the screen printing industry. By implementing a
forward thinking model along with visual representation so!ware, printers will be able to remain
competitive by improving their work$ow and decreasing time to market.
21

Work Cited
“Basic Concepts-Continuous Improvement.” ASQ. 1993-2010. American Society for Quality, Web.
12 Feb 2010. <http://www.asq.org/learn-about-quality/continuous-improvement/overview/
overview.html>.
Bogley, William A., and Robby Robson. “Related Rates.” Calculus Quest. 1996. Oregon State
University, Web. 12 Feb 2010. <http://oregonstate.edu/instruct/mth251/cq/Stage9/Lesson/
relatedRates.html>.
Constraint. %e American Heritage® Dictionary of the English Language, Fourth Edition.
Houghton Mi'in Company, 2004. Answers.com 03 Feb. 2010. <http://www.answers.com/topic/
constraint>.
Coudray, Mark. “422 Production Management for Print & Digital Media Project”. Cal Poly.
Coudray Serigraphics, San Luis Obispo. 17 Nov 2009. Lecture.
Cross, Linda. Bene#ts from Costing & Pricing Tools. Graphic Arts Monthly Jul 2004: 32-34. Print.
Dettmer, H. William. Goldratt's %eory of Constraints. 1st. Milwaukee, Wisconsin: ASQC Quality
Press, 1997. 14-15. Print.
Division, Special, and Mark Woeppel. %e Manufacturer. Boca Raton, Florida: CRC, 2001. 6-7.
Print.
22

Goldratt, Eliyahu. %e Goal. New York: Croton-on-Hudson, 1986. Print.
Maylor, Harvey. Beyond the Gantt Chart: Project Management Moving On. European
Management Journal February 2001: 92-100. Print.
Levenson, Harvey. Some Ideas About Doing Research in Graphic Communications. Atascadero,
CA: %e Good Neighbor Press & Services, 2001. 14-28. Print.
McMullen, %omas. Introduction to the %eory of Constraints (TOC) Management System. 1st.
Boca Raton, Florida: CRC, 1998. 44-45. Print.
Pedretti, Mic Screen Printing. Screen Printing. 10 Mar. 2006 EzineArticles.com. 5 Feb. 2010
<http://ezinearticles.com/?Screen-Printing&id=159285>.
"Printing Process Descriptions.” Printer's National Environmental Assistance Center. PNEAC,
Web. 12 Feb 2010. <http://www.pneac.org/printprocesses/screen/#Overview>.
Stein, Robert. %e %eory of Constraints. 2nd. New York, New York: Marcel Dekker, Inc., 1997.
1-5. Print.
23