screening families for unmet social needs in a pediatric
TRANSCRIPT
Wright State University Wright State University
CORE Scholar CORE Scholar
Master of Public Health Program Student Publications Master of Public Health Program
2017
Screening Families for Unmet Social Needs in a Pediatric Clinic Screening Families for Unmet Social Needs in a Pediatric Clinic
Elizabeth Evans Peterson Wright State University - Main Campus
Follow this and additional works at: https://corescholar.libraries.wright.edu/mph
Part of the Public Health Commons
Repository Citation Repository Citation Peterson, E. E. (2017). Screening Families for Unmet Social Needs in a Pediatric Clinic. Wright State University, Dayton, Ohio.
This Master's Culminating Experience is brought to you for free and open access by the Master of Public Health Program at CORE Scholar. It has been accepted for inclusion in Master of Public Health Program Student Publications by an authorized administrator of CORE Scholar. For more information, please contact [email protected].

Running head: SCREENING FOR UNMET SOCIAL NEEDS 1
Screening Families for Unmet Social Needs in a Pediatric Clinic
Elizabeth Evans Peterson
Wright State University Boonshoft School of Medicine
Master of Public Health Program
Marietta Orlowski, PhD, CPH – Committee Chair
Jessica Saunders, MPA – Committee Member
SCREENING FOR UNMET SOCIAL NEEDS 2
Table of Contents
Abstract ............................................................................................................................................3
Statement of Purpose .......................................................................................................................4
Literature Review.............................................................................................................................5
Social Determinants of Health .............................................................................................6
Assessment and Interventions ............................................................................................15
Methods..........................................................................................................................................18
Study Design ......................................................................................................................18
Setting and Sample ............................................................................................................19
Pilot Study ..........................................................................................................................21
Data Collection ..................................................................................................................23
Data Analysis .....................................................................................................................24
Results ............................................................................................................................................24
Discussion ......................................................................................................................................31
Limitations of Study ..........................................................................................................33
Public Health Implications .................................................................................................34
References ......................................................................................................................................37
Appendices .....................................................................................................................................43
Appendix I: IRB Determination Documents .....................................................................43
Appendix II: Program Screening Tool ...............................................................................45
Appendix III: List of Competencies Met in CE .................................................................46
SCREENING FOR UNMET SOCIAL NEEDS 3
Abstract
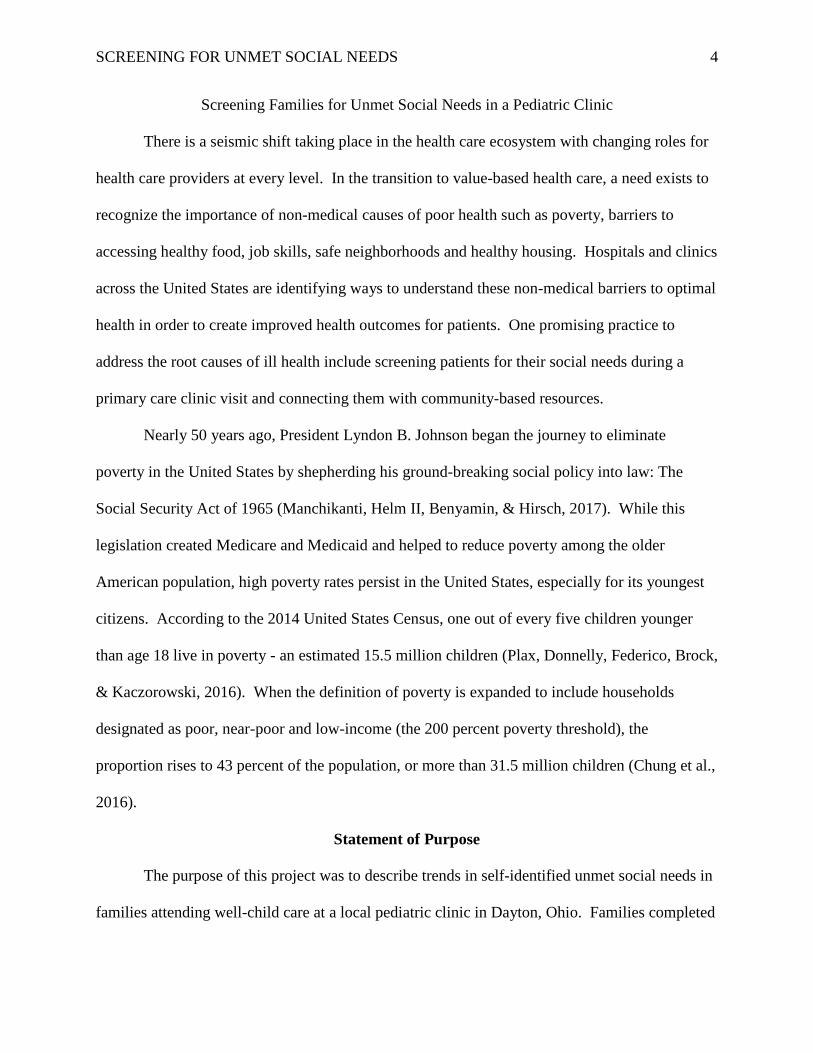
Background: Previous research indicates that at least 60% of preventable deaths are caused by
modifiable factors. Children, especially those under the age of five, are the most at-risk
population for negative social determinants of health. Identifying and mitigating these factors
could break the poverty impact cycle and promote wellness into adulthood, improving
community health outcomes.
Purpose: The purpose of this study was to describe trends in unmet social needs of children
attending a well-child visit in Dayton, Ohio.
Methods: Families attending a hospital-affiliated clinic during a well-child visit were asked to
complete a simple, 10-item questionnaire. This cross-sectional study utilized collected data from
October 3 to December 1, 2016, with 645 surveys completed and an age range of the patients
from three days to 18 years.
Results: The study sample included a 94.7% return rate of the survey tool with 221 positive
responses for unmet social needs (34.3%). Two or more unmet social needs were specified in
52.3% of the group requesting services with 39.7% of the group two years of age or less. The
needs group requested 444 specific needs, a ratio of 2.04 needs per child. In addition, 99.1% of
families identified in this program were previously unidentified in traditional social work
channels.
Discussion: Preliminary data from the program indicates a need to connect families to essential
resources.
Keywords: Social Determinants of Health, health inequity, disparities, community health,
social needs screening
SCREENING FOR UNMET SOCIAL NEEDS 4
Screening Families for Unmet Social Needs in a Pediatric Clinic
There is a seismic shift taking place in the health care ecosystem with changing roles for
health care providers at every level. In the transition to value-based health care, a need exists to
recognize the importance of non-medical causes of poor health such as poverty, barriers to
accessing healthy food, job skills, safe neighborhoods and healthy housing. Hospitals and clinics
across the United States are identifying ways to understand these non-medical barriers to optimal
health in order to create improved health outcomes for patients. One promising practice to
address the root causes of ill health include screening patients for their social needs during a
primary care clinic visit and connecting them with community-based resources.
Nearly 50 years ago, President Lyndon B. Johnson began the journey to eliminate
poverty in the United States by shepherding his ground-breaking social policy into law: The
Social Security Act of 1965 (Manchikanti, Helm II, Benyamin, & Hirsch, 2017). While this
legislation created Medicare and Medicaid and helped to reduce poverty among the older
American population, high poverty rates persist in the United States, especially for its youngest
citizens. According to the 2014 United States Census, one out of every five children younger
than age 18 live in poverty - an estimated 15.5 million children (Plax, Donnelly, Federico, Brock,
& Kaczorowski, 2016). When the definition of poverty is expanded to include households
designated as poor, near-poor and low-income (the 200 percent poverty threshold), the
proportion rises to 43 percent of the population, or more than 31.5 million children (Chung et al.,
2016).
Statement of Purpose
The purpose of this project was to describe trends in self-identified unmet social needs in
families attending well-child care at a local pediatric clinic in Dayton, Ohio. Families completed

SCREENING FOR UNMET SOCIAL NEEDS 5
a survey to determine the existence of ten categories of unmet social needs, including food
access, housing, primary care, commodity resources, education and transportation. This project
will highlight one model’s outcomes in addressing these self-identified unmet needs and explore
demographic trends in age of children, gender of children and geographic location of family to
offer contextual findings for the at-risk population.
Review of Literature
The impact of poverty on a child’s immediate as well as long-term health is staggering.
Poverty’s negative influence begins before birth and continues throughout the life span, creating
poor health, reduced developmental and educational outcomes, increased criminal behavior in
adulthood and ultimately, multi-generational cycles of dysfunction (Dreyer, Chung, Szilagyi, &
Wong, 2016). Children are America’s poorest citizens and the younger the child, the poorer they
are (Edelman, 2016). Poor children have increased infant mortality, low birth weights and
increased severity of chronic disease that follows the child into adulthood, causing a significant
and permanent health burden (Dreyer et al., 2016). In the United States, children raised in
poverty experience life-long deficits in health, education and career opportunities. The United
States boasts the largest economy in the world and yet it ranks as the second worst child poverty
rate among 35 industrialized countries (Edelman, 2016). The most alarming fact is that
Americans are facing a trend of declining health, with the current generation being at great risk
to be the first to endure greater chronic disease and lower life expectancy than the previous
generation (Trujillo & Plough, 2016).
Pediatric health outcomes are strongly influenced by the socio-economic status (SES) of
the child’s family and as SES decreases, the effects, including increased mortality, of chronic
disease intensifies (Colvin, Bettenhausen, Anderson-Carpenter, Collie-Akers, & Chung, 2016).
SCREENING FOR UNMET SOCIAL NEEDS 6
Unmet social needs can be the resulting outcome of lower social status which influences
pediatric health through numerous channels, including inadequate housing, food insecurity, poor
access to health care and lower quality education. Furthermore, multiple unmet needs combine
to create a cumulative impact of even greater detriment to the child’s health (Colvin,
Bettenhausen, Anderson-Carpenter, Collie-Akers, & Chung, 2016). Multiple studies support that
social, environmental and behavioral factors contribute to 60 percent of health outcomes, while
20 percent can be attributed to genetics and the other 20 percent due to healthcare (Bradley et al.,
2016). McGinnis, Williams-Russo, and Knickman (2002) report that 60 percent of premature
deaths can be attributed to behavior and environment, with 30 percent determined by genetics
and only 10 percent directly related to medical care. Regardless of the exact proportion,
traditional approaches to health care will no longer suffice in addressing adverse health. To
optimize long-term population health requires considering the patient as a whole, including their
social environment and its impact, and healthcare providers must integrate this information to
improve patient care (Onyekere, Ross, Namba, Ross, & Mann, 2016). To improve the health of
all Americans requires a paradigm shift with a more holistic view of health that recognizes its
social, geo-political and cultural components.
Social Determinants of Health
Traditionally, society has relied on the health sector to address concerns of health and
illness. Data-driven studies now demonstrate that another set of factors is more informative in
the rising premature death rates. Rising rates in chronic disease are due to the conditions where
people are born, live and work: the social determinants of health. Healthy People 2020 defines
social determinants of health (SDOH) as “conditions in the environments in which people are
born, live, learn, work, play, worship, and age that affect a wide range of health, functioning, and
SCREENING FOR UNMET SOCIAL NEEDS 7
quality-of-life outcomes and risks” (Healthy People 2020, n.d., Understanding Social
Determinants of Health).
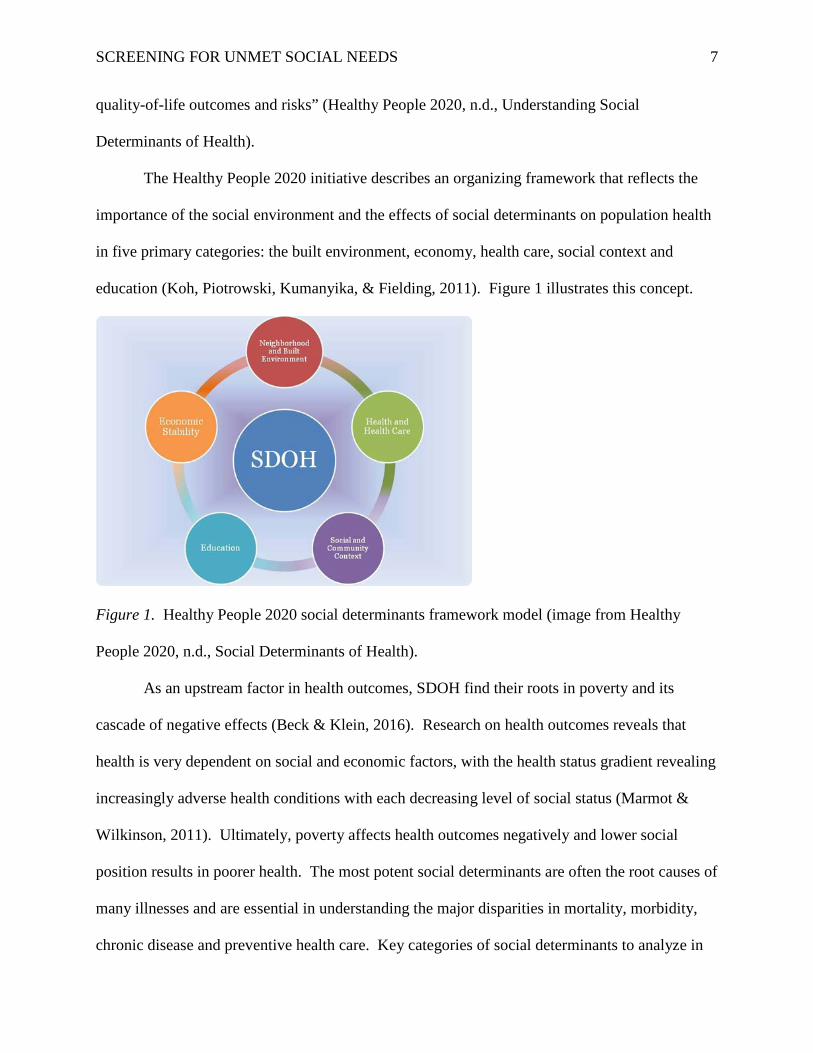
The Healthy People 2020 initiative describes an organizing framework that reflects the
importance of the social environment and the effects of social determinants on population health
in five primary categories: the built environment, economy, health care, social context and
education (Koh, Piotrowski, Kumanyika, & Fielding, 2011). Figure 1 illustrates this concept.
Figure 1. Healthy People 2020 social determinants framework model (image from Healthy
People 2020, n.d., Social Determinants of Health).
As an upstream factor in health outcomes, SDOH find their roots in poverty and its
cascade of negative effects (Beck & Klein, 2016). Research on health outcomes reveals that
health is very dependent on social and economic factors, with the health status gradient revealing
increasingly adverse health conditions with each decreasing level of social status (Marmot &
Wilkinson, 2011). Ultimately, poverty affects health outcomes negatively and lower social
position results in poorer health. The most potent social determinants are often the root causes of
many illnesses and are essential in understanding the major disparities in mortality, morbidity,
chronic disease and preventive health care. Key categories of social determinants to analyze in
SCREENING FOR UNMET SOCIAL NEEDS 8
determining effects on long-term health outcomes include access to health care, geography, food
insecurity, transportation, housing instability, employment, and education.
Access to health care. Lack of health insurance is considered a major factor in health
disparities, particularly for children. The Institute of Medicine describes health care access as
the “timely use of personal healthcare services to achieve the best possible health outcomes”
(Oberg, Colianni, & King-Schultz, 2016, p. 295). Prior to the Affordable Care Act (ACA),
which was enacted in 2010, children in low to moderate income families could receive health
care insurance through either Medicaid or the Children’s Health Insurance Program (CHIP). The
ACA added a third option of a qualified health plan (QHP) sold on the federal and state
insurance exchanges to families with incomes up to 400% of the federal poverty level (Kreider et
al., 2016). Due to the health care policies supported by the ACA, the uninsured rate for children
dropped from 14% in 1997 to 7% in 2012 and the Census Bureau further estimates the rate of
uninsured children fell to 6.2% in 2014 (Kreider et al., 2016). Uninsured children have
decreased access to regular well-child visits, including immunizations, as well as basic dental
care and prescription drugs. Beyond the current political debate on repealing or replacing the
ACA, state-by-state decisions on Medicaid expansion also created potential coverage gaps for a
large proportion of low-income families: incomes above the eligibility for Medicaid but below
the lower threshold for ACA Marketplace premium discounts. Lower reimbursement rates in
Medicaid plans have been linked to limited access to service providers, especially pediatricians.
Regardless of the type of insurance coverage, as many as 29% of all children face difficulty in
seeing a specialist, including a pediatrician, particularly if the child is on a CHIP plan or has
special health needs (Kreider et al., 2016).
SCREENING FOR UNMET SOCIAL NEEDS 9
Geography. Where you grow up and when you do seems incredibly random as it relates
to the life of each child; yet the location and timing of this fateful event is incredibly powerful in
long-term health outcomes. The impact of place is never more relevant than in the life of a child.
Families live in both a physical and social world and both of these environments have well-
documented effects on child development and health (Evans, 2004). Poor children are exposed
to more violence, have less social support and lower parental involvement, as well as watch more
television and have less access to computers and books. The air and water in poorer
neighborhoods are more polluted and the homes are more often noisy, crowded and even
dangerous. National surveys confirm that unsafe lead levels are four times higher in low-income
families than in more affluent while nearly two thirds of low-income pre-school children are
exposed to second-hand smoke at home, compared to less than half of more affluent children of
the same age (Evans, 2004). A growing body of evidence supports that exposure to
environmental toxins generates immune system changes as well as neurological damage in
children, resulting in epigenetic changes (Wise, 2016). The schools and day cares in low-income
areas are generally poorer quality, limiting access to personalized learning plans and educational
success. Ultimately, the aggregation of multiple environmental risks are even more harmful in
this dynamic than each individual exposure alone.
Food insecurity. Poor nutrition is a major contributing factor of chronic disease,
including heart disease, type II diabetes and some cancers (Marmot, 2011). In the second half of
the twentieth century, nutrition programs transitioned their emphasis from prevention of
infectious disease to the management of chronic conditions, such as obesity and hypertension.
Food insecurity includes issues of both physical and economic access to sufficient and nutritious
food, which meets both dietary requirements and physical activity levels (Hadley & Crooks,
SCREENING FOR UNMET SOCIAL NEEDS 10
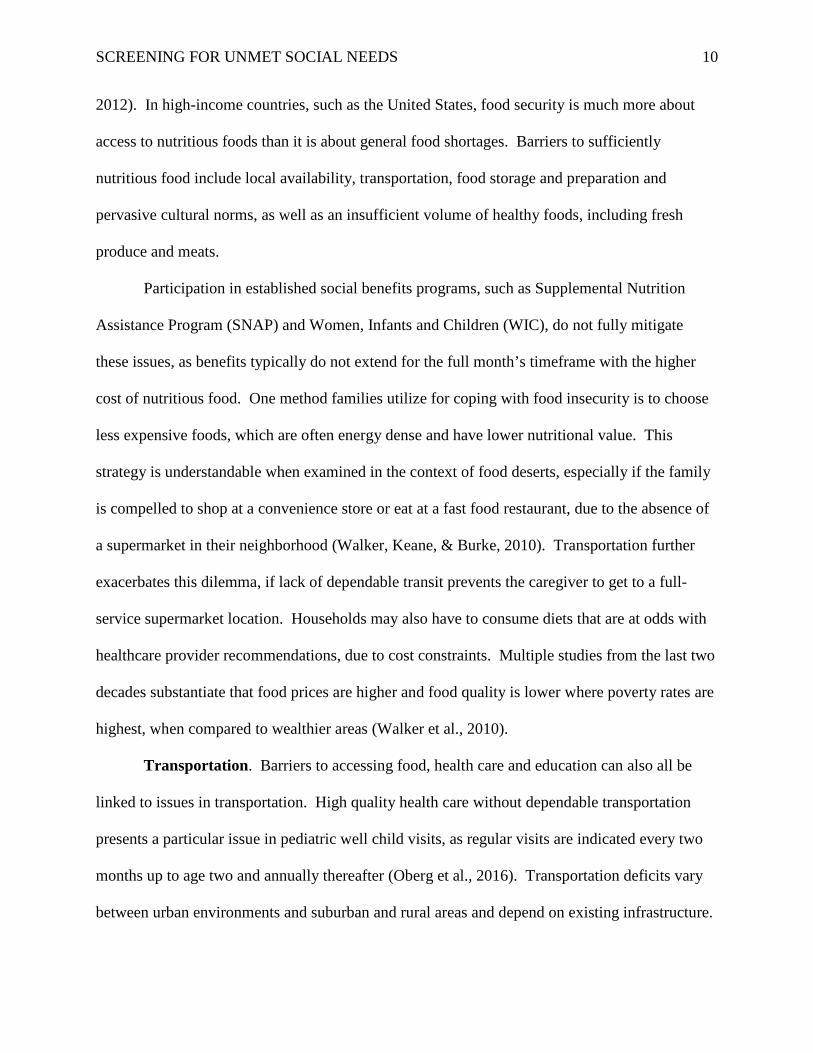
2012). In high-income countries, such as the United States, food security is much more about
access to nutritious foods than it is about general food shortages. Barriers to sufficiently
nutritious food include local availability, transportation, food storage and preparation and
pervasive cultural norms, as well as an insufficient volume of healthy foods, including fresh
produce and meats.
Participation in established social benefits programs, such as Supplemental Nutrition
Assistance Program (SNAP) and Women, Infants and Children (WIC), do not fully mitigate
these issues, as benefits typically do not extend for the full month’s timeframe with the higher
cost of nutritious food. One method families utilize for coping with food insecurity is to choose
less expensive foods, which are often energy dense and have lower nutritional value. This
strategy is understandable when examined in the context of food deserts, especially if the family
is compelled to shop at a convenience store or eat at a fast food restaurant, due to the absence of
a supermarket in their neighborhood (Walker, Keane, & Burke, 2010). Transportation further
exacerbates this dilemma, if lack of dependable transit prevents the caregiver to get to a full-
service supermarket location. Households may also have to consume diets that are at odds with
healthcare provider recommendations, due to cost constraints. Multiple studies from the last two
decades substantiate that food prices are higher and food quality is lower where poverty rates are
highest, when compared to wealthier areas (Walker et al., 2010).
Transportation. Barriers to accessing food, health care and education can also all be
linked to issues in transportation. High quality health care without dependable transportation
presents a particular issue in pediatric well child visits, as regular visits are indicated every two
months up to age two and annually thereafter (Oberg et al., 2016). Transportation deficits vary
between urban environments and suburban and rural areas and depend on existing infrastructure.

SCREENING FOR UNMET SOCIAL NEEDS 11
In addition, this category is interconnected to physical activity opportunities due to lack of
shared amenities (e.g., open space, parks, playgrounds) in local neighborhoods as well as
encouragement of safe active transportation: crime-free neighborhoods that promote physical
activity with bike lanes and bike share programs. Transportation access also encourages social
networking and positive interactions with other families, further contributing to better parenting.
Housing instability. Inadequate or unsafe housing conditions contribute to both acute
and chronic health conditions. Chronic toxin exposure demonstrates the impact of social
determinants such as income, the built environment and racism on children’s health (Oberg et al.,
2016). Children are the most vulnerable population to toxin exposure for many reasons,
including overall body mass, developmental timing and relative location to their living
environment (i.e., close to the ground) (Oberg et al., 2016). Specifically, a child’s typical air
intake is twice the level of an adult and children eat more calories and drink a greater volume of
water by body weight than adults (Oberg et al., 2016). Ozone and particulate matter in the air, as
well as sulfur dioxide and nitrogen dioxide are all associated with exacerbating asthma in
children and the levels of these contaminants are well-established to be significantly greater in
poor urban areas with a high number of minority children (Oberg et al., 2016). The lead
contamination disaster in Flint, Michigan is one recent example where some of the very poorest
families were charged the highest rates of water usage fees for contaminated water and the
children of Flint will face long-term health challenges including cognitive deficits and impaired
academic function (Oberg et al., 2016). If the housing environment is overcrowded, damp,
inadequately heated or cooled or contains poor air quality (e.g., mold, mildew, second-hand
smoke, radon) or poor water quality (e.g., lead), any of these issues can lead to either infectious
or chronic diseases or both. According to a 2011 Centers for Disease Control and Prevention
SCREENING FOR UNMET SOCIAL NEEDS 12
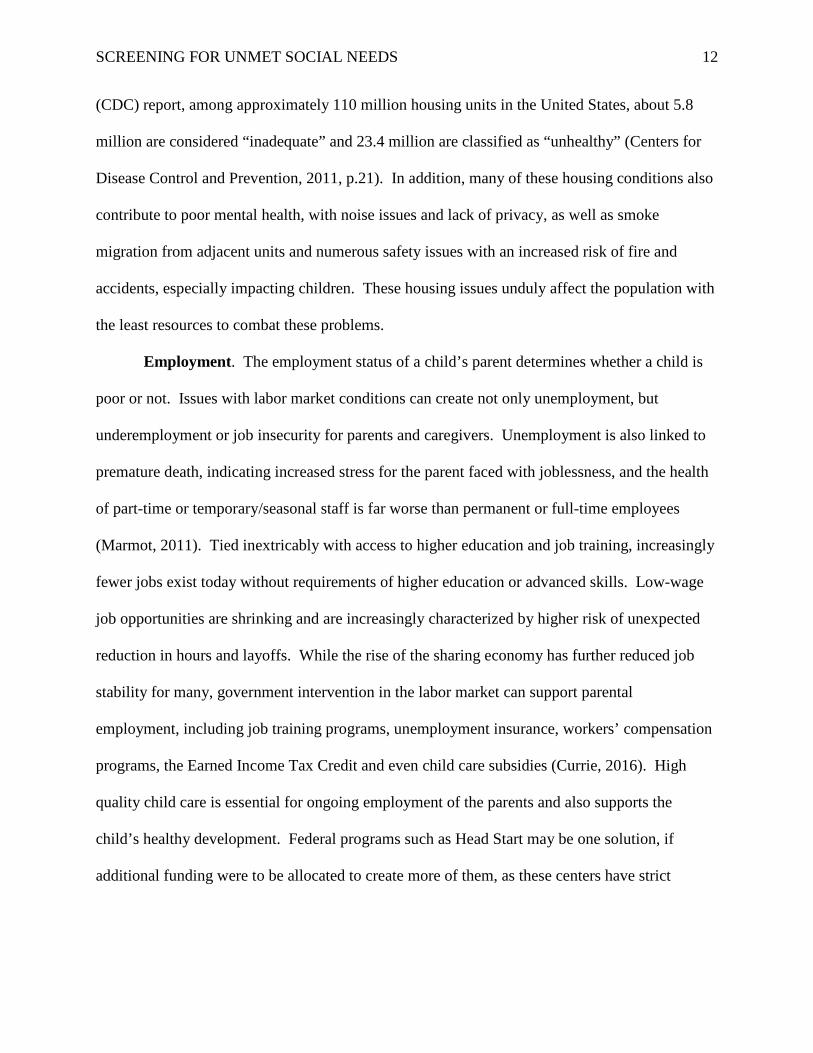
(CDC) report, among approximately 110 million housing units in the United States, about 5.8
million are considered “inadequate” and 23.4 million are classified as “unhealthy” (Centers for
Disease Control and Prevention, 2011, p.21). In addition, many of these housing conditions also
contribute to poor mental health, with noise issues and lack of privacy, as well as smoke
migration from adjacent units and numerous safety issues with an increased risk of fire and
accidents, especially impacting children. These housing issues unduly affect the population with
the least resources to combat these problems.
Employment. The employment status of a child’s parent determines whether a child is
poor or not. Issues with labor market conditions can create not only unemployment, but
underemployment or job insecurity for parents and caregivers. Unemployment is also linked to
premature death, indicating increased stress for the parent faced with joblessness, and the health
of part-time or temporary/seasonal staff is far worse than permanent or full-time employees
(Marmot, 2011). Tied inextricably with access to higher education and job training, increasingly
fewer jobs exist today without requirements of higher education or advanced skills. Low-wage
job opportunities are shrinking and are increasingly characterized by higher risk of unexpected
reduction in hours and layoffs. While the rise of the sharing economy has further reduced job
stability for many, government intervention in the labor market can support parental
employment, including job training programs, unemployment insurance, workers’ compensation
programs, the Earned Income Tax Credit and even child care subsidies (Currie, 2016). High
quality child care is essential for ongoing employment of the parents and also supports the
child’s healthy development. Federal programs such as Head Start may be one solution, if
additional funding were to be allocated to create more of them, as these centers have strict
SCREENING FOR UNMET SOCIAL NEEDS 13
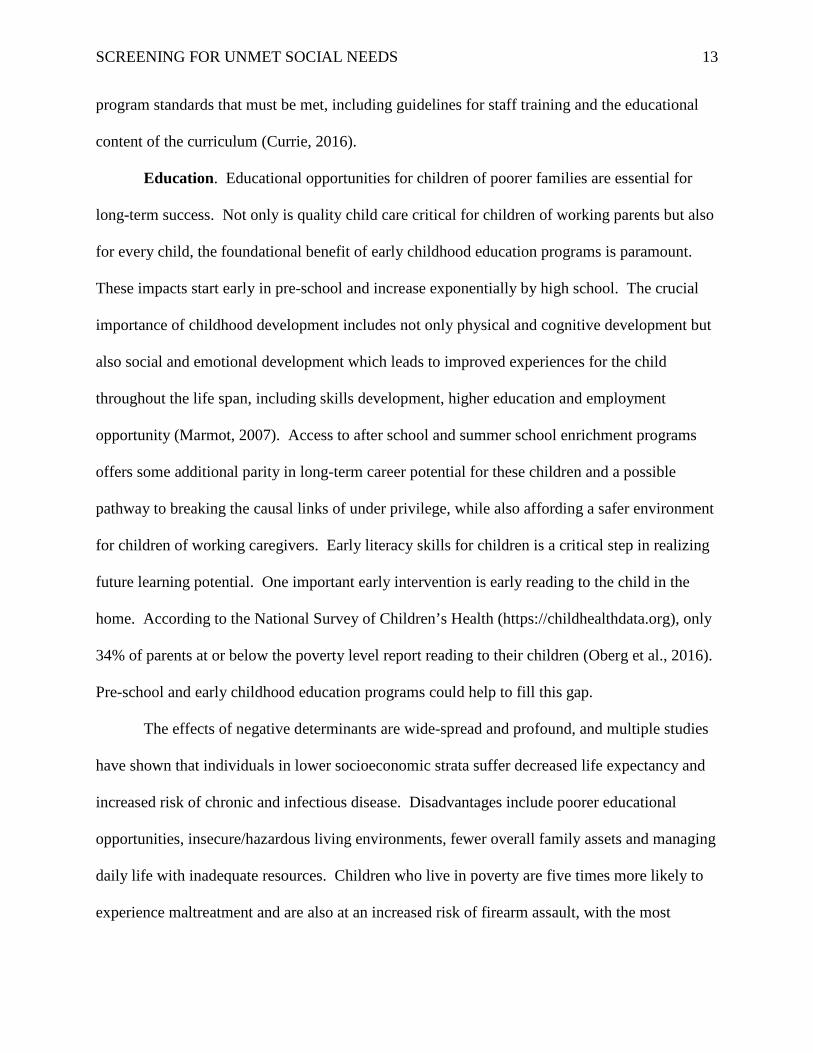
program standards that must be met, including guidelines for staff training and the educational
content of the curriculum (Currie, 2016).
Education. Educational opportunities for children of poorer families are essential for
long-term success. Not only is quality child care critical for children of working parents but also
for every child, the foundational benefit of early childhood education programs is paramount.
These impacts start early in pre-school and increase exponentially by high school. The crucial
importance of childhood development includes not only physical and cognitive development but
also social and emotional development which leads to improved experiences for the child
throughout the life span, including skills development, higher education and employment
opportunity (Marmot, 2007). Access to after school and summer school enrichment programs
offers some additional parity in long-term career potential for these children and a possible
pathway to breaking the causal links of under privilege, while also affording a safer environment
for children of working caregivers. Early literacy skills for children is a critical step in realizing
future learning potential. One important early intervention is early reading to the child in the
home. According to the National Survey of Children’s Health (https://childhealthdata.org), only
34% of parents at or below the poverty level report reading to their children (Oberg et al., 2016).
Pre-school and early childhood education programs could help to fill this gap.
The effects of negative determinants are wide-spread and profound, and multiple studies
have shown that individuals in lower socioeconomic strata suffer decreased life expectancy and
increased risk of chronic and infectious disease. Disadvantages include poorer educational
opportunities, insecure/hazardous living environments, fewer overall family assets and managing
daily life with inadequate resources. Children who live in poverty are five times more likely to
experience maltreatment and are also at an increased risk of firearm assault, with the most
SCREENING FOR UNMET SOCIAL NEEDS 14
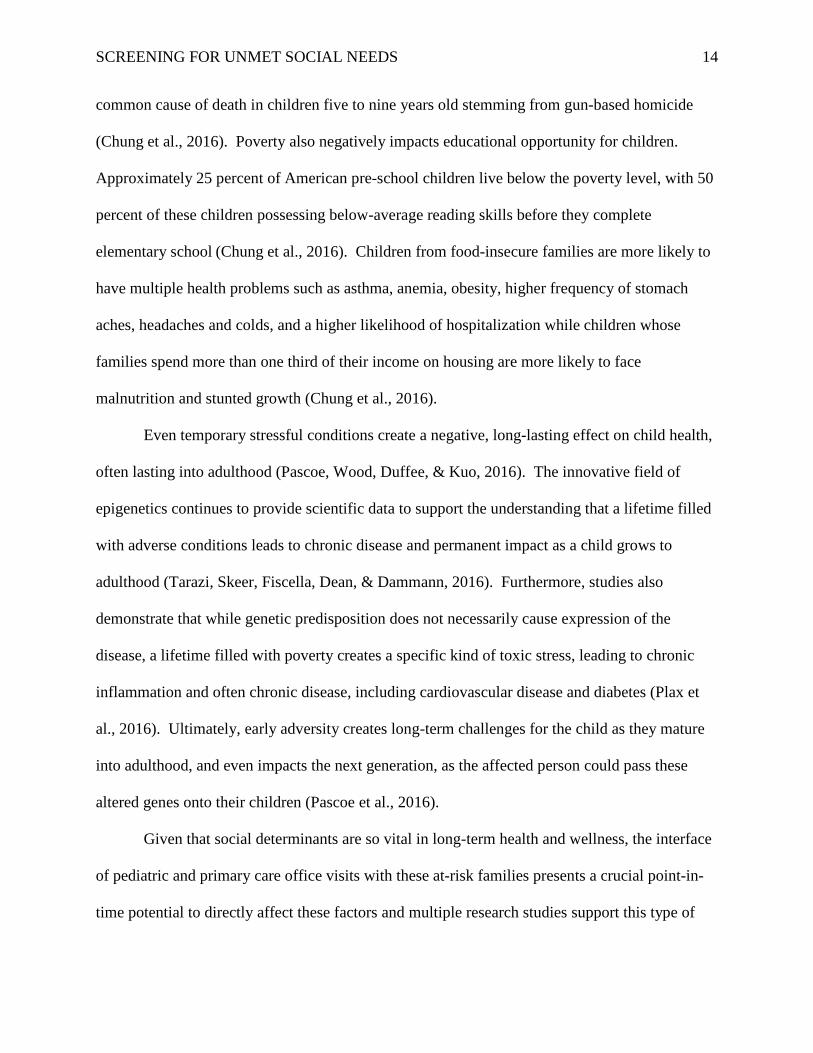
common cause of death in children five to nine years old stemming from gun-based homicide
(Chung et al., 2016). Poverty also negatively impacts educational opportunity for children.
Approximately 25 percent of American pre-school children live below the poverty level, with 50
percent of these children possessing below-average reading skills before they complete
elementary school (Chung et al., 2016). Children from food-insecure families are more likely to
have multiple health problems such as asthma, anemia, obesity, higher frequency of stomach
aches, headaches and colds, and a higher likelihood of hospitalization while children whose
families spend more than one third of their income on housing are more likely to face
malnutrition and stunted growth (Chung et al., 2016).
Even temporary stressful conditions create a negative, long-lasting effect on child health,
often lasting into adulthood (Pascoe, Wood, Duffee, & Kuo, 2016). The innovative field of
epigenetics continues to provide scientific data to support the understanding that a lifetime filled
with adverse conditions leads to chronic disease and permanent impact as a child grows to
adulthood (Tarazi, Skeer, Fiscella, Dean, & Dammann, 2016). Furthermore, studies also
demonstrate that while genetic predisposition does not necessarily cause expression of the
disease, a lifetime filled with poverty creates a specific kind of toxic stress, leading to chronic
inflammation and often chronic disease, including cardiovascular disease and diabetes (Plax et
al., 2016). Ultimately, early adversity creates long-term challenges for the child as they mature
into adulthood, and even impacts the next generation, as the affected person could pass these
altered genes onto their children (Pascoe et al., 2016).
Given that social determinants are so vital in long-term health and wellness, the interface
of pediatric and primary care office visits with these at-risk families presents a crucial point-in-
time potential to directly affect these factors and multiple research studies support this type of
SCREENING FOR UNMET SOCIAL NEEDS 15
intervention to interrupt the negative cycle of poverty and adverse health outcomes. Social needs
from one or more of these factors can be assessed at the time of a routine physician office visit,
providing a unique opportunity to streamline provision of resources in these critical areas.
Assessment and Interventions
Research indicates that as many as 83 percent of pediatric patients demonstrate at least
one negative social determinant of health, such as inadequate or unsafe housing or food
insecurity (Colvin, Bettenhausen, Anderson-Carpenter, Collie-Akers, Plencner et al., 2016).
Screening and providing resources for the unmet social needs of children and their families is not
only the right thing to do but also generates powerful synergy for working together at the
community level to advance health and wellness for multiple generations (Schickedanz & Coker,
2016). Furthermore, preliminary studies from the Johns Hopkins Children’s Center study
indicate not only a need for these resource connections but a willingness of the families to
receive this assistance from the family pediatrician during a well-child visit (Garg, Butz,
Dworkin, Lewis, & Serwint, 2009).
Screening for social needs should be coupled with the opportunity to connect families to
appropriate resources, especially if you take into account the ethical considerations of inaction.
However, maintaining an up-to-date database of available community programs can be
challenging for providers who are already responsible for managing the child’s health care. One
solution is to utilize a technology partner such as Health Leads (https://healthleadsusa.org), a
community-based health care organization that assists hospitals and clinics in facilitating the
patients’ unmet social needs with local resources (Berkowitz et al., 2016). Dayton Children’s
Hospital has chosen to utilize Health Leads as their technology partner in the implementation of
the Family Resource Connection.
SCREENING FOR UNMET SOCIAL NEEDS 16
Multiple positive outcomes have been documented utilizing this type of partnership,
including Kaiser Permanente’s program in California, who engaged Health Leads in 2015 to
address the basic social resource needs of its patients as a part of routine medical care (Shah,
Rogers, & Kanter, 2016). In this project, Kaiser Permanente utilized a scalable call center
staffed with a well-trained but nonclinical workforce to reach patients after a medical service is
provided (including routine office visits and screenings). Results of this preliminary program
show 78 percent of members who were screened indicated an unmet need (Shah et al., 2016).
In 2013 to 2014, Massachusetts General also conducted a similar program with their
patient population utilizing resident-staffed, hospital-based primary care practices. The
physician screened the patient during an office visit and then a social work-supervised team of
volunteers (also utilizing Health Leads technology) connected patients with requested unmet
need resources. In six months, this program connected 416 patients to resources, with 46.5
percent needing health care assistance, 40.1 percent needing food and 36.3 percent requesting
utility assistance (Berkowitz et al., 2016).
Johns Hopkins Children’s Center reported their data from 2008 until 2011, resulting in
over 2,265 needs being identified and met through community resources. In the Hopkins model,
pediatric well child visits were utilized to capture these unmet needs via parent screening with
the follow up delivered primarily by a team of volunteers, utilizing the Health Leads program
resources (Garg, Marino, Vikani, & Solomon, 2012).
As noted in the examples above, a social needs assessment was conducted utilizing a
screening tool or survey during the physician’s visit. However, the direct connection to local
community resources was carried out through non-clinical staff, including students, volunteers
and community health workers. This model allows the providers to work at the top of their
SCREENING FOR UNMET SOCIAL NEEDS 17
licenses and integrates a multidisciplinary team to provide resource connections in a sustainable
and cost-effective way. Furthermore, by utilizing this workforce of physician residents and
collegiate volunteers from the fields of medicine, public health and social work, a network of
service providers from the community can be leveraged to deliver sufficient capacity to benefit
the needs of this vulnerable population (Schickedanz & Coker, 2016). This model of capacity
building was utilized by Dayton Children’s in the creation of the Family Resource Connection
program.
Developing long-term effective payment models and policy implementation to support
such interventions has proven to be challenging but a few early innovators have offered some
encouraging examples. Hennepin Health, a Minnesota-based, Medicaid health care organization,
utilized an integrated medical and social services system to reduce emergency room visits by
nine percent (Alley, Asomugha, Conway & Sanghavi, 2016). The Centers for Medicare and
Medicaid Services (CMS) have also encouraged improvement through Health Care Innovation
Awards, presented to organizations such as the Michigan Public Health Institute, promoting their
“Community Hub” model, which utilizes community health workers to assess the clients’ needs
and link them to resources (Alley et al., 2016, p. 8). In the WellRx Pilot conducted in 2015 in
Albuquerque, New Mexico, 46 percent of patients screened positive for social needs and 63
percent of those had needs in multiple areas (Page-Reeves et al., 2016).
Previous studies have demonstrated that physicians and other health care providers
recognize the impact of the social determinants of health and the powerful association between
these unmet needs and poor health outcomes. A recent Robert Woods Johnson Foundation
survey concluded that 85 percent of physicians who were polled believed that social
determinants of health lead to poor health outcomes and that addressing these unmet social needs
SCREENING FOR UNMET SOCIAL NEEDS 18
are as critical as treating their physical medical needs (Colvin, Bettenhausen, Anderson-
Carpenter, Collie-Akers, & Chung, 2016). Supporting physician efforts to conduct this type of
screening during well-child visits will be a critical need to successfully implement this protocol
into standard practice. Patient-centered medical home policy, resident training curriculum
updates and support statements by organizations such as the American Academy of Pediatrics
further encourage implementation of programs to screen and suggest interventions of unmet
social needs (Beck & Klein, 2016). Furthermore, medical training integrating SDOH into the
curriculum to address the undeniable interplay of both biology and ecology is also indicated
(Shonkoff & Garner, 2012).
Methods
Study Design
A cross-sectional survey design study was conducted from October 3, 2016 to December
1, 2016, collecting data from well-child visits at a pediatric clinic located on-site at Dayton
Children’s Hospital (https://www.childrensdayton.org/). Dayton Children’s is a 155-bed
pediatric hospital, serving infants, children and teens. Founded in 1967, and located in Dayton,
Ohio, Dayton Children’s is one of only 35 freestanding children’s hospitals in the United States.
The hospital primarily serves a 20-county region and completed 299,067 visits last year. The
payer mix for the hospital overall is 52% Medicaid and 48% private insurance. In addition,
Dayton Children’s is a ‘safety net hospital’ and provides care for all children, regardless of
ability to pay.
Study data on unmet social needs was collected from scheduled, well-child pediatric
visits at Dayton Children’s free-standing pediatric clinic location, The Children’s Health Clinic
(CHC). Established in 1990, CHC provides standardized and comprehensive pediatric primary
SCREENING FOR UNMET SOCIAL NEEDS 19
care for the under-served population of southwestern Ohio, with a patient population age range
from birth to 18 years. CHC delivers continuous, family-centered, coordinated and culturally-
effective patient services to over 6,200 patients each year. Previous fiscal year data indicates
that 10,290 patient visits were completed at CHC last year, with a payer mix of 76%
Medicaid/Medicare, 22% private/commercial insurance and 2% self-pay.
The Family Resource Connection program was launched as a community health outreach
program in June 2016 and is offered by Dayton Children’s Center of Child Health and Wellness.
The Family Resource Connection matches families with available resources utilizing a
customized database facilitated by the technology partner, Health Leads. The Health Leads
program was implemented as the standard of care during the study period.
No protected patient healthcare data was available for the study and no electronic medical
record information was utilized. Data were captured at the time of survey return by the
supervising program Medical Social Worker, without personal medical information included,
and aggregated after the conclusion of the two-month interval.
Setting and Sample
Surveys were utilized as the assessment tool and were distributed during well-child
pediatric office visits within CHC and were completed voluntarily by a parent or legal guardian
to indicate unmet needs for the child in any of the ten targeted service categories. All protocols
and procedures for this program were approved prior to launch by the Dayton Children’s
Institutional Review Board (IRB). The IRB committee approved the use of the data for this
study and a copy of the IRB decision is included (Appendix I).
Parents/guardians of the patients completed the standardized screening form which
allowed the respondent to self-identify unmet social needs from ten category choices related to
SCREENING FOR UNMET SOCIAL NEEDS 20
food insecurity, housing issues, health care access, commodity needs, educational support and
transportation. A sample survey is included (Appendix II). Patients who responded
affirmatively with unmet needs were referred to Family Resource Connection Program
Advocates for further assistance. The Family Resource Connection Advocate team consisted
primarily of undergraduate and graduate students in the fields of social work, pre-medicine and
public health, supervised by a senior-level medical social worker. This supervising social
worker captured all the program data as the surveys were forwarded to the Family Resource
Connection by CHC.
A member of the advocate team then contacted the parent/guardian who completed the
screening form to provide resource information or obtain additional details, usually within 24
hours of the well-child visit. Once the screened family was enrolled into the Family Resource
Connection program, additional details were captured about the specific needs of the family.
The software system utilized by Dayton Children’s for this program prompts the assigned
advocate to continue working with the family on regular intervals, typically every five to ten
days, until the resources are successfully matched to the family’s needs or assistance is no longer
requested. This cycle is generally completed in two to three weeks but may last as long as two
months or so. Once the 60-day period has passed, most cases are closed, whether because of
lack of ongoing communication with the program by the family or because the need has been
fulfilled. Preliminary data from the Family Resource Connection indicates that 58 percent of the
families who requested assistance with social needs were successfully connected with local
resources. Work continues on the Family Resource Connection team to continue to research and
augment the Health Leads database with local community resources.
SCREENING FOR UNMET SOCIAL NEEDS 21
The study utilized a sample of 645 pediatric patients at CHC during the defined study
period with responses obtained from the parents and legal guardians of the patients. A limited
demographic profile was also collected at the time of the survey, which included the child’s age,
sex and zip code. Parents/guardians of a patient who presented for a well-child visit at CHC
were offered a screening form for unmet social needs at visit check-in (see sample survey tool in
Appendix II). All parents/guardians who completed the screening tool between October 3, 2016
(when the program was launched full-scale in the clinic) and December 1, 2016 were included in
the study. The health care provider team included five attending physicians and nineteen
residents. During the study period, a total of 718 well-child visits were scheduled, with 37
patients (5.2%) not screened due to cancellations of appointments, resulting in 681 surveys
(94.8%) distributed. Of those 681 surveys, 645 were returned (94.7%), and 36 did not return it
(5.3%), with no reason stated for the surveys not returned. It should be noted that this unusually
high rate of survey return is due primarily to the provider asking the parent/guardian about unmet
social needs during the office visit and prompting them to complete the survey prior to leaving
the clinic.
Pilot Study
Prior to the study period beginning October 3, a pilot project was conducted through
CHC well-child visits, utilizing only the five attending physicians. The pilot study was
conducted from June 28, 2016 through August 19, 2016. Of the 350 patients given a screening
form, 292 forms were completed (83.4%) and 58 families (16.6%) did not return the survey. No
reason was stated for the surveys not returned. The pilot study sample included 350 survey
participants, out of a potential 401 scheduled appointments (87.3%), with 47 cancelled or ‘no

SCREENING FOR UNMET SOCIAL NEEDS 22
show’ patients (11.7%). Of the 292 survey responders, the ages of the children ranged from two
days to 17 years with 158 males and 134 females.
Of the families who completed and returned the form during the pilot period, 108
responded positively for unmet social needs (37.0%). The median age for the entire responder
group (n=292) was four years. More than a third of the responder group had at least one child
two years of age or younger (n=106, 36.3%) and 44.5% of the study group (n=130) was under
the age of three. The pilot study group indicated 214 unmet needs, an average of 1.98 needs per
child.
Information to improve the screening process was received both during the initial pre-
pilot ‘hot wash’ program, conducted from June 13 to June 24, 2016 with one participating
physician and one assigned medical social worker, who followed up and evaluated the positive
responses from the completed surveys. This pre-pilot was especially important to assure that
non-social work trained personnel would be able to assist the patients effectively and establish
any needed referral mechanism for patients needing full-scale social work intervention. This
pre-pilot test program allowed all stakeholders to verify that the program could function as
intended and ensured that no vulnerable populations would be negatively impacted.
From the improvement feedback gained during the pilot, three primary process alterations
were implemented. First of all, all completed surveys were requested to be scanned into the
medical records system so a copy could be attached to the medical notes. This scanning process
was then verified at a later checkpoint to ensure adherence. A more formal feedback loop was
also integrated into the process that each physician who completed the survey could receive the
updates and notes on the progress of the services identification and the responses of the patient
family. Finally, the survey tool was refined from patient family feedback to make the process
SCREENING FOR UNMET SOCIAL NEEDS 23
easier for them by adding more explanation of the Family Resource Connection and a telephone
number to contact them directly if desired. Verbal feedback from the families also provided
valuable information to the provider team and an additional category of unmet needs
(transportation) was added prior to the program launch. All of these process improvements
allowed a more streamlined scaling of the screening project to include all the medical student
residents for the program launch in October.
Data Collection
The survey tool was designed and tested prior to implementation. Initial survey samples
were evaluated from other health care providers by way of the Health Leads partnership. An
advisory committee was formed at Dayton Children’s, with a variety of health care and
community partners involved, specifically for the launch of this Family Resource Connection
program. A primary portion of their early work including designing and testing the Family
Resource Connection survey tool. The design and testing process required several months to
complete and the survey tool was edited multiple times based on both staff feedback and the
testing comments. The survey instrument included ten categories of possible unmet need areas
for the parent/guardian to check. The unmet need areas were: healthy food assistance, unhealthy
housing issues, utility assistance, employment/job training, assistance obtaining health insurance,
adult education classes (ESOL, GED), public benefits (WIC, SNAP, SSI/SSDI), child-related
education support, commodities (clothing, diapers, car seats) and transportation.
The study group data was utilized for covariate analysis (age and sex) as well as to
identify any association trends between the needs areas and demographic profiles. In accordance
with the IRB protocol as well as HIPAA regulations, no identifiable health information was
retained for data analysis.

SCREENING FOR UNMET SOCIAL NEEDS 24
Data Analysis
Analysis was performed using Statistical Package for the Social Science (SPSS) IBM
Corp. Released 2015. IBM SPSS Statistics for Windows, Version 23.0. Armonk, NY: IBM Corp.
Descriptive statistics including median, interquartile ranges and proportions were computed
using SPSS. Logistic regression models were used to test for associations between age and sex
and the ten unmet needs categories at the α = 0.05 level of significance.
Results
Table 1 presents the descriptive statistics for the study sample. Of the 645 patient
families who completed the form, 221 responded positively for unmet social needs (34.3%). The
median age was slightly less than six years (5.77) with a range of three days to 18 years. Of the
survey group, 39.7% had at least one child two years of age or under and 52.3% of the study
group indicated two or more unmet needs.

SCREENING FOR UNMET SOCIAL NEEDS 25
Table 1
Description of Family Resource Center Study Sample (N=645)
Variable Measure
Male, n (%) 331 (51.3%)
Age, median (IQR) 5.77, (3 days – 18.0
years)
Age Categories, n (%):
0-2 years 256 (39.7%)
3-6 years 143 (22.2%)
7-12 years 145 (22.5%)
13-18 years 101 (15.7%)
Unmet Needs, n (%):
No needs 424 (65.7%)
One need 104 (47.7%)
Two or more needs 114 (52.3%)
Three or more needs 56 (25.7%)
Children with Parent-Reported
Unmet Needs, n (%)
221 (34.3%)
Total Unmet Needs Identified 444 (2.01 per child)
The study sample revealed a needs distribution of 47.7% (n=104) requesting one unmet
need, 52.3% requesting two or more needs (n=114) and 25.7% (n=56) requesting three or more
needs at the time of screening. The screening process produced 221 cases, resulting in 444
specific needs, a ratio of 2.01 needs per child of those families indicating one or more unmet
need. In addition, the youngest children, aged birth to two years, consistently had the greatest
number of unmet needs. Figure 2 demonstrates the proportion of children who requested
assistance based on the survey were predominantly the youngest portion of the study group.

SCREENING FOR UNMET SOCIAL NEEDS 26
Figure 2. Distribution of ages of children with unmet needs.
The distribution of needs by age category reveal that the largest proportion of children with
unmet social needs in each of the top four needs categories were the youngest group of children.
This is a consistent result in each of the unmet need categories and is illustrated in Figure 3 for
the top four unmet needs.
Figure 3. Stratified age distribution of children with unmet needs in the top four categories.
41.7
23.3 18.6
16.5 Ages of Children with Unmet Needs
Ages 0-2 Ages 3-6
30.1 45.3 36.5 44.1
27.9 23.3
20.6 18.6
29 20.9
20.6 20.3
12.9 10.5 22.2 16.9
0%10%20%30%40%50%60%70%80%90%
100%
ChildRelated
Commodities Utilities Food
Distribution of Top Needs Stratified By Age
Ages 0-2 Ages3-6 Ages 7-12 Ages 13-18
SCREENING FOR UNMET SOCIAL NEEDS 27
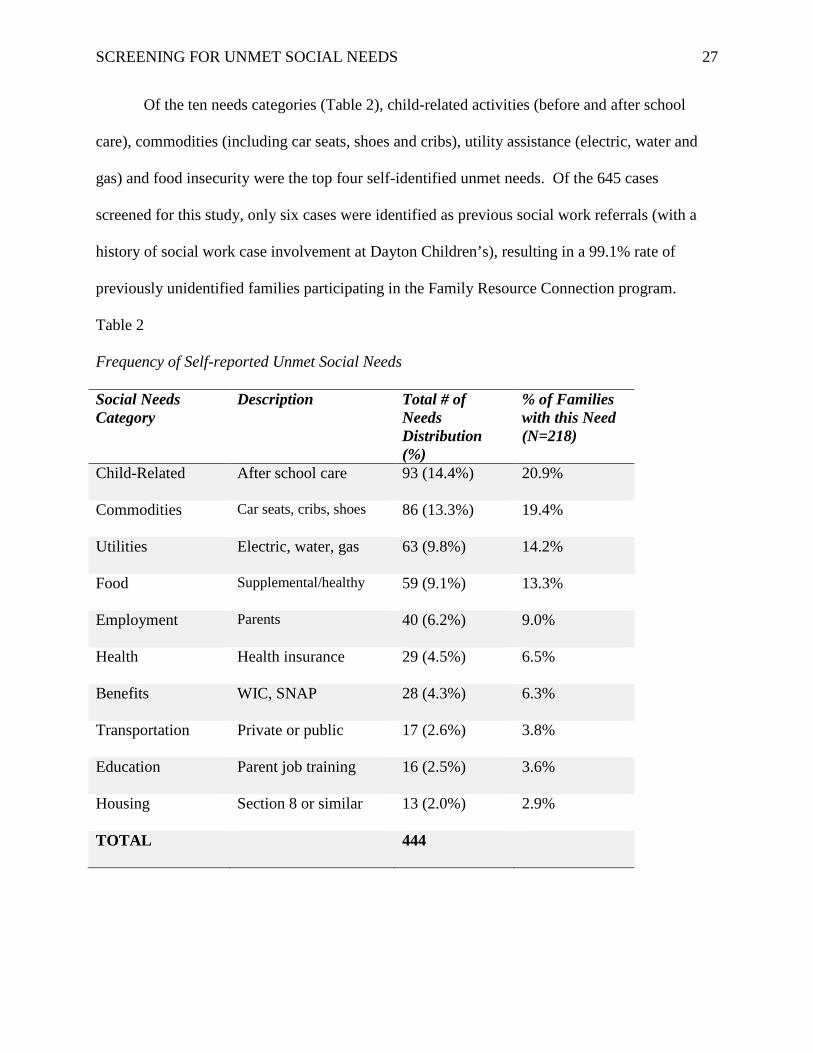
Of the ten needs categories (Table 2), child-related activities (before and after school
care), commodities (including car seats, shoes and cribs), utility assistance (electric, water and
gas) and food insecurity were the top four self-identified unmet needs. Of the 645 cases
screened for this study, only six cases were identified as previous social work referrals (with a
history of social work case involvement at Dayton Children’s), resulting in a 99.1% rate of
previously unidentified families participating in the Family Resource Connection program.
Table 2
Frequency of Self-reported Unmet Social Needs
Social Needs Category
Description Total # of Needs Distribution (%)
% of Families with this Need (N=218)
Child-Related After school care 93 (14.4%) 20.9%
Commodities Car seats, cribs, shoes 86 (13.3%) 19.4%
Utilities Electric, water, gas 63 (9.8%) 14.2%
Food Supplemental/healthy 59 (9.1%) 13.3%
Employment Parents 40 (6.2%) 9.0%
Health Health insurance 29 (4.5%) 6.5%
Benefits WIC, SNAP 28 (4.3%) 6.3%
Transportation Private or public 17 (2.6%) 3.8%
Education Parent job training 16 (2.5%) 3.6%
Housing Section 8 or similar 13 (2.0%) 2.9%
TOTAL 444

SCREENING FOR UNMET SOCIAL NEEDS 28
Based on the logistic regression results, no statistically significant association was found
between unmet needs and each of age and sex (Table 3). Odds ratios (OR) for the top four needs
categories (child-related, commodities, utilities and food) are listed in Table 3. For most of the
unmet needs, the ORs were less than one, indicating that in the study sample, a greater
proportion of males had unmet needs compared to females, and younger children had more self-
identified unmet needs than older children. This does not hold true in the association between
food insecurity and sex, where more females had unmet needs, and also in the utilities and child
related education support categories, where older children have greater unmet needs. However,
as stated above, none of these associations were statistically significant.
Table 3
Association between Needs and Independent Variables (Age, Sex)
Unmet Need Category Odds Ratio p value 95% CI
Commodities (age) 1.104 0.325 (0.906, 1.346)
Commodities (male) 0.705 0.134 (0.446, 1.113)
Child Related (age) 0.858 0.162 (0.693, 1.063)
Child Related (male) 0.913 0.701 (0.575, 1.451)
Utilities (age) 1.126 0.322 (0.890, 1.424)
Utilities (male) 0.915 0.747 (0.533, 1.569)
Food (age) 0.980 0.871 (0.767, 1.253)
Food (male) 1.222 0.473 (0.707, 2.110)
Any need (age) 0.902 0.179 (0.776, 1.049)
Any need (male) 0.979 0.899 (0.701, 1.367)
SCREENING FOR UNMET SOCIAL NEEDS 29
A secondary analysis of self-identified unmet needs by patient’s zip code revealed an
interesting association. Five of the seven zip code areas with the highest number of unmet needs
from this study also match five of the eight identified priority area zip code regions from the
2015 Montgomery County community health assessment data. For the patients who screened
positive for unmet needs (N=221), 176 provided a zip code on the survey form. Analysis of this
data revealed that the highest prevalence of unmet needs aligned with most of the same areas
identified as those having some of the greatest health challenges in Montgomery County. In
particular, Table 4 demonstrates that zip code areas 45417 (West Dayton), 45405 (Northwest
Dayton), 45406 (West Dayton), 45426 (Trotwood), and 45402 (downtown Dayton) each
correspond to high need priority areas from the 2015 Public Health - Dayton and Montgomery
County community health assessment (http://bit.ly/PHDMC-CHNA) data with the highest unmet
need locations from the study sample.

SCREENING FOR UNMET SOCIAL NEEDS 30
Table 4
Prevalence of Reported Unmet Social Needs by Zip Code (N=176 Patients)
Zip Code of Case Montgomery County
Neighborhood
Total
Cases
Prevalence
45417* West Dayton 31 17.6%
45403 East Dayton 25 14.2%
45405* Northwest Dayton 21 11.9%
45406* West Dayton 20 11.4%
45404 Northeast Dayton 11 6.3%
45426* Trotwood 10 5.7%
45402* Downtown Dayton 9 5.1%
45414* North Dayton 2 1.1%
45415* NW Dayton 2 1.1%
45416* Fort McKinley 2 1.1%
*Indicates priority areas from community assessment data provided by Public Health - Dayton & Montgomery County (2015).
Figure 4 highlights the data from Table 4 into a map indicating the highest need zones by
color within the Dayton metropolitan area. The nine areas in Dayton and Montgomery County
with the highest identified unmet social needs from the program are represented by the circular
dots in the map. The blue color represents the lowest prevalence rates with purple and red
marking increasing rates. The highest needs areas by zip code are highlighted with the bright
yellow core of the circles. Specifically, the areas of West Dayton (17.6%), East Dayton (14.2%)
and Northwest Dayton (11.9%) show the most significant unmet social needs locations.

SCREENING FOR UNMET SOCIAL NEEDS 31
Figure 4. Map of Dayton, Ohio with density of unmet needs by zip code region.
Discussion
The results of the study confirm a high number of unmet social needs exist among many
of the families in the Dayton, Ohio community, with more than half (52.3%) of the unmet needs
population requesting assistance in multiple need categories. Drawing upon evidence-based best
practices, the Family Resource Connection at Dayton Children’s provides an innovative program
of identifying unmet social needs and connecting families with community resources during
well-child pediatric office visits, delivered by a multidisciplinary team. Furthermore, the 221
cases resulted in 444 specific needs, more than two needs for every child in the study group. The
most vulnerable population, the very youngest children, comprised the largest portion of this

SCREENING FOR UNMET SOCIAL NEEDS 32
group, with more than one third of the study group including a child two years old or younger.
Finally, almost every family in this group (99.1%) expressing a request for assistance with unmet
social needs was previously unidentified or assisted through the traditional social work referral
system.
The results are similar to outcomes from comparable studies in recent years. The WellRx
Pilot, conducted in 2015 in Albuquerque, New Mexico, found that 46% of patients screened
positive for at least one unmet need, out of a study group of 3,048 patients (Page-Reeves et al.,
2016). In addition, the Johns Hopkins Children’s Center conducted a large-scale study between
2008 and 2011, which revealed a total of 2,265 total needs during this time, with a mean of 2.1
needs per family (Garg et al., 2012). With an average of 2.01 needs per patient, the results from
the Family Resource Connection study sample is within 97.1% of the Hopkins result.
Ultimately, program data from July, 2016 through February, 2017, which includes the
initial pilot program time frame and extends for the first five months of the full program
implementation, supports the results of this two-month study. During the eight-month interval, a
total of 1,967 surveys were completed and returned to The Family Resource Connection, with
34.1% of them indicating an unmet need, a proportion within 99.4% of the results found in this
8-week study (34.3%). The July 2016 through February 2017 dataset also demonstrated a total
of 2,009 unique needs--a result of 2.96 needs for each client--and nearly one additional need
reported than was found in this study. The need is substantial and the study results support the
necessity of this intervention to address the deficit. This early data analysis supports a moderate
but consistent prevalence of unmet social needs among the local pediatric population in Dayton,
Ohio which suggests probable downstream effects on clinical outcomes and health care
utilization.

SCREENING FOR UNMET SOCIAL NEEDS 33
Some of the strengths of this study include the identification of the most commonly
requested areas of self-identified unmet social needs in the Dayton market, which included child-
related educational activities, commodities, utility assistance and insufficient food. Furthermore,
although not statistically significant, the evidence from the study data demonstrates that the
youngest (two years of age and younger), and thus the most vulnerable, portion of the study
group presented with unmet needs more often than any of the other age group categories, at a
rate almost double the other age groups.
Limitations of Study
Obtaining comprehensive data for this program that could be utilized for analysis proved
to be challenging. In part, this was governed by the IRB committee’s stipulation that this study
be limited to process improvement. The program software utilized and provided by Health
Leads, does not capture any data on the survey responses which indicate no unmet social needs.
Thus the available metrics from the Health Leads database, which supports some limited
reporting functions, reflect only the positive responses. Obtaining details such as zip codes, race
and ethnicity and parental age and education level, as well as tracking the entire screened client
pool and not merely the positive screened families is an important reporting function for future
program improvements. In addition, the data utilized for this study, as well as for the pilot
program, was collected and tracked manually and specifically for this project. Designating
resources in designing a systematic method for continuing this data collection would be a
worthwhile endeavor.
Gender difference analysis did not provide a statistically significant result with this study
sample. Some of the other limitations to this study include lack of sufficient data to adjust for
other potential confounders, including race, ethnicity, zip code locations and the age of the

SCREENING FOR UNMET SOCIAL NEEDS 34
parent/guardian. Furthermore, additional results from the ongoing program outcomes over an
extended period of time (more than the initial eight weeks in this study) would provide important
clues to other, potentially statistically significant associations. Collecting and analyzing more
detailed demographic data from the subsequent months since the program launch would be
indicated for future analysis. Comparing data from this initial implementation phase with
comparable data from the full program over time would be an ideal future research question,
including analyzing seasonal trends (summer versus winter) for additional associations.
The time limit of this study was indeed a potential study limitation. Utilizing two months
of screening provided a generous dataset, yet, tracking the families throughout an entire calendar
year, would be very informative and may reveal some additional associations. Likely there are
cyclical trends corresponding to higher needs requests, such as around the ‘Back to School’
period in August/September, as well as during the holiday period from late November into
December. Collecting and analyzing data from 12 months of the program would be interesting
to compare with both the pilot study as well as the initial two months of the program utilized for
this project. Furthermore, long-term longitudinal data capture and analysis would be even more
instructive in identifying trends for future resource allocations.
Public Health Implications
At the intersection of evidence-based healthcare and community-driven partnerships lives
an opportunity to create lasting change for children and their families by interrupting the
negative cycle of poverty which causes adverse health outcomes. Health inequity is ultimately
caused by the unequal distribution of wealth. The consequences in people’s every day existence
with limited access to health care, nutritious foods, education and safe housing, both individually
and especially if the family lacks resources in two or more of these areas together, presents a

SCREENING FOR UNMET SOCIAL NEEDS 35
health-damaging barrier to a full and flourishing life (Marmot, Friel, Bell, Houweling, & Taylor,
2008). Given that social determinants are so vital in these potential health-promoting behaviors,
there is great value to have a trusted provider ask a patient family about their social needs and
then utilize community-based resources in these critical areas. The definition of what constitutes
health care is undergoing a stunning transformation and the pediatric environment is uniquely
suited to provide this opportunity to impact young children at the very beginning of the social
determinants’ cycle. The Family Resource Connection model demonstrates how health care
systems can shepherd community resources to its patient population, while delivering high-value
health care within and beyond the clinic walls. Effective multi-sector collaboration between
healthcare providers, hospital systems, payer corporations, public health agencies, academic
institutions and community volunteer organizations will be vital to build the essential capacity to
both initiate and maintain this critical action (Kania & Kramer, 2011).
As Adam Smith discussed in his 1776 book, The Wealth of Nations, poverty
encompasses so much more than simple physical deprivation (Cannan, 1904). The physical
deficits are very tangible but the related psychosocial impact of being poor is also considerable
and addressing this dynamic is fundamental to improving community health. The time has come
to consider population health holistically and comprehensively, taking into account the long-term
consequences of poverty from the aspects of mental, emotional and social outcomes, as well as
the physical needs. Screening and providing resources for the basic social needs of children and
their families is not only a moral imperative but also creates significant long-term, possibly
multi-generational, community health and wellness benefits (Schickedanz & Coker, 2016).
Investment in health-changing interventions for children in the first five years of life has the
greatest potential to reduce the impact of health inequity within a generation (Marmot, 2007).
SCREENING FOR UNMET SOCIAL NEEDS 36
Ultimately, as entrusted members of each families’ health care team, pediatricians can provide a
unique impetus to lead the true revolution of community health care. If community health
agencies can work together with health care providers, buoyed by the strength of a volunteer
work force as in the case of the Family Resource Connection, much progress can be made in
providing a healthy foundation for America’s youth and preventing the costly and debilitating
effects of chronic disease long-term.

SCREENING FOR UNMET SOCIAL NEEDS 37
References
Alley, D. E., Asomugha, C. N., Conway, P. H., & Sanghavi, D. M. (2016). Accountable health
communities--Addressing social needs through Medicare and Medicaid. New England
Journal of Medicine, 374(1), 8-11. doi:10.1056/NEJMp1512532
Beck, A. F., & Klein, M. D. (2016). Moving from social risk assessment and identification to
intervention and treatment. Academy of Pediatrics, 16(2), 97-98.
doi:http://dx.doi.org/10.1016/j.acap.2016.01.001
Berkowitz, S. A., Hulberg, A. C., Hong, C., Stowell, B. J., Tirozzi, K. J., Traore, C. Y., & Atlas,
S. J. (2016). Addressing basic resource needs to improve primary care quality: A
community collaboration programme. BMJ Quality and Safety, 25(3), 164-172.
doi:10.1136/bmjqs-2015-004521
Bradley, E. H., Canavan, M., Rogan, E., Talbert-Slagle, K., Ndumele, C., Taylor, L., & Curry, L.
A. (2016). Variation in health outcomes: The role of spending on social services, public
health, and health care, 2000-09. Health Affairs, 35(5), 760-768.
doi:10.1377/hlthaff.2015.0814
Cannan, E. (Ed.). (1904). An Inquiry into the Nature and Causes of the Wealth of Nations, 5th
edition. Library of Economics and Liberty. Retrieved from
http://www.econlib.org/library/Smith/smWN.html
Centers for Disease Control and Prevention (CDC). (2011). CDC Health Disparities and
Inequalities Report - United States, 2011. Morbidity & Mortality Weekly Report, 60,
(144), 21.
Chung, E. K., Siegel, B. S., Garg, A., Conroy, K., Gross, R. S., Long, D. A., . . . Fierman, A. H.
(2016). Screening for social determinants of health among children and families living in
SCREENING FOR UNMET SOCIAL NEEDS 38
poverty: A guide for clinicians. Current Problems in Pediatric Adolescent Health Care,
46(5), 135-153. doi:10.1016/j.cppeds.2016.02.004
Colvin, J. D., Bettenhausen, J. L., Anderson-Carpenter, K. D., Collie-Akers, V., & Chung, P. J.
(2016). Caregiver opinion of in-hospital screening for unmet social needs by pediatric
residents. Academy of Pediatrics, 16(2), 161-167. doi:10.1016/j.acap.2015.06.002
Colvin, J. D., Bettenhausen, J. L., Anderson-Carpenter, K. D., Collie-Akers, V., Plencner, L.,
Krager, M., . . . Chung, P. J. (2016). Multiple behavior change intervention to improve
detection of unmet social needs and resulting resource referrals. Academy of Pediatrics,
16(2), 168-174. doi:10.1016/j.acap.2015.06.001
Currie, J. (2016). How can we reduce child poverty and support parental employment?
Academic Pediatrics, 16(3S), S13-S15. doi: 10.1016/j.acap.2016.02.002
Dreyer, B., Chung, P. J., Szilagyi, P., & Wong, S. (2016). Child poverty in the United States
today: Introduction and executive summary. Academy of Pediatrics, 16(3 Suppl), S1-5.
doi:10.1016/j.acap.2016.02.010
Edelman, M. W. (2016). Ending childhood poverty in America. Academy of Pediatrics, 16(3
Suppl), S6-7. doi:10.1016/j.acap.2016.02.006
Evans, G. W. (2004). The environment of childhood poverty. American Psychology, 59(2), 77-
92. doi:10.1037/0003-066x.59.2.77
Garg, A., Butz, A. M., Dworkin, P. H., Lewis, R. A., & Serwint, J. R. (2009). Screening for basic
social needs at a medical home for low-income children. Clinical Pediatrics, 48(1), 32-
36. doi:10.1177/0009922808320602

SCREENING FOR UNMET SOCIAL NEEDS 39
Garg, A., Marino, M., Vikani, A. R., & Solomon, B. S. (2012). Addressing families' unmet social
needs within pediatric primary care: The health leads model. Clinial Pediatrics, 51(12),
1191-1193. doi:10.1177/0009922812437930
Hadley, C., & Crooks, D. L. (2012). Coping and the biosocial consequences of food insecurity in
the 21st century. American Journal of Physical Anthropology, 149 Suppl 55, 72-94.
doi:10.1002/ajpa.22161
Healthy People 2020. (n.d.). Understanding Social Determinants of Health. U.S. Department of
Health and Human Services, Office of Disease Prevention and Health Promotion.
Retrieved from
http://www.healthypeople.gov/2020/topicsobjectives2020/overview.aspx?topicid=39
Kania, J., & Kramer, M. (2011). Collective impact. Stanford Social Innovation Review, 9(1), 36-
41. Retrieved from
http://ezproxy.libraries.wright.edu/login?url=http://search.ebscohost.com/login.aspx?dire
ct=true&db=bth&AN=55818295&site=ehost-live
Koh, H. K., Piotrowski, J. J., Kumanyika, S., & Fielding, J. E. (2011). Healthy people: a 2020
vision for the social determinants approach. Health Education Behaviors, 38(6), 551-557.
doi:10.1177/1090198111428646
Kreider, A. R., French, B., Aysola, J., Saloner, B., Noonan, K. G., & Rubin, D. M. (2016).
Quality of health insurance coverage and access to care for children in low-income
families. JAMA Pediatrics, 170(1), 43-51. doi:10.1001/jamapediatrics.2015.3028
Manchikanti, L., Helm II, S., Benyamin, R., & Hirsch, J. A. (2017). Evolution of US Health Care
Reform. Pain Physician, 20(3), 107-110. Retrieved from
SCREENING FOR UNMET SOCIAL NEEDS 40
http://www.painphysicianjournal.com/current/pdf?article=NDMwMQ%3D%3D&journal
=104
Marmot, M. (2007). Achieving health equity: from root causes to fair outcomes. Lancet,
370(9593), 1153-1163. doi:10.1016/s0140-6736(07)61385-3
Marmot, M. (2011). Global action on social determinants of health. Bulletin of World Health
Organization, 89(10), 702. doi:10.2471/blt.11.094862
Marmot, M., Friel, S., Bell, R., Houweling, T. A. J., & Taylor, S. Closing the gap in a
generation: health equity through action on the social determinants of health. The Lancet,
372(9650), 1661-1669. doi:http://dx.doi.org/10.1016/S0140-6736(08)61690-6
Marmot, M., & Wilkinson, R. G. (2011). Social Determinants of Health (Marmot, M. &
Wilkinson, R. G., Editors. 2nd Ed.). Great Britain: Oxford University Press.
McGinnis, J. Michael, Williams-Russo, Pamela, and Knickman, James R. The Case For More
Active Policy Attention To Health Promotion. Health Affairs 21, no. 2 (2002): 78-93.
doi:10.1377/hlthaff.21.2.78
Oberg, C., Colianni, S., & King-Schultz, L. (2016). Child health disparities in the 21st century.
Current Problems in Pediatric Adolescent Health Care, 46(9), 291-312.
doi:10.1016/j.cppeds.2016.07.001
Onyekere, C., Ross, S., Namba, A., Ross, J. C., & Mann, B. D. (2016). Medical student
volunteerism addresses patients' social needs: A novel approach to patient-centered care.
The Ochsner Journal, 16(1), 45-49.
Page-Reeves, J., Kaufman, W., Bleecker, M., Norris, J., McCalmont, K., Ianakieva, V., . . .
Kaufman, A. (2016). Addressing social determinants of health in a clinic setting: The

SCREENING FOR UNMET SOCIAL NEEDS 41
WellRx Pilot in Albuquerque, New Mexico. Journal of the American Board of Family
Medicine, 29(3), 414-418. doi:10.3122/jabfm.2016.03.150272
Pascoe, J. M., Wood, D. L., Duffee, J. H., & Kuo, A. (2016). Mediators and adverse effects of
child poverty in the United States. Pediatrics. doi:10.1542/peds.2016-0340
Plax, K., Donnelly, J., Federico, S. G., Brock, L., & Kaczorowski, J. M. (2016). An essential role
for pediatricians: Becoming child poverty change agents for a lifetime. Academy of
Pediatrics, 16(3 Suppl), S147-154. doi:10.1016/j.acap.2016.01.009
Council on Community Pediatrics. (2016). Poverty and Child Health in the United States.
Pediatrics, 137(4), e2016033. doi:10.1542/peds.2016-0339
Schickedanz, A., & Coker, T. R. (2016). Surveillance and screening for social determinants of
health-Where do we start and where are we headed? Current Problems in Pediatric
Adolescent Health Care, 46(5), 154-156. doi:10.1016/j.cppeds.2016.02.005
Shah, N. R., Rogers, A. J., & Kanter, M. H. (2016). Health care that targets unmet social needs.
New England Journal of Medicine Catalyst. Retrieved from
http://catalyst.nejm.org/health-care-that-targets-unmet-social-needs/
Shonkoff, J. P., & Garner, A. S. (2012). The lifelong effects of early childhood adversity and
toxic stress. Pediatrics, 129(1), e232-246. doi:10.1542/peds.2011-2663
Smith, A. (1776). Wealth of Nations. Cited in An Inquiry into the Nature and Causes of the
Wealth of Nations, 5th ed. by Edwin Cannan, ed., 1904. Library of Economics and
Liberty. Retrieved from http://www.econlib.org/library/Smith/smWN.html
Tarazi, C., Skeer, M., Fiscella, K., Dean, S., & Dammann, O. (2016). Everything is connected:
social determinants of pediatric health and disease. Pediatric Research, 79(1-2), 125-126.
doi:10.1038/pr.2015.220
SCREENING FOR UNMET SOCIAL NEEDS 42
Trujillo, M. D., & Plough, A. (2016). Building a culture of health: A new framework and
measures for health and health care in America. Society of Scientific Medicine, 165, 206-
213. doi:10.1016/j.socscimed.2016.06.043
Walker, R. E., Keane, C. R., & Burke, J. G. (2010). Disparities and access to healthy food in the
United States: A review of food deserts literature. Health Place, 16(5), 876-884.
doi:10.1016/j.healthplace.2010.04.013
Wise, P. H. (2016). Child poverty and the promise of human capacity: Childhood as a foundation
for healthy aging. Academy of Pediatrics, 16(3 Suppl), S37-45.
doi:10.1016/j.acap.2016.01.014

SCREENING FOR UNMET SOCIAL NEEDS 43
Appendix I: IRB Determination Documents
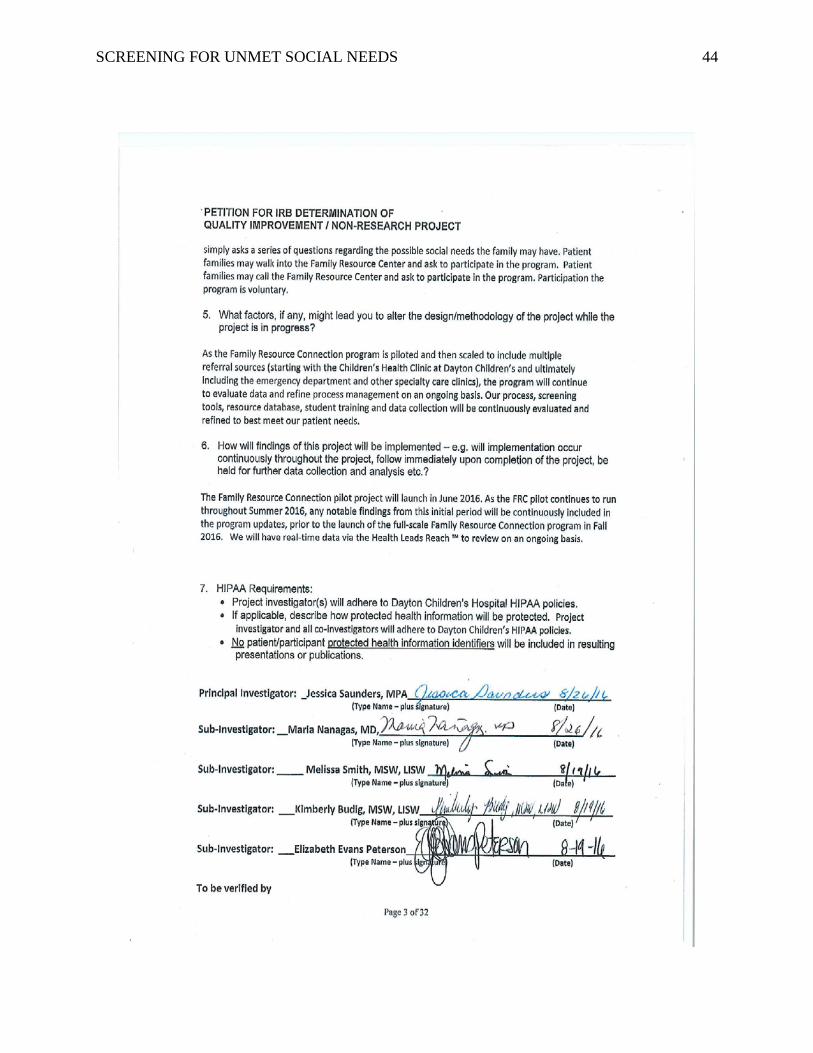
SCREENING FOR UNMET SOCIAL NEEDS 44

SCREENING FOR UNMET SOCIAL NEEDS 45
Appendix II: Program Screening Tool

SCREENING FOR UNMET SOCIAL NEEDS 46
Appendix III: List of Competencies Met in CE
Wright State Program Public Health Competencies
Assess and utilize quantitative and qualitative data. Apply analytical reasoning and methods in data analysis to describe the health of a community. Describe how policies, systems, and environment affect the health of populations. Communicate public health information to lay and/or professional audiences with linguistic and cultural sensitivity. Engage with community members and stakeholders using individual, team, and organizational opportunities. Evaluate and interpret evidence, including strengths, limitations, and practical implications. Demonstrate ethical standards in research, data collection and management, data analysis, and communication. Explain public health as part of a larger inter-related system of organizations that influence the health of populations at local, national, and global levels.
Concentration Specific Competencies
Health Promotion and Education: Area 4: Conduct Evaluation and Research Related to Health Education
4.1 Create purpose statement 4.2 Develop evaluation/research questions 4.3 Assess the merits and limitations of qualitative and quantitative data collection for research 4.4 Critique existing data collection instruments for research 4.6 Develop data analysis plan for research 4.9 Disseminate research findings through professional conference presentations