screening-level liquefaction hazard maps for australia
TRANSCRIPT
Australian Earthquake Engineering Society 2011 Conference, Nov 18-20, Barossa Valley, South Australia
Screening-Level Liquefaction Hazard Maps for Australia
Dr Timothy I Mote1 and James N Dismuke2
1. Corresponding Author. Associate, Arup,
201 Kent St. Lvl 10, Sydney, New South Wales Email: [email protected]
2. Senior Geotechnical Engineer, Arup, 201 Kent St. Lvl 10, Sydney, New South Wales Email: [email protected]
ABSTRACT Screening-level liquefaction hazard maps for Australia are created corresponding to design level ground motions for annual probability of exceedance equal to 10%, 5% and 2% in 50 years (equivalent to return periods of 500, 1000 and 2500 years, respectively) based on AS1170.4. The assessment integrates the Seed and Idriss (1971) cyclic stress ratio (CSR) into a GIS and iterates the CSR calculation on a 5km grid with spatially varying ground conditions, ground motions and magnitudes across the Australian continent. The calculation uses the Australian Site Class Map (Macpherson and Hall, 2007) to represent local ground conditions with ground motion acceleration according to the design level of interest from AS1170.4 (2007). The influence of earthquake magnitude on CSR, with respect to triggering liquefaction, is accounted for by using a magnitude duration weighting factor. AS1170.4 (2007) does not provide explicit guidelines for liquefaction assessment, specifically assignment of a representative earthquake magnitude or magnitude distribution plots for a specific design level. This study explores the selection of earthquake design magnitudes for Australian liquefaction triggering assessments through three earthquake design magnitude models. 1. mean magnitude derived from an approximate magnitude deaggregation developed in this study, 2. maximum magnitude in Australian stable continental regions after Clark et al., (2010), and 3. specific maximum magnitudes assigned to source zones in the Australian Hazard Map (Gaull et al., 1990). Keywords: Australia, liquefaction hazard maps, magnitude duration weighting factor, GIS. 1. INTRODUCTION Liquefaction is a soil behaviour in which saturated soil experiences a reduction in strength due to pore pressure increase during dynamic loading, such as earthquake ground shaking. Consequences of liquefaction include settlement, lateral displacement, loss of bearing capacity, and uplift of buried structures. The historic impact of liquefaction to society is well known from historic earthquakes including billions of dollars in damage from Northridge 1994, Kobe 1995, Loma Prieta (San Francisco) 1989 and most recently Christchurch 2011 and Japan 2011.

Infrastructure planning desk studies in Australia commonly identify liquefaction as a geohazard where susceptible soils exist within the project footprint. Further assessments are required in subsequent feasibility and detailed design phases. Accurately assessing the liquefaction potential is an essential part of geotechnical design considerations. Although Australia is considered a stable continental region (SCR) and seismic hazard is relatively low compared to other tectonically active areas of the world, geological conditions exist that are susceptible to liquefaction when subject to earthquake ground motion above a minimum value. In fact, liquefaction has been documented in Australia on at least three occasions. In 1897, liquefaction was observed during a large (Ms 6.5) earthquake nearBeachport, southeastern South Australia (Collins et al., 2004); in the 1903 Warrnambool, Victoria (Ml 5.3) earthquake (Mitchell and Moore, 2007); andin1968,numerous‘sandblows’wereobservedfollowingtheMs6.8earthquakeatMeckeringinWesternAustralia(Collinsetal.,2004). While, AS1170.4 (2007) Earthquake Design Actions does not provide guidance for liquefaction triggering assessments, liquefaction assessment methodology has been well established in earthquake engineering practice following Seed and Idriss (1971) and refinement over the last 40 years. These assessments generally need three critical input parameters; design ground motion and earthquake magnitude to estimate CSR, and ground conditions to estimate liquefaction susceptibility and Cyclic Resistance Ratio (CRR). These assessments generally conservative assume that groundwater is near the surface unless subsurface information proves otherwise. In Australian practice, liquefaction triggering assessments start with AS1170.4 (2007) to provide base ground motion levels (Z) from the Australian Seismic Hazard Map and guidance for importance levels to derive desired ground motions for design. Ground conditions are derived from site-specific investigations or, with a lack of site-specific ground investigations, published geologic mapping. For liquefaction triggering assessments in Australia, the critical missing input parameter is the earthquake design magnitude. In seismically active areas, a typical method for selecting magnitude is to consider the earthquake scenarios that contribute the greatest amount to the ground motion hazard. This is done by examination of the magnitude deaggregation of a probabilistic seismic hazard analysis (PSHA). In Australian practice, AS1170.4 (2007) and Gaull et al. (1990) with revision by McCue et al. (1993) do not provide enough information to readily extract earthquake design magnitudes or to develop magnitude deaggregation plots. As a result, earthquake engineering practitioners in Australia have applied a number of different methodologies to assign earthquake design magnitude for site-specific studies. These methods range from thorough consideration of magnitude to a somewhat arbitrary assignment, and include developing site-specific PSHA deaggregation plots, estimating mean values from regional recurrence curves, using the maximum historic earthquake in Australia for a region, and consideration of a range of magnitudes. To explore the potential for the liquefaction in Australia, considering the relatively low design ground motions and the arbitrary selection of design magnitudes for Australian liquefaction assessments, three magnitude models are integrated into a GIS-based CSR calculation to produce
Australia-wide liquefaction triggering hazard maps. The first magnitude model was developed in this study to estimate earthquake design magnitude by approximating deaggregation plots from information available in AS1170.4 (2007), Gaull et al. (1990) and other recent references. The second uses a constant earthquake design magnitude corresponding to the maximum credible earthquake in Australian stable continental regions (SCR) after Clark et al., (2010). The third uses specific maximum magnitudes assigned to each source zone of the Australian Hazard Map (Gaull et al., 1990). 2. LIQUEFACTION TRIGGERING EVALUATION METHODOLOGY Seed and Idriss (1971) proposed a simplified procedure for evaluation of liquefaction triggering using standard penetration test (SPT) N-values. Since that time, the simplified procedure has undergone many updates, and procedures using other in-situ test methods, such as the cone penetration test, Becker penetration test, shear wave velocity, and dilatometer have been developed. Each of the evaluation methods compares the soils’ resistance to liquefaction with the cyclic stress caused by an earthquake, expressed as the factor of safety against triggering liquefaction, FSliq. The resistance to liquefaction, commonly termed cyclic resistance ratio (CRR), depends on the relationship between the in-situ density of the soil with its critical state, as well as the behavior of the soil under earthquake-induced cyclic loading. Loose cohesionless soil that is at a state above the critical state line, or loose of critical, is highly susceptible to triggering liquefaction, while plastic soil and soil that is at a state below the critical state, or dense of critical, is least susceptible to triggering liquefaction. Evaluation of susceptibility to triggering liquefaction and CRR is commonly performed using the results of laboratory index testing and in-situ tests, such as those listed above, which have been calibrated with case histories of liquefaction and non-liquefaction to estimate CRR. For this Australia-wide study, the evaluation of in-situ tests is not feasible, so the Australian Site Classification Map is used as a proxy for liquefaction susceptibility and CRR. The driving cyclic stress cause by an earthquake is commonly termed cyclic stress ratio, CSR. CSR used in the simplified procedure for liquefaction triggering assessment is the average, or equivalent, shear stress induced by the earthquake divided by the in situ effective vertical stress. Seed and Idriss (1971) proposed that the average equivalent CSR for liquefaction triggering assessment is about 0.65 times the peak shear stress, and is estimated as:
Where σv is the total vertical stress, σv’ is the effective vertical stress, Amax is the maximum
acceleration (taken as peak ground acceleration, PGA, for liquefaction triggering assessment), and rd is the nonlinear shear-mass participation factor. FSliq by definition is the ratio of CRR to CSR, but is also affected by earthquake magnitude, the level of overburden stress, and presence of static shear stress. These aspects are incorporated in

a liquefaction triggering assessment using the magnitude-duration weighting factor, DWF, and factors kσ and kα to account for overburden stress and static shear stress, respectively. For this study, liquefaction hazard is mapped in areas where both geologic and seismologic conditions that indicate susceptibility to triggering liquefaction are present. This is achieved by deriving CSR where site Classes D, DE, and E are mapped. The site classes were chosen to represent areas where soil that is potentially susceptible to triggering liquefaction could exist.
CSR is computed assuming σv, σv’ and rd are constant near the ground surface, as discussed
below, leaving Amax to vary with geographical location. Amax is extracted from AS1170.4 (2007) for the appropriate design level. Magnitude duration effects on CSR are including using the DWF, which relies on an earthquake design magnitude. Earthquake magnitude is determined using three separate estimates. Liquefaction hazard is mapped where CSR is above a minimum value, as discussed below. This study assumes that groundwater is at the ground surface. 3. SITE CLASSIFICATION (PROXY FOR LIQUEFACTION SUSCEPTIBILITY AND
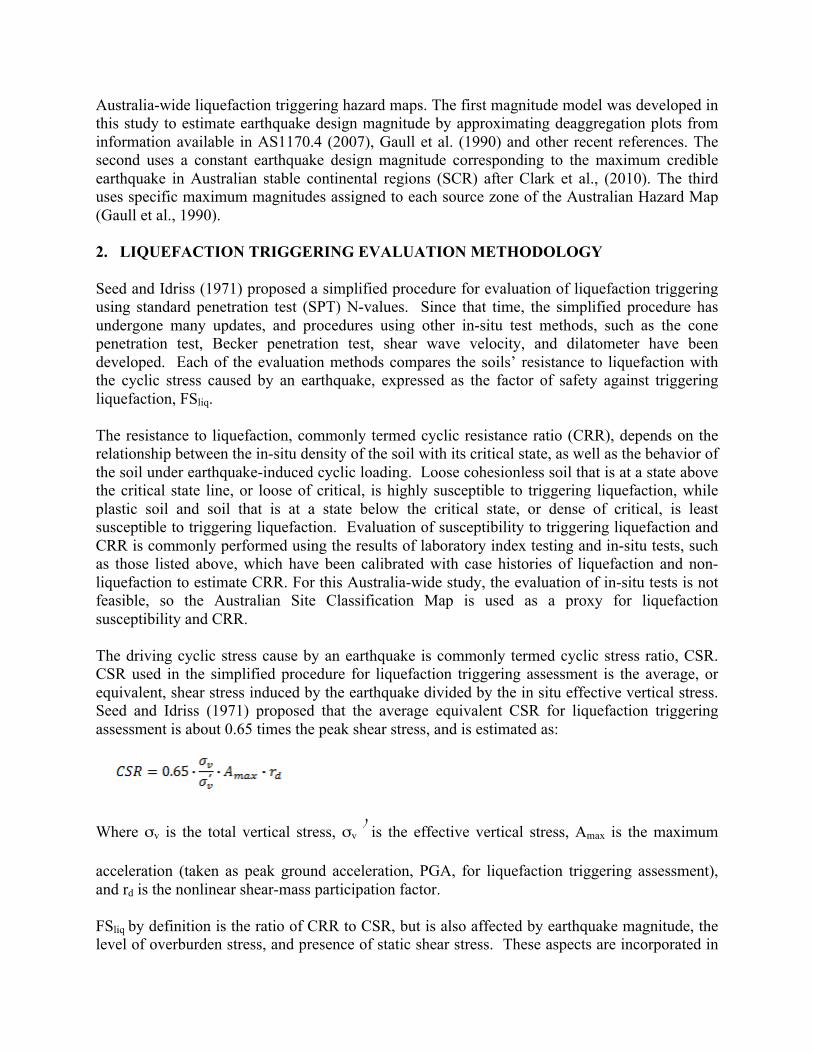
CRR) Geologically young or relatively loose soil and uncompacted or poorly compacted fills are generally the materials most susceptible to liquefaction. Among these, loose sands and nonplastic silts are particularly susceptible, but gravels and low plasticity clays can also be at risk. Dense soil and compacted fills have low susceptibility to liquefaction. High plasticity clay and bedrock generally are not susceptible to liquefaction. Soil that is geologically susceptible to liquefaction commonly exists within deposits of Quaternary-aged sediments and manmade fills. In practice, liquefaction triggering assessments should include evaluation of susceptibility using, at a minimum, gradation and Atterberg limit data (Seed et al., 2003, and Idriss and Boulanger, 2008) prior to estimation of CRR; however for this study, an evaluation of susceptibility is neglected and potentially liquefiable soil is assumed to occur wherever Quaternary-aged sediment or manmade fills are present. The site classification maps of McPherson and Hall (2007) indicate surficial geology broadly classed by shear wave velocity in the uppermost 30 meters below the ground surface, Vs30 (Figure 1). As indicated on the maps, the classifications of D, DE, and E correspond generally to Quaternary-aged deposits. Therefore, we have assumed that potentially liquefiable soil exists wherever Site Class D, DE, and E are mapped. The site classification map was input into the GIS and site classification values for a grid with ~5km spacing across Australia were extracted. The model includes ~160,000 grid cells susceptible to liquefaction from the assigned Site Class D, DE, and E. At the time of this study a digital or detailed version of the site class map was not available; therefore the resolution of this dataset is limited to the maps in the original McPherson and Hall (2007) paper.
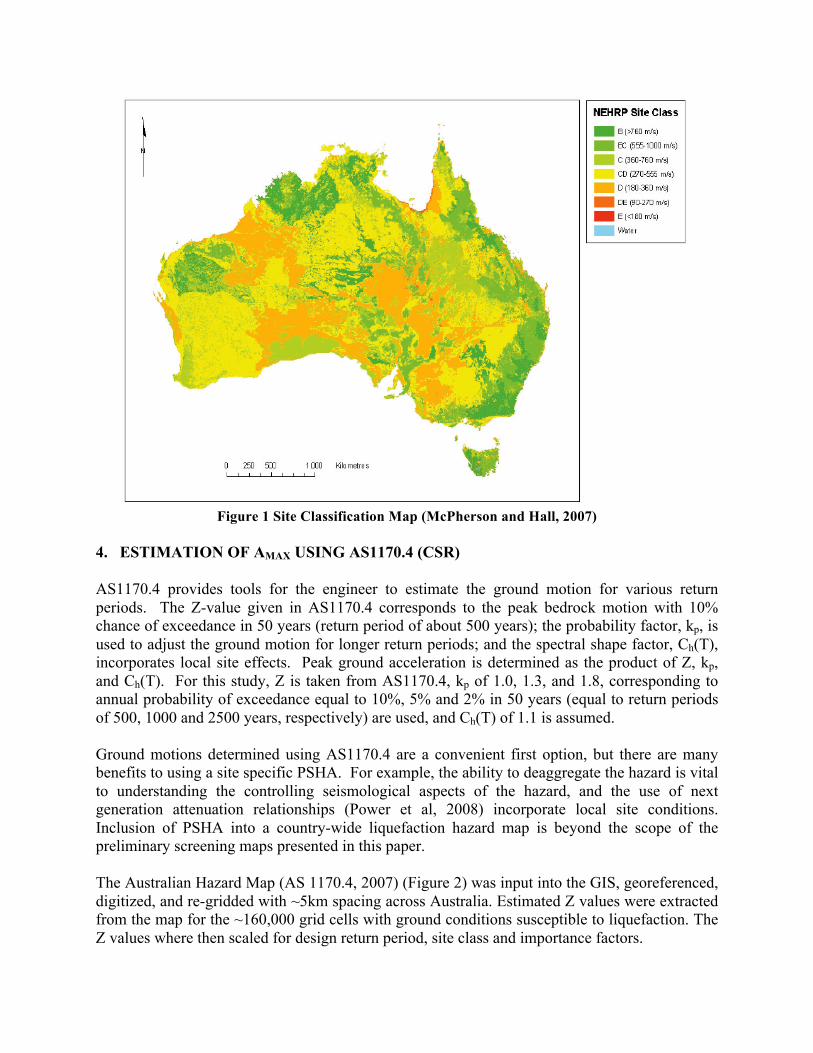
Figure 1 Site Classification Map (McPherson and Hall, 2007)
4. ESTIMATION OF AMAX USING AS1170.4 (CSR) AS1170.4 provides tools for the engineer to estimate the ground motion for various return periods. The Z-value given in AS1170.4 corresponds to the peak bedrock motion with 10% chance of exceedance in 50 years (return period of about 500 years); the probability factor, kp, is used to adjust the ground motion for longer return periods; and the spectral shape factor, Ch(T), incorporates local site effects. Peak ground acceleration is determined as the product of Z, kp, and Ch(T). For this study, Z is taken from AS1170.4, kp of 1.0, 1.3, and 1.8, corresponding to annual probability of exceedance equal to 10%, 5% and 2% in 50 years (equal to return periods of 500, 1000 and 2500 years, respectively) are used, and Ch(T) of 1.1 is assumed. Ground motions determined using AS1170.4 are a convenient first option, but there are many benefits to using a site specific PSHA. For example, the ability to deaggregate the hazard is vital to understanding the controlling seismological aspects of the hazard, and the use of next generation attenuation relationships (Power et al, 2008) incorporate local site conditions. Inclusion of PSHA into a country-wide liquefaction hazard map is beyond the scope of the preliminary screening maps presented in this paper. The Australian Hazard Map (AS 1170.4, 2007) (Figure 2) was input into the GIS, georeferenced, digitized, and re-gridded with ~5km spacing across Australia. Estimated Z values were extracted from the map for the ~160,000 grid cells with ground conditions susceptible to liquefaction. The Z values where then scaled for design return period, site class and importance factors.
Figure 2 Earthquake Hazard Map (AS 1170.4, 2007) 5. ESTIMATION OF DESIGN MAGNITUDE AND THE DURATION WEIGHTING
FUNCTION (DWF) The impact of duration of strong ground motion on CSR is considered using the magnitude-duration weight factor, DWF. For this study kσ and kα are attributed to cyclic resistance and do not impact the determination of CSR. Design-level assessment of FSliq should incorporate all of these factors, however. The magnitude-duration weighted cyclic stress ratio, CSR7.5, is computed as:
DWF requires a design magnitude as input, which is determined in this study following three models: Approximate Deaggregation, SCR Maximum Magnitude, and Maximum Magnitude from AS1170.4.
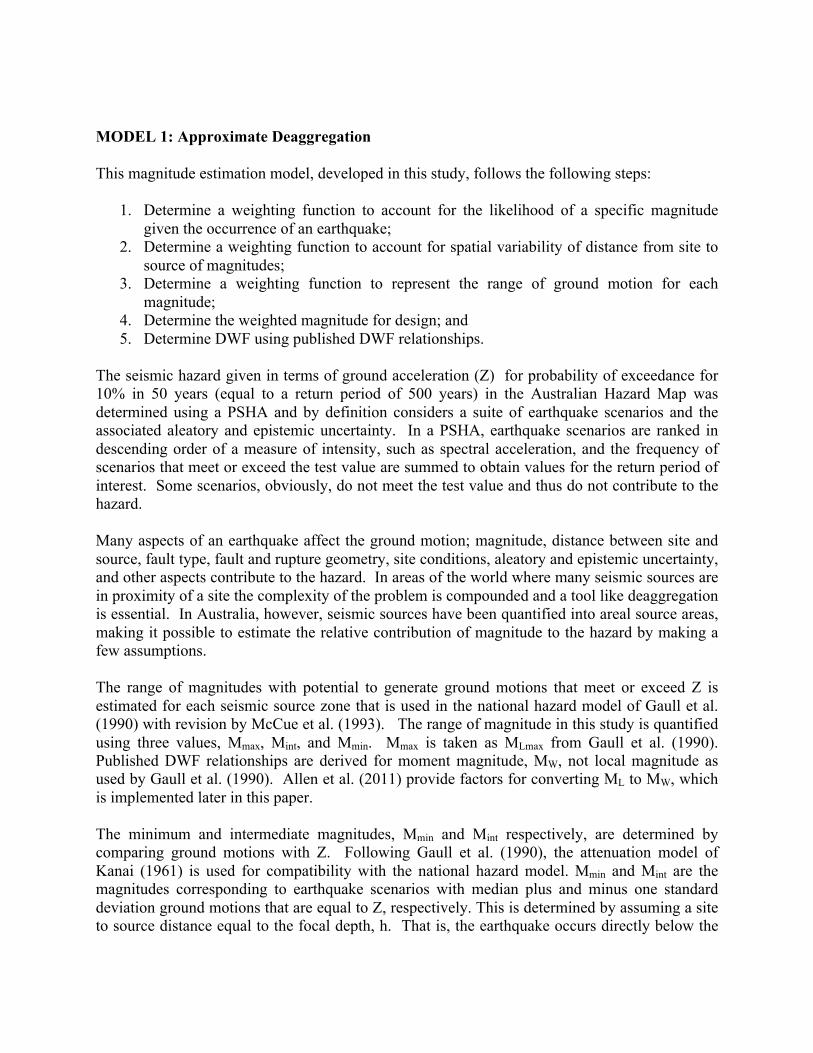
MODEL 1: Approximate Deaggregation This magnitude estimation model, developed in this study, follows the following steps:
1. Determine a weighting function to account for the likelihood of a specific magnitude given the occurrence of an earthquake;
2. Determine a weighting function to account for spatial variability of distance from site to source of magnitudes;
3. Determine a weighting function to represent the range of ground motion for each magnitude;
4. Determine the weighted magnitude for design; and 5. Determine DWF using published DWF relationships.
The seismic hazard given in terms of ground acceleration (Z) for probability of exceedance for 10% in 50 years (equal to a return period of 500 years) in the Australian Hazard Map was determined using a PSHA and by definition considers a suite of earthquake scenarios and the associated aleatory and epistemic uncertainty. In a PSHA, earthquake scenarios are ranked in descending order of a measure of intensity, such as spectral acceleration, and the frequency of scenarios that meet or exceed the test value are summed to obtain values for the return period of interest. Some scenarios, obviously, do not meet the test value and thus do not contribute to the hazard. Many aspects of an earthquake affect the ground motion; magnitude, distance between site and source, fault type, fault and rupture geometry, site conditions, aleatory and epistemic uncertainty, and other aspects contribute to the hazard. In areas of the world where many seismic sources are in proximity of a site the complexity of the problem is compounded and a tool like deaggregation is essential. In Australia, however, seismic sources have been quantified into areal source areas, making it possible to estimate the relative contribution of magnitude to the hazard by making a few assumptions. The range of magnitudes with potential to generate ground motions that meet or exceed Z is estimated for each seismic source zone that is used in the national hazard model of Gaull et al. (1990) with revision by McCue et al. (1993). The range of magnitude in this study is quantified using three values, Mmax, Mint, and Mmin. Mmax is taken as MLmax from Gaull et al. (1990). Published DWF relationships are derived for moment magnitude, MW, not local magnitude as used by Gaull et al. (1990). Allen et al. (2011) provide factors for converting ML to MW, which is implemented later in this paper. The minimum and intermediate magnitudes, Mmin and Mint respectively, are determined by comparing ground motions with Z. Following Gaull et al. (1990), the attenuation model of Kanai (1961) is used for compatibility with the national hazard model. Mmin and Mint are the magnitudes corresponding to earthquake scenarios with median plus and minus one standard deviation ground motions that are equal to Z, respectively. This is determined by assuming a site to source distance equal to the focal depth, h. That is, the earthquake occurs directly below the

site. Determination of Mmax, Mint, and Mmin is illustrated on Figure 3 and summarized in Table 1. The use of these values is discussed in the following section. Variability and uncertainty have been neglected in determination of magnitude, but a key feature of a PSHA is the explicit consideration of error. A full treatment of variability and uncertainty is beyond the scope of these preliminary hazard maps and will be incorporated in later models that include a complete PSHA, as discussed previously. In this study variability and uncertainty is accounted for through consideration of ground motion plus and minus one standard deviation.
Figure 3: Range of Magnitude for Seismic Source Zone 1
Weighting function for magnitude likelihood This weighting function accounts for the relative likelihood of magnitudes given occurrence of an earthquake. Recall that the criterion of PSHA is only that the ground motion is met or exceeded. It is irrelevant by how much it is exceeded or which magnitude is driving the specific scenario. However, the DWF is a nonlinear function of magnitude and therefore sensitive to magnitude. Thus the likelihood of lower magnitudes compared to higher magnitudes is important. The magnitude density function is used in this study to account for relative likelihood of magnitude. The magnitude density functions used by Gaull et al. (1990) are truncated exponential distributions expressed as:
for Where α is ln(10) time the b-value.

Weighting function for areal extent of possible epicenters The weighting function, fR(M), accounts for the areal extent of possible epicenters and the size of each seismic source zone. Mmin and Mint were determined assuming the site was situated at the epicenter, but earthquakes can occur anywhere within a source zone. Mmin must be greater if the site is offset from the epicenter. Therefore, this weighting function is represented by areas of concentric circles where a specific magnitude occurring within the area is likely to meet or exceed the hazard. Figure 4 illustrates this concept. The left side of Figure 4 illustrates the site to source distance term, R, used in Gaull et all (1990) and Kanai (1961). Considering only earthquakes occurring at the mean focal depth, there is an area where earthquakes above some minimum magnitude are likely to exceed the hazard, as shown on the right side of Figure 4. At a distance of B, the minimum magnitude likely to generate ground motions that meet or exceed the hazard is larger than at a distance of A, by definition. Earthquakes of magnitude Mmin,B could occur anywhere within the area with radius equal to B and generate ground motions that meet or exceed Z. Likewise, earthquakes of magnitude Mmin,A could occur anywhere within the area with radius equal to A and generate ground motions that meet or exceed Z.
Figure 4: Tributary area for fR(M)
In order to define fR(M), the value of R was determined for a range of magnitudes such that Z was achieved at +1 standard error. This process is similar to that described for determination of Mmin, except the attenuation equation is rewritten with R as the unknown value. The areal weighting function, fR(M), is shown below for circular areas.
for
Where a, b, c, d, and σ are given by Gaull et al. (1990). Large magnitude earthquakes have potential to generate Z at distances that exceed the areal extent of a seismic source zone;

therefore, consideration for the shape of the source zone must be given in fR(M). This is accomplished by limiting the area contribution where appropriate. Note that fR(M) represents possible epicenters and does not consider rupture geometry. Additionally, the extent of the seismic source zone is more accurately represented by a volume confined within the seismogenic zone, but for simplicity, area is used in this study. Weighting function for ground motion variability In Figure 3, Mmin is the minimum magnitude that has potential for generating ground motions that meet or exceed Z. It is expected that essentially zero earthquake scenarios using Mmin will meet or exceed the hazard, but in contrast, likely any scenario at Mmax (given as 7.5 in Figure 3) will exceed the hazard. In fact, examination of Figure 3 indicates that between Mint and Mmax, the full range of variability in ground motion considered (one standard deviation) will potentially meet or exceed the hazard. This observation is adapted as a weighting function such that magnitudes above Mint are weighted at 100%; magnitude of Mmin is weighted at 0; and a linear relationship is used between Mmin and Mint. The weighting function for ground motion variability, fV(M), is shown in Figure 5 and given as: for for
Figure 5: fV(M) of Seismic Source Zone 1
Weighted Design Magnitude The weighted earthquake design magnitude is determined by normalizing the product of the three functions (Figure 6):
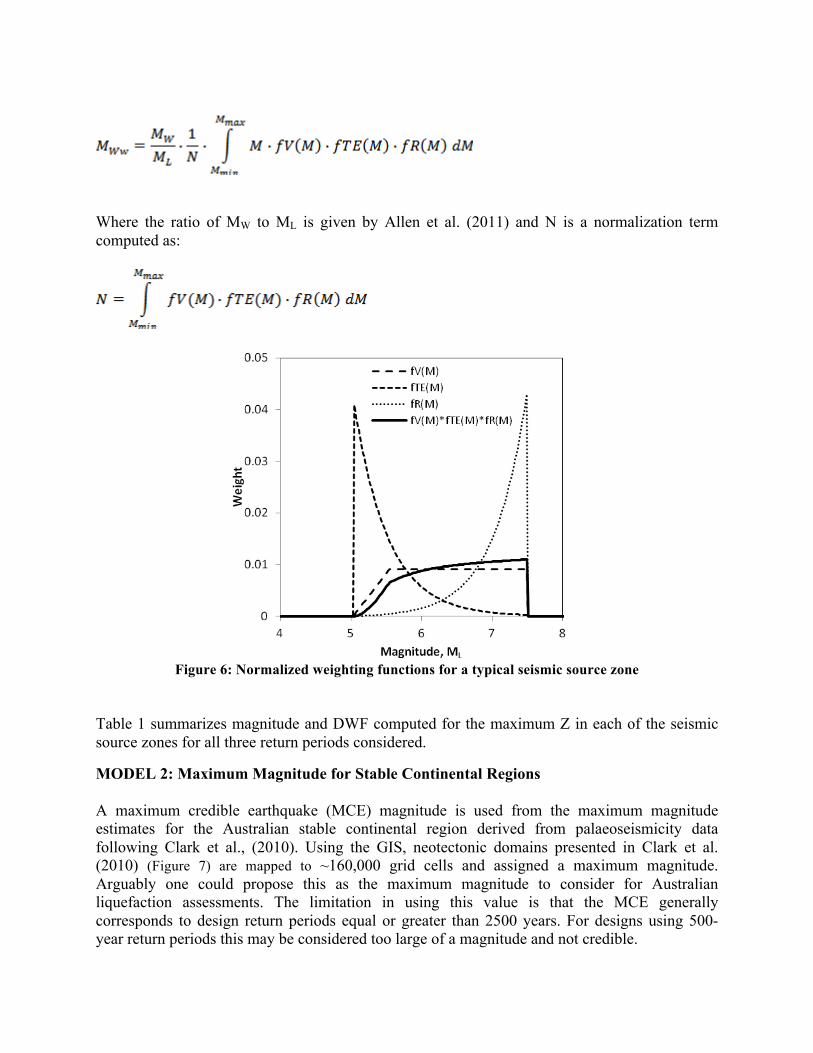
Where the ratio of MW to ML is given by Allen et al. (2011) and N is a normalization term computed as:
Figure 6: Normalized weighting functions for a typical seismic source zone
Table 1 summarizes magnitude and DWF computed for the maximum Z in each of the seismic source zones for all three return periods considered.
MODEL 2: Maximum Magnitude for Stable Continental Regions A maximum credible earthquake (MCE) magnitude is used from the maximum magnitude estimates for the Australian stable continental region derived from palaeoseismicity data following Clark et al., (2010). Using the GIS, neotectonic domains presented in Clark et al. (2010) (Figure 7) are mapped to ~160,000 grid cells and assigned a maximum magnitude. Arguably one could propose this as the maximum magnitude to consider for Australian liquefaction assessments. The limitation in using this value is that the MCE generally corresponds to design return periods equal or greater than 2500 years. For designs using 500-year return periods this may be considered too large of a magnitude and not credible.

Figure 7: Neotectonic domains (D) and Maximum magnitudes (Mmax) from Clark et al. (2010).
D1 = Mmax7.0, D2 = Mmax7.2, D3= Mmax7.4, D4 = Mmax7.3, D5 = Mmax7.1, D6 = Mmax7.5
MODEL 3: Maximum Magnitude Derived from AS1170.4 The background reference for the Australian Hazard Map in AS1170.4 (2007) from Gaull et al. (1990) and McCue et al. (1993) provide maximum magnitudes for the source zones used in the national hazard model. These magnitudes are the MCE for each respective zone (Table 1 and Figure 8) and used as the liquefaction triggering design magnitude for each zone specific DWF.

Figure 8 Source Zones for the Australian Hazard Map (Gaull et al., 1990).
As with the maximum magnitude for SCR model, the maximum magnitude generally corresponds to design return periods equal or greater than 2500-years. For designs corresponding to annual probability of exceedance equal to 10% in 50 years (equivalent to a 500-year return period) this may be considered too large of a magnitude and not credible. Duration Weighting Factor Currently, there are four relationships for DWF that are commonly used for computation of CSR. Youd et al. (2001) was the standard reference for liquefaction triggering assessment for many years and continues to be used in some parts of the world; however, recent updates to liquefaction triggering, including an expanded database of case histories, have been issued by Cetin et al. (2004), Moss et al. (2006), and Idriss and Boulanger (2008). For this study we are only considering DWF relationships of Moss et al. (2006) and Idriss and Boulanger (2008). The Youd et al. (2001) DWF relationship was not used because it has been superseded by the updated triggering procedures, and the relationship of Cetin et al. (2004) was not used because it was essentially superseded by Moss et al. (2006). DWF was capped at values corresponding to M5.25 for the Idriss and Boulanger (2008) relationship and at M5.5 for Moss et al. (2006) based on the range of values presented in each reference. Regardless, future design level triggering evaluations should use the DWF interpretation appropriate for the specific method. 6. DETERMINATION OF CSR 7.5 CSR7.5 was calculated considering the three magnitude models for ~160,000 5km grid cells across Australia under the following assumptions:
• Amax is equal to Z (AS1170.4-2007) with site factor of 1.1 for Site Class D, DE, and E and importance factors corresponding to return periods of 500, 1000, and 2500 years;

• The ratio of σv to σv’ is about 2 for an assumed total unit weight of 20 kN/m3; • Groundwater level is at or near the ground surface; • rd is 1 near the ground surface; and • An average DWF of capped values determined by Moss et al. (2006) and Idriss and
Boulanger (2008). 7. SCREENING LEVEL LIQUEFACTION HAZARD MAPS Liquefaction hazard maps are presented in Figure 9 for annual probability of exceedance equal to 10%, 5% and 2% in 50 years (equivalent to return periods of 500, 1000 and 2500 years, respectively) and the three magnitude estimates models presented above. On the maps, red is considered high liquefaction triggering potential, orange is moderate, and green is low triggering potential. The gray zones are identified as rock (Site Class S, B, or C). Liquefaction and no-liquefaction case history databases recently used by Cetin et al. (2004), Moss et al. (2006), and Idriss and Boulanger (2008) for SPT- and CPT-based triggering assessment procedures indicate that the minimum CSR7.5 where liquefaction was observed is about 0.05 for very loose to loose sand and about 0.1 for loose to medium dense sand. Thus, liquefaction hazard is considered to be high where CSR7.5 is greater than 0.1 (red areas on the hazard maps) and moderate where CSR7.5 is greater than 0.05 but less than 0.1 (yellow areas on the hazard maps).

Figure 9 Screening-Level Liquefaction Hazard Maps
Approximate Deaggregation Model
AS 1170.4 Source Zone Maximum Magnitude Model
Stable Continental Region Maximum Magnitude (7.5) Model

Table 1: Summary of magnitude used to calculate DWF for the maximum Z within each seismic source zone
Model: AS1170.4 Approximate Deaggregation Model Magnitude SCR
500 year Return Period 1000 year Return Period 2500 year Return Period
Source Zone Mlmax [1] Z [2] MWw [3] Z [4] MWw [3] Z [5] MWw [3] MSCR [6]
1 7.5 0.22 6.56 0.29 6.71 0.40 6.86 7.00
2 7.5 0.15 6.29 0.20 6.44 0.27 6.62 7.00
5 7 0.09 5.91 0.12 6.02 0.16 6.16 7.40
5A 7 0.09 5.89 0.12 6.02 0.16 6.16 7.40
6 6 0.09 5.22 0.12 5.34 0.16 5.48 7.00
7 4.5 0.07 3.93 0.09 3.99 0.13 4.05 7.00
8 7.7 0.12 6.35 0.16 6.49 0.22 6.66 7.50
9 6 0.12 5.33 0.16 5.45 0.22 5.60 7.00
10A south 7.5 0.15 6.28 0.20 6.43 0.27 6.61 7.40
10A 7.5 0.12 6.16 0.16 6.31 0.22 6.50 7.50
10A north 7 0.12 5.91 0.16 6.05 0.22 6.22 7.50
14 7 0.11 5.87 0.14 6.01 0.20 6.18 7.40
Tennant Creek 7 0.15 6.00 0.20 6.13 0.27 6.27 7.50
15 7 0.12 5.90 0.16 6.02 0.22 6.17 7.40
16 6 0.14 5.22 0.18 5.34 0.25 5.47 7.20
17 6 0.10 5.05 0.13 5.18 0.18 5.33 7.00
18 7 0.12 5.49 0.16 5.67 0.22 5.89 7.00
19 6 0.08 4.94 0.10 5.07 0.14 5.23 7.00
20 6 0.11 5.16 0.14 5.27 0.20 5.39 7.00
21W 7.5 0.21 6.31 0.27 6.44 0.38 6.58 7.30
21E 7 0.21 5.94 0.27 6.07 0.38 6.21 7.30
22 6.1 0.08 4.91 0.10 5.06 0.14 5.24 7.30
Deniliquin 6.1 0.10 5.04 0.13 5.19 0.18 5.36 7.30
23 6.1 0.12 5.24 0.16 5.35 0.22 5.48 7.30
Newcastle 6.1 0.11 5.20 0.14 5.32 0.20 5.45 7.30
24 5.8 0.06 4.83 0.08 4.93 0.11 5.05 7.30
25 4.5 0.06 4.21 0.08 4.21 0.11 4.21 7.30
26 5.8 0.06 4.94 0.08 5.06 0.11 5.19 7.30
27 5.5 0.06 4.79 0.08 4.89 0.11 5.01 7.30
28 6.8 0.12 5.87 0.16 5.97 0.22 6.09 7.30
29 6 0.09 5.27 0.12 5.36 0.16 5.48 7.30
30 5.8 0.06 4.96 0.08 5.07 0.11 5.20 7.30
East 5.5 0.06 4.77 0.08 4.88 0.11 5.00 7.30
Melbourne 3.6 0.06 3.66 0.08 3.66 0.11 3.66 7.30
West 5 0.06 4.35 0.08 4.47 0.11 4.68 7.40 Notes: 1. MLmax given by Gaull et al. (1990). 2. Maximum Z for 500 yr return period given by AS1170.4 in each seismic source zone. 3. MWw is the weighted magnitude discussed in this paper, converted from ML to MW using Allen et al. (2011). 4. Z for 1000 yr return period = 1.3 · Z for 500 yr return period. 5. Z for 2500 yr return period = 1.8 · Z for 500 yr return period. 6. MSCR for Australian stable continental regions, after Clark et al., (2010) based on the largest estimated Mmax in the zone.
8. CONCLUSIONS AND DISCUSSION Although soil susceptible to liquefaction exists in geologically-young sediments throughout Australia, liquefaction potential is limited by seismological aspects, such as ground motions levels and earthquake magnitude. The basis of the liquefaction hazard maps developed in this study, is the determination of earthquake induced cyclic stress that is sufficient to trigger liquefaction. In the absence of a deaggregated PSHA, controlling magnitudes and magnitude-duration weighting factors are determined using several simplifications of the PSHA underlying the potential ground motions. The liquefaction hazard maps are intended as an aid for planning site investigations, not as an assessment of liquefaction triggering at a specific site. The liquefaction hazard maps (Figure 9) are developed for Australia corresponding to AS1170.4 design level ground motions for annual probability of exceedance equal to 10%, 5% and 2% in 50 years (equal to return periods of 500, 1000 and 2500 years, respectively) provide screening level tools to assess liquefaction triggering hazard throughout Australia. The maps assume groundwater is at the ground surface and use the small scale Australian Site Classification map as a proxy for ground conditions, therefore consideration of groundwater and confirmation that local Site Class falls into D, DE and E is required to properly apply these maps. In practice, if ground conditions at a site are Class D, DE, or E and fall into the high liquefaction hazard zone of the design return period ground motion, a site investigation should include components specifically for assessment of susceptibility and triggering of liquefaction. For example, sieve analyses and Atterberg limits determinations to assess susceptibility and cone penetration tests paired with borings to define stratigraphy and assess triggering potential. If a site falls in the moderate zone then confirmation of soil conditions is suggested before a further detailed liquefaction assessment is implemented. For all hazard levels, site specific knowledge of soil and groundwater conditions should be used to plan site investigations, in cooperation with these maps. The development of the liquefaction triggering maps for three different design magnitude models allows for an assessment of selection of design magnitudes in practice. Figure 9 shows the three models: 1. mean magnitude derived from an approximate magnitude deaggregation developed in this study, 2. magnitude corresponding to maximum magnitude in stable continental regions after Clark et al., (2010), and 3. specific maximum magnitudes assigned to source zones in the Australian Hazard Map (Gaull et al. 1990). Comparison of the extent of high liquefaction hazard in the maps shows that the design magnitude has a significant role in the liquefaction triggering assessment. Intuitively, the maximum magnitude for the SCR model creates the largest extent of high liquefaction hazard. This result is not surprising as it considers the MCE and not design level events. A typical method for selecting magnitude is to consider the earthquake scenarios that contribute the greatest amount to the ground motion hazard through an examination of the magnitude deaggregation of a PSHA. In Australia, this information is not readily available in AS1170.4 (2007) however; the Australian Hazard Model provides information on the broad seismic sources quantified into areal source areas, making it possible to estimate the relative contribution of magnitude to the hazard by making a few assumptions. The earthquake design magnitude selection model developed in this study approximates the magnitude

deaggregation and, the authors feel, provides a basis to guide earthquake design magnitude selection. The methods presented in this paper are simplifications of the seismological aspects of the ground motion hazard, and should be considered preliminary until such time as deaggregated results of a PSHA are incorporated. The scale of the mapping is considered on the order of 1:5,000,000 due to the digitization of a number of small scale figures. Development of these maps includes several assumptions that tend to be conservative, such as:
• Soil that is susceptible to triggering liquefaction is assumed to be present everywhere Site Classes D, DE, or E is mapped. Although this is a conservative assumption, as it yields the greatest area of positive liquefaction hazard, it is necessary to ensure that site investigations are designed to gather the proper data for assessment of liquefaction.
• The ground motion variability of one standard error that is assumed in the approximate deaggregation model yield design magnitudes that are likely larger than design magnitudes determined by considering more than one standard error, as is customary in modern PSHA.
• DWF values are capped at M 5.25 to 5.5. This was done because the DWF relationships are not developed for lower magnitudes. Although it is unlikely that earthquake-induced liquefaction is triggered by earthquakes with low magnitudes, the capping of DWF adds to conservatism in the hazard results.
• Calculation of CSR at the ground surface with a high groundwater table yields maximum CSR values. Actual site and groundwater conditions will likely yield lower CSR. This aspect of the hazard maps was implemented for simplification. The hazard maps should always be reality checked against local site and groundwater conditions.
Several aspects of the map may be improved, such as:
• Updated estimation of Z using the next generation Australian National Earthquake Hazard Map;
• Better understanding of magnitude through deaggregation of PSHA; • Use of modern attenuation models that incorporate site effects; • Incorporation of the detailed Australian Site Classification Map; • Consideration of groundwater levels; and • Ground truth using site specific knowledge of geological conditions and engineering
properties. 9. REFERENCES Allen, T.I., Burbridge, D.R., Clark, D., McPherson, A.A., Collins, C.D.N., and Leonard, M., 2011. Development of the next generation Australia National Hazard Earthquake Hazard Map, Proceedings of the Ninth Pacific Conference on Earthquake Engineering, Auckland, New Zealand. Australian Standards Australia, 2007. Structural design actions, part 4: Earthquake actions in Australia. Standards Australia.

Cetin, K.O., Seed, R.B., Der Kiureghian, A., Tokimatsu, K., Harder, L.F., Kayen, R.E., and Moss, R.E.S., 2004. Standard penetration test-based probabilistic and deterministic assessment of seismic soil liquefaction potential, Journal of Geotechnical and Geoenvironmental Engineering, ASCE 130(12), 1314-340. Clark, D., McPherson, A., and Collins, C., 2010. Mmax estimates for the Australian stable continental region (SCR) derived from palaeoseismicity data. AEES 2010 Cummins C. Collins, P. Cummins & D. Clark M. Tuttle R. Van Arsdale, 2004,Paleoliquefaction studies in Australia to constrain earthquake hazard estimates. AEES 2004. Gaull, B.A., Michael-Leiba, M.O., and Rynn, J.M.W., 1990. Probabilistic earthquake risk maps of Australia. Australian Journal of Earth Sciences 37, 169-187. Idriss, I.M., and Boulanger, R.W., 2008. “Soil Liquefaction During Earthquakes,” monograph series, No. MNO-12, Earthquake Engineering Research Institute. Kanai, K., 1961. An empirical formula for the spectrum of strong earthquake motions. Bulletin of the Earthquake Research Institute, University of Tokyo 39, 85-96. McCue, K., (Compiler), Gibson, G., Michael-Leiba, M., Love, D., Cuthbertson, R., & Horoschun, G., 1993. Earthquake hazard map of Australia, 1991. McPherson, A.A. and Hall, L.S. 2007. Development of the Australian National Regolith Site Classification Map. Geoscience Australia Record 2007/07, 37 p. Mitchell P. W. and Moore C. 2007, Difficulties in assessing liquefaction potential from conventional field testing. AEES 2007 Moss, R.E.S., Seed, R.B., Kayen, R.E., Stewart, J.P., Der Kiureghian, A., and Cetin, K.O., 2006. CPT-based probabilistic and deterministic assessment of in situ seismic soil liquefaction potential, Journal of Geotechnical and Geoenvironmental Engineering, ASCE 132(8), 1032-051. Power, M., Chiou, B., Abrahamson, N., Bozorgnia, Y., and Roblee, C., 2008. An Overview of the NGA Project. Earthquake Spectra, Volume 24, No. 1, pages 3-21, February. Seed, H. B., and Idriss, I. M., 1971. Simplified procedure for evaluating soil liquefaction potential. Journal of the Geotechnical Engineering Division, ASCE, 97(9), 1249–1273. Seed, R.B., Cetin, K.O., Moss, R.E.S., Kammerer, A., Wu, J., Pestana, J., Riemer, M., Sancio, R.B., Bray, J.D., Kayen, R.E., and Faris, A., 2003. Recent Advanced in Soil Liquefaction Engineering: a Unified and Consistent Framework, Keynote presentation, 26th Annual ASCE Los Angeles Geotechnical Spring Seminar, Long Beach, CA. Youd, T.L., Idriss, I.M., Andrus, R.D., Arango, I., Castor, G., Christian, J.T., Dobry, R., Finn, W.D.L., Harder, L.F., Hynes, M.E., Ishihara, K., Koester, J.P., Liao, S.S.C., Marcuson, W.F., Martin, G.R., Mitchell, J.K., Moriwaki, Y., Power, M.S., Robertson, P.K., Seed, R.B., and Stokoe, K.H., 2001. Liquefaction Resistance of Soils: Summary Report from the 1996

NCEER and 1998 NCEER/NSF Workshops on Evaluation of Liquefaction Resistance of Soils, Journal of Geotechnical and Geoenvironmental Engineering, ASCE 127(10), 817-833.