sdg index and dashboards report 2018 global sdgs 2018 g20 edition... · from major inputs from...
TRANSCRIPT
SDG INDEX AND DASHBOARDS REPORT 2018
IMPLEMENTING THE GOALSG20 AND LARGE COUNTRIES EDITION
GLOBAL RESPONSIBILITIES
SDG INDEX AND DASHBOARDS REPORT 2018
SDG
IND
EX A
ND
DA
SHB
OA
RD
S REPO
RT 20
18 G20
AN
D LA
RG
E COU
NTR
IES EDITIO
N
July 2018
© Bertelsmann Stiftung and Sustainable Development Solutions Network
The views expressed in this report do not reflect the views of any organizations, agency
or programme of the United Nations. It has been prepared by the team of independent
experts of the SDSN Secretariat and the Bertelsmann Stiftung.
This report has been prepared with the extensive advice and consultation of the SDSN
Leadership Council members. Members of the Leadership Council serve in their personal
capacities, so the opinions expressed in this paper may not reflect the opinions of their
host institutions. Members are not necessarily in agreement with every detail of this report.
Lead writers are Jeffrey Sachs, Guido Schmidt-Traub, Christian Kroll, Guillaume Lafortune
and Grayson Fuller. The report should be cited as: Sachs, J., Schmidt-Traub, G., Kroll, C.,
Lafortune, G., Fuller, G. (2018): SDG Index and Dashboards Report 2018. New York:
Bertelsmann Stiftung and Sustainable Development Solutions Network (SDSN).
Guillaume Lafortune coordinated the production of the report under the direction of
Guido Schmidt-Traub and Christian Kroll and under the overall supervision of Jeffrey
Sachs. Grayson Fuller was responsible for the data collection and management.
Design and Layout by Pica Publishing ltd – www.pica-publishing.com
SDG Index and Dashboards Report 2018
IMPLEMENTING THE GOALSGLOBAL RESPONSIBILITIES
G20 AND LARGE COUNTRIES EDITION
SDG Index and Dashboards Report 2018 Global Responsibilitiesii
Acknowledgements
The Bertelsmann Stiftung and the Sustainable Development Solutions Network (SDSN) co-produced the 2018 SDG Index and Dashboards report. The report was coordinated by Guillaume Lafortune under the direction of Christian Kroll (Bertelsmann Stiftung) and Guido Schmidt-Traub (SDSN) and the overall supervision of Jeffrey Sachs. The report benefited from major inputs from members of the SDSN and its Leadership Council. The report was drafted by Guido-Schmidt-Traub, Christian Kroll, Guillaume Lafortune and Grayson Fuller. Grayson Fuller was the lead data analyst for the report. We are grateful to Jorge Moreno for providing statistical support.
The report brings together the results from data collection and analyses produced by a wide range of international organizations, civil society organizations, and research centers. We want to thank all the researchers for their contributions and collaboration in producing the report. The full list of contributing organizations is available in the section on “References.”
We would also like to thank the regional and national SDSN networks, experts, and government officials for responding to the survey on “national implementation and coordination mechanisms for the SDGs at the central/federal level.” That section also benefited from major inputs from Chandrika Bahadur, María Cortés-Puch, Lara Dahan, Eve de la Mothe Karoubi, Marine Formentini, Holger Kuhle, Laurie Manderino, Dorothea Strüber, and Yingxin Ye.
We would also like to thank organizations, government officials, and individuals who contributed to this report by providing valuable comments during the public consultations organized from April 30 to May 11, 2018.
María Cortés-Puch, Elena Crete, Ryan Swaney, and Benjamin Stappenbeck provided communication support for the launch of the report. Roberto Rossi (PICA Publishing) prepared the manuscript for publication.
We thank the German Mission to the UN for hosting our New York SDG Index event during the UN High-Level Political Forum, in particular Ambassador Christoph Heusgen and his team.
We would also like to thank the following Bertelsmann Stiftung staff members and affiliates for their support: Nicole Adams, Irene Braam, Stefan Empter, Agnes Gabriel, Sam George, Gabriele Horsmann, Florian Köbele, Megan Long, Pia Paulini, Daniel Schraad-Tischler, Robert Schwarz, Benjamin Stappenbeck, Stephan Strothe, Samia Yakub and Malte Tim Zabel.
iiiSDG Index and Dashboards Report 2018 Global Responsibilities
Foreword vi
Executive summary viii
Part 1. Are governments in G20 countries getting organized for the SDGs? 1
Overall institutionalization of the SDGs in G20 countries 2
Evaluating targets and policy actions for the SDGs 3
Strengthening accountability mechanisms 4
Integrating the SDGs into budgets, and public management practices and procedures 5
Conclusions and outlook 7
Part 2. The 2018 Global SDG Index ranking and scores 10
Introduction 11
The SDG Index 12
The SDG Dashboards 12
Absolute performance gaps for achieving the SDGs 14
Part 3. Methodology 34
3.1. Limitations and changes made to the 2018 edition 35
3.2. Methods summary 39
Data tables 45
References 73
Part 4. Country profiles 77
Table of Contents
SDG Index and Dashboards Report 2018 Global Responsibilities
Table of Contents
iv
List of Tables
Table 1 | Detailed results of the 2018 Survey on national coordination and implementation mechanisms for the SDGs at the central/federal level of government in G20 countries 8
Table 2 | Absolute Performance Gaps for SDG 1: No Poverty 14
Table 3 | Absolute Performance Gaps for SDG 12: Sustainable Consumption and Production 14
Table 4 | Absolute performance gaps for Imported SO2 emissions, kg/capita versus tonnes 15
Table 5 | Absolute performance gap for aggregate international spillover metric 15
Table 6 | The SDG Index 16
Table 7 | Spillover Index score (from 0 “worst” to 100 “best”) 32
Table 8 | New indicators and replacements included in the 2018 SDG Index and Dashboards 35
Table 9 | Major indicator and data gaps for the SDGs 37
Table 10 | List of indicators included in the 2018 SDG Index and Dashboards 45
Table 11 | List of countries not included in the 2018 SDG Index due to insufficient data availability 55
Table 12 | Summary statistics for indicators included in the SDG Index and Dashboards 56
Table 13 | Indicator thresholds 61
Table 14 | List of SDG trend indicators and period used for trend estimation 66
Table 15 | Overall country scores by SDG 69
List of Figures
Figure 1 | Performance of G20 countries on the SDG Index and international spillovers, 2018 1
Figure 2 | National coordination and implementation mechanisms for the SDGs in G20 countries, 2018 2
Figure 3 | NDC rating and current climate mitigation policy rating, 2017 3
Figure 4 | Did the National Statistical Institute or any mandated central/federal institutions identify official key national indicators to monitor the implementation of the SDGs? 4
Figure 5 | Number of national SDG monitoring indicators, 2018 5
Figure 6 | The Sustainable Development Goals 11
Figure 7 | SDG Dashboard for OECD countries 18
Figure 8 | SDG Trend Dashboard for OECD countries 19
Figure 9 | SDG Dashboard for East and South Asia 20
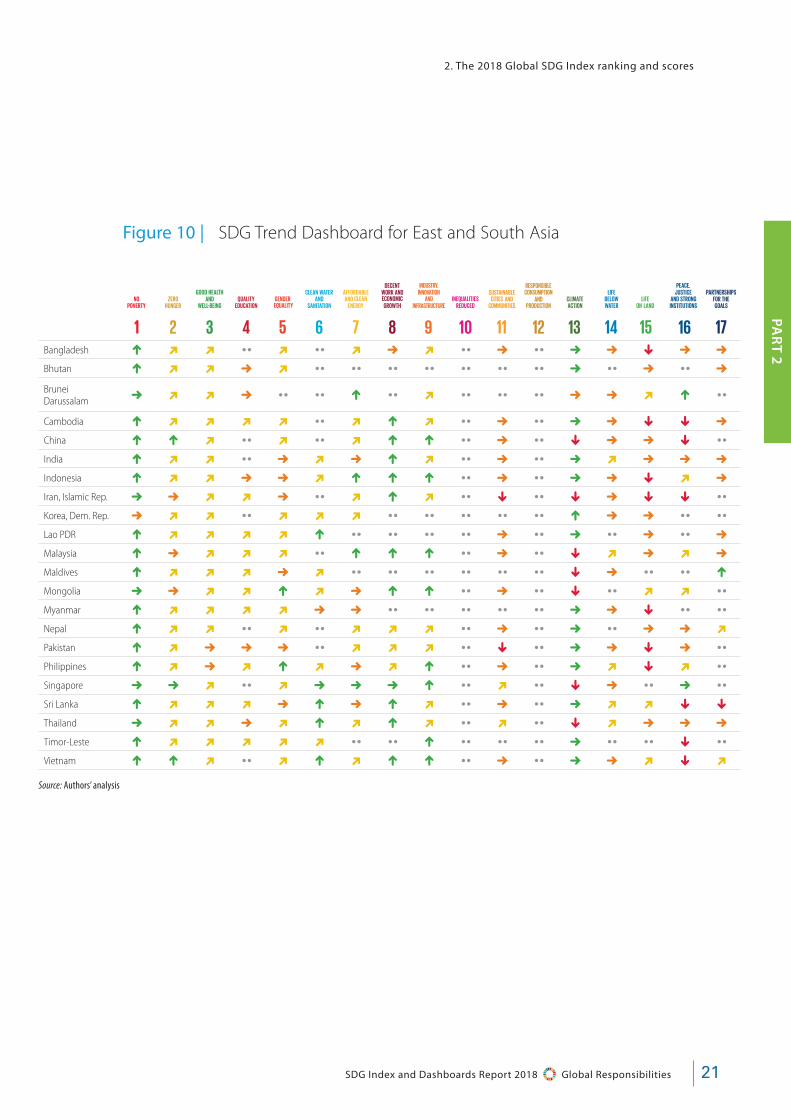
Figure 10 | SDG Trend Dashboard for East and South Asia 21
Figure 11 | SDG Dashboard for Eastern Europe and Central Asia 22
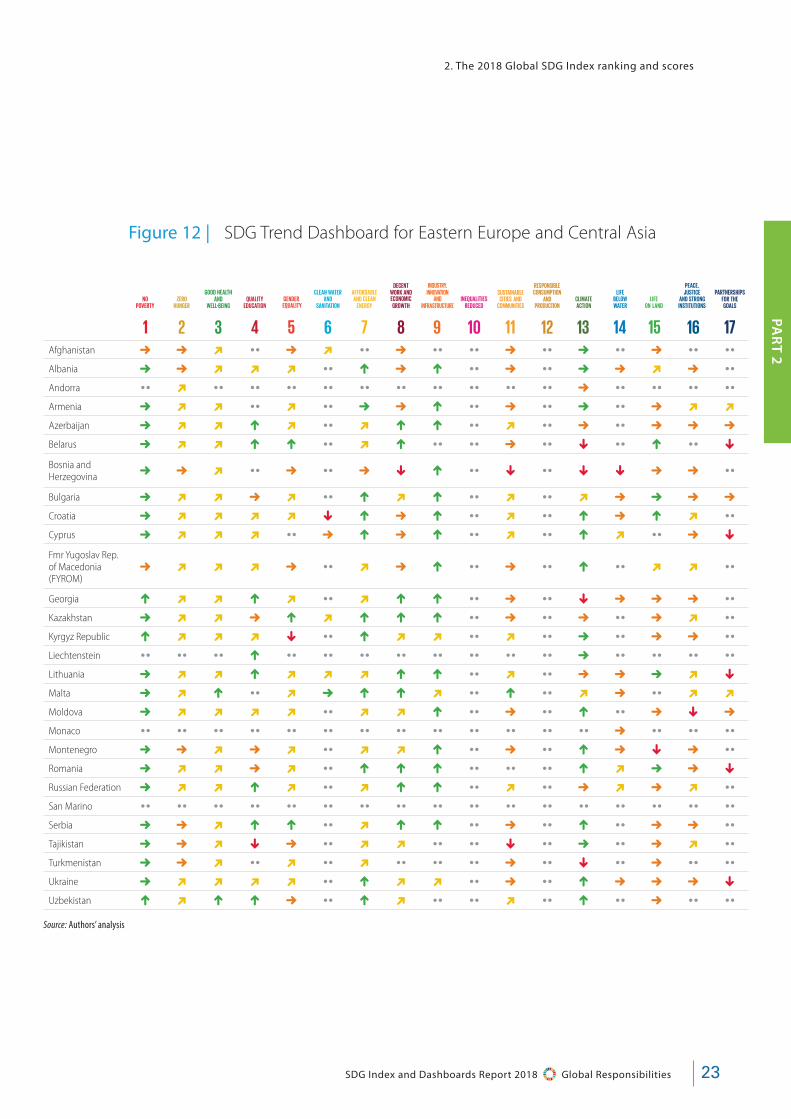
Figure 12 | SDG Trend Dashboard for Eastern Europe and Central Asia 23
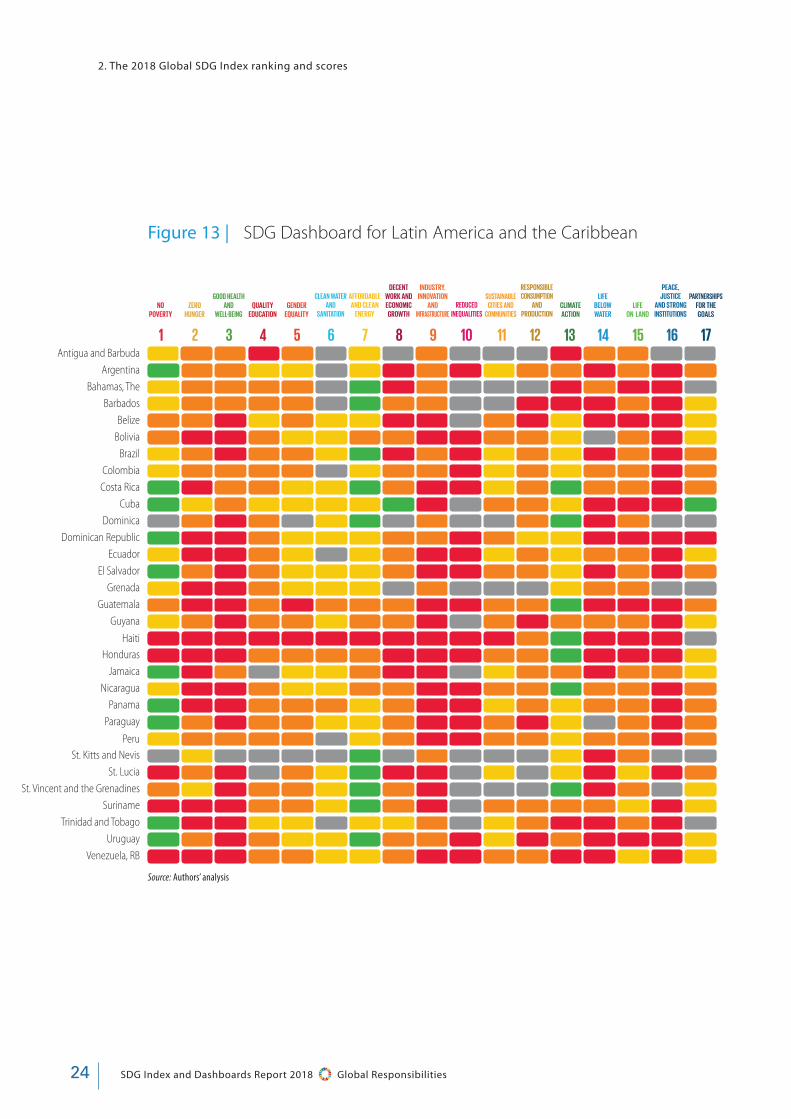
Figure 13 | SDG Dashboard for Latin America and the Caribbean 24
Figure 14 | SDG Trend Dashboard for Latin America and the Caribbean 25
Figure 15 | SDG Dashboard for the Middle East and North Africa 26
Figure 16 | SDG Trend Dashboard for the Middle East and North Africa 27
Figure 17 | SDG Dashboard for Sub-Saharan Africa 28
Figure 18 | SDG Trend Dashboard for Sub-Saharan Africa 29
Figure 19 | SDG Dashboard for the Middle East and North Africa 30
Figure 20 | SDG Trend Dashboard for the Middle East and North Africa 30
Figure 21 | Average spillover score against Gross Domestic Product (GDP) per capita in purchasing power parity (PPP) 31
Figure 22 | The 5-arrow system for denoting SDG Trends 44
Figure 23 | Graphic representation of the SDG Trends methodology 44

SDG Index and Dashboards Report 2018 Global Responsibilitiesvi
Foreword We are pleased to launch the 2018 SDG Index and Dashboards. This report is the third edition of the annual overview of countries’ performance on the 17 Sustainable Development Goals prepared jointly by the Bertelsmann Stiftung and the Sustainable Development Solutions Network (SDSN). For the first time, this edition covers all 193 UN member states and presents data on changes over time in SDG indicators.
Achieving the SDGs will require deep transformations of education systems, healthcare, energy use, land use, urban planning, and deployment of information technologies. These transformations require strong government leadership working in partnership with business and civil society. Integrating the SDGs by 2030 into national strategies, budgets, audits, procurement policies, regulatory and human resource management, and other dimensions of public policy poses major challenges for developed and developing countries alike. While some countries have proven to be better than others at long-term planning and implementation, all countries need to improve their public policies if they are to achieve all the SDGs within the next 12 years. Success will require massive innovation, learning, and sharing of best practices within and among countries.
For this reason, we have also conducted a first-time survey on national implementation mechanisms for the SDGs in G20 countries. We use publicly available data that have been vetted with governments, though any remaining inaccuracies are the responsibility of the authors. Our results show a large variation among G20 countries in how the SDGs are embraced by the political leadership and translated into institutional mechanisms. Some countries have established dedicated coordination units, action plans, and accountability systems, while others lag behind on some or all of these dimensions. Given the size and importance of G20 economies, it is worrying that so many have yet to take adequate action to pursue the goals.
The SDG data in this report show that no country is completely on track to achieve all SDGs. Some countries, particularly in Sub-Saharan Africa and those affected by conflict, struggle to end extreme poverty in all its forms by 2030. Inequalities are high and rising in many parts of the world as underscored in this report, including by the more extensive data available for OECD countries. The data also suggest that progress towards achieving SDGs 13 (Climate action), 14 (Life below water) and 15 (Life on land) must accelerate substantially to meet the 2030 targets.
Building on our first investigation into international spillover effects in meeting the SDGs, which we published in the 2017 report, we broaden the data considered for this report. The expanded and updated data show that high-income countries generate high environmental, economic and security spillovers, which undermine other countries’ efforts to achieve the SDGs. Yet, there is high variation in our spillover score across countries at similar income levels, which suggests ways to reduce spillover effects for a given level of income.
We hope that our first analysis of governments’ efforts to implement the SDGs will be helpful as governments convene in New York in July for the 2018 High-Level Political Forum to review SDG implementation and then in September for the opening of the new UN General Assembly session. Our assessments are necessarily preliminary and incomplete. By next year we plan to augment these assessments with systematic measurements of each countries’ policies in critical SDG domains. With the help of the member organizations of the SDSN and other partners, we will endeavor to provide detailed, worldwide assessments of government policy actions and institutional innovations to achieve the SDGs.
As always, all data and analyses included in this year’s report are available on our online data portal (www.sdgindex.org), where readers can also find individual country and indicator profiles. We have strived to improve the online presentation of the data and have prepared visuals that are downloadable and freely available to support researchers, civil society, and governments.

viiSDG Index and Dashboards Report 2018 Global Responsibilities
We are very pleased and encouraged that the SDGs are now being pursued in virtually every country, and often at the local as well as national level. It is our hope that the data and tools presented in this report and on the data portal will provide policymakers, civil society organizations, research centers, businesses and other stakeholders with valuable insights that will strengthen the implementation of the SDGs.
As always, our analysis is constrained by the availability of global, high quality, and comparable data. Clearly, governments, international organizations, business, and civil society should continue to increase their investments in more and better data for SDG implementation. TReNDs, the SDSN’s thematic network on data and statistics provides guidance on how to improve the quality of available data and ensure adequate data governance (http://unsdsn.org/trends/). We welcome comments and suggestions for filling gaps in the data used for this index and for improving the analysis and presentation of the results. Please contact us at [email protected].
The interest in the global SDG Index and Dashboards has spurred many initiatives to develop localized assessments of SDG progress. For example, the SDSN and its partners are preparing city-level SDG indices for the United States, Italy, Spain, and the European Union, among others. The SDG Center for Africa and the SDSN have prepared an Africa SDG Index and Dashboards Report. Several other regional and sub-national assessments are in preparation. We very much welcome suggestions for further deployment, development, and improvement of these tools.
Foreword
Aart de GeusChairman and CEOBertelsmann Stiftung
Jeffrey SachsDirectorSustainable Development Solutions Network
SDG Index and Dashboards Report 2018 Global Responsibilitiesviii
Executive summaryThe 2018 SDG Index and Dashboards report presents a revised and updated assessment of countries’ distance to achieving the Sustainable Development Goals (SDGs). It includes detailed SDG Dashboards to help identify implementation priorities for the SDGs. The report also provides a ranking of countries by the aggregate SDG Index of overall performance.
This year’s report includes several improvements and additions in comparison to previous versions. It incorporates trend data for the first time. New indicators have been added to cover more accurately the SDGs and associated targets with a special focus on “leave no one behind” for OECD member states. We present data for all 193 UN member states and estimate absolute SDG achievement gaps to complement per capita estimates. Building on the 2017 report, we expand the analysis of international SDG spillovers and present an overall SDG spillover index.
This year, three Nordic countries, Sweden, Denmark, and Finland, top the global SDG Index ranking, yet all three still face major challenges in achieving the SDGs. Due to several changes in indicators and some adjustments in the methodology, the results from the 2018 SDG Index and Dashboard are not comparable to the 2017 results. In particular, changes in country scores or rankings cannot be interpreted as SDG progress or regress since last year.
2018 SDG Index and Dashboards Report generates six additional findings:
Most G20 countries have started SDGs implementation, but important gaps remain.Results from the novel survey on national SDG implementation mechanisms conducted by the SDSN and the Bertelsmann Stiftung show large variations among G20 countries in how the SDGs are embraced by the political leadership and translated into institutional mechanisms. Some countries have established dedicated coordination units, strategies and action plans, and accountability systems, while others lag behind on some or all of these dimensions. More data and analyses are needed to gauge the level of ambition and effectiveness of SDG strategies, tools, and processes.
No country is on track towards achieving all SDGs. For the first time, we are able to show that no country is on track to achieve all the goals by 2030. For example, Sweden, Denmark, and Finland top the 2018 SDG Index, but they need to significantly accelerate progress towards achieving some goals, including Goal 12 (Sustainable Consumption and Production) and Goal 13 (Climate Action).
Conflicts are leading to reversals in SDG progress. Most developing countries have experienced significant progress towards ending extreme poverty in all its forms, including income poverty, undernourishment, access to health and education services, and access to basic infrastructure. Achievement gaps are greatest towards universal completion of secondary education. Countries experiencing conflict have experienced some of the sharpest reversals, particularly towards achieving Goal 1 (No Poverty) and Goal 2 (No Hunger).
Progress towards sustainable consumption and production patterns is too slow. High-income countries obtain their lowest scores on Goal 12 (Sustainable Consumption and Production) and Goal 14 (Life Below Water). While no trend data are available for Goal 12, the data for Goal 14 suggest that most of high-income countries have made no progress in recent years towards achieving the Goal. Trends on Goal 15 (Life on Land) are also insufficient. They show that further efforts are needed to protect the biodiversity and support sustainable production and consumption.
ixSDG Index and Dashboards Report 2018 Global Responsibilities
High-income countries generate negative SDG spillover effects. High-income countries generate significant environmental, economic, and security spillover effects that undermine other countries’ efforts to achieve the SDGs. Yet, there is high variation in spillovers among countries with a similar per capita income. This suggests that countries can reduce their negative spillover effects without reducing their per capita incomes.
Inequalities in economic and social outcomes require better data. Newly added indicators for OECD countries focusing on inequalities in economic, health, and education outcomes lower the SDG Index scores for some countries. This suggests significant shortfalls in ensuring that no one is left behind, which are hidden by aggregate data. Such disaggregated data are unavailable for most non-OECD countries, so greater investments are needed to fill these data gaps.
The 2018 SDG Index and Dashboard report presents regional dashboards of SDG achievement and trends towards the goals. Country-level data on SDG implementation is consolidated in two-page country profiles for every UN member states, available in the “Country Profiles” section. Data profiles for each SDG Indicator are presented online. The methodology is described in Part 3 and in an annex available on www.sdgindex.org.
Executive summary

Are governments in G20 countries getting organized for the SDGs?
1
1SDG Index and Dashboards Report 2018 Global Responsibilities
PAR
T 1
To achieve the SDGs, countries must undertake major transformations of education, health, energy
systems, land-use, urban development, and many other dimensions. Each transformation requires long-
term changes involving large numbers of stakeholders from government, business, and civil society. Since
such complex transformations cannot be implemented by markets alone, governments must take the
lead in mobilizing stakeholders, planning for the transformations, designing supporting policy processes,
and mobilizing the public funding.
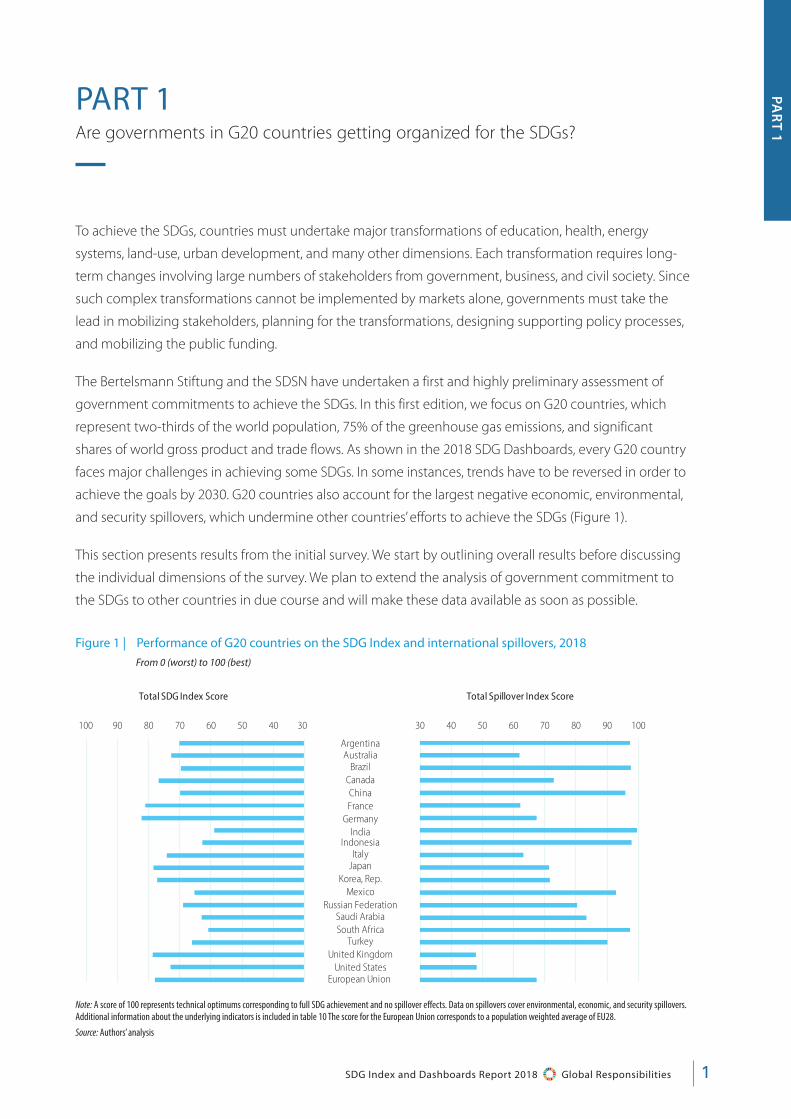
The Bertelsmann Stiftung and the SDSN have undertaken a first and highly preliminary assessment of
government commitments to achieve the SDGs. In this first edition, we focus on G20 countries, which
represent two-thirds of the world population, 75% of the greenhouse gas emissions, and significant
shares of world gross product and trade flows. As shown in the 2018 SDG Dashboards, every G20 country
faces major challenges in achieving some SDGs. In some instances, trends have to be reversed in order to
achieve the goals by 2030. G20 countries also account for the largest negative economic, environmental,
and security spillovers, which undermine other countries’ efforts to achieve the SDGs (Figure 1).
This section presents results from the initial survey. We start by outlining overall results before discussing
the individual dimensions of the survey. We plan to extend the analysis of government commitment to
the SDGs to other countries in due course and will make these data available as soon as possible.
Figure 1 | Performance of G20 countries on the SDG Index and international spillovers, 2018
����������������������������������������� ����������
����������������
���������������
����������������������������������������
������ ������������ ������������
������� ����
��������������������� ������������ ��������������
�� �� �� �� �� �� �� ������ �� �� �� �� �� �� ��
From 0 (worst) to 100 (best)
Note: A score of 100 represents technical optimums corresponding to full SDG achievement and no spillover effects. Data on spillovers cover environmental, economic, and security spillovers. Additional information about the underlying indicators is included in table 10 The score for the European Union corresponds to a population weighted average of EU28. Source: Authors’ analysis
Are governments in G20 countries getting organized for the SDGs?
PART 1
SDG Index and Dashboards Report 2018 Global Responsibilities2
Overall institutionalization of the SDGs in G20 countries
Between February and May 2018, SDSN and the Bertelsmann Stiftung conducted a short survey to gauge political leadership and the institutionalization of the SDGs in G20 countries. The survey comprised 15 questions and a number of sub-questions. It covered the following aspects: 1) National strategy and baseline assessments in the executive; 2) Coordinating units in the executive; and 3) Budgeting practices in the executive. Additional questions were also included on legislative actions as well as the main challenges for implementation.
The survey was conceived to apply to both federal and unitary countries. It applies to any institutional (presiden-tial, parliamentary, semi-presidential) and legislative system (bicameral, single house). To the extent possible, the survey aimed to cover policies and actions enacted by the current administration, unless there has been a very recent change of government (i.e. over the past six months). In cases where the current administration has been there for a long time, the survey focuses on initiatives introduced between
January 1, 2016 and May 1, 2018. Therefore, some of the information and initiatives published in the Voluntary National Reviews (VNR) 2018 may not be fully reflected in this year’s assessment.
The SDSN Secretariat first collected data through desk research before validation by national experts and gov-ernment officials. Other processes were used to ensure high data quality and comparability. For each positive response, references to official statements, documents or web portals were requested to ensure that the survey responses reflect verifiable facts and not opinions (Lafortune, G. et al., 2017).
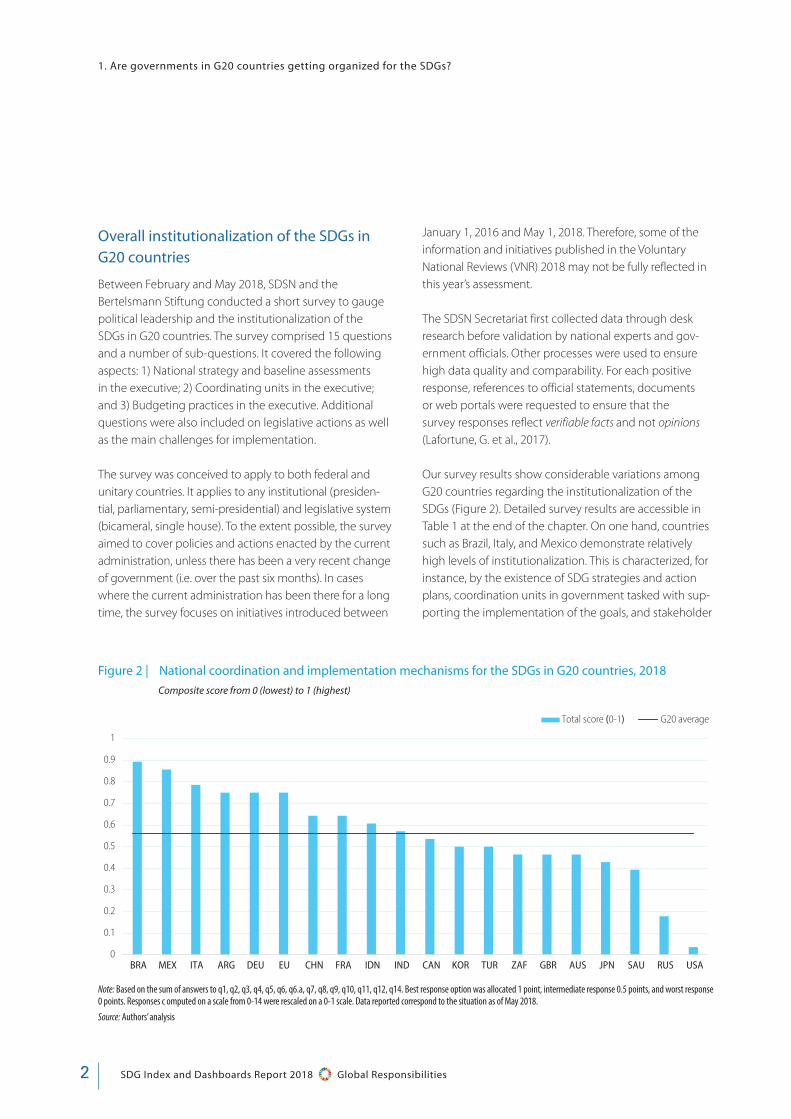
Our survey results show considerable variations among G20 countries regarding the institutionalization of the SDGs (Figure 2). Detailed survey results are accessible in Table 1 at the end of the chapter. On one hand, countries such as Brazil, Italy, and Mexico demonstrate relatively high levels of institutionalization. This is characterized, for instance, by the existence of SDG strategies and action plans, coordination units in government tasked with sup-porting the implementation of the goals, and stakeholder
1. Are governments in G20 countries getting organized for the SDGs?
Figure 2 | National coordination and implementation mechanisms for the SDGs in G20 countries, 2018
�
���
���
���
���
���
���
���
���
���
�
��� ��� ��� ��� ��� �� ��� ��� ��� ��� ��� ��� ��� ��� ��� �� ��� �� �� � �
������� ����(��) ����������
Composite score from 0 (lowest) to 1 (highest)
Note: Based on the sum of answers to q1, q2, q3, q4, q5, q6, q6.a, q7, q8, q9, q10, q11, q12, q14. Best response option was allocated 1 point, intermediate response 0.5 points, and worst response 0 points. Responses c omputed on a scale from 0-14 were rescaled on a 0-1 scale. Data reported correspond to the situation as of May 2018. Source: Authors’ analysis

3SDG Index and Dashboards Report 2018 Global Responsibilities
PAR
T 1
1. Are governments in G20 countries getting organized for the SDGs?
engagement tools such as SDG web platforms and portals. In contrast, countries such as the United-States and the Russian Federation show low levels of political leadership and institutionalization of the SDGs, char-acterized notably by the absence of public statements made by the head of state on how the country plans to implement the SDGs.
The collected data are descriptive in nature and do not permit to gauge the level of ambition and effectiveness of strategies and coordination mechanisms in place. They are also incomplete since they focus on the national level and do not cover initiatives at subnational levels. They also only cover some aspects of institutional support in the executive for the SDGs. Still they provide a first assess-ment of current government efforts for implementing the SDGs, which complement the SDG Index and Dashboards results; the latter being based, in many instances, on data referring to pre-SDG period.
Evaluating targets and policy actions for the SDGs
Experiences from the MDGs and during the run-up to the Paris Climate Agreement have underscored the importance of evidence-based and transparent long-term pathways towards time-bound goals. They demonstrate the feasibil-ity of ambitious goals, help mobilize stakeholders around shared strategies, serve to develop financing strategies, and identify innovation challenges. Given the depth of the transformations needed to achieve the SDGs, developing such a shared direction and purpose becomes a critical factor for success. Long-term pathways can also help build trust between countries and facilitate concerted actions.
The Climate Action Tracker (CAT) and Climate Transparency have analyzed both the content of Intended Nationally Determined Contribution (INDCs) (what governments propose
Figure 3 | NDC rating and current climate mitigation policy rating, 2017
Intended Nationally Determined Contribution (INDC) rating Current policy rating
���������
���������
������
������
�����
�����
���������
����
�����
����
������������������
������������
������������
������
�������������
��������������
Highly insufficient Critically insufficient
Insufficient Highly insufficient
Insufficient Insufficient
Highly insufficient Highly insufficient
Highly insufficient Highly insufficient
2°C Compatible 2°C Compatible
Insufficient Insufficient
Highly insufficient Highly insufficient
Highly insufficient Critically insufficient
Insufficient Highly insufficient
Critically insufficient Highly insufficient
Critically insufficient Critically insufficient
Highly insufficient Highly insufficient
Critically insufficient Critically insufficient
Critically insufficient Highly insufficient
Insufficient Highly insufficient
����������
� °������������
�°������������
����������
�����������������
���������������������
Note: For EU countries, only EU level data are presented. Source: Climate Action Tracker (2017)

SDG Index and Dashboards Report 2018 Global Responsibilities4
to do) and current policies (what governments are actually doing) on climate mitigation in G20 countries. These inde-pendent reviews of SDG 13 conducted by experts show that, with the exception of India, NDCs and current climate poli-cies pursued by G20 countries are insufficient and, in some cases, critically insufficient to achieve the “well below 2°C” objective of the Paris Climate Agreement. Some countries have set insufficient targets, which they can reach without implementing new policies. Others have implemented poli-cies that will not even allow insufficient targets to be met.
These independent reviews applied to climate action focusing on both the content of strategies and the alignment of policy actions demonstrate the need to move beyond published action plans and intentions. In countries where the SDG have already been translated into more tangible short and long-term national targets, the methodology used by the CAT could be applied to evaluate the level of ambition and policy actions targeting other SDG priorities, such as reducing income inequal-ity, universal health care, sustainable land-use and food systems, or international development finance.
Our preliminary assessment of G20 government com-mitments to the SDGs does not address these questions. Such assessments are urgently needed as they will help benchmark countries’ performance and share lessons across countries. They will also promote accountability for implementing Agenda 2030.
Strengthening accountability mechanisms
Under SDG 17.19 all countries have committed to “build on existing initiatives to develop measurements of progress on sustainable development that complement gross domestic product […].” Our survey results indicate that a majority of G20 countries have developed or are in the process of developing national indicators of progress on the SDGs (Figure 4). There is no common approach for identifying the nature and number of national indicators to monitor progress on the SDGs, which range from 63 in Germany to 201 in Italy (Figure 5). The European Union, via Eurostat, has identified 100 indicators to monitor the implementation of the SDGs in the EU.
Figure 4 | Did the National Statistical Institute or any mandated central/federal institutions identify official key national indicators to monitor the implementation of the SDGs?
������
��������
�����
�����
�����
� ��������
��� �������� �
��������
��������
�����������
��� �����
� ���
������
������
����
��������������� �
�����������
������������ �
�������������
Yes = 35%
No but it is planned = 35%
No = 30%
1. Are governments in G20 countries getting organized for the SDGs?
Source: Authors’ analysis

5SDG Index and Dashboards Report 2018 Global Responsibilities
PAR
T 1
Some countries do not plan to develop their own national SDG indicators, but do report on the availability of data for the official SDG indicators. For instance, the United Kingdom’s Office of National Statistics estimates that, out of the 244 official indicators, 138 indicators were “reported online,” 27 indicators were considered as “statistics in prog-ress,” and that for 79 indicators data sources were currently being explored (https://sustainabledevelopment-uk.github.io/reporting-status/).
Regular audits can also support accountability and government actions. Some Supreme Audit Institutions (SAIs) have started to undertake performance audits in the context of the SDGs. Traditionally SAIs have focused on financial and compliance audits, but they are increasingly incorporating other aspects, such as performance and value for money audits (OECD, 2015). The International Organization of Supreme Audit Institutions (INTOSAI) has issued guidelines for how SAIs can contribute to the success of the 2030 Agenda and the SDGs in their countries. In April 2018, the Office of the Auditor General of Canada released a baseline from which to measure the federal government’s progress in implementing the 2030 Agenda and achieving the sustainable development goals in future audit work (Box 1).
Yet, several barriers still prevent SAIs from playing a greater role in the context of the SDGs. In a number of countries, their mandates do not cover audits of policy effectiveness and efficiency, including cross-sectoral policy effective-ness (UNDESA, 2018b; Vries, G.d., 2016). As the role of SAIs evolves, countries might need to revise the legislative provisions and mandates for SAI audits.
Integrating the SDGs into budgets, and public management practices and proceduresBeyond audit mechanisms, other public management tools and practices can be leveraged to promote inte-grated actions and effective governance for the SDGs. This applies particularly to budgeting practices and proce-dures. Performance budgeting and spending reviews are powerful tools that can help mainstream the SDGs in the budget process and strengthen implementation over time at the national level. Evidence from our survey shows that so far only one country (India) conducted a prelimi-nary evaluation of additional financing needs to achieve the SDGs. Some countries have done partial assessments focusing for instance on environmental goals. To this date,
Figure 5 | Number of national SDG monitoring indicators, 2018
Source: Authors’ analysis
��������������
������ ������� ��� � ����� ����� �����������
�
��
��
��
��
���
���
���
���
���
���
���
1. Are governments in G20 countries getting organized for the SDGs?
SDG Index and Dashboards Report 2018 Global Responsibilities6
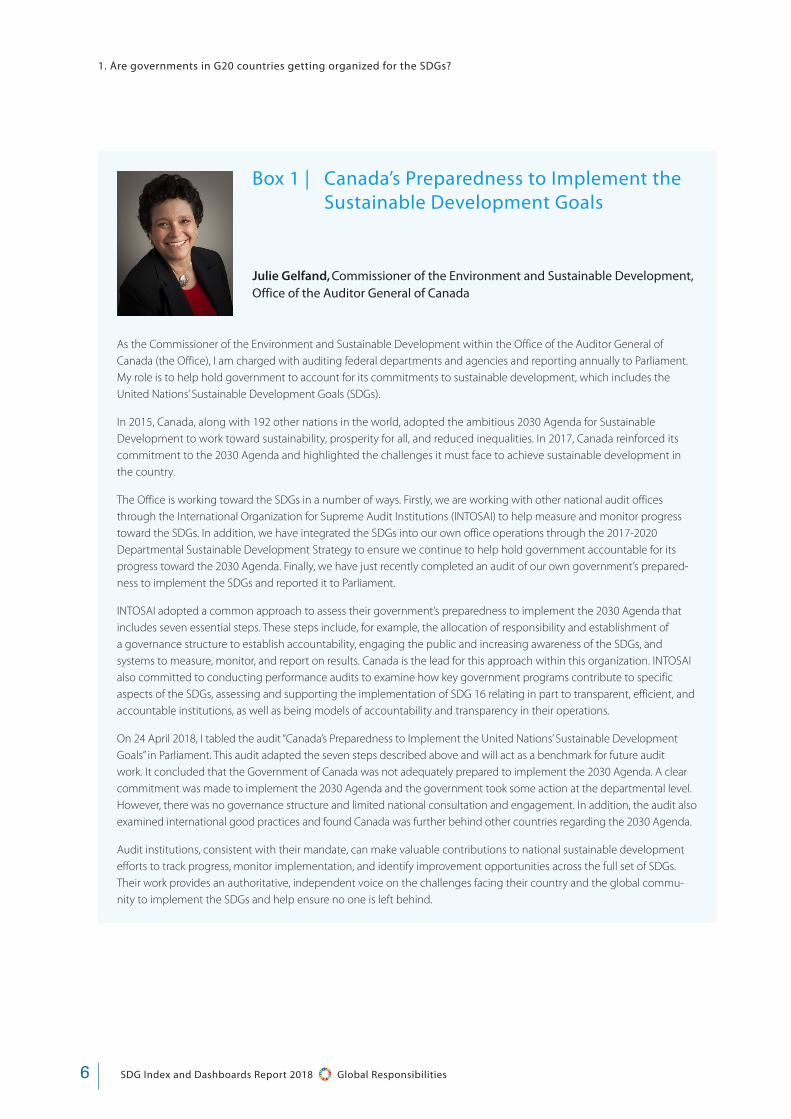
Box 1 | Canada’s Preparedness to Implement the Sustainable Development Goals
Julie Gelfand, Commissioner of the Environment and Sustainable Development, Office of the Auditor General of Canada
As the Commissioner of the Environment and Sustainable Development within the Office of the Auditor General of Canada (the Office), I am charged with auditing federal departments and agencies and reporting annually to Parliament. My role is to help hold government to account for its commitments to sustainable development, which includes the United Nations’ Sustainable Development Goals (SDGs).
In 2015, Canada, along with 192 other nations in the world, adopted the ambitious 2030 Agenda for Sustainable Development to work toward sustainability, prosperity for all, and reduced inequalities. In 2017, Canada reinforced its commitment to the 2030 Agenda and highlighted the challenges it must face to achieve sustainable development in the country.
The Office is working toward the SDGs in a number of ways. Firstly, we are working with other national audit offices through the International Organization for Supreme Audit Institutions (INTOSAI) to help measure and monitor progress toward the SDGs. In addition, we have integrated the SDGs into our own office operations through the 2017-2020 Departmental Sustainable Development Strategy to ensure we continue to help hold government accountable for its progress toward the 2030 Agenda. Finally, we have just recently completed an audit of our own government’s prepared-ness to implement the SDGs and reported it to Parliament.
INTOSAI adopted a common approach to assess their government’s preparedness to implement the 2030 Agenda that includes seven essential steps. These steps include, for example, the allocation of responsibility and establishment of a governance structure to establish accountability, engaging the public and increasing awareness of the SDGs, and systems to measure, monitor, and report on results. Canada is the lead for this approach within this organization. INTOSAI also committed to conducting performance audits to examine how key government programs contribute to specific aspects of the SDGs, assessing and supporting the implementation of SDG 16 relating in part to transparent, efficient, and accountable institutions, as well as being models of accountability and transparency in their operations.
On 24 April 2018, I tabled the audit “Canada’s Preparedness to Implement the United Nations’ Sustainable Development Goals” in Parliament. This audit adapted the seven steps described above and will act as a benchmark for future audit work. It concluded that the Government of Canada was not adequately prepared to implement the 2030 Agenda. A clear commitment was made to implement the 2030 Agenda and the government took some action at the departmental level. However, there was no governance structure and limited national consultation and engagement. In addition, the audit also examined international good practices and found Canada was further behind other countries regarding the 2030 Agenda.
Audit institutions, consistent with their mandate, can make valuable contributions to national sustainable development efforts to track progress, monitor implementation, and identify improvement opportunities across the full set of SDGs. Their work provides an authoritative, independent voice on the challenges facing their country and the global commu-nity to implement the SDGs and help ensure no one is left behind.
1. Are governments in G20 countries getting organized for the SDGs?

7SDG Index and Dashboards Report 2018 Global Responsibilities
PAR
T 1
few G20 countries use the SDGs as a framework to inform the national budget process.
Apart from a few questions on budgets, our survey did not gauge the role of other government functions and tools used to promote a whole-of-government approach to the SDGs. Below are three examples of other government functions and tools that can support the achievement of long-term goals:
• Incorporating sustainable development principles into regulatory governance is crucial to ensure that new regulations have their desired short and long-term impacts. Integrating considerations such as income inequality, decoupling of economic growth from resource use, gender equality, and other “leave-no-one-behind” considerations into ex ante and ex post evaluations can help strengthen policy coherence for sustainable development and improve synergies in policy interventions. Stakeholder consultations in the regulatory process are also crucial to address unintended effects of policies on certain population groups in a context characterized by disruptive innovations and shorter economic cycles.
• The strategic use of public procurement can also help ensure that the purchase by governments and state-owned enterprises of goods, services and works are aligned with the principles of sustainable development. Public procurement represents 12% of GDP on average in OECD countries every year (OECD, 2018a). Evidence suggest that this percentage is even higher in middle and low-income countries (Djankov, S. et al., 2016). Several directives and frameworks have been developed to support the transition towards more efficient and sustainable procurement processes in government (c.f. EU directive, 10YFP SPP programme). This is also explicitly stated in SDG 12.7 “Promote public procurement practices that are sustainable, in accordance with national policies and priorities.” Beyond green growth, public procurement can help implement other secondary policy objectives such as supporting SMEs and technological innovation.
• Mobilizing the machinery of government for the SDGs may also benefit from adapting Human Resource Management (HRM) practices in government in G20 countries and other countries. More research and peer-to-peer exchanges might be needed to understand how competence frameworks, training policies and performance management systems – especially of senior civil servants – can help mainstream the SDGs across agencies and policy sectors and help achieve long-term sustainability objectives.
Overall, we lack comparative country-level information regarding the integration of sustainable development in public management processes. Filling this gap will be an important priority for future work of the SDSN and other partners in the years to come. Further assessments and case studies are needed to identify best practices and to scale-up innovative approaches
Conclusions and outlook
Our survey results show that almost all G20 countries have undertaken some efforts to implement the SDGs. Yet they all fall short on important dimensions of SDG implementation, including but not limited to government accountability mechanisms and public management practices, such as budgeting. Such implementation gaps need to be assessed and closed quickly so that countries can achieve the SDGs. The analysis provided in this section can help governments identify gaps and learn how other countries are tackling similar challenges.
This first assessment of governments’ commitments to achieve the SDGs provides novel insights, but it is limited in several ways. In particular, we are not yet able to assess whether governments’ targets, policies, and supporting budgets are sufficient to achieve long-term objectives related to the SDGs. Closing this gap will require major efforts in collecting and harmonizing data. We believe that such efforts can learn important lessons from the Climate Action Tracker’s assessment of countries NDCs and their consistency with the objectives of the Paris Agreement. Moreover, we will aim to replicate such analyses for other non-G20 countries.
1. Are governments in G20 countries getting organized for the SDGs?

SDG Index and Dashboards Report 2018 Global Responsibilities8
Table 1 | Detailed results of the 2018 Survey on national coordination and implementation mechanisms for the SDGs at the central/federal level of government in G20 countries
ARG AUS BRA CAN CHN FRA DEU IND IDN ITA JPN KOR MEX RUS SAU ZAF TUR GBR USA EU
I. NATIONAL STRATEGIES AND BASELINE ASSESSMENTS IN THE EXECUTIVE
Q.1. Since the current administration took office, was there any official statement made by a high-ranking official endorsing the implementation of the Sustainable Development Goals (SDGs) at the national level? (select all that apply)
The statement should be made in a public and official context and should explicitly mention the endorsement of the SDGs and how the country plans to operationalize their implementation. The simple use of the term “SDGs” in an official speech would not be sufficient to tick any of the positive answers.
a) Yes, a statement made by the head of state/government (e.g. President, Prime Minister) • • • • • • • • • • • •
b) Yes, a statement made by a member of the cabinet (e.g. Minister, State Secretary) • • • • • • • • • • • • • • • • •
c) No • • •Q.2. Did the central/federal government map the alignment of
existing national strategies with the SDGs?
a) Yes • • • • • • • • • • • •b) No but it is planned • • • • •c) No and it is not planned • • •Q.3. Did the central/federal government adopt an action plan to
implement the SDGs?
Yes • • • • • • •Yes, but it covers only some SDGs (e.g. only the environmental goals) • • •No but it is planned • • • • •No and it is not planned • • • • •Q.4. Did the National Statistical Institute or any mandated central/
federal institutions identify official key national indicators to monitor the implementation of the SDGs?
Yes • • • • • • •No, but a national online platform/document has been developed to report on the status of official SDG indicators • • • •
No but it is planned • • • • • • •No and it is not planned • • •Q.4.1. If yes, how many indicators are included in this list of official
national indicators?
Please indicate the exact number(e.g. 100, 88, 50, 12 etc.) na (155) na na na 98 63 na na 201 140 na 183 na na 98 na na na 100
Q.5. Has the National Statistical Office been officially mandated to lead the work on data and indicators for the SDGs?
Yes • • • • • • • • • • • • • •No but it is planned No • • • • • •Q.6. Since January 1st 2016, has there been a comprehensive
assessment coordinated by the central/federal government looking at where the country stands with regards to its distance to achieving the SDGs?
This may be reflected in a Voluntary National Review (VNR) or in another national assessment proces.
Yes, • • • • • • • • • • •No but it is planned • • • • • • •No and it is not planned • •Q.6.a. If yes, did the assessment cover all the SDGs or a selection
of SDGs?
All SDGs (•) • na • • • • na na • • na na na na na •Only a selection of SDGs (please specify which ones) • na • • na na na na na na naQ.7. Since January 1st 2016, did the central/federal government
conduct a quantitative assessment of incremental financing needs for the SDGs?
Yes, and it covers all the SDGs •Yes, and it covers some of the SDGs •No but it is planned •No and it is not planned • • • • • • • • • • • • • • • • •
1. Are governments in G20 countries getting organized for the SDGs?

9SDG Index and Dashboards Report 2018 Global Responsibilities
PAR
T 1
ARG AUS BRA CAN CHN FRA DEU IND IDN ITA JPN KOR MEX RUS SAU ZAF TUR GBR USA EU
Q.8. Have key national priorities been identified regarding the implementation of the SDGs?
There should be an explicit mention in an official document of key SDG goals/targets priorities at the national level.
Yes • • • • • • • • • •No but it is planned • • • • •No and it is not planned • • • • •Q.9. Is there a dedicated central/federal government online
repository/website for the SDGs? i.e. a dedicated website where the latest news, official speeches, metrics and initiatives on the SDGs are provided.
Yes, a stand-alone SDG website • • • • • • • •Yes, a web page hosted on the website of the coordinating Ministry/Agency or Center of Government portal (please provide web link) • • • • • • •
No, but information about the SDGs are available in departments’ and agencies’ websites • • •
No • •Q.9a. If yes, is the repository/website regularly updated (i.e. at
least once a month)?
Yes • • • na • • na • • na na na •No • na • • • na na • na • • naII. COORDINATING UNIT(S) IN THE EXECUTIVE
Q.10. Is there a lead central/federal government unit responsible for supporting the implementation of the SDGs across line ministries and agencies?
Yes • • • • • • • • • • • • • •No • • • • • •Q.10a. If yes, where is this unit located?
Centre of government (Government office/Prime Minister Office/President’s office/Cabinet office) • • • • • • • •
Ministry of Foreign Affairs • • • •Ministry of Finance •Ministry of Environment • • •Ministry of Public Administration •Ministry of Economic development (or close match) • • • • •Other (please specify): • •Q.11. Was an inter-ministerial committee/task force set up to
coordinate the implementation of the SDGs across line ministries/agencies?
Yes • • • • • • • • • • • • • •No but it is planned •No, and it is not planned • • • • •III. BUDGETING PRACTICES IN THE EXECUTIVE
Q.12. Does the latest central/federal budget reflect incremental SDG investment needs?
a) Yes, and it covers all the SDGs • • • •b) Yes, and it covers some of the SDGs • • •c) No but it is planned • •d) No and it is not planned • • • • • • • • • • •IV. LEGISLATIVE ACTIONS
Q.14. Has a dedicated taskforce/committee been set up in Parliament to discuss the implementation of the SDGs?
Yes • • • • • • • •No • • • • • • • • • • • •
Note: Results based on desk research conducted by the SDSN Secretariat and validated with experts and government officials. “na” stands for not applicable. “()” introduced but not yet fully implemented or available publicly. Source: Authors’ analysis
1. Are governments in G20 countries getting organized for the SDGs?
The 2018 Global SDG Index ranking and scores
2

11SDG Index and Dashboards Report 2018 Global Responsibilities
PAR
T 2
Introduction Agenda 2030 and the Sustainable Development Goals (Figure 6), adopted by all member states of the
United-Nations in 2015, describe a universal agenda that applies to and must be implemented by all
countries. Sound metrics and data are critical for turning the SDGs into practical tools for problem solving
by (i) mobilizing governments, academia, civil society and business; (ii) providing a report card to track
progress and ensure accountability; and (iii) serving as a management tool for the transformations needed
to achieve the SDGs by 2030.
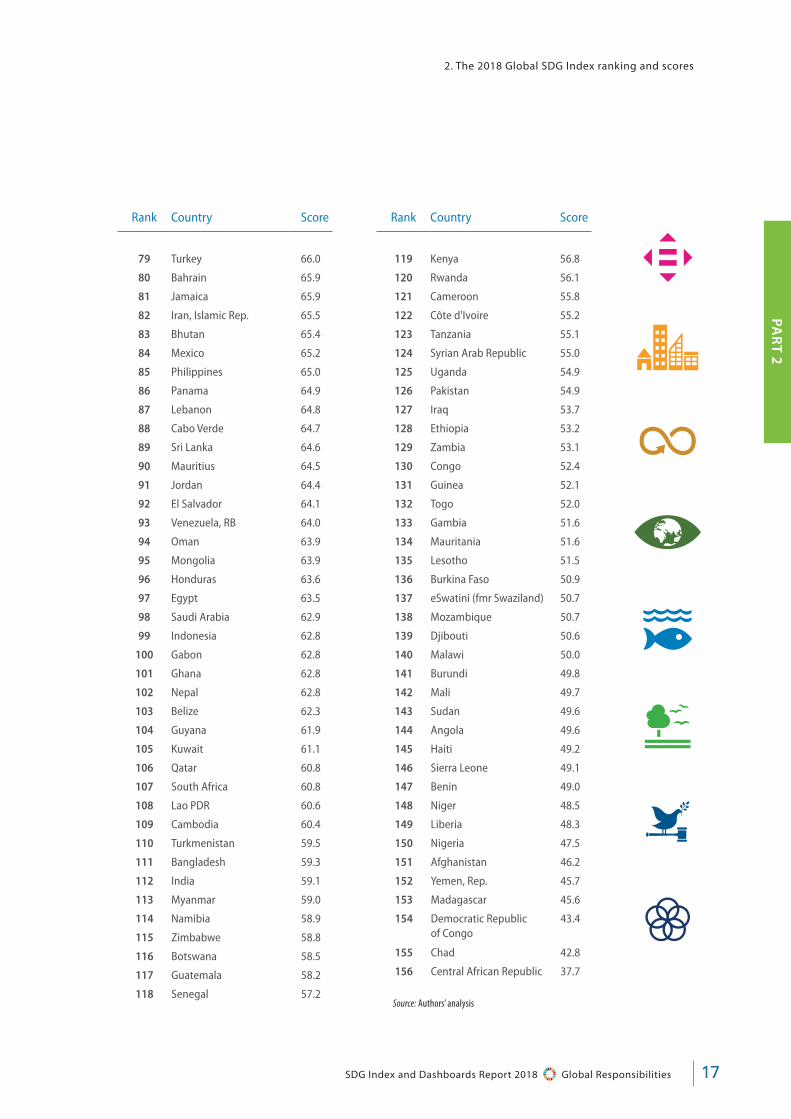
The report summarizes countries’ current performance and trends on the 17 SDGs. This year’s Index is topped by Sweden, Denmark and Finland whereas the Democratic Republic of Congo, Chad and the Central African Republic rank last among the 156 countries included. Since the indicators, data, and methodology have been revised for the 2018 Index, the rankings and scores are not comparable with the 2017 and 2016 editions. Therefore, a change in a country’s ranking does not necessarily signify a change in its SDG performance.
To complement the official SDG indicators and volun-tary country-led review processes, the Bertelsmann Stiftung and the Sustainable Development Solutions Network (SDSN) have been releasing since 2016 the annual global SDG Index and Dashboards Report. The report is not an official monitoring tool. It uses pub-licly available data published by official data providers (World Bank, WHO, ILO, others) and other organizations including research centers and non-governmental organizations.
Figure 6 | The Sustainable Development Goals
The 2018 Global SDG Index ranking and scores
PART 2

SDG Index and Dashboards Report 2018 Global Responsibilities12
2. The 2018 Global SDG Index ranking and scores
The SDG Index
The SDG Index score signifies a country’s position between the worst (0) and the best or target (100) out-comes. Sweden’s overall Index score (85) suggest that the country is on average 85% of the way to the best possible outcome across the 17 SDGs.
Changes to the methodology and indicator set impacted the Global Index ranking and scores. This year we imputed the average regional score for countries with missing values for one or several goals. This applies mainly to SDG 10 (Reduced Inequalities) and SDG 14 (Life Below Water) for non-coastal countries. This methodological refinement has affected the ranking of some of these countries compared to last year’s results. Changes in the indicator set, including replacements (e.g. Gini adjusted for underreported top incomes) and new additions (e.g. fish caught via trawling), have led to additional changes in countries’ scores for SDGs 10 and 14.
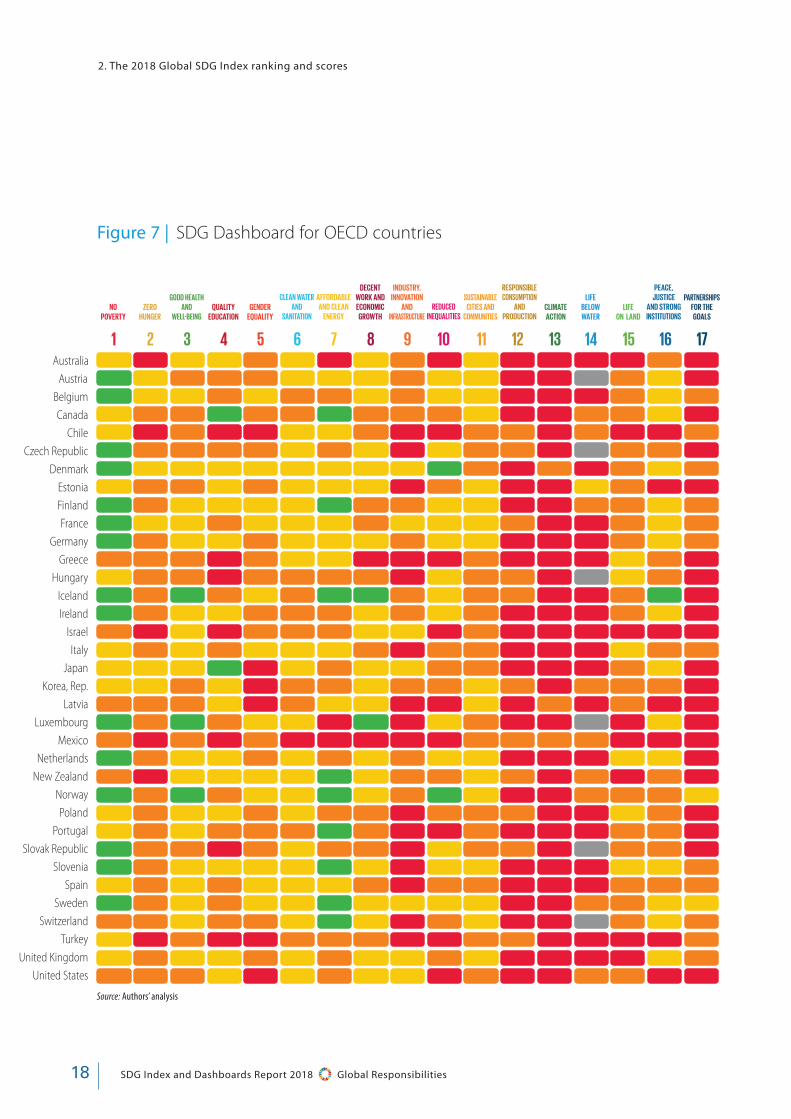
Three Scandinavian countries (Sweden, Denmark and Finland) top this year’s SDG Index. All countries in the top 20 are OECD countries. However, even countries that perform well on the Index score significantly below the maximum score of 100. Every country scores “red” on at least one SDG in the Dashboards (Figure 7). High-income countries perform relatively poorly on spillover indicators as presented in Figure 21 and Table 7. Looking at trends, many high-income countries are not making significant progress on issues related to sustainable consumption and production and the protection of the biodiversity in particular in relation to Goal 14 (Life Below Water) where most high-income countries are stagnating.
Low-income countries tend to have lower SDG Index scores. This is partly due to the nature of the SDGs which focus to a large extent on ending extreme poverty and on access to basic services and infrastructure (SDGs 1-8). Moreover, poorer countries tend to lack adequate infrastructure and mechanisms to manage key environmental issues that are the focus of the SDGs. Except for countries that are facing armed conflicts and civil wars, most low-income countries are making progress in ending extreme poverty and provid-ing access to basic services, particularly in the area of health, as illustrated by the SDG Trends (Figure 18).
The SDG Dashboards
OECD countriesThe SDG Dashboard for OECD member countries sug-gests that every rich country faces major challenges in meeting several SDGs, and that no OECD country is on track to achieving all of the SDGs. In particular, avail-able data on SDG 12 (Sustainable Consumption and Production), 13 (Climate Action), 14 (Life below Water) and 15 (Life on Land) suggest that OECD countries are far from reaching these goals and that many are stagnating or experiencing a deterioration. This is partly driven by the relatively high spillover effects embodied in trade that are generated by OECD countries. The inclusion of addi-tional metrics on “Leave no one behind”, in particular for SDG 3 (Health and Well-Being), 4 (Quality Education) and 10 (Reduced Inequalities), highlights shortcomings in a number of OECD countries that were not apparent using more aggregated data. Low current scores and weak trends on SDG 2 (Zero Hunger) are driven by unsustain-able agriculture and high and rising obesity rates in most OECD countries. On balance, OECD countries face major challenges in meeting the environmental objectives as well as in realizing the Agenda 2030 ambition to “leave no one behind”.
East and South AsiaCountries in East and South Asia face persistent challenges related to SDGs 2 (Zero Hunger), 3 (Good Health and Well-Being), 9 (Industry, Innovation and Infrastructure), 14 (Life below Water) and 16 (Peace, Justice and Strong Institutions). There are important challenges also related to income inequalities (SDG 10) and other forms of inequal-ities. Most countries are making progress in in ending extreme poverty and providing access to basic services, though not all countries are on track to meet the corre-sponding SDGs by 2030. Far greater efforts are needed to achieve SDG 13 (Climate Action), 14 (Life Below Water) and 15 (Life on Land). Trend data also suggest important shortfalls on SDG 11 (Sustainable Cities and Communities) and SDG 16 (Peace Justice and Strong Institutions).
Eastern Europe and Central AsiaCountries in Eastern Europe and Central Asia perform rel-atively well on SDG 1 (No Poverty) and SDG 7 (Affordable and Clean Energy) but they face major shortfalls on SDGs

13SDG Index and Dashboards Report 2018 Global Responsibilities
PAR
T 2
2. The 2018 Global SDG Index ranking and scores
2 (No Hunger), 3 (Good Health and Well-Being), 8 (Decent Work and Economic Growth), 9 (Industry, Innovation and Infrastructure) and 10 (Reduced Inequalities). While these countries score highly on addressing extreme poverty, improving health and education outcomes, and on providing access to key infrastructure, trend data suggest that some are regressing on these central dimensions of human development. Virtually all countries in the region require greater efforts to decouple economic growth from negative environmental impacts, as they are stag-nating or even regressing on SDG 13 (Climate Action), 14 (Life Below Water) and 15 (Life on Land). Domestic revenue collection for public investments has come under pressure in many countries and drive relatively low scores on SDG 17.
Latin America and the CaribbeanSDG 10 (Reduced Inequalities) and SDG 16 (Peace Justice and Strong Institutions) represent two major challenges across Latin America and the Caribbean. Some coun-tries in the region also face persisting challenges related to SDG 3 (Good Health and Well-Being), 9 (Industry, Innovation and Infrastructure), and 14 (Life below Water). With the exception of a few countries, there has been major progress towards ending extreme poverty, improv-ing health outcomes, and in promoting gender equality in the region. In contrast, countries are off track towards SDG 13 (Climate Action), as demonstrated by the SDG Trends, which show that many countries are stagnating or regressing on this goal.
Middle East and North AfricaIn the dryland Middle East and North Africa, food secu-rity and sustainable agriculture (SDG 2) and sustainable water management (SDG 6) are high-priority challenges in most countries. In addition, many countries perform poorly on gender equality (SDG 5). Countries with available data also perform poorly on income inequality (SDG 10), and further efforts are needed to increase the availability of data on income and wealth distribution in the region to inform policies. Apart from the many countries in the region that are facing major conflicts, great progress has been made in ending extreme poverty, improving health outcomes, and promot-ing affordable and clean energy (SDG 7). In contrast, most countries in the region have stagnated and even
regressed towards the environmental goals, including SDGs 13 (Climate Action), 14 (Life below Water) and 15 (Life on Land). Some of the most advanced countries, particularly in the Gulf Region, generate high spillover effects, which reduce their overall performance on the SDG Index.
Sub-Saharan AfricaSub-Saharan African countries face major challenges in achieving most SDGs. Despite significant progress during the Millennium Development Goals (MDG) period, ending extreme poverty and undernourishment (SDGs 1 and 2), ensuring basic access to water and sanitation (SDG 6) and strengthening access and quality of health and education services (SDG 3 and 4) remain major challenges in most countries. Progress towards improving access to key infrastructure (SDG 9) and strengthening institutions (Goal 16) must also be accelerated. The broader SDGs bring out additional challenges for Sub-Saharan Africa that require urgent action. These include sustainable urban development (SDG 11) and reducing high income inequality (SDG 10). Countries in the region perform relatively better on sustainable consumption and production, climate action and terrestrial ecosystems suggesting that richer countries are responsible for a disproportionate share of environmental pressure relating to these goals. The remaining red scores on SDG 17 high-light that Sub-Saharan Africa has significant potential in increasing domestic revenue collection.
OceaniaThe new Oceania Dashboard, presented for the first time in this year’s SDG Index and Dashboards Report, shows that the small islands perform very well on climate mitigation (SDG 13), but they are of course among the countries that are the most vulnerable to climate change. The countries face major challenges in improving access to and quality of health care (SDG 3) and in increasing access to basic infrastructure services (SDGs 6, 7, 9). In recent years, all countries have made significant progress towards SDG 3 and most countries also improved their performance on SDG 14 (Life below Water). The Oceania Dashboard reveals that there are important gaps in data availability in the region. With help from the international community, these countries will need to invest signifi-cantly in strengthening their data systems.

SDG Index and Dashboards Report 2018 Global Responsibilities14
Absolute performance gaps for achieving the SDGs
The SDG Index and Dashboards express data in per capita terms or other suitable denominators. These relative metrics are used so that performance can be compared across countries. Absolute performance is a useful complementary presentation of this data. It helps identify the countries that account for the largest achievement gaps in meeting the SDGs.
This chapter identifies the countries that account for the largest absolute performance gaps for selected SDGs. The results were obtained by multiplying SDG Index scores, which range from 0 to 100, with population.
Table 2 below shows that Nigeria alone accounts for 19% of the global gap to meeting SDG 1. Together with the Democratic Republic of Congo and India, the three countries account for more than one third of the global achievement gap for SDG 1.
The conclusions are similar for SDG 12 (Table 3). Taken together, China, India, and the United States account for more than 40% of the world’s gap on achieving sustainable consumption and production practices. Out of the fifteen countries accounting for the greatest gaps in achieving goal 12, eleven are G20 countries. This underscores the critical role of G20 countries in achieving SDG 12.
To illustrate the difference between absolute and relative performance gaps at the indicator level, we consider Sulfur Dioxide (SO2) emissions embodied in imports under SDG 12. Sulfur dioxide has major impacts on human health even in short-term exposure. It can react with other substances to form harmful particulates in the atmo-sphere and acid rain. This pollutant embodied in trade is an important international spillover, as pollution gen-erated in one country can stem from the production of goods and services that are consumed in another country. Table 4 shows that large G20 countries account for the largest absolute performance gaps, whereas smaller coun-tries top the ranking by relative per capita performance.
2. The 2018 Global SDG Index ranking and scores
Table 2 | Absolute Performance Gaps for SDG 1: No Poverty
CountryPercentage achievement gap of SDG 1
Nigeria 18.6%
Dem. Rep. of the Congo 11.9%
India 7.8%
Madagascar 3.9%
Mozambique 3.5%
Tanzania 3.3%
South Africa 3.0%
Yemen, Rep. 2.9%
Malawi 2.4%
Kenya 2.3%
Source: Authors’ analysis
Table 3 | Absolute performance gaps for SDG 12: Sustainable Consumption and Production
CountryPercentage achievement gap of SDG 12
China 18.5%
India 12.1%
United States 10.0%
Brazil 3.0%
Japan 2.8%
Indonesia 2.7%
Nigeria 2.2%
Russian Federation 2.1%
Pakistan 2.0%
Bangladesh 1.8%
Source: Authors’ analysis
15SDG Index and Dashboards Report 2018 Global Responsibilities
PAR
T 2
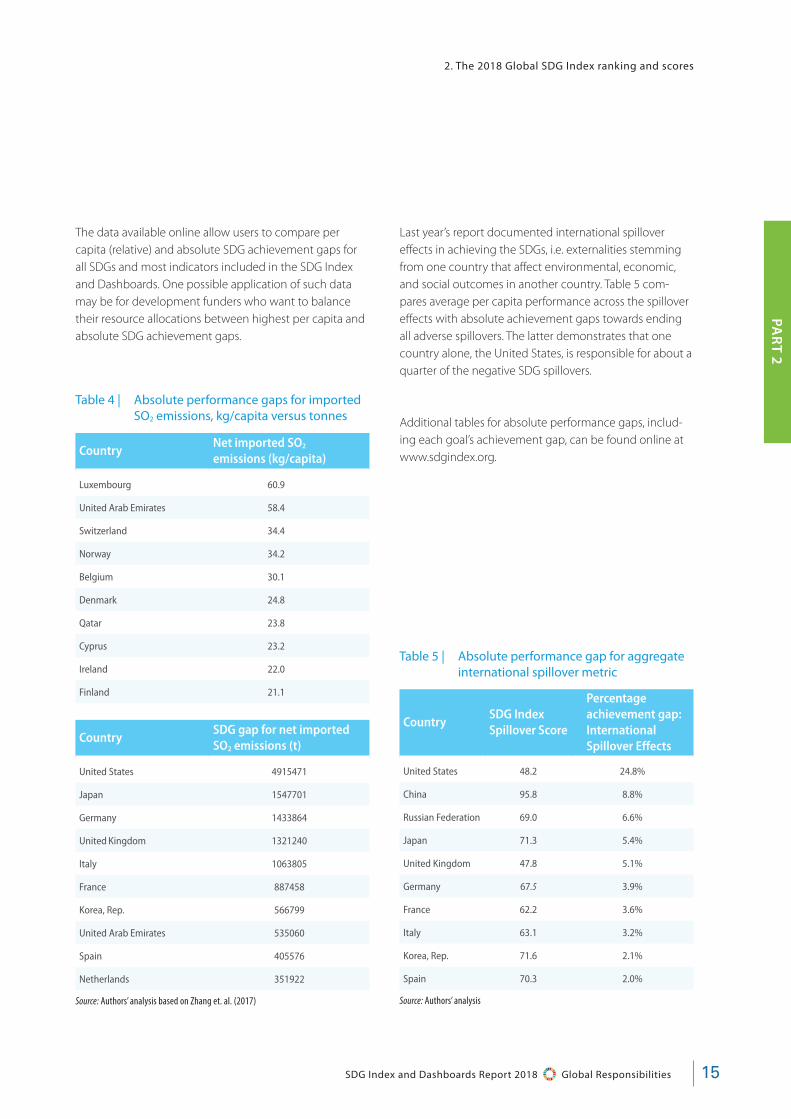
The data available online allow users to compare per capita (relative) and absolute SDG achievement gaps for all SDGs and most indicators included in the SDG Index and Dashboards. One possible application of such data may be for development funders who want to balance their resource allocations between highest per capita and absolute SDG achievement gaps.
Last year’s report documented international spillover effects in achieving the SDGs, i.e. externalities stemming from one country that affect environmental, economic, and social outcomes in another country. Table 5 com-pares average per capita performance across the spillover effects with absolute achievement gaps towards ending all adverse spillovers. The latter demonstrates that one country alone, the United States, is responsible for about a quarter of the negative SDG spillovers.
Additional tables for absolute performance gaps, includ-ing each goal’s achievement gap, can be found online at www.sdgindex.org.
2. The 2018 Global SDG Index ranking and scores
Table 5 | Absolute performance gap for aggregate international spillover metric
CountrySDG Index Spillover Score
Percentage achievement gap: International Spillover Effects
United States 48.2 24.8%
China 95.8 8.8%
Russian Federation 69.0 6.6%
Japan 71.3 5.4%
United Kingdom 47.8 5.1%
Germany 67.5 3.9%
France 62.2 3.6%
Italy 63.1 3.2%
Korea, Rep. 71.6 2.1%
Spain 70.3 2.0%
Source: Authors’ analysis
Table 4 | Absolute performance gaps for imported SO2 emissions, kg/capita versus tonnes
CountryNet imported SO2 emissions (kg/capita)
Luxembourg 60.9
United Arab Emirates 58.4
Switzerland 34.4
Norway 34.2
Belgium 30.1
Denmark 24.8
Qatar 23.8
Cyprus 23.2
Ireland 22.0
Finland 21.1
CountrySDG gap for net imported SO2 emissions (t)
United States 4915471
Japan 1547701
Germany 1433864
United Kingdom 1321240
Italy 1063805
France 887458
Korea, Rep. 566799
United Arab Emirates 535060
Spain 405576
Netherlands 351922
Source: Authors’ analysis based on Zhang et. al. (2017)

SDG Index and Dashboards Report 2018 Global Responsibilities16
Rank Country Score
1 Sweden 85.0
2 Denmark 84.6
3 Finland 83.0
4 Germany 82.3
5 France 81.2
6 Norway 81.2
7 Switzerland 80.1
8 Slovenia 80.0
9 Austria 80.0
10 Iceland 79.7
11 Netherlands 79.5
12 Belgium 79.0
13 Czech Republic 78.7
14 United Kingdom 78.7
15 Japan 78.5
16 Estonia 78.3
17 New Zealand 77.9
18 Ireland 77.5
19 Korea, Rep. 77.4
20 Canada 76.8
21 Croatia 76.5
22 Luxembourg 76.1
23 Belarus 76.0
24 Slovak Republic 75.6
25 Spain 75.4
26 Hungary 75.0
27 Latvia 74.7
28 Moldova 74.5
29 Italy 74.2
30 Malta 74.2
31 Portugal 74.0
32 Poland 73.7
33 Costa Rica 73.2
34 Bulgaria 73.1
35 United States 73.0
36 Lithuania 72.9
37 Australia 72.9
38 Chile 72.8
39 Ukraine 72.3
40 Serbia 72.1
Rank Country Score
41 Israel 71.8
42 Cuba 71.3
43 Singapore 71.3
44 Romania 71.2
45 Azerbaijan 70.8
46 Ecuador 70.8
47 Georgia 70.7
48 Greece 70.6
49 Uruguay 70.4
50 Cyprus 70.4
51 Kyrgyz Republic 70.3
52 Uzbekistan 70.3
53 Argentina 70.3
54 China 70.1
55 Malaysia 70.0
56 Brazil 69.7
57 Vietnam 69.7
58 Armenia 69.3
59 Thailand 69.2
60 United Arab Emirates 69.2
61 Former Yugoslav Republic of Macedonia (FYROM)
69.0
62 Albania 68.9
63 Russian Federation 68.9
64 Peru 68.4
65 Kazakhstan 68.1
66 Bolivia 68.1
67 Suriname 68.0
68 Algeria 67.9
69 Montenegro 67.6
70 Trinidad and Tobago 67.5
71 Bosnia and Herzegovina 67.3
72 Paraguay 67.2
73 Tajikistan 67.2
74 Colombia 66.6
75 Dominican Republic 66.4
76 Nicaragua 66.4
77 Morocco 66.3
78 Tunisia 66.2
Table 6 | The SDG Index
2. The 2018 Global SDG Index ranking and scores
17SDG Index and Dashboards Report 2018 Global Responsibilities
PAR
T 2
Rank Country Score
79 Turkey 66.0
80 Bahrain 65.9
81 Jamaica 65.9
82 Iran, Islamic Rep. 65.5
83 Bhutan 65.4
84 Mexico 65.2
85 Philippines 65.0
86 Panama 64.9
87 Lebanon 64.8
88 Cabo Verde 64.7
89 Sri Lanka 64.6
90 Mauritius 64.5
91 Jordan 64.4
92 El Salvador 64.1
93 Venezuela, RB 64.0
94 Oman 63.9
95 Mongolia 63.9
96 Honduras 63.6
97 Egypt 63.5
98 Saudi Arabia 62.9
99 Indonesia 62.8
100 Gabon 62.8
101 Ghana 62.8
102 Nepal 62.8
103 Belize 62.3
104 Guyana 61.9
105 Kuwait 61.1
106 Qatar 60.8
107 South Africa 60.8
108 Lao PDR 60.6
109 Cambodia 60.4
110 Turkmenistan 59.5
111 Bangladesh 59.3
112 India 59.1
113 Myanmar 59.0
114 Namibia 58.9
115 Zimbabwe 58.8
116 Botswana 58.5
117 Guatemala 58.2
118 Senegal 57.2
Rank Country Score
119 Kenya 56.8
120 Rwanda 56.1
121 Cameroon 55.8
122 Côte d'Ivoire 55.2
123 Tanzania 55.1
124 Syrian Arab Republic 55.0
125 Uganda 54.9
126 Pakistan 54.9
127 Iraq 53.7
128 Ethiopia 53.2
129 Zambia 53.1
130 Congo 52.4
131 Guinea 52.1
132 Togo 52.0
133 Gambia 51.6
134 Mauritania 51.6
135 Lesotho 51.5
136 Burkina Faso 50.9
137 eSwatini (fmr Swaziland) 50.7
138 Mozambique 50.7
139 Djibouti 50.6
140 Malawi 50.0
141 Burundi 49.8
142 Mali 49.7
143 Sudan 49.6
144 Angola 49.6
145 Haiti 49.2
146 Sierra Leone 49.1
147 Benin 49.0
148 Niger 48.5
149 Liberia 48.3
150 Nigeria 47.5
151 Afghanistan 46.2
152 Yemen, Rep. 45.7
153 Madagascar 45.6
154 Democratic Republic of Congo
43.4
155 Chad 42.8
156 Central African Republic 37.7
2. The 2018 Global SDG Index ranking and scores
Source: Authors’ analysis
SDG Index and Dashboards Report 2018 Global Responsibilities18
Figure 7 | SDG Dashboard for OECD countries
Source: Authors’ analysis
2. The 2018 Global SDG Index ranking and scores
Australia
Austria
Belgium
Canada
Chile
Czech Republic
Denmark
Estonia
Finland
France
Germany
Greece
Hungary
Iceland
Ireland
Israel
Italy
Japan
Korea, Rep.
Latvia
Luxembourg
Mexico
Netherlands
New Zealand
Norway
Poland
Portugal
Slovak Republic
Slovenia
Spain
Sweden
Switzerland
Turkey
United Kingdom
United States
AFFORDABLE AND CLEAN
ENERGY
DECENT WORK AND ECONOMIC
GROWTH
INDUSTRY, INNOVATION
AND INFRASTRUCTURE
REDUCEDINEQUALITIES
SUSTAINABLE CITIES AND
COMMUNITIES
RESPONSIBLECONSUMPTION
AND PRODUCTION
LIFE ON LAND
PEACE, JUSTICE
AND STRONGINSTITUTIONS
CLIMATEACTION
LIFE BELOW WATER
PARTNERSHIPSFOR THE
GOALSNO
POVERTYZERO
HUNGER
GOOD HEALTHAND
WELL-BEINGQUALITY
EDUCATIONGENDER
EQUALITY
CLEAN WATER AND
SANITATION
1 2 3 4 5 6 7 8 9 10 11 12 13 14 15 16 17

19SDG Index and Dashboards Report 2018 Global Responsibilities
PAR
T 2
Figure 8 | SDG Trend Dashboard for OECD countries
Australia L D 5 D D •• D D D •• D •• D D 5 5 D
Austria 5 D L •• D 5 L D L L •• •• D •• 5 D 5
Belgium 5 D L D D L D D L L 5 •• D D 5 D 5
Canada 5 D L 5 D •• 5 D D p •• •• 5 5 5 L ••Chile L D D 5 D L L L D D 5 •• p D p 5 ••Czech Republic 5 D L D 5 5 L D L L D •• D •• 5 D 5
Denmark 5 D L D D 5 L L L 5 D •• L 5 5 D 5
Estonia 5 D L D D 5 D D D •• L •• p D 5 L 5
Finland 5 D 5 L D 5 5 D L 5 L •• D 5 5 L L
France 5 D L D L D L D L L D •• L 5 D D 5
Germany 5 D L D D 5 L L L 5 D •• 5 5 5 D D
Greece 5 D D 5 D D L 5 D p D •• L 5 D D ••Hungary 5 D D 5 5 L D D D 5 D •• L •• 5 p 5
Iceland 5 D 5 D L D 5 •• D 5 •• •• 5 5 5 D 5
Ireland 5 D L D D L L L L L D •• L D 5 L p
Israel 5 D L D D L D L D •• 5 •• D D 5 D 5
Italy 5 D D D L L L 5 D 5 5 •• L 5 5 5 p
Japan •• 5 D L 5 5 D L L •• •• •• p 5 D D D
Korea, Rep. D 5 D 5 D 5 D •• 5 •• •• •• p 5 p 5 ••Latvia 5 D L p D 5 L L D D D •• 5 5 5 L p
Luxembourg 5 D 5 D •• 5 D 5 D D D •• D •• D D ••Mexico L D D 5 D 5 D D D p D •• D 5 5 5 5
Netherlands 5 D L 5 D 5 D 5 L •• D •• 5 5 5 L D
New Zealand 5 D L 5 5 D 5 L L •• D •• 5 5 p D 5
Norway 5 D 5 D D D 5 •• D 5 •• •• D 5 5 5 L
Poland 5 D L D L 5 D D D D 5 •• 5 p 5 5 p
Portugal 5 D D D D D L D D 5 D •• L D D D p
Slovak Republic 5 D D D D p L 5 D 5 5 •• D •• 5 5 5
Slovenia 5 D D D L D L D D 5 D •• L D 5 5 D
Spain 5 D L D L 5 L 5 D p D •• L 5 5 5 p
Sweden 5 D 5 D L 5 5 5 L •• L •• D 5 5 D L
Switzerland 5 D 5 5 D L 5 •• L •• L •• L •• D L L
Turkey D D D 5 D •• D 5 D 5 5 •• p D 5 D ••United Kingdom D D L D D 5 L L L p D •• L 5 D L L
United States D D D 5 D D D D L •• D •• 5 5 5 5 D
2. The 2018 Global SDG Index ranking and scores
Source: Authors’ analysis

SDG Index and Dashboards Report 2018 Global Responsibilities20
Figure 9 | SDG Dashboard for East and South Asia
Source: Authors’ analysis
AFFORDABLE AND CLEAN
ENERGY
DECENT WORK AND ECONOMIC
GROWTH
INDUSTRY, INNOVATION
AND INFRASTRUCTURE
REDUCEDINEQUALITIES
SUSTAINABLE CITIES AND
COMMUNITIES
RESPONSIBLECONSUMPTION
AND PRODUCTION
LIFE ON LAND
PEACE, JUSTICE
AND STRONGINSTITUTIONS
CLIMATEACTION
LIFE BELOW WATER
PARTNERSHIPSFOR THE
GOALSNO
POVERTYZERO
HUNGER
GOOD HEALTHAND
WELL-BEINGQUALITY
EDUCATIONGENDER
EQUALITY
CLEAN WATER AND
SANITATION
1 2 3 4 5 6 7 8 9 10 11 12 13 14 15 16 17Bangladesh
Bhutan
Brunei Darussalam
Cambodia
China
India
Indonesia
Iran, Islamic Rep.
Korea, Dem. Rep.
Lao PDR
Malaysia
Maldives
Mongolia
Myanmar
Nepal
Pakistan
Philippines
Singapore
Sri Lanka
Thailand
Timor-Leste
Vietnam
2. The 2018 Global SDG Index ranking and scores
21SDG Index and Dashboards Report 2018 Global Responsibilities
PAR
T 2
Figure 10 | SDG Trend Dashboard for East and South Asia
Bangladesh L D D •• D •• D 5 D •• 5 •• 5 5 p 5 5
Bhutan L D D 5 D •• •• •• •• •• •• •• 5 •• 5 •• 5
Brunei Darussalam 5 D D 5 •• •• L •• D •• •• •• 5 5 D L ••
Cambodia L D D D D •• D L D •• 5 •• 5 5 p p 5
China L L D •• D •• D L L •• 5 •• p 5 5 p ••India L D D •• 5 D 5 L D •• 5 •• 5 D 5 5 5
Indonesia L D D 5 5 D L L L •• 5 •• 5 5 p D 5
Iran, Islamic Rep. 5 5 D D 5 •• D L D •• p •• p 5 p p ••Korea, Dem. Rep. 5 D D •• D D D •• •• •• •• •• L 5 5 •• ••Lao PDR L D D D D L •• •• •• •• 5 •• 5 •• 5 •• 5
Malaysia L 5 D D D •• L L L •• 5 •• p D 5 D 5
Maldives L D D D 5 D •• •• •• •• •• •• p 5 •• •• L
Mongolia 5 5 D D L D 5 L L •• 5 •• p •• D D ••Myanmar L D D D D 5 5 •• •• •• •• •• 5 5 p •• ••Nepal L D D •• D •• D D D •• 5 •• 5 •• 5 5 D
Pakistan L D 5 5 5 •• D D D •• p •• 5 5 p 5 ••Philippines L D 5 D L D 5 D L •• 5 •• 5 D p D ••Singapore 5 5 D •• D 5 5 5 L •• D •• p 5 •• 5 ••Sri Lanka L D D D 5 L 5 L D •• 5 •• 5 D D p p
Thailand 5 D D 5 D L D L D •• D •• p D 5 5 5
Timor-Leste L D D D D D •• •• L •• •• •• 5 •• •• p ••Vietnam L L D •• D L D L L •• 5 •• 5 5 D p D
2. The 2018 Global SDG Index ranking and scores
Source: Authors’ analysis

SDG Index and Dashboards Report 2018 Global Responsibilities22
Figure 11 | SDG Dashboard for Eastern Europe and Central Asia
2. The 2018 Global SDG Index ranking and scores
AFFORDABLE AND CLEAN
ENERGY
DECENT WORK AND ECONOMIC
GROWTH
INDUSTRY, INNOVATION
AND INFRASTRUCTURE
REDUCEDINEQUALITIES
SUSTAINABLE CITIES AND
COMMUNITIES
RESPONSIBLECONSUMPTION
AND PRODUCTION
LIFE ON LAND
PEACE, JUSTICE
AND STRONGINSTITUTIONS
CLIMATEACTION
LIFE BELOW WATER
PARTNERSHIPSFOR THE
GOALSNO
POVERTYZERO
HUNGER
GOOD HEALTHAND
WELL-BEINGQUALITY
EDUCATIONGENDER
EQUALITY
CLEAN WATER AND
SANITATION
1 2 3 4 5 6 7 8 9 10 11 12 13 14 15 16 17
PARTNERSHIPSFOR THE
GOALS
Albania
Andorra
Armenia
Belarus
Bulgaria
Croatia
Cyprus
Georgia
Malta
Moldova
Monaco
Romania
Serbia
Tajikistan
Ukraine
Afghanistan
Azerbaijan
Bosnia and Herzegovina
Former Yugoslav Republic of Macedonia (FYROM)
Kazakhstan
Kyrgyz Republic
Liechtenstein
Lithuania
Montenegro
Russian Federation
San Marino
Turkmenistan
Uzbekistan
Source: Authors’ analysis
23SDG Index and Dashboards Report 2018 Global Responsibilities
PAR
T 2
Figure 12 | SDG Trend Dashboard for Eastern Europe and Central Asia
Afghanistan 5 5 D •• 5 D •• 5 •• •• 5 •• 5 •• 5 •• ••Albania 5 5 D D D •• L 5 L •• 5 •• 5 5 D 5 ••Andorra •• D •• •• •• •• •• •• •• •• •• •• 5 •• •• •• ••Armenia 5 D D •• D •• 5 5 L •• 5 •• 5 •• 5 D D
Azerbaijan 5 D D L D •• D L L •• D •• 5 •• 5 5 5
Belarus 5 D D L L •• D L •• •• 5 •• p •• L •• p
Bosnia and Herzegovina 5 5 D •• 5 •• 5 p L •• p •• p p 5 5 ••
Bulgaria 5 D D 5 D •• L D L •• D •• D 5 5 5 5
Croatia 5 D D D D p L 5 L •• D •• L 5 L D ••Cyprus 5 D D D •• 5 L 5 L •• D •• L D •• 5 p
Fmr Yugoslav Rep. of Macedonia (FYROM)
5 D D D 5 •• D 5 L •• 5 •• L •• D D ••
Georgia L D D L D •• D L L •• 5 •• p 5 5 5 ••Kazakhstan 5 D D 5 L D L L L •• 5 •• 5 •• 5 D ••Kyrgyz Republic L D D D p •• L D D •• D •• 5 •• 5 5 ••Liechtenstein •• •• •• L •• •• •• •• •• •• •• •• 5 •• •• •• ••Lithuania 5 D D L D D D L L •• D •• 5 5 5 D p
Malta 5 D L •• D 5 L L D •• L •• D 5 •• D D
Moldova 5 D D D D •• D D L •• 5 •• L •• 5 p 5
Monaco •• •• •• •• •• •• •• •• •• •• •• •• •• 5 •• •• ••Montenegro 5 5 D 5 D •• D D L •• 5 •• L 5 p 5 ••Romania 5 D D 5 D •• L L L •• •• •• L D 5 5 p
Russian Federation 5 D D L D •• D L L •• D •• 5 D 5 D ••San Marino •• •• •• •• •• •• •• •• •• •• •• •• •• •• •• •• ••Serbia 5 5 D L L •• D L L •• 5 •• L •• 5 5 ••Tajikistan 5 5 D p 5 •• D D •• •• p •• 5 •• 5 D ••Turkmenistan 5 5 D •• D •• D •• •• •• 5 •• p •• 5 •• ••Ukraine 5 D D D D •• L D D •• 5 •• L 5 5 5 p
Uzbekistan L D L L 5 •• L D •• •• D •• L •• 5 •• ••
2. The 2018 Global SDG Index ranking and scores
Source: Authors’ analysis
SDG Index and Dashboards Report 2018 Global Responsibilities24
Figure 13 | SDG Dashboard for Latin America and the Caribbean
2. The 2018 Global SDG Index ranking and scores
Source: Authors’ analysis
AFFORDABLE AND CLEAN
ENERGY
DECENT WORK AND ECONOMIC
GROWTH
INDUSTRY, INNOVATION
AND INFRASTRUCTURE
REDUCEDINEQUALITIES
SUSTAINABLE CITIES AND
COMMUNITIES
RESPONSIBLECONSUMPTION
AND PRODUCTION
LIFE ON LAND
PEACE, JUSTICE
AND STRONGINSTITUTIONS
CLIMATEACTION
LIFE BELOW WATER
PARTNERSHIPSFOR THE
GOALSNO
POVERTYZERO
HUNGER
GOOD HEALTHAND
WELL-BEINGQUALITY
EDUCATIONGENDER
EQUALITY
CLEAN WATER AND
SANITATION
1 2 3 4 5 6 7 8 9 10 11 12 13 14 15 16 17Antigua and Barbuda
Argentina
Bahamas, The
Barbados
Belize
Bolivia
Brazil
Colombia
Costa Rica
Cuba
Dominica
Dominican Republic
Ecuador
El Salvador
Grenada
Guatemala
Guyana
HaitiHonduras
Jamaica
Nicaragua
Panama
Paraguay
PeruSt. Kitts and Nevis
St. Lucia
St. Vincent and the Grenadines
Suriname
Trinidad and Tobago
Uruguay
Venezuela, RB

25SDG Index and Dashboards Report 2018 Global Responsibilities
PAR
T 2
Figure 14 | SDG Trend Dashboard for Latin America and the Caribbean
Antigua and Barbuda L 5 D p •• •• •• •• •• •• •• •• p D •• •• ••
Argentina 5 D D D D •• D D D •• 5 •• p 5 5 p p
Bahamas, The 5 D D p D •• •• •• •• •• •• •• p 5 •• •• ••Barbados 5 D D D D •• •• •• L •• •• •• L 5 •• D ••Belize 5 D D D D D •• •• •• •• •• •• 5 5 p •• L
Bolivia L 5 D 5 D •• D L L •• 5 •• 5 •• D D ••Brazil L D D 5 D •• 5 D D •• 5 •• p 5 5 p 5
Colombia L D D 5 D •• D L D •• p •• 5 5 5 5 D
Costa Rica 5 D D •• D •• 5 L D •• 5 •• 5 D •• D D
Cuba L 5 D D D •• D •• •• •• •• •• p 5 •• •• ••Dominica •• D •• D •• D •• •• •• •• •• •• 5 p •• •• ••Dominican Republic 5 D 5 5 L D L D D •• 5 •• L D D 5 ••
Ecuador L D D 5 L •• D L L •• L •• p D 5 D ••El Salvador L D D p D L L L 5 •• 5 •• 5 5 5 5 5
Grenada D 5 D D •• 5 •• •• •• •• •• •• L 5 •• •• ••Guatemala D 5 D 5 5 •• 5 L 5 •• 5 •• 5 5 p D p
Guyana L D D •• 5 D •• •• D •• •• •• p 5 •• 5 ••Haiti D 5 D •• 5 5 5 p •• •• p •• 5 5 p D ••Honduras D 5 D 5 L L D D D •• D •• 5 5 •• 5 ••Jamaica 5 5 D •• D 5 L D D •• p •• L 5 •• D p
Nicaragua L 5 D •• L •• D D D •• D •• 5 5 D 5 ••Panama L D D 5 L D D L L •• 5 •• p D •• 5 ••Paraguay L D D •• D L L •• D •• 5 •• 5 •• 5 5 ••Peru L D D 5 D •• D D D •• D •• 5 5 5 p 5
St. Kitts and Nevis •• •• •• •• •• •• •• •• •• •• •• •• p 5 •• •• ••St. Lucia p D D •• D L •• •• •• •• •• •• 5 p •• •• p
St. Vincent and the Grenadines 5 D D 5 D D •• •• •• •• •• •• L D •• •• ••
Suriname 5 D D 5 D 5 5 •• •• •• •• •• 5 D D 5 ••Trinidad and Tobago 5 5 D •• D •• D •• D •• •• •• p D •• p ••
Uruguay 5 D D 5 D •• 5 D D •• 5 •• L 5 p 5 ••Venezuela, RB p 5 5 5 5 •• L L D •• p •• 5 5 D p ••
2. The 2018 Global SDG Index ranking and scores
Source: Authors’ analysis
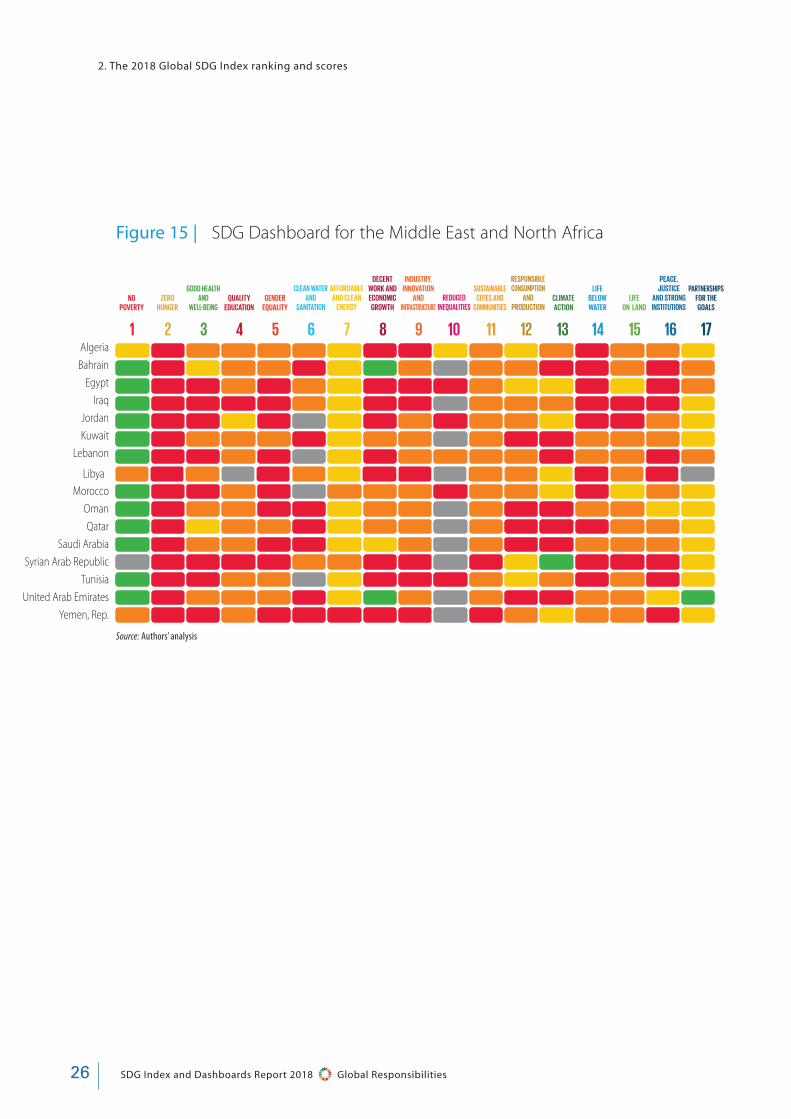
SDG Index and Dashboards Report 2018 Global Responsibilities26
Figure 15 | SDG Dashboard for the Middle East and North Africa
2. The 2018 Global SDG Index ranking and scores
Source: Authors’ analysis
Algeria
Bahrain
Egypt
Iraq
Jordan
Kuwait
Lebanon
Morocco
Oman
Qatar
Saudi Arabia
Syrian Arab Republic
Tunisia
United Arab Emirates
Yemen, Rep.
Libya
AFFORDABLE AND CLEAN
ENERGY
DECENT WORK AND ECONOMIC
GROWTH
INDUSTRY, INNOVATION
AND INFRASTRUCTURE
REDUCEDINEQUALITIES
SUSTAINABLE CITIES AND
COMMUNITIES
RESPONSIBLECONSUMPTION
AND PRODUCTION
LIFE ON LAND
PEACE, JUSTICE
AND STRONGINSTITUTIONS
CLIMATEACTION
LIFE BELOW WATER
PARTNERSHIPSFOR THE
GOALSNO
POVERTYZERO
HUNGER
GOOD HEALTHAND
WELL-BEINGQUALITY
EDUCATIONGENDER
EQUALITY
CLEAN WATER AND
SANITATION
1 2 3 4 5 6 7 8 9 10 11 12 13 14 15 16 17
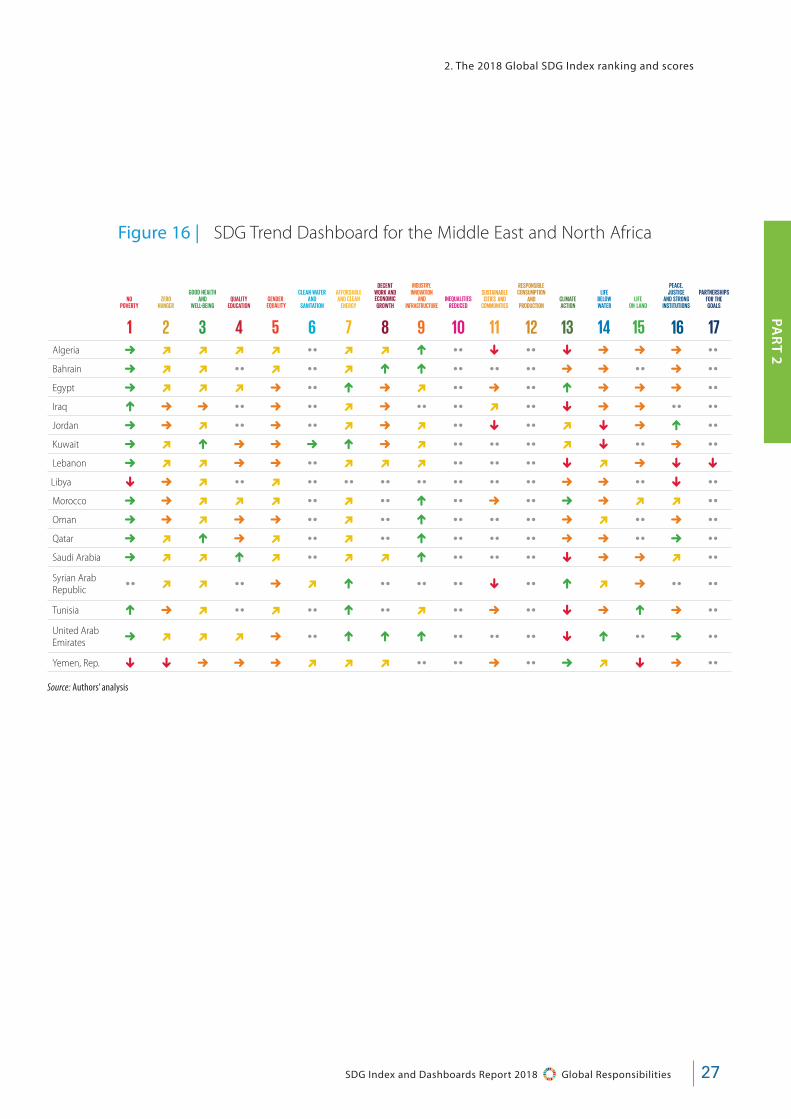
27SDG Index and Dashboards Report 2018 Global Responsibilities
PAR
T 2
Figure 16 | SDG Trend Dashboard for the Middle East and North Africa
Algeria 5 D D D D •• D D L •• p •• p 5 5 5 ••Bahrain 5 D D •• D •• D L L •• •• •• 5 5 •• 5 ••Egypt 5 D D D 5 •• L 5 D •• 5 •• L 5 5 5 ••Iraq L 5 5 •• 5 •• D 5 •• •• D •• p 5 5 •• ••Jordan 5 5 D •• 5 •• D 5 D •• p •• D p 5 L ••Kuwait 5 D L 5 5 5 L 5 D •• •• •• D p •• 5 ••Lebanon 5 D D 5 5 •• D D D •• •• •• p D 5 p p
Libya p 5 D •• D •• •• •• •• •• •• •• 5 5 •• p ••Morocco 5 5 D D D •• D •• L •• 5 •• 5 5 D D ••Oman 5 5 D 5 5 •• D •• L •• •• •• 5 D •• 5 ••Qatar 5 D L 5 D •• D •• L •• •• •• 5 5 •• 5 ••Saudi Arabia 5 D D L D •• D D L •• •• •• p 5 5 D ••Syrian Arab Republic •• D D •• 5 D L •• •• •• p •• L D 5 •• ••
Tunisia L 5 D •• D •• L •• D •• 5 •• p 5 L 5 ••United Arab Emirates 5 D D D 5 •• L L L •• •• •• p L •• 5 ••
Yemen, Rep. p p 5 5 5 D D D •• •• 5 •• 5 D p 5 ••
2. The 2018 Global SDG Index ranking and scores
Source: Authors’ analysis
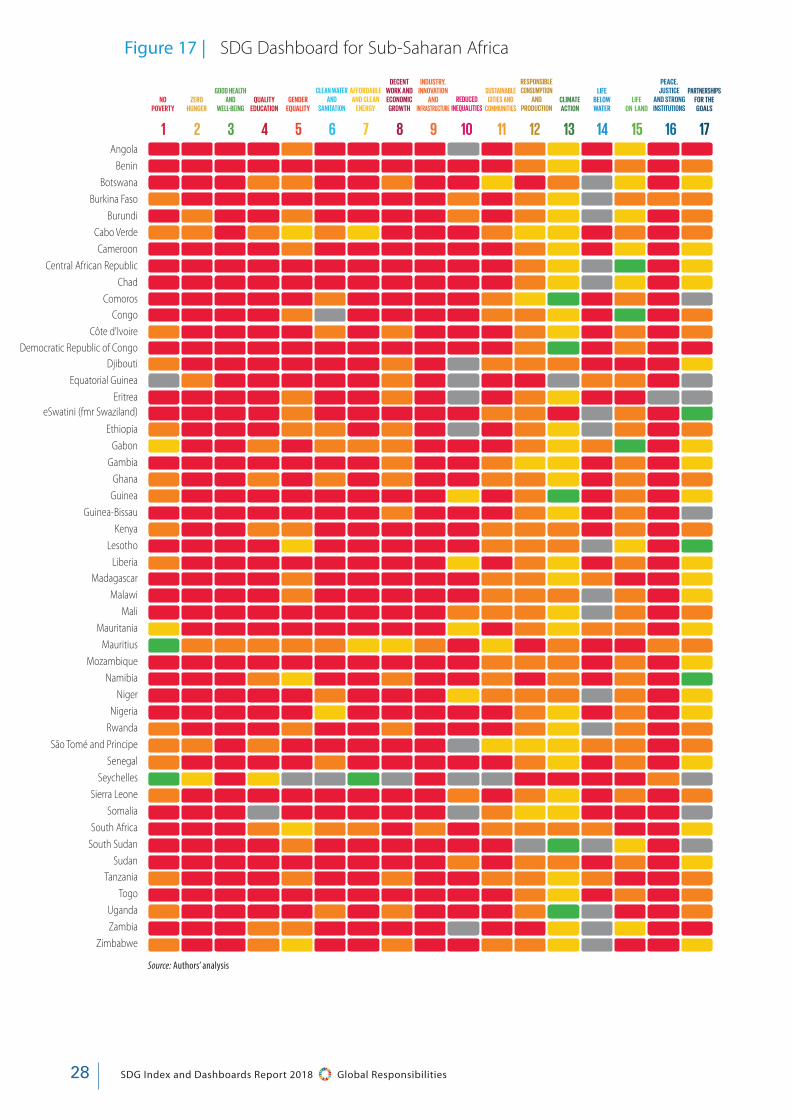
SDG Index and Dashboards Report 2018 Global Responsibilities28
Figure 17 | SDG Dashboard for Sub-Saharan Africa
Source: Authors’ analysis
Angola
Benin
Botswana
Burkina Faso
Burundi
Cabo Verde
Cameroon
Central African Republic
Chad
Comoros
Democratic Republic of Congo
eSwatini (fmr Swaziland)
Congo
Côte d'Ivoire
Djibouti
Equatorial Guinea
Eritrea
Ethiopia
Gabon
Gambia
Ghana
Guinea
Guinea-Bissau
Kenya
Lesotho
LiberiaMadagascar
Malawi
Mali
Mauritania
Mauritius
Mozambique
Namibia
Niger
Nigeria
Rwanda
São Tomé and Principe
Senegal
Seychelles
Sierra Leone
Somalia
South Africa
South Sudan
SudanTanzania
Togo
Uganda
Zambia
Zimbabwe
AFFORDABLE AND CLEAN
ENERGY
DECENT WORK AND ECONOMIC
GROWTH
INDUSTRY, INNOVATION
AND INFRASTRUCTURE
REDUCEDINEQUALITIES
SUSTAINABLE CITIES AND
COMMUNITIES
RESPONSIBLECONSUMPTION
AND PRODUCTION
LIFE ON LAND
PEACE, JUSTICE
AND STRONGINSTITUTIONS
CLIMATEACTION
LIFE BELOW WATER
PARTNERSHIPSFOR THE
GOALSNO
POVERTYZERO
HUNGER
GOOD HEALTHAND
WELL-BEINGQUALITY
EDUCATIONGENDER
EQUALITY
CLEAN WATER AND
SANITATION
1 2 3 4 5 6 7 8 9 10 11 12 13 14 15 16 17
PARTNERSHIPSFOR THE
GOALS
17
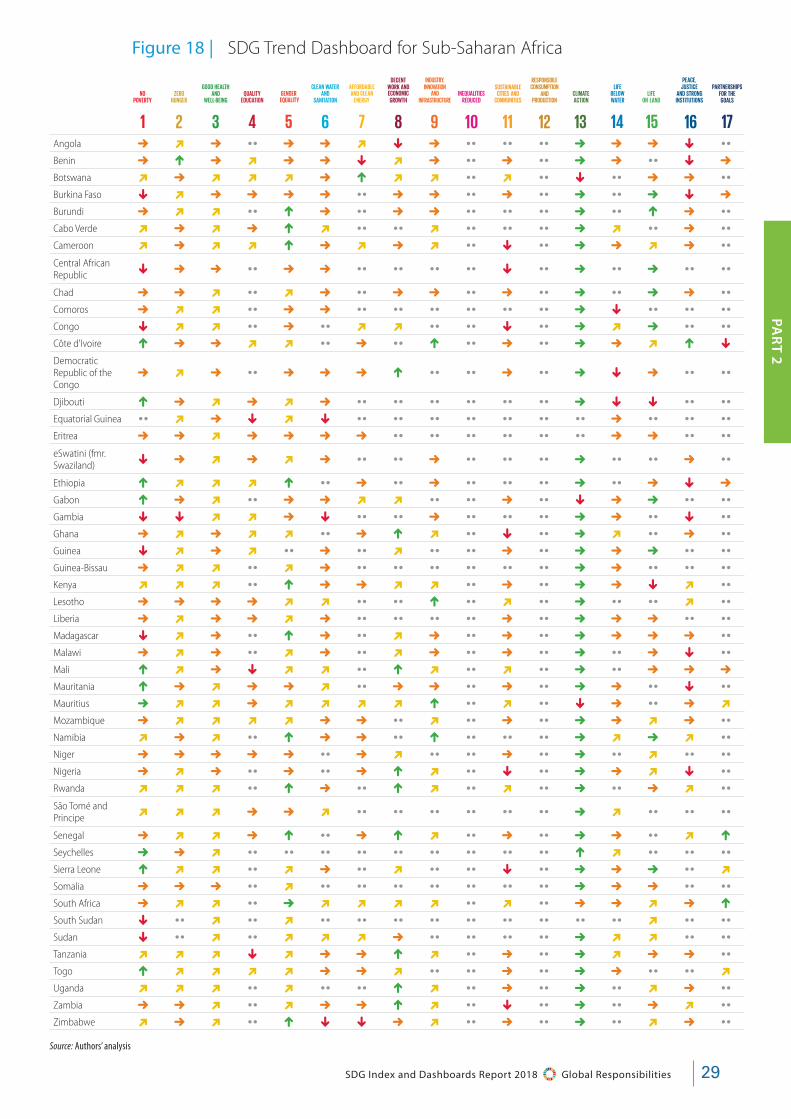
29SDG Index and Dashboards Report 2018 Global Responsibilities
PAR
T 2
Figure 18 | SDG Trend Dashboard for Sub-Saharan Africa
Angola 5 D 5 •• 5 5 D p 5 •• •• •• 5 5 5 p ••Benin 5 L 5 D 5 5 p D 5 •• 5 •• 5 5 •• p 5
Botswana D 5 D D D 5 L D D •• D •• p •• 5 5 ••Burkina Faso p D 5 5 5 5 •• 5 5 •• 5 •• 5 •• 5 p 5
Burundi 5 D D •• L 5 •• 5 5 •• •• •• 5 •• L 5 ••Cabo Verde D 5 D 5 L D •• •• D •• •• •• 5 D •• 5 ••Cameroon D 5 D D L 5 D 5 D •• p •• 5 5 D 5 ••Central African Republic p 5 5 •• 5 5 •• •• •• •• p •• 5 •• 5 •• ••
Chad 5 5 D •• D 5 •• 5 5 •• 5 •• 5 •• 5 5 ••Comoros 5 D D •• 5 5 •• •• •• •• •• •• 5 p •• •• ••Congo p D D •• 5 •• D D •• •• p •• 5 D 5 •• ••Côte d'Ivoire L 5 5 D D •• 5 •• L •• 5 •• 5 5 D L p
Democratic Republic of the Congo
5 D 5 •• 5 5 5 L •• •• 5 •• 5 p 5 •• ••
Djibouti L 5 D 5 D 5 •• •• •• •• •• •• 5 p p •• ••Equatorial Guinea •• D 5 p D p •• •• •• •• •• •• •• 5 •• •• ••Eritrea 5 5 D 5 5 5 5 •• •• •• •• •• •• 5 5 •• ••eSwatini (fmr. Swaziland) p 5 D 5 D 5 •• •• 5 •• •• •• 5 •• •• 5 ••
Ethiopia L D D D L •• 5 •• 5 •• •• •• 5 •• 5 p 5
Gabon L 5 D •• 5 5 D D •• •• 5 •• p 5 5 •• ••Gambia p p D D 5 p •• •• 5 •• •• •• 5 5 •• p ••Ghana 5 D 5 D D •• 5 L D •• p •• 5 D •• 5 ••Guinea p D 5 D •• 5 •• D •• •• 5 •• 5 5 5 •• ••Guinea-Bissau 5 D D •• D 5 •• •• •• •• •• •• 5 5 •• •• ••Kenya D D D •• L 5 5 D D •• 5 •• 5 5 p D ••Lesotho 5 5 5 5 D D •• •• L •• D •• 5 •• •• D ••Liberia 5 D 5 5 D 5 •• •• •• •• 5 •• 5 5 5 •• ••Madagascar p D 5 •• L 5 •• D 5 •• 5 •• 5 5 5 5 ••Malawi 5 D 5 •• D 5 •• D 5 •• 5 •• 5 •• 5 p ••Mali L D 5 p D D •• L D •• D •• 5 •• 5 5 5
Mauritania L 5 D 5 5 D •• 5 5 •• 5 •• 5 5 •• p ••Mauritius 5 D D 5 D D D D L •• D •• p 5 •• 5 D
Mozambique 5 D D D D 5 5 •• D •• 5 •• 5 5 D 5 ••Namibia D 5 D •• L 5 5 •• L •• •• •• 5 D 5 D ••Niger 5 5 5 5 5 •• 5 D •• •• 5 •• 5 •• D •• ••Nigeria 5 D 5 •• 5 •• 5 L D •• p •• 5 5 D p ••Rwanda D D D •• L 5 •• L D •• D •• 5 •• 5 D ••São Tomé and Principe D D D 5 5 D •• •• •• •• •• •• 5 D •• •• ••
Senegal 5 D D 5 L •• 5 L D •• 5 •• 5 5 •• D L
Seychelles 5 5 D •• •• •• •• •• •• •• •• •• L D •• •• ••Sierra Leone L D D •• D 5 •• D •• •• p •• 5 5 5 •• D
Somalia 5 5 5 •• D •• •• •• •• •• •• •• 5 5 5 •• ••South Africa 5 D D •• 5 D D D D •• D •• 5 5 D 5 L
South Sudan p •• D •• D •• •• •• •• •• •• •• •• •• D •• ••Sudan p •• D •• D D D 5 •• •• •• •• 5 D D •• ••Tanzania D D D p D 5 5 L D •• 5 •• 5 D 5 5 ••Togo L D D D D 5 5 D •• •• 5 •• 5 5 •• •• D
Uganda D D D •• D •• •• L D •• 5 •• 5 •• D 5 ••Zambia 5 5 D •• D 5 5 L D •• p •• 5 •• 5 D ••Zimbabwe D 5 D •• L p p 5 D •• 5 •• 5 •• D 5 ••
Source: Authors’ analysis

SDG Index and Dashboards Report 2018 Global Responsibilities30
2. The 2018 Global SDG Index ranking and scores
Figure 20 | SDG Trend Dashboard for Oceania
Fiji 5 D D L •• D •• •• •• •• •• •• 5 D •• •• ••Kiribati L •• D •• •• 5 •• •• •• •• •• •• 5 •• •• •• ••Marshall Islands •• •• •• •• •• •• •• •• •• •• •• •• •• D •• •• ••Micronesia, Fed. Sts. p •• D •• •• •• •• •• •• •• •• •• •• L •• •• ••Nauru •• •• •• •• •• •• •• •• •• •• •• •• D 5 •• •• ••Palau •• •• •• •• •• •• •• •• •• •• •• •• •• L •• •• ••Papua New Guinea D 5 D •• D p •• •• •• •• •• •• 5 D •• •• ••Samoa 5 •• D 5 5 L •• •• •• •• •• •• 5 D •• •• ••Solomon Islands D 5 D •• D p •• •• •• •• •• •• 5 D •• •• ••Tonga 5 D D •• 5 •• •• •• •• •• •• •• 5 D •• •• ••Tuvalu •• •• •• •• •• •• •• •• •• •• •• •• •• L •• •• ••Vanuatu 5 5 D •• 5 D •• •• •• •• •• •• 5 D •• •• 5
Source: Authors’ analysis
Figure 19 | SDG Dashboard for Oceania
Source: Authors’ analysis
Fiji
Kiribati
Marshall Islands
Micronesia, Fed. Sts.
Nauru
Palau
Papua New Guinea
Samoa
Solomon Islands
Tonga
Tuvalu
Vanuatu
AFFORDABLE AND CLEAN
ENERGY
DECENT WORK AND ECONOMIC
GROWTH
INDUSTRY, INNOVATION
AND INFRASTRUCTURE
REDUCEDINEQUALITIES
SUSTAINABLE CITIES AND
COMMUNITIES
RESPONSIBLECONSUMPTION
AND PRODUCTION
LIFE ON LAND
PEACE, JUSTICE
AND STRONGINSTITUTIONS
CLIMATEACTION
LIFE BELOW WATER
PARTNERSHIPSFOR THE
GOALSNO
POVERTYZERO
HUNGER
GOOD HEALTHAND
WELL-BEINGQUALITY
EDUCATIONGENDER
EQUALITY
CLEAN WATER AND
SANITATION
1 2 3 4 5 6 7 8 9 10 11 12 13 14 15 16 17
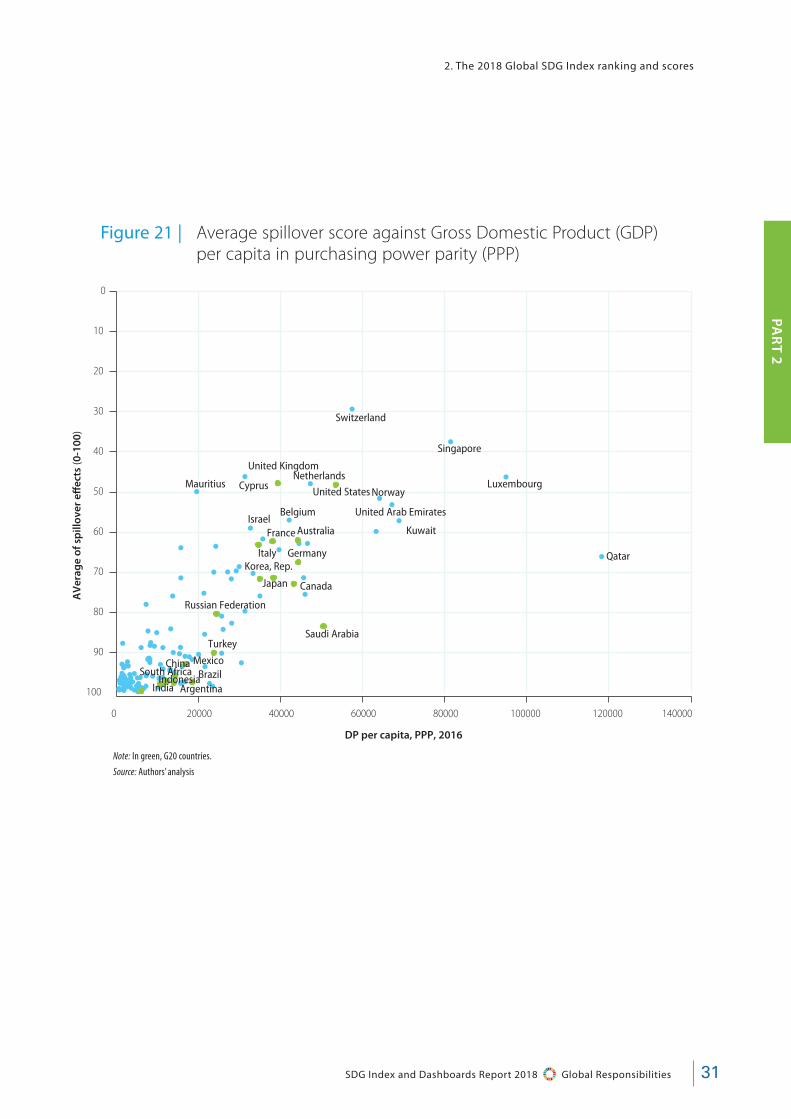
31SDG Index and Dashboards Report 2018 Global Responsibilities
PAR
T 2
Figure 21 | Average spillover score against Gross Domestic Product (GDP) per capita in purchasing power parity (PPP)
Note: In green, G20 countries.Source: Authors’ analysis
United Kingdom
United States
AustraliaFrance
Italy Germany
Japan
Korea, Rep.
Canada
Russian Federation
Saudi ArabiaTurkey
MexicoChinaSouth Africa
ArgentinaBrazilIndonesia
India
Switzerland
Singapore
Cyprus LuxembourgNetherlands
MauritiusNorway
United Arab EmiratesBelgium
KuwaitIsrael
Qatar
0 20000 40000 60000 80000 100000 120000 140000
0
10
20
30
40
50
60
70
80
90
100
AV
erag
e of
sp
illov
er e
ffec
ts (0
-100
)
DP per capita, PPP, 2016
2. The 2018 Global SDG Index ranking and scores

SDG Index and Dashboards Report 2018 Global Responsibilities32
Table 7 | Spillover Index score (from 0 “worst” to 100 “best”)
Country Rank Spillover Score
Afghanistan 151 93.8
Albania 62 88.7
Algeria 68 96.8
Angola 144 98.7
Argentina 53 97.4
Armenia 58 92.4
Australia 37 62.0
Austria 9 62.8
Azerbaijan 45 97.4
Bahrain 80 77.8
Bangladesh 111 97.9
Belarus 23 90.9
Belgium 12 57.0
Belize 103 91.4
Benin 147 96.2
Bhutan 83 88.2
Bolivia 66 98.9
Bosnia and Herzegovina 71 96.2
Botswana 116 71.4
Brazil 56 97.5
Bulgaria 34 91.0
Burkina Faso 136 96.3
Burundi 141 99.3
Cabo Verde 88 88.8
Cambodia 109 98.6
Cameroon 121 97.7
Canada 20 72.8
Central African Republic 156 99.0
Chad 155 99.5
Chile 38 97.7
China 54 95.8
Colombia 74 94.1
Congo 130 98.7
Costa Rica 33 90.3
Côte d’Ivoire 122 96.6
Croatia 21 85.4
Cuba 42 96.1
Cyprus 50 46.1
Czech Republic 13 79.7
Dem. Rep. of the Congo 154 99.3
Country Rank Spillover Score
Denmark 2 75.5
Djibouti 139 81.7
Dominican Republic 75 95.0
Ecuador 46 96.4
Egypt 97 98.7
El Salvador 92 91.4
Estonia 16 82.7
Ethiopia 128 99.0
Finland 3 64.4
Fmr Yugoslav Rep. of Macedonia 61 94.5
France 5 62.2
Gabon 100 97.3
Gambia 133 87.7
Georgia 47 88.4
Germany 4 67.5
Ghana 101 97.3
Greece 48 63.5
Guatemala 117 95.4
Guinea 131 93.3
Guyana 104 78.0
Haiti 145 97.6
Honduras 96 95.2
Hungary 26 80.9
Iceland 10 71.4
India 112 99.6
Indonesia 99 97.8
Iran, Islamic Rep. 82 91.7
Iraq 127 93.5
Ireland 18 59.8
Israel 41 59.0
Italy 29 63.1
Jamaica 81 91.7
Japan 15 71.3
Jordan 91 87.5
Kazakhstan 65 98.4
Kenya 119 93.3
Korea, Rep. 19 71.6
Kuwait 105 57.1
Kyrgyz Republic 51 95.5
Lao PDR 108 99.2
2. The 2018 Global SDG Index ranking and scores

33SDG Index and Dashboards Report 2018 Global Responsibilities
PAR
T 2
Country Rank Spillover Score
Latvia 27 70.0
Lebanon 87 84.1
Lesotho 135 92.3
Liberia 149 96.9
Lithuania 36 71.6
Luxembourg 22 46.2
Madagascar 153 95.2
Malawi 140 99.1
Malaysia 55 90.2
Mali 142 98.8
Malta 30 61.7
Mauritania 134 96.2
Mauritius 90 49.9
Mexico 84 92.8
Moldova 28 98.3
Mongolia 95 97.8
Montenegro 69 63.9
Morocco 77 95.8
Mozambique 138 96.1
Myanmar 113 99.8
Namibia 114 85.0
Nepal 102 98.5
Netherlands 11 47.9
New Zealand 17 75.9
Nicaragua 76 96.3
Niger 148 97.6
Nigeria 150 97.7
Norway 6 51.6
Oman 94 80.7
Pakistan 126 99.3
Panama 86 75.2
Paraguay 72 95.9
Peru 64 96.8
Philippines 85 98.3
Poland 32 84.2
Portugal 31 69.9
Qatar 106 66.1
Romania 44 93.5
Russian Federation 63 80.4
Rwanda 120 97.6
Country Rank Spillover Score
Saudi Arabia 98 83.4
Senegal 118 96.7
Serbia 40 75.9
Sierra Leone 146 92.9
Singapore 43 37.5
Slovak Republic 24 69.7
Slovenia 8 68.6
South Africa 107 97.2
Spain 25 70.3
Sri Lanka 89 94.0
Sudan 143 99.3
Suriname 67 90.0
eSwatini (fmr. Swaziland) 137 84.6
Sweden 1 62.8
Switzerland 7 29.3
Syrian Arab Republic 124 96.5
Tajikistan 73 97.6
Tanzania 123 98.5
Thailand 59 97.7
Togo 132 97.5
Trinidad and Tobago 70 92.5
Tunisia 78 92.9
Turkey 79 90.0
Turkmenistan 110 88.7
Uganda 125 98.0
Ukraine 39 91.7
United Arab Emirates 60 53.1
United Kingdom 14 47.8
United States 35 48.2
Uruguay 49 90.4
Uzbekistan 52 99.0
Venezuela, RB 93 97.5
Vietnam 57 96.2
Yemen, Rep. 152 93.4
Zambia 129 98.9
Zimbabwe 115 95.8
Source: Authors’ analysis
2. The 2018 Global SDG Index ranking and scores
Table 7 | (continued)
Methodology
3

PAR
T 3
3.1 LIMITATIONS AND CHANGES MADE TO THE 2018 EDITION
Interpreting the Index and Dashboards resultsThe SDG Index and Dashboards describe countries’ progress towards achieving the SDGs and indicate areas requiring faster progress. The global SDG Index score and scores by goal can be interpreted as the percentage of achievement. The difference between 100 and countries’ scores is therefore the distance in percentage that needs to be completed to achieving the SDGs and goals. The same basket of indicators is used for all countries to generate comparable scores and rankings. It should be noted that differences in rankings may be due to small differences in the aggregate score.
The SDG Dashboards provide a visual representation of countries’ performance by SDGs to identify priorities for action. The “traffic light” color scheme (green, yellow, orange and red) illustrates how far a country is from achieving a particular goal. As in previous years, the Dashboards and country profiles for OECD countries include additional metrics that are not available for non-OECD member countries. For the first time we present SDG Trend Dashboards that indicate whether a country is on track to achieve a particular goal by 2030.
The methods summary section below describes how the SDG Index and Dashboards were computed.
Changes made to the 2018 SDG Index and DashboardsThe 2018 SDG Index covers 156 compared with 157 countries in 2017. Owing to insufficient data availability we are no longer able to include Barbados and Timor Leste in the index but Cabo Verde had sufficient data this year to be included. For the first time the Dashboards present data for all 193 UN member States.
The 2018 report incorporates several new indicators (Table 8). This table also identifies the indicators that were replaced or modified due to changes in the methodology and estimates produced by data providers. The majority of the data for this year’s edition were extracted between February and April 2018. For OECD countries, the SDG Dashboards incorporate a greater number of metrics on “leave no one behind”. These indicators focus on gaps in outcomes by various population groups (income level, age, geography, gender).
For the first time, the 2018 report incorporates trend data to assess countries’ progress towards meeting the 2030 SDG deadline. These data are available in SDG Trends Dashboards as well as the 2-page country profiles at the end of this report. The methodology for estimating SDG trends is described in the methods summary.
Table 8 | New indicators and replacements included in the 2018 SDG Index and Dashboards
Indicator Change
Gap in life expectancy at birth among regions (years) New addition
Gap in self-reported health by income (0 - 100) New addition
Percentage of variation in science performance explained by students’ socio-economic status
Replaces PISA Social Justice Index (0-10)
Students performing below level 2 in science (%) New addition
Resilient students (%) New addition
For high-income countries : population using safely managed water services (%) Replaces Access to improved water source (% population)
For all other countries : Population using at least basic drinking water services (%) Replaces Access to improved water source (% population)
Methodology
PART 3
35SDG Index and Dashboards Report 2018 Global Responsibilities

1. Limitations and changes made to the 2018 edition
Indicator Change
For high-income & OECD countries : population using safely managed sanitation services (%)
Replaces Access to improved sanitation facilities (% population)
For all other countries : Population using at least basic sanitation services (%)
Replaces Access to improved sanitation facilities (% population)
Access to clean fuels & technology for cooking (%) Replaces Access to non-solid fuels (% population)
The Times Higher Education Universities Ranking, Average score of top 3 universities (0-100)
Replaces QS University Ranking, Average score of top 3 universities (0-100)
Gap in internet access by income (%) New addition
Women in science and engineering (%) New addition
Gini Coefficient adjusted for top income (1-100) Replaces Gini index (0-100)
Elderly Poverty Rate (%) New addition
Satisfaction with public transport (%) New addition
Rent overburden rate (%) Replaces Median of the rent burden (private market and subsidized rent) as a share of disposable income (%)
CO2 emissions embodied in fossil fuel exports (kg/capita) New addition
Fish caught by trawling (%) New addition
Imported biodiversity threats (threats/capita) Replaces Imported biodiversity impacts (species lost per million people)
Source: Authors’ analysis
Limitations and data gapsDue to changes in the indicators and some refinements in the methodology, SDG Index rankings and scores cannot be compared across the 2016, 2017 and 2018 editions of the report. In spite of our best efforts to identify data for the SDGs, several indicator and data gaps persist (Table 9). As underscored in previous versions of this report, governments and the international community must increase investments in SDG data and monitoring systems to close these gaps.
Table 8 | New indicators and replacements included in the 2018 SDG Index and Dashboards
36 SDG Index and Dashboards Report 2018 Global Responsibilities
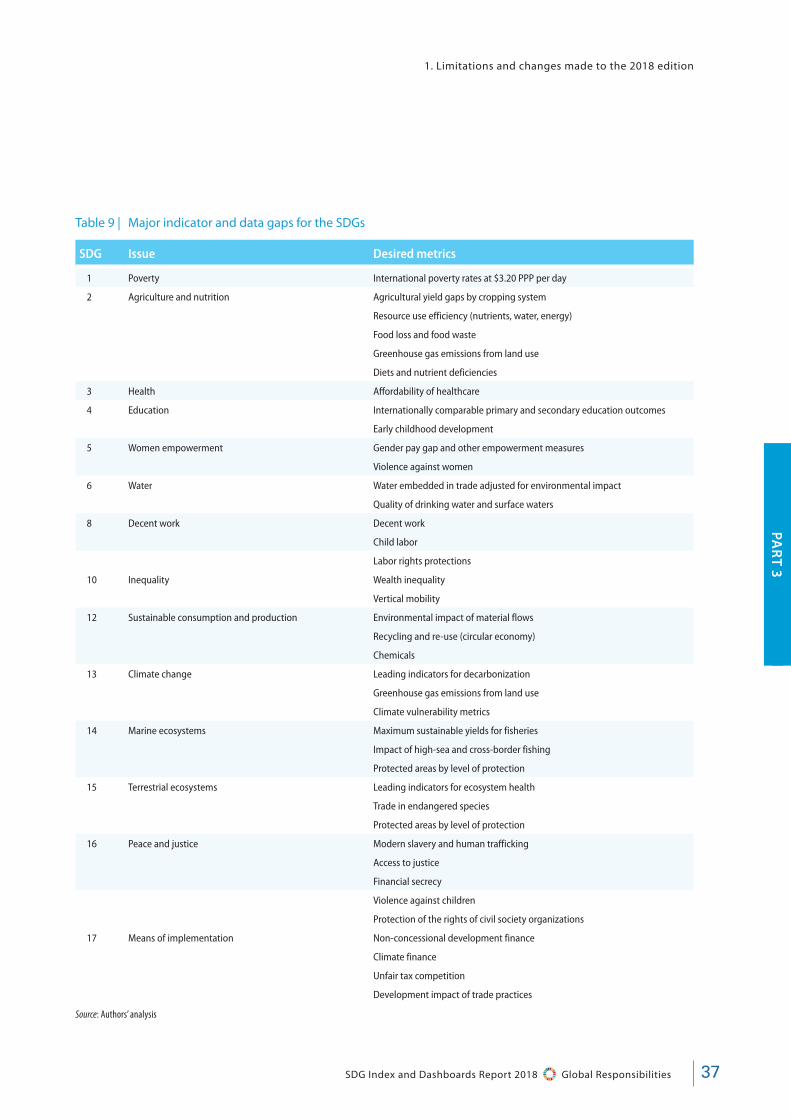
PAR
T 3
Table 9 | Major indicator and data gaps for the SDGs
SDG Issue Desired metrics
1 Poverty International poverty rates at $3.20 PPP per day
2 Agriculture and nutrition Agricultural yield gaps by cropping system
Resource use efficiency (nutrients, water, energy)
Food loss and food waste
Greenhouse gas emissions from land use
Diets and nutrient deficiencies
3 Health Affordability of healthcare
4 Education Internationally comparable primary and secondary education outcomes
Early childhood development
5 Women empowerment Gender pay gap and other empowerment measures
Violence against women
6 Water Water embedded in trade adjusted for environmental impact
Quality of drinking water and surface waters
8 Decent work Decent work
Child labor
Labor rights protections
10 Inequality Wealth inequality
Vertical mobility
12 Sustainable consumption and production Environmental impact of material flows
Recycling and re-use (circular economy)
Chemicals
13 Climate change Leading indicators for decarbonization
Greenhouse gas emissions from land use
Climate vulnerability metrics
14 Marine ecosystems Maximum sustainable yields for fisheries
Impact of high-sea and cross-border fishing
Protected areas by level of protection
15 Terrestrial ecosystems Leading indicators for ecosystem health
Trade in endangered species
Protected areas by level of protection
16 Peace and justice Modern slavery and human trafficking
Access to justice
Financial secrecy
Violence against children
Protection of the rights of civil society organizations
17 Means of implementation Non-concessional development finance
Climate finance
Unfair tax competition
Development impact of trade practices
Source: Authors’ analysis
1. Limitations and changes made to the 2018 edition
37SDG Index and Dashboards Report 2018 Global Responsibilities

The report relies to on data validated and published by international organizations and other providers who may adjust national data to ensure international comparability. As a result, some data points presented in this report may be different from data available from national statistical offices. Moreover, the length of the validation processes by international organizations can lead to significant delays in publishing some data. As a result, national statistical offices may have more recent data for certain indicators. To ensure maximum data comparability we only use data from internationally comparable sources.
Finally, the reported SDG Trends are based on data points that precede the adoption of SDGs, because data is reported with long lags at the international level due to lengthy validation processes. Over time, we will update the data to use 2015 as baseline year for SDG Trends.
Looking forwardIn future editions we will aim to include additional and improved SDG metrics while aiming for greater comparability over time. To better inform regional and national discussions around the implementation of the SDGs, we support SDG Indices and Dashboards for regions (e.g. the Africa Index) and at sub-national levels (e.g. US city index). SDSN is working with a number of partners to produce more of these regional and sub-national editions as tools to promote evidence-based policymaking, mobilize regional and local communities, and identify persisting data gaps for monitoring the SDGs.
1. Limitations and changes made to the 2018 edition
38 SDG Index and Dashboards Report 2018 Global Responsibilities

PAR
T 3
3.2 METHODS SUMMARY
The 2018 global SDG Index and Dashboards provides a comprehensive assessment of distance to targets based on the most up to date data available covering all 193 UN member States. This year’s report includes 88 global indicators and 111 indicators for the Dashboard for OECD countries. The main new feature this year is the inclusion of trends at goal and indicator level. This year’s report also incorporates a number of new indicators to fill data gaps.
The following sections provide an overview of the methodology for indicator selection, normalization, aggregation and for generating indications on trends. Additional information including raw data, additional data tables and sensitivity tests are available online.
A. Data selection
Criteria for indicator selectionWhere possible, the 2018 SDG Index and Dashboards reports official SDG indicators endorsed by the UN Statistical Commission. Where insufficient data is available for an official indicator and to close data gaps, we include other metrics from official and unofficial providers. Five criteria for indicator selection were used to determine suitable metrics for inclusion in the global SDG Index and Dashboards:
1. Global relevance and applicability to a broad range of country settings: The indicators are relevant for monitoring achievement of the SDGs and applicable to the entire continent. They are internationally comparable and allow for direct comparison of performance across countries. In particular, they allow for the definition of quantitative performance thresholds that signify SDG achievement.
2. Statistical adequacy: The indicators selected represent valid and reliable measures.
3. Timeliness: The indicators selected are up to date and published on a reasonably prompt schedule.
4. Data quality: Data series represent the best available measure for a specific issue, and derive from official national or international sources (e.g. national statistical offices or international organizations) or other reputable sources, such as peer-reviewed publications. No imputations of self-reported national estimates are included.
5. Coverage: Data have to be available for at least 80% of the 149 UN Member States with a national population greater than 1 million.
Data sourcesThe data included in the 2018 Global Index and Dashboards come from a mix of official and non-official data sources. Most of the data come from International Organizations (World Bank, OECD, WHO, FAO, ILO, UNICEF, other) which have extensive and rigorous data validation processes. Other data sources include household surveys (Gallup World Poll), civil society organizations and networks (Oxfam, Tax Justice Network, other) and peer-reviewed journals. The full list of indicators and data sources is available in Table 10.
B. Missing data and imputationsThe purpose of the SDG Index and Dashboards is to guide countries’ discussions of their SDG priorities today based on available and robust data. To minimize biases from missing data, the SDG Index only includes countries that have data for at least 80% of the variables included in the global SDG Index or the augmented SDG Index for OECD countries. The list of countries not included in the SDG Index due to insufficient data availability is available in Table 11. We do include all UN member countries in the SDG Dashboards and country profiles.
39SDG Index and Dashboards Report 2018 Global Responsibilities

Considering that many SDG priorities lack widely accepted statistical models for imputing country-level data, we generally did not impute or model any missing data. We made exceptions for the following variables that would otherwise not have been included because of missing data:
• Prevalence of wasting in children under 5 years of age (%):UNICEF et al. (2016) report an average prevalence of wasting in high-income countries of 0.75%. We assumed this value for high-income countries with missing data.
• Prevalence of stunting (low height-for-age) in children under 5 years of age (%): UNICEF et al. (2016) report an average prevalence of wasting in high-income countries of 2.58%. We assumed this value for high-income countries with missing data.
• Prevalence of undernourishment (% of population): FAO et al. (2015) report 14.7 million undernourished people in developed regions, which corresponds to an average prevalence of 1.17% in the developed regions. We assumed a 1.2% prevalence rate for each high-income country (World Bank, 2016b) with missing data.
• Times Higher Education Universities Ranking, Average score of top 3 universities (0-100): We assumed a value of 0 for countries with no universities in the rankings
• Research and development expenditure (% of GDP): We assumed zero R&D expenditure for low-income countries that did not report any data for this variable.
• Percentage of children 5-14 years involved in child labor: The best performing upper-middle-income countries have a child labor rate of 1% (UNICEF, 2015). We assumed 0% child labor for high-income countries for which no data was reported.
• CO2 emissions embodied in fossil fuel exports (kg/capita): We assumed a value of 0 for countries with little or no production of fossil fuels when export data was missing.
• Transfers of major conventional weapons (exports) (constant 1990 US$ million per 100,000 people): We assumed a value of 0 for countries with unreported export data.
To reduce missing data biases in the computation of the SDG Index, we impute missing goal scores using the regional mean. This applies primarily to Goal 10 (Reduced Inequalities) and Goal 14 (Life Below Water). Imputed goal scores are used solely for the computation of the index, and they are not reported in the SDG Dashboards or country profiles. In the case of Goal 14 (Life Below Water), we hope to identify suitable metrics in the future to gauge the impact of landlocked countries on oceans.
C. Method for Constructing the SDG Index The procedure for calculating the SDG Index comprised three steps: (i) censor extreme values from the distribution of each indicator; (ii) rescale the data to ensure comparability across indicators; (iii) aggregate the indicators within and across SDGs.
Normalization To make the data comparable across indicators, each variable was rescaled from 0 to 100 with 0 denoting worst performance and 100 describing the optimum. Rescaling is usually very sensitive to the choice of limits and extreme values (outliers) at both tails of the distribution. The latter may become unintended thresholds and introduce spurious variability in the data. Consequently, the choice of upper and lower bounds can affect the relative ranking of countries in the index. This applies in particular to the lower bounds that affect the value and the units of the variable, which may in turn affect rankings, while the upper bound only affects the units (Booysen, 2002; OECD and JRC, 2016).
2. Methods summary
40 SDG Index and Dashboards Report 2018 Global Responsibilities

PAR
T 3
The upper bound for each indicator was determined using a five-step decision tree:
1. Use absolute quantitative thresholds in SDGs and targets: e.g. zero poverty, universal school completion, universal access to water and sanitation, full gender equality. Some SDG Targets propose relative changes (Target 3.4: […] reduce by one third premature mortality from non-communicable diseases [..]) that cannot be translated into a global baseline today. Such targets are addressed through step 5 below.
2. Where no explicit SDG target is available, apply the principle of “leave no one behind” to set upper bound to universal access or zero deprivation for the following types of indicators:
a. Measures of extreme poverty (e.g. wasting), consistent with the SDG ambition to end extreme poverty in all its forms (“leave no one behind”).
b. Public service coverage (e.g. access to contraception).
c. Access to basic infrastructure (e.g. mobile phone coverage, wastewater treatment).
3. Where science-based targets exist that must be achieved by 2030 or later, use these to set 100% upper bound (e.g. zero greenhouse gas emissions from electricity as required by no later than 2070 to stay within 2°C, 100% sustainable management of fisheries).
4. Where several countries already exceed an SDG target, use the average of the top 5 performers (e.g. child mortality).
5. For all other indicators, use the average of the top performers. In the case of global indicators retained, the upper bound was set by taking the average value of the top 5 global performers. For OECD indicators, the average top 3 performers.
These principles interpret the SDGs as “stretch targets” and focus attention on the indicators where a country is lagging behind. Each indicator distribution was censored, so that all values exceeding the upper bound scored 100, and values below the lower bound scored 0.
In some cases, the upper bound exceeded the thresholds to be met by 2030 in order to achieve the SDGs. For example, the SDGs call for reducing child mortality to no more than 25 per 1000 live births, but many countries have already exceeded this threshold (i.e. have mortality rates under 25 per 1000). By defining the upper bound as the “best” outcome (e.g. 0 mortality per 1000) – not the SDG achievement threshold – the SDG Index rewards improvements across the full distribu-tion. This is particularly important for countries that have already achieved some SDG thresholds, but still lag behind other countries on this metric.
Some countries already exceed the upper bound of some indicators today and more will do so in the coming years as the world progresses towards the SDGs.
To remove the effect of extreme values, which can skew the results of a composite index, the OECD (OECD and JRC, 2016) recommends censoring the data at the bottom 2.5th percentile as the minimum value for the normalization. We applied this approach to the lower bound and censored data at this level.
After establishing the upper and lower bounds, variables were transformed linearly to a scale between 0 and 100 using the following rescaling formula for the range [0; 100]:
2. Methods summary
41SDG Index and Dashboards Report 2018 Global Responsibilities
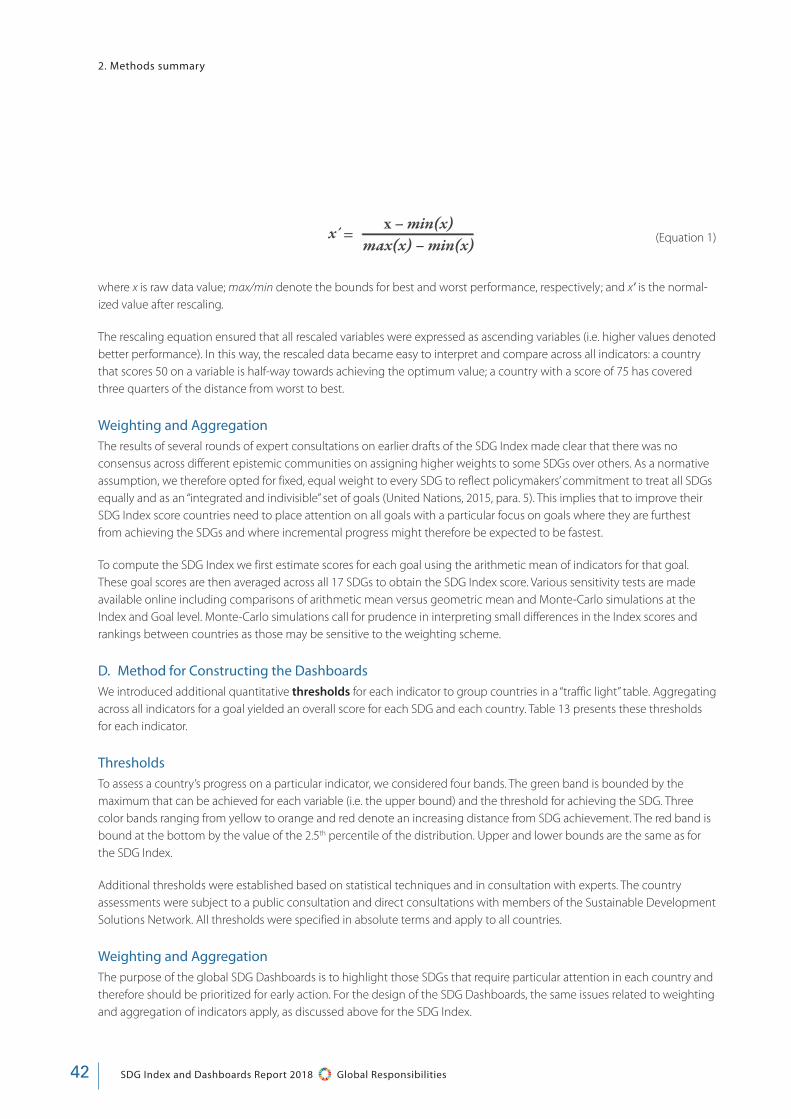
x́ =x – min(x)
max(x) – min(x)
(Equation 1)
where x is raw data value; max/min denote the bounds for best and worst performance, respectively; and x’ is the normal-ized value after rescaling.
The rescaling equation ensured that all rescaled variables were expressed as ascending variables (i.e. higher values denoted better performance). In this way, the rescaled data became easy to interpret and compare across all indicators: a country that scores 50 on a variable is half-way towards achieving the optimum value; a country with a score of 75 has covered three quarters of the distance from worst to best.
Weighting and Aggregation The results of several rounds of expert consultations on earlier drafts of the SDG Index made clear that there was no consensus across different epistemic communities on assigning higher weights to some SDGs over others. As a normative assumption, we therefore opted for fixed, equal weight to every SDG to reflect policymakers’ commitment to treat all SDGs equally and as an “integrated and indivisible” set of goals (United Nations, 2015, para. 5). This implies that to improve their SDG Index score countries need to place attention on all goals with a particular focus on goals where they are furthest from achieving the SDGs and where incremental progress might therefore be expected to be fastest.
To compute the SDG Index we first estimate scores for each goal using the arithmetic mean of indicators for that goal. These goal scores are then averaged across all 17 SDGs to obtain the SDG Index score. Various sensitivity tests are made available online including comparisons of arithmetic mean versus geometric mean and Monte-Carlo simulations at the Index and Goal level. Monte-Carlo simulations call for prudence in interpreting small differences in the Index scores and rankings between countries as those may be sensitive to the weighting scheme.
D. Method for Constructing the Dashboards We introduced additional quantitative thresholds for each indicator to group countries in a “traffic light” table. Aggregating across all indicators for a goal yielded an overall score for each SDG and each country. Table 13 presents these thresholds for each indicator.
Thresholds To assess a country’s progress on a particular indicator, we considered four bands. The green band is bounded by the maximum that can be achieved for each variable (i.e. the upper bound) and the threshold for achieving the SDG. Three color bands ranging from yellow to orange and red denote an increasing distance from SDG achievement. The red band is bound at the bottom by the value of the 2.5th percentile of the distribution. Upper and lower bounds are the same as for the SDG Index.
Additional thresholds were established based on statistical techniques and in consultation with experts. The country assessments were subject to a public consultation and direct consultations with members of the Sustainable Development Solutions Network. All thresholds were specified in absolute terms and apply to all countries.
Weighting and AggregationThe purpose of the global SDG Dashboards is to highlight those SDGs that require particular attention in each country and therefore should be prioritized for early action. For the design of the SDG Dashboards, the same issues related to weighting and aggregation of indicators apply, as discussed above for the SDG Index.
2. Methods summary
42 SDG Index and Dashboards Report 2018 Global Responsibilities

PAR
T 3
Averaging across all indicators for an SDG might hide areas of policy concern if a country performs well on most indica-tors but faces serious shortfalls on one or two metrics within the same SDG. This applies particularly to high-income and upper-middle-income countries that have made significant progress on many SDG dimensions but may face serious shortfalls on individual variables.
As a result, the global SDG Dashboards aggregate indicator ratings for each SDG by estimating the average of the two variables on which a country performed worst. To this end, the indicator values were first rescaled from 0 to 3, where 0 corresponds to the lower bound, 1 to the value of the threshold between red and orange (“red threshold”), 2 to the value of the threshold between yellow and green (“green threshold”), and 3 to the upper bound. For all indicators, the yellow/orange threshold was set as the value halfway between the red and green thresholds (1.5). Each interval between 0 and 3 is continuous.
We then took the average of the two rescaled variables on which the country performed worst to identify the rating for the goal. We applied the added rule that in order to score green for the goal both indicators had to be green – otherwise the goal would be rated yellow. Similarly, a red score was applied only if both worst-performing indicators score red. If the country has only one data point under the SDG then the color rating for that indicator determines the overall rating for the goal. If the country has less than 50% of the indicators available under a goal the dashboard color for that goal is “grey”.
E. SDG TrendsUsing historic data, we estimate how fast a country has been progressing towards an SDG and determine whether – if continued into the future – this pace will be sufficient to achieve the SDG by 2030. For each indicator, SDG achievement is defined by the green threshold set for the SDG Dashboards. The difference in percentage points between the green threshold and the normalized country score denotes the gap that must be closed to meet that goal. To estimate SDG trends, we calculated the linear annual growth rates (i.e. annual percentage improvements) needed to achieve the goal by 2030 (i.e. 2010-2030) which we compared to the average annual growth rate over the most recent period (usually 2010-2015). Progress towards goal achievement on a particular indicator is described using a 5-arrow system (Figure 22). Figure 23 illustrates the methodology graphically.
To estimate overall trends for an SDG, each indicator trend for that SDG was re-normalized on a linear scale from 0-4. The trend for an SDG was calculated as the arithmetic average of all trend indicators for that goal. An average between 0-1 corresponds to a “decreasing” goal trend, between 1-2 to a “stagnating” goal trend, 2-3 “moderately improving goal trend”, 3-4 “on track” goal trend. Maintaining SDG achievement corresponds to a normalized score of exactly 3. Trends are reported at the SDG level only if trend data were available for at least 75% of SDG Dashboards indicators under that goal.
SDG Trends are based on data points that precede the adoption of SDGs, because data is reported with long lags at the international level due to lengthy validation processes. Over time, we will update the data to use 2015 as baseline year for SDG Trends.
Table 14 provides the list of indicators used to compute SDG Trends. Trends indicators were selected from among the indicators included in the SDG Dashboards based on the availability of trend data. When the value for one year was not available we used the closest available value with a maximum of one-year difference. The table also indicates the period over which the trend was calculated.
Several other calculation methods were considered. For instance, we tested the sensitivity of the results when using technical optimums (100 score) as “goal achievement” and calculate distance to technical optimums. This approach yielded harsher results and is not consistent with our conceptual assumption that lower green thresholds correspond to goal achievement. We also considered using compound annual growth rates (CAGR) instead of linear growth rates. The two
2. Methods summary
43SDG Index and Dashboards Report 2018 Global Responsibilities

approaches yield rather similar results and we could not identify a strong argument for using the more sophisticated CAGR method. Finally, while the dashboards are based only on the two-worst indicators trends are generated using all indicators under the goal. This is because the dashboards aim to highlight goals where particular attention is required due to very poor performance on some of the underlying indicators whereas trends aim to reflect insights on the overall goal evolu-tion including all indicators.
2. Methods summary
Green bound “goal achievement”
Extrapolated linear annual growth rate (2010-2030)
2010 2015 2030
30
5
L
D
5
p
p 5 D L 5Decreasing Stagnating Moderately
IncreasingOn track Maintaining SDG
achievement
Decreasing score, i.e. country is moving in the wrong direction
Score remains stagnant or is increasing at a
rate below 50% of the growth rate needed to achieve the SDG
by 2030
Score is increasing at a rate above 50% of the required growth
rate but below the rate needed to achieve the
SDG by 2030
Score is increasing at the rate needed to achieve the SDG
by 2030
Score is level and trend remains at or above SDG achievement
Figure 22 | The 5-arrow system for denoting SDG Trends
Figure 23 | Graphic representation of the SDG Trends methodology
44 SDG Index and Dashboards Report 2018 Global Responsibilities
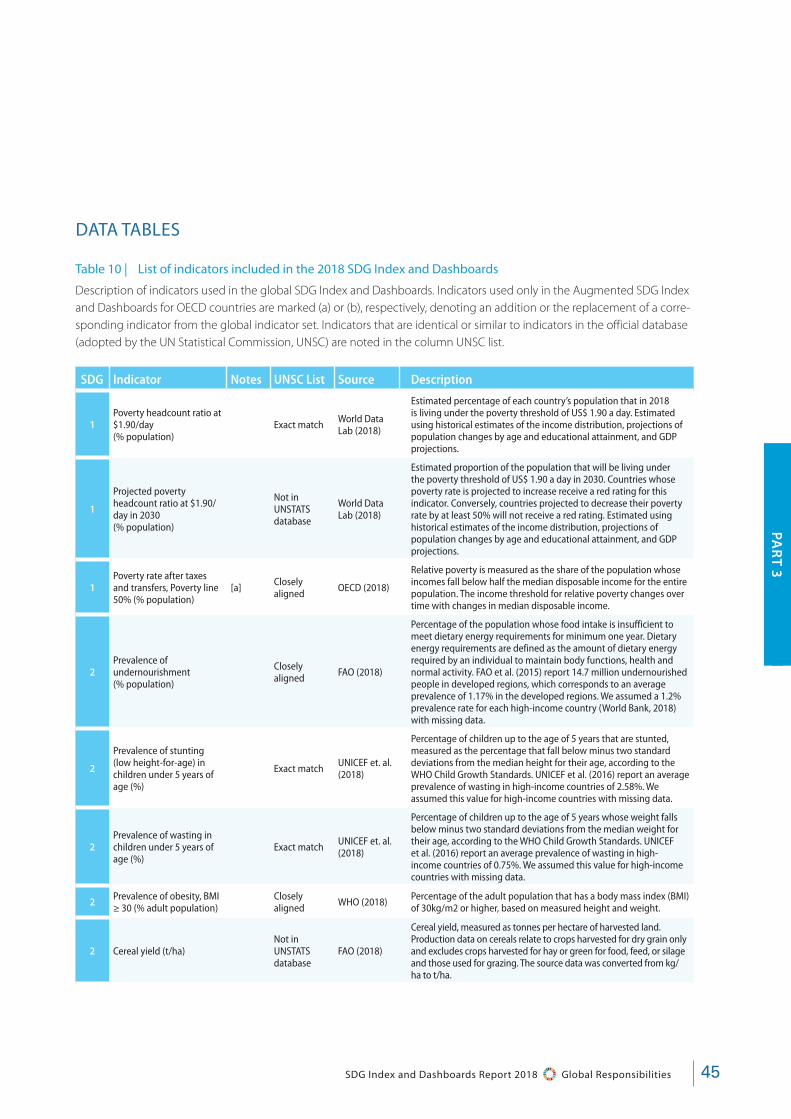
PAR
T 3
DATA TABLES
Table 10 | List of indicators included in the 2018 SDG Index and Dashboards
Description of indicators used in the global SDG Index and Dashboards. Indicators used only in the Augmented SDG Index and Dashboards for OECD countries are marked (a) or (b), respectively, denoting an addition or the replacement of a corre-sponding indicator from the global indicator set. Indicators that are identical or similar to indicators in the official database (adopted by the UN Statistical Commission, UNSC) are noted in the column UNSC list.
SDG Indicator Notes UNSC List Source Description
1Poverty headcount ratio at $1.90/day (% population)
Exact match World Data Lab (2018)
Estimated percentage of each country’s population that in 2018 is living under the poverty threshold of US$ 1.90 a day. Estimated using historical estimates of the income distribution, projections of population changes by age and educational attainment, and GDP projections.
1
Projected poverty headcount ratio at $1.90/day in 2030 (% population)
Not in UNSTATS database
World Data Lab (2018)
Estimated proportion of the population that will be living under the poverty threshold of US$ 1.90 a day in 2030. Countries whose poverty rate is projected to increase receive a red rating for this indicator. Conversely, countries projected to decrease their poverty rate by at least 50% will not receive a red rating. Estimated using historical estimates of the income distribution, projections of population changes by age and educational attainment, and GDP projections.
1Poverty rate after taxes and transfers, Poverty line 50% (% population)
[a] Closely aligned OECD (2018)
Relative poverty is measured as the share of the population whose incomes fall below half the median disposable income for the entire population. The income threshold for relative poverty changes over time with changes in median disposable income.
2Prevalence of undernourishment (% population)
Closely aligned FAO (2018)
Percentage of the population whose food intake is insufficient to meet dietary energy requirements for minimum one year. Dietary energy requirements are defined as the amount of dietary energy required by an individual to maintain body functions, health and normal activity. FAO et al. (2015) report 14.7 million undernourished people in developed regions, which corresponds to an average prevalence of 1.17% in the developed regions. We assumed a 1.2% prevalence rate for each high-income country (World Bank, 2018) with missing data.
2
Prevalence of stunting (low height-for-age) in children under 5 years of age (%)
Exact match UNICEF et. al. (2018)
Percentage of children up to the age of 5 years that are stunted, measured as the percentage that fall below minus two standard deviations from the median height for their age, according to the WHO Child Growth Standards. UNICEF et al. (2016) report an average prevalence of wasting in high-income countries of 2.58%. We assumed this value for high-income countries with missing data.
2Prevalence of wasting in children under 5 years of age (%)
Exact match UNICEF et. al. (2018)
Percentage of children up to the age of 5 years whose weight falls below minus two standard deviations from the median weight for their age, according to the WHO Child Growth Standards. UNICEF et al. (2016) report an average prevalence of wasting in high-income countries of 0.75%. We assumed this value for high-income countries with missing data.
2 Prevalence of obesity, BMI ≥ 30 (% adult population)
Closely aligned WHO (2018) Percentage of the adult population that has a body mass index (BMI)
of 30kg/m2 or higher, based on measured height and weight.
2 Cereal yield (t/ha)Not in UNSTATS database
FAO (2018)
Cereal yield, measured as tonnes per hectare of harvested land. Production data on cereals relate to crops harvested for dry grain only and excludes crops harvested for hay or green for food, feed, or silage and those used for grazing. The source data was converted from kg/ha to t/ha.
45SDG Index and Dashboards Report 2018 Global Responsibilities

SDG Indicator Notes UNSC List Source Description
2 Sustainable Nitrogen Management Index
Not in UNSTATS database
Zhang and Davidson (2016)
The Sustainable Nitrogen Management Index (SNMI) is a one-dimensional ranking score that combines two efficiency measures in crop production: Nitrogen Use Efficiency (NUE) and land use efficiency (crop yield).
3 Maternal mortality rate (per 100,000 live births) Exact match WHO (2018)
Estimated number of women, between the age of 15-49, who die from pregnancy-related causes while pregnant, or within 42 days of termination of pregnancy, per 100,000 live births.
3 Neonatal mortality rate (per 1,000 live births) Exact match UNICEF et. al.
(2018)Number of newborn infants (neonates) dying before reaching 28 days of age, per 1,000 live births.
3 Mortality rate, under-5 (per 1,000 live births) Exact match UNICEF et. al.
(2018)
Probability that a newborn baby will die before reaching age five, if subject to age-specific mortality rates of the specified year, per 1,000 live births.
3 Incidence of tuberculosis (per 100,000 people) Exact match WHO (2018)
Estimated rate of new and relapse cases of tuberculosis in a given year, expressed per 100,000 people. All forms of tuberculosis are included, including cases of people living with HIV.
3 HIV prevalence (per 1,000) Closely aligned IMHE (2016)
Estimated prevalence of people living with HIV, per 1,000 people. The estimates are modelled using population-based surveys, where available, and HIV prevalence studies in countries with low-level HIV epidemics where transmission largely occurs among key population groups.
3
Age-standardised death rate due to cardiovascular disease, cancer, diabetes, and chronic respiratory disease in populations age 30–70 years (per 100,000 population)
Exact match WHO (2018)
Probability of dying between the ages of 30 and 70 years from cardiovascular diseases, cancer, diabetes or chronic respiratory diseases, defined as the percent of 30-year-old-people who would die before their 70th birthday from these diseases, assuming current mortality rates at every age and that individuals would not die from any other cause of death (e.g. injuries or HIV/AIDS)
3
Age-standardised death rate attributable to household air pollution and ambient air pollution (per 100,000 population)
Exact match WHO (2018)Mortality rate that is attributable to the joint effects of fuels used for cooking indoors and ambient outdoor air pollution. Calculated as number of deaths divided by the total population.
3 Traffic deaths rate (per 100,000 people) Exact match WHO (2018) Estimated number of fatal road traffic injuries per 100,000 people.
3 Healthy Life Expectancy at birth (years)
Not in UNSTATS database
WHO (2018)
Average number of years that a person can expect to live in “full health” by taking into account years lived in less than full health due to disease and/or injury. It adds up life expectancy for different health states, adjusted for severity distribution, capturing both fatal and non-fatal health outcomes in a summary measure of average levels of population health.
3Adolescent fertility rate (births per 1,000 women ages 15-19)
Closely aligned UNDP (2018) Number of births per 1,000 by women between the age of 15-19.
3 Births attended by skilled health personnel (%) Exact match UNICEF
(2018)
Percentage of births attended by personnel trained to give the necessary supervision, care, and advice to women during pregnancy, labor, and the postpartum period; to conduct deliveries on their own; and to care for newborns.
3
Percentage of surviving infants who received 2 WHO-recommended vaccines (%)
Closely aligned
WHO and UNICEF (2018)
Estimated national routine immunisation coverage of infants, expressed as the percentage of surviving infants children under the age of 12 months who received two WHO-recommended vaccines (DTP and measles).
3 Universal Health Coverage Tracer Index (0-100)
Not in UNSTATS database
IMHE (2016)Coverage of essential health services, as defined by 9 tracer interventions and risk-standardized death rates from 32 causes amenable to personal healthcare.
Data tables
Table 10 | (continued)
46 SDG Index and Dashboards Report 2018 Global Responsibilities
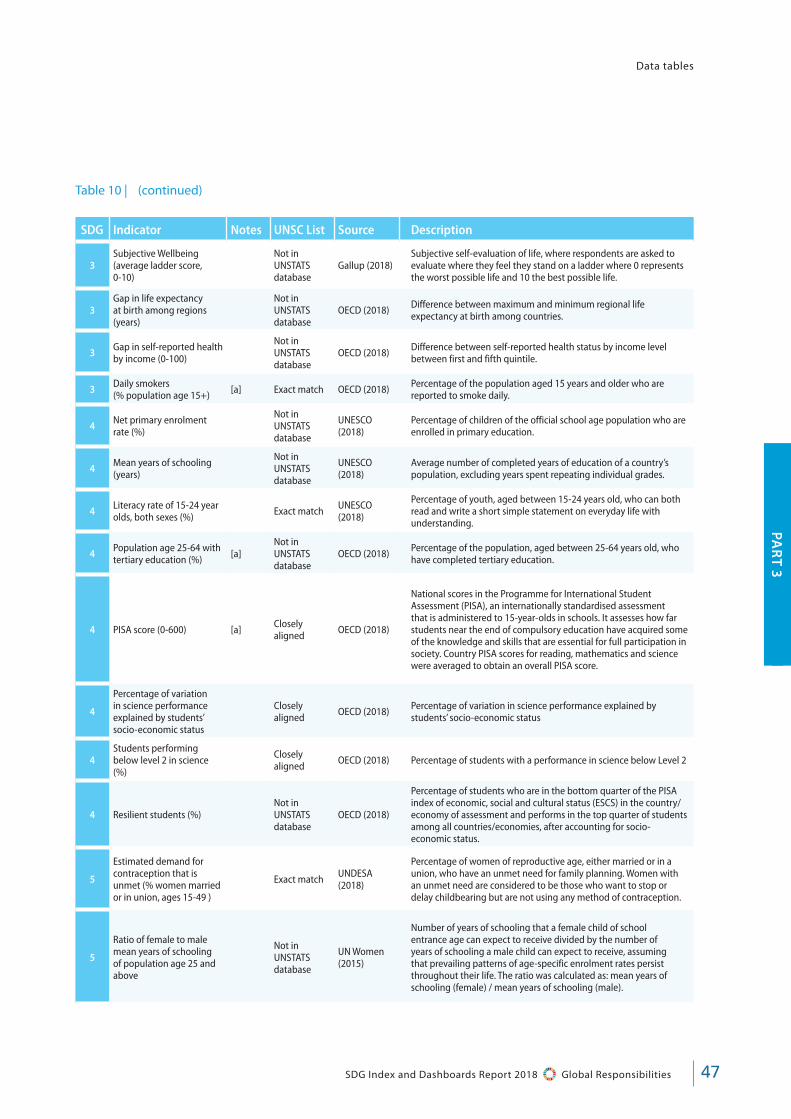
PAR
T 3
SDG Indicator Notes UNSC List Source Description
3Subjective Wellbeing (average ladder score, 0-10)
Not in UNSTATS database
Gallup (2018)Subjective self-evaluation of life, where respondents are asked to evaluate where they feel they stand on a ladder where 0 represents the worst possible life and 10 the best possible life.
3Gap in life expectancy at birth among regions (years)
Not in UNSTATS database
OECD (2018) Difference between maximum and minimum regional life expectancy at birth among countries.
3 Gap in self-reported health by income (0-100)
Not in UNSTATS database
OECD (2018) Difference between self-reported health status by income level between first and fifth quintile.
3 Daily smokers (% population age 15+) [a] Exact match OECD (2018) Percentage of the population aged 15 years and older who are
reported to smoke daily.
4 Net primary enrolment rate (%)
Not in UNSTATS database
UNESCO (2018)
Percentage of children of the official school age population who are enrolled in primary education.
4 Mean years of schooling (years)
Not in UNSTATS database
UNESCO (2018)
Average number of completed years of education of a country’s population, excluding years spent repeating individual grades.
4 Literacy rate of 15-24 year olds, both sexes (%) Exact match UNESCO
(2018)
Percentage of youth, aged between 15-24 years old, who can both read and write a short simple statement on everyday life with understanding.
4 Population age 25-64 with tertiary education (%) [a]
Not in UNSTATS database
OECD (2018) Percentage of the population, aged between 25-64 years old, who have completed tertiary education.
4 PISA score (0-600) [a] Closely aligned OECD (2018)
National scores in the Programme for International Student Assessment (PISA), an internationally standardised assessment that is administered to 15-year-olds in schools. It assesses how far students near the end of compulsory education have acquired some of the knowledge and skills that are essential for full participation in society. Country PISA scores for reading, mathematics and science were averaged to obtain an overall PISA score.
4
Percentage of variation in science performance explained by students’ socio-economic status
Closely aligned OECD (2018) Percentage of variation in science performance explained by
students’ socio-economic status
4Students performing below level 2 in science (%)
Closely aligned OECD (2018) Percentage of students with a performance in science below Level 2
4 Resilient students (%)Not in UNSTATS database
OECD (2018)
Percentage of students who are in the bottom quarter of the PISA index of economic, social and cultural status (ESCS) in the country/economy of assessment and performs in the top quarter of students among all countries/economies, after accounting for socio-economic status.
5
Estimated demand for contraception that is unmet (% women married or in union, ages 15-49 )
Exact match UNDESA (2018)
Percentage of women of reproductive age, either married or in a union, who have an unmet need for family planning. Women with an unmet need are considered to be those who want to stop or delay childbearing but are not using any method of contraception.
5
Ratio of female to male mean years of schooling of population age 25 and above
Not in UNSTATS database
UN Women (2015)
Number of years of schooling that a female child of school entrance age can expect to receive divided by the number of years of schooling a male child can expect to receive, assuming that prevailing patterns of age-specific enrolment rates persist throughout their life. The ratio was calculated as: mean years of schooling (female) / mean years of schooling (male).
Data tables
Table 10 | (continued)
47SDG Index and Dashboards Report 2018 Global Responsibilities

SDG Indicator Notes UNSC List Source Description
5Ratio of female to male labour force participation rate
Not in UNSTATS database
ILO (2018)
Proportion of the female population aged 15 years and older that is economically active, divided by the same proportion for men. The ratio was calculated as: labor force particpation rate (female) / labor force participation (male)
5 Seats held by women in national parliaments (%) Exact match IPU (2018)
Number of seats held by women in single or lower chambers of national parliaments, expressed as a percentage of all occupied seats. Seats refer to the number of parliamentary mandates, or the number of members of parliament.
5 Gender wage gap (Total, % male median wage) [a]
Not in UNSTATS database
OECD (2018)Difference between male and female median wages of full-time employees and those self-employed, divided by the male median wage.
6
For high-income & OECD countries: population using safely managed water services (%)
JMP (2018)
Percentage of the population using a safely managed drinking water service. A safely managed drinking water service is one where people use an “improved” source meeting three criteria: it is accessible on premises, water is available when needed, and the water supplied is free from contamination. Improved sources are those that have the potential to deliver safe water by nature of their design and construction.
6
For all other countries: Population using at least basic drinking water services (%)
Closely aligned JMP (2018)
Percentage of the population using at least a basic service; that is, drinking water from an improved source, provided collection time is not more than 30 minutes for a round trip, including queuing.
6
For high-income & OECD countries: population using safely managed sanitation services (%)
JMP (2018)
Percentage of the population using safely managed sanitation services. Safely managed sanitation services are “improved” sanitation facilities that are not shared with other households, and where the excreta produced should either be treated and disposed of in situ, stored temporarily and then emptied, transported and treated off-site, or transported through a sewer with wastewater and then treated off-site. Improved sanitation facilities are those designed to hygienically separate excreta from human contact.
6
For all other countries: Population using at least basic sanitation services (%)
Closely aligned JMP (2018)
Percentage of the population using an at least basic sanitation service, that is, an improved sanitation facility that is not shared with other households.
6Freshwater withdrawal as % total renewable water resources
Exact match FAO (2018)
Total renewable freshwater withdrawals, not counting evaporation losses from storage basins, divided by the total available renewable water resource. Withdrawals include both surface water withdrawal and groundwater withdrawal.
6 Imported groundwater depletion (m3/year/capita)
Not in UNSTATS database
Dalin et al. (2017)
Imports of groundwater depletion embedded in international crop trade. Estimates are based on a combination of global, crop-specific estimates of non-renewable groundwater abstraction and international food trade data. This indicator was calculated by aggregating bilateral import data into an overall country score, and expressed per capita.
7 Access to electricity (% population) Exact match SE4All (2018) Percentage of the total population who has access to electricity.
7Access to clean fuels & technology for cooking (% population)
Exact match SE4All (2018)Percentage of total population primarily using clean cooking fuels and technologies for cooking. Under WHO guidelines, kerosene is excluded from clean cooking fuels.
7CO2 emissions from fuel combustion / electricity output (MtCO2/TWh)
Not in UNSTATS database
IEA (2016)
A measure of the carbon intensity of energy production, calculated by dividing CO2 emissions from the combustion of fuel by electricity output. This indicator was calculated by dividing national data on “Total CO2 emissions from fuel combustion for electricity and heat (MtCO2)” over “Electricity output (TWh)”
Data tables
Table 10 | (continued)
48 SDG Index and Dashboards Report 2018 Global Responsibilities
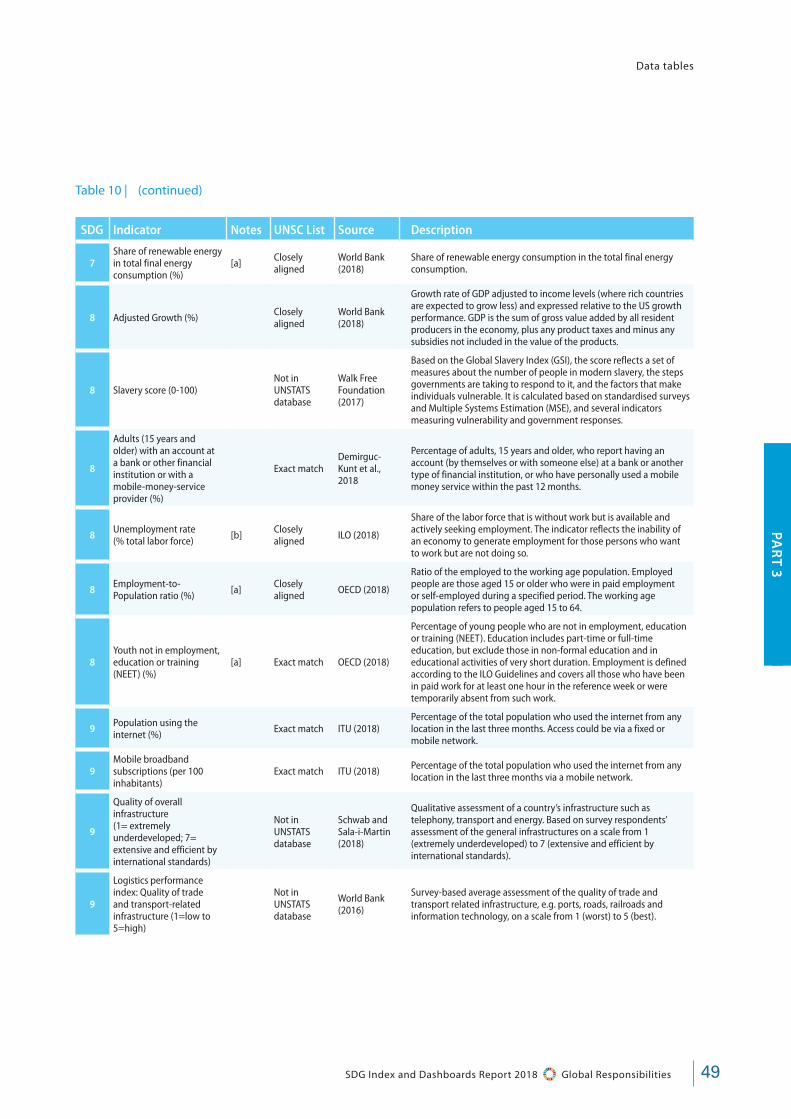
PAR
T 3
SDG Indicator Notes UNSC List Source Description
7Share of renewable energy in total final energy consumption (%)
[a] Closely aligned
World Bank (2018)
Share of renewable energy consumption in the total final energy consumption.
8 Adjusted Growth (%) Closely aligned
World Bank (2018)
Growth rate of GDP adjusted to income levels (where rich countries are expected to grow less) and expressed relative to the US growth performance. GDP is the sum of gross value added by all resident producers in the economy, plus any product taxes and minus any subsidies not included in the value of the products.
8 Slavery score (0-100)Not in UNSTATS database
Walk Free Foundation (2017)
Based on the Global Slavery Index (GSI), the score reflects a set of measures about the number of people in modern slavery, the steps governments are taking to respond to it, and the factors that make individuals vulnerable. It is calculated based on standardised surveys and Multiple Systems Estimation (MSE), and several indicators measuring vulnerability and government responses.
8
Adults (15 years and older) with an account at a bank or other financial institution or with a mobile-money-service provider (%)
Exact matchDemirguc-Kunt et al., 2018
Percentage of adults, 15 years and older, who report having an account (by themselves or with someone else) at a bank or another type of financial institution, or who have personally used a mobile money service within the past 12 months.
8 Unemployment rate (% total labor force) [b] Closely
aligned ILO (2018)
Share of the labor force that is without work but is available and actively seeking employment. The indicator reflects the inability of an economy to generate employment for those persons who want to work but are not doing so.
8 Employment-to-Population ratio (%) [a] Closely
aligned OECD (2018)
Ratio of the employed to the working age population. Employed people are those aged 15 or older who were in paid employment or self-employed during a specified period. The working age population refers to people aged 15 to 64.
8Youth not in employment, education or training (NEET) (%)
[a] Exact match OECD (2018)
Percentage of young people who are not in employment, education or training (NEET). Education includes part-time or full-time education, but exclude those in non-formal education and in educational activities of very short duration. Employment is defined according to the ILO Guidelines and covers all those who have been in paid work for at least one hour in the reference week or were temporarily absent from such work.
9 Population using the internet (%) Exact match ITU (2018)
Percentage of the total population who used the internet from any location in the last three months. Access could be via a fixed or mobile network.
9Mobile broadband subscriptions (per 100 inhabitants)
Exact match ITU (2018) Percentage of the total population who used the internet from any location in the last three months via a mobile network.
9
Quality of overall infrastructure (1= extremely underdeveloped; 7= extensive and efficient by international standards)
Not in UNSTATS database
Schwab and Sala-i-Martin (2018)
Qualitative assessment of a country’s infrastructure such as telephony, transport and energy. Based on survey respondents’ assessment of the general infrastructures on a scale from 1 (extremely underdeveloped) to 7 (extensive and efficient by international standards).
9
Logistics performance index: Quality of trade and transport-related infrastructure (1=low to 5=high)
Not in UNSTATS database
World Bank (2016)
Survey-based average assessment of the quality of trade and transport related infrastructure, e.g. ports, roads, railroads and information technology, on a scale from 1 (worst) to 5 (best).
Data tables
Table 10 | (continued)
49SDG Index and Dashboards Report 2018 Global Responsibilities
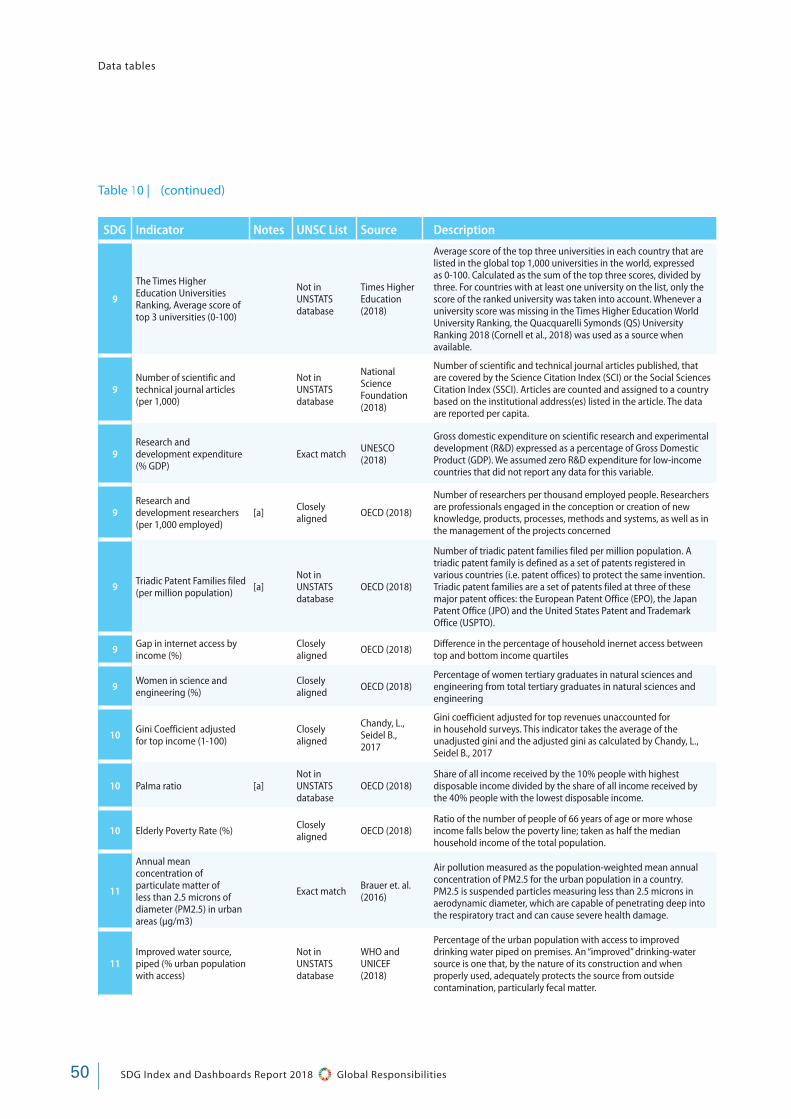
SDG Indicator Notes UNSC List Source Description
9
The Times Higher Education Universities Ranking, Average score of top 3 universities (0-100)
Not in UNSTATS database
Times Higher Education (2018)
Average score of the top three universities in each country that are listed in the global top 1,000 universities in the world, expressed as 0-100. Calculated as the sum of the top three scores, divided by three. For countries with at least one university on the list, only the score of the ranked university was taken into account. Whenever a university score was missing in the Times Higher Education World University Ranking, the Quacquarelli Symonds (QS) University Ranking 2018 (Cornell et al., 2018) was used as a source when available.
9Number of scientific and technical journal articles (per 1,000)
Not in UNSTATS database
National Science Foundation (2018)
Number of scientific and technical journal articles published, that are covered by the Science Citation Index (SCI) or the Social Sciences Citation Index (SSCI). Articles are counted and assigned to a country based on the institutional address(es) listed in the article. The data are reported per capita.
9Research and development expenditure (% GDP)
Exact match UNESCO (2018)
Gross domestic expenditure on scientific research and experimental development (R&D) expressed as a percentage of Gross Domestic Product (GDP). We assumed zero R&D expenditure for low-income countries that did not report any data for this variable.
9Research and development researchers (per 1,000 employed)
[a] Closely aligned OECD (2018)
Number of researchers per thousand employed people. Researchers are professionals engaged in the conception or creation of new knowledge, products, processes, methods and systems, as well as in the management of the projects concerned
9 Triadic Patent Families filed (per million population) [a]
Not in UNSTATS database
OECD (2018)
Number of triadic patent families filed per million population. A triadic patent family is defined as a set of patents registered in various countries (i.e. patent offices) to protect the same invention. Triadic patent families are a set of patents filed at three of these major patent offices: the European Patent Office (EPO), the Japan Patent Office (JPO) and the United States Patent and Trademark Office (USPTO).
9 Gap in internet access by income (%)
Closely aligned OECD (2018) Difference in the percentage of household inernet access between
top and bottom income quartiles
9 Women in science and engineering (%)
Closely aligned OECD (2018)
Percentage of women tertiary graduates in natural sciences and engineering from total tertiary graduates in natural sciences and engineering
10 Gini Coefficient adjusted for top income (1-100)
Closely aligned
Chandy, L., Seidel B., 2017
Gini coefficient adjusted for top revenues unaccounted for in household surveys. This indicator takes the average of the unadjusted gini and the adjusted gini as calculated by Chandy, L., Seidel B., 2017
10 Palma ratio [a]Not in UNSTATS database
OECD (2018)Share of all income received by the 10% people with highest disposable income divided by the share of all income received by the 40% people with the lowest disposable income.
10 Elderly Poverty Rate (%) Closely aligned OECD (2018)
Ratio of the number of people of 66 years of age or more whose income falls below the poverty line; taken as half the median household income of the total population.
11
Annual mean concentration of particulate matter of less than 2.5 microns of diameter (PM2.5) in urban areas (μg/m3)
Exact match Brauer et. al. (2016)
Air pollution measured as the population-weighted mean annual concentration of PM2.5 for the urban population in a country. PM2.5 is suspended particles measuring less than 2.5 microns in aerodynamic diameter, which are capable of penetrating deep into the respiratory tract and can cause severe health damage.
11Improved water source, piped (% urban population with access)
Not in UNSTATS database
WHO and UNICEF (2018)
Percentage of the urban population with access to improved drinking water piped on premises. An “improved” drinking-water source is one that, by the nature of its construction and when properly used, adequately protects the source from outside contamination, particularly fecal matter.
Data tables
Table 10 | (continued)
50 SDG Index and Dashboards Report 2018 Global Responsibilities

PAR
T 3
SDG Indicator Notes UNSC List Source Description
11 Satisfaction with public transport (%) Exact match Gallup (2018)
Percentage of the surveyed population that responded “Yes” to the question “In the city or area where you live, are you satisfied or dissatisfied with the public transportation systems?”
11 Rent overburden rate (%) Exact match OECD (2018)Percentage of the population living in households where the total housing costs (‘net’ of housing allowances) represent more than 40 % of disposable income (‘net’ of housing allowances).
12 Municipal Solid Waste (kg/year/capita) [b] Closely
alignedWorld Bank (2012)
Annual amount of waste collected by or on behalf of municipal authorities and disposed of through the waste management system, expressed in kilogram per capita. Waste from agriculture and from industries are not included.
12 E-waste generated (kg/capita)
Not in UNSTATS database
UNU-IAS (2015)
Waste from electrical and electronic equipment that is generated, expressed in kilos per capita. Estimated based on figures for domestic production, imports and exports of electronic products, as well as product lifespan data.
12Percentage of anthropogenic wastewater that receives treatment (%)
Closely aligned EPI (2018)
Percentage of collected, generated, or produced wastewater that is treated, normalized by the population connected to centralized wastewater treatment facilities. Scores were calculated by multiplying the wastewater treatment summary values, based on decadal averages, with the sewerage connection values to arrive at an overall total percentage of wastewater treated.
12 Production-based SO2 emissions (kg/capita)
Not in UNSTATS database
Zhang et. al. (2017)
SO2 emissions associated with the production of goods and services, which are then either exported or consumed domestically. The health impacts of outdoor air pollution are felt locally as well as in neighbouring regions, due to transboundary atmospheric transport of the pollutants.
12 Net imported SO2 emissions (kg/capita)
Not in UNSTATS database
Zhang et. al. (2017)
Net imports of SO2 emissions associated with the trade in goods and services. These have severe health impacts and are a significant cause of premature mortality worldwide. Trade in goods mean that health impacts of air pollution occur far away from the point of consumption.
12 Nitrogen production footprint (kg/capita)
Not in UNSTATS database
Oita et al. (2016)
Reactive nitrogen emitted during the production of commodities, which are then either exported or consumed domestically. Reactive nitrogen corresponds to emissions of ammonia, nitrogen oxides and nitrous oxide to the atmosphere, and of reactive nitrogen potentially exportable to water bodies, all of which can be harmful to human health and the environment.
12Net imported emissions of reactive nitrogen (kg/capita)
Not in UNSTATS database
Oita et al. (2016)
Net imports of reactive nitrogen emitted during the production of commodities. Reactive nitrogen corresponds here to emissions of ammonia, nitrogen oxides and nitrous oxide to the atmosphere, and of reactive nitrogen potentially exportable to water bodies, all of which can be harmful to human health and the environment.
12
Non-Recycled Municipal Solid Waste (MSW in kg/person/year times recycling rate)
[a] Closely aligned
World Bank (2012); OECD (2018)
Annual amounts of municipal solid waste (MSW), including household waste, that is not recycled, expressed in kilogram per capita. This indicator is calculated by multiplying “Municipal Solid Waste (kg/year/capita)” by one minus the recycling rate.
13Energy-related CO2 emissions per capita (tCO2/capita)
Not in UNSTATS database
Oak Ridge National Laboratory (2018)
Emissions of carbon dioxide per capita that arise from the consumption of energy. This includes emissions due to the consumption of petroleum, natural gas, coal, and also from natural gas flaring.
13Imported CO2 emissions, technology-adjusted (tCO2/capita)
Not in UNSTATS database
Kander et al. (2015)
Imports of CO2 emissions embodied in goods, measured as technology-adjusted, consumption-based (TCBA) emissions minus production-based emissions. Technology-adjusted emissions data reflects the carbon efficiency of exporting sectors. If a country uses relatively CO2-intensive technologies in its export sector then it will have a higher TCBA than suggested by a simple carbon footprint.
Data tables
Table 10 | (continued)
51SDG Index and Dashboards Report 2018 Global Responsibilities
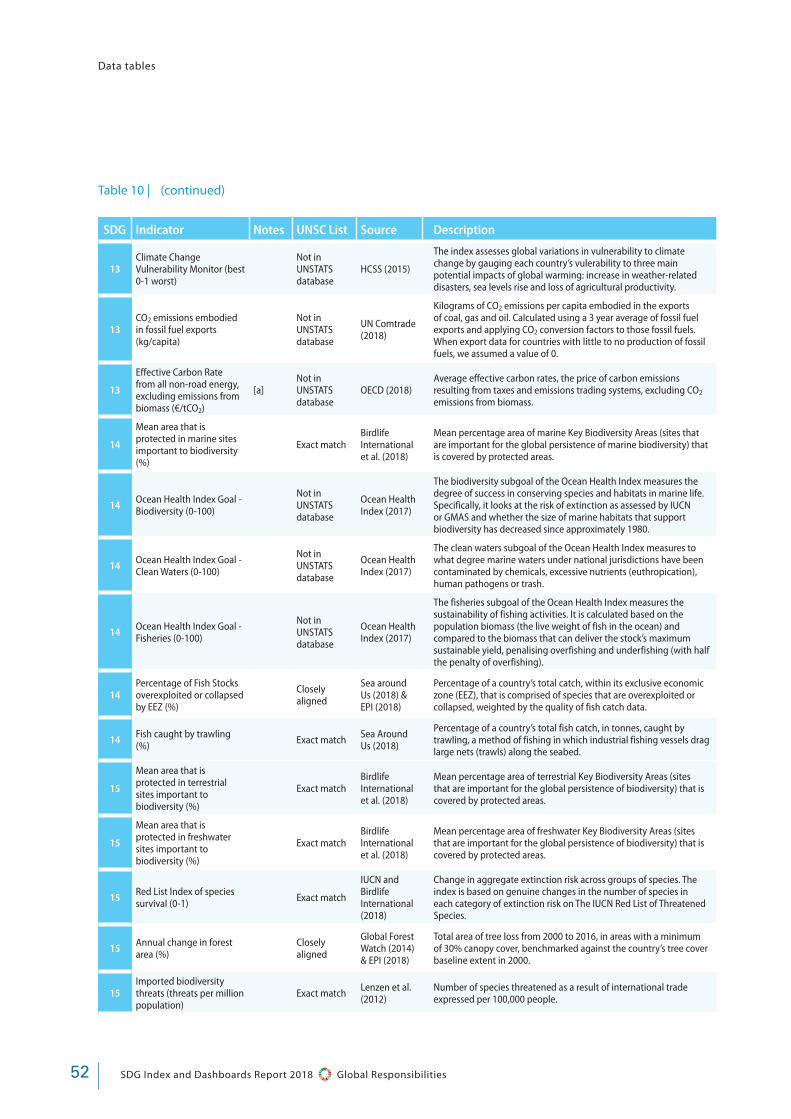
SDG Indicator Notes UNSC List Source Description
13Climate Change Vulnerability Monitor (best 0-1 worst)
Not in UNSTATS database
HCSS (2015)
The index assesses global variations in vulnerability to climate change by gauging each country’s vulerability to three main potential impacts of global warming: increase in weather-related disasters, sea levels rise and loss of agricultural productivity.
13CO2 emissions embodied in fossil fuel exports (kg/capita)
Not in UNSTATS database
UN Comtrade (2018)
Kilograms of CO2 emissions per capita embodied in the exports of coal, gas and oil. Calculated using a 3 year average of fossil fuel exports and applying CO2 conversion factors to those fossil fuels. When export data for countries with little to no production of fossil fuels, we assumed a value of 0.
13
Effective Carbon Rate from all non-road energy, excluding emissions from biomass (€/tCO2)
[a]Not in UNSTATS database
OECD (2018)Average effective carbon rates, the price of carbon emissions resulting from taxes and emissions trading systems, excluding CO2 emissions from biomass.
14
Mean area that is protected in marine sites important to biodiversity (%)
Exact matchBirdlife International et al. (2018)
Mean percentage area of marine Key Biodiversity Areas (sites that are important for the global persistence of marine biodiversity) that is covered by protected areas.
14 Ocean Health Index Goal - Biodiversity (0-100)
Not in UNSTATS database
Ocean Health Index (2017)
The biodiversity subgoal of the Ocean Health Index measures the degree of success in conserving species and habitats in marine life. Specifically, it looks at the risk of extinction as assessed by IUCN or GMAS and whether the size of marine habitats that support biodiversity has decreased since approximately 1980.
14 Ocean Health Index Goal - Clean Waters (0-100)
Not in UNSTATS database
Ocean Health Index (2017)
The clean waters subgoal of the Ocean Health Index measures to what degree marine waters under national jurisdictions have been contaminated by chemicals, excessive nutrients (euthropication), human pathogens or trash.
14 Ocean Health Index Goal - Fisheries (0-100)
Not in UNSTATS database
Ocean Health Index (2017)
The fisheries subgoal of the Ocean Health Index measures the sustainability of fishing activities. It is calculated based on the population biomass (the live weight of fish in the ocean) and compared to the biomass that can deliver the stock’s maximum sustainable yield, penalising overfishing and underfishing (with half the penalty of overfishing).
14Percentage of Fish Stocks overexploited or collapsed by EEZ (%)
Closely aligned
Sea around Us (2018) & EPI (2018)
Percentage of a country’s total catch, within its exclusive economic zone (EEZ), that is comprised of species that are overexploited or collapsed, weighted by the quality of fish catch data.
14 Fish caught by trawling (%) Exact match Sea Around
Us (2018)
Percentage of a country’s total fish catch, in tonnes, caught by trawling, a method of fishing in which industrial fishing vessels drag large nets (trawls) along the seabed.
15
Mean area that is protected in terrestrial sites important to biodiversity (%)
Exact matchBirdlife International et al. (2018)
Mean percentage area of terrestrial Key Biodiversity Areas (sites that are important for the global persistence of biodiversity) that is covered by protected areas.
15
Mean area that is protected in freshwater sites important to biodiversity (%)
Exact matchBirdlife International et al. (2018)
Mean percentage area of freshwater Key Biodiversity Areas (sites that are important for the global persistence of biodiversity) that is covered by protected areas.
15 Red List Index of species survival (0-1) Exact match
IUCN and Birdlife International (2018)
Change in aggregate extinction risk across groups of species. The index is based on genuine changes in the number of species in each category of extinction risk on The IUCN Red List of Threatened Species.
15 Annual change in forest area (%)
Closely aligned
Global Forest Watch (2014) & EPI (2018)
Total area of tree loss from 2000 to 2016, in areas with a minimum of 30% canopy cover, benchmarked against the country’s tree cover baseline extent in 2000.
15Imported biodiversity threats (threats per million population)
Exact match Lenzen et al. (2012)
Number of species threatened as a result of international trade expressed per 100,000 people.
Data tables
Table 10 | (continued)
52 SDG Index and Dashboards Report 2018 Global Responsibilities
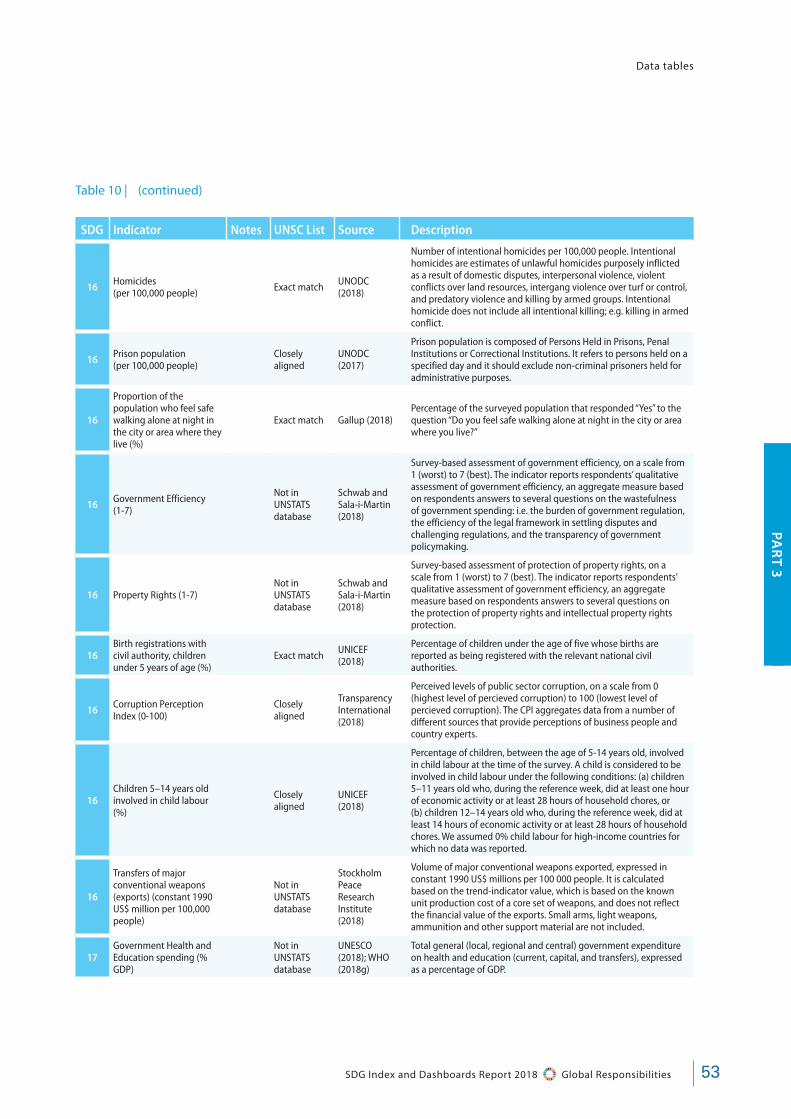
PAR
T 3
SDG Indicator Notes UNSC List Source Description
16 Homicides (per 100,000 people) Exact match UNODC
(2018)
Number of intentional homicides per 100,000 people. Intentional homicides are estimates of unlawful homicides purposely inflicted as a result of domestic disputes, interpersonal violence, violent conflicts over land resources, intergang violence over turf or control, and predatory violence and killing by armed groups. Intentional homicide does not include all intentional killing; e.g. killing in armed conflict.
16 Prison population (per 100,000 people)
Closely aligned
UNODC (2017)
Prison population is composed of Persons Held in Prisons, Penal Institutions or Correctional Institutions. It refers to persons held on a specified day and it should exclude non-criminal prisoners held for administrative purposes.
16
Proportion of the population who feel safe walking alone at night in the city or area where they live (%)
Exact match Gallup (2018)Percentage of the surveyed population that responded “Yes” to the question “Do you feel safe walking alone at night in the city or area where you live?”
16 Government Efficiency (1-7)
Not in UNSTATS database
Schwab and Sala-i-Martin (2018)
Survey-based assessment of government efficiency, on a scale from 1 (worst) to 7 (best). The indicator reports respondents’ qualitative assessment of government efficiency, an aggregate measure based on respondents answers to several questions on the wastefulness of government spending: i.e. the burden of government regulation, the efficiency of the legal framework in settling disputes and challenging regulations, and the transparency of government policymaking.
16 Property Rights (1-7)Not in UNSTATS database
Schwab and Sala-i-Martin (2018)
Survey-based assessment of protection of property rights, on a scale from 1 (worst) to 7 (best). The indicator reports respondents’ qualitative assessment of government efficiency, an aggregate measure based on respondents answers to several questions on the protection of property rights and intellectual property rights protection.
16Birth registrations with civil authority, children under 5 years of age (%)
Exact match UNICEF (2018)
Percentage of children under the age of five whose births are reported as being registered with the relevant national civil authorities.
16 Corruption Perception Index (0-100)
Closely aligned
Transparency International (2018)
Perceived levels of public sector corruption, on a scale from 0 (highest level of percieved corruption) to 100 (lowest level of percieved corruption). The CPI aggregates data from a number of different sources that provide perceptions of business people and country experts.
16Children 5–14 years old involved in child labour (%)
Closely aligned
UNICEF (2018)
Percentage of children, between the age of 5-14 years old, involved in child labour at the time of the survey. A child is considered to be involved in child labour under the following conditions: (a) children 5–11 years old who, during the reference week, did at least one hour of economic activity or at least 28 hours of household chores, or (b) children 12–14 years old who, during the reference week, did at least 14 hours of economic activity or at least 28 hours of household chores. We assumed 0% child labour for high-income countries for which no data was reported.
16
Transfers of major conventional weapons (exports) (constant 1990 US$ million per 100,000 people)
Not in UNSTATS database
Stockholm Peace Research Institute (2018)
Volume of major conventional weapons exported, expressed in constant 1990 US$ millions per 100 000 people. It is calculated based on the trend-indicator value, which is based on the known unit production cost of a core set of weapons, and does not reflect the financial value of the exports. Small arms, light weapons, ammunition and other support material are not included.
17Government Health and Education spending (% GDP)
Not in UNSTATS database
UNESCO (2018); WHO (2018g)
Total general (local, regional and central) government expenditure on health and education (current, capital, and transfers), expressed as a percentage of GDP.
Data tables
Table 10 | (continued)
53SDG Index and Dashboards Report 2018 Global Responsibilities

SDG Indicator Notes UNSC List Source Description
17
For high-income and all OECD DAC countries: International concessional public finance, including official development assistance (% GNI)
Exact match OECD (2018)
Amount of official development assistance (ODA) as a share of the provider country’s gross national income (GNI), in US$ constant prices. It includes grants, “soft” loans (where the grant element is at least 25% of the total) and the provision of technical assistance, and excludes grants and loans for military purposes.
17 For all other countries: Tax revenue (% GDP) Exact match World Bank
(2018)
Percentage share of tax revenues in a country’s gross domestic product (GDP). Tax revenues are seen as compulsory transfers to the central government for public purposes, excluding certain transfers such as fines, penalties and most social security contributions. Refunds and corrections of erroneously collected tax revenue are treated as negative revenue.
17 Tax Haven Score (best 0-5 worst)
Not in UNSTATS database
Oxfam (2016)
Ranking of countries’ contribution to global corporate tax avoidance and evasion, on a scale from 0 (best) to 5 (worst). Calculated by first identifying a set of tax havens from various credible bodies, and then assessing three key elements for corporate tax dodging; corporate tax rates, the tax incentives offered, and lack of cooperation with international efforts against tax avoidance. The scale and global significance of the tax avoidance structures were taken into account.
17 Financial Secrecy Score (best 0-100 worst) [a]
Not in UNSTATS database
Tax Justice Network (2018)
The Index measures the contribution of each jurisdiction to financial secrecy, on a scale from 0 (best) to 100 (worst). It is calculated using qualitative data to prepare a secrecy score for each jurisdiction and quantitative data to create a global scale weighting for each jurisdiction according to its share of offshore financial services activity in the global total.
Source: Authors’ analysis
Data tables
Table 10 | (continued)
54 SDG Index and Dashboards Report 2018 Global Responsibilities
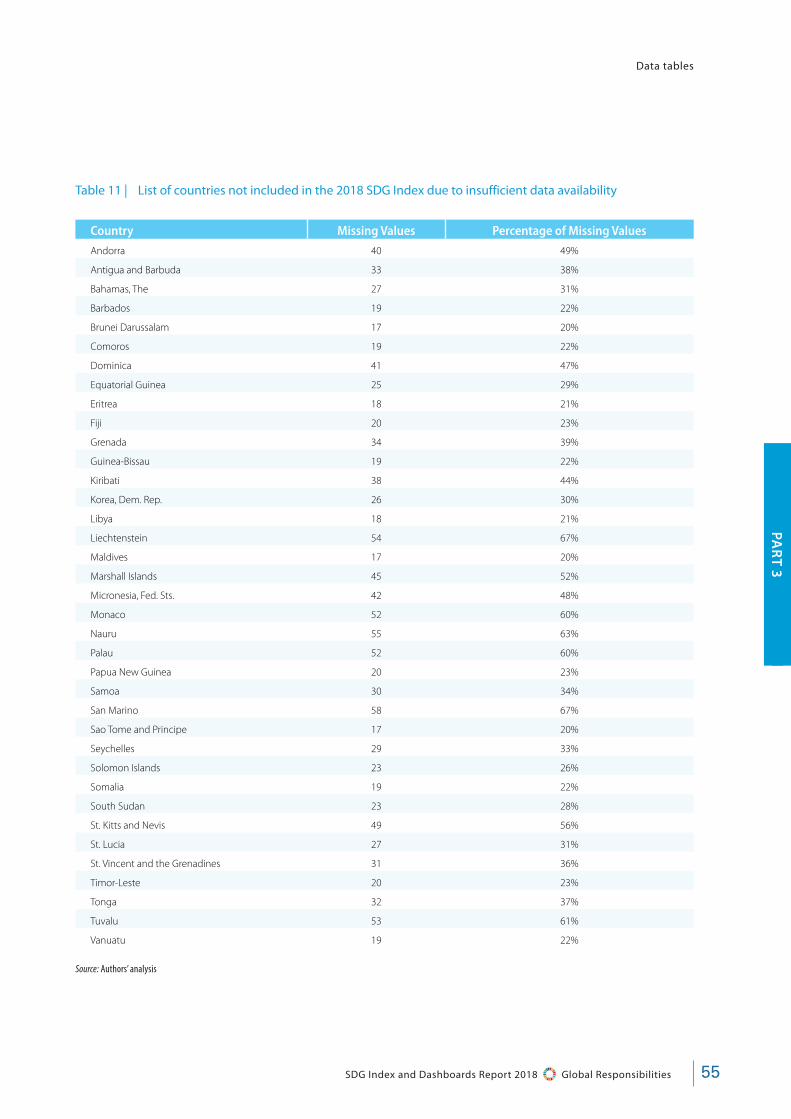
PAR
T 3
Data tables
Table 11 | List of countries not included in the 2018 SDG Index due to insufficient data availability
Country Missing Values Percentage of Missing Values
Andorra 40 49%
Antigua and Barbuda 33 38%
Bahamas, The 27 31%
Barbados 19 22%
Brunei Darussalam 17 20%
Comoros 19 22%
Dominica 41 47%
Equatorial Guinea 25 29%
Eritrea 18 21%
Fiji 20 23%
Grenada 34 39%
Guinea-Bissau 19 22%
Kiribati 38 44%
Korea, Dem. Rep. 26 30%
Libya 18 21%
Liechtenstein 54 67%
Maldives 17 20%
Marshall Islands 45 52%
Micronesia, Fed. Sts. 42 48%
Monaco 52 60%
Nauru 55 63%
Palau 52 60%
Papua New Guinea 20 23%
Samoa 30 34%
San Marino 58 67%
Sao Tome and Principe 17 20%
Seychelles 29 33%
Solomon Islands 23 26%
Somalia 19 22%
South Sudan 23 28%
St. Kitts and Nevis 49 56%
St. Lucia 27 31%
St. Vincent and the Grenadines 31 36%
Timor-Leste 20 23%
Tonga 32 37%
Tuvalu 53 61%
Vanuatu 19 22%
Source: Authors’ analysis
55SDG Index and Dashboards Report 2018 Global Responsibilities

Table 12 | Summary statistics for indicators included in the SDG Index and DashboardsNumber of observations (N), statistical mean (Mean), standard deviation (SD), the minimum (Min) and maximum (Max) values across all countries with data availability.
SDG Label Obs Mean Std.Dev. Min Max
1 Poverty headcount ratio at $1.90/day (% population) 181 13.0 20.0 0.0 86.0
1 Projected poverty headcount ratio at $1.90/day in 2030 (% population) 181 8.8 16.6 0.0 95.5
1 Poverty rate after taxes and transfers, Poverty line 50% (% population) 35 11.5 3.7 5.5 17.7
2 Prevalence of undernourishment (% population) 177 10.8 11.4 1.2 58.6
2 Prevalence of stunting (low height-for-age) in children under 5 years of age (%) 182 18.1 14.7 1.3 59.3
2 Prevalence of wasting in children under 5 years of age (%) 181 4.9 4.8 0.0 22.7
2 Prevalence of obesity, BMI ≥ 30 (% adult population) 187 19.5 10.8 2.1 61.0
2 Cereal yield (t/ha) 174 3.5 3.0 0.2 24.7
2 Sustainable Nitrogen Management Index 136 0.8 0.2 0.3 1.3
3 Maternal mortality rate (per 100,000 live births) 181 170.2 233.2 3.0 1360.0
3 Neonatal mortality rate (per 1,000 live births) 192 13.3 10.9 0.6 45.6
3 Mortality rate, under-5 (per 1,000 live births) 192 30.4 30.3 2.1 132.5
3 Incidence of tuberculosis (per 100,000 population) 192 114.8 149.0 0.0 781.0
3 HIV prevalence (per 1,000) 186 0.5 1.1 0.0 8.0
3Age-standardised death rate due to cardiovascular disease, cancer, diabetes, and chronic respiratory disease in populations age 30–70 years (per 100,000 population)
183 19.2 5.8 8.3 36.1
3 Age-standardised death rate attributable to household air pollution and ambient air pollution (per 100,000 population) 184 84.2 66.8 0.2 261.8
3 Traffic deaths rate (per 100,000 population) 183 17.0 9.3 2.0 45.4
3 Healthy Life Expectancy at birth (years) 183 71.3 8.0 50.1 83.7
3 Adolescent fertility rate (births per 1,000 women ages 15-19) 183 48.0 40.5 0.3 194.0
3 Births attended by skilled health personnel (%) 180 85.0 21.2 9.4 100.0
3 Percentage of surviving infants who received 2 WHO-recommended vaccines (%) 192 85.7 15.6 19.0 99.0
3 Universal Health Coverage Tracer Index (0-100) 186 60.2 13.5 27.2 86.2
Data tables
56 SDG Index and Dashboards Report 2018 Global Responsibilities

PAR
T 3
SDG Label Obs Mean Std.Dev. Min Max
3 Subjective Wellbeing (average ladder score, 0-10) 158 5.4 1.2 2.7 7.8
3 Gap in life expectancy at birth among regions (years) 33 3.2 2.0 0.3 11.0
3 Gap in self-reported health by income (0-100) 33 19.1 8.2 3.7 41.1
3 Daily smokers (% population age 15+) 35 18.8 5.2 7.6 29.8
4 Net primary enrolment rate (%) 172 89.0 12.0 32.1 100.0
4 Mean years of schooling (years) 186 8.3 3.1 1.4 13.4
4 Literacy rate of 15-24 year olds, both sexes (%) 141 87.8 17.6 23.5 100.0
4 Population age 25-64 with tertiary education (%) 35 35.5 10.1 16.8 56.3
4 PISA score (0-600) 35 492.0 26.1 415.7 528.7
4 Percentage of variation in science performance explained by students' socio-economic status 35 12.9 4.0 4.9 21.4
4 Students performing below level 2 in science (%) 35 21.2 8.8 8.8 47.8
4 Resilient students (%) 35 29.2 9.2 12.8 48.8
5 Estimated demand for contraception that is unmet (% women married or in union, ages 15-49 ) 177 26.0 18.3 4.3 82.4
5 Ratio of female to male mean years of schooling of population age 25 and above 168 87.8 18.7 27.6 132.1
5 Ratio of female to male labour force participation rate 178 71.5 19.7 8.6 110.6
5 Seats held by women in national parliaments (%) 193 21.3 11.8 0.0 61.3
5 Gender wage gap (Total, % male median wage) 35 14.1 7.3 3.4 36.7
6 For high-income & OECD countries : population using safely managed water services (%) 42 96.1 4.9 81.5 100.0
6 For all other countries : Population using at least basic drinking water services (%) 93 76.8 19.4 19.3 99.9
6 For high-income & OECD countries : population using safely managed sanitation services (%) 47 86.1 12.1 60.1 100.0
6 For all other countries : Population using at least basic sanitation services (%) 107 57.9 28.9 7.1 100.0
6 Freshwater withdrawal as % total renewable water resources 180 65.4 287.3 0.0 2603.5
6 Imported groundwater depletion (m3/year/capita) 170 10.4 18.3 0.1 148.2
Table 12 | (continued)
Data tables
57SDG Index and Dashboards Report 2018 Global Responsibilities

SDG Label Obs Mean Std.Dev. Min Max
7 Access to electricity (% population) 193 80.3 29.8 4.5 100.0
7 Access to clean fuels & technology for cooking (% population) 189 64.2 38.6 2.0 100.0
7 CO2 emissions from fuel combustion / electricity output (MtCO2/TWh) 137 1.7 2.6 0.1 23.7
7 Share of renewable energy in total final energy consumption (%) 35 21.3 16.6 2.7 77.0
8 Adjusted Growth (%) 179 -2.2 2.8 -14.8 7.9
8 Slavery score (0-100) 164 65.0 28.3 0.0 100.0
8 Adults (15 years and older) with an account at a bank or other financial institution or with a mobile-money-service provider (%) 154 58.8 27.4 6.4 99.9
8 Unemployment rate (% total labor force) 143 7.9 6.1 0.2 27.7
8 Employment-to-Population ratio (%) 35 69.4 7.2 51.6 86.1
8 Youth not in employment, education or training (NEET) (%) 34 14.0 5.3 5.3 28.2
9 Population using the internet (%) 190 49.4 28.4 0.0 98.2
9 Mobile broadband subscriptions (per 100 inhabitants) 193 53.7 39.7 0.0 254.4
9 Quality of overall infrastructure (1= extremely underdeveloped; 7= extensive and efficient by international standards) 149 4.0 1.1 1.5 6.6
9 Logistics performance index: Quality of trade and transport-related infrastructure (1=low to 5=high) 156 2.7 0.7 1.2 4.4
9 The Times Higher Education Universities Ranking, Average score of top 3 universities (0-100) 193 15.8 22.7 0.0 92.8
9 Number of scientific and technical journal articles (per 1,000 population) 193 0.4 0.6 0.0 2.5
9 Research and development expenditure (% GDP) 148 0.7 0.9 0.0 4.3
9 Research and development researchers (per 1,000 employed) 35 8.7 3.8 0.8 17.4
9 Triadic Patent Families filed (per million population) 35 30.6 35.0 0.1 142.4
9 Gap in internet access by income (%) 29 38.4 18.0 6.0 63.6
9 Women in science and engineering (%) 30 28.0 5.4 16.2 41.0
10 Gini Coefficient adjusted for top income (1-100) 134 42.6 9.0 26.7 67.1
10 Palma ratio 35 1.2 0.4 0.8 2.5
10 Elderly Poverty Rate (%) 35 13.0 9.8 3.1 45.7
11 Annual mean concentration of particulate matter of less than 2.5 microns of diameter (PM2.5) in urban areas (μg/m3) 186 28.7 19.9 3.4 107.3
Table 12 | (continued)
Data tables
58 SDG Index and Dashboards Report 2018 Global Responsibilities

PAR
T 3
SDG Label Obs Mean Std.Dev. Min Max
11 Improved water source, piped (% urban population with access) 172 82.7 21.4 7.4 100.0
11 Satisfaction with public transport (%) 158 57.4 14.6 8.0 85.0
11 Rent overburden rate (%) 32 11.3 5.3 3.5 25.6
12 Municipal Solid Waste (kg/year/capita) 124 1.3 1.2 0.1 5.7
12 E-waste generated (kg/capita) 181 7.5 7.1 0.2 28.3
12 Percentage of anthropogenic wastewater that receives treatment (%) 167 26.1 33.5 0.0 100.0
12 Production-based SO2 emissions (kg/capita) 159 13.5 23.5 0.4 176.3
12 Net imported SO2 emissions (kg/capita) 187 1.6 12.0 -52.0 60.9
12 Nitrogen production footprint (kg/capita) 146 28.0 21.2 1.0 139.8
12 Net imported emissions of reactive nitrogen (kg/capita) 128 6.9 217.2 -1223.5 965.4
12 Non-Recycled Municipal Solid Waste (MSW in kg/person/year times recycling rate) 33 1.4 0.4 0.5 2.4
13 Energy-related CO2 emissions per capita (tCO2/capita) 191 4.5 6.1 0.0 45.4
13 Imported CO2 emissions, technology-adjusted (tCO2/capita) 175 0.3 4.4 -19.5 48.5
13 Climate Change Vulnerability Monitor (best 0-1 worst) 158 0.1 0.1 0.0 0.4
13 CO2 emissions embodied in fossil fuel exports (kg/capita) 168 4095.3 15973.0 0.0 150584.3
13 Effective Carbon Rate from all non-road energy, excluding emissions from biomass (€/tCO2) 34 18.4 16.5 -0.1 67.0
14 Mean area that is protected in marine sites important to biodiversity (%) 134 43.0 31.4 0.0 100.0
14 Ocean Health Index Goal - Biodiversity (0-100) 148 88.6 5.9 68.0 98.1
14 Ocean Health Index Goal - Clean Waters (0-100) 148 57.3 13.7 24.5 94.3
14 Ocean Health Index Goal - Fisheries (0-100) 148 47.0 18.0 14.3 97.9
14 Percentage of Fish Stocks overexploited or collapsed by EEZ (%) 116 31.5 22.7 0.1 100.0
14 Fish caught by trawling (%) 119 32.5 27.5 0.0 97.4
15 Mean area that is protected in terrestrial sites important to biodiversity (%) 188 43.9 26.5 0.0 100.0
15 Mean area that is protected in freshwater sites important to biodiversity (%) 136 48.9 30.1 0.0 100.0
15 Red List Index of species survival (0-1) 193 0.9 0.1 0.4 1.0
Table 12 | (continued)
Data tables
59SDG Index and Dashboards Report 2018 Global Responsibilities
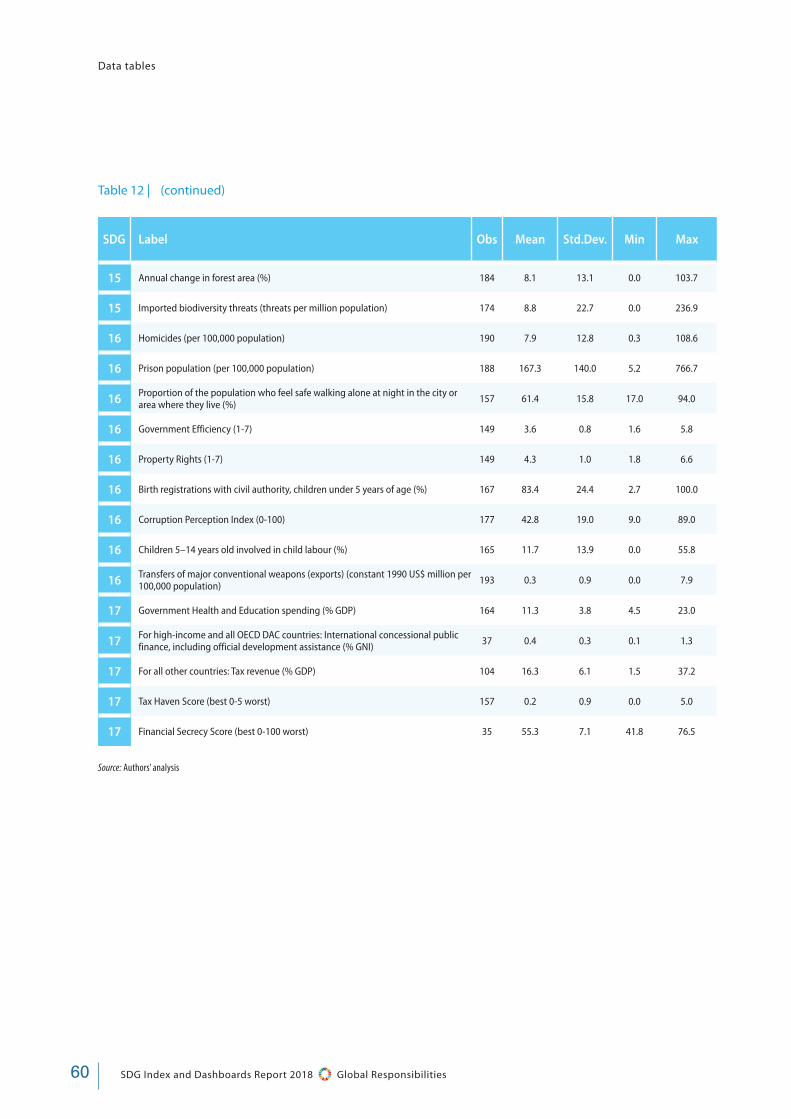
SDG Label Obs Mean Std.Dev. Min Max
15 Annual change in forest area (%) 184 8.1 13.1 0.0 103.7
15 Imported biodiversity threats (threats per million population) 174 8.8 22.7 0.0 236.9
16 Homicides (per 100,000 population) 190 7.9 12.8 0.3 108.6
16 Prison population (per 100,000 population) 188 167.3 140.0 5.2 766.7
16 Proportion of the population who feel safe walking alone at night in the city or area where they live (%) 157 61.4 15.8 17.0 94.0
16 Government Efficiency (1-7) 149 3.6 0.8 1.6 5.8
16 Property Rights (1-7) 149 4.3 1.0 1.8 6.6
16 Birth registrations with civil authority, children under 5 years of age (%) 167 83.4 24.4 2.7 100.0
16 Corruption Perception Index (0-100) 177 42.8 19.0 9.0 89.0
16 Children 5–14 years old involved in child labour (%) 165 11.7 13.9 0.0 55.8
16 Transfers of major conventional weapons (exports) (constant 1990 US$ million per 100,000 population) 193 0.3 0.9 0.0 7.9
17 Government Health and Education spending (% GDP) 164 11.3 3.8 4.5 23.0
17 For high-income and all OECD DAC countries: International concessional public finance, including official development assistance (% GNI) 37 0.4 0.3 0.1 1.3
17 For all other countries: Tax revenue (% GDP) 104 16.3 6.1 1.5 37.2
17 Tax Haven Score (best 0-5 worst) 157 0.2 0.9 0.0 5.0
17 Financial Secrecy Score (best 0-100 worst) 35 55.3 7.1 41.8 76.5
Source: Authors’ analysis
Data tables
Table 12 | (continued)
60 SDG Index and Dashboards Report 2018 Global Responsibilities
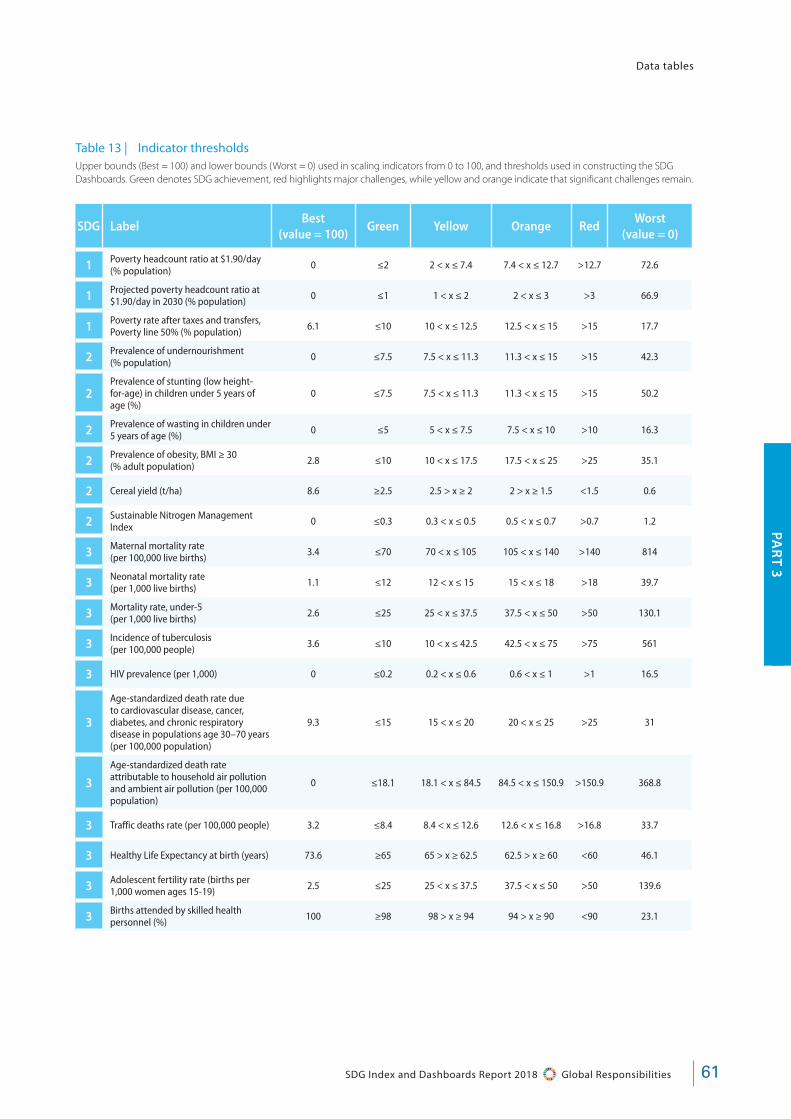
PAR
T 3
Table 13 | Indicator thresholdsUpper bounds (Best = 100) and lower bounds (Worst = 0) used in scaling indicators from 0 to 100, and thresholds used in constructing the SDG Dashboards. Green denotes SDG achievement, red highlights major challenges, while yellow and orange indicate that significant challenges remain.
SDG LabelBest
(value = 100)Green Yellow Orange Red
Worst (value = 0)
1 Poverty headcount ratio at $1.90/day (% population) 0 ≤2 2 < x ≤ 7.4 7.4 < x ≤ 12.7 >12.7 72.6
1 Projected poverty headcount ratio at $1.90/day in 2030 (% population) 0 ≤1 1 < x ≤ 2 2 < x ≤ 3 >3 66.9
1 Poverty rate after taxes and transfers, Poverty line 50% (% population) 6.1 ≤10 10 < x ≤ 12.5 12.5 < x ≤ 15 >15 17.7
2 Prevalence of undernourishment (% population) 0 ≤7.5 7.5 < x ≤ 11.3 11.3 < x ≤ 15 >15 42.3
2Prevalence of stunting (low height-for-age) in children under 5 years of age (%)
0 ≤7.5 7.5 < x ≤ 11.3 11.3 < x ≤ 15 >15 50.2
2 Prevalence of wasting in children under 5 years of age (%) 0 ≤5 5 < x ≤ 7.5 7.5 < x ≤ 10 >10 16.3
2 Prevalence of obesity, BMI ≥ 30 (% adult population) 2.8 ≤10 10 < x ≤ 17.5 17.5 < x ≤ 25 >25 35.1
2 Cereal yield (t/ha) 8.6 ≥2.5 2.5 > x ≥ 2 2 > x ≥ 1.5 <1.5 0.6
2 Sustainable Nitrogen Management Index 0 ≤0.3 0.3 < x ≤ 0.5 0.5 < x ≤ 0.7 >0.7 1.2
3 Maternal mortality rate (per 100,000 live births) 3.4 ≤70 70 < x ≤ 105 105 < x ≤ 140 >140 814
3 Neonatal mortality rate (per 1,000 live births) 1.1 ≤12 12 < x ≤ 15 15 < x ≤ 18 >18 39.7
3 Mortality rate, under-5 (per 1,000 live births) 2.6 ≤25 25 < x ≤ 37.5 37.5 < x ≤ 50 >50 130.1
3 Incidence of tuberculosis (per 100,000 people) 3.6 ≤10 10 < x ≤ 42.5 42.5 < x ≤ 75 >75 561
3 HIV prevalence (per 1,000) 0 ≤0.2 0.2 < x ≤ 0.6 0.6 < x ≤ 1 >1 16.5
3
Age-standardized death rate due to cardiovascular disease, cancer, diabetes, and chronic respiratory disease in populations age 30–70 years (per 100,000 population)
9.3 ≤15 15 < x ≤ 20 20 < x ≤ 25 >25 31
3
Age-standardized death rate attributable to household air pollution and ambient air pollution (per 100,000 population)
0 ≤18.1 18.1 < x ≤ 84.5 84.5 < x ≤ 150.9 >150.9 368.8
3 Traffic deaths rate (per 100,000 people) 3.2 ≤8.4 8.4 < x ≤ 12.6 12.6 < x ≤ 16.8 >16.8 33.7
3 Healthy Life Expectancy at birth (years) 73.6 ≥65 65 > x ≥ 62.5 62.5 > x ≥ 60 <60 46.1
3 Adolescent fertility rate (births per 1,000 women ages 15-19) 2.5 ≤25 25 < x ≤ 37.5 37.5 < x ≤ 50 >50 139.6
3 Births attended by skilled health personnel (%) 100 ≥98 98 > x ≥ 94 94 > x ≥ 90 <90 23.1
Data tables
61SDG Index and Dashboards Report 2018 Global Responsibilities

SDG LabelBest
(value = 100)Green Yellow Orange Red
Worst (value = 0)
3Percentage of surviving infants who received 2 WHO-recommended vaccines (%)
100 ≥90 90 > x ≥ 85 85 > x ≥ 80 <80 41
3 Universal Health Coverage Tracer Index (0-100) 100 ≥80 80 > x ≥ 70 70 > x ≥ 60 <60 38.2
3 Subjective Wellbeing (average ladder score, 0-10) 7.6 ≥6 6 > x ≥ 5.5 5.5 > x ≥ 5 <5 3.3
3 Gap in life expectancy at birth among regions (years) 0 ≤4 4 < x ≤ 5.5 5.5 < x ≤ 7 >7 11
3 Gap in self-reported health by income (0-100) 0 ≤20 20 < x ≤ 25 25 < x ≤ 30 >30 41.1
3 Daily smokers (% population age 15+) 10.1 ≤20 20 < x ≤ 22.5 22.5 < x ≤ 25 >25 29.8
4 Net primary enrolment rate (%) 100 ≥98 98 > x ≥ 89 89 > x ≥ 80 <80 53.8
4 Mean years of schooling (years) 13.2 ≥12 12 > x ≥ 11 11 > x ≥ 10 <10 2.3
4 Literacy rate of 15-24 year olds, both sexes (%) 100 ≥95 95 > x ≥ 90 90 > x ≥ 85 <85 45.2
4 Population age 25-64 with tertiary education (%) 52.2 ≥25 25 > x ≥ 20 20 > x ≥ 15 <15 16.8
4 PISA score (0-600) 525.6 ≥493 493 > x ≥ 446.5 446.5 > x ≥ 400 <400 415.7
4Percentage of variation in science performance explained by students’ socio-economic status
8.3 ≤10.5 10.5 < x ≤ 15.3 15.3 < x ≤ 20 >20 21.4
4 Students performing below level 2 in science (%) 9.8 ≤12 12 < x ≤ 21 21 < x ≤ 30 >30 47.8
4 Resilient students (%) 46.6 ≥38 38 > x ≥ 29 29 > x ≥ 20 <20 12.8
5Estimated demand for contraception that is unmet (% women married or in union, ages 15-49 )
0 ≤20 20 < x ≤ 30.7 30.7 < x ≤ 41.3 >41.3 85.8
5Ratio of female to male mean years of schooling of population age 25 and above
100 ≥98 98 > x ≥ 86.5 86.5 > x ≥ 75 <75 41.8
5 Ratio of female to male labor force participation rate 100 ≥70 70 > x ≥ 60 60 > x ≥ 50 <50 21.5
5 Seats held by women in national parliaments (%) 50 ≥40 40 > x ≥ 30 30 > x ≥ 20 <20 1.2
5 Gender wage gap (Total, % male median wage) 0 ≤7.5 7.5 < x ≤ 11.3 11.3 < x ≤ 15 >15 36.7
6For high-income and OECD countries countries : population using safely managed water services (%)
100 ≥95 95 > x ≥ 87.5 87.5 > x ≥ 80 <80 10.5
6For all other countries : Population using at least basic drinking water services (%)
100 ≥98 98 > x ≥ 89 89 > x ≥ 80 <80 40
6For high-income and OECD countries countries : population using safely managed sanitation services (%)
100 ≥90 90 > x ≥ 77.5 77.5 > x ≥ 65 <65 14.1
Table 13 | (continued)
Data tables
62 SDG Index and Dashboards Report 2018 Global Responsibilities
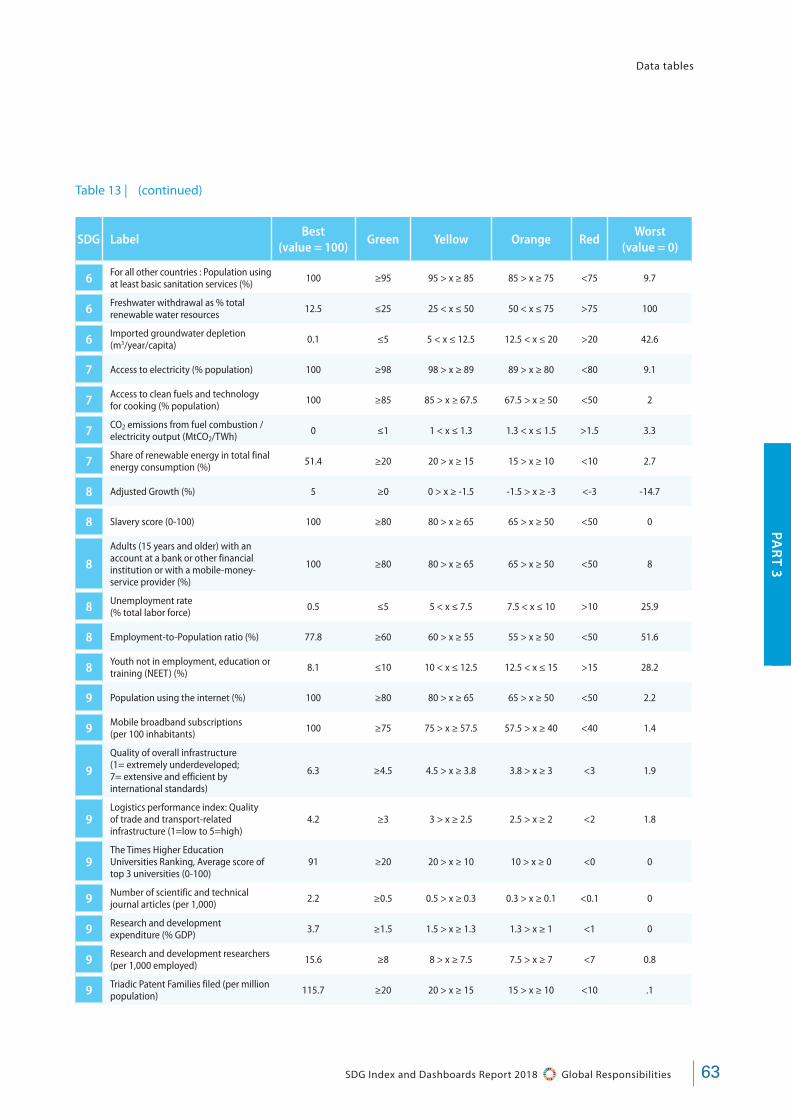
PAR
T 3
SDG LabelBest
(value = 100)Green Yellow Orange Red
Worst (value = 0)
6 For all other countries : Population using at least basic sanitation services (%) 100 ≥95 95 > x ≥ 85 85 > x ≥ 75 <75 9.7
6 Freshwater withdrawal as % total renewable water resources 12.5 ≤25 25 < x ≤ 50 50 < x ≤ 75 >75 100
6 Imported groundwater depletion (m3/year/capita) 0.1 ≤5 5 < x ≤ 12.5 12.5 < x ≤ 20 >20 42.6
7 Access to electricity (% population) 100 ≥98 98 > x ≥ 89 89 > x ≥ 80 <80 9.1
7 Access to clean fuels and technology for cooking (% population) 100 ≥85 85 > x ≥ 67.5 67.5 > x ≥ 50 <50 2
7 CO2 emissions from fuel combustion / electricity output (MtCO2/TWh) 0 ≤1 1 < x ≤ 1.3 1.3 < x ≤ 1.5 >1.5 3.3
7 Share of renewable energy in total final energy consumption (%) 51.4 ≥20 20 > x ≥ 15 15 > x ≥ 10 <10 2.7
8 Adjusted Growth (%) 5 ≥0 0 > x ≥ -1.5 -1.5 > x ≥ -3 <-3 -14.7
8 Slavery score (0-100) 100 ≥80 80 > x ≥ 65 65 > x ≥ 50 <50 0
8
Adults (15 years and older) with an account at a bank or other financial institution or with a mobile-money-service provider (%)
100 ≥80 80 > x ≥ 65 65 > x ≥ 50 <50 8
8 Unemployment rate (% total labor force) 0.5 ≤5 5 < x ≤ 7.5 7.5 < x ≤ 10 >10 25.9
8 Employment-to-Population ratio (%) 77.8 ≥60 60 > x ≥ 55 55 > x ≥ 50 <50 51.6
8 Youth not in employment, education or training (NEET) (%) 8.1 ≤10 10 < x ≤ 12.5 12.5 < x ≤ 15 >15 28.2
9 Population using the internet (%) 100 ≥80 80 > x ≥ 65 65 > x ≥ 50 <50 2.2
9 Mobile broadband subscriptions (per 100 inhabitants) 100 ≥75 75 > x ≥ 57.5 57.5 > x ≥ 40 <40 1.4
9
Quality of overall infrastructure (1= extremely underdeveloped; 7= extensive and efficient by international standards)
6.3 ≥4.5 4.5 > x ≥ 3.8 3.8 > x ≥ 3 <3 1.9
9Logistics performance index: Quality of trade and transport-related infrastructure (1=low to 5=high)
4.2 ≥3 3 > x ≥ 2.5 2.5 > x ≥ 2 <2 1.8
9The Times Higher Education Universities Ranking, Average score of top 3 universities (0-100)
91 ≥20 20 > x ≥ 10 10 > x ≥ 0 <0 0
9 Number of scientific and technical journal articles (per 1,000) 2.2 ≥0.5 0.5 > x ≥ 0.3 0.3 > x ≥ 0.1 <0.1 0
9 Research and development expenditure (% GDP) 3.7 ≥1.5 1.5 > x ≥ 1.3 1.3 > x ≥ 1 <1 0
9 Research and development researchers (per 1,000 employed) 15.6 ≥8 8 > x ≥ 7.5 7.5 > x ≥ 7 <7 0.8
9 Triadic Patent Families filed (per million population) 115.7 ≥20 20 > x ≥ 15 15 > x ≥ 10 <10 .1
Table 13 | (continued)
Data tables
63SDG Index and Dashboards Report 2018 Global Responsibilities
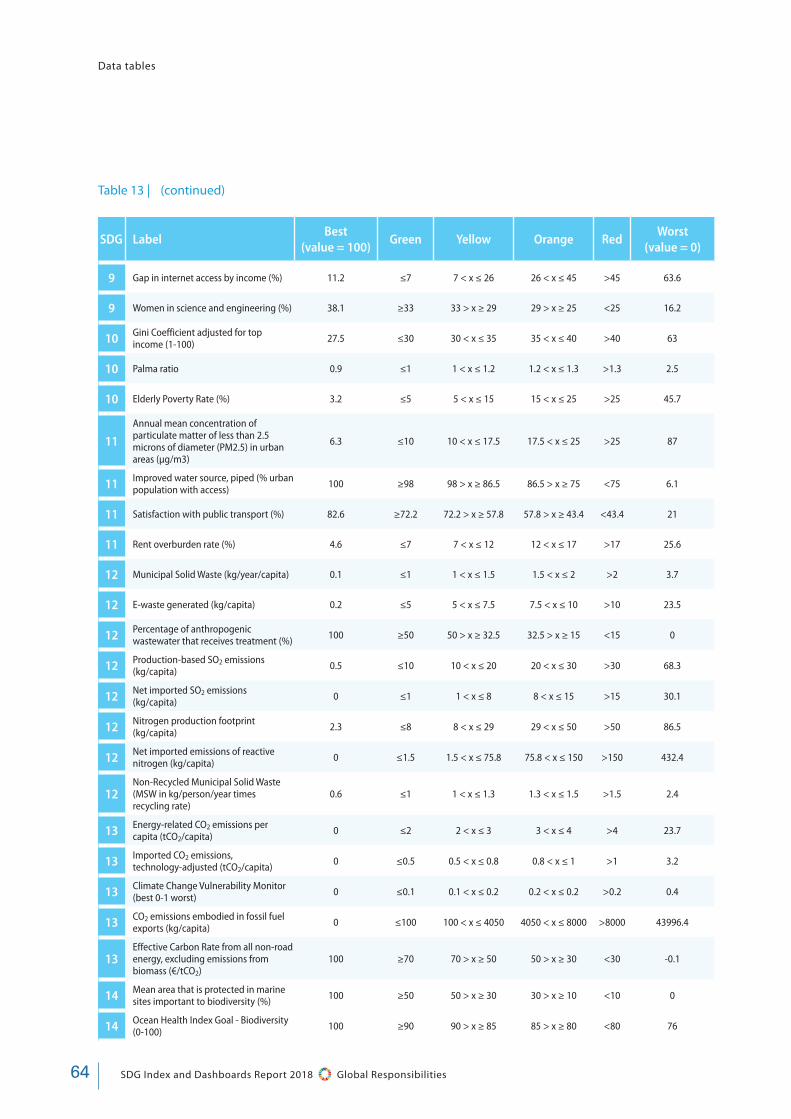
SDG LabelBest
(value = 100)Green Yellow Orange Red
Worst (value = 0)
9 Gap in internet access by income (%) 11.2 ≤7 7 < x ≤ 26 26 < x ≤ 45 >45 63.6
9 Women in science and engineering (%) 38.1 ≥33 33 > x ≥ 29 29 > x ≥ 25 <25 16.2
10 Gini Coefficient adjusted for top income (1-100) 27.5 ≤30 30 < x ≤ 35 35 < x ≤ 40 >40 63
10 Palma ratio 0.9 ≤1 1 < x ≤ 1.2 1.2 < x ≤ 1.3 >1.3 2.5
10 Elderly Poverty Rate (%) 3.2 ≤5 5 < x ≤ 15 15 < x ≤ 25 >25 45.7
11
Annual mean concentration of particulate matter of less than 2.5 microns of diameter (PM2.5) in urban areas (μg/m3)
6.3 ≤10 10 < x ≤ 17.5 17.5 < x ≤ 25 >25 87
11 Improved water source, piped (% urban population with access) 100 ≥98 98 > x ≥ 86.5 86.5 > x ≥ 75 <75 6.1
11 Satisfaction with public transport (%) 82.6 ≥72.2 72.2 > x ≥ 57.8 57.8 > x ≥ 43.4 <43.4 21
11 Rent overburden rate (%) 4.6 ≤7 7 < x ≤ 12 12 < x ≤ 17 >17 25.6
12 Municipal Solid Waste (kg/year/capita) 0.1 ≤1 1 < x ≤ 1.5 1.5 < x ≤ 2 >2 3.7
12 E-waste generated (kg/capita) 0.2 ≤5 5 < x ≤ 7.5 7.5 < x ≤ 10 >10 23.5
12 Percentage of anthropogenic wastewater that receives treatment (%) 100 ≥50 50 > x ≥ 32.5 32.5 > x ≥ 15 <15 0
12 Production-based SO2 emissions (kg/capita) 0.5 ≤10 10 < x ≤ 20 20 < x ≤ 30 >30 68.3
12 Net imported SO2 emissions (kg/capita) 0 ≤1 1 < x ≤ 8 8 < x ≤ 15 >15 30.1
12 Nitrogen production footprint (kg/capita) 2.3 ≤8 8 < x ≤ 29 29 < x ≤ 50 >50 86.5
12 Net imported emissions of reactive nitrogen (kg/capita) 0 ≤1.5 1.5 < x ≤ 75.8 75.8 < x ≤ 150 >150 432.4
12Non-Recycled Municipal Solid Waste (MSW in kg/person/year times recycling rate)
0.6 ≤1 1 < x ≤ 1.3 1.3 < x ≤ 1.5 >1.5 2.4
13 Energy-related CO2 emissions per capita (tCO2/capita) 0 ≤2 2 < x ≤ 3 3 < x ≤ 4 >4 23.7
13 Imported CO2 emissions, technology-adjusted (tCO2/capita) 0 ≤0.5 0.5 < x ≤ 0.8 0.8 < x ≤ 1 >1 3.2
13 Climate Change Vulnerability Monitor (best 0-1 worst) 0 ≤0.1 0.1 < x ≤ 0.2 0.2 < x ≤ 0.2 >0.2 0.4
13 CO2 emissions embodied in fossil fuel exports (kg/capita) 0 ≤100 100 < x ≤ 4050 4050 < x ≤ 8000 >8000 43996.4
13Effective Carbon Rate from all non-road energy, excluding emissions from biomass (€/tCO2)
100 ≥70 70 > x ≥ 50 50 > x ≥ 30 <30 -0.1
14 Mean area that is protected in marine sites important to biodiversity (%) 100 ≥50 50 > x ≥ 30 30 > x ≥ 10 <10 0
14 Ocean Health Index Goal - Biodiversity (0-100) 100 ≥90 90 > x ≥ 85 85 > x ≥ 80 <80 76
Table 13 | (continued)
Data tables
64 SDG Index and Dashboards Report 2018 Global Responsibilities

PAR
T 3
SDG LabelBest
(value = 100)Green Yellow Orange Red
Worst (value = 0)
14 Ocean Health Index Goal - Clean Waters (0-100) 100 ≥70 70 > x ≥ 65 65 > x ≥ 60 <60 28.6
14 Ocean Health Index Goal - Fisheries (0-100) 100 ≥70 70 > x ≥ 65 65 > x ≥ 60 <60 19.7
14 Percentage of Fish Stocks overexploited or collapsed by EEZ (%) 0 ≤25 25 < x ≤ 37.5 37.5 < x ≤ 50 >50 90.7
14 Fish caught by trawling (%) 1 ≤6.3 6.3 < x ≤ 33.2 33.2 < x ≤ 60 >60 90
15Mean area that is protected in terrestrial sites important to biodiversity (%)
100 ≥50 50 > x ≥ 30 30 > x ≥ 10 <10 4.6
15Mean area that is protected in freshwater sites important to biodiversity (%)
100 ≥50 50 > x ≥ 30 30 > x ≥ 10 <10 0
15 Red List Index of species survival (0-1) 1 ≥0.9 0.9 > x ≥ 0.9 0.9 > x ≥ 0.8 <0.8 0.6
15 Annual change in forest area (%) 0.6 ≤3 3 < x ≤ 4.5 4.5 < x ≤ 6 >6 18.4
15 Imported biodiversity threats (threats per million population) 0.1 ≤5 5 < x ≤ 10.3 10.3 < x ≤ 15.5 >15.5 26.4
16 Homicides (per 100,000 people) 0.3 ≤1.5 1.5 < x ≤ 2.3 2.3 < x ≤ 3 >3 38
16 Prison population (per 100,000 people) 25 ≤100 100 < x ≤ 150 150 < x ≤ 200 >200 475
16Proportion of the population who feel safe walking alone at night in the city or area where they live (%)
90 ≥80 80 > x ≥ 65 65 > x ≥ 50 <50 33
16 Government Efficiency (1-7) 5.6 ≥4.5 4.5 > x ≥ 3.8 3.8 > x ≥ 3 <3 2.4
16 Property Rights (1-7) 6.3 ≥4.5 4.5 > x ≥ 3.8 3.8 > x ≥ 3 <3 2.5
16 Birth registrations with civil authority, children under 5 years of age (%) 100 ≥98 98 > x ≥ 86.5 86.5 > x ≥ 75 <75 11.3
16 Corruption Perception Index (0-100) 88.6 ≥60 60 > x ≥ 50 50 > x ≥ 40 <40 13
16 Children 5–14 years old involved in child labor (%) 0 ≤2 2 < x ≤ 6 6 < x ≤ 10 >10 39.3
16Transfers of major conventional weapons (exports) (constant 1990 US$ million per 100,000 people)
0 ≤1 1 < x ≤ 25.5 25.5 < x ≤ 50 >50 3.4
17 Government Health and Education spending (% GDP) 20.7 ≥16 16 > x ≥ 12 12 > x ≥ 8 <8 5.1
17
For high-income and all OECD DAC countries: International concessional public finance, including official development assistance (% GNI)
1 ≥0.7 0.7 > x ≥ 0.5 0.5 > x ≥ 0.4 <0.4 0.1
17 For all other countries: Tax revenue (% GDP) 30.4 ≥25 25 > x ≥ 20 20 > x ≥ 15 <15 1.5
17 Tax Haven Score (best 0-5 worst) 0 ≤1 1 < x ≤ 2.5 2.5 < x ≤ 4 >4 5
17 Financial Secrecy Score (best 0-100 worst) 42.7 ≤40 40 < x ≤ 45 45 < x ≤ 50 >50 76.5
Source: Authors’ analysis
Table 13 | (continued)
Data tables
65SDG Index and Dashboards Report 2018 Global Responsibilities
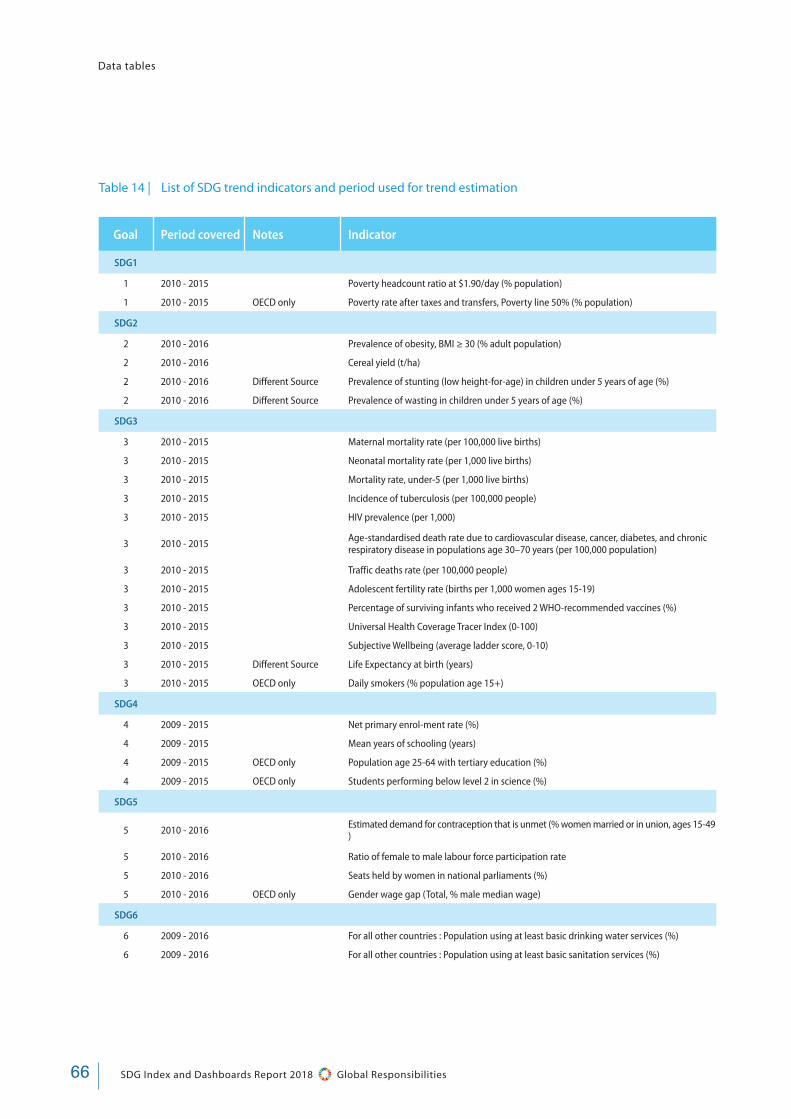
Table 14 | List of SDG trend indicators and period used for trend estimation
Goal Period covered Notes Indicator
SDG1
1 2010 - 2015 Poverty headcount ratio at $1.90/day (% population)
1 2010 - 2015 OECD only Poverty rate after taxes and transfers, Poverty line 50% (% population)
SDG2
2 2010 - 2016 Prevalence of obesity, BMI ≥ 30 (% adult population)
2 2010 - 2016 Cereal yield (t/ha)
2 2010 - 2016 Different Source Prevalence of stunting (low height-for-age) in children under 5 years of age (%)
2 2010 - 2016 Different Source Prevalence of wasting in children under 5 years of age (%)
SDG3
3 2010 - 2015 Maternal mortality rate (per 100,000 live births)
3 2010 - 2015 Neonatal mortality rate (per 1,000 live births)
3 2010 - 2015 Mortality rate, under-5 (per 1,000 live births)
3 2010 - 2015 Incidence of tuberculosis (per 100,000 people)
3 2010 - 2015 HIV prevalence (per 1,000)
3 2010 - 2015 Age-standardised death rate due to cardiovascular disease, cancer, diabetes, and chronic respiratory disease in populations age 30–70 years (per 100,000 population)
3 2010 - 2015 Traffic deaths rate (per 100,000 people)
3 2010 - 2015 Adolescent fertility rate (births per 1,000 women ages 15-19)
3 2010 - 2015 Percentage of surviving infants who received 2 WHO-recommended vaccines (%)
3 2010 - 2015 Universal Health Coverage Tracer Index (0-100)
3 2010 - 2015 Subjective Wellbeing (average ladder score, 0-10)
3 2010 - 2015 Different Source Life Expectancy at birth (years)
3 2010 - 2015 OECD only Daily smokers (% population age 15+)
SDG4
4 2009 - 2015 Net primary enrol-ment rate (%)
4 2009 - 2015 Mean years of schooling (years)
4 2009 - 2015 OECD only Population age 25-64 with tertiary education (%)
4 2009 - 2015 OECD only Students performing below level 2 in science (%)
SDG5
5 2010 - 2016 Estimated demand for contraception that is unmet (% women married or in union, ages 15-49 )
5 2010 - 2016 Ratio of female to male labour force participation rate
5 2010 - 2016 Seats held by women in national parliaments (%)
5 2010 - 2016 OECD only Gender wage gap (Total, % male median wage)
SDG6
6 2009 - 2016 For all other countries : Population using at least basic drinking water services (%)
6 2009 - 2016 For all other countries : Population using at least basic sanitation services (%)
Data tables
66 SDG Index and Dashboards Report 2018 Global Responsibilities

PAR
T 3
Goal Period covered Notes Indicator
6 2009 - 2016 For high-income and OECD countries : population using safely managed water services (%)
6 2009 - 2016 For high-income and OECD countries : population using safely managed sanitation services (%)
SDG7
7 2008 - 2014 Access to electricity (% population)
7 2008 - 2014 Access to clean fuels and technology for cooking (% population)
7 2008 - 2014 CO2 emissions from fuel combustion / electricity output (MtCO2/TWh)
7 2008 - 2014 OECD ONLY Share of renewable energy in total final energy consumption (%)
SDG8
8 2011 - 2014 Adults (15 years and older) with an account at a bank or other financial institution or with a mobile-money-service provider (%)
8 2011 - 2014 GLOBAL ONLY Unemployment rate (% total labor force)
8 2011 - 2014 OECD only Employment-to-Population ratio (%)
8 2011 - 2014 OECD only Youth not in employment, education or training (NEET) (%)
SDG9
9 2009 - 2015 Population using the internet (%)
9 2009 - 2015 Mobile broadband subscriptions (per 100 inhabitants)
9 2009 - 2015 Quality of overall infrastructure (1= extremely underdeveloped; 7= extensive and efficient by international standards)
9 2009 - 2015 OECD only Research and development researchers (per 1,000 employed)
9 2009 - 2015 OECD only Triadic Patent Families filed (per million population)
SDG10
10 2011 - 2014 OECD only Gini Coefficient adjusted for top income (1-100)
10 2011 - 2014 OECD only Palma ratio
SDG11
11 2010 - 2016 Improved water source, piped (% urban population with access)
11 2010 - 2016 Satisfaction with public transport (%)
11 2010 - 2016 Different Source Levels of particulate matter smaller than 2.5 microns (PM2.5)
SDG13
13 2008 - 2014 Energy-related CO2 emissions per capita (tCO2/capita)
SDG14
14 2012 - 2017 Ocean Health Index Goal - Biodiversity (0-100)
14 2012 - 2017 Ocean Health Index Goal - Clean Waters (0-100)
14 2012 - 2017 Ocean Health Index Goal - Fisheries (0-100)
14 2009 - 2014 Different Years Fish caught by trawling (%)
SDG15
15 2011 - 2017 Mean area that is protected in terrestrial sites important to biodiversity (%)
15 2011 - 2017 Mean area that is protected in freshwater sites important to biodiversity (%)
15 2011 - 2017 Red List Index of species survival (0-1)
Data tables
67SDG Index and Dashboards Report 2018 Global Responsibilities
Table 14 | (continued)

Goal Period covered Notes Indicator
SDG16
16 2011 - 2015 Proportion of the population who feel safe walking alone at night in the city or area where they live (%)
16 2011 - 2015 Government Efficiency (1-7)
16 2011 - 2015 Property Rights (1-7)
16 2011 - 2015 Corruption Perception Index (0-100)
SDG17
17 2008 - 2014 Government Health and Education spending (% GDP)
17 2008 - 2014 For all other countries: Tax revenue (% GDP)
17 2008 - 2014 For high-income and all OECD DAC countries: International concessional public finance, including official development assistance (% GNI)
Note: Different source means that in order to reflect time series the source used for a similar indicator between the SDG Index and the trends may not be exactly the same. Trends rely slightly more on model-based indicators for which time series coverage is greater.
Source: Authors’ analysis
Data tables
68 SDG Index and Dashboards Report 2018 Global Responsibilities
Table 14 | (continued)

PAR
T 3
Table 15 | Overall country scores by SDG
Country SDG1 SDG2 SDG3 SDG4 SDG5 SDG6 SDG7 SDG8 SDG9 SDG10 SDG11 SDG12 SDG13 SDG14 SDG15 SDG16 SDG17
Afghanistan 63.8 40.3 37.9 6.9 24.6 49.3 52.0 31.2 3.8 nd 39.4 82.1 87.7 nd 50.8 47.6 55.0
Albania 99.7 48.8 81.0 84.8 73.5 93.1 82.3 55.6 27.3 59.9 75.4 74.4 75.4 38.8 75.1 65.8 60.6
Algeria 99.5 50.7 76.6 77.8 49.3 61.9 79.8 53.7 28.8 88.9 68.7 81.6 90.8 44.4 62.2 65.2 74.0
Angola 60.4 44.1 31.4 44.8 61.8 57.5 35.6 48.9 7.7 nd 44.2 80.6 87.4 43.1 63.8 38.8 47.3
Argentina 99.8 69.1 80.8 88.6 78.5 100.0 85.6 61.5 38.3 39.8 83.6 69.9 89.1 44.5 50.5 58.8 56.6
Armenia 98.9 54.1 76.9 88.2 69.9 73.4 93.6 55.5 29.2 50.2 75.7 80.9 92.2 nd 59.9 71.1 59.5
Australia 99.9 59.6 95.3 96.2 79.9 86.7 84.0 86.8 81.5 77.1 84.5 50.7 23.3 55.0 37.7 81.9 59.0
Austria 99.6 80.2 93.7 82.2 77.1 94.4 89.1 87.6 79.5 87.5 83.9 51.5 83.2 nd 64.6 86.7 66.0
Azerbaijan 100.0 57.9 74.3 90.1 68.2 76.4 85.7 61.2 38.7 68.4 79.0 77.2 82.3 nd 66.3 72.3 57.2
Bahrain 99.9 66.9 88.9 84.4 58.1 32.9 88.7 86.0 50.2 nd 61.8 73.9 55.9 40.6 53.4 68.7 47.5
Bangladesh 97.0 46.8 60.3 63.9 57.0 77.3 42.9 63.1 18.0 76.5 39.4 77.5 81.1 51.0 54.7 60.7 41.7
Belarus 99.9 59.5 81.4 93.3 82.1 95.4 83.4 79.1 31.5 85.9 81.1 82.1 91.1 nd 70.2 67.9 59.5
Belgium 99.7 80.8 93.1 89.4 84.0 77.0 85.9 85.5 73.4 93.6 84.5 51.9 79.0 47.2 75.2 83.9 58.9
Belize 84.7 58.5 74.5 83.1 60.7 90.4 89.3 56.3 18.7 nd 70.9 63.8 85.0 24.6 41.6 47.1 73.8
Benin 45.8 49.3 46.9 38.7 43.1 58.3 10.7 64.5 7.6 36.3 50.2 81.3 84.3 41.5 62.2 54.5 57.5
Bhutan 99.9 49.3 69.6 47.6 45.7 74.0 83.7 64.2 28.8 68.3 75.1 74.5 93.4 nd 57.6 78.6 56.2
Bolivia 94.5 49.6 68.9 76.9 77.9 95.8 66.8 72.5 19.6 48.7 79.5 75.3 88.4 nd 71.1 45.9 77.3
Bosnia and Herzegovina 99.9 66.3 78.8 80.2 54.3 100.0 64.6 51.3 24.8 82.3 61.3 72.3 89.1 11.5 60.8 64.7 81.9
Botswana 80.8 36.4 61.7 76.1 67.0 75.5 45.9 49.5 30.2 0.0 84.6 57.5 68.0 nd 69.8 63.5 79.1
Brazil 96.9 67.7 78.2 77.4 68.3 98.3 89.6 67.6 45.3 25.7 79.4 70.3 90.1 59.9 56.4 47.3 66.4
Bulgaria 98.2 62.1 80.1 84.9 73.9 75.5 83.4 74.8 38.6 61.9 77.4 65.6 86.0 57.7 90.7 62.8 69.4
Burkina Faso 71.1 34.9 47.1 18.4 36.0 55.2 8.1 54.3 11.9 78.2 51.7 80.4 89.7 nd 65.6 55.1 59.0
Burundi 0.0 41.4 46.4 54.0 69.2 67.9 0.1 43.6 4.7 67.2 52.3 83.1 83.8 nd 71.9 49.7 63.5
Cabo Verde 83.5 46.6 75.3 63.1 61.7 81.6 79.7 64.6 26.5 36.7 78.0 79.7 87.0 46.0 61.7 66.0 61.8
Cambodia 99.9 51.8 61.0 60.9 62.9 81.1 35.5 47.0 20.3 91.0 73.8 80.8 73.2 34.5 43.2 55.1 54.5
Cameroon 75.4 49.7 43.5 62.9 58.7 65.7 47.0 55.6 10.0 43.3 39.5 81.4 94.8 47.3 67.6 48.9 57.1
Canada 99.4 65.6 94.3 99.3 81.1 75.4 91.5 85.6 75.8 79.0 81.9 52.9 66.4 54.0 51.5 88.3 63.4
Central African Republic 0.0 32.4 21.8 16.0 36.2 60.0 1.8 21.9 0.8 19.4 32.0 77.3 76.5 nd 89.3 56.7 50.0
Chad 43.2 31.3 25.8 18.1 28.2 51.1 0.8 46.3 3.2 53.4 49.2 76.8 85.6 nd 76.3 36.7 53.7
Chile 99.5 68.6 86.9 84.1 66.6 94.2 87.5 78.1 43.6 27.4 79.6 74.0 92.4 62.9 50.0 68.3 73.8
China 99.7 71.5 80.0 73.8 75.6 89.9 69.1 83.1 58.7 59.6 69.2 73.2 69.3 33.5 58.6 72.5 53.6
Colombia 95.5 56.7 80.8 75.5 72.0 97.6 85.4 56.9 28.2 21.8 80.8 74.7 86.6 54.2 53.6 50.6 61.3
Congo 19.7 40.3 51.2 57.0 61.2 52.9 35.0 45.1 12.4 29.5 58.5 78.1 93.3 52.7 90.4 63.5 49.8
Costa Rica 100.0 57.0 87.0 83.1 78.1 91.2 91.9 71.3 36.2 34.8 89.9 72.9 90.9 62.1 61.5 64.2 71.4
Côte d’Ivoire 78.2 45.1 36.3 34.6 39.9 67.9 46.6 63.9 24.8 46.8 56.5 77.4 95.6 36.3 71.2 56.4 60.6
Croatia 99.0 72.6 86.1 84.5 71.5 82.5 83.8 72.5 51.0 70.0 80.7 68.4 91.6 67.9 79.2 66.0 73.4
Cuba 98.4 65.4 85.4 92.2 82.3 90.3 80.0 85.9 12.4 nd 56.8 74.2 82.0 51.0 59.1 60.8 100.0
Cyprus 99.9 57.0 91.5 93.3 70.7 76.9 86.2 70.6 54.1 77.5 76.9 39.6 76.2 45.2 74.8 80.6 25.3
Czech Republic 99.6 69.1 91.6 91.3 72.6 87.4 87.2 81.0 62.7 92.4 86.9 71.1 87.9 nd 83.8 72.0 49.3
Data tables
69SDG Index and Dashboards Report 2018 Global Responsibilities
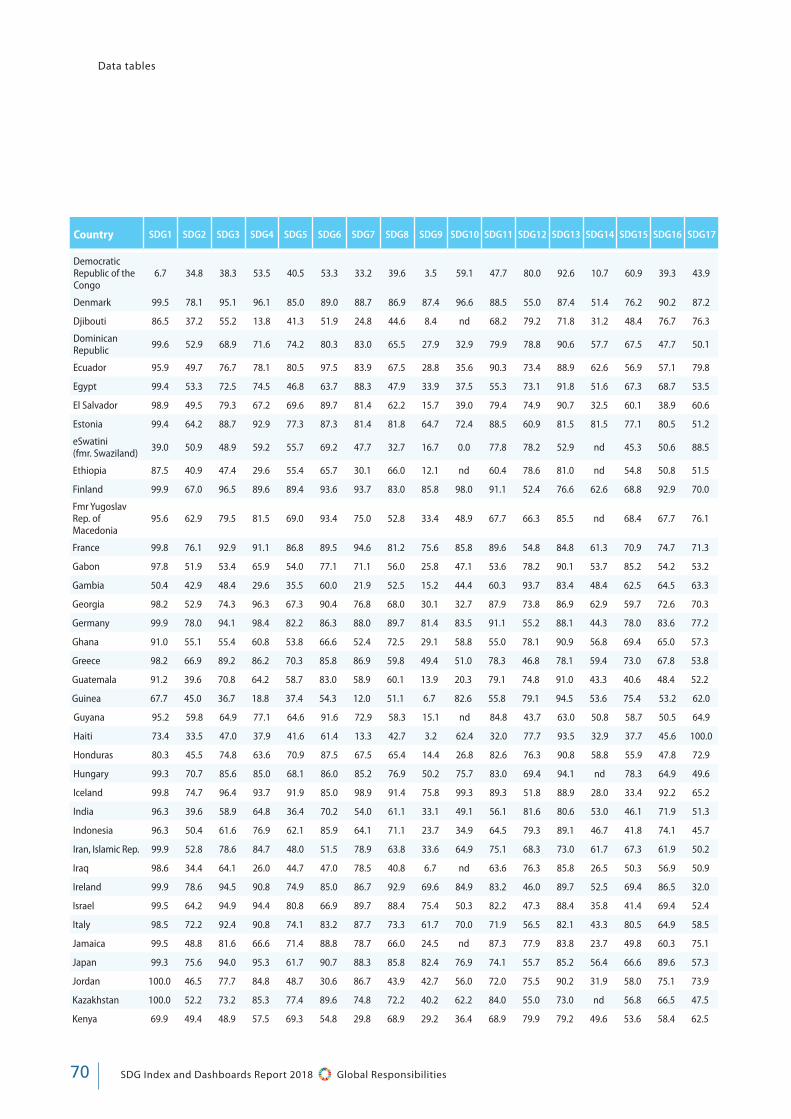
Country SDG1 SDG2 SDG3 SDG4 SDG5 SDG6 SDG7 SDG8 SDG9 SDG10 SDG11 SDG12 SDG13 SDG14 SDG15 SDG16 SDG17
Democratic Republic of the Congo
6.7 34.8 38.3 53.5 40.5 53.3 33.2 39.6 3.5 59.1 47.7 80.0 92.6 10.7 60.9 39.3 43.9
Denmark 99.5 78.1 95.1 96.1 85.0 89.0 88.7 86.9 87.4 96.6 88.5 55.0 87.4 51.4 76.2 90.2 87.2
Djibouti 86.5 37.2 55.2 13.8 41.3 51.9 24.8 44.6 8.4 nd 68.2 79.2 71.8 31.2 48.4 76.7 76.3
Dominican Republic 99.6 52.9 68.9 71.6 74.2 80.3 83.0 65.5 27.9 32.9 79.9 78.8 90.6 57.7 67.5 47.7 50.1
Ecuador 95.9 49.7 76.7 78.1 80.5 97.5 83.9 67.5 28.8 35.6 90.3 73.4 88.9 62.6 56.9 57.1 79.8
Egypt 99.4 53.3 72.5 74.5 46.8 63.7 88.3 47.9 33.9 37.5 55.3 73.1 91.8 51.6 67.3 68.7 53.5
El Salvador 98.9 49.5 79.3 67.2 69.6 89.7 81.4 62.2 15.7 39.0 79.4 74.9 90.7 32.5 60.1 38.9 60.6
Estonia 99.4 64.2 88.7 92.9 77.3 87.3 81.4 81.8 64.7 72.4 88.5 60.9 81.5 81.5 77.1 80.5 51.2
eSwatini (fmr. Swaziland) 39.0 50.9 48.9 59.2 55.7 69.2 47.7 32.7 16.7 0.0 77.8 78.2 52.9 nd 45.3 50.6 88.5
Ethiopia 87.5 40.9 47.4 29.6 55.4 65.7 30.1 66.0 12.1 nd 60.4 78.6 81.0 nd 54.8 50.8 51.5
Finland 99.9 67.0 96.5 89.6 89.4 93.6 93.7 83.0 85.8 98.0 91.1 52.4 76.6 62.6 68.8 92.9 70.0
Fmr Yugoslav Rep. of Macedonia
95.6 62.9 79.5 81.5 69.0 93.4 75.0 52.8 33.4 48.9 67.7 66.3 85.5 nd 68.4 67.7 76.1
France 99.8 76.1 92.9 91.1 86.8 89.5 94.6 81.2 75.6 85.8 89.6 54.8 84.8 61.3 70.9 74.7 71.3
Gabon 97.8 51.9 53.4 65.9 54.0 77.1 71.1 56.0 25.8 47.1 53.6 78.2 90.1 53.7 85.2 54.2 53.2
Gambia 50.4 42.9 48.4 29.6 35.5 60.0 21.9 52.5 15.2 44.4 60.3 93.7 83.4 48.4 62.5 64.5 63.3
Georgia 98.2 52.9 74.3 96.3 67.3 90.4 76.8 68.0 30.1 32.7 87.9 73.8 86.9 62.9 59.7 72.6 70.3
Germany 99.9 78.0 94.1 98.4 82.2 86.3 88.0 89.7 81.4 83.5 91.1 55.2 88.1 44.3 78.0 83.6 77.2
Ghana 91.0 55.1 55.4 60.8 53.8 66.6 52.4 72.5 29.1 58.8 55.0 78.1 90.9 56.8 69.4 65.0 57.3
Greece 98.2 66.9 89.2 86.2 70.3 85.8 86.9 59.8 49.4 51.0 78.3 46.8 78.1 59.4 73.0 67.8 53.8
Guatemala 91.2 39.6 70.8 64.2 58.7 83.0 58.9 60.1 13.9 20.3 79.1 74.8 91.0 43.3 40.6 48.4 52.2
Guinea 67.7 45.0 36.7 18.8 37.4 54.3 12.0 51.1 6.7 82.6 55.8 79.1 94.5 53.6 75.4 53.2 62.0
Guyana 95.2 59.8 64.9 77.1 64.6 91.6 72.9 58.3 15.1 nd 84.8 43.7 63.0 50.8 58.7 50.5 64.9
Haiti 73.4 33.5 47.0 37.9 41.6 61.4 13.3 42.7 3.2 62.4 32.0 77.7 93.5 32.9 37.7 45.6 100.0
Honduras 80.3 45.5 74.8 63.6 70.9 87.5 67.5 65.4 14.4 26.8 82.6 76.3 90.8 58.8 55.9 47.8 72.9
Hungary 99.3 70.7 85.6 85.0 68.1 86.0 85.2 76.9 50.2 75.7 83.0 69.4 94.1 nd 78.3 64.9 49.6
Iceland 99.8 74.7 96.4 93.7 91.9 85.0 98.9 91.4 75.8 99.3 89.3 51.8 88.9 28.0 33.4 92.2 65.2
India 96.3 39.6 58.9 64.8 36.4 70.2 54.0 61.1 33.1 49.1 56.1 81.6 80.6 53.0 46.1 71.9 51.3
Indonesia 96.3 50.4 61.6 76.9 62.1 85.9 64.1 71.1 23.7 34.9 64.5 79.3 89.1 46.7 41.8 74.1 45.7
Iran, Islamic Rep. 99.9 52.8 78.6 84.7 48.0 51.5 78.9 63.8 33.6 64.9 75.1 68.3 73.0 61.7 67.3 61.9 50.2
Iraq 98.6 34.4 64.1 26.0 44.7 47.0 78.5 40.8 6.7 nd 63.6 76.3 85.8 26.5 50.3 56.9 50.9
Ireland 99.9 78.6 94.5 90.8 74.9 85.0 86.7 92.9 69.6 84.9 83.2 46.0 89.7 52.5 69.4 86.5 32.0
Israel 99.5 64.2 94.9 94.4 80.8 66.9 89.7 88.4 75.4 50.3 82.2 47.3 88.4 35.8 41.4 69.4 52.4
Italy 98.5 72.2 92.4 90.8 74.1 83.2 87.7 73.3 61.7 70.0 71.9 56.5 82.1 43.3 80.5 64.9 58.5
Jamaica 99.5 48.8 81.6 66.6 71.4 88.8 78.7 66.0 24.5 nd 87.3 77.9 83.8 23.7 49.8 60.3 75.1
Japan 99.3 75.6 94.0 95.3 61.7 90.7 88.3 85.8 82.4 76.9 74.1 55.7 85.2 56.4 66.6 89.6 57.3
Jordan 100.0 46.5 77.7 84.8 48.7 30.6 86.7 43.9 42.7 56.0 72.0 75.5 90.2 31.9 58.0 75.1 73.9
Kazakhstan 100.0 52.2 73.2 85.3 77.4 89.6 74.8 72.2 40.2 62.2 84.0 55.0 73.0 nd 56.8 66.5 47.5
Kenya 69.9 49.4 48.9 57.5 69.3 54.8 29.8 68.9 29.2 36.4 68.9 79.9 79.2 49.6 53.6 58.4 62.5
Data tables
70 SDG Index and Dashboards Report 2018 Global Responsibilities
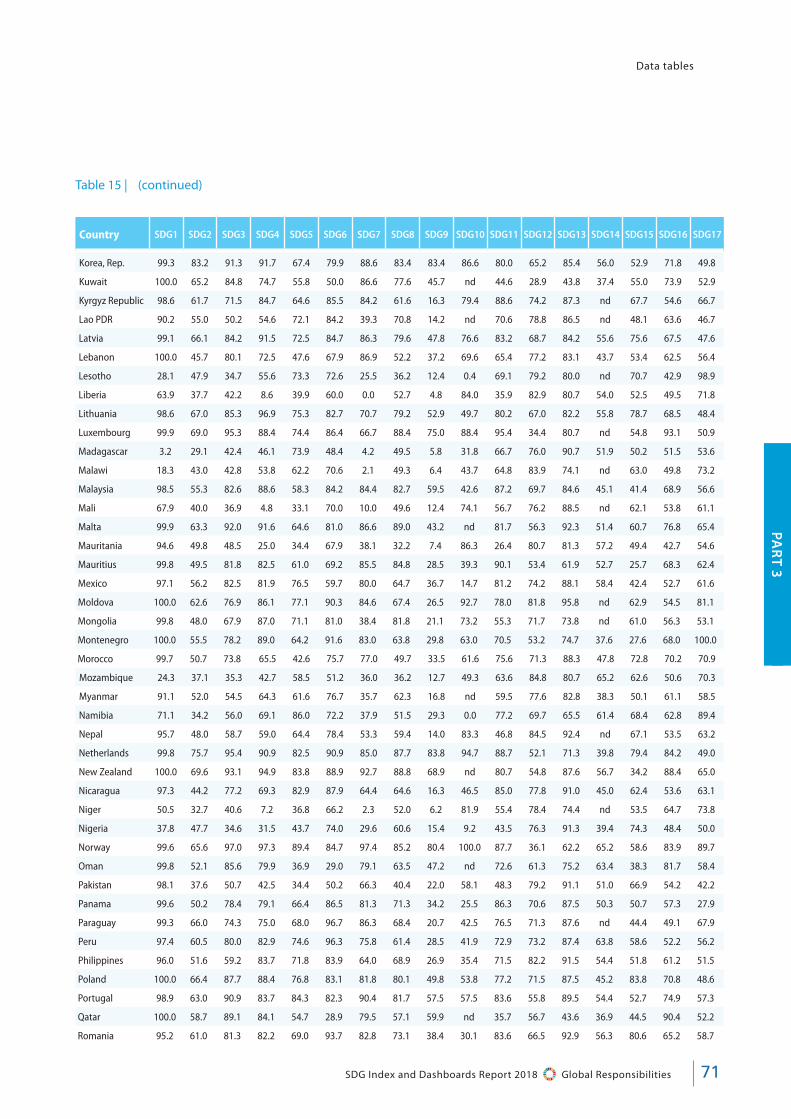
PAR
T 3
Country SDG1 SDG2 SDG3 SDG4 SDG5 SDG6 SDG7 SDG8 SDG9 SDG10 SDG11 SDG12 SDG13 SDG14 SDG15 SDG16 SDG17
Korea, Rep. 99.3 83.2 91.3 91.7 67.4 79.9 88.6 83.4 83.4 86.6 80.0 65.2 85.4 56.0 52.9 71.8 49.8
Kuwait 100.0 65.2 84.8 74.7 55.8 50.0 86.6 77.6 45.7 nd 44.6 28.9 43.8 37.4 55.0 73.9 52.9
Kyrgyz Republic 98.6 61.7 71.5 84.7 64.6 85.5 84.2 61.6 16.3 79.4 88.6 74.2 87.3 nd 67.7 54.6 66.7
Lao PDR 90.2 55.0 50.2 54.6 72.1 84.2 39.3 70.8 14.2 nd 70.6 78.8 86.5 nd 48.1 63.6 46.7
Latvia 99.1 66.1 84.2 91.5 72.5 84.7 86.3 79.6 47.8 76.6 83.2 68.7 84.2 55.6 75.6 67.5 47.6
Lebanon 100.0 45.7 80.1 72.5 47.6 67.9 86.9 52.2 37.2 69.6 65.4 77.2 83.1 43.7 53.4 62.5 56.4
Lesotho 28.1 47.9 34.7 55.6 73.3 72.6 25.5 36.2 12.4 0.4 69.1 79.2 80.0 nd 70.7 42.9 98.9
Liberia 63.9 37.7 42.2 8.6 39.9 60.0 0.0 52.7 4.8 84.0 35.9 82.9 80.7 54.0 52.5 49.5 71.8
Lithuania 98.6 67.0 85.3 96.9 75.3 82.7 70.7 79.2 52.9 49.7 80.2 67.0 82.2 55.8 78.7 68.5 48.4
Luxembourg 99.9 69.0 95.3 88.4 74.4 86.4 66.7 88.4 75.0 88.4 95.4 34.4 80.7 nd 54.8 93.1 50.9
Madagascar 3.2 29.1 42.4 46.1 73.9 48.4 4.2 49.5 5.8 31.8 66.7 76.0 90.7 51.9 50.2 51.5 53.6
Malawi 18.3 43.0 42.8 53.8 62.2 70.6 2.1 49.3 6.4 43.7 64.8 83.9 74.1 nd 63.0 49.8 73.2
Malaysia 98.5 55.3 82.6 88.6 58.3 84.2 84.4 82.7 59.5 42.6 87.2 69.7 84.6 45.1 41.4 68.9 56.6
Mali 67.9 40.0 36.9 4.8 33.1 70.0 10.0 49.6 12.4 74.1 56.7 76.2 88.5 nd 62.1 53.8 61.1
Malta 99.9 63.3 92.0 91.6 64.6 81.0 86.6 89.0 43.2 nd 81.7 56.3 92.3 51.4 60.7 76.8 65.4
Mauritania 94.6 49.8 48.5 25.0 34.4 67.9 38.1 32.2 7.4 86.3 26.4 80.7 81.3 57.2 49.4 42.7 54.6
Mauritius 99.8 49.5 81.8 82.5 61.0 69.2 85.5 84.8 28.5 39.3 90.1 53.4 61.9 52.7 25.7 68.3 62.4
Mexico 97.1 56.2 82.5 81.9 76.5 59.7 80.0 64.7 36.7 14.7 81.2 74.2 88.1 58.4 42.4 52.7 61.6
Moldova 100.0 62.6 76.9 86.1 77.1 90.3 84.6 67.4 26.5 92.7 78.0 81.8 95.8 nd 62.9 54.5 81.1
Mongolia 99.8 48.0 67.9 87.0 71.1 81.0 38.4 81.8 21.1 73.2 55.3 71.7 73.8 nd 61.0 56.3 53.1
Montenegro 100.0 55.5 78.2 89.0 64.2 91.6 83.0 63.8 29.8 63.0 70.5 53.2 74.7 37.6 27.6 68.0 100.0
Morocco 99.7 50.7 73.8 65.5 42.6 75.7 77.0 49.7 33.5 61.6 75.6 71.3 88.3 47.8 72.8 70.2 70.9
Mozambique 24.3 37.1 35.3 42.7 58.5 51.2 36.0 36.2 12.7 49.3 63.6 84.8 80.7 65.2 62.6 50.6 70.3
Myanmar 91.1 52.0 54.5 64.3 61.6 76.7 35.7 62.3 16.8 nd 59.5 77.6 82.8 38.3 50.1 61.1 58.5
Namibia 71.1 34.2 56.0 69.1 86.0 72.2 37.9 51.5 29.3 0.0 77.2 69.7 65.5 61.4 68.4 62.8 89.4
Nepal 95.7 48.0 58.7 59.0 64.4 78.4 53.3 59.4 14.0 83.3 46.8 84.5 92.4 nd 67.1 53.5 63.2
Netherlands 99.8 75.7 95.4 90.9 82.5 90.9 85.0 87.7 83.8 94.7 88.7 52.1 71.3 39.8 79.4 84.2 49.0
New Zealand 100.0 69.6 93.1 94.9 83.8 88.9 92.7 88.8 68.9 nd 80.7 54.8 87.6 56.7 34.2 88.4 65.0
Nicaragua 97.3 44.2 77.2 69.3 82.9 87.9 64.4 64.6 16.3 46.5 85.0 77.8 91.0 45.0 62.4 53.6 63.1
Niger 50.5 32.7 40.6 7.2 36.8 66.2 2.3 52.0 6.2 81.9 55.4 78.4 74.4 nd 53.5 64.7 73.8
Nigeria 37.8 47.7 34.6 31.5 43.7 74.0 29.6 60.6 15.4 9.2 43.5 76.3 91.3 39.4 74.3 48.4 50.0
Norway 99.6 65.6 97.0 97.3 89.4 84.7 97.4 85.2 80.4 100.0 87.7 36.1 62.2 65.2 58.6 83.9 89.7
Oman 99.8 52.1 85.6 79.9 36.9 29.0 79.1 63.5 47.2 nd 72.6 61.3 75.2 63.4 38.3 81.7 58.4
Pakistan 98.1 37.6 50.7 42.5 34.4 50.2 66.3 40.4 22.0 58.1 48.3 79.2 91.1 51.0 66.9 54.2 42.2
Panama 99.6 50.2 78.4 79.1 66.4 86.5 81.3 71.3 34.2 25.5 86.3 70.6 87.5 50.3 50.7 57.3 27.9
Paraguay 99.3 66.0 74.3 75.0 68.0 96.7 86.3 68.4 20.7 42.5 76.5 71.3 87.6 nd 44.4 49.1 67.9
Peru 97.4 60.5 80.0 82.9 74.6 96.3 75.8 61.4 28.5 41.9 72.9 73.2 87.4 63.8 58.6 52.2 56.2
Philippines 96.0 51.6 59.2 83.7 71.8 83.9 64.0 68.9 26.9 35.4 71.5 82.2 91.5 54.4 51.8 61.2 51.5
Poland 100.0 66.4 87.7 88.4 76.8 83.1 81.8 80.1 49.8 53.8 77.2 71.5 87.5 45.2 83.8 70.8 48.6
Portugal 98.9 63.0 90.9 83.7 84.3 82.3 90.4 81.7 57.5 57.5 83.6 55.8 89.5 54.4 52.7 74.9 57.3
Qatar 100.0 58.7 89.1 84.1 54.7 28.9 79.5 57.1 59.9 nd 35.7 56.7 43.6 36.9 44.5 90.4 52.2
Romania 95.2 61.0 81.3 82.2 69.0 93.7 82.8 73.1 38.4 30.1 83.6 66.5 92.9 56.3 80.6 65.2 58.7
Data tables
71SDG Index and Dashboards Report 2018 Global Responsibilities
Table 15 | (continued)
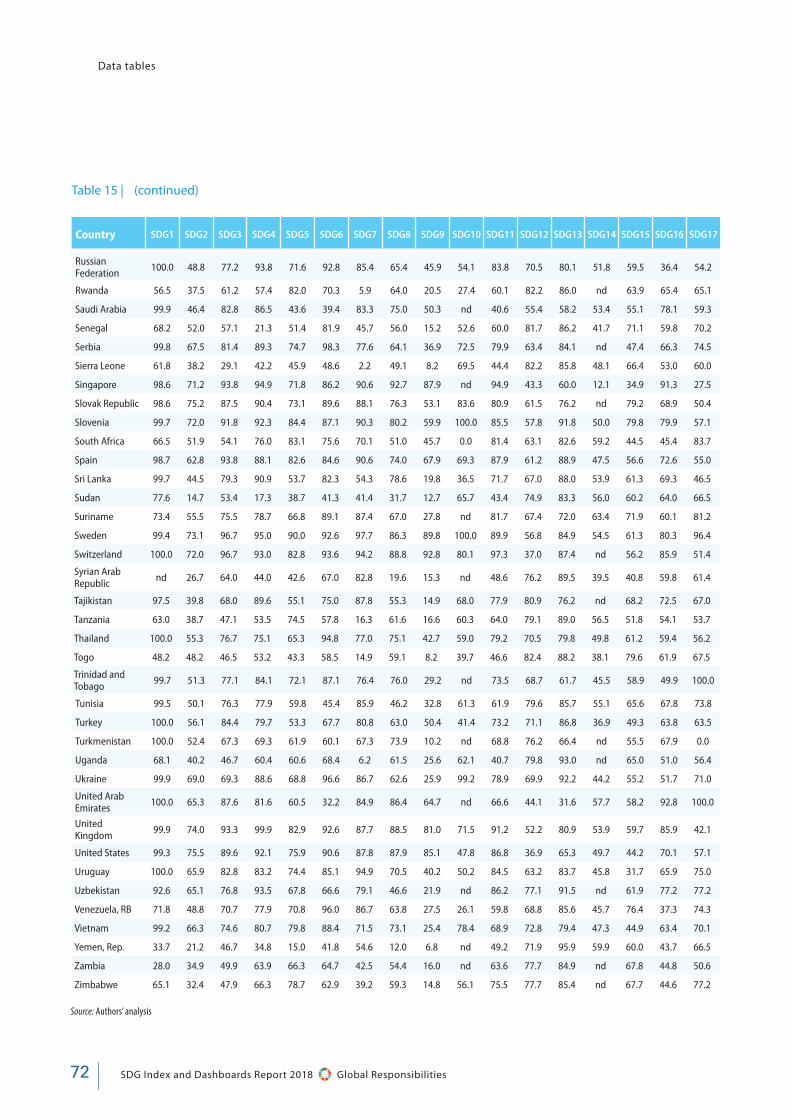
Country SDG1 SDG2 SDG3 SDG4 SDG5 SDG6 SDG7 SDG8 SDG9 SDG10 SDG11 SDG12 SDG13 SDG14 SDG15 SDG16 SDG17
Russian Federation 100.0 48.8 77.2 93.8 71.6 92.8 85.4 65.4 45.9 54.1 83.8 70.5 80.1 51.8 59.5 36.4 54.2
Rwanda 56.5 37.5 61.2 57.4 82.0 70.3 5.9 64.0 20.5 27.4 60.1 82.2 86.0 nd 63.9 65.4 65.1
Saudi Arabia 99.9 46.4 82.8 86.5 43.6 39.4 83.3 75.0 50.3 nd 40.6 55.4 58.2 53.4 55.1 78.1 59.3
Senegal 68.2 52.0 57.1 21.3 51.4 81.9 45.7 56.0 15.2 52.6 60.0 81.7 86.2 41.7 71.1 59.8 70.2
Serbia 99.8 67.5 81.4 89.3 74.7 98.3 77.6 64.1 36.9 72.5 79.9 63.4 84.1 nd 47.4 66.3 74.5
Sierra Leone 61.8 38.2 29.1 42.2 45.9 48.6 2.2 49.1 8.2 69.5 44.4 82.2 85.8 48.1 66.4 53.0 60.0
Singapore 98.6 71.2 93.8 94.9 71.8 86.2 90.6 92.7 87.9 nd 94.9 43.3 60.0 12.1 34.9 91.3 27.5
Slovak Republic 98.6 75.2 87.5 90.4 73.1 89.6 88.1 76.3 53.1 83.6 80.9 61.5 76.2 nd 79.2 68.9 50.4
Slovenia 99.7 72.0 91.8 92.3 84.4 87.1 90.3 80.2 59.9 100.0 85.5 57.8 91.8 50.0 79.8 79.9 57.1
South Africa 66.5 51.9 54.1 76.0 83.1 75.6 70.1 51.0 45.7 0.0 81.4 63.1 82.6 59.2 44.5 45.4 83.7
Spain 98.7 62.8 93.8 88.1 82.6 84.6 90.6 74.0 67.9 69.3 87.9 61.2 88.9 47.5 56.6 72.6 55.0
Sri Lanka 99.7 44.5 79.3 90.9 53.7 82.3 54.3 78.6 19.8 36.5 71.7 67.0 88.0 53.9 61.3 69.3 46.5
Sudan 77.6 14.7 53.4 17.3 38.7 41.3 41.4 31.7 12.7 65.7 43.4 74.9 83.3 56.0 60.2 64.0 66.5
Suriname 73.4 55.5 75.5 78.7 66.8 89.1 87.4 67.0 27.8 nd 81.7 67.4 72.0 63.4 71.9 60.1 81.2
Sweden 99.4 73.1 96.7 95.0 90.0 92.6 97.7 86.3 89.8 100.0 89.9 56.8 84.9 54.5 61.3 80.3 96.4
Switzerland 100.0 72.0 96.7 93.0 82.8 93.6 94.2 88.8 92.8 80.1 97.3 37.0 87.4 nd 56.2 85.9 51.4
Syrian Arab Republic nd 26.7 64.0 44.0 42.6 67.0 82.8 19.6 15.3 nd 48.6 76.2 89.5 39.5 40.8 59.8 61.4
Tajikistan 97.5 39.8 68.0 89.6 55.1 75.0 87.8 55.3 14.9 68.0 77.9 80.9 76.2 nd 68.2 72.5 67.0
Tanzania 63.0 38.7 47.1 53.5 74.5 57.8 16.3 61.6 16.6 60.3 64.0 79.1 89.0 56.5 51.8 54.1 53.7
Thailand 100.0 55.3 76.7 75.1 65.3 94.8 77.0 75.1 42.7 59.0 79.2 70.5 79.8 49.8 61.2 59.4 56.2
Togo 48.2 48.2 46.5 53.2 43.3 58.5 14.9 59.1 8.2 39.7 46.6 82.4 88.2 38.1 79.6 61.9 67.5
Trinidad and Tobago
99.7 51.3 77.1 84.1 72.1 87.1 76.4 76.0 29.2 nd 73.5 68.7 61.7 45.5 58.9 49.9 100.0
Tunisia 99.5 50.1 76.3 77.9 59.8 45.4 85.9 46.2 32.8 61.3 61.9 79.6 85.7 55.1 65.6 67.8 73.8
Turkey 100.0 56.1 84.4 79.7 53.3 67.7 80.8 63.0 50.4 41.4 73.2 71.1 86.8 36.9 49.3 63.8 63.5
Turkmenistan 100.0 52.4 67.3 69.3 61.9 60.1 67.3 73.9 10.2 nd 68.8 76.2 66.4 nd 55.5 67.9 0.0
Uganda 68.1 40.2 46.7 60.4 60.6 68.4 6.2 61.5 25.6 62.1 40.7 79.8 93.0 nd 65.0 51.0 56.4
Ukraine 99.9 69.0 69.3 88.6 68.8 96.6 86.7 62.6 25.9 99.2 78.9 69.9 92.2 44.2 55.2 51.7 71.0
United Arab Emirates 100.0 65.3 87.6 81.6 60.5 32.2 84.9 86.4 64.7 nd 66.6 44.1 31.6 57.7 58.2 92.8 100.0
United Kingdom 99.9 74.0 93.3 99.9 82.9 92.6 87.7 88.5 81.0 71.5 91.2 52.2 80.9 53.9 59.7 85.9 42.1
United States 99.3 75.5 89.6 92.1 75.9 90.6 87.8 87.9 85.1 47.8 86.8 36.9 65.3 49.7 44.2 70.1 57.1
Uruguay 100.0 65.9 82.8 83.2 74.4 85.1 94.9 70.5 40.2 50.2 84.5 63.2 83.7 45.8 31.7 65.9 75.0
Uzbekistan 92.6 65.1 76.8 93.5 67.8 66.6 79.1 46.6 21.9 nd 86.2 77.1 91.5 nd 61.9 77.2 77.2
Venezuela, RB 71.8 48.8 70.7 77.9 70.8 96.0 86.7 63.8 27.5 26.1 59.8 68.8 85.6 45.7 76.4 37.3 74.3
Vietnam 99.2 66.3 74.6 80.7 79.8 88.4 71.5 73.1 25.4 78.4 68.9 72.8 79.4 47.3 44.9 63.4 70.1
Yemen, Rep. 33.7 21.2 46.7 34.8 15.0 41.8 54.6 12.0 6.8 nd 49.2 71.9 95.9 59.9 60.0 43.7 66.5
Zambia 28.0 34.9 49.9 63.9 66.3 64.7 42.5 54.4 16.0 nd 63.6 77.7 84.9 nd 67.8 44.8 50.6
Zimbabwe 65.1 32.4 47.9 66.3 78.7 62.9 39.2 59.3 14.8 56.1 75.5 77.7 85.4 nd 67.7 44.6 77.2
Source: Authors’ analysis
Data tables
72 SDG Index and Dashboards Report 2018 Global Responsibilities
Table 15 | (continued)
BirdLife International, IUCN, and UNEP-WCMC (2018), “Marine Important Bird and Biodiversity Areas,” BirdLife International, International Union for Conservation of Nature and United Nations Environment Programme - World Conservation Monitoring Center, Geneva, Switzerland.
Brauer, M., and et al. (2016), PM2.5 air pollution, mean annual exposure (micrograms per cubic meter). Available at https://data.worldbank.org/indicator/en.atm.pm25.mc.m3, accessed April 1, 2018.
Booysen, F. (2002), “An Overview and Evaluation of Composite Indices of Development,” Social Indicators Research, 59(2), 115–151.
Climate Action Tracker (2017), “Improvement in warming outlook as China and India move ahead, but Paris Agreement gap still looms large.” - Climate Analytics, Berlin, Germany; Ecofys, London, United Kingdom and New Climate Institute, Berlin, Germany.
Dalin, C., Y. Wada, T. Kastner, and M.J. Puma (2017), “Groundwater depletion embedded in international food trade,” Nature, 543(7647), 700–704.
Djankov, S., Islam, A., and Saliola, F. (2016), “How Large Is Public Procurement in Developing Countries?” - Peterson Institute for International Economics, Washington D.C., United States of America.
European Commission (2011), “Buying social” - Employment, Social Affairs & Inclusion, European Commission, Brussels, Belgium.
FAO (2018a), AQUASTAT Database. Available at http://www.fao.org/nr/water/aquastat/data/query/index.html?lang=en, accessed April 1, 2018.
FAO (2018b), Cereal yield (kg per hectare). Available at http://data.worldbank.org/indicator/AG.YLD.CREL.KG, accessed April 1, 2018.
FAO (2018c), Prevalence of undernourishment (% of population). Available at http://data.worldbank.org/indicator/SN.ITK.DEFC.ZS, accessed April 1, 2018.
FAO, IFAD, and WFP (2015), “The State of Food Insecurity in the World 2015. Meeting the 2015 international hunger targets: taking stock of uneven progress,” Food and Agriculture Organization, International Fund for Agricultural Development and World Food Programme, Rome, Italy.
Gallup (2016), “Gallup World Poll” - Gallup, New York, United States of America.
GBD (2016), “Measuring the health-related Sustainable Development Goals in 188 countries: a baseline analysis from the Global Burden of Disease Study 2015,” The Lancet, 388(10053), 1813–1850.
Global Forest Watch (2014), Global Forest Watch Database. Available at https://www.globalforestwatch.org/, accessed April 1, 2018.
IEA (2016), “CO2 Emissions from Fuel Combustion (2016 Edition)” - International Energy Agency, Paris, France.
ILO (2018a), Labor force participation rate, total (% of total population ages 15+) (modeled ILO estimate). Available at http://data.worldbank.org/indicator/SL.TLF.CACT.ZS, accessed April 1, 2018.
FAO (2018b), Unemployment, total (% of total labor force) (modeled ILO estimate). Available at http://data.worldbank.org/indicator/SL.UEM.TOTL.ZS, accessed April 1, 2018.
INTOSAI (2018), “SDGs: SAIs and Regions” - International Organization of Supreme Audit Institutions, Vienna, Austria.
IPU (2018), Proportion of seats held by women in national parliaments (%). Available at https://data.worldbank.org/indicator/SG.GEN.PARL.ZS, accessed April 1, 2018.
ITU (2018), World Telecommunication/ICT Indicators database. Available at http://www.itu.int/en/ITU-D/Statistics/Pages/publications/wtid.aspx, accessed April 1, 2018.
IUCN, and BirdLife International (2018), “IUCN Red List” International Union for Conservation of Nature, Gland, Switzerland and Birdlife International, Cambridge, United Kingdom.
Kander, A., M. Jiborn, D.D. Moran, and T.O. Wiedmann (2015), “National greenhouse-gas accounting for effective climate policy on international trade,” Nature Climate Change, 5(5), 431–435.
Lafortune, G., Gonzalez, S., and Lonti, Z. (2017), Government at a Glance: A Dashboard Approach to Indicators. The Palgrave Handbook of Indicators of Global Governance, Palgrave Macmillan, Cham.
Lenzen, M., D. Moran, K. Kanemoto, B. Foran, L. Lobefaro, and A. Geschke (2012), “International trade drives biodiversity threats in developing nations,” Nature, 486(7401), 109–112.
National Science Foundation (2018), Scientific and Technical Journal Articles. Available at http://data.worldbank.org/indicator/IP.JRN.ARTC.SC, accessed April 1, 2018.
Oak Ridge National Laboratory (2018), “CO2 emissions (metric tons per capita)” Available at https://data.worldbank.org/indicator/EN.ATM.CO2E.PC, accessed April 1, 2018.
Ocean Health Index (2017), Ocean Health Index 2017 global assessment. Available at http://data.oceanhealthindex.org/data-and-downloads, accessed April 1, 2018.
OECD (2015), Government at a Glance: 2015., Organization for Economic Cooperation & Development, Paris, France.
OECD (2018a), OECD Statistics. Available at http://stats.oecd.org/, accessed April 1, 2018.
REFERENCES
73SDG Index and Dashboards Report 2018 Global Responsibilities

References
OECD (2018b), PISA Database. Available at: http://www.oecd.org/pisa/, accessed April 1, 2018.
OECD, IEA, and World Bank (2018), Renewable energy consumption (% of total final energy consumption). Available at http://data.worldbank.org/indicator/EG.FEC.RNEW.ZS, accessed April 1, 2018.
OECD and JRC (2016), Handbook on Constructing Composite Indicators: Methodology and User Guide, OECD, Joint Research Committee, Paris
Oita, A., A. Malik, K. Kanemoto, A. Geschke, S. Nishijima, and M. Lenzen (2016), “Substantial nitrogen pollution embedded in international trade,” Nature Geoscience, 9(2), 111–115.
Oxfam (2016), “Tax Battles. The dangerous global Race to the Bottom on Corporate Tax” Oxfam, Oxford, United Kingdom.
Pauly, D., and D. Zeller (2015), Sea Around Us concepts, design and data, Springer, Vancouver.
Schwab, K., and Sala-i-Martín, X. (2018), “The Global Competitiveness Report 2017-2018” - World Economic Forum, Geneva, Switzerland.
SE4All (2018a), Access to clean fuels and technologies for cooking (% of population). Available at https://data.worldbank.org/indicator/EG.CFT.ACCS.ZS, accessed April 1, 2018.
SE4All (2018b), Access to electricity (% of population), Available at http://data.worldbank.org/indicator/EG.ELC.ACCS.ZS, accessed April 1, 2018.
Sea Around Us (2018), Sea Around Us: Tools and Data, Available at http://www.seaaroundus.org/data/#/eez, accessed April 1, 2018.
Seidel, B. and Chandy L. (2017), “How much do we really know about inequality within countries around the world? Adjusting Gini coefficients for missing top incomes” - The Brookings Institution, Washington D. C., United States of America.
SIPRI (2018), SIPRI Arms Transfers Database. Available at https://www.sipri.org/databases/armstransfers, accessed April 1, 2018.
Tax Justice Network (2018), Financial Secrecy Index 2018. Available at https://www.financialsecrecyindex.com/introduction/fsi-2018-results, accessed April 1, 2018.
Times Higher Education (2018), World University Rankings 2018. Available at https://www.timeshighereducation.com/world-university-rankings/2018/world-ranking, accessed April 1, 2018.
Transparency International (2017), Corruption Perceptions Index 2017. Available at https://www.transparency.org/news/feature/corruption_perceptions_index_2017, accessed April 1, 2018.
UN Comtrade (2018), UN Comtrade Database. Available at https://comtrade.un.org/data/, accessed April 1, 2018.
UN Women (2015), “Progress of the World’s Women 2015-2016: Transforming Economies, Realizing Rights” - United Nations Entity for Gender Equality and the Empowerment of Women, New York, United States of America.
UNDESA (2018a), Family Planning - Model. Available at http://www.un.org/en/development/desa/population/theme/family-planning/cp_model.shtml, accessed April 1, 2018.
UNDESA (2018b), “Working Together: Integration, institutions and the Sustainable Development Goals, World Public Sector Report 2018” - Public Institutions and Digital Government Department of Economics and Social Affairs, New York, United States of America.
UNDP (2018), Adolescent fertility rate (births per 1,000 women ages 15-19). Available at: http://data.worldbank.org/indicator/SP.ADO.TFRT, accessed April 1, 2018.
UNEP (2018), «Sustainable public procurement» - 10YFP SPP Programme, Paris, France.
UNESCO (2018a), Government expenditure on education. Available at http://data.worldbank.org/indicator/SE.XPD.TOTL.GD.ZS, accessed April 1, 2018.
UNESCO (2018b), UIS.Stat. Available at http://data.uis.unesco.org/, accessed April 1, 2018.
UNICEF (2018a), Child Labour. Available at http://data.unicef.org/child-protection/child-labour.html, accessed April 1, 2018.
UNICEF (2018b), Proportion of births attended by skilled health personnel, Available at http://data.worldbank.org/indicator/SH.STA.BRTC.ZS, accessed April 1, 2018.
UNICEF, WHO, and World Bank (2017), “Joint child malnutrition estimates - Levels and trends (2017 edition)” - UNICEF, New York, United States of America; WHO, Geneva, Switzerland and World Bank, Washington D.C., United States of America.
UNICEF, WHO, World Bank, and UN DESA Population Division (2018a), Mortality rate, under-5 (per 1,000 live births). Available at http://data.worldbank.org/indicator/SH.DYN.MORT, accessed April 1, 2018.
UNICEF (2018b), Mortality rate, neonatal (per 1,000 live births). Available at http://data.worldbank.org/indicator/SH.DYN.NMRT, accessed April 1, 2018.
UNODC (2016), “Global Study on Homicides” - United Nations Office on Drugs and Crime, Vienna, Austria.
UNODC (2017), “Total Prison Population” - United Nations Office on Drugs and Crime, Vienna, Austria.
UNSDSN (2017), “Counting the World: Building Modern Data Systems for Sustainable Development” - UN Sustainable Development Solution Network, New York, United States of America.
SDG Index and Dashboards Report 2018 Global Responsibilities74

UNU-IAS (2015), “The Global E-Waste Monitor 2014: Quantities, Flows and Resources” - United Nations University, IAS – SCYCLE, Bonn, Germany.
Vries, G.d. (2016), “How national audit offices can support implementation of the SDGs” - Public Financial Management Blog.
Walk Free Foundation (2016), “Global Slavery Index 2016” - Walk Free Foundation, Broadway Nedlands, Australia.
Wendling, Z., Emerson, J., Esty, D., Levy, M., and de Sherbini, A. (2018), “2018 Environmental Performance Index,” Yale Center for Environmental Law & Policy, New Haven, CT, United States of America.
WHO (2018a), Age-standardised death rate attributable to household air pollution and ambient air pollution, per 100 000 population. Available at http://www.who.int/gho/phe/en/, accessed April 1, 2018.
WHO (2018b), Age-standardised death rate due to cardiovascular disease, cancer, diabetes, and chronic respiratory disease in populations age 30–70 years, per 100 000 population. Available at http://www.who.int/gho/en/, accessed April 1,2018.
WHO (2018c), GHO Healthy life expectancy. Available at http://apps.who.int/gho/data/node.main.688, accessed April 1, 2018.
WHO (2018d), GHO Obesity (body mass index >= 30) (age-standardized estimate). Available at http://apps.who.int/gho/data/view.main.CTRY2450A?lang=en, accessed April 1, 2018.
WHO (2018e), GHO Road traffic deaths. Available at http://apps.who.int/gho/data/node.main.A997, accessed April 1, 2018.
WHO (2018f ), Incidence of tuberculosis (per 100,000 people). Available at http://data.worldbank.org/indicator/SH.TBS.INCD, accessed April 1, 2018.
WHO (2018g), Maternal mortality ratio (modeled estimate, per 100,000 live births). Available at http://data.worldbank.org/indicator/SH.STA.MMRT, accessed April 1, 2018.
WHO (2018h), World Health Expenditure Database. Available at http://apps.who.int/nha/database, accessed April 1, 2018.
WHO and UNICEF (2018a), Immunization Coverage. Available at //data.unicef.org/topic/child-health/immunization/, accessed April 1, 2018.
WHO and UNICEF (2018b), “WHO / UNICEF Joint Monitoring Programme: Data & estimates” - World Health Organization and United Nations Children’s Fund, Geneva, Switzerland.
World Bank (2012), “What a Waste: A Global Review of Solid Waste Management,” Urban Development Seris - Knowledge Papers No. 15, World Bank, Washington D.C., United States of America.
World Bank (2016), Logistics Performance Index (LPI). Available at http://lpi.worldbank.org/international/global, accessed April 1, 2018.
World Bank (2018a), GDP per capita, PPP (constant 2011 international $). Available at http://data.worldbank.org/indicator/NY.GDP.PCAP.PP.KD, accessed April 1, 2018.
World Bank (2018b), Global Financial Inclusion Database. Available at http://www.worldbank.org/globalfindex, accessed April 1, 2018.
World Bank (2018c), Tax revenue (% of GDP). Available at http://data.worldbank.org/indicator/GC.TAX.TOTL.GD.ZS, accessed April 1, 2018.
World Data Lab (2017), World Poverty Clock. Available at http://worldpoverty.io/, accessed April 1, 2018.
Zhang, Q., X. Jiang, D. Tong, S.J. Davis, H. Zhao, G. Geng, T. Feng, B. Zheng, Z. Lu, D.G. Streets, and others (2017), “Transboundary health impacts of transported global air pollution and international trade,” Nature, 543(7647), 705–709.
Zhang, X., E.A. Davidson, D.L. Mauzerall, T.D. Searchinger, P. Dumas, and Y. Shen (2015), “Managing nitrogen for sustainable development,” Nature, 528(7580), 51–59.
References
75SDG Index and Dashboards Report 2018 Global Responsibilities


Country Profiles
4
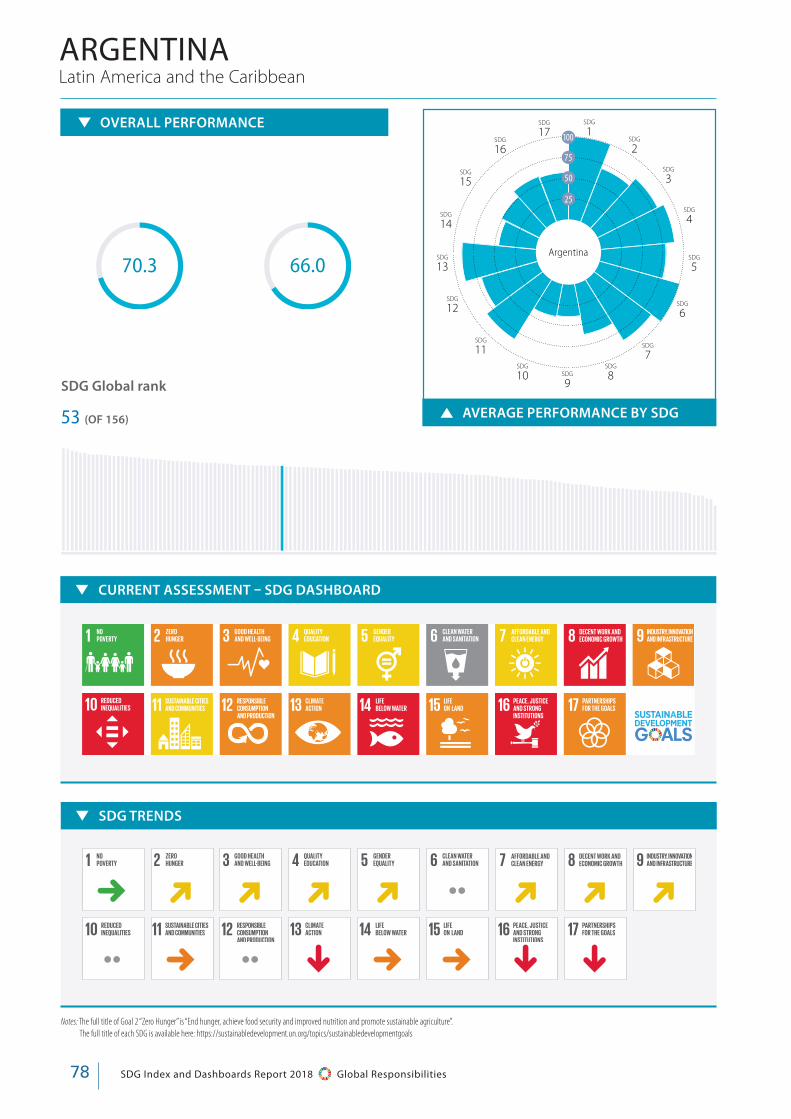
SDG Index and Dashboards Report 2018 Global Responsibilities78
AVERAGE PERFORMANCE BY SDG
Notes: The full title of Goal 2 “Zero Hunger” is “End hunger, achieve food security and improved nutrition and promote sustainable agriculture”. The full title of each SDG is available here: https://sustainabledevelopment.un.org/topics/sustainabledevelopmentgoals
OVERALL PERFORMANCE
SDG Global rank
53 (OF 156)
Latin America and the CaribbeanARGENTINA
SDG TRENDS
5 D D D D •• D D D
•• 5 •• p 5 5 p p
66.070.3
CURRENT ASSESSMENT – SDG DASHBOARD
100
75
50
25
SDG
1SDG
17SDG
16
SDG
15
SDG
14
SDG
13
SDG
12
SDG
11SDG
10 SDG
9
SDG
8
SDG
7
SDG
6
SDG
5
SDG
4
SDG
3
SDG
2
Argentina

79SDG Index and Dashboards Report 2018 Global Responsibilities
PAR
T 4. CO
UN
TRY
PR
OFILES
Performance by IndicatorARGENTINA
Value Rating Trend
Logistics performance index: Quality of trade and transport-related infrastructure (1=low to 5=high)
2.9 • ••
The Times Higher Education Universities Ranking, Average score of top 3 universities (0-100)
18.5 • ••
Number of scientific and technical journal articles (per 1,000 population) 0.2 • ••Research and development expenditure (% GDP) 0.6 • ••SDG10 – Reduced Inequalities Gini Coefficient adjusted for top income (1-100) 48.9 • ••SDG11 – Sustainable Cities and Communities
Annual mean concentration of particulate matter of less than 2.5 microns of diameter (PM2.5) in urban areas (μg/m3)
13.4 • 5
Improved water source, piped (% urban population with access) 99.6 • 5Satisfaction with public transport (%) 58.0 • p
SDG12 – Responsible Consumption and Production Municipal Solid Waste (kg/day/capita) 1.2 • ••E-waste generated (kg/capita) 7.0 • ••Anthropogenic wastewater that receives treatment (%) 7.7 • ••Production-based SO2 emissions (kg/capita) 9.8 • ••Net imported SO2 emissions (kg/capita) -1.6 • ••Reactive nitrogen production footprint (kg/capita) 40.4 • ••Net imported emissions of reactive nitrogen (kg/capita) -239.4 • ••SDG13 – Climate Action
Energy-related CO2 emissions per capita (tCO2/capita) 4.7 • pImported CO2 emissions, technology-adjusted (tCO2/capita) 0.4 • ••Climate Change Vulnerability Index 0.0 • ••CO2 emissions embodied in fossil fuel exports (kg/capita) 171.4 • ••SDG14 – Life Below Water
Mean area that is protected in marine sites important to biodiversity (%) 44.2 • ••Ocean Health Index-Biodiversity (0-100) 93.3 • 5Ocean Health Index-Clean Waters (0-100) 83.2 • 5Ocean Health Index-Fisheries (0-100) 37.7 • pFish Stocks overexploited or collapsed by EEZ (%) 74.0 • ••Fish caught by trawling (%) 60.5 • 5
SDG15 – Life on Land Mean area that is protected in terrestrial sites important to biodiversity (%) 33.2 • 5Mean area that is protected in freshwater sites important to biodiversity (%) 43.5 • 5Red List Index of species survival (0-1) 0.9 • 5Annual change in forest area (%) 13.7 • ••Imported biodiversity threats (threats per million population) 2.0 • ••SDG16 – Peace, Justice and Strong Institutions
Homicides (per 100,000 population) 6.5 • ••Prison population (per 100,000 population) 167.4 • ••Population who feel safe walking alone at night in the city or area where
they live (%)40.0 • p
Government Efficiency (1-7) 2.9 • pProperty Rights (1-7) 3.6 • pChildren under 5 years of age whose births have been registered with a
civil authority (%)99.5 • ••
Corruption Perception Index (0-100) 39.0 • pChildren 5–14 years old involved in child labour (%) 4.4 • ••Transfers of major conventional weapons (exports) (constant 1990
US$ million per 100,000 population)0.0 • ••
SDG17 – Partnerships for the Goals
Government Health and Education spending (% GDP) 10.1 • pHigh-income and all OECD DAC countries: International concessional public
finance, including official development assistance (% GNI)NA • ••
Other countries: Tax revenue (% GDP) 12.4 • pTax Haven Score (best 0-5 worst) 0.0 • ••
SDG1 – End Poverty Poverty headcount ratio at $1.90/day (% population) 0.1 • 5Projected poverty headcount ratio at $1.90/day in 2030 (% population) 0.1 • ••SDG2 – Zero Hunger
Prevalence of undernourishment (% population) 3.6 • ••Prevalence of stunting (low height-for-age) in children under 5 years of age (%) 8.2 • 5Prevalence of wasting in children under 5 years of age (%) 1.2 • 5Prevalence of obesity, BMI ≥ 30 (% adult population) 28.3 • pCereal yield (t/ha) 5.1 • 5Sustainable Nitrogen Management Index 0.3 • ••SDG3 – Good Health and Well-Being
Maternal mortality rate (per 100,000 live births) 52.0 • 5Neonatal mortality rate (per 1,000 live births) 6.2 • 5Mortality rate, under-5 (per 1,000 live births) 11.1 • 5Incidence of tuberculosis (per 100,000 population) 24.0 • pHIV prevalence (per 1,000) 0.2 • 5Age-standardised death rate due to cardiovascular disease, cancer,
diabetes, and chronic respiratory disease in populations age 30–70 years (per 100,000 population)
17.1 • L
Age-standardised death rate attributable to household air pollution and ambient air pollution (per 100,000 population)
20.9 • ••
Traffic deaths rate (per 100,000 population) 14.1 • pHealthy Life Expectancy at birth (years) 76.3 • 5Adolescent fertility rate (births per 1,000 women ages 15-19) 63.0 • 5Births attended by skilled health personnel (%) 99.6 • ••Surviving infants who received 2 WHO-recommended vaccines (%) 90.0 • pUniversal Health Coverage Tracer Index (0-100) 61.7 • 5Subjective Wellbeing (average ladder score, 0-10) 6.0 • 5
SDG4 – Quality Education
Net primary enrolment rate (%) 99.4 • 5Mean years of schooling 9.8 • DLiteracy rate of 15-24 year olds, both sexes (%) 99.3 • ••SDG5 – Gender Equality
Unmet demand for contraception, estimated (% women married or in union, ages 15-49 )
11.3 • 5
Female to male mean years of schooling of population age 25 + (%) 97.0 • ••Female to male labour force participation rate (%) 64.6 • DSeats held by women in national parliaments (%) 38.9 • p
SDG6 – Clean Water and Sanitation
High-income countries: population using safely managed water services (%) NA • ••Other countries: population using at least basic drinking water services (%) NA • ••High-income countries: population using safely managed sanitation services (%) NA • ••Other countries: population using at least basic sanitation services (%) NA • ••Freshwater withdrawal as % total renewable water resources 6.6 • ••Imported groundwater depletion (m3/year/capita) 0.2 • ••SDG7 – Affordable and Clean Energy
Access to electricity (% population) 100.0 • 5Access to clean fuels & technology for cooking (% population) 99.9 • 5CO2 emissions from fuel combustion / electricity output (MtCO2/TWh) 1.4 • 5
SDG8 – Decent Work and Economic Growth
Adjusted GDP Growth (%) -4.1 • ••Slavery score (0-100) 80.0 • ••Adults (15 years +) with an account at a bank or other financial institution or
with a mobile-money-service provider (%)48.7 • L
Unemployment rate (% total labour force) 8.7 • 5
SDG9 – Industry, Innovation and Infrastructure
Proportion of the population using the internet (%) 71.0 • LMobile broadband subscriptions (per 100 inhabitants) 78.1 • LQuality of overall infrastructure (1= extremely underdeveloped;
7= extensive and efficient by international standards)3.3 • p
Value Rating Trend Value Rating Trend

CURRENT ASSESSMENT – SDG DASHBOARD
Notes: The full title of Goal 2 “Zero Hunger” is “End hunger, achieve food security and improved nutrition and promote sustainable agriculture”. The full title of each SDG is available here: https://sustainabledevelopment.un.org/topics/sustainabledevelopmentgoals
SDG Index and Dashboards Report 2018 Global Responsibilities80
AVERAGE PERFORMANCE BY SDG
OECD Countries
OVERALL PERFORMANCE
Index score Regional average score
SDG Global rank
37 (OF 156)
AUSTRALIA
72.9 76.9
SDG TRENDS
L D 5 D D •• D D D
•• D •• D D 5 5 D
100
75
50
25
SDG
1SDG
17SDG
16
SDG
15
SDG
14
SDG
13
SDG
12
SDG
11SDG
10 SDG
9
SDG
8
SDG
7
SDG
6
SDG
5
SDG
4
SDG
3
SDG
2
Australia
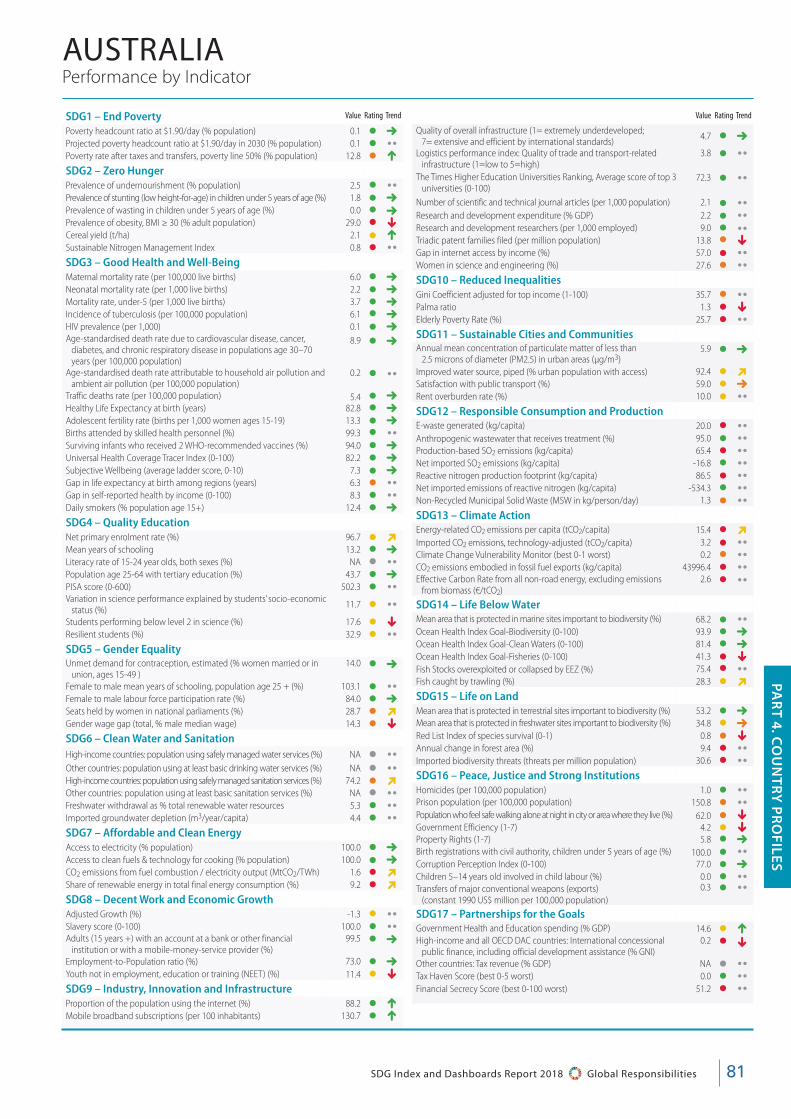
Performance by Indicator
Value Rating Trend
81SDG Index and Dashboards Report 2018 Global Responsibilities
PAR
T 4. CO
UN
TRY
PR
OFILES
SDG1 – End Poverty
Poverty headcount ratio at $1.90/day (% population) 0.1 • 5Projected poverty headcount ratio at $1.90/day in 2030 (% population) 0.1 • ••Poverty rate after taxes and transfers, poverty line 50% (% population) 12.8 • LSDG2 – Zero Hunger Prevalence of undernourishment (% population) 2.5 • ••Prevalence of stunting (low height-for-age) in children under 5 years of age (%) 1.8 • 5Prevalence of wasting in children under 5 years of age (%) 0.0 • 5Prevalence of obesity, BMI ≥ 30 (% adult population) 29.0 • pCereal yield (t/ha) 2.1 • LSustainable Nitrogen Management Index 0.8 • ••SDG3 – Good Health and Well-Being Maternal mortality rate (per 100,000 live births) 6.0 • 5Neonatal mortality rate (per 1,000 live births) 2.2 • 5Mortality rate, under-5 (per 1,000 live births) 3.7 • 5Incidence of tuberculosis (per 100,000 population) 6.1 • 5HIV prevalence (per 1,000) 0.1 • 5Age-standardised death rate due to cardiovascular disease, cancer,
diabetes, and chronic respiratory disease in populations age 30–70 years (per 100,000 population)
8.9 • 5
Age-standardised death rate attributable to household air pollution and ambient air pollution (per 100,000 population)
0.2 • ••Traffic deaths rate (per 100,000 population) 5.4 • 5Healthy Life Expectancy at birth (years) 82.8 • 5Adolescent fertility rate (births per 1,000 women ages 15-19) 13.3 • 5Births attended by skilled health personnel (%) 99.3 • ••Surviving infants who received 2 WHO-recommended vaccines (%) 94.0 • 5Universal Health Coverage Tracer Index (0-100) 82.2 • 5Subjective Wellbeing (average ladder score, 0-10) 7.3 • 5Gap in life expectancy at birth among regions (years) 6.3 • ••Gap in self-reported health by income (0-100) 8.3 • ••Daily smokers (% population age 15+) 12.4 • 5
SDG4 – Quality Education Net primary enrolment rate (%) 96.7 • DMean years of schooling 13.2 • 5Literacy rate of 15-24 year olds, both sexes (%) NA • ••Population age 25-64 with tertiary education (%) 43.7 • 5PISA score (0-600) 502.3 • ••Variation in science performance explained by students’ socio-economic
status (%)11.7 • ••
Students performing below level 2 in science (%) 17.6 • pResilient students (%) 32.9 • ••SDG5 – Gender Equality Unmet demand for contraception, estimated (% women married or in
union, ages 15-49 )14.0 • 5
Female to male mean years of schooling, population age 25 + (%) 103.1 • ••Female to male labour force participation rate (%) 84.0 • 5Seats held by women in national parliaments (%) 28.7 • DGender wage gap (total, % male median wage) 14.3 • pSDG6 – Clean Water and Sanitation
High-income countries: population using safely managed water services (%) NA • ••Other countries: population using at least basic drinking water services (%) NA • ••High-income countries: population using safely managed sanitation services (%) 74.2 • DOther countries: population using at least basic sanitation services (%) NA • ••Freshwater withdrawal as % total renewable water resources 5.3 • ••Imported groundwater depletion (m3/year/capita) 4.4 • ••SDG7 – Affordable and Clean Energy Access to electricity (% population) 100.0 • 5Access to clean fuels & technology for cooking (% population) 100.0 • 5CO2 emissions from fuel combustion / electricity output (MtCO2/TWh) 1.6 • DShare of renewable energy in total final energy consumption (%) 9.2 • D
SDG8 – Decent Work and Economic Growth Adjusted Growth (%) -1.3 • ••Slavery score (0-100) 100.0 • ••Adults (15 years +) with an account at a bank or other financial
institution or with a mobile-money-service provider (%)99.5 • 5
Employment-to-Population ratio (%) 73.0 • 5Youth not in employment, education or training (NEET) (%) 11.4 • pSDG9 – Industry, Innovation and Infrastructure Proportion of the population using the internet (%) 88.2 • LMobile broadband subscriptions (per 100 inhabitants) 130.7 • L
AUSTRALIA
Quality of overall infrastructure (1= extremely underdeveloped; 7= extensive and efficient by international standards)
4.7 • 5
Logistics performance index: Quality of trade and transport-related infrastructure (1=low to 5=high)
3.8 • ••
The Times Higher Education Universities Ranking, Average score of top 3 universities (0-100)
72.3 • ••
Number of scientific and technical journal articles (per 1,000 population) 2.1 • ••Research and development expenditure (% GDP) 2.2 • ••Research and development researchers (per 1,000 employed) 9.0 • ••Triadic patent families filed (per million population) 13.8 • pGap in internet access by income (%) 57.0 • ••Women in science and engineering (%) 27.6 • ••SDG10 – Reduced Inequalities Gini Coefficient adjusted for top income (1-100) 35.7 • ••Palma ratio 1.3 • pElderly Poverty Rate (%) 25.7 • ••SDG11 – Sustainable Cities and Communities Annual mean concentration of particulate matter of less than
2.5 microns of diameter (PM2.5) in urban areas (μg/m3)5.9 • 5
Improved water source, piped (% urban population with access) 92.4 • DSatisfaction with public transport (%) 59.0 • 5Rent overburden rate (%) 10.0 • ••SDG12 – Responsible Consumption and Production E-waste generated (kg/capita) 20.0 • ••Anthropogenic wastewater that receives treatment (%) 95.0 • ••Production-based SO2 emissions (kg/capita) 65.4 • ••Net imported SO2 emissions (kg/capita) -16.8 • ••Reactive nitrogen production footprint (kg/capita) 86.5 • ••Net imported emissions of reactive nitrogen (kg/capita) -534.3 • ••Non-Recycled Municipal Solid Waste (MSW in kg/person/day) 1.3 • ••SDG13 – Climate Action Energy-related CO2 emissions per capita (tCO2/capita) 15.4 • DImported CO2 emissions, technology-adjusted (tCO2/capita) 3.2 • ••Climate Change Vulnerability Monitor (best 0-1 worst) 0.2 • ••CO2 emissions embodied in fossil fuel exports (kg/capita) 43996.4 • ••Effective Carbon Rate from all non-road energy, excluding emissions
from biomass (€/tCO2)2.6 • ••
SDG14 – Life Below Water Mean area that is protected in marine sites important to biodiversity (%) 68.2 • ••Ocean Health Index Goal-Biodiversity (0-100) 93.9 • 5Ocean Health Index Goal-Clean Waters (0-100) 81.4 • 5Ocean Health Index Goal-Fisheries (0-100) 41.3 • pFish Stocks overexploited or collapsed by EEZ (%) 75.4 • ••Fish caught by trawling (%) 28.3 • D
SDG15 – Life on Land Mean area that is protected in terrestrial sites important to biodiversity (%) 53.2 • 5Mean area that is protected in freshwater sites important to biodiversity (%) 34.8 • 5Red List Index of species survival (0-1) 0.8 • pAnnual change in forest area (%) 9.4 • ••Imported biodiversity threats (threats per million population) 30.6 • ••SDG16 – Peace, Justice and Strong Institutions Homicides (per 100,000 population) 1.0 • ••Prison population (per 100,000 population) 150.8 • ••Population who feel safe walking alone at night in city or area where they live (%) 62.0 • pGovernment Efficiency (1-7) 4.2 • pProperty Rights (1-7) 5.8 • 5Birth registrations with civil authority, children under 5 years of age (%) 100.0 • ••Corruption Perception Index (0-100) 77.0 • 5Children 5–14 years old involved in child labour (%) 0.0 • ••Transfers of major conventional weapons (exports)
(constant 1990 US$ million per 100,000 population)0.3 • ••
SDG17 – Partnerships for the Goals Government Health and Education spending (% GDP) 14.6 • LHigh-income and all OECD DAC countries: International concessional
public finance, including official development assistance (% GNI)0.2 • p
Other countries: Tax revenue (% GDP) NA • ••Tax Haven Score (best 0-5 worst) 0.0 • ••Financial Secrecy Score (best 0-100 worst) 51.2 • ••
Value Rating Trend

SDG Index and Dashboards Report 2018 Global Responsibilities82
AVERAGE PERFORMANCE BY SDG
Notes: The full title of Goal 2 “Zero Hunger” is “End hunger, achieve food security and improved nutrition and promote sustainable agriculture”. The full title of each SDG is available here: https://sustainabledevelopment.un.org/topics/sustainabledevelopmentgoals
OVERALL PERFORMANCE
SDG Global rank
111 (OF 156)
East and South AsiaBANGLADESH
SDG TRENDS
L D D •• D •• D 5 D
•• 5 •• 5 5 p 5 5
59.3 64.1
CURRENT ASSESSMENT – SDG DASHBOARD
100
75
50
25
SDG
1SDG
17SDG
16
SDG
15
SDG
14
SDG
13
12
SDG
11SDG
10 SDG
9
SDG
8
SDG
7
SDG
6
SDG
5
SDG
4
SDG
3
SDG
2
Bangladesh
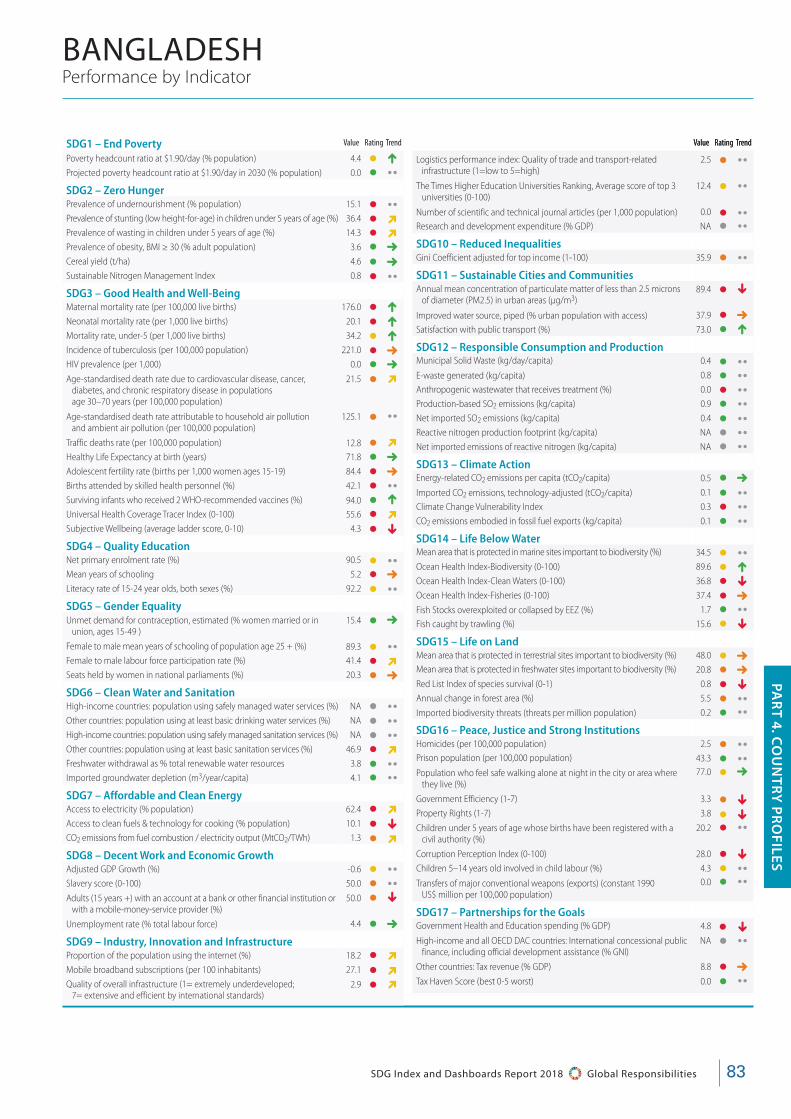
83SDG Index and Dashboards Report 2018 Global Responsibilities
PAR
T 4. CO
UN
TRY
PR
OFILES
Performance by Indicator
Value Rating Trend
BANGLADESH
Logistics performance index: Quality of trade and transport-related infrastructure (1=low to 5=high)
2.5 • ••
The Times Higher Education Universities Ranking, Average score of top 3 universities (0-100)
12.4 • ••
Number of scientific and technical journal articles (per 1,000 population) 0.0 • ••Research and development expenditure (% GDP) NA • ••SDG10 – Reduced Inequalities Gini Coefficient adjusted for top income (1-100) 35.9 • ••SDG11 – Sustainable Cities and Communities
Annual mean concentration of particulate matter of less than 2.5 microns of diameter (PM2.5) in urban areas (μg/m3)
89.4 • p
Improved water source, piped (% urban population with access) 37.9 • 5Satisfaction with public transport (%) 73.0 • L
SDG12 – Responsible Consumption and Production Municipal Solid Waste (kg/day/capita) 0.4 • ••E-waste generated (kg/capita) 0.8 • ••Anthropogenic wastewater that receives treatment (%) 0.0 • ••Production-based SO2 emissions (kg/capita) 0.9 • ••Net imported SO2 emissions (kg/capita) 0.4 • ••Reactive nitrogen production footprint (kg/capita) NA • ••Net imported emissions of reactive nitrogen (kg/capita) NA • ••SDG13 – Climate Action
Energy-related CO2 emissions per capita (tCO2/capita) 0.5 • 5Imported CO2 emissions, technology-adjusted (tCO2/capita) 0.1 • ••Climate Change Vulnerability Index 0.3 • ••CO2 emissions embodied in fossil fuel exports (kg/capita) 0.1 • ••SDG14 – Life Below Water
Mean area that is protected in marine sites important to biodiversity (%) 34.5 • ••Ocean Health Index-Biodiversity (0-100) 89.6 • LOcean Health Index-Clean Waters (0-100) 36.8 • pOcean Health Index-Fisheries (0-100) 37.4 • 5Fish Stocks overexploited or collapsed by EEZ (%) 1.7 • ••Fish caught by trawling (%) 15.6 • p
SDG15 – Life on Land Mean area that is protected in terrestrial sites important to biodiversity (%) 48.0 • 5Mean area that is protected in freshwater sites important to biodiversity (%) 20.8 • 5Red List Index of species survival (0-1) 0.8 • pAnnual change in forest area (%) 5.5 • ••Imported biodiversity threats (threats per million population) 0.2 • ••SDG16 – Peace, Justice and Strong Institutions
Homicides (per 100,000 population) 2.5 • ••Prison population (per 100,000 population) 43.3 • ••Population who feel safe walking alone at night in the city or area where
they live (%)77.0 • 5
Government Efficiency (1-7) 3.3 • pProperty Rights (1-7) 3.8 • pChildren under 5 years of age whose births have been registered with a
civil authority (%)20.2 • ••
Corruption Perception Index (0-100) 28.0 • pChildren 5–14 years old involved in child labour (%) 4.3 • ••Transfers of major conventional weapons (exports) (constant 1990
US$ million per 100,000 population)0.0 • ••
SDG17 – Partnerships for the Goals
Government Health and Education spending (% GDP) 4.8 • pHigh-income and all OECD DAC countries: International concessional public
finance, including official development assistance (% GNI)NA • ••
Other countries: Tax revenue (% GDP) 8.8 • 5Tax Haven Score (best 0-5 worst) 0.0 • ••
SDG1 – End Poverty Poverty headcount ratio at $1.90/day (% population) 4.4 • LProjected poverty headcount ratio at $1.90/day in 2030 (% population) 0.0 • ••SDG2 – Zero Hunger
Prevalence of undernourishment (% population) 15.1 • ••Prevalence of stunting (low height-for-age) in children under 5 years of age (%) 36.4 • DPrevalence of wasting in children under 5 years of age (%) 14.3 • DPrevalence of obesity, BMI ≥ 30 (% adult population) 3.6 • 5Cereal yield (t/ha) 4.6 • 5Sustainable Nitrogen Management Index 0.8 • ••SDG3 – Good Health and Well-Being
Maternal mortality rate (per 100,000 live births) 176.0 • LNeonatal mortality rate (per 1,000 live births) 20.1 • LMortality rate, under-5 (per 1,000 live births) 34.2 • LIncidence of tuberculosis (per 100,000 population) 221.0 • 5HIV prevalence (per 1,000) 0.0 • 5Age-standardised death rate due to cardiovascular disease, cancer,
diabetes, and chronic respiratory disease in populations age 30–70 years (per 100,000 population)
21.5 • D
Age-standardised death rate attributable to household air pollution and ambient air pollution (per 100,000 population)
125.1 • ••
Traffic deaths rate (per 100,000 population) 12.8 • DHealthy Life Expectancy at birth (years) 71.8 • 5Adolescent fertility rate (births per 1,000 women ages 15-19) 84.4 • 5Births attended by skilled health personnel (%) 42.1 • ••Surviving infants who received 2 WHO-recommended vaccines (%) 94.0 • LUniversal Health Coverage Tracer Index (0-100) 55.6 • DSubjective Wellbeing (average ladder score, 0-10) 4.3 • p
SDG4 – Quality Education
Net primary enrolment rate (%) 90.5 • ••Mean years of schooling 5.2 • 5Literacy rate of 15-24 year olds, both sexes (%) 92.2 • ••SDG5 – Gender Equality
Unmet demand for contraception, estimated (% women married or in union, ages 15-49 )
15.4 • 5
Female to male mean years of schooling of population age 25 + (%) 89.3 • ••Female to male labour force participation rate (%) 41.4 • DSeats held by women in national parliaments (%) 20.3 • 5
SDG6 – Clean Water and Sanitation
High-income countries: population using safely managed water services (%) NA • ••Other countries: population using at least basic drinking water services (%) NA • ••High-income countries: population using safely managed sanitation services (%) NA • ••Other countries: population using at least basic sanitation services (%) 46.9 • DFreshwater withdrawal as % total renewable water resources 3.8 • ••Imported groundwater depletion (m3/year/capita) 4.1 • ••SDG7 – Affordable and Clean Energy
Access to electricity (% population) 62.4 • DAccess to clean fuels & technology for cooking (% population) 10.1 • pCO2 emissions from fuel combustion / electricity output (MtCO2/TWh) 1.3 • D
SDG8 – Decent Work and Economic Growth
Adjusted GDP Growth (%) -0.6 • ••Slavery score (0-100) 50.0 • ••Adults (15 years +) with an account at a bank or other financial institution or
with a mobile-money-service provider (%)50.0 • p
Unemployment rate (% total labour force) 4.4 • 5
SDG9 – Industry, Innovation and Infrastructure
Proportion of the population using the internet (%) 18.2 • DMobile broadband subscriptions (per 100 inhabitants) 27.1 • DQuality of overall infrastructure (1= extremely underdeveloped;
7= extensive and efficient by international standards)2.9 • D
Value Rating Trend Value Rating Trend
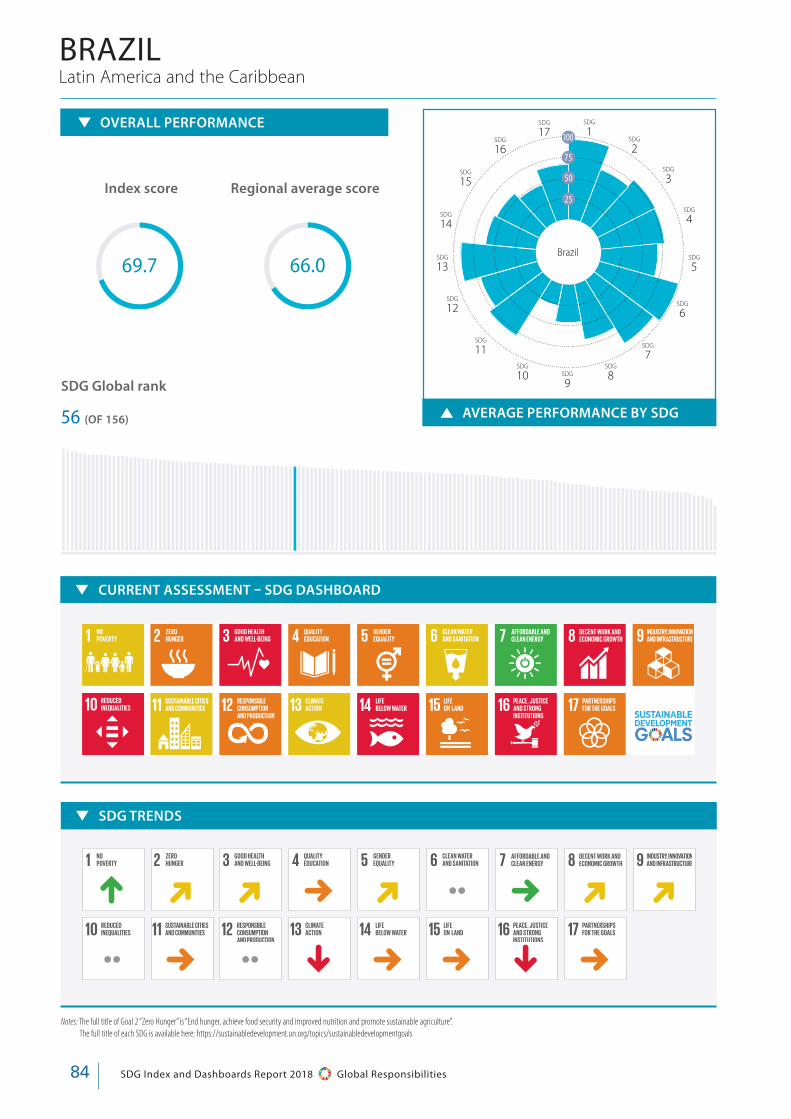
SDG Index and Dashboards Report 2018 Global Responsibilities84
AVERAGE PERFORMANCE BY SDG
Notes: The full title of Goal 2 “Zero Hunger” is “End hunger, achieve food security and improved nutrition and promote sustainable agriculture”. The full title of each SDG is available here: https://sustainabledevelopment.un.org/topics/sustainabledevelopmentgoals
OVERALL PERFORMANCE
Index score Regional average score
SDG Global rank
56 (OF 156)
Latin America and the CaribbeanBRAZIL
SDG TRENDS
L D D 5 D •• 5 D D
•• 5 •• p 5 5 p 5
66.069.7
CURRENT ASSESSMENT – SDG DASHBOARD
100
75
50
25
SDG
1SDG
17SDG
16
SDG
15
SDG
14
SDG
13
SDG
12
SDG
11SDG
10 SDG
9
SDG
8
SDG
7
SDG
6
SDG
5
SDG
4
SDG
3
SDG
2
Brazil

85SDG Index and Dashboards Report 2018 Global Responsibilities
PAR
T 4. CO
UN
TRY
PR
OFILES
Performance by Indicator
Value Rating Trend
BRAZIL
Logistics performance index: Quality of trade and transport-related infrastructure (1=low to 5=high)
3.1 • ••
The Times Higher Education Universities Ranking, Average score of top 3 universities (0-100)
39.0 • ••
Number of scientific and technical journal articles (per 1,000 population) 0.3 • ••Research and development expenditure (% GDP) 1.2 • ••SDG10 – Reduced Inequalities Gini Coefficient adjusted for top income (1-100) 53.9 • ••SDG11 – Sustainable Cities and Communities
Annual mean concentration of particulate matter of less than 2.5 microns of diameter (PM2.5) in urban areas (μg/m3)
11.4 • p
Improved water source, piped (% urban population with access) 99.0 • LSatisfaction with public transport (%) 49.0 • p
SDG12 – Responsible Consumption and Production Municipal Solid Waste (kg/day/capita) 1.0 • ••E-waste generated (kg/capita) 7.0 • ••Anthropogenic wastewater that receives treatment (%) 17.5 • ••Production-based SO2 emissions (kg/capita) 8.0 • ••Net imported SO2 emissions (kg/capita) 0.1 • ••Reactive nitrogen production footprint (kg/capita) 52.6 • ••Net imported emissions of reactive nitrogen (kg/capita) -9.2 • ••SDG13 – Climate Action
Energy-related CO2 emissions per capita (tCO2/capita) 2.6 • pImported CO2 emissions, technology-adjusted (tCO2/capita) 0.4 • ••Climate Change Vulnerability Index 0.1 • ••CO2 emissions embodied in fossil fuel exports (kg/capita) 530.8 • ••SDG14 – Life Below Water
Mean area that is protected in marine sites important to biodiversity (%) 57.4 • ••Ocean Health Index-Biodiversity (0-100) 94.8 • 5Ocean Health Index-Clean Waters (0-100) 59.8 • pOcean Health Index-Fisheries (0-100) 48.2 • pFish Stocks overexploited or collapsed by EEZ (%) 33.7 • ••Fish caught by trawling (%) 17.5 • p
SDG15 – Life on Land Mean area that is protected in terrestrial sites important to biodiversity (%) 47.4 • 5Mean area that is protected in freshwater sites important to biodiversity (%) 15.6 • 5Red List Index of species survival (0-1) 0.9 • 5Annual change in forest area (%) 8.9 • ••Imported biodiversity threats (threats per million population) 0.9 • ••SDG16 – Peace, Justice and Strong Institutions
Homicides (per 100,000 population) 26.7 • ••Prison population (per 100,000 population) 299.4 • ••Population who feel safe walking alone at night in the city or area where
they live (%)31.0 • p
Government Efficiency (1-7) 2.4 • pProperty Rights (1-7) 4.3 • pChildren under 5 years of age whose births have been registered with a
civil authority (%)96.4 • ••
Corruption Perception Index (0-100) 37.0 • pChildren 5–14 years old involved in child labour (%) 6.6 • ••Transfers of major conventional weapons (exports) (constant 1990
US$ million per 100,000 population)0.0 • ••
SDG17 – Partnerships for the Goals
Government Health and Education spending (% GDP) 14.5 • LHigh-income and all OECD DAC countries: International concessional public
finance, including official development assistance (% GNI)NA • ••
Other countries: Tax revenue (% GDP) 12.8 • pTax Haven Score (best 0-5 worst) 0.0 • ••
SDG1 – End Poverty Poverty headcount ratio at $1.90/day (% population) 2.9 • LProjected poverty headcount ratio at $1.90/day in 2030 (% population) 1.6 • ••SDG2 – Zero Hunger
Prevalence of undernourishment (% population) 2.5 • ••Prevalence of stunting (low height-for-age) in children under 5 years of age (%) 7.1 • 5Prevalence of wasting in children under 5 years of age (%) 1.6 • 5Prevalence of obesity, BMI ≥ 30 (% adult population) 22.1 • pCereal yield (t/ha) 4.2 • 5Sustainable Nitrogen Management Index 0.6 • ••SDG3 – Good Health and Well-Being
Maternal mortality rate (per 100,000 live births) 44.0 • 5Neonatal mortality rate (per 1,000 live births) 7.8 • 5Mortality rate, under-5 (per 1,000 live births) 15.1 • 5Incidence of tuberculosis (per 100,000 population) 42.0 • 5HIV prevalence (per 1,000) 0.2 • 5Age-standardised death rate due to cardiovascular disease, cancer,
diabetes, and chronic respiratory disease in populations age 30–70 years (per 100,000 population)
16.9 • L
Age-standardised death rate attributable to household air pollution and ambient air pollution (per 100,000 population)
24.0 • ••
Traffic deaths rate (per 100,000 population) 22.6 • pHealthy Life Expectancy at birth (years) 75.0 • 5Adolescent fertility rate (births per 1,000 women ages 15-19) 62.7 • 5Births attended by skilled health personnel (%) 99.1 • ••Surviving infants who received 2 WHO-recommended vaccines (%) 86.0 • 5Universal Health Coverage Tracer Index (0-100) 62.4 • 5Subjective Wellbeing (average ladder score, 0-10) 6.3 • 5
SDG4 – Quality Education
Net primary enrolment rate (%) 92.7 • pMean years of schooling 7.8 • DLiteracy rate of 15-24 year olds, both sexes (%) 98.8 • ••SDG5 – Gender Equality
Unmet demand for contraception, estimated (% women married or in union, ages 15-49 )
8.1 • 5
Female to male mean years of schooling of population age 25 + (%) 108.0 • ••Female to male labour force participation rate (%) 71.2 • 5Seats held by women in national parliaments (%) 10.7 • 5
SDG6 – Clean Water and Sanitation
High-income countries: population using safely managed water services (%) NA • ••Other countries: population using at least basic drinking water services (%) 97.5 • LHigh-income countries: population using safely managed sanitation services (%) NA • ••Other countries: population using at least basic sanitation services (%) NA • ••Freshwater withdrawal as % total renewable water resources 1.3 • ••Imported groundwater depletion (m3/year/capita) 0.5 • ••SDG7 – Affordable and Clean Energy
Access to electricity (% population) 99.7 • 5Access to clean fuels & technology for cooking (% population) 93.1 • 5CO2 emissions from fuel combustion / electricity output (MtCO2/TWh) 0.8 • 5
SDG8 – Decent Work and Economic Growth
Adjusted GDP Growth (%) -4.6 • ••Slavery score (0-100) 100.0 • ••Adults (15 years +) with an account at a bank or other financial institution or
with a mobile-money-service provider (%)70.0 • L
Unemployment rate (% total labour force) 12.9 • 5
SDG9 – Industry, Innovation and Infrastructure
Proportion of the population using the internet (%) 60.9 • LMobile broadband subscriptions (per 100 inhabitants) 88.5 • LQuality of overall infrastructure (1= extremely underdeveloped;
7= extensive and efficient by international standards)3.1 • p
Value Rating Trend Value Rating Trend

Notes: The full title of Goal 2 “Zero Hunger” is “End hunger, achieve food security and improved nutrition and promote sustainable agriculture”. The full title of each SDG is available here: https://sustainabledevelopment.un.org/topics/sustainabledevelopmentgoals
SDG Index and Dashboards Report 2018 Global Responsibilities86
AVERAGE PERFORMANCE BY SDG
OECD Countries
OVERALL PERFORMANCE
Index score Regional average score
SDG Global rank
20 (OF 156)
CANADA
76.8 76.9
CURRENT ASSESSMENT – SDG DASHBOARD
SDG TRENDS
5 D L 5 D •• 5 D D
p •• •• 5 5 5 L ••
100
75
50
25
SDG
1SDG
17SDG
16
SDG
15
SDG
14
SDG
13
SDG
12
SDG
11SDG
10 SDG
9
SDG
8
SDG
7
SDG
6
SDG
5
SDG
4
SDG
3
SDG
2
Canada
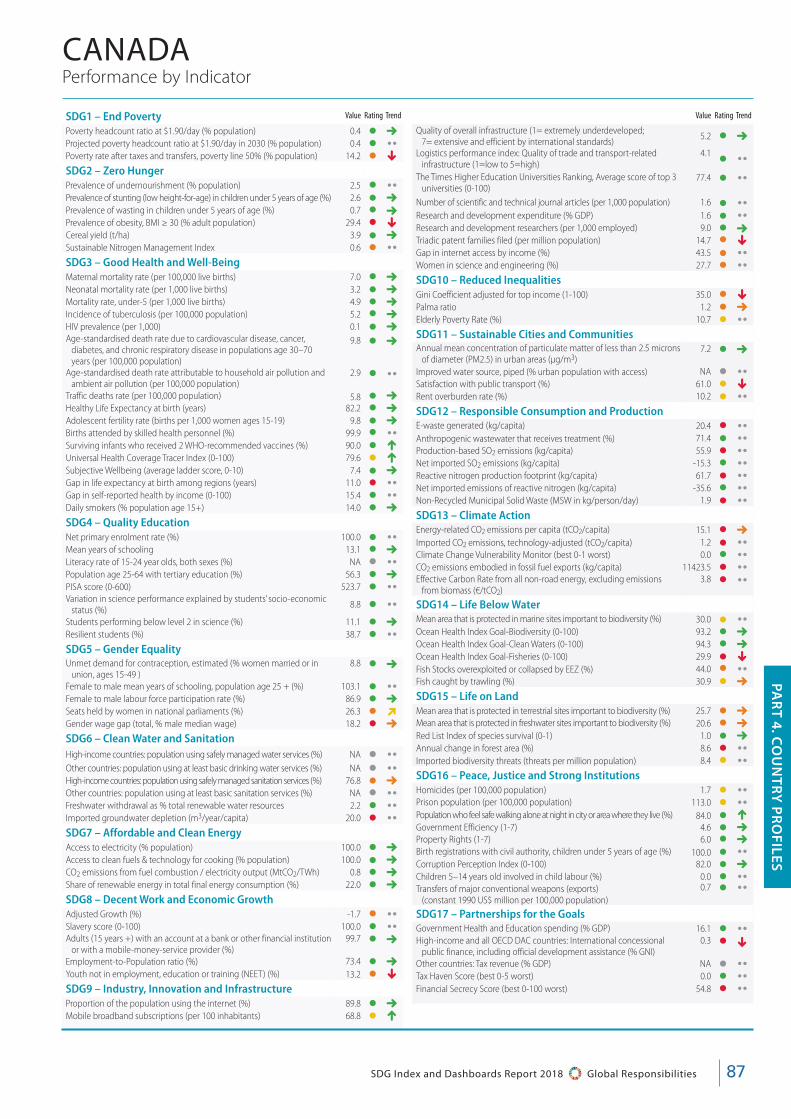
Performance by Indicator
Value Rating Trend
87SDG Index and Dashboards Report 2018 Global Responsibilities
PAR
T 4. CO
UN
TRY
PR
OFILES
CANADA
SDG1 – End Poverty
Poverty headcount ratio at $1.90/day (% population) 0.4 • 5Projected poverty headcount ratio at $1.90/day in 2030 (% population) 0.4 • ••Poverty rate after taxes and transfers, poverty line 50% (% population) 14.2 • pSDG2 – Zero Hunger Prevalence of undernourishment (% population) 2.5 • ••Prevalence of stunting (low height-for-age) in children under 5 years of age (%) 2.6 • 5Prevalence of wasting in children under 5 years of age (%) 0.7 • 5Prevalence of obesity, BMI ≥ 30 (% adult population) 29.4 • pCereal yield (t/ha) 3.9 • 5Sustainable Nitrogen Management Index 0.6 • ••SDG3 – Good Health and Well-Being Maternal mortality rate (per 100,000 live births) 7.0 • 5Neonatal mortality rate (per 1,000 live births) 3.2 • 5Mortality rate, under-5 (per 1,000 live births) 4.9 • 5Incidence of tuberculosis (per 100,000 population) 5.2 • 5HIV prevalence (per 1,000) 0.1 • 5Age-standardised death rate due to cardiovascular disease, cancer,
diabetes, and chronic respiratory disease in populations age 30–70 years (per 100,000 population)
9.8 • 5
Age-standardised death rate attributable to household air pollution and ambient air pollution (per 100,000 population)
2.9 • ••Traffic deaths rate (per 100,000 population) 5.8 • 5Healthy Life Expectancy at birth (years) 82.2 • 5Adolescent fertility rate (births per 1,000 women ages 15-19) 9.8 • 5Births attended by skilled health personnel (%) 99.9 • ••Surviving infants who received 2 WHO-recommended vaccines (%) 90.0 • LUniversal Health Coverage Tracer Index (0-100) 79.6 • LSubjective Wellbeing (average ladder score, 0-10) 7.4 • 5Gap in life expectancy at birth among regions (years) 11.0 • ••Gap in self-reported health by income (0-100) 15.4 • ••Daily smokers (% population age 15+) 14.0 • 5
SDG4 – Quality Education Net primary enrolment rate (%) 100.0 • ••Mean years of schooling 13.1 • 5Literacy rate of 15-24 year olds, both sexes (%) NA • ••Population age 25-64 with tertiary education (%) 56.3 • 5PISA score (0-600) 523.7 • ••Variation in science performance explained by students’ socio-economic
status (%)8.8 • ••
Students performing below level 2 in science (%) 11.1 • 5Resilient students (%) 38.7 • ••SDG5 – Gender Equality Unmet demand for contraception, estimated (% women married or in
union, ages 15-49 )8.8 • 5
Female to male mean years of schooling, population age 25 + (%) 103.1 • ••Female to male labour force participation rate (%) 86.9 • 5Seats held by women in national parliaments (%) 26.3 • DGender wage gap (total, % male median wage) 18.2 • 5
SDG6 – Clean Water and Sanitation
High-income countries: population using safely managed water services (%) NA • ••Other countries: population using at least basic drinking water services (%) NA • ••High-income countries: population using safely managed sanitation services (%) 76.8 • 5Other countries: population using at least basic sanitation services (%) NA • ••Freshwater withdrawal as % total renewable water resources 2.2 • ••Imported groundwater depletion (m3/year/capita) 20.0 • ••SDG7 – Affordable and Clean Energy Access to electricity (% population) 100.0 • 5Access to clean fuels & technology for cooking (% population) 100.0 • 5CO2 emissions from fuel combustion / electricity output (MtCO2/TWh) 0.8 • 5Share of renewable energy in total final energy consumption (%) 22.0 • 5
SDG8 – Decent Work and Economic Growth Adjusted Growth (%) -1.7 • ••Slavery score (0-100) 100.0 • ••Adults (15 years +) with an account at a bank or other financial institution
or with a mobile-money-service provider (%)99.7 • 5
Employment-to-Population ratio (%) 73.4 • 5Youth not in employment, education or training (NEET) (%) 13.2 • pSDG9 – Industry, Innovation and Infrastructure Proportion of the population using the internet (%) 89.8 • 5Mobile broadband subscriptions (per 100 inhabitants) 68.8 • L
Quality of overall infrastructure (1= extremely underdeveloped; 7= extensive and efficient by international standards)
5.2 • 5
Logistics performance index: Quality of trade and transport-related infrastructure (1=low to 5=high)
4.1 • ••The Times Higher Education Universities Ranking, Average score of top 3
universities (0-100)77.4 • ••
Number of scientific and technical journal articles (per 1,000 population) 1.6 • ••Research and development expenditure (% GDP) 1.6 • ••Research and development researchers (per 1,000 employed) 9.0 • 5Triadic patent families filed (per million population) 14.7 • pGap in internet access by income (%) 43.5 • ••Women in science and engineering (%) 27.7 • ••SDG10 – Reduced Inequalities Gini Coefficient adjusted for top income (1-100) 35.0 • pPalma ratio 1.2 • 5Elderly Poverty Rate (%) 10.7 • ••SDG11 – Sustainable Cities and Communities Annual mean concentration of particulate matter of less than 2.5 microns
of diameter (PM2.5) in urban areas (μg/m3)7.2 • 5
Improved water source, piped (% urban population with access) NA • ••Satisfaction with public transport (%) 61.0 • pRent overburden rate (%) 10.2 • ••SDG12 – Responsible Consumption and Production E-waste generated (kg/capita) 20.4 • ••Anthropogenic wastewater that receives treatment (%) 71.4 • ••Production-based SO2 emissions (kg/capita) 55.9 • ••Net imported SO2 emissions (kg/capita) -15.3 • ••Reactive nitrogen production footprint (kg/capita) 61.7 • ••Net imported emissions of reactive nitrogen (kg/capita) -35.6 • ••Non-Recycled Municipal Solid Waste (MSW in kg/person/day) 1.9 • ••SDG13 – Climate Action Energy-related CO2 emissions per capita (tCO2/capita) 15.1 • 5Imported CO2 emissions, technology-adjusted (tCO2/capita) 1.2 • ••Climate Change Vulnerability Monitor (best 0-1 worst) 0.0 • ••CO2 emissions embodied in fossil fuel exports (kg/capita) 11423.5 • ••Effective Carbon Rate from all non-road energy, excluding emissions
from biomass (€/tCO2)3.8 • ••
SDG14 – Life Below Water Mean area that is protected in marine sites important to biodiversity (%) 30.0 • ••Ocean Health Index Goal-Biodiversity (0-100) 93.2 • 5Ocean Health Index Goal-Clean Waters (0-100) 94.3 • 5Ocean Health Index Goal-Fisheries (0-100) 29.9 • pFish Stocks overexploited or collapsed by EEZ (%) 44.0 • ••Fish caught by trawling (%) 30.9 • 5
SDG15 – Life on Land Mean area that is protected in terrestrial sites important to biodiversity (%) 25.7 • 5Mean area that is protected in freshwater sites important to biodiversity (%) 20.6 • 5Red List Index of species survival (0-1) 1.0 • 5Annual change in forest area (%) 8.6 • ••Imported biodiversity threats (threats per million population) 8.4 • ••SDG16 – Peace, Justice and Strong Institutions Homicides (per 100,000 population) 1.7 • ••Prison population (per 100,000 population) 113.0 • ••Population who feel safe walking alone at night in city or area where they live (%) 84.0 • LGovernment Efficiency (1-7) 4.6 • 5Property Rights (1-7) 6.0 • 5Birth registrations with civil authority, children under 5 years of age (%) 100.0 • ••Corruption Perception Index (0-100) 82.0 • 5Children 5–14 years old involved in child labour (%) 0.0 • ••Transfers of major conventional weapons (exports)
(constant 1990 US$ million per 100,000 population)0.7 • ••
SDG17 – Partnerships for the Goals Government Health and Education spending (% GDP) 16.1 • ••High-income and all OECD DAC countries: International concessional
public finance, including official development assistance (% GNI)0.3 • p
Other countries: Tax revenue (% GDP) NA • ••Tax Haven Score (best 0-5 worst) 0.0 • ••Financial Secrecy Score (best 0-100 worst) 54.8 • ••
Value Rating Trend

SDG Index and Dashboards Report 2018 Global Responsibilities88
AVERAGE PERFORMANCE BY SDG
Notes: The full title of Goal 2 “Zero Hunger” is “End hunger, achieve food security and improved nutrition and promote sustainable agriculture”. The full title of each SDG is available here: https://sustainabledevelopment.un.org/topics/sustainabledevelopmentgoals
OVERALL PERFORMANCE
Index score Regional average score
SDG Global rank
54 (OF 156)
East and South AsiaCHINA
SDG TRENDS
L L D •• D •• D L L
•• 5 •• p 5 5 p ••
70.1 64.1
CURRENT ASSESSMENT – SDG DASHBOARD
100
75
50
25
SDG
1SDG
17SDG
16
SDG
15
SDG
14
SDG
13
SDG
12
SDG
11SDG
10 SDG
9
SDG
8
SDG
7
SDG
6
SDG
5
SDG
4
SDG
3
SDG
2
China

89SDG Index and Dashboards Report 2018 Global Responsibilities
PAR
T 4. CO
UN
TRY
PR
OFILES
Performance by Indicator
Value Rating Trend
CHINA
Logistics performance index: Quality of trade and transport-related infrastructure (1=low to 5=high)
3.8 • ••
The Times Higher Education Universities Ranking, Average score of top 3 universities (0-100)
72.4 • ••
Number of scientific and technical journal articles (per 1,000 population) 0.3 • ••Research and development expenditure (% GDP) 2.1 • ••SDG10 – Reduced Inequalities Gini Coefficient adjusted for top income (1-100) 41.9 • ••SDG11 – Sustainable Cities and Communities
Annual mean concentration of particulate matter of less than 2.5 microns of diameter (PM2.5) in urban areas (μg/m3)
58.4 • 5
Improved water source, piped (% urban population with access) 90.0 • 5Satisfaction with public transport (%) 72.0 • L
SDG12 – Responsible Consumption and Production Municipal Solid Waste (kg/day/capita) 1.0 • ••E-waste generated (kg/capita) 4.4 • ••Anthropogenic wastewater that receives treatment (%) 16.1 • ••Production-based SO2 emissions (kg/capita) 25.5 • ••Net imported SO2 emissions (kg/capita) -5.7 • ••Reactive nitrogen production footprint (kg/capita) 22.8 • ••Net imported emissions of reactive nitrogen (kg/capita) -12.5 • ••SDG13 – Climate Action
Energy-related CO2 emissions per capita (tCO2/capita) 7.5 • pImported CO2 emissions, technology-adjusted (tCO2/capita) -0.8 • ••Climate Change Vulnerability Index 0.3 • ••CO2 emissions embodied in fossil fuel exports (kg/capita) 20.6 • ••SDG14 – Life Below Water
Mean area that is protected in marine sites important to biodiversity (%) 18.8 • ••Ocean Health Index-Biodiversity (0-100) 80.1 • pOcean Health Index-Clean Waters (0-100) 34.8 • pOcean Health Index-Fisheries (0-100) 45.4 • DFish Stocks overexploited or collapsed by EEZ (%) 8.6 • ••Fish caught by trawling (%) 60.0 • p
SDG15 – Life on Land Mean area that is protected in terrestrial sites important to biodiversity (%) 52.1 • 5Mean area that is protected in freshwater sites important to biodiversity (%) 41.6 • 5Red List Index of species survival (0-1) 0.8 • pAnnual change in forest area (%) 5.0 • ••Imported biodiversity threats (threats per million population) 0.7 • ••SDG16 – Peace, Justice and Strong Institutions
Homicides (per 100,000 population) 0.7 • ••Prison population (per 100,000 population) 120.5 • ••Population who feel safe walking alone at night in the city or area where
they live (%)80.0 • ••
Government Efficiency (1-7) 4.3 • pProperty Rights (1-7) 4.6 • pChildren under 5 years of age whose births have been registered with a
civil authority (%)NA • ••
Corruption Perception Index (0-100) 41.0 • pChildren 5–14 years old involved in child labour (%) NA • ••Transfers of major conventional weapons (exports) (constant 1990
US$ million per 100,000 population)0.1 • ••
SDG17 – Partnerships for the Goals
Government Health and Education spending (% GDP) NA • ••High-income and all OECD DAC countries: International concessional public
finance, including official development assistance (% GNI)NA • ••
Other countries: Tax revenue (% GDP) 9.4 • pTax Haven Score (best 0-5 worst) 1.0 • ••
SDG1 – End Poverty Poverty headcount ratio at $1.90/day (% population) 0.4 • LProjected poverty headcount ratio at $1.90/day in 2030 (% population) 0.1 • ••SDG2 – Zero Hunger
Prevalence of undernourishment (% population) 9.6 • ••Prevalence of stunting (low height-for-age) in children under 5 years of age (%) 9.4 • LPrevalence of wasting in children under 5 years of age (%) 2.3 • 5Prevalence of obesity, BMI ≥ 30 (% adult population) 6.2 • 5Cereal yield (t/ha) 6.0 • 5Sustainable Nitrogen Management Index 0.8 • ••SDG3 – Good Health and Well-Being
Maternal mortality rate (per 100,000 live births) 27.0 • 5Neonatal mortality rate (per 1,000 live births) 5.1 • 5Mortality rate, under-5 (per 1,000 live births) 9.9 • 5Incidence of tuberculosis (per 100,000 population) 64.0 • DHIV prevalence (per 1,000) 0.0 • 5Age-standardised death rate due to cardiovascular disease, cancer,
diabetes, and chronic respiratory disease in populations age 30–70 years (per 100,000 population)
18.1 • D
Age-standardised death rate attributable to household air pollution and ambient air pollution (per 100,000 population)
169.4 • ••
Traffic deaths rate (per 100,000 population) 19.4 • 5Healthy Life Expectancy at birth (years) 76.1 • 5Adolescent fertility rate (births per 1,000 women ages 15-19) 6.5 • 5Births attended by skilled health personnel (%) 99.9 • ••Surviving infants who received 2 WHO-recommended vaccines (%) 99.0 • 5Universal Health Coverage Tracer Index (0-100) 70.0 • DSubjective Wellbeing (average ladder score, 0-10) 5.1 • L
SDG4 – Quality Education
Net primary enrolment rate (%) NA • ••Mean years of schooling 7.6 • 5Literacy rate of 15-24 year olds, both sexes (%) 99.6 • ••SDG5 – Gender Equality
Unmet demand for contraception, estimated (% women married or in union, ages 15-49 )
4.3 • 5
Female to male mean years of schooling of population age 25 + (%) 91.1 • ••Female to male labour force participation rate (%) 80.8 • 5Seats held by women in national parliaments (%) 24.2 • 5
SDG6 – Clean Water and Sanitation
High-income countries: population using safely managed water services (%) NA • ••Other countries: population using at least basic drinking water services (%) 95.8 • LHigh-income countries: population using safely managed sanitation services (%) NA • ••Other countries: population using at least basic sanitation services (%) NA • ••Freshwater withdrawal as % total renewable water resources 29.9 • ••Imported groundwater depletion (m3/year/capita) 1.6 • ••SDG7 – Affordable and Clean Energy
Access to electricity (% population) 100.0 • 5Access to clean fuels & technology for cooking (% population) 57.2 • DCO2 emissions from fuel combustion / electricity output (MtCO2/TWh) 1.6 • L
SDG8 – Decent Work and Economic Growth
Adjusted GDP Growth (%) 3.1 • ••Slavery score (0-100) 80.0 • ••Adults (15 years +) with an account at a bank or other financial institution or
with a mobile-money-service provider (%)80.2 • L
Unemployment rate (% total labour force) 4.7 • 5
SDG9 – Industry, Innovation and Infrastructure
Proportion of the population using the internet (%) 53.2 • LMobile broadband subscriptions (per 100 inhabitants) 69.4 • LQuality of overall infrastructure (1= extremely underdeveloped;
7= extensive and efficient by international standards)4.5 • L
Value Rating Trend Value Rating Trend
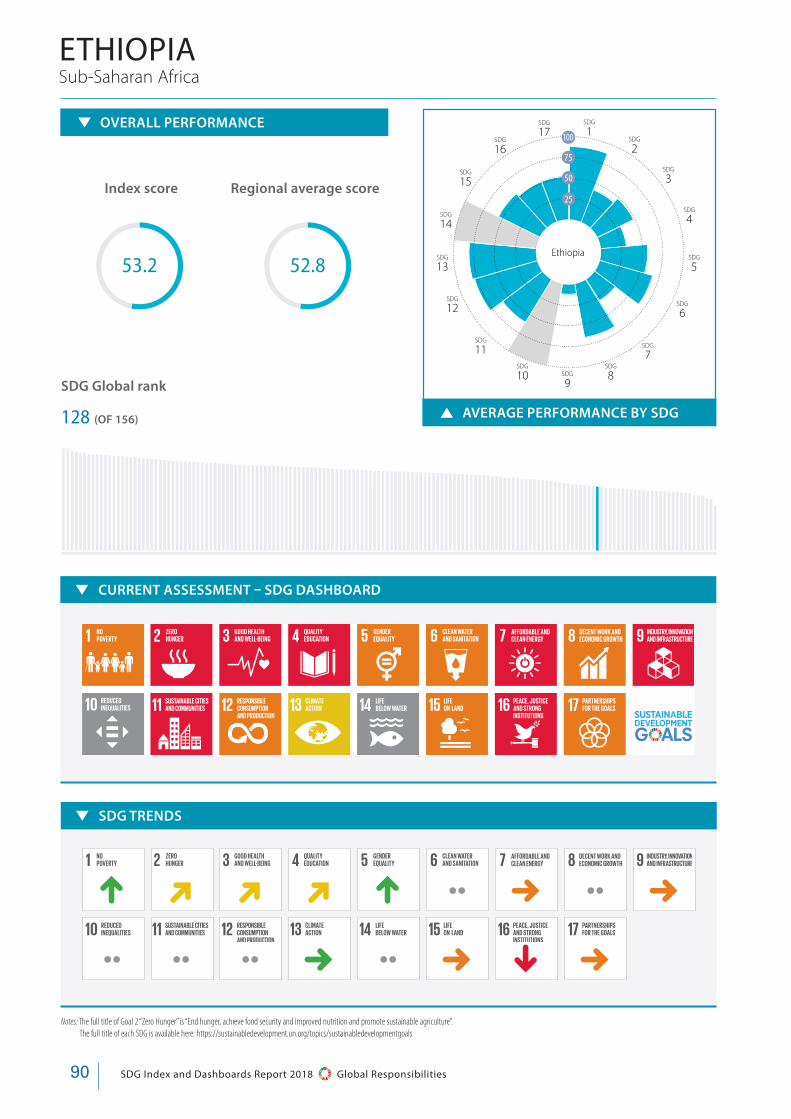
SDG Index and Dashboards Report 2018 Global Responsibilities90
AVERAGE PERFORMANCE BY SDG
Notes: The full title of Goal 2 “Zero Hunger” is “End hunger, achieve food security and improved nutrition and promote sustainable agriculture”. The full title of each SDG is available here: https://sustainabledevelopment.un.org/topics/sustainabledevelopmentgoals
OVERALL PERFORMANCE
Index score Regional average score
SDG Global rank
128 (OF 156)
Sub-Saharan AfricaETHIOPIA
SDG TRENDS
L D D D L •• 5 •• 5
•• •• •• 5 •• 5 p 5
52.853.2
CURRENT ASSESSMENT – SDG DASHBOARD
100
75
50
25
SDG
1SDG
17SDG
16
SDG
15
SDG
14
SDG
13
SDG
12
SDG
11SDG
10 SDG
9
SDG
8
SDG
7
SDG
6
SDG
5
SDG
4
SDG
3
SDG
2
Ethiopia
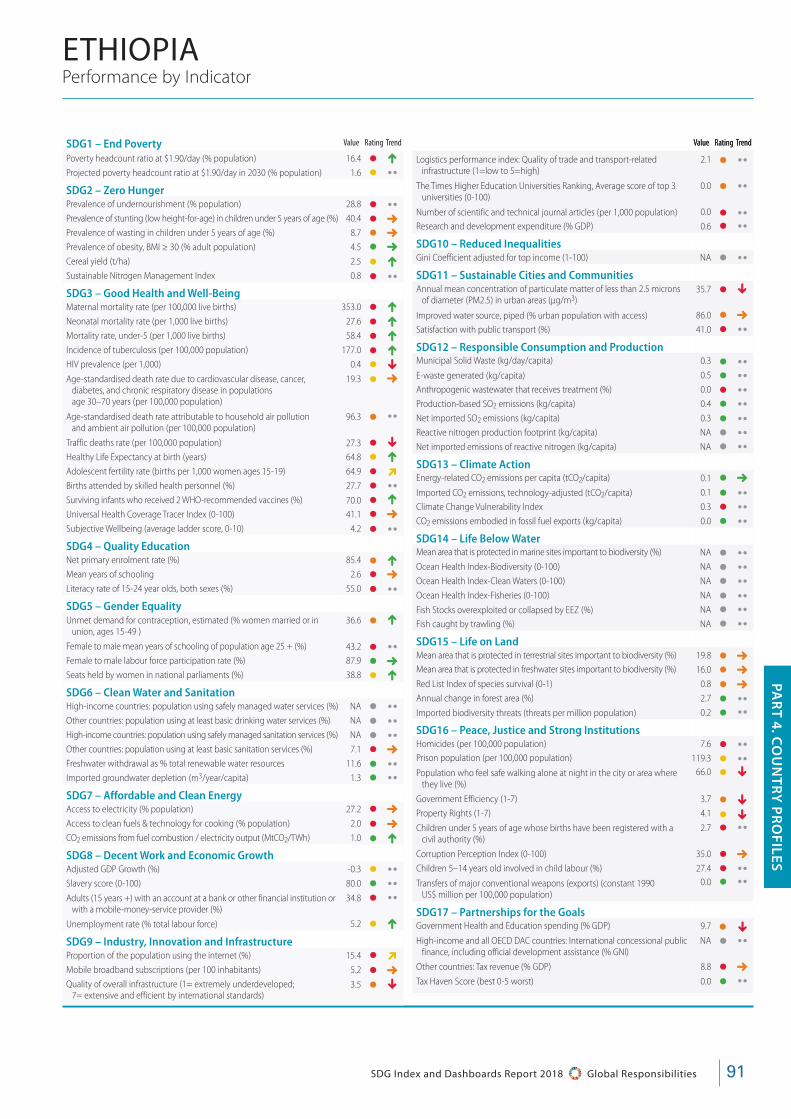
91SDG Index and Dashboards Report 2018 Global Responsibilities
PAR
T 4. CO
UN
TRY
PR
OFILES
Performance by Indicator
Value Rating Trend
ETHIOPIA
Logistics performance index: Quality of trade and transport-related infrastructure (1=low to 5=high)
2.1 • ••
The Times Higher Education Universities Ranking, Average score of top 3 universities (0-100)
0.0 • ••
Number of scientific and technical journal articles (per 1,000 population) 0.0 • ••Research and development expenditure (% GDP) 0.6 • ••SDG10 – Reduced Inequalities Gini Coefficient adjusted for top income (1-100) NA • ••SDG11 – Sustainable Cities and Communities
Annual mean concentration of particulate matter of less than 2.5 microns of diameter (PM2.5) in urban areas (μg/m3)
35.7 • p
Improved water source, piped (% urban population with access) 86.0 • 5Satisfaction with public transport (%) 41.0 • ••SDG12 – Responsible Consumption and Production Municipal Solid Waste (kg/day/capita) 0.3 • ••E-waste generated (kg/capita) 0.5 • ••Anthropogenic wastewater that receives treatment (%) 0.0 • ••Production-based SO2 emissions (kg/capita) 0.4 • ••Net imported SO2 emissions (kg/capita) 0.3 • ••Reactive nitrogen production footprint (kg/capita) NA • ••Net imported emissions of reactive nitrogen (kg/capita) NA • ••SDG13 – Climate Action
Energy-related CO2 emissions per capita (tCO2/capita) 0.1 • 5Imported CO2 emissions, technology-adjusted (tCO2/capita) 0.1 • ••Climate Change Vulnerability Index 0.3 • ••CO2 emissions embodied in fossil fuel exports (kg/capita) 0.0 • ••SDG14 – Life Below Water
Mean area that is protected in marine sites important to biodiversity (%) NA • ••Ocean Health Index-Biodiversity (0-100) NA • ••Ocean Health Index-Clean Waters (0-100) NA • ••Ocean Health Index-Fisheries (0-100) NA • ••Fish Stocks overexploited or collapsed by EEZ (%) NA • ••Fish caught by trawling (%) NA • ••SDG15 – Life on Land Mean area that is protected in terrestrial sites important to biodiversity (%) 19.8 • 5Mean area that is protected in freshwater sites important to biodiversity (%) 16.0 • 5Red List Index of species survival (0-1) 0.8 • 5Annual change in forest area (%) 2.7 • ••Imported biodiversity threats (threats per million population) 0.2 • ••SDG16 – Peace, Justice and Strong Institutions
Homicides (per 100,000 population) 7.6 • ••Prison population (per 100,000 population) 119.3 • ••Population who feel safe walking alone at night in the city or area where
they live (%)66.0 • p
Government Efficiency (1-7) 3.7 • pProperty Rights (1-7) 4.1 • pChildren under 5 years of age whose births have been registered with a
civil authority (%)2.7 • ••
Corruption Perception Index (0-100) 35.0 • 5Children 5–14 years old involved in child labour (%) 27.4 • ••Transfers of major conventional weapons (exports) (constant 1990
US$ million per 100,000 population)0.0 • ••
SDG17 – Partnerships for the Goals
Government Health and Education spending (% GDP) 9.7 • pHigh-income and all OECD DAC countries: International concessional public
finance, including official development assistance (% GNI)NA • ••
Other countries: Tax revenue (% GDP) 8.8 • 5Tax Haven Score (best 0-5 worst) 0.0 • ••
SDG1 – End Poverty Poverty headcount ratio at $1.90/day (% population) 16.4 • LProjected poverty headcount ratio at $1.90/day in 2030 (% population) 1.6 • ••SDG2 – Zero Hunger
Prevalence of undernourishment (% population) 28.8 • ••Prevalence of stunting (low height-for-age) in children under 5 years of age (%) 40.4 • 5Prevalence of wasting in children under 5 years of age (%) 8.7 • 5Prevalence of obesity, BMI ≥ 30 (% adult population) 4.5 • 5Cereal yield (t/ha) 2.5 • LSustainable Nitrogen Management Index 0.8 • ••SDG3 – Good Health and Well-Being
Maternal mortality rate (per 100,000 live births) 353.0 • LNeonatal mortality rate (per 1,000 live births) 27.6 • LMortality rate, under-5 (per 1,000 live births) 58.4 • LIncidence of tuberculosis (per 100,000 population) 177.0 • LHIV prevalence (per 1,000) 0.4 • pAge-standardised death rate due to cardiovascular disease, cancer,
diabetes, and chronic respiratory disease in populations age 30–70 years (per 100,000 population)
19.3 • 5
Age-standardised death rate attributable to household air pollution and ambient air pollution (per 100,000 population)
96.3 • ••
Traffic deaths rate (per 100,000 population) 27.3 • pHealthy Life Expectancy at birth (years) 64.8 • LAdolescent fertility rate (births per 1,000 women ages 15-19) 64.9 • DBirths attended by skilled health personnel (%) 27.7 • ••Surviving infants who received 2 WHO-recommended vaccines (%) 70.0 • LUniversal Health Coverage Tracer Index (0-100) 41.1 • 5Subjective Wellbeing (average ladder score, 0-10) 4.2 • ••SDG4 – Quality Education
Net primary enrolment rate (%) 85.4 • LMean years of schooling 2.6 • 5Literacy rate of 15-24 year olds, both sexes (%) 55.0 • ••SDG5 – Gender Equality
Unmet demand for contraception, estimated (% women married or in union, ages 15-49 )
36.6 • L
Female to male mean years of schooling of population age 25 + (%) 43.2 • ••Female to male labour force participation rate (%) 87.9 • 5Seats held by women in national parliaments (%) 38.8 • L
SDG6 – Clean Water and Sanitation
High-income countries: population using safely managed water services (%) NA • ••Other countries: population using at least basic drinking water services (%) NA • ••High-income countries: population using safely managed sanitation services (%) NA • ••Other countries: population using at least basic sanitation services (%) 7.1 • 5Freshwater withdrawal as % total renewable water resources 11.6 • ••Imported groundwater depletion (m3/year/capita) 1.3 • ••SDG7 – Affordable and Clean Energy
Access to electricity (% population) 27.2 • 5Access to clean fuels & technology for cooking (% population) 2.0 • 5CO2 emissions from fuel combustion / electricity output (MtCO2/TWh) 1.0 • L
SDG8 – Decent Work and Economic Growth
Adjusted GDP Growth (%) -0.3 • ••Slavery score (0-100) 80.0 • ••Adults (15 years +) with an account at a bank or other financial institution or
with a mobile-money-service provider (%)34.8 • ••
Unemployment rate (% total labour force) 5.2 • L
SDG9 – Industry, Innovation and Infrastructure
Proportion of the population using the internet (%) 15.4 • DMobile broadband subscriptions (per 100 inhabitants) 5.2 • 5Quality of overall infrastructure (1= extremely underdeveloped;
7= extensive and efficient by international standards)3.5 • p
Value Rating Trend Value Rating Trend
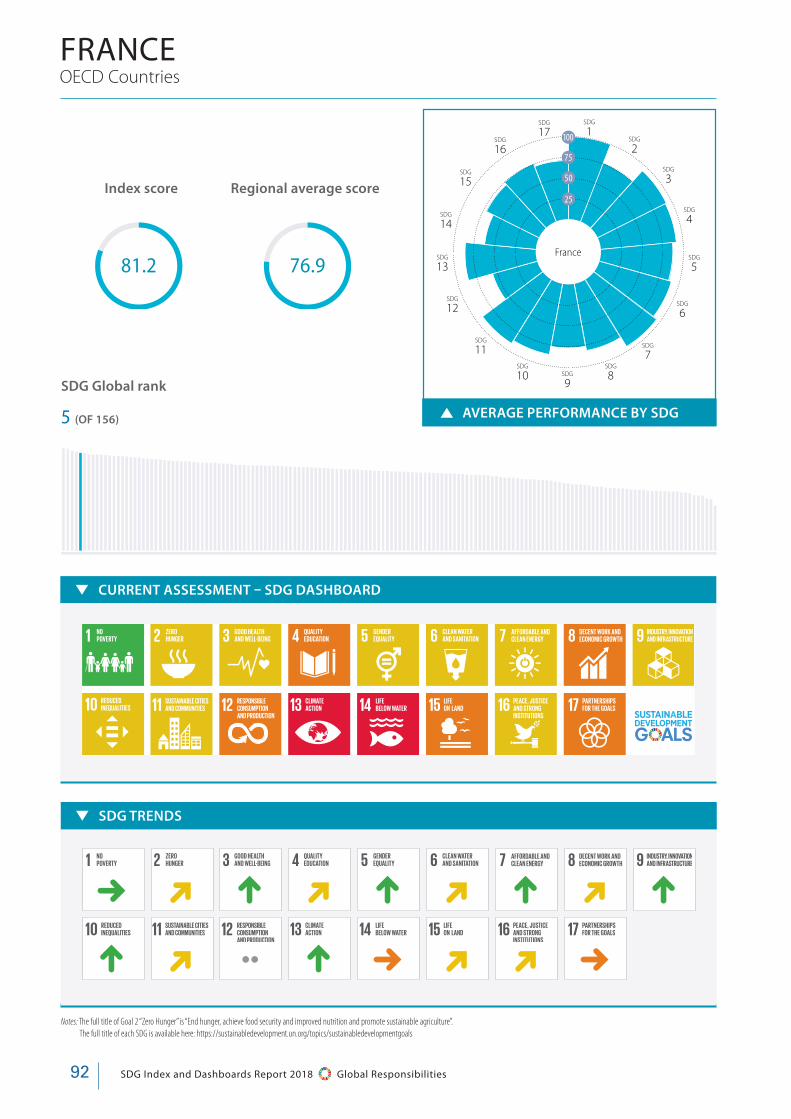
Notes: The full title of Goal 2 “Zero Hunger” is “End hunger, achieve food security and improved nutrition and promote sustainable agriculture”. The full title of each SDG is available here: https://sustainabledevelopment.un.org/topics/sustainabledevelopmentgoals
SDG Index and Dashboards Report 2018 Global Responsibilities92
AVERAGE PERFORMANCE BY SDG
OECD Countries
Index score Regional average score
SDG Global rank
5 (OF 156)
FRANCE
81.2 76.9
CURRENT ASSESSMENT – SDG DASHBOARD
AVERAGE PERFORMANCE BY SDG
SDG TRENDS
5 D L D L D L D L
L D •• L 5 D D 5
100
75
50
25
SDG
1SDG
17SDG
16
SDG
15
SDG
14
SDG
13
SDG
12
SDG
11SDG
10 SDG
9
SDG
8
SDG
7
SDG
6
SDG
5
SDG
4
SDG
3
SDG
2
France
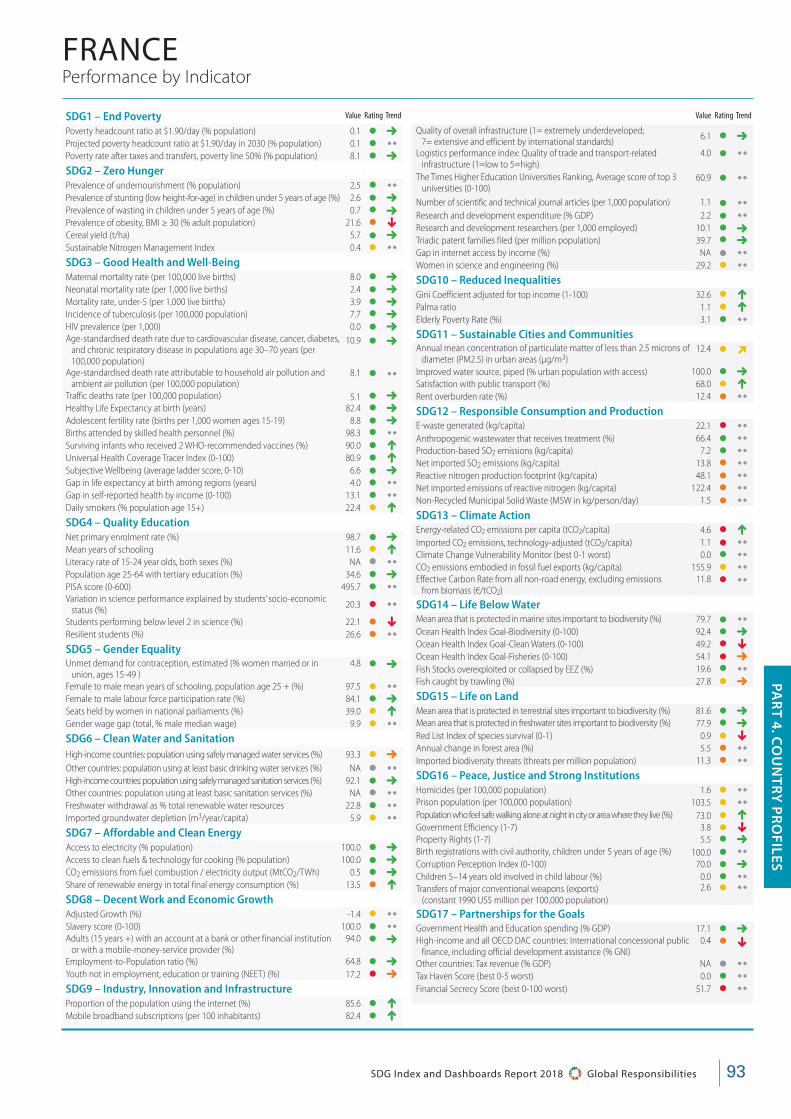
Performance by Indicator
Value Rating Trend
93SDG Index and Dashboards Report 2018 Global Responsibilities
PAR
T 4. CO
UN
TRY
PR
OFILES
FRANCE
SDG1 – End Poverty
Poverty headcount ratio at $1.90/day (% population) 0.1 • 5Projected poverty headcount ratio at $1.90/day in 2030 (% population) 0.1 • ••Poverty rate after taxes and transfers, poverty line 50% (% population) 8.1 • 5
SDG2 – Zero Hunger Prevalence of undernourishment (% population) 2.5 • ••Prevalence of stunting (low height-for-age) in children under 5 years of age (%) 2.6 • 5Prevalence of wasting in children under 5 years of age (%) 0.7 • 5Prevalence of obesity, BMI ≥ 30 (% adult population) 21.6 • pCereal yield (t/ha) 5.7 • 5Sustainable Nitrogen Management Index 0.4 • ••SDG3 – Good Health and Well-Being Maternal mortality rate (per 100,000 live births) 8.0 • 5Neonatal mortality rate (per 1,000 live births) 2.4 • 5Mortality rate, under-5 (per 1,000 live births) 3.9 • 5Incidence of tuberculosis (per 100,000 population) 7.7 • 5HIV prevalence (per 1,000) 0.0 • 5Age-standardised death rate due to cardiovascular disease, cancer, diabetes,
and chronic respiratory disease in populations age 30–70 years (per 100,000 population)
10.9 • 5
Age-standardised death rate attributable to household air pollution and ambient air pollution (per 100,000 population)
8.1 • ••Traffic deaths rate (per 100,000 population) 5.1 • 5Healthy Life Expectancy at birth (years) 82.4 • 5Adolescent fertility rate (births per 1,000 women ages 15-19) 8.8 • 5Births attended by skilled health personnel (%) 98.3 • ••Surviving infants who received 2 WHO-recommended vaccines (%) 90.0 • LUniversal Health Coverage Tracer Index (0-100) 80.9 • LSubjective Wellbeing (average ladder score, 0-10) 6.6 • 5Gap in life expectancy at birth among regions (years) 4.0 • ••Gap in self-reported health by income (0-100) 13.1 • ••Daily smokers (% population age 15+) 22.4 • LSDG4 – Quality Education Net primary enrolment rate (%) 98.7 • 5Mean years of schooling 11.6 • LLiteracy rate of 15-24 year olds, both sexes (%) NA • ••Population age 25-64 with tertiary education (%) 34.6 • 5PISA score (0-600) 495.7 • ••Variation in science performance explained by students’ socio-economic
status (%)20.3 • ••
Students performing below level 2 in science (%) 22.1 • pResilient students (%) 26.6 • ••SDG5 – Gender Equality Unmet demand for contraception, estimated (% women married or in
union, ages 15-49 )4.8 • 5
Female to male mean years of schooling, population age 25 + (%) 97.5 • ••Female to male labour force participation rate (%) 84.1 • 5Seats held by women in national parliaments (%) 39.0 • LGender wage gap (total, % male median wage) 9.9 • ••SDG6 – Clean Water and Sanitation
High-income countries: population using safely managed water services (%) 93.3 • 5Other countries: population using at least basic drinking water services (%) NA • ••High-income countries: population using safely managed sanitation services (%) 92.1 • 5Other countries: population using at least basic sanitation services (%) NA • ••Freshwater withdrawal as % total renewable water resources 22.8 • ••Imported groundwater depletion (m3/year/capita) 5.9 • ••SDG7 – Affordable and Clean Energy Access to electricity (% population) 100.0 • 5Access to clean fuels & technology for cooking (% population) 100.0 • 5CO2 emissions from fuel combustion / electricity output (MtCO2/TWh) 0.5 • 5Share of renewable energy in total final energy consumption (%) 13.5 • LSDG8 – Decent Work and Economic Growth Adjusted Growth (%) -1.4 • ••Slavery score (0-100) 100.0 • ••Adults (15 years +) with an account at a bank or other financial institution
or with a mobile-money-service provider (%)94.0 • 5
Employment-to-Population ratio (%) 64.8 • 5Youth not in employment, education or training (NEET) (%) 17.2 • 5
SDG9 – Industry, Innovation and Infrastructure Proportion of the population using the internet (%) 85.6 • LMobile broadband subscriptions (per 100 inhabitants) 82.4 • L
Quality of overall infrastructure (1= extremely underdeveloped; 7= extensive and efficient by international standards)
6.1 • 5
Logistics performance index: Quality of trade and transport-related infrastructure (1=low to 5=high)
4.0 • ••
The Times Higher Education Universities Ranking, Average score of top 3 universities (0-100)
60.9 • ••
Number of scientific and technical journal articles (per 1,000 population) 1.1 • ••Research and development expenditure (% GDP) 2.2 • ••Research and development researchers (per 1,000 employed) 10.1 • 5Triadic patent families filed (per million population) 39.7 • 5Gap in internet access by income (%) NA • ••Women in science and engineering (%) 29.2 • ••SDG10 – Reduced Inequalities Gini Coefficient adjusted for top income (1-100) 32.6 • LPalma ratio 1.1 • LElderly Poverty Rate (%) 3.1 • ••SDG11 – Sustainable Cities and Communities Annual mean concentration of particulate matter of less than 2.5 microns of
diameter (PM2.5) in urban areas (μg/m3)12.4 • D
Improved water source, piped (% urban population with access) 100.0 • 5Satisfaction with public transport (%) 68.0 • LRent overburden rate (%) 12.4 • ••SDG12 – Responsible Consumption and Production E-waste generated (kg/capita) 22.1 • ••Anthropogenic wastewater that receives treatment (%) 66.4 • ••Production-based SO2 emissions (kg/capita) 7.2 • ••Net imported SO2 emissions (kg/capita) 13.8 • ••Reactive nitrogen production footprint (kg/capita) 48.1 • ••Net imported emissions of reactive nitrogen (kg/capita) 122.4 • ••Non-Recycled Municipal Solid Waste (MSW in kg/person/day) 1.5 • ••SDG13 – Climate Action Energy-related CO2 emissions per capita (tCO2/capita) 4.6 • LImported CO2 emissions, technology-adjusted (tCO2/capita) 1.1 • ••Climate Change Vulnerability Monitor (best 0-1 worst) 0.0 • ••CO2 emissions embodied in fossil fuel exports (kg/capita) 155.9 • ••Effective Carbon Rate from all non-road energy, excluding emissions
from biomass (€/tCO2)11.8 • ••
SDG14 – Life Below Water Mean area that is protected in marine sites important to biodiversity (%) 79.7 • ••Ocean Health Index Goal-Biodiversity (0-100) 92.4 • 5Ocean Health Index Goal-Clean Waters (0-100) 49.2 • pOcean Health Index Goal-Fisheries (0-100) 54.1 • 5Fish Stocks overexploited or collapsed by EEZ (%) 19.6 • ••Fish caught by trawling (%) 27.8 • 5
SDG15 – Life on Land Mean area that is protected in terrestrial sites important to biodiversity (%) 81.6 • 5Mean area that is protected in freshwater sites important to biodiversity (%) 77.9 • 5Red List Index of species survival (0-1) 0.9 • pAnnual change in forest area (%) 5.5 • ••Imported biodiversity threats (threats per million population) 11.3 • ••SDG16 – Peace, Justice and Strong Institutions Homicides (per 100,000 population) 1.6 • ••Prison population (per 100,000 population) 103.5 • ••Population who feel safe walking alone at night in city or area where they live (%) 73.0 • LGovernment Efficiency (1-7) 3.8 • pProperty Rights (1-7) 5.5 • 5Birth registrations with civil authority, children under 5 years of age (%) 100.0 • ••Corruption Perception Index (0-100) 70.0 • 5Children 5–14 years old involved in child labour (%) 0.0 • ••Transfers of major conventional weapons (exports)
(constant 1990 US$ million per 100,000 population)2.6 • ••
SDG17 – Partnerships for the Goals Government Health and Education spending (% GDP) 17.1 • 5High-income and all OECD DAC countries: International concessional public
finance, including official development assistance (% GNI)0.4 • p
Other countries: Tax revenue (% GDP) NA • ••Tax Haven Score (best 0-5 worst) 0.0 • ••Financial Secrecy Score (best 0-100 worst) 51.7 • ••
Value Rating Trend

Notes: The full title of Goal 2 “Zero Hunger” is “End hunger, achieve food security and improved nutrition and promote sustainable agriculture”. The full title of each SDG is available here: https://sustainabledevelopment.un.org/topics/sustainabledevelopmentgoals
SDG Index and Dashboards Report 2018 Global Responsibilities94
AVERAGE PERFORMANCE BY SDG
OECD Countries
OVERALL PERFORMANCE
Index score Regional average score
SDG Global rank
4 (OF 156)
GERMANY
SDG TRENDS
5 D L D D 5 L L L
5 D •• 5 5 5 D D
82.3 76.9
CURRENT ASSESSMENT – SDG DASHBOARD
100
75
50
25
SDG
1SDG
17SDG
16
SDG
15
SDG
14
SDG
13
SDG
12
SDG
11SDG
10 SDG
9
SDG
8
SDG
7
SDG
6
SDG
5
SDG
4
SDG
3
SDG
2
Germany
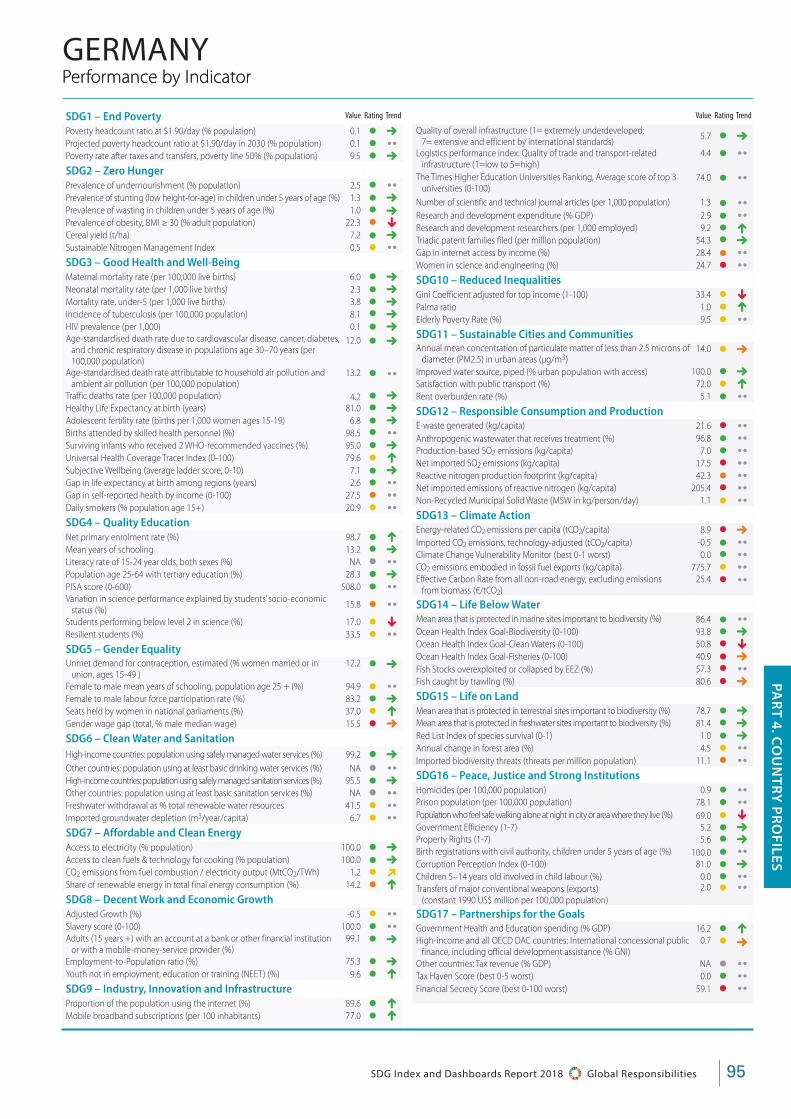
Performance by Indicator
Value Rating Trend
95SDG Index and Dashboards Report 2018 Global Responsibilities
PAR
T 4. CO
UN
TRY
PR
OFILES
Performance by IndicatorGERMANY
SDG1 – End Poverty
Poverty headcount ratio at $1.90/day (% population) 0.1 • 5Projected poverty headcount ratio at $1.90/day in 2030 (% population) 0.1 • ••Poverty rate after taxes and transfers, poverty line 50% (% population) 9.5 • 5
SDG2 – Zero Hunger Prevalence of undernourishment (% population) 2.5 • ••Prevalence of stunting (low height-for-age) in children under 5 years of age (%) 1.3 • 5Prevalence of wasting in children under 5 years of age (%) 1.0 • 5Prevalence of obesity, BMI ≥ 30 (% adult population) 22.3 • pCereal yield (t/ha) 7.2 • 5Sustainable Nitrogen Management Index 0.5 • ••SDG3 – Good Health and Well-Being Maternal mortality rate (per 100,000 live births) 6.0 • 5Neonatal mortality rate (per 1,000 live births) 2.3 • 5Mortality rate, under-5 (per 1,000 live births) 3.8 • 5Incidence of tuberculosis (per 100,000 population) 8.1 • 5HIV prevalence (per 1,000) 0.1 • 5Age-standardised death rate due to cardiovascular disease, cancer, diabetes,
and chronic respiratory disease in populations age 30–70 years (per 100,000 population)
12.0 • 5
Age-standardised death rate attributable to household air pollution and ambient air pollution (per 100,000 population)
13.2 • ••Traffic deaths rate (per 100,000 population) 4.2 • 5Healthy Life Expectancy at birth (years) 81.0 • 5Adolescent fertility rate (births per 1,000 women ages 15-19) 6.8 • 5Births attended by skilled health personnel (%) 98.5 • ••Surviving infants who received 2 WHO-recommended vaccines (%) 95.0 • 5Universal Health Coverage Tracer Index (0-100) 79.6 • LSubjective Wellbeing (average ladder score, 0-10) 7.1 • 5Gap in life expectancy at birth among regions (years) 2.6 • ••Gap in self-reported health by income (0-100) 27.5 • ••Daily smokers (% population age 15+) 20.9 • ••SDG4 – Quality Education Net primary enrolment rate (%) 98.7 • LMean years of schooling 13.2 • 5Literacy rate of 15-24 year olds, both sexes (%) NA • ••Population age 25-64 with tertiary education (%) 28.3 • 5PISA score (0-600) 508.0 • ••Variation in science performance explained by students’ socio-economic
status (%)15.8 • ••
Students performing below level 2 in science (%) 17.0 • pResilient students (%) 33.5 • ••SDG5 – Gender Equality Unmet demand for contraception, estimated (% women married or in
union, ages 15-49 )12.2 • 5
Female to male mean years of schooling, population age 25 + (%) 94.9 • ••Female to male labour force participation rate (%) 83.2 • 5Seats held by women in national parliaments (%) 37.0 • LGender wage gap (total, % male median wage) 15.5 • 5
SDG6 – Clean Water and Sanitation
High-income countries: population using safely managed water services (%) 99.2 • 5Other countries: population using at least basic drinking water services (%) NA • ••High-income countries: population using safely managed sanitation services (%) 95.5 • 5Other countries: population using at least basic sanitation services (%) NA • ••Freshwater withdrawal as % total renewable water resources 41.5 • ••Imported groundwater depletion (m3/year/capita) 6.7 • ••SDG7 – Affordable and Clean Energy Access to electricity (% population) 100.0 • 5Access to clean fuels & technology for cooking (% population) 100.0 • 5CO2 emissions from fuel combustion / electricity output (MtCO2/TWh) 1.2 • DShare of renewable energy in total final energy consumption (%) 14.2 • LSDG8 – Decent Work and Economic Growth Adjusted Growth (%) -0.5 • ••Slavery score (0-100) 100.0 • ••Adults (15 years +) with an account at a bank or other financial institution
or with a mobile-money-service provider (%)99.1 • 5
Employment-to-Population ratio (%) 75.3 • 5Youth not in employment, education or training (NEET) (%) 9.6 • LSDG9 – Industry, Innovation and Infrastructure Proportion of the population using the internet (%) 89.6 • LMobile broadband subscriptions (per 100 inhabitants) 77.0 • L
Quality of overall infrastructure (1= extremely underdeveloped; 7= extensive and efficient by international standards)
5.7 • 5
Logistics performance index: Quality of trade and transport-related infrastructure (1=low to 5=high)
4.4 • ••
The Times Higher Education Universities Ranking, Average score of top 3 universities (0-100)
74.0 • ••
Number of scientific and technical journal articles (per 1,000 population) 1.3 • ••Research and development expenditure (% GDP) 2.9 • ••Research and development researchers (per 1,000 employed) 9.2 • LTriadic patent families filed (per million population) 54.3 • 5Gap in internet access by income (%) 28.4 • ••Women in science and engineering (%) 24.7 • ••SDG10 – Reduced Inequalities Gini Coefficient adjusted for top income (1-100) 33.4 • pPalma ratio 1.0 • LElderly Poverty Rate (%) 9.5 • ••SDG11 – Sustainable Cities and Communities Annual mean concentration of particulate matter of less than 2.5 microns of
diameter (PM2.5) in urban areas (μg/m3)14.0 • 5
Improved water source, piped (% urban population with access) 100.0 • 5Satisfaction with public transport (%) 72.0 • LRent overburden rate (%) 5.1 • ••SDG12 – Responsible Consumption and Production E-waste generated (kg/capita) 21.6 • ••Anthropogenic wastewater that receives treatment (%) 96.8 • ••Production-based SO2 emissions (kg/capita) 7.0 • ••Net imported SO2 emissions (kg/capita) 17.5 • ••Reactive nitrogen production footprint (kg/capita) 42.3 • ••Net imported emissions of reactive nitrogen (kg/capita) 205.4 • ••Non-Recycled Municipal Solid Waste (MSW in kg/person/day) 1.1 • ••SDG13 – Climate Action Energy-related CO2 emissions per capita (tCO2/capita) 8.9 • 5Imported CO2 emissions, technology-adjusted (tCO2/capita) -0.5 • ••Climate Change Vulnerability Monitor (best 0-1 worst) 0.0 • ••CO2 emissions embodied in fossil fuel exports (kg/capita) 775.7 • ••Effective Carbon Rate from all non-road energy, excluding emissions
from biomass (€/tCO2)25.4 • ••
SDG14 – Life Below Water Mean area that is protected in marine sites important to biodiversity (%) 86.4 • ••Ocean Health Index Goal-Biodiversity (0-100) 93.8 • 5Ocean Health Index Goal-Clean Waters (0-100) 50.8 • pOcean Health Index Goal-Fisheries (0-100) 40.9 • 5Fish Stocks overexploited or collapsed by EEZ (%) 57.3 • ••Fish caught by trawling (%) 80.6 • 5
SDG15 – Life on Land Mean area that is protected in terrestrial sites important to biodiversity (%) 78.7 • 5Mean area that is protected in freshwater sites important to biodiversity (%) 81.4 • 5Red List Index of species survival (0-1) 1.0 • 5Annual change in forest area (%) 4.5 • ••Imported biodiversity threats (threats per million population) 11.1 • ••SDG16 – Peace, Justice and Strong Institutions Homicides (per 100,000 population) 0.9 • ••Prison population (per 100,000 population) 78.1 • ••Population who feel safe walking alone at night in city or area where they live (%) 69.0 • pGovernment Efficiency (1-7) 5.2 • 5Property Rights (1-7) 5.6 • 5Birth registrations with civil authority, children under 5 years of age (%) 100.0 • ••Corruption Perception Index (0-100) 81.0 • 5Children 5–14 years old involved in child labour (%) 0.0 • ••Transfers of major conventional weapons (exports)
(constant 1990 US$ million per 100,000 population)2.0 • ••
SDG17 – Partnerships for the Goals Government Health and Education spending (% GDP) 16.2 • LHigh-income and all OECD DAC countries: International concessional public
finance, including official development assistance (% GNI)0.7 • 5
Other countries: Tax revenue (% GDP) NA • ••Tax Haven Score (best 0-5 worst) 0.0 • ••Financial Secrecy Score (best 0-100 worst) 59.1 • ••
Value Rating Trend

SDG Index and Dashboards Report 2018 Global Responsibilities96
AVERAGE PERFORMANCE BY SDG
Notes: The full title of Goal 2 “Zero Hunger” is “End hunger, achieve food security and improved nutrition and promote sustainable agriculture”. The full title of each SDG is available here: https://sustainabledevelopment.un.org/topics/sustainabledevelopmentgoals
OVERALL PERFORMANCE
Index score Regional average score
SDG Global rank
112 (OF 156)
East and South AsiaINDIA
SDG TRENDS
L D D •• 5 D 5 L D
•• 5 •• 5 D 5 5 5
59.1 64.1
100
75
50
25
SDG
1SDG
17SDG
16
SDG
15
SDG
14
SDG
13
SDG
12
SDG
11SDG
10 SDG
9
SDG
8
SDG
7
SDG
6
SDG
5
SDG
4
SDG
3
SDG
2
India
CURRENT ASSESSMENT – SDG DASHBOARD
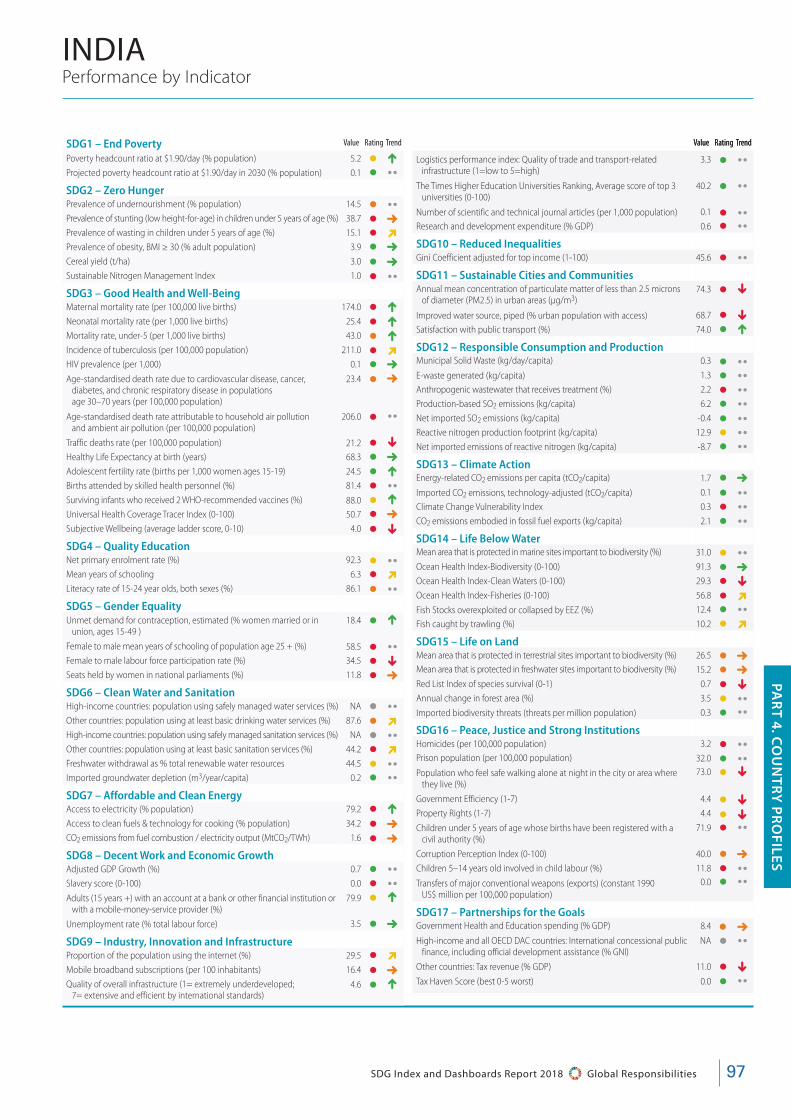
97SDG Index and Dashboards Report 2018 Global Responsibilities
PAR
T 4. CO
UN
TRY
PR
OFILES
PAR
T 4. CO
UN
TRY
PR
OFILES
Performance by Indicator
Value Rating Trend
INDIA
Logistics performance index: Quality of trade and transport-related infrastructure (1=low to 5=high)
3.3 • ••
The Times Higher Education Universities Ranking, Average score of top 3 universities (0-100)
40.2 • ••
Number of scientific and technical journal articles (per 1,000 population) 0.1 • ••Research and development expenditure (% GDP) 0.6 • ••SDG10 – Reduced Inequalities Gini Coefficient adjusted for top income (1-100) 45.6 • ••SDG11 – Sustainable Cities and Communities
Annual mean concentration of particulate matter of less than 2.5 microns of diameter (PM2.5) in urban areas (μg/m3)
74.3 • p
Improved water source, piped (% urban population with access) 68.7 • pSatisfaction with public transport (%) 74.0 • L
SDG12 – Responsible Consumption and Production Municipal Solid Waste (kg/day/capita) 0.3 • ••E-waste generated (kg/capita) 1.3 • ••Anthropogenic wastewater that receives treatment (%) 2.2 • ••Production-based SO2 emissions (kg/capita) 6.2 • ••Net imported SO2 emissions (kg/capita) -0.4 • ••Reactive nitrogen production footprint (kg/capita) 12.9 • ••Net imported emissions of reactive nitrogen (kg/capita) -8.7 • ••SDG13 – Climate Action
Energy-related CO2 emissions per capita (tCO2/capita) 1.7 • 5Imported CO2 emissions, technology-adjusted (tCO2/capita) 0.1 • ••Climate Change Vulnerability Index 0.3 • ••CO2 emissions embodied in fossil fuel exports (kg/capita) 2.1 • ••SDG14 – Life Below Water
Mean area that is protected in marine sites important to biodiversity (%) 31.0 • ••Ocean Health Index-Biodiversity (0-100) 91.3 • 5Ocean Health Index-Clean Waters (0-100) 29.3 • pOcean Health Index-Fisheries (0-100) 56.8 • DFish Stocks overexploited or collapsed by EEZ (%) 12.4 • ••Fish caught by trawling (%) 10.2 • D
SDG15 – Life on Land Mean area that is protected in terrestrial sites important to biodiversity (%) 26.5 • 5Mean area that is protected in freshwater sites important to biodiversity (%) 15.2 • 5Red List Index of species survival (0-1) 0.7 • pAnnual change in forest area (%) 3.5 • ••Imported biodiversity threats (threats per million population) 0.3 • ••SDG16 – Peace, Justice and Strong Institutions
Homicides (per 100,000 population) 3.2 • ••Prison population (per 100,000 population) 32.0 • ••Population who feel safe walking alone at night in the city or area where
they live (%)73.0 • p
Government Efficiency (1-7) 4.4 • pProperty Rights (1-7) 4.4 • pChildren under 5 years of age whose births have been registered with a
civil authority (%)71.9 • ••
Corruption Perception Index (0-100) 40.0 • 5Children 5–14 years old involved in child labour (%) 11.8 • ••Transfers of major conventional weapons (exports) (constant 1990
US$ million per 100,000 population)0.0 • ••
SDG17 – Partnerships for the Goals
Government Health and Education spending (% GDP) 8.4 • 5High-income and all OECD DAC countries: International concessional public
finance, including official development assistance (% GNI)NA • ••
Other countries: Tax revenue (% GDP) 11.0 • pTax Haven Score (best 0-5 worst) 0.0 • ••
SDG1 – End Poverty Poverty headcount ratio at $1.90/day (% population) 5.2 • LProjected poverty headcount ratio at $1.90/day in 2030 (% population) 0.1 • ••SDG2 – Zero Hunger
Prevalence of undernourishment (% population) 14.5 • ••Prevalence of stunting (low height-for-age) in children under 5 years of age (%) 38.7 • 5Prevalence of wasting in children under 5 years of age (%) 15.1 • DPrevalence of obesity, BMI ≥ 30 (% adult population) 3.9 • 5Cereal yield (t/ha) 3.0 • 5Sustainable Nitrogen Management Index 1.0 • ••SDG3 – Good Health and Well-Being
Maternal mortality rate (per 100,000 live births) 174.0 • LNeonatal mortality rate (per 1,000 live births) 25.4 • LMortality rate, under-5 (per 1,000 live births) 43.0 • LIncidence of tuberculosis (per 100,000 population) 211.0 • DHIV prevalence (per 1,000) 0.1 • 5Age-standardised death rate due to cardiovascular disease, cancer,
diabetes, and chronic respiratory disease in populations age 30–70 years (per 100,000 population)
23.4 • 5
Age-standardised death rate attributable to household air pollution and ambient air pollution (per 100,000 population)
206.0 • ••
Traffic deaths rate (per 100,000 population) 21.2 • pHealthy Life Expectancy at birth (years) 68.3 • 5Adolescent fertility rate (births per 1,000 women ages 15-19) 24.5 • LBirths attended by skilled health personnel (%) 81.4 • ••Surviving infants who received 2 WHO-recommended vaccines (%) 88.0 • LUniversal Health Coverage Tracer Index (0-100) 50.7 • 5Subjective Wellbeing (average ladder score, 0-10) 4.0 • p
SDG4 – Quality Education
Net primary enrolment rate (%) 92.3 • ••Mean years of schooling 6.3 • DLiteracy rate of 15-24 year olds, both sexes (%) 86.1 • ••SDG5 – Gender Equality
Unmet demand for contraception, estimated (% women married or in union, ages 15-49 )
18.4 • L
Female to male mean years of schooling of population age 25 + (%) 58.5 • ••Female to male labour force participation rate (%) 34.5 • pSeats held by women in national parliaments (%) 11.8 • 5
SDG6 – Clean Water and Sanitation
High-income countries: population using safely managed water services (%) NA • ••Other countries: population using at least basic drinking water services (%) 87.6 • DHigh-income countries: population using safely managed sanitation services (%) NA • ••Other countries: population using at least basic sanitation services (%) 44.2 • DFreshwater withdrawal as % total renewable water resources 44.5 • ••Imported groundwater depletion (m3/year/capita) 0.2 • ••SDG7 – Affordable and Clean Energy
Access to electricity (% population) 79.2 • LAccess to clean fuels & technology for cooking (% population) 34.2 • 5CO2 emissions from fuel combustion / electricity output (MtCO2/TWh) 1.6 • 5
SDG8 – Decent Work and Economic Growth
Adjusted GDP Growth (%) 0.7 • ••Slavery score (0-100) 0.0 • ••Adults (15 years +) with an account at a bank or other financial institution or
with a mobile-money-service provider (%)79.9 • L
Unemployment rate (% total labour force) 3.5 • 5
SDG9 – Industry, Innovation and Infrastructure
Proportion of the population using the internet (%) 29.5 • DMobile broadband subscriptions (per 100 inhabitants) 16.4 • 5Quality of overall infrastructure (1= extremely underdeveloped;
7= extensive and efficient by international standards)4.6 • L
Value Rating Trend Value Rating Trend
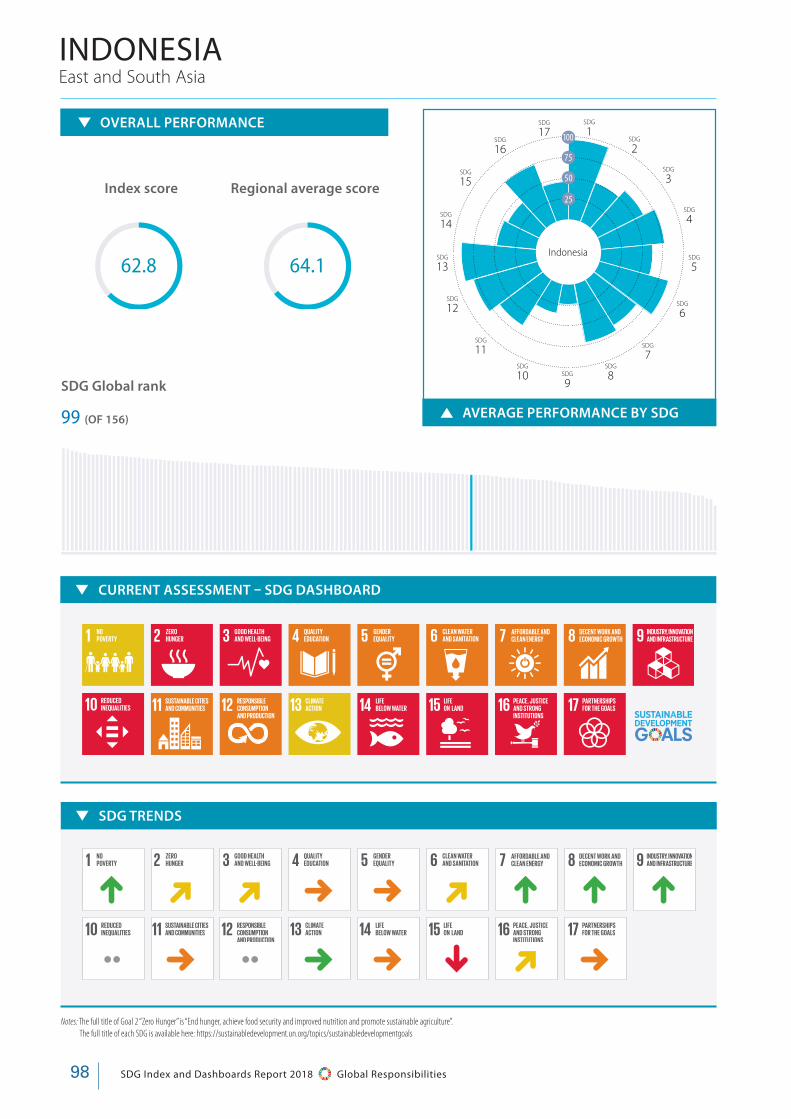
SDG Index and Dashboards Report 2018 Global Responsibilities98
AVERAGE PERFORMANCE BY SDG
Notes: The full title of Goal 2 “Zero Hunger” is “End hunger, achieve food security and improved nutrition and promote sustainable agriculture”. The full title of each SDG is available here: https://sustainabledevelopment.un.org/topics/sustainabledevelopmentgoals
OVERALL PERFORMANCE
Index score Regional average score
SDG Global rank
99 (OF 156)
East and South AsiaINDONESIA
SDG TRENDS
L D D 5 5 D L L L
•• 5 •• 5 5 p D 5
62.8 64.1
100
75
50
25
SDG
1SDG
17SDG
16
SDG
15
SDG
14
SDG
13
SDG
12
SDG
11SDG
10 SDG
9
SDG
8
SDG
7
SDG
6
SDG
5
SDG
4
SDG
3
SDG
2
Indonesia
CURRENT ASSESSMENT – SDG DASHBOARD

99SDG Index and Dashboards Report 2018 Global Responsibilities
PAR
T 4. CO
UN
TRY
PR
OFILES
PAR
T 4. CO
UN
TRY
PR
OFILES
Performance by Indicator
Value Rating Trend
INDONESIA
Logistics performance index: Quality of trade and transport-related infrastructure (1=low to 5=high)
2.6 • ••
The Times Higher Education Universities Ranking, Average score of top 3 universities (0-100)
18.5 • ••
Number of scientific and technical journal articles (per 1,000 population) 0.0 • ••Research and development expenditure (% GDP) 0.1 • ••SDG10 – Reduced Inequalities Gini Coefficient adjusted for top income (1-100) 50.7 • ••SDG11 – Sustainable Cities and Communities
Annual mean concentration of particulate matter of less than 2.5 microns of diameter (PM2.5) in urban areas (μg/m3)
15.4 • p
Improved water source, piped (% urban population with access) 25.3 • pSatisfaction with public transport (%) 73.0 • L
SDG12 – Responsible Consumption and Production Municipal Solid Waste (kg/day/capita) 0.5 • ••E-waste generated (kg/capita) 3.0 • ••Anthropogenic wastewater that receives treatment (%) 0.0 • ••Production-based SO2 emissions (kg/capita) 4.5 • ••Net imported SO2 emissions (kg/capita) 0.1 • ••Reactive nitrogen production footprint (kg/capita) 14.6 • ••Net imported emissions of reactive nitrogen (kg/capita) 7.2 • ••SDG13 – Climate Action
Energy-related CO2 emissions per capita (tCO2/capita) 1.8 • 5Imported CO2 emissions, technology-adjusted (tCO2/capita) 0.2 • ••Climate Change Vulnerability Index 0.1 • ••CO2 emissions embodied in fossil fuel exports (kg/capita) 3715.2 • ••SDG14 – Life Below Water
Mean area that is protected in marine sites important to biodiversity (%) 30.3 • ••Ocean Health Index-Biodiversity (0-100) 81.9 • DOcean Health Index-Clean Waters (0-100) 57.6 • 5Ocean Health Index-Fisheries (0-100) 58.9 • LFish Stocks overexploited or collapsed by EEZ (%) 21.7 • ••Fish caught by trawling (%) 36.9 • p
SDG15 – Life on Land Mean area that is protected in terrestrial sites important to biodiversity (%) 23.5 • 5Mean area that is protected in freshwater sites important to biodiversity (%) 39.3 • 5Red List Index of species survival (0-1) 0.8 • pAnnual change in forest area (%) 14.3 • ••Imported biodiversity threats (threats per million population) 1.3 • ••SDG16 – Peace, Justice and Strong Institutions
Homicides (per 100,000 population) 0.5 • ••Prison population (per 100,000 population) 67.4 • ••Population who feel safe walking alone at night in the city or area where
they live (%)82.0 • p
Government Efficiency (1-7) 4.1 • DProperty Rights (1-7) 4.6 • LChildren under 5 years of age whose births have been registered with a
civil authority (%)72.5 • ••
Corruption Perception Index (0-100) 37.0 • DChildren 5–14 years old involved in child labour (%) 6.9 • ••Transfers of major conventional weapons (exports) (constant 1990
US$ million per 100,000 population)0.0 • ••
SDG17 – Partnerships for the Goals
Government Health and Education spending (% GDP) 6.1 • 5High-income and all OECD DAC countries: International concessional public
finance, including official development assistance (% GNI)NA • ••
Other countries: Tax revenue (% GDP) 10.3 • pTax Haven Score (best 0-5 worst) 0.0 • ••
SDG1 – End Poverty Poverty headcount ratio at $1.90/day (% population) 5.3 • LProjected poverty headcount ratio at $1.90/day in 2030 (% population) 0.0 • ••SDG2 – Zero Hunger
Prevalence of undernourishment (% population) 7.9 • ••Prevalence of stunting (low height-for-age) in children under 5 years of age (%) 36.4 • DPrevalence of wasting in children under 5 years of age (%) 13.5 • 5Prevalence of obesity, BMI ≥ 30 (% adult population) 6.9 • 5Cereal yield (t/ha) 5.4 • 5Sustainable Nitrogen Management Index 0.8 • ••SDG3 – Good Health and Well-Being
Maternal mortality rate (per 100,000 live births) 126.0 • LNeonatal mortality rate (per 1,000 live births) 13.7 • LMortality rate, under-5 (per 1,000 live births) 26.4 • LIncidence of tuberculosis (per 100,000 population) 391.0 • 5HIV prevalence (per 1,000) 0.1 • 5Age-standardised death rate due to cardiovascular disease, cancer,
diabetes, and chronic respiratory disease in populations age 30–70 years (per 100,000 population)
26.6 • 5
Age-standardised death rate attributable to household air pollution and ambient air pollution (per 100,000 population)
137.4 • ••
Traffic deaths rate (per 100,000 population) 15.5 • DHealthy Life Expectancy at birth (years) 69.1 • 5Adolescent fertility rate (births per 1,000 women ages 15-19) 48.0 • 5Births attended by skilled health personnel (%) 87.4 • ••Surviving infants who received 2 WHO-recommended vaccines (%) 76.0 • pUniversal Health Coverage Tracer Index (0-100) 51.1 • 5Subjective Wellbeing (average ladder score, 0-10) 5.1 • p
SDG4 – Quality Education
Net primary enrolment rate (%) 90.9 • pMean years of schooling 7.9 • 5Literacy rate of 15-24 year olds, both sexes (%) 99.7 • ••SDG5 – Gender Equality
Unmet demand for contraception, estimated (% women married or in union, ages 15-49 )
16.4 • 5
Female to male mean years of schooling of population age 25 + (%) 87.1 • ••Female to male labour force participation rate (%) 62.0 • 5Seats held by women in national parliaments (%) 19.8 • p
SDG6 – Clean Water and Sanitation
High-income countries: population using safely managed water services (%) NA • ••Other countries: population using at least basic drinking water services (%) 89.5 • LHigh-income countries: population using safely managed sanitation services (%) NA • ••Other countries: population using at least basic sanitation services (%) 67.9 • DFreshwater withdrawal as % total renewable water resources 9.2 • ••Imported groundwater depletion (m3/year/capita) 1.5 • ••SDG7 – Affordable and Clean Energy
Access to electricity (% population) 97.0 • LAccess to clean fuels & technology for cooking (% population) 56.6 • LCO2 emissions from fuel combustion / electricity output (MtCO2/TWh) 2.0 • L
SDG8 – Decent Work and Economic Growth
Adjusted GDP Growth (%) 0.0 • ••Slavery score (0-100) 80.0 • ••Adults (15 years +) with an account at a bank or other financial institution or
with a mobile-money-service provider (%)48.9 • L
Unemployment rate (% total labour force) 4.3 • L
SDG9 – Industry, Innovation and Infrastructure
Proportion of the population using the internet (%) 25.4 • DMobile broadband subscriptions (per 100 inhabitants) 33.9 • LQuality of overall infrastructure (1= extremely underdeveloped;
7= extensive and efficient by international standards)4.1 • L
Value Rating Trend Value Rating Trend
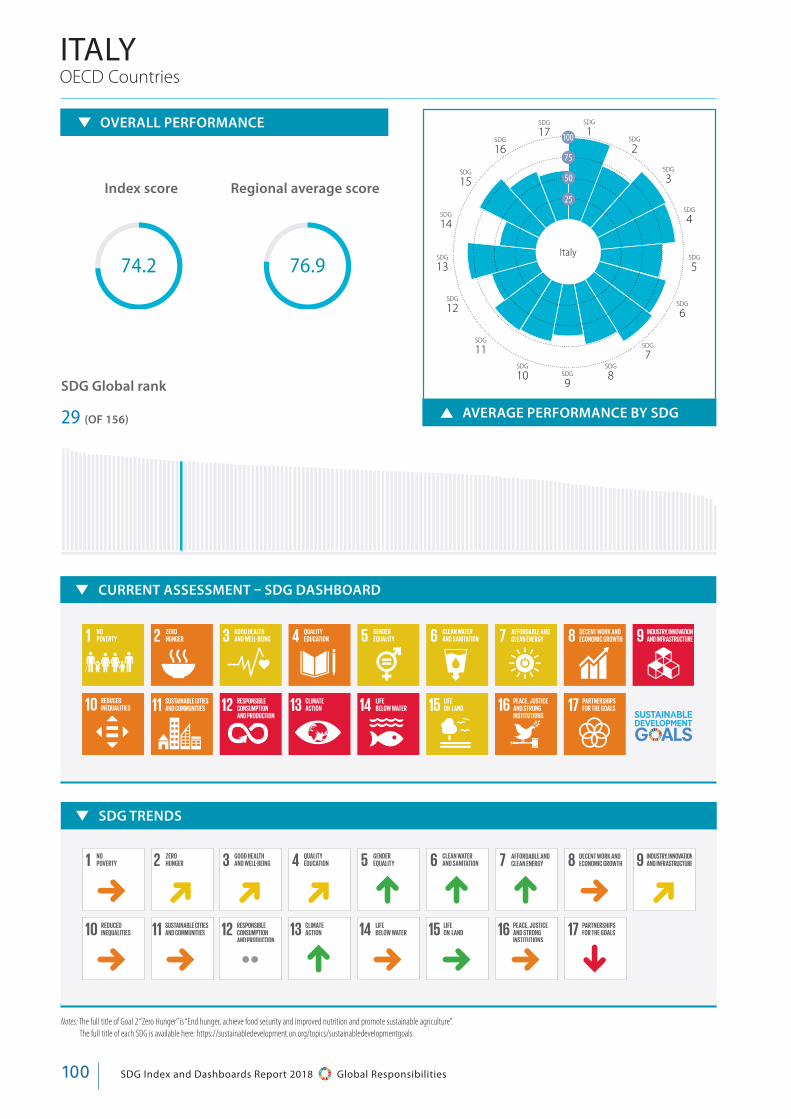
SDG Index and Dashboards Report 2018 Global Responsibilities100
SDG TRENDS
5 D D D L L L 5 D
5 5 •• L 5 5 5 p
CURRENT ASSESSMENT – SDG DASHBOARD
AVERAGE PERFORMANCE BY SDG
Notes: The full title of Goal 2 “Zero Hunger” is “End hunger, achieve food security and improved nutrition and promote sustainable agriculture”. The full title of each SDG is available here: https://sustainabledevelopment.un.org/topics/sustainabledevelopmentgoals
OECD Countries
OVERALL PERFORMANCE
Index score Regional average score
SDG Global rank
29 (OF 156)
ITALY
74.2 76.9
100
75
50
25
SDG
1SDG
17SDG
16
SDG
15
SDG
14
SDG
13
SDG
12
SDG
11SDG
10 SDG
9
SDG
8
SDG
7
SDG
6
SDG
5
SDG
4
SDG
3
SDG
2
Italy

101SDG Index and Dashboards Report 2018 Global Responsibilities
PAR
T 4. CO
UN
TRY
PR
OFILES
Value Rating Trend
ITALY
SDG1 – End Poverty
Poverty headcount ratio at $1.90/day (% population) 1.1 • 5Projected poverty headcount ratio at $1.90/day in 2030 (% population) 1.1 • ••Poverty rate after taxes and transfers, poverty line 50% (% population) 13.7 • pSDG2 – Zero Hunger Prevalence of undernourishment (% population) 2.5 • ••Prevalence of stunting (low height-for-age) in children under 5 years of age (%) 2.6 • 5Prevalence of wasting in children under 5 years of age (%) 0.7 • 5Prevalence of obesity, BMI ≥ 30 (% adult population) 19.9 • pCereal yield (t/ha) 5.6 • 5Sustainable Nitrogen Management Index 0.7 • ••SDG3 – Good Health and Well-Being Maternal mortality rate (per 100,000 live births) 4.0 • 5Neonatal mortality rate (per 1,000 live births) 2.0 • 5Mortality rate, under-5 (per 1,000 live births) 3.3 • 5Incidence of tuberculosis (per 100,000 population) 6.1 • 5HIV prevalence (per 1,000) 0.1 • 5Age-standardised death rate due to cardiovascular disease, cancer,
diabetes, and chronic respiratory disease in populations age 30–70 years (per 100,000 population)
9.4 • 5
Age-standardised death rate attributable to household air pollution and ambient air pollution (per 100,000 population)
12.9 • ••Traffic deaths rate (per 100,000 population) 5.6 • 5Healthy Life Expectancy at birth (years) 82.7 • 5Adolescent fertility rate (births per 1,000 women ages 15-19) 6.2 • 5Births attended by skilled health personnel (%) 99.9 • ••Surviving infants who received 2 WHO-recommended vaccines (%) 85.0 • pUniversal Health Coverage Tracer Index (0-100) 81.2 • LSubjective Wellbeing (average ladder score, 0-10) 6.2 • pGap in life expectancy at birth among regions (years) 2.8 • ••Gap in self-reported health by income (0-100) 9.1 • ••Daily smokers (% population age 15+) 20.0 • LSDG4 – Quality Education Net primary enrolment rate (%) 97.3 • pMean years of schooling 10.9 • LLiteracy rate of 15-24 year olds, both sexes (%) 99.9 • ••Population age 25-64 with tertiary education (%) 17.7 • LPISA score (0-600) 485.3 • ••Variation in science performance explained by students’ socio-economic
status (%)9.6 • ••
Students performing below level 2 in science (%) 23.2 • pResilient students (%) 26.6 • ••SDG5 – Gender Equality Unmet demand for contraception, estimated (% women married or in
union, ages 15-49 )13.6 • 5
Female to male mean years of schooling, population age 25 + (%) 95.5 • ••Female to male labour force participation rate (%) 67.8 • LSeats held by women in national parliaments (%) 31.0 • LGender wage gap (total, % male median wage) 5.6 • ••SDG6 – Clean Water and Sanitation
High-income countries: population using safely managed water services (%) 93.7 • LOther countries: population using at least basic drinking water services (%) NA • ••High-income countries: population using safely managed sanitation services (%) 95.4 • 5Other countries: population using at least basic sanitation services (%) NA • ••Freshwater withdrawal as % total renewable water resources 44.8 • ••Imported groundwater depletion (m3/year/capita) 7.8 • ••SDG7 – Affordable and Clean Energy Access to electricity (% population) 100.0 • 5Access to clean fuels & technology for cooking (% population) 100.0 • 5CO2 emissions from fuel combustion / electricity output (MtCO2/TWh) 1.2 • LShare of renewable energy in total final energy consumption (%) 16.5 • LSDG8 – Decent Work and Economic Growth Adjusted Growth (%) -2.3 • ••Slavery score (0-100) 80.0 • ••Adults (15 years +) with an account at a bank or other financial institution
or with a mobile-money-service provider (%)93.8 • L
Employment-to-Population ratio (%) 58.0 • pYouth not in employment, education or training (NEET) (%) 26.0 • pSDG9 – Industry, Innovation and Infrastructure Proportion of the population using the internet (%) 61.3 • LMobile broadband subscriptions (per 100 inhabitants) 88.1 • L
Quality of overall infrastructure (1= extremely underdeveloped; 7= extensive and efficient by international standards)
4.3 • L
Logistics performance index: Quality of trade and transport-related infrastructure (1=low to 5=high)
3.8 • ••
The Times Higher Education Universities Ranking, Average score of top 3 universities (0-100)
53.0 • ••
Number of scientific and technical journal articles (per 1,000 population) 1.2 • ••Research and development expenditure (% GDP) 1.3 • ••Research and development researchers (per 1,000 employed) 5.1 • DTriadic patent families filed (per million population) 13.2 • 5Gap in internet access by income (%) 51.2 • ••Women in science and engineering (%) NA • ••SDG10 – Reduced Inequalities Gini Coefficient adjusted for top income (1-100) 38.2 • 5Palma ratio 1.2 • 5Elderly Poverty Rate (%) 9.3 • ••SDG11 – Sustainable Cities and Communities Annual mean concentration of particulate matter of less than 2.5 microns
of diameter (PM2.5) in urban areas (μg/m3)19.9 • p
Improved water source, piped (% urban population with access) 100.0 • 5Satisfaction with public transport (%) 41.0 • pRent overburden rate (%) 11.4 • ••SDG12 – Responsible Consumption and Production E-waste generated (kg/capita) 17.6 • ••Anthropogenic wastewater that receives treatment (%) 79.6 • ••Production-based SO2 emissions (kg/capita) 5.9 • ••Net imported SO2 emissions (kg/capita) 17.9 • ••Reactive nitrogen production footprint (kg/capita) 38.3 • ••Net imported emissions of reactive nitrogen (kg/capita) 172.6 • ••Non-Recycled Municipal Solid Waste (MSW in kg/person/day) 1.6 • ••SDG13 – Climate Action Energy-related CO2 emissions per capita (tCO2/capita) 5.3 • LImported CO2 emissions, technology-adjusted (tCO2/capita) 1.2 • ••Climate Change Vulnerability Monitor (best 0-1 worst) 0.0 • ••CO2 emissions embodied in fossil fuel exports (kg/capita) 49.6 • ••Effective Carbon Rate from all non-road energy, excluding emissions
from biomass (€/tCO2)20.5 • ••
SDG14 – Life Below Water Mean area that is protected in marine sites important to biodiversity (%) 75.5 • ••Ocean Health Index Goal-Biodiversity (0-100) 91.3 • 5Ocean Health Index Goal-Clean Waters (0-100) 51.4 • pOcean Health Index Goal-Fisheries (0-100) 42.7 • pFish Stocks overexploited or collapsed by EEZ (%) 75.1 • ••Fish caught by trawling (%) 51.8 • D
SDG15 – Life on Land Mean area that is protected in terrestrial sites important to biodiversity (%) 78.2 • 5Mean area that is protected in freshwater sites important to biodiversity (%) 84.7 • 5Red List Index of species survival (0-1) 0.9 • 5Annual change in forest area (%) 2.4 • ••Imported biodiversity threats (threats per million population) 7.0 • ••SDG16 – Peace, Justice and Strong Institutions Homicides (per 100,000 population) 0.8 • ••Prison population (per 100,000 population) 89.3 • ••Population who feel safe walking alone at night in city or area where they live (%) 58.0 • LGovernment Efficiency (1-7) 2.3 • pProperty Rights (1-7) 4.2 • pBirth registrations with civil authority, children under 5 years of age (%) 100.0 • ••Corruption Perception Index (0-100) 50.0 • DChildren 5–14 years old involved in child labour (%) 0.0 • ••Transfers of major conventional weapons (exports)
(constant 1990 US$ million per 100,000 population)1.2 • ••
SDG17 – Partnerships for the Goals Government Health and Education spending (% GDP) 13.3 • 5High-income and all OECD DAC countries: International concessional
public finance, including official development assistance (% GNI)0.3 • p
Other countries: Tax revenue (% GDP) NA • ••Tax Haven Score (best 0-5 worst) 0.0 • ••Financial Secrecy Score (best 0-100 worst) 49.5 • ••
Value Rating Trend
Performance by Indicator

SDG Index and Dashboards Report 2018 Global Responsibilities102
AVERAGE PERFORMANCE BY SDG
SDG TRENDS
•• 5 D L 5 5 D L L
•• •• •• p 5 D D D
Notes: The full title of Goal 2 “Zero Hunger” is “End hunger, achieve food security and improved nutrition and promote sustainable agriculture”. The full title of each SDG is available here: https://sustainabledevelopment.un.org/topics/sustainabledevelopmentgoals
OECD Countries
OVERALL PERFORMANCE
Index score Regional average score
SDG Global rank
15 (OF 156)
JAPAN
78.5 76.9
100
75
50
25
SDG
1SDG
17SDG
16
SDG
15
SDG
14
SDG
13
SDG
12
SDG
11SDG
10 SDG
9
SDG
8
SDG
7
SDG
6
SDG
5
SDG
4
SDG
3
SDG
2
Japan
CURRENT ASSESSMENT – SDG DASHBOARD
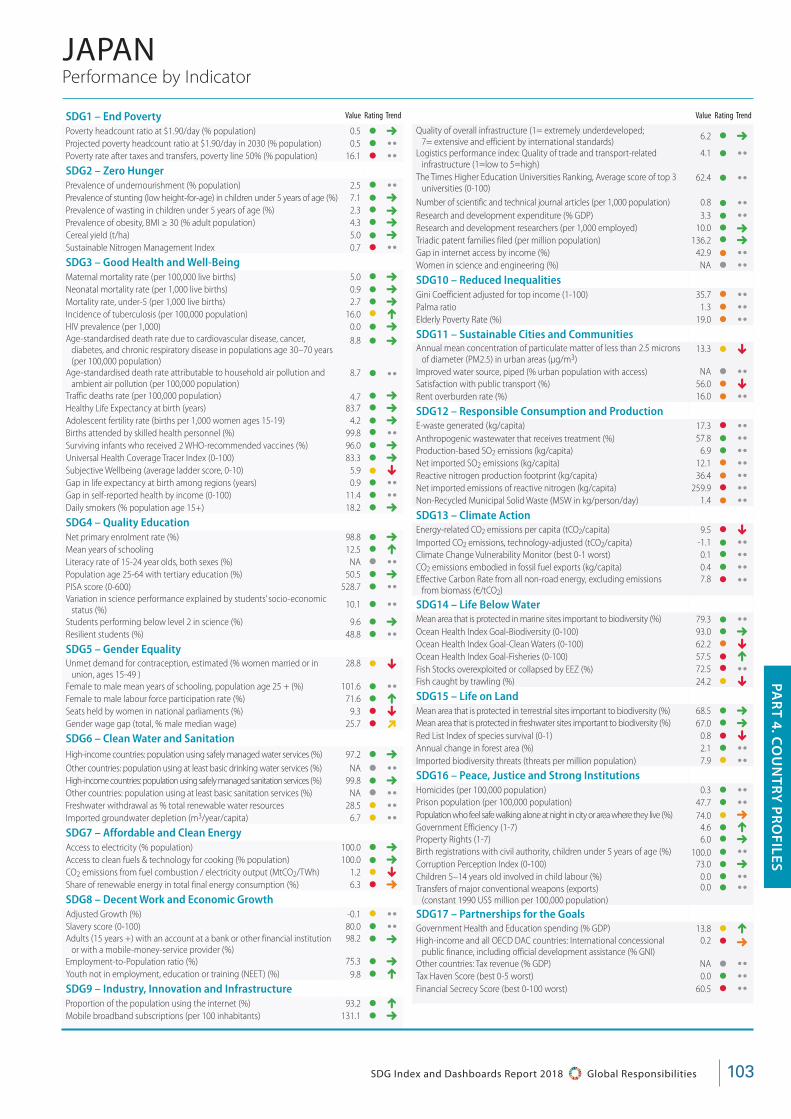
103SDG Index and Dashboards Report 2018 Global Responsibilities
PAR
T 4. CO
UN
TRY
PR
OFILES
JAPAN
SDG1 – End Poverty
Poverty headcount ratio at $1.90/day (% population) 0.5 • 5Projected poverty headcount ratio at $1.90/day in 2030 (% population) 0.5 • ••Poverty rate after taxes and transfers, poverty line 50% (% population) 16.1 • ••SDG2 – Zero Hunger Prevalence of undernourishment (% population) 2.5 • ••Prevalence of stunting (low height-for-age) in children under 5 years of age (%) 7.1 • 5Prevalence of wasting in children under 5 years of age (%) 2.3 • 5Prevalence of obesity, BMI ≥ 30 (% adult population) 4.3 • 5Cereal yield (t/ha) 5.0 • 5Sustainable Nitrogen Management Index 0.7 • ••SDG3 – Good Health and Well-Being Maternal mortality rate (per 100,000 live births) 5.0 • 5Neonatal mortality rate (per 1,000 live births) 0.9 • 5Mortality rate, under-5 (per 1,000 live births) 2.7 • 5Incidence of tuberculosis (per 100,000 population) 16.0 • LHIV prevalence (per 1,000) 0.0 • 5Age-standardised death rate due to cardiovascular disease, cancer,
diabetes, and chronic respiratory disease in populations age 30–70 years (per 100,000 population)
8.8 • 5
Age-standardised death rate attributable to household air pollution and ambient air pollution (per 100,000 population)
8.7 • ••Traffic deaths rate (per 100,000 population) 4.7 • 5Healthy Life Expectancy at birth (years) 83.7 • 5Adolescent fertility rate (births per 1,000 women ages 15-19) 4.2 • 5Births attended by skilled health personnel (%) 99.8 • ••Surviving infants who received 2 WHO-recommended vaccines (%) 96.0 • 5Universal Health Coverage Tracer Index (0-100) 83.3 • 5Subjective Wellbeing (average ladder score, 0-10) 5.9 • pGap in life expectancy at birth among regions (years) 0.9 • ••Gap in self-reported health by income (0-100) 11.4 • ••Daily smokers (% population age 15+) 18.2 • 5
SDG4 – Quality Education Net primary enrolment rate (%) 98.8 • 5Mean years of schooling 12.5 • LLiteracy rate of 15-24 year olds, both sexes (%) NA • ••Population age 25-64 with tertiary education (%) 50.5 • 5PISA score (0-600) 528.7 • ••Variation in science performance explained by students’ socio-economic
status (%)10.1 • ••
Students performing below level 2 in science (%) 9.6 • 5Resilient students (%) 48.8 • ••SDG5 – Gender Equality Unmet demand for contraception, estimated (% women married or in
union, ages 15-49 )28.8 • p
Female to male mean years of schooling, population age 25 + (%) 101.6 • ••Female to male labour force participation rate (%) 71.6 • LSeats held by women in national parliaments (%) 9.3 • pGender wage gap (total, % male median wage) 25.7 • D
SDG6 – Clean Water and Sanitation
High-income countries: population using safely managed water services (%) 97.2 • 5Other countries: population using at least basic drinking water services (%) NA • ••High-income countries: population using safely managed sanitation services (%) 99.8 • 5Other countries: population using at least basic sanitation services (%) NA • ••Freshwater withdrawal as % total renewable water resources 28.5 • ••Imported groundwater depletion (m3/year/capita) 6.7 • ••SDG7 – Affordable and Clean Energy Access to electricity (% population) 100.0 • 5Access to clean fuels & technology for cooking (% population) 100.0 • 5CO2 emissions from fuel combustion / electricity output (MtCO2/TWh) 1.2 • pShare of renewable energy in total final energy consumption (%) 6.3 • 5
SDG8 – Decent Work and Economic Growth Adjusted Growth (%) -0.1 • ••Slavery score (0-100) 80.0 • ••Adults (15 years +) with an account at a bank or other financial institution
or with a mobile-money-service provider (%)98.2 • 5
Employment-to-Population ratio (%) 75.3 • 5Youth not in employment, education or training (NEET) (%) 9.8 • LSDG9 – Industry, Innovation and Infrastructure Proportion of the population using the internet (%) 93.2 • LMobile broadband subscriptions (per 100 inhabitants) 131.1 • 5
Quality of overall infrastructure (1= extremely underdeveloped; 7= extensive and efficient by international standards)
6.2 • 5
Logistics performance index: Quality of trade and transport-related infrastructure (1=low to 5=high)
4.1 • ••
The Times Higher Education Universities Ranking, Average score of top 3 universities (0-100)
62.4 • ••
Number of scientific and technical journal articles (per 1,000 population) 0.8 • ••Research and development expenditure (% GDP) 3.3 • ••Research and development researchers (per 1,000 employed) 10.0 • 5Triadic patent families filed (per million population) 136.2 • 5Gap in internet access by income (%) 42.9 • ••Women in science and engineering (%) NA • ••SDG10 – Reduced Inequalities Gini Coefficient adjusted for top income (1-100) 35.7 • ••Palma ratio 1.3 • ••Elderly Poverty Rate (%) 19.0 • ••SDG11 – Sustainable Cities and Communities Annual mean concentration of particulate matter of less than 2.5 microns
of diameter (PM2.5) in urban areas (μg/m3)13.3 • p
Improved water source, piped (% urban population with access) NA • ••Satisfaction with public transport (%) 56.0 • pRent overburden rate (%) 16.0 • ••SDG12 – Responsible Consumption and Production E-waste generated (kg/capita) 17.3 • ••Anthropogenic wastewater that receives treatment (%) 57.8 • ••Production-based SO2 emissions (kg/capita) 6.9 • ••Net imported SO2 emissions (kg/capita) 12.1 • ••Reactive nitrogen production footprint (kg/capita) 36.4 • ••Net imported emissions of reactive nitrogen (kg/capita) 259.9 • ••Non-Recycled Municipal Solid Waste (MSW in kg/person/day) 1.4 • ••SDG13 – Climate Action Energy-related CO2 emissions per capita (tCO2/capita) 9.5 • pImported CO2 emissions, technology-adjusted (tCO2/capita) -1.1 • ••Climate Change Vulnerability Monitor (best 0-1 worst) 0.1 • ••CO2 emissions embodied in fossil fuel exports (kg/capita) 0.4 • ••Effective Carbon Rate from all non-road energy, excluding emissions
from biomass (€/tCO2)7.8 • ••
SDG14 – Life Below Water Mean area that is protected in marine sites important to biodiversity (%) 79.3 • ••Ocean Health Index Goal-Biodiversity (0-100) 93.0 • 5Ocean Health Index Goal-Clean Waters (0-100) 62.2 • pOcean Health Index Goal-Fisheries (0-100) 57.5 • LFish Stocks overexploited or collapsed by EEZ (%) 72.5 • ••Fish caught by trawling (%) 24.2 • pSDG15 – Life on Land Mean area that is protected in terrestrial sites important to biodiversity (%) 68.5 • 5Mean area that is protected in freshwater sites important to biodiversity (%) 67.0 • 5Red List Index of species survival (0-1) 0.8 • pAnnual change in forest area (%) 2.1 • ••Imported biodiversity threats (threats per million population) 7.9 • ••SDG16 – Peace, Justice and Strong Institutions Homicides (per 100,000 population) 0.3 • ••Prison population (per 100,000 population) 47.7 • ••Population who feel safe walking alone at night in city or area where they live (%) 74.0 • 5Government Efficiency (1-7) 4.6 • LProperty Rights (1-7) 6.0 • 5Birth registrations with civil authority, children under 5 years of age (%) 100.0 • ••Corruption Perception Index (0-100) 73.0 • 5Children 5–14 years old involved in child labour (%) 0.0 • ••Transfers of major conventional weapons (exports)
(constant 1990 US$ million per 100,000 population)0.0 • ••
SDG17 – Partnerships for the Goals Government Health and Education spending (% GDP) 13.8 • LHigh-income and all OECD DAC countries: International concessional
public finance, including official development assistance (% GNI)0.2 • 5
Other countries: Tax revenue (% GDP) NA • ••Tax Haven Score (best 0-5 worst) 0.0 • ••Financial Secrecy Score (best 0-100 worst) 60.5 • ••
Value Rating Trend
Performance by Indicator
Value Rating Trend
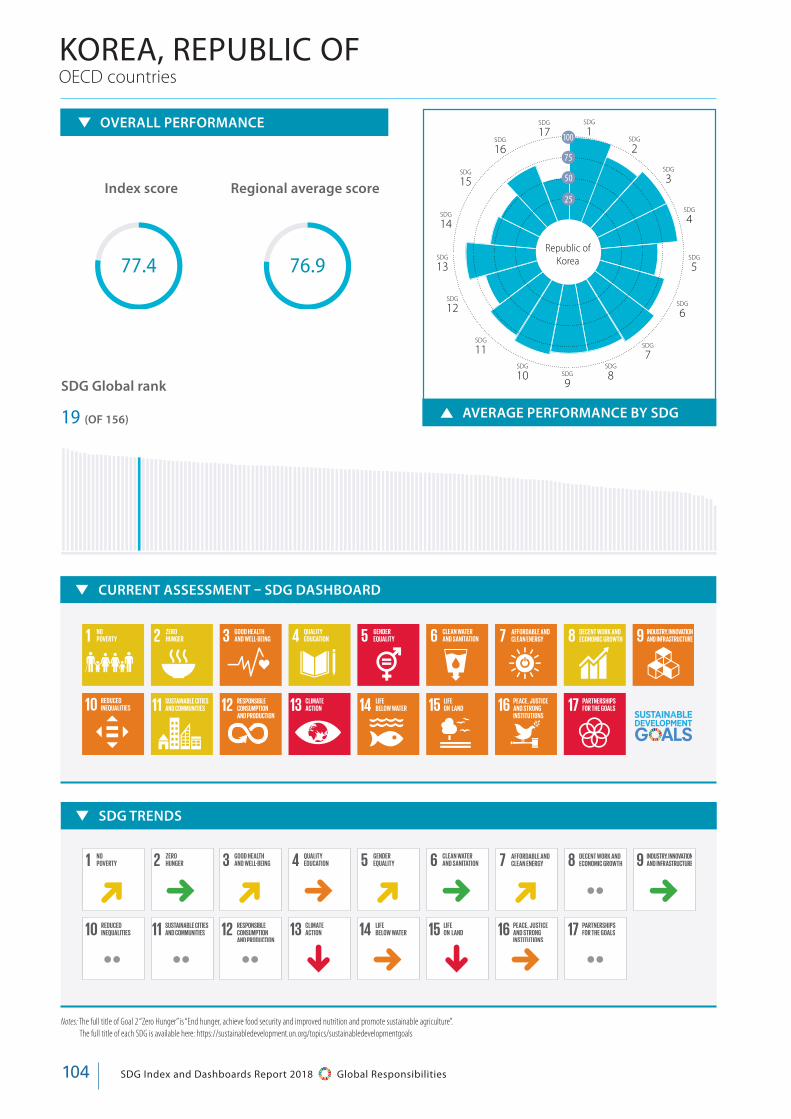
SDG Index and Dashboards Report 2018 Global Responsibilities104
AVERAGE PERFORMANCE BY SDG
Notes: The full title of Goal 2 “Zero Hunger” is “End hunger, achieve food security and improved nutrition and promote sustainable agriculture”. The full title of each SDG is available here: https://sustainabledevelopment.un.org/topics/sustainabledevelopmentgoals
OVERALL PERFORMANCE
Index score Regional average score
SDG Global rank
19 (OF 156)
OECD countriesKOREA, REPUBLIC OF
SDG TRENDS
D 5 D 5 D 5 D •• 5
•• •• •• p 5 p 5 ••
77.4 76.9 5
100
75
50
25
SDG
1SDG
17SDG
16
SDG
15
SDG
14
SDG
13
SDG
12
SDG
11SDG
10 SDG
9
SDG
8
SDG
7
SDG
6
SDG
SDG
4
SDG
3
SDG
2
Republic of Korea
CURRENT ASSESSMENT – SDG DASHBOARD

105SDG Index and Dashboards Report 2018 Global Responsibilities
PAR
T 4. CO
UN
TRY
PR
OFILES
PAR
T 4. CO
UN
TRY
PR
OFILES
Performance by IndicatorKOREA, REPUBLIC OF
SDG1 – End Poverty
Poverty headcount ratio at $1.90/day (% population) 0.5 • 5Projected poverty headcount ratio at $1.90/day in 2030 (% population) 0.5 • ••Poverty rate after taxes and transfers, poverty line 50% (% population) 13.8 • D
SDG2 – Zero Hunger Prevalence of undernourishment (% population) 2.5 • ••Prevalence of stunting (low height-for-age) in children under 5 years of age (%) 2.5 • 5Prevalence of wasting in children under 5 years of age (%) 0.9 • 5Prevalence of obesity, BMI ≥ 30 (% adult population) 4.7 • 5Cereal yield (t/ha) 6.8 • 5Sustainable Nitrogen Management Index 0.6 • ••SDG3 – Good Health and Well-Being Maternal mortality rate (per 100,000 live births) 11.0 • 5Neonatal mortality rate (per 1,000 live births) 1.5 • 5Mortality rate, under-5 (per 1,000 live births) 3.4 • 5Incidence of tuberculosis (per 100,000 population) 77.0 • DHIV prevalence (per 1,000) 0.0 • 5Age-standardised death rate due to cardiovascular disease, cancer,
diabetes, and chronic respiratory disease in populations age 30–70 years (per 100,000 population)
8.3 • 5
Age-standardised death rate attributable to household air pollution and ambient air pollution (per 100,000 population)
16.5 • ••Traffic deaths rate (per 100,000 population) 12.0 • LHealthy Life Expectancy at birth (years) 82.3 • 5Adolescent fertility rate (births per 1,000 women ages 15-19) 1.7 • 5Births attended by skilled health personnel (%) 100.0 • ••Surviving infants who received 2 WHO-recommended vaccines (%) 98.0 • 5Universal Health Coverage Tracer Index (0-100) 81.6 • LSubjective Wellbeing (average ladder score, 0-10) 5.9 • pGap in life expectancy at birth among regions (years) 2.4 • ••Gap in self-reported health by income (0-100) 11.9 • ••Daily smokers (% population age 15+) 17.3 • LSDG4 – Quality Education Net primary enrolment rate (%) 96.8 • pMean years of schooling 12.2 • LLiteracy rate of 15-24 year olds, both sexes (%) NA • ••Population age 25-64 with tertiary education (%) 46.9 • 5PISA score (0-600) 519.0 • ••Variation in science performance explained by students’ socio-economic
status (%)10.1 • ••
Students performing below level 2 in science (%) 14.4 • pResilient students (%) 40.4 • ••SDG5 – Gender Equality Unmet demand for contraception, estimated (% women married or in
union, ages 15-49 )6.7 • 5
Female to male mean years of schooling, population age 25 + (%) 89.1 • ••Female to male labour force participation rate (%) 71.4 • LSeats held by women in national parliaments (%) 17.0 • 5Gender wage gap (total, % male median wage) 36.7 • 5
SDG6 – Clean Water and Sanitation
High-income countries: population using safely managed water services (%) 98.0 • 5Other countries: population using at least basic drinking water services (%) NA • ••High-income countries: population using safely managed sanitation services (%) 98.5 • 5Other countries: population using at least basic sanitation services (%) NA • ••Freshwater withdrawal as % total renewable water resources 57.6 • ••Imported groundwater depletion (m3/year/capita) 10.8 • ••SDG7 – Affordable and Clean Energy Access to electricity (% population) 100.0 • 5Access to clean fuels & technology for cooking (% population) 100.0 • 5CO2 emissions from fuel combustion / electricity output (MtCO2/TWh) 1.1 • LShare of renewable energy in total final energy consumption (%) 2.7 • 5
SDG8 – Decent Work and Economic Growth Adjusted Growth (%) -0.5 • ••Slavery score (0-100) 80.0 • ••Adults (15 years +) with an account at a bank or other financial institution
or with a mobile-money-service provider (%)94.9 • 5
Employment-to-Population ratio (%) 66.6 • 5Youth not in employment, education or training (NEET) (%) NA • ••SDG9 – Industry, Innovation and Infrastructure Proportion of the population using the internet (%) 92.8 • 5Mobile broadband subscriptions (per 100 inhabitants) 109.7 • 5
Quality of overall infrastructure (1= extremely underdeveloped; 7= extensive and efficient by international standards)
5.7 • 5
Logistics performance index: Quality of trade and transport-related infrastructure (1=low to 5=high)
3.8 • ••
The Times Higher Education Universities Ranking, Average score of top 3 universities (0-100)
61.7 • ••
Number of scientific and technical journal articles (per 1,000 population) 1.2 • ••Research and development expenditure (% GDP) 4.2 • ••Research and development researchers (per 1,000 employed) 13.8 • 5Triadic patent families filed (per million population) 53.0 • 5Gap in internet access by income (%) 13.0 • ••Women in science and engineering (%) 24.0 • ••SDG10 – Reduced Inequalities Gini Coefficient adjusted for top income (1-100) 32.3 • ••Palma ratio 1.0 • LElderly Poverty Rate (%) 45.7 • ••SDG11 – Sustainable Cities and Communities Annual mean concentration of particulate matter of less than 2.5 microns
of diameter (PM2.5) in urban areas (μg/m3)28.7 • p
Improved water source, piped (% urban population with access) NA • ••Satisfaction with public transport (%) 75.0 • LRent overburden rate (%) 3.5 • ••SDG12 – Responsible Consumption and Production E-waste generated (kg/capita) 15.9 • ••Anthropogenic wastewater that receives treatment (%) 84.8 • ••Production-based SO2 emissions (kg/capita) 14.5 • ••Net imported SO2 emissions (kg/capita) 11.2 • ••Reactive nitrogen production footprint (kg/capita) 33.9 • ••Net imported emissions of reactive nitrogen (kg/capita) NA • ••Non-Recycled Municipal Solid Waste (MSW in kg/person/day) 0.5 • ••SDG13 – Climate Action Energy-related CO2 emissions per capita (tCO2/capita) 11.6 • pImported CO2 emissions, technology-adjusted (tCO2/capita) -1.6 • ••Climate Change Vulnerability Monitor (best 0-1 worst) 0.0 • ••CO2 emissions embodied in fossil fuel exports (kg/capita) 0.8 • ••Effective Carbon Rate from all non-road energy, excluding emissions
from biomass (€/tCO2)9.9 • ••
SDG14 – Life Below Water Mean area that is protected in marine sites important to biodiversity (%) 26.8 • ••Ocean Health Index Goal-Biodiversity (0-100) 94.8 • 5Ocean Health Index Goal-Clean Waters (0-100) 64.0 • pOcean Health Index Goal-Fisheries (0-100) 50.7 • DFish Stocks overexploited or collapsed by EEZ (%) 7.0 • ••Fish caught by trawling (%) 45.1 • 5
SDG15 – Life on Land Mean area that is protected in terrestrial sites important to biodiversity (%) 36.6 • 5Mean area that is protected in freshwater sites important to biodiversity (%) 36.8 • 5Red List Index of species survival (0-1) 0.8 • pAnnual change in forest area (%) 3.5 • ••Imported biodiversity threats (threats per million population) 7.3 • ••SDG16 – Peace, Justice and Strong Institutions Homicides (per 100,000 population) 0.7 • ••Prison population (per 100,000 population) 107.4 • ••Population who feel safe walking alone at night in city or area where they live (%) 69.0 • LGovernment Efficiency (1-7) 3.5 • pProperty Rights (1-7) 4.8 • pBirth registrations with civil authority, children under 5 years of age (%) NA • ••Corruption Perception Index (0-100) 54.0 • pChildren 5–14 years old involved in child labour (%) 0.0 • ••Transfers of major conventional weapons (exports)
(constant 1990 US$ million per 100,000 population)0.6 • ••
SDG17 – Partnerships for the Goals Government Health and Education spending (% GDP) 11.6 • ••High-income and all OECD DAC countries: International concessional
public finance, including official development assistance (% GNI)0.1 • 5
Other countries: Tax revenue (% GDP) NA • ••Tax Haven Score (best 0-5 worst) 0.0 • ••Financial Secrecy Score (best 0-100 worst) 59.0 • ••
Value Rating Trend
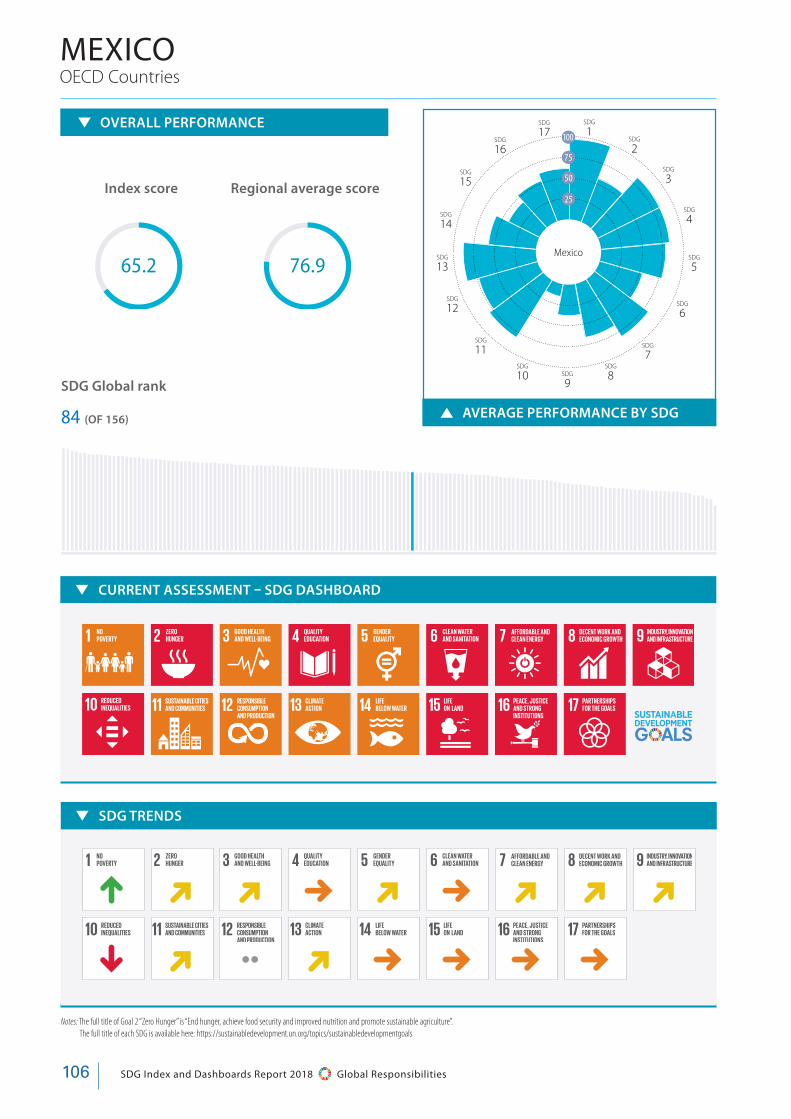
SDG Index and Dashboards Report 2018 Global Responsibilities106
AVERAGE PERFORMANCE BY SDG
SDG TRENDS
L D D 5 D 5 D D D
p D •• D 5 5 5 5
Notes: The full title of Goal 2 “Zero Hunger” is “End hunger, achieve food security and improved nutrition and promote sustainable agriculture”. The full title of each SDG is available here: https://sustainabledevelopment.un.org/topics/sustainabledevelopmentgoals
OECD Countries
OVERALL PERFORMANCE
Index score Regional average score
SDG Global rank
84 (OF 156)
MEXICO
65.2 76.9
100
75
50
25
SDG
1SDG
17SDG
16
SDG
15
SDG
14
SDG
13
SDG
12
SDG
11SDG
10 SDG
9
SDG
8
SDG
7
SDG
6
SDG
5
SDG
4
SDG
3
SDG
2
Mexico
CURRENT ASSESSMENT – SDG DASHBOARD

107SDG Index and Dashboards Report 2018 Global Responsibilities
PAR
T 4. CO
UN
TRY
PR
OFILES
MEXICO
SDG1 – End Poverty
Poverty headcount ratio at $1.90/day (% population) 2.9 • LProjected poverty headcount ratio at $1.90/day in 2030 (% population) 1.2 • ••Poverty rate after taxes and transfers, poverty line 50% (% population) 16.7 • LSDG2 – Zero Hunger Prevalence of undernourishment (% population) 4.2 • ••Prevalence of stunting (low height-for-age) in children under 5 years of age (%) 13.6 • LPrevalence of wasting in children under 5 years of age (%) 1.6 • 5Prevalence of obesity, BMI ≥ 30 (% adult population) 28.9 • pCereal yield (t/ha) 3.7 • 5Sustainable Nitrogen Management Index 0.9 • ••SDG3 – Good Health and Well-Being Maternal mortality rate (per 100,000 live births) 38.0 • 5Neonatal mortality rate (per 1,000 live births) 7.8 • 5Mortality rate, under-5 (per 1,000 live births) 14.6 • 5Incidence of tuberculosis (per 100,000 population) 22.0 • 5HIV prevalence (per 1,000) 0.1 • 5Age-standardised death rate due to cardiovascular disease, cancer, diabetes,
and chronic respiratory disease in populations age 30–70 years (per 100,000 population)
15.2 • L
Age-standardised death rate attributable to household air pollution and ambient air pollution (per 100,000 population)
31.4 • ••Traffic deaths rate (per 100,000 population) 11.8 • LHealthy Life Expectancy at birth (years) 76.7 • 5Adolescent fertility rate (births per 1,000 women ages 15-19) 61.4 • 5Births attended by skilled health personnel (%) 95.6 • ••Surviving infants who received 2 WHO-recommended vaccines (%) 96.0 • pUniversal Health Coverage Tracer Index (0-100) 60.7 • 5Subjective Wellbeing (average ladder score, 0-10) 6.4 • 5Gap in life expectancy at birth among regions (years) 4.3 • ••Gap in self-reported health by income (0-100) NA • ••Daily smokers (% population age 15+) 7.6 • 5
SDG4 – Quality Education Net primary enrolment rate (%) 95.5 • 5Mean years of schooling 8.6 • 5Literacy rate of 15-24 year olds, both sexes (%) 98.9 • ••Population age 25-64 with tertiary education (%) 16.8 • DPISA score (0-600) 415.7 • ••Variation in science performance explained by students’ socio-economic
status (%)10.9 • ••
Students performing below level 2 in science (%) 47.8 • pResilient students (%) 12.8 • ••SDG5 – Gender Equality Unmet demand for contraception, estimated (% women married or in
union, ages 15-49 )12.6 • 5
Female to male mean years of schooling, population age 25 + (%) 95.3 • ••Female to male labour force participation rate (%) 55.9 • 5Seats held by women in national parliaments (%) 42.6 • LGender wage gap (total, % male median wage) 16.5 • pSDG6 – Clean Water and Sanitation
High-income countries: population using safely managed water services (%) 42.6 • 5Other countries: population using at least basic drinking water services (%) NA • ••High-income countries: population using safely managed sanitation services (%) 45.2 • DOther countries: population using at least basic sanitation services (%) NA • ••Freshwater withdrawal as % total renewable water resources 24.1 • ••Imported groundwater depletion (m3/year/capita) 8.6 • ••SDG7 – Affordable and Clean Energy Access to electricity (% population) 99.2 • 5Access to clean fuels & technology for cooking (% population) 86.2 • LCO2 emissions from fuel combustion / electricity output (MtCO2/TWh) 1.5 • LShare of renewable energy in total final energy consumption (%) 9.2 • pSDG8 – Decent Work and Economic Growth Adjusted Growth (%) -3.0 • ••Slavery score (0-100) 80.0 • ••Adults (15 years +) with an account at a bank or other financial institution or
with a mobile-money-service provider (%)36.9 • L
Employment-to-Population ratio (%) 61.1 • 5Youth not in employment, education or training (NEET) (%) 21.8 • D
SDG9 – Industry, Innovation and Infrastructure Proportion of the population using the internet (%) 59.5 • LMobile broadband subscriptions (per 100 inhabitants) 58.9 • L
Quality of overall infrastructure (1= extremely underdeveloped; 7= extensive and efficient by international standards)
4.1 • L
Logistics performance index: Quality of trade and transport-related infrastructure (1=low to 5=high)
2.9 • ••
The Times Higher Education Universities Ranking, Average score of top 3 universities (0-100)
23.5 • ••
Number of scientific and technical journal articles (per 1,000 population) 0.1 • ••Research and development expenditure (% GDP) 0.6 • ••Research and development researchers (per 1,000 employed) 0.8 • ••Triadic patent families filed (per million population) 0.1 • 5Gap in internet access by income (%) NA • ••Women in science and engineering (%) 29.2 • ••SDG10 – Reduced Inequalities Gini Coefficient adjusted for top income (1-100) 57.8 • pPalma ratio 2.5 • 5Elderly Poverty Rate (%) 25.6 • ••SDG11 – Sustainable Cities and Communities Annual mean concentration of particulate matter of less than 2.5 microns of
diameter (PM2.5) in urban areas (μg/m3)20.2 • 5
Improved water source, piped (% urban population with access) 97.8 • LSatisfaction with public transport (%) 60.0 • 5Rent overburden rate (%) 7.7 • ••SDG12 – Responsible Consumption and Production E-waste generated (kg/capita) 8.2 • ••Anthropogenic wastewater that receives treatment (%) 45.6 • ••Production-based SO2 emissions (kg/capita) 16.0 • ••Net imported SO2 emissions (kg/capita) -1.3 • ••Reactive nitrogen production footprint (kg/capita) 27.8 • ••Net imported emissions of reactive nitrogen (kg/capita) 34.4 • ••Non-Recycled Municipal Solid Waste (MSW in kg/person/day) 1.2 • ••SDG13 – Climate Action Energy-related CO2 emissions per capita (tCO2/capita) 3.9 • DImported CO2 emissions, technology-adjusted (tCO2/capita) 0.6 • ••Climate Change Vulnerability Monitor (best 0-1 worst) 0.0 • ••CO2 emissions embodied in fossil fuel exports (kg/capita) 980.7 • ••Effective Carbon Rate from all non-road energy, excluding emissions
from biomass (€/tCO2)0.3 • ••
SDG14 – Life Below Water Mean area that is protected in marine sites important to biodiversity (%) 77.6 • ••Ocean Health Index Goal-Biodiversity (0-100) 92.0 • 5Ocean Health Index Goal-Clean Waters (0-100) 63.6 • pOcean Health Index Goal-Fisheries (0-100) 26.2 • pFish Stocks overexploited or collapsed by EEZ (%) 34.4 • ••Fish caught by trawling (%) 12.4 • D
SDG15 – Life on Land Mean area that is protected in terrestrial sites important to biodiversity (%) 31.0 • 5Mean area that is protected in freshwater sites important to biodiversity (%) 9.2 • 5Red List Index of species survival (0-1) 0.7 • pAnnual change in forest area (%) 5.8 • ••Imported biodiversity threats (threats per million population) 1.3 • ••SDG16 – Peace, Justice and Strong Institutions Homicides (per 100,000 population) 16.4 • ••Prison population (per 100,000 population) 174.3 • ••Population who feel safe walking alone at night in city or area where they live (%) 40.0 • pGovernment Efficiency (1-7) 2.9 • pProperty Rights (1-7) 4.0 • DBirth registrations with civil authority, children under 5 years of age (%) 95.0 • ••Corruption Perception Index (0-100) 29.0 • pChildren 5–14 years old involved in child labour (%) 12.4 • ••Transfers of major conventional weapons (exports)
(constant 1990 US$ million per 100,000 population)0.0 • ••
SDG17 – Partnerships for the Goals Government Health and Education spending (% GDP) 11.6 • DHigh-income and all OECD DAC countries: International concessional public
finance, including official development assistance (% GNI)NA • ••
Other countries: Tax revenue (% GDP) 13.9 • 5Tax Haven Score (best 0-5 worst) 0.0 • ••Financial Secrecy Score (best 0-100 worst) 54.4 • ••
Value Rating Trend
Performance by Indicator
Value Rating Trend
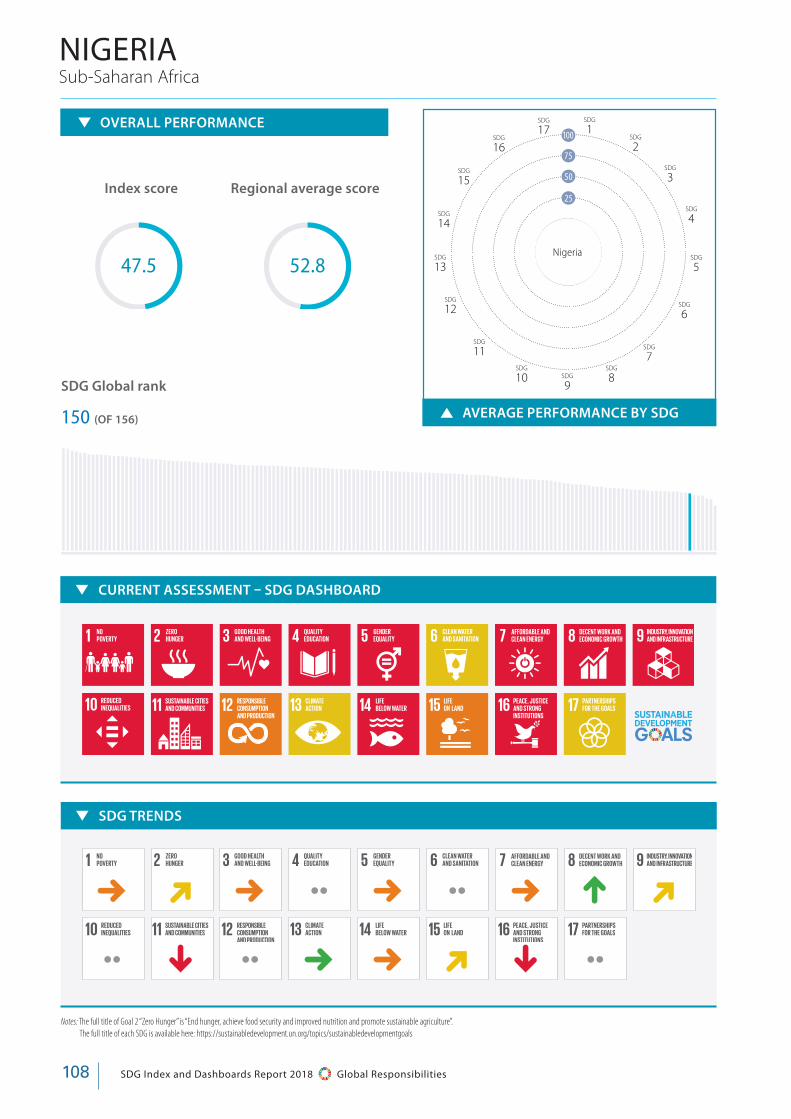
SDG Index and Dashboards Report 2018 Global Responsibilities108
AVERAGE PERFORMANCE BY SDG
Notes: The full title of Goal 2 “Zero Hunger” is “End hunger, achieve food security and improved nutrition and promote sustainable agriculture”. The full title of each SDG is available here: https://sustainabledevelopment.un.org/topics/sustainabledevelopmentgoals
OVERALL PERFORMANCE
Index score Regional average score
SDG Global rank
150 (OF 156)
Sub-Saharan AfricaNIGERIA
SDG TRENDS
5 D 5 •• 5 •• 5 L D
•• p •• 5 5 D p ••
52.847.5
100
75
50
25
SDG
1SDG
17SDG
16
SDG
15
SDG
14
SDG
13
SDG
12
SDG
11SDG
10 SDG
9
SDG
8
SDG
7
SDG
6
SDG
5
SDG
4
SDG
3
SDG
2
Nigeria
CURRENT ASSESSMENT – SDG DASHBOARD
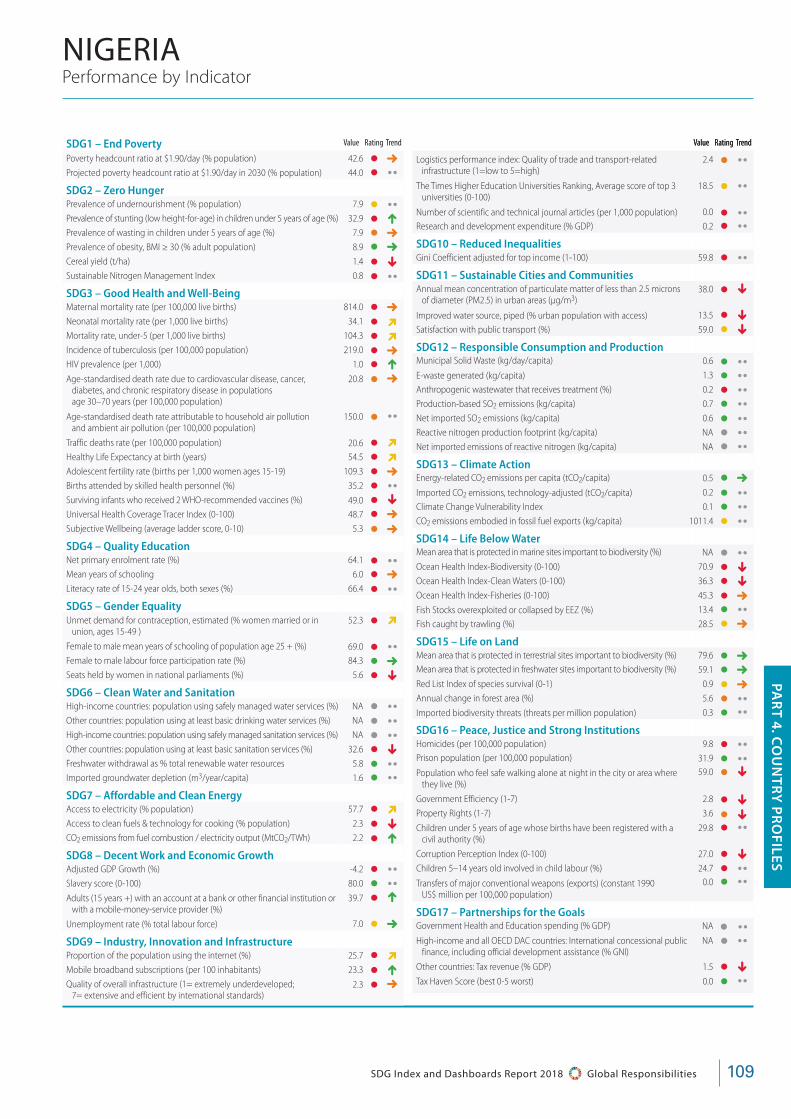
109SDG Index and Dashboards Report 2018 Global Responsibilities
PAR
T 4. CO
UN
TRY
PR
OFILES
Performance by Indicator
Value Rating Trend
NIGERIA
Logistics performance index: Quality of trade and transport-related infrastructure (1=low to 5=high)
2.4 • ••
The Times Higher Education Universities Ranking, Average score of top 3 universities (0-100)
18.5 • ••
Number of scientific and technical journal articles (per 1,000 population) 0.0 • ••Research and development expenditure (% GDP) 0.2 • ••SDG10 – Reduced Inequalities Gini Coefficient adjusted for top income (1-100) 59.8 • ••SDG11 – Sustainable Cities and Communities
Annual mean concentration of particulate matter of less than 2.5 microns of diameter (PM2.5) in urban areas (μg/m3)
38.0 • p
Improved water source, piped (% urban population with access) 13.5 • pSatisfaction with public transport (%) 59.0 • p
SDG12 – Responsible Consumption and Production Municipal Solid Waste (kg/day/capita) 0.6 • ••E-waste generated (kg/capita) 1.3 • ••Anthropogenic wastewater that receives treatment (%) 0.2 • ••Production-based SO2 emissions (kg/capita) 0.7 • ••Net imported SO2 emissions (kg/capita) 0.6 • ••Reactive nitrogen production footprint (kg/capita) NA • ••Net imported emissions of reactive nitrogen (kg/capita) NA • ••SDG13 – Climate Action
Energy-related CO2 emissions per capita (tCO2/capita) 0.5 • 5Imported CO2 emissions, technology-adjusted (tCO2/capita) 0.2 • ••Climate Change Vulnerability Index 0.1 • ••CO2 emissions embodied in fossil fuel exports (kg/capita) 1011.4 • ••SDG14 – Life Below Water
Mean area that is protected in marine sites important to biodiversity (%) NA • ••Ocean Health Index-Biodiversity (0-100) 70.9 • pOcean Health Index-Clean Waters (0-100) 36.3 • pOcean Health Index-Fisheries (0-100) 45.3 • 5Fish Stocks overexploited or collapsed by EEZ (%) 13.4 • ••Fish caught by trawling (%) 28.5 • 5
SDG15 – Life on Land Mean area that is protected in terrestrial sites important to biodiversity (%) 79.6 • 5Mean area that is protected in freshwater sites important to biodiversity (%) 59.1 • 5Red List Index of species survival (0-1) 0.9 • 5Annual change in forest area (%) 5.6 • ••Imported biodiversity threats (threats per million population) 0.3 • ••SDG16 – Peace, Justice and Strong Institutions
Homicides (per 100,000 population) 9.8 • ••Prison population (per 100,000 population) 31.9 • ••Population who feel safe walking alone at night in the city or area where
they live (%)59.0 • p
Government Efficiency (1-7) 2.8 • pProperty Rights (1-7) 3.6 • pChildren under 5 years of age whose births have been registered with a
civil authority (%)29.8 • ••
Corruption Perception Index (0-100) 27.0 • pChildren 5–14 years old involved in child labour (%) 24.7 • ••Transfers of major conventional weapons (exports) (constant 1990
US$ million per 100,000 population)0.0 • ••
SDG17 – Partnerships for the Goals
Government Health and Education spending (% GDP) NA • ••High-income and all OECD DAC countries: International concessional public
finance, including official development assistance (% GNI)NA • ••
Other countries: Tax revenue (% GDP) 1.5 • pTax Haven Score (best 0-5 worst) 0.0 • ••
SDG1 – End Poverty Poverty headcount ratio at $1.90/day (% population) 42.6 • 5Projected poverty headcount ratio at $1.90/day in 2030 (% population) 44.0 • ••SDG2 – Zero Hunger
Prevalence of undernourishment (% population) 7.9 • ••Prevalence of stunting (low height-for-age) in children under 5 years of age (%) 32.9 • LPrevalence of wasting in children under 5 years of age (%) 7.9 • 5Prevalence of obesity, BMI ≥ 30 (% adult population) 8.9 • 5Cereal yield (t/ha) 1.4 • pSustainable Nitrogen Management Index 0.8 • ••SDG3 – Good Health and Well-Being
Maternal mortality rate (per 100,000 live births) 814.0 • 5Neonatal mortality rate (per 1,000 live births) 34.1 • DMortality rate, under-5 (per 1,000 live births) 104.3 • DIncidence of tuberculosis (per 100,000 population) 219.0 • 5HIV prevalence (per 1,000) 1.0 • LAge-standardised death rate due to cardiovascular disease, cancer,
diabetes, and chronic respiratory disease in populations age 30–70 years (per 100,000 population)
20.8 • 5
Age-standardised death rate attributable to household air pollution and ambient air pollution (per 100,000 population)
150.0 • ••
Traffic deaths rate (per 100,000 population) 20.6 • DHealthy Life Expectancy at birth (years) 54.5 • DAdolescent fertility rate (births per 1,000 women ages 15-19) 109.3 • 5Births attended by skilled health personnel (%) 35.2 • ••Surviving infants who received 2 WHO-recommended vaccines (%) 49.0 • pUniversal Health Coverage Tracer Index (0-100) 48.7 • 5Subjective Wellbeing (average ladder score, 0-10) 5.3 • 5
SDG4 – Quality Education
Net primary enrolment rate (%) 64.1 • ••Mean years of schooling 6.0 • 5Literacy rate of 15-24 year olds, both sexes (%) 66.4 • ••SDG5 – Gender Equality
Unmet demand for contraception, estimated (% women married or in union, ages 15-49 )
52.3 • D
Female to male mean years of schooling of population age 25 + (%) 69.0 • ••Female to male labour force participation rate (%) 84.3 • 5Seats held by women in national parliaments (%) 5.6 • p
SDG6 – Clean Water and Sanitation
High-income countries: population using safely managed water services (%) NA • ••Other countries: population using at least basic drinking water services (%) NA • ••High-income countries: population using safely managed sanitation services (%) NA • ••Other countries: population using at least basic sanitation services (%) 32.6 • pFreshwater withdrawal as % total renewable water resources 5.8 • ••Imported groundwater depletion (m3/year/capita) 1.6 • ••SDG7 – Affordable and Clean Energy
Access to electricity (% population) 57.7 • DAccess to clean fuels & technology for cooking (% population) 2.3 • pCO2 emissions from fuel combustion / electricity output (MtCO2/TWh) 2.2 • L
SDG8 – Decent Work and Economic Growth
Adjusted GDP Growth (%) -4.2 • ••Slavery score (0-100) 80.0 • ••Adults (15 years +) with an account at a bank or other financial institution or
with a mobile-money-service provider (%)39.7 • L
Unemployment rate (% total labour force) 7.0 • 5
SDG9 – Industry, Innovation and Infrastructure
Proportion of the population using the internet (%) 25.7 • DMobile broadband subscriptions (per 100 inhabitants) 23.3 • LQuality of overall infrastructure (1= extremely underdeveloped;
7= extensive and efficient by international standards)2.3 • 5
Value Rating Trend Value Rating Trend

SDG Index and Dashboards Report 2018 Global Responsibilities110
AVERAGE PERFORMANCE BY SDG
Notes: The full title of Goal 2 “Zero Hunger” is “End hunger, achieve food security and improved nutrition and promote sustainable agriculture”. The full title of each SDG is available here: https://sustainabledevelopment.un.org/topics/sustainabledevelopmentgoals
OVERALL PERFORMANCE
Index score Regional average score
SDG Global rank
126 (OF 156)
East and South AsiaPAKISTAN
SDG TRENDS
L D 5 5 5 •• D D D
•• p •• 5 5 p 5 ••
54.9 64.1
100
75
50
25
SDG
1SDG
17SDG
16
SDG
15
SDG
14
SDG
13
SDG
12
SDG
11SDG
10 SDG
9
SDG
8
SDG
7
SDG
6
SDG
5
SDG
4
SDG
3
SDG
2
Pakistan
CURRENT ASSESSMENT – SDG DASHBOARD
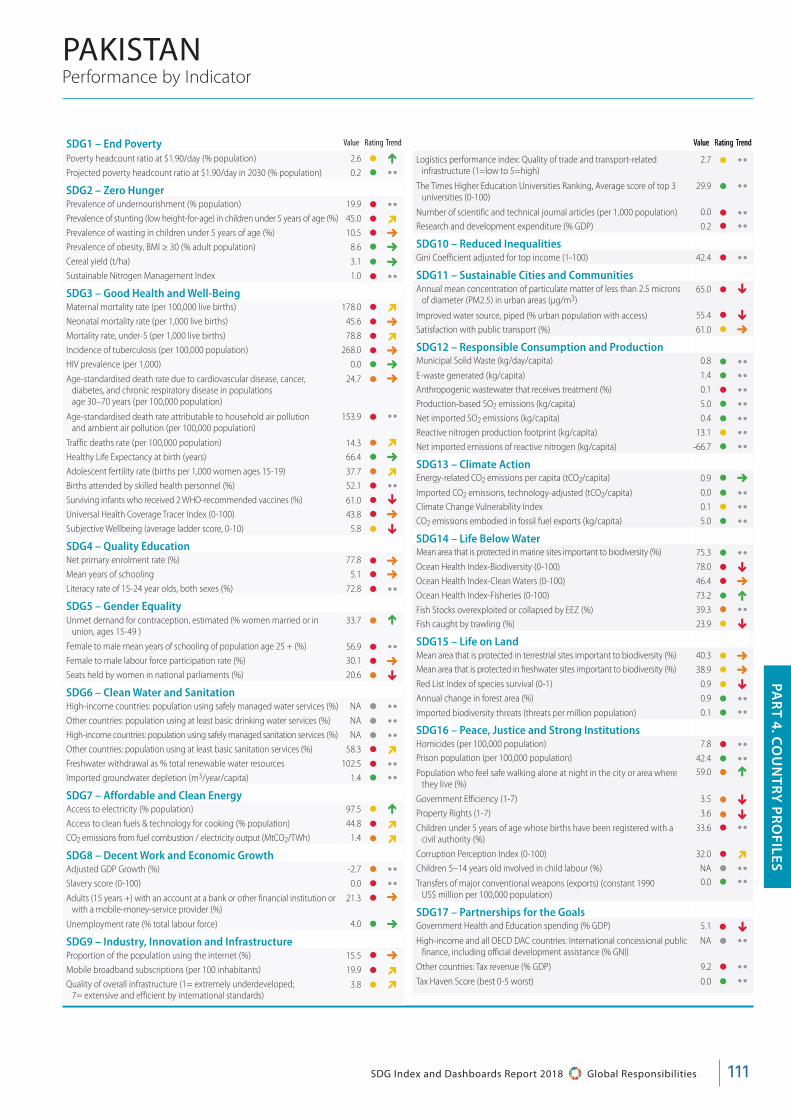
111SDG Index and Dashboards Report 2018 Global Responsibilities
PAR
T 4. CO
UN
TRY
PR
OFILES
PAR
T 4. CO
UN
TRY
PR
OFILES
Performance by Indicator
Value Rating Trend
PAKISTAN
Logistics performance index: Quality of trade and transport-related infrastructure (1=low to 5=high)
2.7 • ••
The Times Higher Education Universities Ranking, Average score of top 3 universities (0-100)
29.9 • ••
Number of scientific and technical journal articles (per 1,000 population) 0.0 • ••Research and development expenditure (% GDP) 0.2 • ••SDG10 – Reduced Inequalities Gini Coefficient adjusted for top income (1-100) 42.4 • ••SDG11 – Sustainable Cities and Communities
Annual mean concentration of particulate matter of less than 2.5 microns of diameter (PM2.5) in urban areas (μg/m3)
65.0 • p
Improved water source, piped (% urban population with access) 55.4 • pSatisfaction with public transport (%) 61.0 • 5
SDG12 – Responsible Consumption and Production Municipal Solid Waste (kg/day/capita) 0.8 • ••E-waste generated (kg/capita) 1.4 • ••Anthropogenic wastewater that receives treatment (%) 0.1 • ••Production-based SO2 emissions (kg/capita) 5.0 • ••Net imported SO2 emissions (kg/capita) 0.4 • ••Reactive nitrogen production footprint (kg/capita) 13.1 • ••Net imported emissions of reactive nitrogen (kg/capita) -66.7 • ••SDG13 – Climate Action
Energy-related CO2 emissions per capita (tCO2/capita) 0.9 • 5Imported CO2 emissions, technology-adjusted (tCO2/capita) 0.0 • ••Climate Change Vulnerability Index 0.1 • ••CO2 emissions embodied in fossil fuel exports (kg/capita) 5.0 • ••SDG14 – Life Below Water
Mean area that is protected in marine sites important to biodiversity (%) 75.3 • ••Ocean Health Index-Biodiversity (0-100) 78.0 • pOcean Health Index-Clean Waters (0-100) 46.4 • 5Ocean Health Index-Fisheries (0-100) 73.2 • LFish Stocks overexploited or collapsed by EEZ (%) 39.3 • ••Fish caught by trawling (%) 23.9 • p
SDG15 – Life on Land Mean area that is protected in terrestrial sites important to biodiversity (%) 40.3 • 5Mean area that is protected in freshwater sites important to biodiversity (%) 38.9 • 5Red List Index of species survival (0-1) 0.9 • pAnnual change in forest area (%) 0.9 • ••Imported biodiversity threats (threats per million population) 0.1 • ••SDG16 – Peace, Justice and Strong Institutions
Homicides (per 100,000 population) 7.8 • ••Prison population (per 100,000 population) 42.4 • ••Population who feel safe walking alone at night in the city or area where
they live (%)59.0 • L
Government Efficiency (1-7) 3.5 • pProperty Rights (1-7) 3.6 • pChildren under 5 years of age whose births have been registered with a
civil authority (%)33.6 • ••
Corruption Perception Index (0-100) 32.0 • DChildren 5–14 years old involved in child labour (%) NA • ••Transfers of major conventional weapons (exports) (constant 1990
US$ million per 100,000 population)0.0 • ••
SDG17 – Partnerships for the Goals
Government Health and Education spending (% GDP) 5.1 • pHigh-income and all OECD DAC countries: International concessional public
finance, including official development assistance (% GNI)NA • ••
Other countries: Tax revenue (% GDP) 9.2 • ••Tax Haven Score (best 0-5 worst) 0.0 • ••
SDG1 – End Poverty Poverty headcount ratio at $1.90/day (% population) 2.6 • LProjected poverty headcount ratio at $1.90/day in 2030 (% population) 0.2 • ••SDG2 – Zero Hunger
Prevalence of undernourishment (% population) 19.9 • ••Prevalence of stunting (low height-for-age) in children under 5 years of age (%) 45.0 • DPrevalence of wasting in children under 5 years of age (%) 10.5 • 5Prevalence of obesity, BMI ≥ 30 (% adult population) 8.6 • 5Cereal yield (t/ha) 3.1 • 5Sustainable Nitrogen Management Index 1.0 • ••SDG3 – Good Health and Well-Being
Maternal mortality rate (per 100,000 live births) 178.0 • DNeonatal mortality rate (per 1,000 live births) 45.6 • 5Mortality rate, under-5 (per 1,000 live births) 78.8 • DIncidence of tuberculosis (per 100,000 population) 268.0 • 5HIV prevalence (per 1,000) 0.0 • 5Age-standardised death rate due to cardiovascular disease, cancer,
diabetes, and chronic respiratory disease in populations age 30–70 years (per 100,000 population)
24.7 • 5
Age-standardised death rate attributable to household air pollution and ambient air pollution (per 100,000 population)
153.9 • ••
Traffic deaths rate (per 100,000 population) 14.3 • DHealthy Life Expectancy at birth (years) 66.4 • 5Adolescent fertility rate (births per 1,000 women ages 15-19) 37.7 • DBirths attended by skilled health personnel (%) 52.1 • ••Surviving infants who received 2 WHO-recommended vaccines (%) 61.0 • pUniversal Health Coverage Tracer Index (0-100) 43.8 • 5Subjective Wellbeing (average ladder score, 0-10) 5.8 • p
SDG4 – Quality Education
Net primary enrolment rate (%) 77.8 • 5Mean years of schooling 5.1 • 5Literacy rate of 15-24 year olds, both sexes (%) 72.8 • ••SDG5 – Gender Equality
Unmet demand for contraception, estimated (% women married or in union, ages 15-49 )
33.7 • L
Female to male mean years of schooling of population age 25 + (%) 56.9 • ••Female to male labour force participation rate (%) 30.1 • 5Seats held by women in national parliaments (%) 20.6 • p
SDG6 – Clean Water and Sanitation
High-income countries: population using safely managed water services (%) NA • ••Other countries: population using at least basic drinking water services (%) NA • ••High-income countries: population using safely managed sanitation services (%) NA • ••Other countries: population using at least basic sanitation services (%) 58.3 • DFreshwater withdrawal as % total renewable water resources 102.5 • ••Imported groundwater depletion (m3/year/capita) 1.4 • ••SDG7 – Affordable and Clean Energy
Access to electricity (% population) 97.5 • LAccess to clean fuels & technology for cooking (% population) 44.8 • DCO2 emissions from fuel combustion / electricity output (MtCO2/TWh) 1.4 • D
SDG8 – Decent Work and Economic Growth
Adjusted GDP Growth (%) -2.7 • ••Slavery score (0-100) 0.0 • ••Adults (15 years +) with an account at a bank or other financial institution or
with a mobile-money-service provider (%)21.3 • 5
Unemployment rate (% total labour force) 4.0 • 5
SDG9 – Industry, Innovation and Infrastructure
Proportion of the population using the internet (%) 15.5 • 5Mobile broadband subscriptions (per 100 inhabitants) 19.9 • DQuality of overall infrastructure (1= extremely underdeveloped;
7= extensive and efficient by international standards)3.8 • D
Value Rating Trend Value Rating Trend
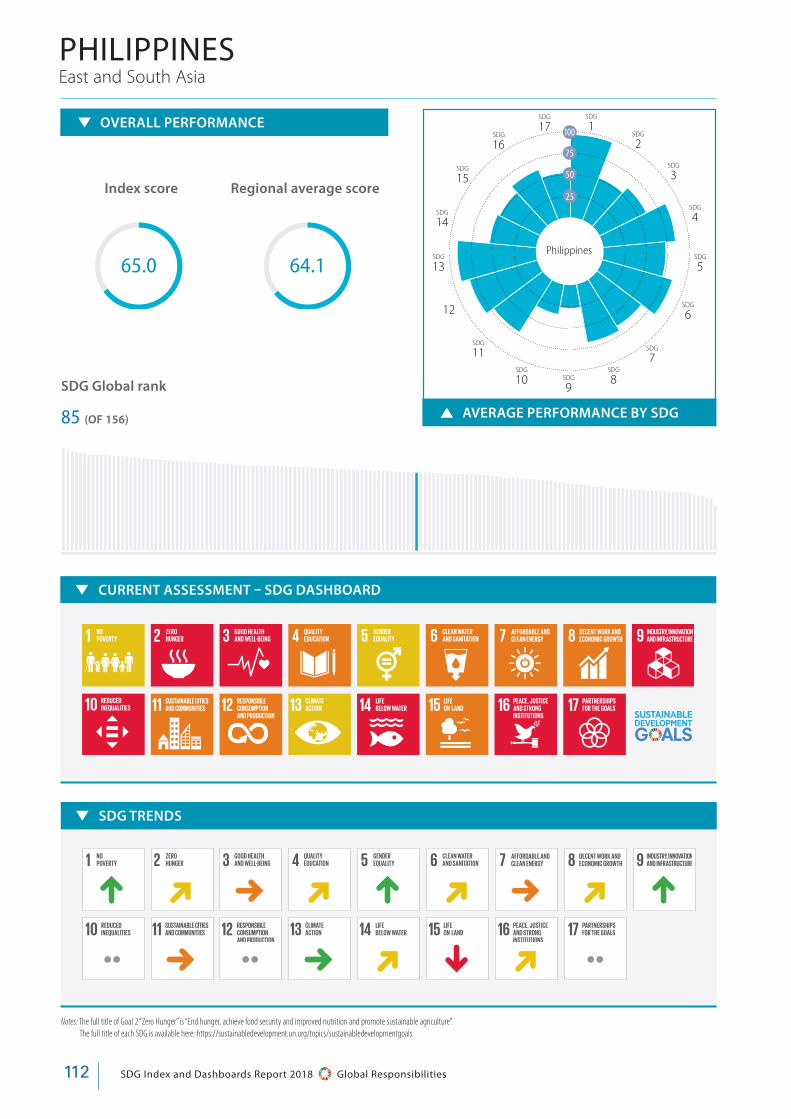
SDG Index and Dashboards Report 2018 Global Responsibilities112
AVERAGE PERFORMANCE BY SDG
Notes: The full title of Goal 2 “Zero Hunger” is “End hunger, achieve food security and improved nutrition and promote sustainable agriculture”. The full title of each SDG is available here: https://sustainabledevelopment.un.org/topics/sustainabledevelopmentgoals
OVERALL PERFORMANCE
Index score Regional average score
SDG Global rank
85 (OF 156)
East and South AsiaPHILIPPINES
SDG TRENDS
L D 5 D L D 5 D L
•• 5 •• 5 D p D ••
65.0 64.1
100
75
50
25
SDG
1SDG
17SDG
16
SDG
15
SDG
14
SDG
13
12
SDG
11SDG
10 SDG
9
SDG
8
SDG
7
SDG
6
SDG
5
SDG
4
SDG
3
SDG
2
Philippines
CURRENT ASSESSMENT – SDG DASHBOARD

113SDG Index and Dashboards Report 2018 Global Responsibilities
PAR
T 4. CO
UN
TRY
PR
OFILES
PAR
T 4. CO
UN
TRY
PR
OFILES
Performance by Indicator
Value Rating Trend
PHILIPPINES
Logistics performance index: Quality of trade and transport-related infrastructure (1=low to 5=high)
2.6 • ••
The Times Higher Education Universities Ranking, Average score of top 3 universities (0-100)
26.1 • ••
Number of scientific and technical journal articles (per 1,000 population) 0.0 • ••Research and development expenditure (% GDP) 0.1 • ••SDG10 – Reduced Inequalities Gini Coefficient adjusted for top income (1-100) 50.5 • ••SDG11 – Sustainable Cities and Communities
Annual mean concentration of particulate matter of less than 2.5 microns of diameter (PM2.5) in urban areas (μg/m3)
23.5 • 5
Improved water source, piped (% urban population with access) 58.8 • pSatisfaction with public transport (%) 70.0 • p
SDG12 – Responsible Consumption and Production Municipal Solid Waste (kg/day/capita) 0.5 • ••E-waste generated (kg/capita) 1.3 • ••Anthropogenic wastewater that receives treatment (%) 2.6 • ••Production-based SO2 emissions (kg/capita) 2.9 • ••Net imported SO2 emissions (kg/capita) 0.3 • ••Reactive nitrogen production footprint (kg/capita) 8.4 • ••Net imported emissions of reactive nitrogen (kg/capita) 2.8 • ••SDG13 – Climate Action
Energy-related CO2 emissions per capita (tCO2/capita) 1.1 • 5Imported CO2 emissions, technology-adjusted (tCO2/capita) 0.0 • ••Climate Change Vulnerability Index 0.1 • ••CO2 emissions embodied in fossil fuel exports (kg/capita) 162.2 • ••SDG14 – Life Below Water
Mean area that is protected in marine sites important to biodiversity (%) 58.3 • ••Ocean Health Index-Biodiversity (0-100) 82.8 • DOcean Health Index-Clean Waters (0-100) 57.2 • 5Ocean Health Index-Fisheries (0-100) 43.4 • 5Fish Stocks overexploited or collapsed by EEZ (%) 23.4 • ••Fish caught by trawling (%) 4.5 • L
SDG15 – Life on Land Mean area that is protected in terrestrial sites important to biodiversity (%) 41.7 • 5Mean area that is protected in freshwater sites important to biodiversity (%) 48.1 • 5Red List Index of species survival (0-1) 0.7 • pAnnual change in forest area (%) 5.2 • ••Imported biodiversity threats (threats per million population) 0.8 • ••SDG16 – Peace, Justice and Strong Institutions
Homicides (per 100,000 population) 9.8 • ••Prison population (per 100,000 population) 134.8 • ••Population who feel safe walking alone at night in the city or area where
they live (%)60.0 • 5
Government Efficiency (1-7) 3.1 • LProperty Rights (1-7) 4.2 • LChildren under 5 years of age whose births have been registered with a
civil authority (%)90.2 • ••
Corruption Perception Index (0-100) 34.0 • 5Children 5–14 years old involved in child labour (%) 11.1 • ••Transfers of major conventional weapons (exports) (constant 1990
US$ million per 100,000 population)0.0 • ••
SDG17 – Partnerships for the Goals
Government Health and Education spending (% GDP) 7.1 • ••High-income and all OECD DAC countries: International concessional public
finance, including official development assistance (% GNI)NA • ••
Other countries: Tax revenue (% GDP) 13.7 • 5Tax Haven Score (best 0-5 worst) 0.0 • ••
SDG1 – End Poverty Poverty headcount ratio at $1.90/day (% population) 5.8 • LProjected poverty headcount ratio at $1.90/day in 2030 (% population) 0.0 • ••SDG2 – Zero Hunger
Prevalence of undernourishment (% population) 13.8 • ••Prevalence of stunting (low height-for-age) in children under 5 years of age (%) 30.3 • DPrevalence of wasting in children under 5 years of age (%) 7.9 • pPrevalence of obesity, BMI ≥ 30 (% adult population) 6.4 • 5Cereal yield (t/ha) 3.5 • 5Sustainable Nitrogen Management Index 0.8 • ••SDG3 – Good Health and Well-Being
Maternal mortality rate (per 100,000 live births) 114.0 • LNeonatal mortality rate (per 1,000 live births) 12.6 • LMortality rate, under-5 (per 1,000 live births) 27.1 • LIncidence of tuberculosis (per 100,000 population) 554.0 • pHIV prevalence (per 1,000) 0.2 • pAge-standardised death rate due to cardiovascular disease, cancer,
diabetes, and chronic respiratory disease in populations age 30–70 years (per 100,000 population)
28.6 • 5
Age-standardised death rate attributable to household air pollution and ambient air pollution (per 100,000 population)
142.0 • ••
Traffic deaths rate (per 100,000 population) 10.7 • pHealthy Life Expectancy at birth (years) 68.5 • 5Adolescent fertility rate (births per 1,000 women ages 15-19) 59.9 • pBirths attended by skilled health personnel (%) 72.8 • ••Surviving infants who received 2 WHO-recommended vaccines (%) 80.0 • pUniversal Health Coverage Tracer Index (0-100) 50.3 • 5Subjective Wellbeing (average ladder score, 0-10) 5.6 • L
SDG4 – Quality Education
Net primary enrolment rate (%) 95.7 • LMean years of schooling 9.3 • 5Literacy rate of 15-24 year olds, both sexes (%) 98.1 • ••SDG5 – Gender Equality
Unmet demand for contraception, estimated (% women married or in union, ages 15-49 )
23.6 • L
Female to male mean years of schooling of population age 25 + (%) 103.3 • ••Female to male labour force participation rate (%) 66.0 • LSeats held by women in national parliaments (%) 29.5 • L
SDG6 – Clean Water and Sanitation
High-income countries: population using safely managed water services (%) NA • ••Other countries: population using at least basic drinking water services (%) 90.5 • DHigh-income countries: population using safely managed sanitation services (%) NA • ••Other countries: population using at least basic sanitation services (%) 75.0 • 5Freshwater withdrawal as % total renewable water resources 25.1 • ••Imported groundwater depletion (m3/year/capita) 2.9 • ••SDG7 – Affordable and Clean Energy
Access to electricity (% population) 89.1 • LAccess to clean fuels & technology for cooking (% population) 44.8 • 5CO2 emissions from fuel combustion / electricity output (MtCO2/TWh) 1.3 • p
SDG8 – Decent Work and Economic Growth
Adjusted GDP Growth (%) 0.2 • ••Slavery score (0-100) 80.0 • ••Adults (15 years +) with an account at a bank or other financial institution or
with a mobile-money-service provider (%)34.5 • D
Unemployment rate (% total labour force) 2.8 • 5
SDG9 – Industry, Innovation and Infrastructure
Proportion of the population using the internet (%) 55.5 • LMobile broadband subscriptions (per 100 inhabitants) 46.4 • LQuality of overall infrastructure (1= extremely underdeveloped;
7= extensive and efficient by international standards)3.0 • 5
Value Rating Trend Value Rating Trend

SDG Index and Dashboards Report 2018 Global Responsibilities114
AVERAGE PERFORMANCE BY SDG
Notes: The full title of Goal 2 “Zero Hunger” is “End hunger, achieve food security and improved nutrition and promote sustainable agriculture”. The full title of each SDG is available here: https://sustainabledevelopment.un.org/topics/sustainabledevelopmentgoals
OVERALL PERFORMANCE
Index score Regional average score
SDG Global rank
63 (OF 156)
Eastern Europe and Central AsiaRUSSIAN FEDERATION
SDG TRENDS
5 D D L D •• D L L
•• D •• 5 D 5 D ••
68.9 69.5
100
75
50
25
SDG
1SDG
17SDG
16
SDG
15
SDG
14
SDG
13
SDG
12
SDG
11SDG
10 SDG
9
SDG
8
SDG
7
SDG
6
SDG
5
SDG
4
SDG
3
SDG
2
Russian Federation
CURRENT ASSESSMENT – SDG DASHBOARD
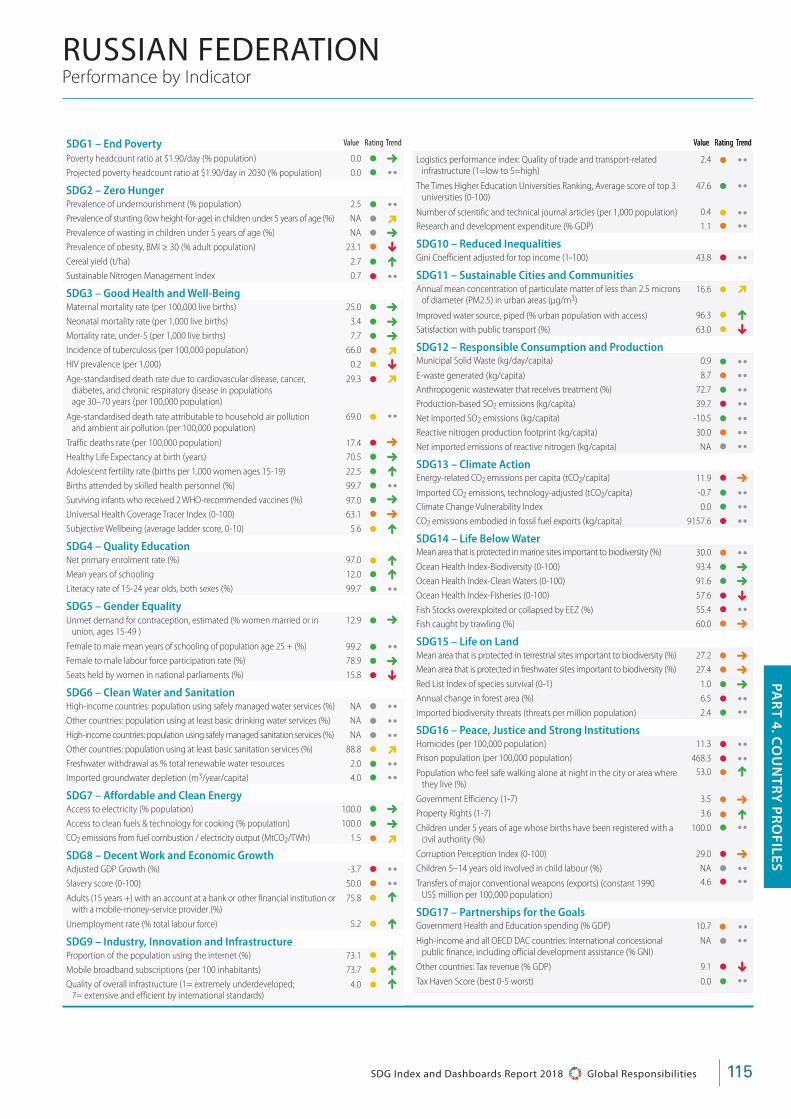
115SDG Index and Dashboards Report 2018 Global Responsibilities
PAR
T 4. CO
UN
TRY
PR
OFILES
PAR
T 4. CO
UN
TRY
PR
OFILES
Performance by Indicator
Value Rating Trend
RUSSIAN FEDERATION
Logistics performance index: Quality of trade and transport-related infrastructure (1=low to 5=high)
2.4 • ••
The Times Higher Education Universities Ranking, Average score of top 3 universities (0-100)
47.6 • ••
Number of scientific and technical journal articles (per 1,000 population) 0.4 • ••Research and development expenditure (% GDP) 1.1 • ••SDG10 – Reduced Inequalities Gini Coefficient adjusted for top income (1-100) 43.8 • ••SDG11 – Sustainable Cities and Communities
Annual mean concentration of particulate matter of less than 2.5 microns of diameter (PM2.5) in urban areas (μg/m3)
16.6 • D
Improved water source, piped (% urban population with access) 96.3 • LSatisfaction with public transport (%) 63.0 • p
SDG12 – Responsible Consumption and Production Municipal Solid Waste (kg/day/capita) 0.9 • ••E-waste generated (kg/capita) 8.7 • ••Anthropogenic wastewater that receives treatment (%) 72.7 • ••Production-based SO2 emissions (kg/capita) 39.7 • ••Net imported SO2 emissions (kg/capita) -10.5 • ••Reactive nitrogen production footprint (kg/capita) 30.0 • ••Net imported emissions of reactive nitrogen (kg/capita) NA • ••SDG13 – Climate Action
Energy-related CO2 emissions per capita (tCO2/capita) 11.9 • 5Imported CO2 emissions, technology-adjusted (tCO2/capita) -0.7 • ••Climate Change Vulnerability Index 0.0 • ••CO2 emissions embodied in fossil fuel exports (kg/capita) 9157.6 • ••SDG14 – Life Below Water
Mean area that is protected in marine sites important to biodiversity (%) 30.0 • ••Ocean Health Index-Biodiversity (0-100) 93.4 • 5Ocean Health Index-Clean Waters (0-100) 91.6 • 5Ocean Health Index-Fisheries (0-100) 57.6 • pFish Stocks overexploited or collapsed by EEZ (%) 55.4 • ••Fish caught by trawling (%) 60.0 • 5
SDG15 – Life on Land Mean area that is protected in terrestrial sites important to biodiversity (%) 27.2 • 5Mean area that is protected in freshwater sites important to biodiversity (%) 27.4 • 5Red List Index of species survival (0-1) 1.0 • 5Annual change in forest area (%) 6.5 • ••Imported biodiversity threats (threats per million population) 2.4 • ••SDG16 – Peace, Justice and Strong Institutions
Homicides (per 100,000 population) 11.3 • ••Prison population (per 100,000 population) 468.3 • ••Population who feel safe walking alone at night in the city or area where
they live (%)53.0 • L
Government Efficiency (1-7) 3.5 • 5Property Rights (1-7) 3.6 • LChildren under 5 years of age whose births have been registered with a
civil authority (%)100.0 • ••
Corruption Perception Index (0-100) 29.0 • 5Children 5–14 years old involved in child labour (%) NA • ••Transfers of major conventional weapons (exports) (constant 1990
US$ million per 100,000 population)4.6 • ••
SDG17 – Partnerships for the Goals
Government Health and Education spending (% GDP) 10.7 • ••High-income and all OECD DAC countries: International concessional
public finance, including official development assistance (% GNI)NA • ••
Other countries: Tax revenue (% GDP) 9.1 • pTax Haven Score (best 0-5 worst) 0.0 • ••
SDG1 – End Poverty Poverty headcount ratio at $1.90/day (% population) 0.0 • 5Projected poverty headcount ratio at $1.90/day in 2030 (% population) 0.0 • ••SDG2 – Zero Hunger
Prevalence of undernourishment (% population) 2.5 • ••Prevalence of stunting (low height-for-age) in children under 5 years of age (%) NA • DPrevalence of wasting in children under 5 years of age (%) NA • 5Prevalence of obesity, BMI ≥ 30 (% adult population) 23.1 • pCereal yield (t/ha) 2.7 • LSustainable Nitrogen Management Index 0.7 • ••SDG3 – Good Health and Well-Being
Maternal mortality rate (per 100,000 live births) 25.0 • 5Neonatal mortality rate (per 1,000 live births) 3.4 • 5Mortality rate, under-5 (per 1,000 live births) 7.7 • 5Incidence of tuberculosis (per 100,000 population) 66.0 • DHIV prevalence (per 1,000) 0.2 • pAge-standardised death rate due to cardiovascular disease, cancer,
diabetes, and chronic respiratory disease in populations age 30–70 years (per 100,000 population)
29.3 • D
Age-standardised death rate attributable to household air pollution and ambient air pollution (per 100,000 population)
69.0 • ••
Traffic deaths rate (per 100,000 population) 17.4 • 5Healthy Life Expectancy at birth (years) 70.5 • 5Adolescent fertility rate (births per 1,000 women ages 15-19) 22.5 • LBirths attended by skilled health personnel (%) 99.7 • ••Surviving infants who received 2 WHO-recommended vaccines (%) 97.0 • 5Universal Health Coverage Tracer Index (0-100) 63.1 • 5Subjective Wellbeing (average ladder score, 0-10) 5.6 • L
SDG4 – Quality Education
Net primary enrolment rate (%) 97.0 • LMean years of schooling 12.0 • LLiteracy rate of 15-24 year olds, both sexes (%) 99.7 • ••SDG5 – Gender Equality
Unmet demand for contraception, estimated (% women married or in union, ages 15-49 )
12.9 • 5
Female to male mean years of schooling of population age 25 + (%) 99.2 • ••Female to male labour force participation rate (%) 78.9 • 5Seats held by women in national parliaments (%) 15.8 • p
SDG6 – Clean Water and Sanitation
High-income countries: population using safely managed water services (%) NA • ••Other countries: population using at least basic drinking water services (%) NA • ••High-income countries: population using safely managed sanitation services (%) NA • ••Other countries: population using at least basic sanitation services (%) 88.8 • DFreshwater withdrawal as % total renewable water resources 2.0 • ••Imported groundwater depletion (m3/year/capita) 4.0 • ••SDG7 – Affordable and Clean Energy
Access to electricity (% population) 100.0 • 5Access to clean fuels & technology for cooking (% population) 100.0 • 5CO2 emissions from fuel combustion / electricity output (MtCO2/TWh) 1.5 • D
SDG8 – Decent Work and Economic Growth
Adjusted GDP Growth (%) -3.7 • ••Slavery score (0-100) 50.0 • ••Adults (15 years +) with an account at a bank or other financial institution or
with a mobile-money-service provider (%)75.8 • L
Unemployment rate (% total labour force) 5.2 • L
SDG9 – Industry, Innovation and Infrastructure
Proportion of the population using the internet (%) 73.1 • LMobile broadband subscriptions (per 100 inhabitants) 73.7 • LQuality of overall infrastructure (1= extremely underdeveloped;
7= extensive and efficient by international standards)4.0 • L
Value Rating Trend Value Rating Trend
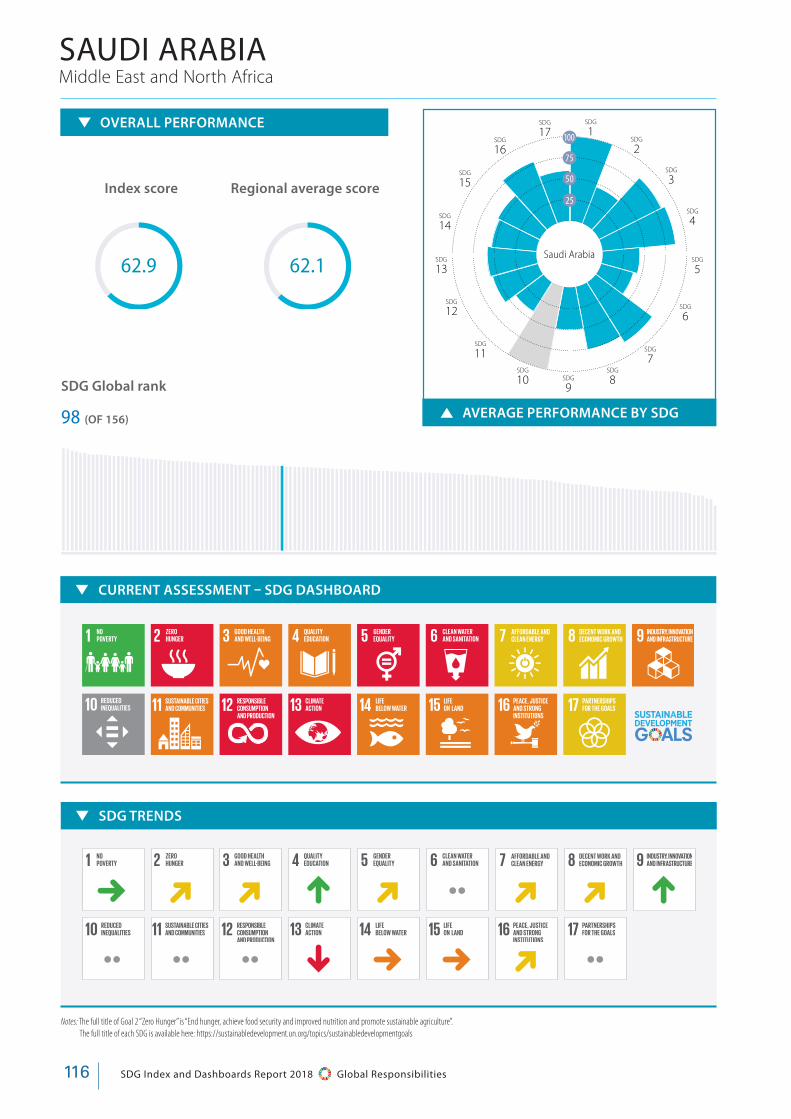
SDG Index and Dashboards Report 2018 Global Responsibilities116
AVERAGE PERFORMANCE BY SDG
Notes: The full title of Goal 2 “Zero Hunger” is “End hunger, achieve food security and improved nutrition and promote sustainable agriculture”. The full title of each SDG is available here: https://sustainabledevelopment.un.org/topics/sustainabledevelopmentgoals
OVERALL PERFORMANCE
Index score Regional average score
SDG Global rank
98 (OF 156)
Middle East and North AfricaSAUDI ARABIA
SDG TRENDS
5 D D L D •• D D L
•• •• •• p 5 5 D ••
62.9 62.1
100
75
50
25
SDG
1SDG
17SDG
16
SDG
15
SDG
14
SDG
13
SDG
12
SDG
11SDG
10 SDG
9
SDG
8
SDG
7
SDG
6
SDG
5
SDG
4
SDG
3
SDG
2
Saudi Arabia
CURRENT ASSESSMENT – SDG DASHBOARD
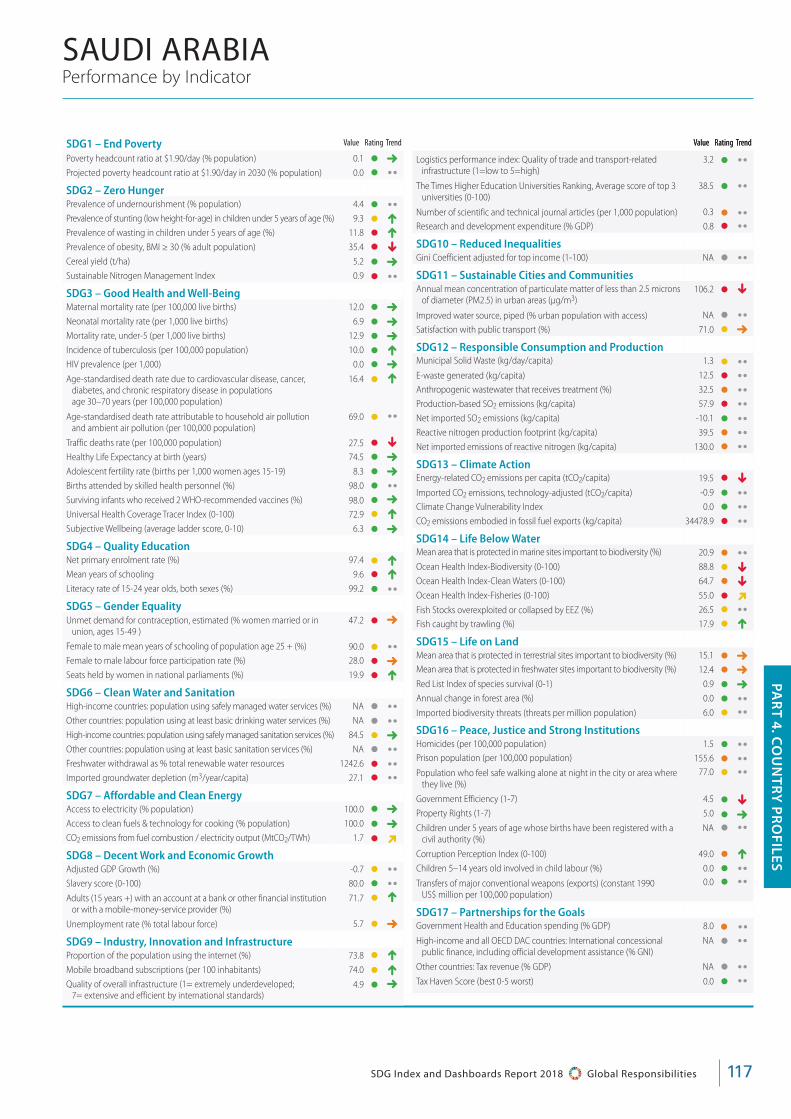
117SDG Index and Dashboards Report 2018 Global Responsibilities
PAR
T 4. CO
UN
TRY
PR
OFILES
PAR
T 4. CO
UN
TRY
PR
OFILES
Performance by Indicator
Value Rating Trend
SAUDI ARABIA
Logistics performance index: Quality of trade and transport-related infrastructure (1=low to 5=high)
3.2 • ••
The Times Higher Education Universities Ranking, Average score of top 3 universities (0-100)
38.5 • ••
Number of scientific and technical journal articles (per 1,000 population) 0.3 • ••Research and development expenditure (% GDP) 0.8 • ••SDG10 – Reduced Inequalities Gini Coefficient adjusted for top income (1-100) NA • ••SDG11 – Sustainable Cities and Communities
Annual mean concentration of particulate matter of less than 2.5 microns of diameter (PM2.5) in urban areas (μg/m3)
106.2 • p
Improved water source, piped (% urban population with access) NA • ••Satisfaction with public transport (%) 71.0 • 5
SDG12 – Responsible Consumption and Production Municipal Solid Waste (kg/day/capita) 1.3 • ••E-waste generated (kg/capita) 12.5 • ••Anthropogenic wastewater that receives treatment (%) 32.5 • ••Production-based SO2 emissions (kg/capita) 57.9 • ••Net imported SO2 emissions (kg/capita) -10.1 • ••Reactive nitrogen production footprint (kg/capita) 39.5 • ••Net imported emissions of reactive nitrogen (kg/capita) 130.0 • ••SDG13 – Climate Action
Energy-related CO2 emissions per capita (tCO2/capita) 19.5 • pImported CO2 emissions, technology-adjusted (tCO2/capita) -0.9 • ••Climate Change Vulnerability Index 0.0 • ••CO2 emissions embodied in fossil fuel exports (kg/capita) 34478.9 • ••SDG14 – Life Below Water
Mean area that is protected in marine sites important to biodiversity (%) 20.9 • ••Ocean Health Index-Biodiversity (0-100) 88.8 • pOcean Health Index-Clean Waters (0-100) 64.7 • pOcean Health Index-Fisheries (0-100) 55.0 • DFish Stocks overexploited or collapsed by EEZ (%) 26.5 • ••Fish caught by trawling (%) 17.9 • L
SDG15 – Life on Land Mean area that is protected in terrestrial sites important to biodiversity (%) 15.1 • 5Mean area that is protected in freshwater sites important to biodiversity (%) 12.4 • 5Red List Index of species survival (0-1) 0.9 • 5Annual change in forest area (%) 0.0 • ••Imported biodiversity threats (threats per million population) 6.0 • ••SDG16 – Peace, Justice and Strong Institutions
Homicides (per 100,000 population) 1.5 • ••Prison population (per 100,000 population) 155.6 • ••Population who feel safe walking alone at night in the city or area where
they live (%)77.0 • ••
Government Efficiency (1-7) 4.5 • pProperty Rights (1-7) 5.0 • 5Children under 5 years of age whose births have been registered with a
civil authority (%)NA • ••
Corruption Perception Index (0-100) 49.0 • LChildren 5–14 years old involved in child labour (%) 0.0 • ••Transfers of major conventional weapons (exports) (constant 1990
US$ million per 100,000 population)0.0 • ••
SDG17 – Partnerships for the Goals
Government Health and Education spending (% GDP) 8.0 • ••High-income and all OECD DAC countries: International concessional
public finance, including official development assistance (% GNI)NA • ••
Other countries: Tax revenue (% GDP) NA • ••Tax Haven Score (best 0-5 worst) 0.0 • ••
SDG1 – End Poverty Poverty headcount ratio at $1.90/day (% population) 0.1 • 5Projected poverty headcount ratio at $1.90/day in 2030 (% population) 0.0 • ••SDG2 – Zero Hunger
Prevalence of undernourishment (% population) 4.4 • ••Prevalence of stunting (low height-for-age) in children under 5 years of age (%) 9.3 • LPrevalence of wasting in children under 5 years of age (%) 11.8 • LPrevalence of obesity, BMI ≥ 30 (% adult population) 35.4 • pCereal yield (t/ha) 5.2 • 5Sustainable Nitrogen Management Index 0.9 • ••SDG3 – Good Health and Well-Being
Maternal mortality rate (per 100,000 live births) 12.0 • 5Neonatal mortality rate (per 1,000 live births) 6.9 • 5Mortality rate, under-5 (per 1,000 live births) 12.9 • 5Incidence of tuberculosis (per 100,000 population) 10.0 • LHIV prevalence (per 1,000) 0.0 • 5Age-standardised death rate due to cardiovascular disease, cancer,
diabetes, and chronic respiratory disease in populations age 30–70 years (per 100,000 population)
16.4 • L
Age-standardised death rate attributable to household air pollution and ambient air pollution (per 100,000 population)
69.0 • ••
Traffic deaths rate (per 100,000 population) 27.5 • pHealthy Life Expectancy at birth (years) 74.5 • 5Adolescent fertility rate (births per 1,000 women ages 15-19) 8.3 • 5Births attended by skilled health personnel (%) 98.0 • ••Surviving infants who received 2 WHO-recommended vaccines (%) 98.0 • 5Universal Health Coverage Tracer Index (0-100) 72.9 • LSubjective Wellbeing (average ladder score, 0-10) 6.3 • 5
SDG4 – Quality Education
Net primary enrolment rate (%) 97.4 • LMean years of schooling 9.6 • LLiteracy rate of 15-24 year olds, both sexes (%) 99.2 • ••SDG5 – Gender Equality
Unmet demand for contraception, estimated (% women married or in union, ages 15-49 )
47.2 • 5
Female to male mean years of schooling of population age 25 + (%) 90.0 • ••Female to male labour force participation rate (%) 28.0 • 5Seats held by women in national parliaments (%) 19.9 • L
SDG6 – Clean Water and Sanitation
High-income countries: population using safely managed water services (%) NA • ••Other countries: population using at least basic drinking water services (%) NA • ••High-income countries: population using safely managed sanitation services (%) 84.5 • 5Other countries: population using at least basic sanitation services (%) NA • ••Freshwater withdrawal as % total renewable water resources 1242.6 • ••Imported groundwater depletion (m3/year/capita) 27.1 • ••SDG7 – Affordable and Clean Energy
Access to electricity (% population) 100.0 • 5Access to clean fuels & technology for cooking (% population) 100.0 • 5CO2 emissions from fuel combustion / electricity output (MtCO2/TWh) 1.7 • D
SDG8 – Decent Work and Economic Growth
Adjusted GDP Growth (%) -0.7 • ••Slavery score (0-100) 80.0 • ••Adults (15 years +) with an account at a bank or other financial institution
or with a mobile-money-service provider (%)71.7 • L
Unemployment rate (% total labour force) 5.7 • 5
SDG9 – Industry, Innovation and Infrastructure
Proportion of the population using the internet (%) 73.8 • LMobile broadband subscriptions (per 100 inhabitants) 74.0 • LQuality of overall infrastructure (1= extremely underdeveloped;
7= extensive and efficient by international standards)4.9 • 5
Value Rating Trend Value Rating Trend
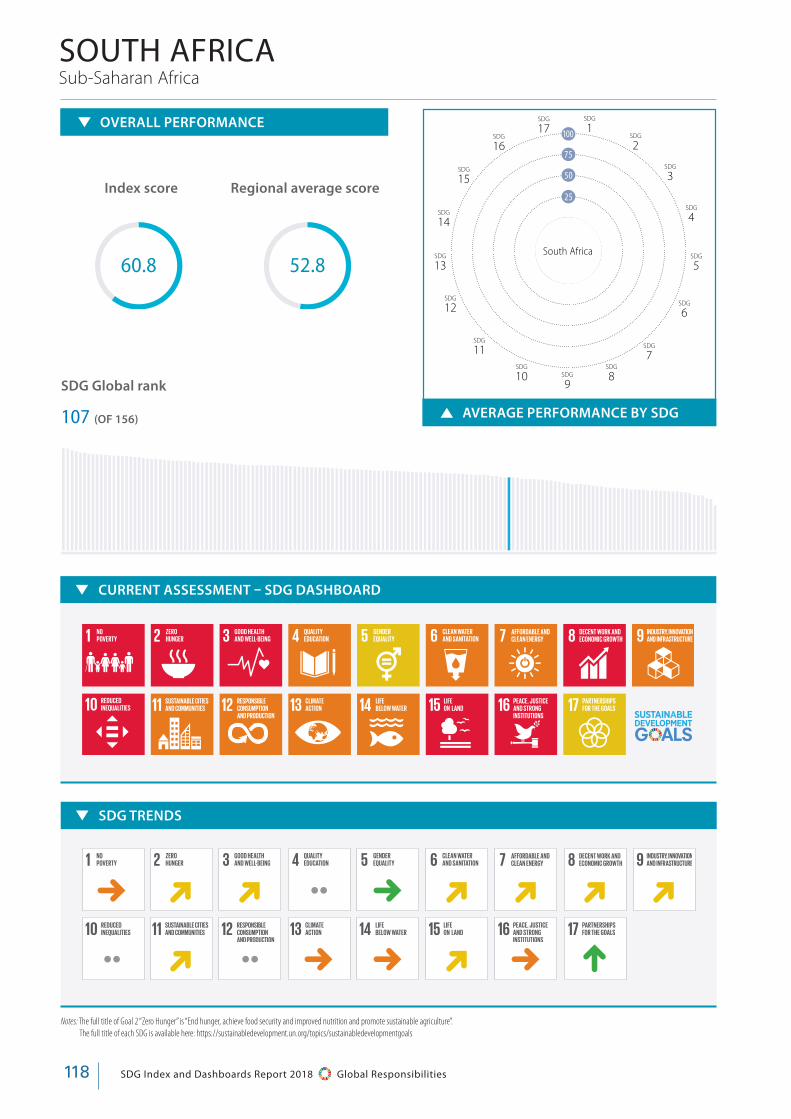
SDG Index and Dashboards Report 2018 Global Responsibilities118
AVERAGE PERFORMANCE BY SDG
Notes: The full title of Goal 2 “Zero Hunger” is “End hunger, achieve food security and improved nutrition and promote sustainable agriculture”. The full title of each SDG is available here: https://sustainabledevelopment.un.org/topics/sustainabledevelopmentgoals
OVERALL PERFORMANCE
Index score Regional average score
SDG Global rank
107 (OF 156)
Sub-Saharan AfricaSOUTH AFRICA
SDG TRENDS
5 D D •• 5 D D D D
•• D •• 5 5 D 5 L
52.860.8
100
75
50
25
SDG
1SDG
17SDG
16
SDG
15
SDG
14
SDG
13
SDG
12
SDG
11SDG
10 SDG
9
SDG
8
SDG
7
SDG
6
SDG
5
SDG
4
SDG
3
SDG
2
South Africa
CURRENT ASSESSMENT – SDG DASHBOARD
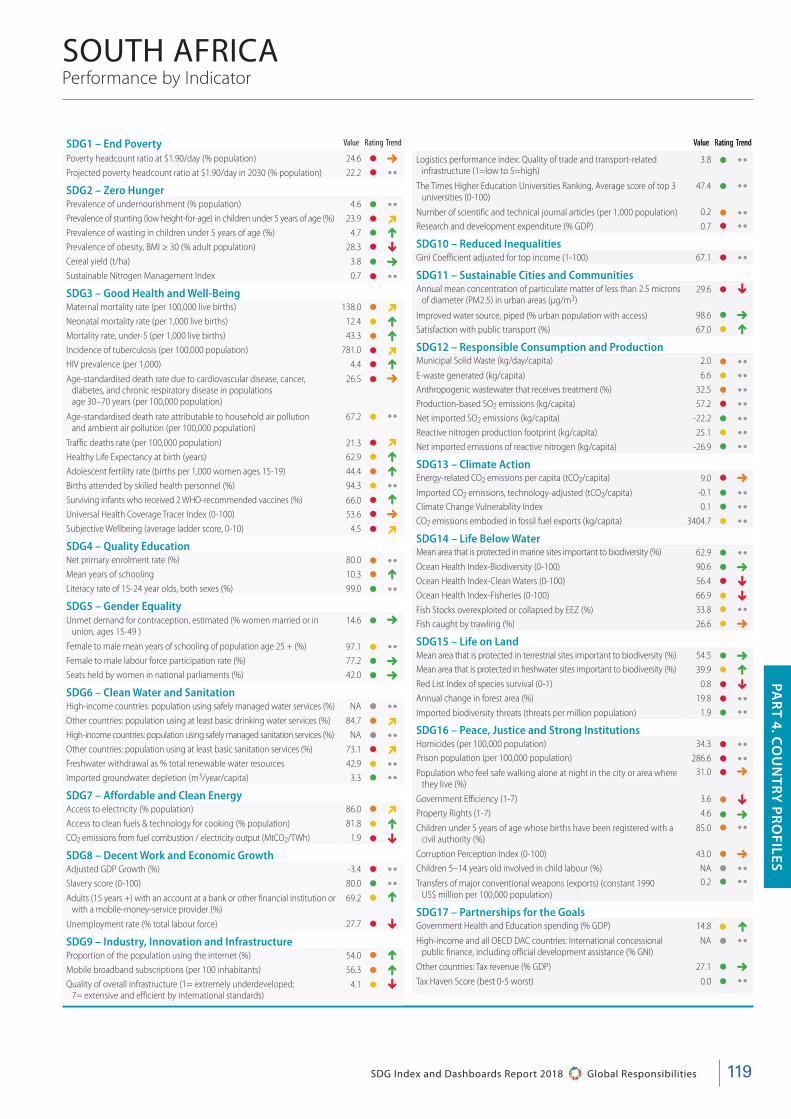
119SDG Index and Dashboards Report 2018 Global Responsibilities
PAR
T 4. CO
UN
TRY
PR
OFILES
PAR
T 4. CO
UN
TRY
PR
OFILES
Performance by IndicatorSOUTH AFRICA
Value Rating Trend
Logistics performance index: Quality of trade and transport-related infrastructure (1=low to 5=high)
3.8 • ••
The Times Higher Education Universities Ranking, Average score of top 3 universities (0-100)
47.4 • ••
Number of scientific and technical journal articles (per 1,000 population) 0.2 • ••Research and development expenditure (% GDP) 0.7 • ••SDG10 – Reduced Inequalities Gini Coefficient adjusted for top income (1-100) 67.1 • ••SDG11 – Sustainable Cities and Communities
Annual mean concentration of particulate matter of less than 2.5 microns of diameter (PM2.5) in urban areas (μg/m3)
29.6 • p
Improved water source, piped (% urban population with access) 98.6 • 5Satisfaction with public transport (%) 67.0 • L
SDG12 – Responsible Consumption and Production Municipal Solid Waste (kg/day/capita) 2.0 • ••E-waste generated (kg/capita) 6.6 • ••Anthropogenic wastewater that receives treatment (%) 32.5 • ••Production-based SO2 emissions (kg/capita) 57.2 • ••Net imported SO2 emissions (kg/capita) -22.2 • ••Reactive nitrogen production footprint (kg/capita) 25.1 • ••Net imported emissions of reactive nitrogen (kg/capita) -26.9 • ••SDG13 – Climate Action
Energy-related CO2 emissions per capita (tCO2/capita) 9.0 • 5Imported CO2 emissions, technology-adjusted (tCO2/capita) -0.1 • ••Climate Change Vulnerability Index 0.1 • ••CO2 emissions embodied in fossil fuel exports (kg/capita) 3404.7 • ••SDG14 – Life Below Water
Mean area that is protected in marine sites important to biodiversity (%) 62.9 • ••Ocean Health Index-Biodiversity (0-100) 90.6 • 5Ocean Health Index-Clean Waters (0-100) 56.4 • pOcean Health Index-Fisheries (0-100) 66.9 • pFish Stocks overexploited or collapsed by EEZ (%) 33.8 • ••Fish caught by trawling (%) 26.6 • 5
SDG15 – Life on Land Mean area that is protected in terrestrial sites important to biodiversity (%) 54.5 • 5Mean area that is protected in freshwater sites important to biodiversity (%) 39.9 • LRed List Index of species survival (0-1) 0.8 • pAnnual change in forest area (%) 19.8 • ••Imported biodiversity threats (threats per million population) 1.9 • ••SDG16 – Peace, Justice and Strong Institutions
Homicides (per 100,000 population) 34.3 • ••Prison population (per 100,000 population) 286.6 • ••Population who feel safe walking alone at night in the city or area where
they live (%)31.0 • 5
Government Efficiency (1-7) 3.6 • pProperty Rights (1-7) 4.6 • 5Children under 5 years of age whose births have been registered with a
civil authority (%)85.0 • ••
Corruption Perception Index (0-100) 43.0 • 5Children 5–14 years old involved in child labour (%) NA • ••Transfers of major conventional weapons (exports) (constant 1990
US$ million per 100,000 population)0.2 • ••
SDG17 – Partnerships for the Goals
Government Health and Education spending (% GDP) 14.8 • LHigh-income and all OECD DAC countries: International concessional
public finance, including official development assistance (% GNI)NA • ••
Other countries: Tax revenue (% GDP) 27.1 • 5Tax Haven Score (best 0-5 worst) 0.0 • ••
SDG1 – End Poverty Poverty headcount ratio at $1.90/day (% population) 24.6 • 5Projected poverty headcount ratio at $1.90/day in 2030 (% population) 22.2 • ••SDG2 – Zero Hunger
Prevalence of undernourishment (% population) 4.6 • ••Prevalence of stunting (low height-for-age) in children under 5 years of age (%) 23.9 • DPrevalence of wasting in children under 5 years of age (%) 4.7 • LPrevalence of obesity, BMI ≥ 30 (% adult population) 28.3 • pCereal yield (t/ha) 3.8 • 5Sustainable Nitrogen Management Index 0.7 • ••SDG3 – Good Health and Well-Being
Maternal mortality rate (per 100,000 live births) 138.0 • DNeonatal mortality rate (per 1,000 live births) 12.4 • LMortality rate, under-5 (per 1,000 live births) 43.3 • LIncidence of tuberculosis (per 100,000 population) 781.0 • DHIV prevalence (per 1,000) 4.4 • LAge-standardised death rate due to cardiovascular disease, cancer,
diabetes, and chronic respiratory disease in populations age 30–70 years (per 100,000 population)
26.5 • 5
Age-standardised death rate attributable to household air pollution and ambient air pollution (per 100,000 population)
67.2 • ••
Traffic deaths rate (per 100,000 population) 21.3 • DHealthy Life Expectancy at birth (years) 62.9 • LAdolescent fertility rate (births per 1,000 women ages 15-19) 44.4 • LBirths attended by skilled health personnel (%) 94.3 • ••Surviving infants who received 2 WHO-recommended vaccines (%) 66.0 • LUniversal Health Coverage Tracer Index (0-100) 53.6 • 5Subjective Wellbeing (average ladder score, 0-10) 4.5 • D
SDG4 – Quality Education
Net primary enrolment rate (%) 80.0 • ••Mean years of schooling 10.3 • LLiteracy rate of 15-24 year olds, both sexes (%) 99.0 • ••SDG5 – Gender Equality
Unmet demand for contraception, estimated (% women married or in union, ages 15-49 )
14.6 • 5
Female to male mean years of schooling of population age 25 + (%) 97.1 • ••Female to male labour force participation rate (%) 77.2 • 5Seats held by women in national parliaments (%) 42.0 • 5
SDG6 – Clean Water and Sanitation
High-income countries: population using safely managed water services (%) NA • ••Other countries: population using at least basic drinking water services (%) 84.7 • DHigh-income countries: population using safely managed sanitation services (%) NA • ••Other countries: population using at least basic sanitation services (%) 73.1 • DFreshwater withdrawal as % total renewable water resources 42.9 • ••Imported groundwater depletion (m3/year/capita) 3.3 • ••SDG7 – Affordable and Clean Energy
Access to electricity (% population) 86.0 • DAccess to clean fuels & technology for cooking (% population) 81.8 • LCO2 emissions from fuel combustion / electricity output (MtCO2/TWh) 1.9 • p
SDG8 – Decent Work and Economic Growth
Adjusted GDP Growth (%) -3.4 • ••Slavery score (0-100) 80.0 • ••Adults (15 years +) with an account at a bank or other financial institution or
with a mobile-money-service provider (%)69.2 • L
Unemployment rate (% total labour force) 27.7 • p
SDG9 – Industry, Innovation and Infrastructure
Proportion of the population using the internet (%) 54.0 • LMobile broadband subscriptions (per 100 inhabitants) 56.3 • LQuality of overall infrastructure (1= extremely underdeveloped;
7= extensive and efficient by international standards)4.1 • p
Value Rating Trend Value Rating Trend

SDG Index and Dashboards Report 2018 Global Responsibilities120
Notes: The full title of Goal 2 “Zero Hunger” is “End hunger, achieve food security and improved nutrition and promote sustainable agriculture”. The full title of each SDG is available here: https://sustainabledevelopment.un.org/topics/sustainabledevelopmentgoals
SDG TRENDS
D D D 5 D •• D 5 D
5 5 •• p D 5 D ••
Notes: The full title of Goal 2 “Zero Hunger” is “End hunger, achieve food security and improved nutrition and promote sustainable agriculture”. The full title of each SDG is available here: https://sustainabledevelopment.un.org/topics/sustainabledevelopmentgoals
OECD Countries
OVERALL PERFORMANCE
Index score Regional average score
SDG Global rank
79 (OF 156)
TURKEY
66.0 76.9
AVERAGE PERFORMANCE BY SDG
100
75
50
25
SDG
1SDG
17SDG
16
SDG
15
SDG
14
SDG
13
SDG
12
SDG
11SDG
10 SDG
9
SDG
8
SDG
7
SDG
6
SDG
5
SDG
4
SDG
3
SDG
2
Turkey
CURRENT ASSESSMENT – SDG DASHBOARD
AVERAGE PERFORMANCE BY SDG
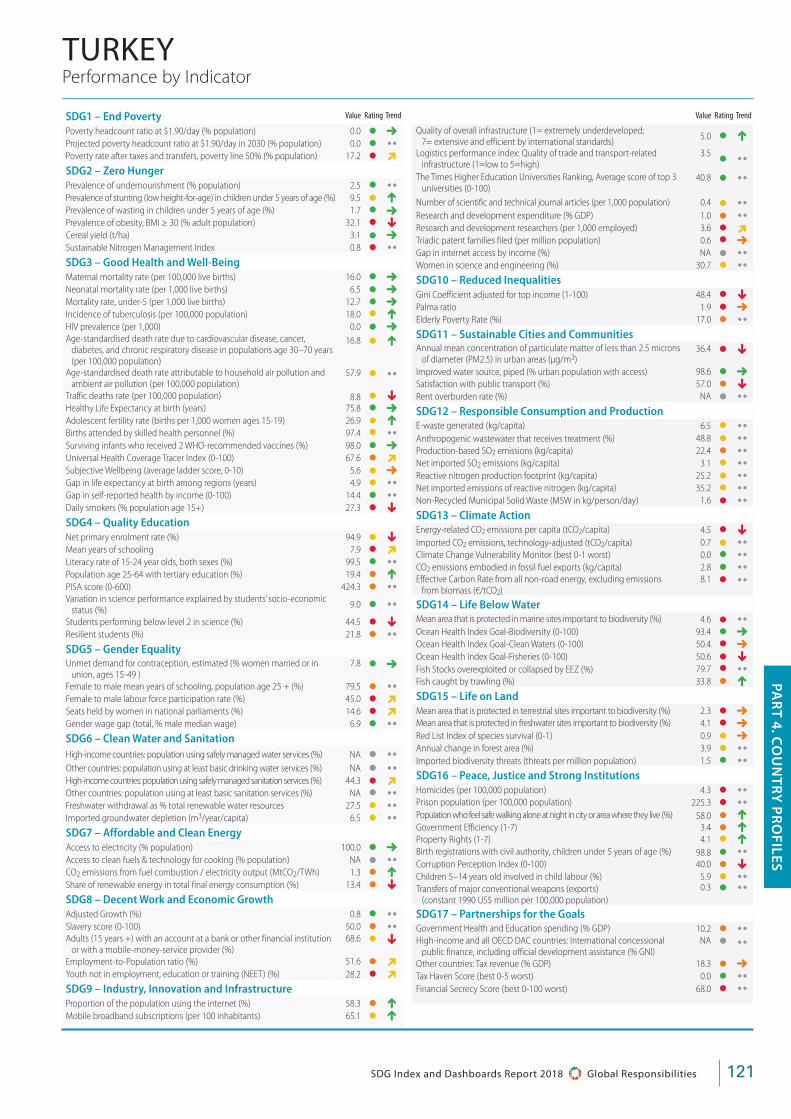
121SDG Index and Dashboards Report 2018 Global Responsibilities
Performance by Indicator
Value Rating Trend
PAR
T 4. CO
UN
TRY
PR
OFILES
SDG1 – End Poverty
Poverty headcount ratio at $1.90/day (% population) 0.0 • 5Projected poverty headcount ratio at $1.90/day in 2030 (% population) 0.0 • ••Poverty rate after taxes and transfers, poverty line 50% (% population) 17.2 • D
SDG2 – Zero Hunger Prevalence of undernourishment (% population) 2.5 • ••Prevalence of stunting (low height-for-age) in children under 5 years of age (%) 9.5 • LPrevalence of wasting in children under 5 years of age (%) 1.7 • 5Prevalence of obesity, BMI ≥ 30 (% adult population) 32.1 • pCereal yield (t/ha) 3.1 • 5Sustainable Nitrogen Management Index 0.8 • ••SDG3 – Good Health and Well-Being Maternal mortality rate (per 100,000 live births) 16.0 • 5Neonatal mortality rate (per 1,000 live births) 6.5 • 5Mortality rate, under-5 (per 1,000 live births) 12.7 • 5Incidence of tuberculosis (per 100,000 population) 18.0 • LHIV prevalence (per 1,000) 0.0 • 5Age-standardised death rate due to cardiovascular disease, cancer,
diabetes, and chronic respiratory disease in populations age 30–70 years (per 100,000 population)
16.8 • L
Age-standardised death rate attributable to household air pollution and ambient air pollution (per 100,000 population)
57.9 • ••Traffic deaths rate (per 100,000 population) 8.8 • pHealthy Life Expectancy at birth (years) 75.8 • 5Adolescent fertility rate (births per 1,000 women ages 15-19) 26.9 • LBirths attended by skilled health personnel (%) 97.4 • ••Surviving infants who received 2 WHO-recommended vaccines (%) 98.0 • 5Universal Health Coverage Tracer Index (0-100) 67.6 • DSubjective Wellbeing (average ladder score, 0-10) 5.6 • 5Gap in life expectancy at birth among regions (years) 4.9 • ••Gap in self-reported health by income (0-100) 14.4 • ••Daily smokers (% population age 15+) 27.3 • pSDG4 – Quality Education Net primary enrolment rate (%) 94.9 • pMean years of schooling 7.9 • DLiteracy rate of 15-24 year olds, both sexes (%) 99.5 • ••Population age 25-64 with tertiary education (%) 19.4 • LPISA score (0-600) 424.3 • ••Variation in science performance explained by students’ socio-economic
status (%)9.0 • ••
Students performing below level 2 in science (%) 44.5 • pResilient students (%) 21.8 • ••SDG5 – Gender Equality Unmet demand for contraception, estimated (% women married or in
union, ages 15-49 )7.8 • 5
Female to male mean years of schooling, population age 25 + (%) 79.5 • ••Female to male labour force participation rate (%) 45.0 • DSeats held by women in national parliaments (%) 14.6 • DGender wage gap (total, % male median wage) 6.9 • ••SDG6 – Clean Water and Sanitation
High-income countries: population using safely managed water services (%) NA • ••Other countries: population using at least basic drinking water services (%) NA • ••High-income countries: population using safely managed sanitation services (%) 44.3 • DOther countries: population using at least basic sanitation services (%) NA • ••Freshwater withdrawal as % total renewable water resources 27.5 • ••Imported groundwater depletion (m3/year/capita) 6.5 • ••SDG7 – Affordable and Clean Energy Access to electricity (% population) 100.0 • 5Access to clean fuels & technology for cooking (% population) NA • ••CO2 emissions from fuel combustion / electricity output (MtCO2/TWh) 1.3 • LShare of renewable energy in total final energy consumption (%) 13.4 • pSDG8 – Decent Work and Economic Growth Adjusted Growth (%) 0.8 • ••Slavery score (0-100) 50.0 • ••Adults (15 years +) with an account at a bank or other financial institution
or with a mobile-money-service provider (%)68.6 • p
Employment-to-Population ratio (%) 51.6 • DYouth not in employment, education or training (NEET) (%) 28.2 • D
SDG9 – Industry, Innovation and Infrastructure Proportion of the population using the internet (%) 58.3 • LMobile broadband subscriptions (per 100 inhabitants) 65.1 • L
Quality of overall infrastructure (1= extremely underdeveloped; 7= extensive and efficient by international standards)
5.0 • L
Logistics performance index: Quality of trade and transport-related infrastructure (1=low to 5=high)
3.5 • ••The Times Higher Education Universities Ranking, Average score of top 3
universities (0-100)40.8 • ••
Number of scientific and technical journal articles (per 1,000 population) 0.4 • ••Research and development expenditure (% GDP) 1.0 • ••Research and development researchers (per 1,000 employed) 3.6 • DTriadic patent families filed (per million population) 0.6 • 5Gap in internet access by income (%) NA • ••Women in science and engineering (%) 30.7 • ••SDG10 – Reduced Inequalities Gini Coefficient adjusted for top income (1-100) 48.4 • pPalma ratio 1.9 • 5Elderly Poverty Rate (%) 17.0 • ••SDG11 – Sustainable Cities and Communities Annual mean concentration of particulate matter of less than 2.5 microns
of diameter (PM2.5) in urban areas (μg/m3)36.4 • p
Improved water source, piped (% urban population with access) 98.6 • 5Satisfaction with public transport (%) 57.0 • pRent overburden rate (%) NA • ••SDG12 – Responsible Consumption and Production E-waste generated (kg/capita) 6.5 • ••Anthropogenic wastewater that receives treatment (%) 48.8 • ••Production-based SO2 emissions (kg/capita) 22.4 • ••Net imported SO2 emissions (kg/capita) 3.1 • ••Reactive nitrogen production footprint (kg/capita) 25.2 • ••Net imported emissions of reactive nitrogen (kg/capita) 35.2 • ••Non-Recycled Municipal Solid Waste (MSW in kg/person/day) 1.6 • ••SDG13 – Climate Action Energy-related CO2 emissions per capita (tCO2/capita) 4.5 • pImported CO2 emissions, technology-adjusted (tCO2/capita) 0.7 • ••Climate Change Vulnerability Monitor (best 0-1 worst) 0.0 • ••CO2 emissions embodied in fossil fuel exports (kg/capita) 2.8 • ••Effective Carbon Rate from all non-road energy, excluding emissions
from biomass (€/tCO2)8.1 • ••
SDG14 – Life Below Water Mean area that is protected in marine sites important to biodiversity (%) 4.6 • ••Ocean Health Index Goal-Biodiversity (0-100) 93.4 • 5Ocean Health Index Goal-Clean Waters (0-100) 50.4 • 5Ocean Health Index Goal-Fisheries (0-100) 50.6 • pFish Stocks overexploited or collapsed by EEZ (%) 79.7 • ••Fish caught by trawling (%) 33.8 • LSDG15 – Life on Land Mean area that is protected in terrestrial sites important to biodiversity (%) 2.3 • 5Mean area that is protected in freshwater sites important to biodiversity (%) 4.1 • 5Red List Index of species survival (0-1) 0.9 • 5Annual change in forest area (%) 3.9 • ••Imported biodiversity threats (threats per million population) 1.5 • ••SDG16 – Peace, Justice and Strong Institutions Homicides (per 100,000 population) 4.3 • ••Prison population (per 100,000 population) 225.3 • ••Population who feel safe walking alone at night in city or area where they live (%) 58.0 • LGovernment Efficiency (1-7) 3.4 • LProperty Rights (1-7) 4.1 • LBirth registrations with civil authority, children under 5 years of age (%) 98.8 • ••Corruption Perception Index (0-100) 40.0 • pChildren 5–14 years old involved in child labour (%) 5.9 • ••Transfers of major conventional weapons (exports)
(constant 1990 US$ million per 100,000 population)0.3 • ••
SDG17 – Partnerships for the Goals Government Health and Education spending (% GDP) 10.2 • ••High-income and all OECD DAC countries: International concessional
public finance, including official development assistance (% GNI)NA • ••
Other countries: Tax revenue (% GDP) 18.3 • 5Tax Haven Score (best 0-5 worst) 0.0 • ••Financial Secrecy Score (best 0-100 worst) 68.0 • ••
TURKEY
Value Rating Trend
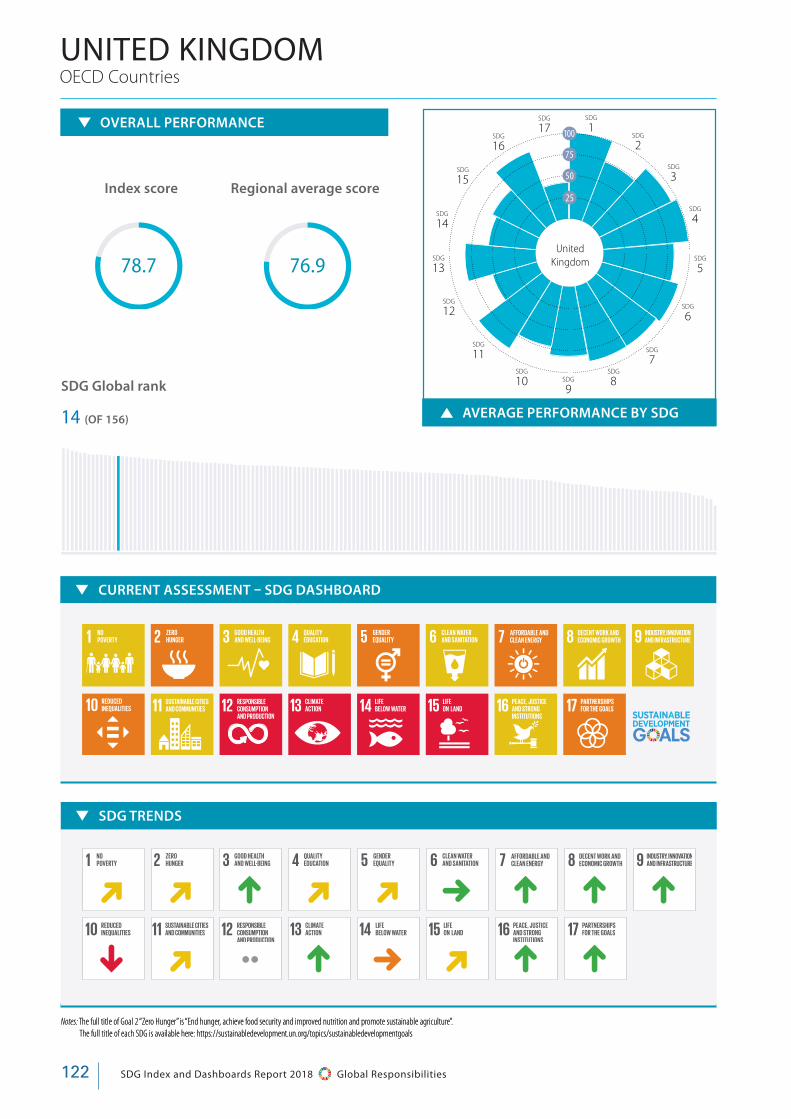
SDG Index and Dashboards Report 2018 Global Responsibilities122
Notes: The full title of Goal 2 “Zero Hunger” is “End hunger, achieve food security and improved nutrition and promote sustainable agriculture”. The full title of each SDG is available here: https://sustainabledevelopment.un.org/topics/sustainabledevelopmentgoals
SDG TRENDS
D D L D D 5 L L L
p D •• L 5 D L L
Notes: The full title of Goal 2 “Zero Hunger” is “End hunger, achieve food security and improved nutrition and promote sustainable agriculture”. The full title of each SDG is available here: https://sustainabledevelopment.un.org/topics/sustainabledevelopmentgoals
OECD Countries
OVERALL PERFORMANCE
Index score Regional average score
SDG Global rank
14 (OF 156)
UNITED KINGDOM
78.7 76.9
AVERAGE PERFORMANCE BY SDG
100
75
50
25
SDG
1SDG
17SDG
16
SDG
15
SDG
14
SDG
13
SDG
12
SDG
11SDG
10 SDG
9
SDG
8
SDG
7
SDG
6
SDG
5
SDG
4
SDG
3
SDG
2
United Kingdom
CURRENT ASSESSMENT – SDG DASHBOARD
AVERAGE PERFORMANCE BY SDG
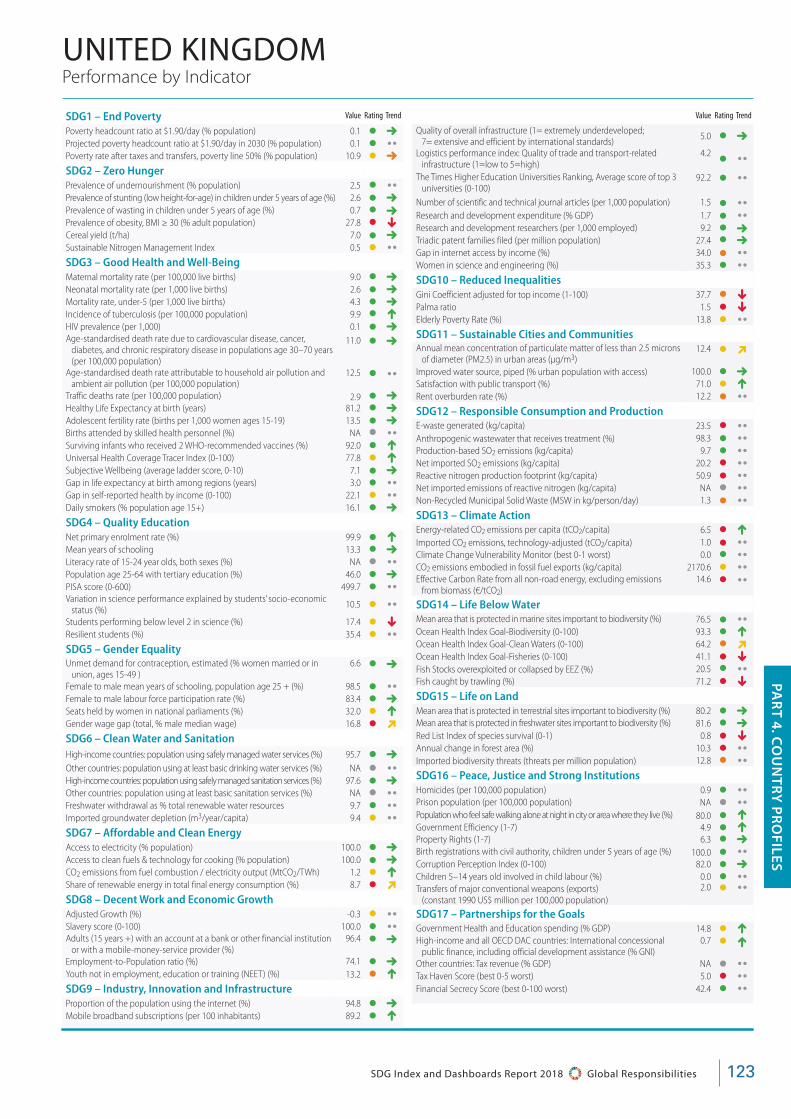
123SDG Index and Dashboards Report 2018 Global Responsibilities
Performance by Indicator
Value Rating Trend
PAR
T 4. CO
UN
TRY
PR
OFILES
SDG1 – End Poverty
Poverty headcount ratio at $1.90/day (% population) 0.1 • 5Projected poverty headcount ratio at $1.90/day in 2030 (% population) 0.1 • ••Poverty rate after taxes and transfers, poverty line 50% (% population) 10.9 • 5
SDG2 – Zero Hunger Prevalence of undernourishment (% population) 2.5 • ••Prevalence of stunting (low height-for-age) in children under 5 years of age (%) 2.6 • 5Prevalence of wasting in children under 5 years of age (%) 0.7 • 5Prevalence of obesity, BMI ≥ 30 (% adult population) 27.8 • pCereal yield (t/ha) 7.0 • 5Sustainable Nitrogen Management Index 0.5 • ••SDG3 – Good Health and Well-Being Maternal mortality rate (per 100,000 live births) 9.0 • 5Neonatal mortality rate (per 1,000 live births) 2.6 • 5Mortality rate, under-5 (per 1,000 live births) 4.3 • 5Incidence of tuberculosis (per 100,000 population) 9.9 • LHIV prevalence (per 1,000) 0.1 • 5Age-standardised death rate due to cardiovascular disease, cancer,
diabetes, and chronic respiratory disease in populations age 30–70 years (per 100,000 population)
11.0 • 5
Age-standardised death rate attributable to household air pollution and ambient air pollution (per 100,000 population)
12.5 • ••Traffic deaths rate (per 100,000 population) 2.9 • 5Healthy Life Expectancy at birth (years) 81.2 • 5Adolescent fertility rate (births per 1,000 women ages 15-19) 13.5 • 5Births attended by skilled health personnel (%) NA • ••Surviving infants who received 2 WHO-recommended vaccines (%) 92.0 • LUniversal Health Coverage Tracer Index (0-100) 77.8 • LSubjective Wellbeing (average ladder score, 0-10) 7.1 • 5Gap in life expectancy at birth among regions (years) 3.0 • ••Gap in self-reported health by income (0-100) 22.1 • ••Daily smokers (% population age 15+) 16.1 • 5
SDG4 – Quality Education Net primary enrolment rate (%) 99.9 • LMean years of schooling 13.3 • 5Literacy rate of 15-24 year olds, both sexes (%) NA • ••Population age 25-64 with tertiary education (%) 46.0 • 5PISA score (0-600) 499.7 • ••Variation in science performance explained by students’ socio-economic
status (%)10.5 • ••
Students performing below level 2 in science (%) 17.4 • pResilient students (%) 35.4 • ••SDG5 – Gender Equality Unmet demand for contraception, estimated (% women married or in
union, ages 15-49 )6.6 • 5
Female to male mean years of schooling, population age 25 + (%) 98.5 • ••Female to male labour force participation rate (%) 83.4 • 5Seats held by women in national parliaments (%) 32.0 • LGender wage gap (total, % male median wage) 16.8 • D
SDG6 – Clean Water and Sanitation
High-income countries: population using safely managed water services (%) 95.7 • 5Other countries: population using at least basic drinking water services (%) NA • ••High-income countries: population using safely managed sanitation services (%) 97.6 • 5Other countries: population using at least basic sanitation services (%) NA • ••Freshwater withdrawal as % total renewable water resources 9.7 • ••Imported groundwater depletion (m3/year/capita) 9.4 • ••SDG7 – Affordable and Clean Energy Access to electricity (% population) 100.0 • 5Access to clean fuels & technology for cooking (% population) 100.0 • 5CO2 emissions from fuel combustion / electricity output (MtCO2/TWh) 1.2 • LShare of renewable energy in total final energy consumption (%) 8.7 • D
SDG8 – Decent Work and Economic Growth Adjusted Growth (%) -0.3 • ••Slavery score (0-100) 100.0 • ••Adults (15 years +) with an account at a bank or other financial institution
or with a mobile-money-service provider (%)96.4 • 5
Employment-to-Population ratio (%) 74.1 • 5Youth not in employment, education or training (NEET) (%) 13.2 • LSDG9 – Industry, Innovation and Infrastructure Proportion of the population using the internet (%) 94.8 • 5Mobile broadband subscriptions (per 100 inhabitants) 89.2 • L
Quality of overall infrastructure (1= extremely underdeveloped; 7= extensive and efficient by international standards)
5.0 • 5
Logistics performance index: Quality of trade and transport-related infrastructure (1=low to 5=high)
4.2 • ••The Times Higher Education Universities Ranking, Average score of top 3
universities (0-100)92.2 • ••
Number of scientific and technical journal articles (per 1,000 population) 1.5 • ••Research and development expenditure (% GDP) 1.7 • ••Research and development researchers (per 1,000 employed) 9.2 • 5Triadic patent families filed (per million population) 27.4 • 5Gap in internet access by income (%) 34.0 • ••Women in science and engineering (%) 35.3 • ••SDG10 – Reduced Inequalities Gini Coefficient adjusted for top income (1-100) 37.7 • pPalma ratio 1.5 • pElderly Poverty Rate (%) 13.8 • ••SDG11 – Sustainable Cities and Communities Annual mean concentration of particulate matter of less than 2.5 microns
of diameter (PM2.5) in urban areas (μg/m3)12.4 • D
Improved water source, piped (% urban population with access) 100.0 • 5Satisfaction with public transport (%) 71.0 • LRent overburden rate (%) 12.2 • ••SDG12 – Responsible Consumption and Production E-waste generated (kg/capita) 23.5 • ••Anthropogenic wastewater that receives treatment (%) 98.3 • ••Production-based SO2 emissions (kg/capita) 9.7 • ••Net imported SO2 emissions (kg/capita) 20.2 • ••Reactive nitrogen production footprint (kg/capita) 50.9 • ••Net imported emissions of reactive nitrogen (kg/capita) NA • ••Non-Recycled Municipal Solid Waste (MSW in kg/person/day) 1.3 • ••SDG13 – Climate Action Energy-related CO2 emissions per capita (tCO2/capita) 6.5 • LImported CO2 emissions, technology-adjusted (tCO2/capita) 1.0 • ••Climate Change Vulnerability Monitor (best 0-1 worst) 0.0 • ••CO2 emissions embodied in fossil fuel exports (kg/capita) 2170.6 • ••Effective Carbon Rate from all non-road energy, excluding emissions
from biomass (€/tCO2)14.6 • ••
SDG14 – Life Below Water Mean area that is protected in marine sites important to biodiversity (%) 76.5 • ••Ocean Health Index Goal-Biodiversity (0-100) 93.3 • LOcean Health Index Goal-Clean Waters (0-100) 64.2 • DOcean Health Index Goal-Fisheries (0-100) 41.1 • pFish Stocks overexploited or collapsed by EEZ (%) 20.5 • ••Fish caught by trawling (%) 71.2 • pSDG15 – Life on Land Mean area that is protected in terrestrial sites important to biodiversity (%) 80.2 • 5Mean area that is protected in freshwater sites important to biodiversity (%) 81.6 • 5Red List Index of species survival (0-1) 0.8 • pAnnual change in forest area (%) 10.3 • ••Imported biodiversity threats (threats per million population) 12.8 • ••SDG16 – Peace, Justice and Strong Institutions Homicides (per 100,000 population) 0.9 • ••Prison population (per 100,000 population) NA • ••Population who feel safe walking alone at night in city or area where they live (%) 80.0 • LGovernment Efficiency (1-7) 4.9 • LProperty Rights (1-7) 6.3 • 5Birth registrations with civil authority, children under 5 years of age (%) 100.0 • ••Corruption Perception Index (0-100) 82.0 • 5Children 5–14 years old involved in child labour (%) 0.0 • ••Transfers of major conventional weapons (exports)
(constant 1990 US$ million per 100,000 population)2.0 • ••
SDG17 – Partnerships for the Goals Government Health and Education spending (% GDP) 14.8 • LHigh-income and all OECD DAC countries: International concessional
public finance, including official development assistance (% GNI)0.7 • L
Other countries: Tax revenue (% GDP) NA • ••Tax Haven Score (best 0-5 worst) 5.0 • ••Financial Secrecy Score (best 0-100 worst) 42.4 • ••
Value Rating Trend
UNITED KINGDOM
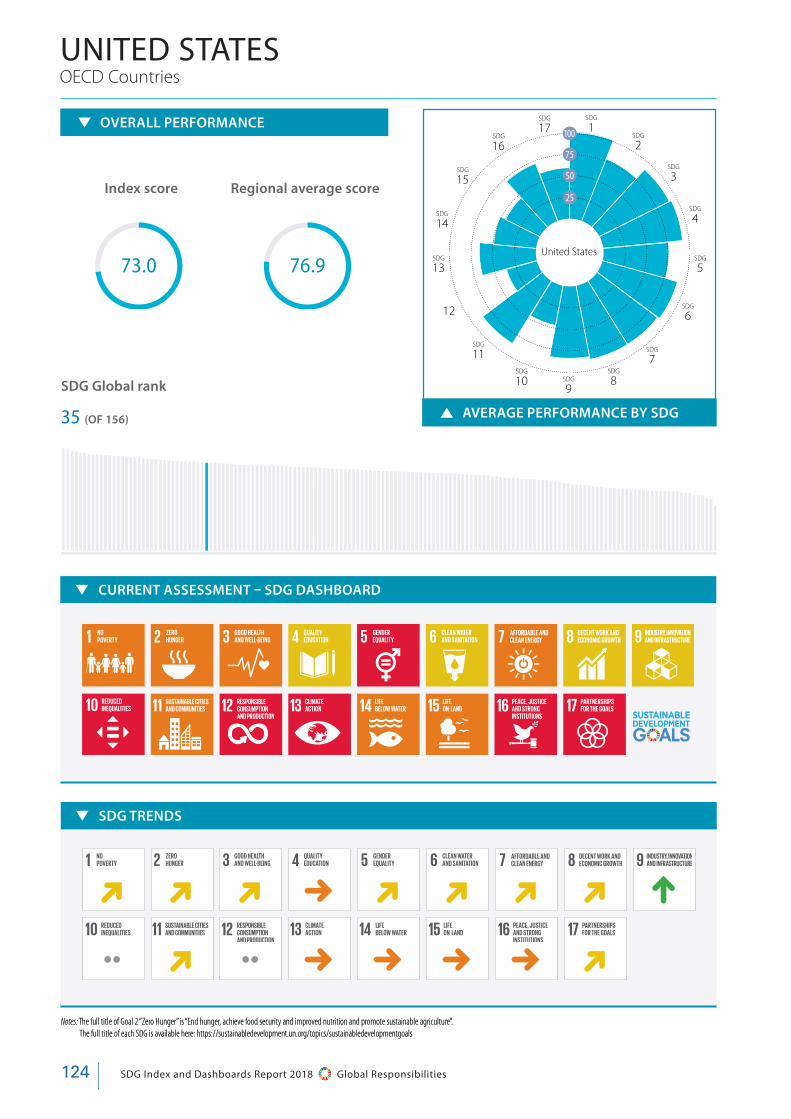
SDG Index and Dashboards Report 2018 Global Responsibilities124
Notes: The full title of Goal 2 “Zero Hunger” is “End hunger, achieve food security and improved nutrition and promote sustainable agriculture”. The full title of each SDG is available here: https://sustainabledevelopment.un.org/topics/sustainabledevelopmentgoalsNotes: The full title of Goal 2 “Zero Hunger” is “End hunger, achieve food security and improved nutrition and promote sustainable agriculture”. The full title of each SDG is available here: https://sustainabledevelopment.un.org/topics/sustainabledevelopmentgoals
OECD Countries
OVERALL PERFORMANCE
Index score Regional average score
SDG Global rank
35 (OF 156)
UNITED STATES
73.0 76.9
AVERAGE PERFORMANCE BY SDG
100
75
50
25
SDG
1SDG
17SDG
16
SDG
15
SDG
14
SDG
13
12
SDG
11SDG
10 SDG
9
SDG
8
SDG
7
SDG
6
SDG
5
SDG
4
SDG
3
SDG
2
United States
CURRENT ASSESSMENT – SDG DASHBOARD
SDG TRENDS
D D D 5 D D D D L
•• D •• 5 5 5 5 D
AVERAGE PERFORMANCE BY SDG
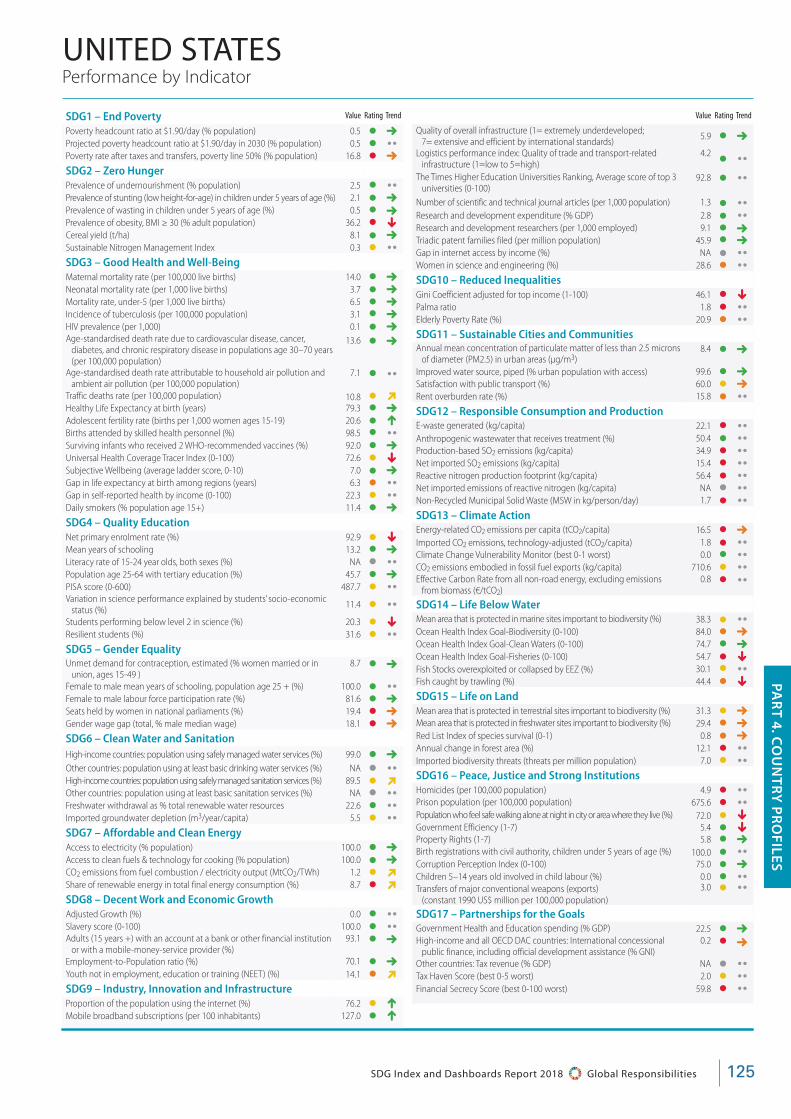
125SDG Index and Dashboards Report 2018 Global Responsibilities
Performance by Indicator
Value Rating Trend
PAR
T 4. CO
UN
TRY
PR
OFILES
SDG1 – End Poverty
Poverty headcount ratio at $1.90/day (% population) 0.5 • 5Projected poverty headcount ratio at $1.90/day in 2030 (% population) 0.5 • ••Poverty rate after taxes and transfers, poverty line 50% (% population) 16.8 • 5
SDG2 – Zero Hunger Prevalence of undernourishment (% population) 2.5 • ••Prevalence of stunting (low height-for-age) in children under 5 years of age (%) 2.1 • 5Prevalence of wasting in children under 5 years of age (%) 0.5 • 5Prevalence of obesity, BMI ≥ 30 (% adult population) 36.2 • pCereal yield (t/ha) 8.1 • 5Sustainable Nitrogen Management Index 0.3 • ••SDG3 – Good Health and Well-Being Maternal mortality rate (per 100,000 live births) 14.0 • 5Neonatal mortality rate (per 1,000 live births) 3.7 • 5Mortality rate, under-5 (per 1,000 live births) 6.5 • 5Incidence of tuberculosis (per 100,000 population) 3.1 • 5HIV prevalence (per 1,000) 0.1 • 5Age-standardised death rate due to cardiovascular disease, cancer,
diabetes, and chronic respiratory disease in populations age 30–70 years (per 100,000 population)
13.6 • 5
Age-standardised death rate attributable to household air pollution and ambient air pollution (per 100,000 population)
7.1 • ••Traffic deaths rate (per 100,000 population) 10.8 • DHealthy Life Expectancy at birth (years) 79.3 • 5Adolescent fertility rate (births per 1,000 women ages 15-19) 20.6 • LBirths attended by skilled health personnel (%) 98.5 • ••Surviving infants who received 2 WHO-recommended vaccines (%) 92.0 • 5Universal Health Coverage Tracer Index (0-100) 72.6 • pSubjective Wellbeing (average ladder score, 0-10) 7.0 • 5Gap in life expectancy at birth among regions (years) 6.3 • ••Gap in self-reported health by income (0-100) 22.3 • ••Daily smokers (% population age 15+) 11.4 • 5
SDG4 – Quality Education Net primary enrolment rate (%) 92.9 • pMean years of schooling 13.2 • 5Literacy rate of 15-24 year olds, both sexes (%) NA • ••Population age 25-64 with tertiary education (%) 45.7 • 5PISA score (0-600) 487.7 • ••Variation in science performance explained by students’ socio-economic
status (%)11.4 • ••
Students performing below level 2 in science (%) 20.3 • pResilient students (%) 31.6 • ••SDG5 – Gender Equality Unmet demand for contraception, estimated (% women married or in
union, ages 15-49 )8.7 • 5
Female to male mean years of schooling, population age 25 + (%) 100.0 • ••Female to male labour force participation rate (%) 81.6 • 5Seats held by women in national parliaments (%) 19.4 • 5Gender wage gap (total, % male median wage) 18.1 • 5
SDG6 – Clean Water and Sanitation
High-income countries: population using safely managed water services (%) 99.0 • 5Other countries: population using at least basic drinking water services (%) NA • ••High-income countries: population using safely managed sanitation services (%) 89.5 • DOther countries: population using at least basic sanitation services (%) NA • ••Freshwater withdrawal as % total renewable water resources 22.6 • ••Imported groundwater depletion (m3/year/capita) 5.5 • ••SDG7 – Affordable and Clean Energy Access to electricity (% population) 100.0 • 5Access to clean fuels & technology for cooking (% population) 100.0 • 5CO2 emissions from fuel combustion / electricity output (MtCO2/TWh) 1.2 • DShare of renewable energy in total final energy consumption (%) 8.7 • D
SDG8 – Decent Work and Economic Growth Adjusted Growth (%) 0.0 • ••Slavery score (0-100) 100.0 • ••Adults (15 years +) with an account at a bank or other financial institution
or with a mobile-money-service provider (%)93.1 • 5
Employment-to-Population ratio (%) 70.1 • 5Youth not in employment, education or training (NEET) (%) 14.1 • D
SDG9 – Industry, Innovation and Infrastructure Proportion of the population using the internet (%) 76.2 • LMobile broadband subscriptions (per 100 inhabitants) 127.0 • L
Quality of overall infrastructure (1= extremely underdeveloped; 7= extensive and efficient by international standards)
5.9 • 5
Logistics performance index: Quality of trade and transport-related infrastructure (1=low to 5=high)
4.2 • ••The Times Higher Education Universities Ranking, Average score of top 3
universities (0-100)92.8 • ••
Number of scientific and technical journal articles (per 1,000 population) 1.3 • ••Research and development expenditure (% GDP) 2.8 • ••Research and development researchers (per 1,000 employed) 9.1 • 5Triadic patent families filed (per million population) 45.9 • 5Gap in internet access by income (%) NA • ••Women in science and engineering (%) 28.6 • ••SDG10 – Reduced Inequalities Gini Coefficient adjusted for top income (1-100) 46.1 • pPalma ratio 1.8 • ••Elderly Poverty Rate (%) 20.9 • ••SDG11 – Sustainable Cities and Communities Annual mean concentration of particulate matter of less than 2.5 microns
of diameter (PM2.5) in urban areas (μg/m3)8.4 • 5
Improved water source, piped (% urban population with access) 99.6 • 5Satisfaction with public transport (%) 60.0 • 5Rent overburden rate (%) 15.8 • ••SDG12 – Responsible Consumption and Production E-waste generated (kg/capita) 22.1 • ••Anthropogenic wastewater that receives treatment (%) 50.4 • ••Production-based SO2 emissions (kg/capita) 34.9 • ••Net imported SO2 emissions (kg/capita) 15.4 • ••Reactive nitrogen production footprint (kg/capita) 56.4 • ••Net imported emissions of reactive nitrogen (kg/capita) NA • ••Non-Recycled Municipal Solid Waste (MSW in kg/person/day) 1.7 • ••SDG13 – Climate Action Energy-related CO2 emissions per capita (tCO2/capita) 16.5 • 5Imported CO2 emissions, technology-adjusted (tCO2/capita) 1.8 • ••Climate Change Vulnerability Monitor (best 0-1 worst) 0.0 • ••CO2 emissions embodied in fossil fuel exports (kg/capita) 710.6 • ••Effective Carbon Rate from all non-road energy, excluding emissions
from biomass (€/tCO2)0.8 • ••
SDG14 – Life Below Water Mean area that is protected in marine sites important to biodiversity (%) 38.3 • ••Ocean Health Index Goal-Biodiversity (0-100) 84.0 • 5Ocean Health Index Goal-Clean Waters (0-100) 74.7 • 5Ocean Health Index Goal-Fisheries (0-100) 54.7 • pFish Stocks overexploited or collapsed by EEZ (%) 30.1 • ••Fish caught by trawling (%) 44.4 • pSDG15 – Life on Land Mean area that is protected in terrestrial sites important to biodiversity (%) 31.3 • 5Mean area that is protected in freshwater sites important to biodiversity (%) 29.4 • 5Red List Index of species survival (0-1) 0.8 • 5Annual change in forest area (%) 12.1 • ••Imported biodiversity threats (threats per million population) 7.0 • ••SDG16 – Peace, Justice and Strong Institutions Homicides (per 100,000 population) 4.9 • ••Prison population (per 100,000 population) 675.6 • ••Population who feel safe walking alone at night in city or area where they live (%) 72.0 • pGovernment Efficiency (1-7) 5.4 • pProperty Rights (1-7) 5.8 • 5Birth registrations with civil authority, children under 5 years of age (%) 100.0 • ••Corruption Perception Index (0-100) 75.0 • 5Children 5–14 years old involved in child labour (%) 0.0 • ••Transfers of major conventional weapons (exports)
(constant 1990 US$ million per 100,000 population)3.0 • ••
SDG17 – Partnerships for the Goals Government Health and Education spending (% GDP) 22.5 • 5High-income and all OECD DAC countries: International concessional
public finance, including official development assistance (% GNI)0.2 • 5
Other countries: Tax revenue (% GDP) NA • ••Tax Haven Score (best 0-5 worst) 2.0 • ••Financial Secrecy Score (best 0-100 worst) 59.8 • ••
Value Rating Trend
UNITED STATES

SDG
IND
EX A
ND
DA
SHB
OA
RD
S REPO
RT 20
18 G20
AN
D LA
RG
E COU
NTR
IES EDITIO
N