sdss iv manga - the spatially resolved transition … 000, 1–17 (2016) preprint 24 january 2017...
TRANSCRIPT

MNRAS 000, 1–17 (2016) Preprint 24 January 2017 Compiled using MNRAS LATEX style file v3.0
SDSS IV MaNGA - the spatially resolved transition from starformation to quiescence.
Francesco Belfiore1,2?, Roberto Maiolino1,2, Claudia Maraston3, Eric Emsellem4,5,Matthew A. Bershady6, Karen L. Masters3,7, Dmitry Bizyaev8,9, Médéric Boquien10,Joel R. Brownstein11, Kevin Bundy12, Aleksandar M. Diamond-Stanic6,13, Niv Drory14,Timothy M. Heckman15, David R. Law16, Olena Malanushenko9, Audrey Oravetz9,Kaike Pan9, Alexandre Roman-Lopes17, Daniel Thomas3, Anne-Marie Weijmans18,Kyle B. Westfall3 and Renbin Yan19
(Affiliations can be found after the references)
Accepted . Received ; in original form
ABSTRACTUsing spatially resolved spectroscopy from SDSS-IV MaNGA we have demonstrated thatlow ionisation emission line regions (LIERs) in local galaxies result from photoionisation byhot evolved stars, not active galactic nuclei, hence tracing galactic region hosting old stellarpopulation where, despite the presence of ionised gas, star formation is no longer occurring.LIERs are ubiquitous in both quiescent galaxies and in the central regions of galaxies wherestar formation takes place at larger radii. We refer to these two classes of galaxies as extendedLIER (eLIER) and central LIER (cLIER) galaxies respectively. cLIERs are late type galaxiesprimarily spread across the green valley, in the transition region between the star formationmain sequence and quiescent galaxies. These galaxies display regular disc rotation in bothstars and gas, although featuring a higher central stellar velocity dispersion than star forminggalaxies of the same mass. cLIERs are consistent with being slowly quenched inside-out; thetransformation is associated with massive bulges, pointing towards the importance of bulgegrowth via secular evolution. eLIERs are morphologically early types and are indistinguish-able from passive galaxies devoid of line emission in terms of their stellar populations, mor-phology and central stellar velocity dispersion. Ionised gas in eLIERs shows both disturbedand disc-like kinematics. When a large-scale flow/rotation is observed in the gas, it is oftenmisaligned relative to the stellar component. These features indicate that eLIERs are passivegalaxies harbouring a residual cold gas component, acquired mostly via external accretion.Importantly, quiescent galaxies devoid of line emission reside in denser environments andhave significantly higher satellite fraction than eLIERs. Environmental effects thus representthe likely cause for the existence of line-less galaxies on the red sequence.
Key words: galaxies: ISM – galaxies: evolution – galaxies: fundamental parameters – galax-ies: survey
1 INTRODUCTION
Large spectroscopic galaxy surveys (SDSS, York et al. 2000,GAMA, Driver et al. 2011, zCOSMOS, Lilly et al. 2007) havedemonstrated that galaxies are strongly bimodal in several of theirfundamental properties, including colours, star formation rates,stellar ages, morphology and gas content (Strateva et al. 2001;
? Email: [email protected]
Blanton et al. 2003; Baldry et al. 2004, 2006; Wyder et al. 2007;Schawinski et al. 2007; Blanton & Moustakas 2009; Peng et al.2010; Thomas et al. 2010). These observations support a scenariowhere some physical processes lead galaxies to transition from the‘star forming’ (SF) blue cloud to the passive ‘red sequence’, caus-ing the eventual shut-down (or ‘quenching’) of star formation on agalaxy-wide scale.
The physics driving this transformation is currently hotly de-bated and has not yet been unambiguously identified, although
c© 2016 The Authors
arX
iv:1
609.
0173
7v2
[as
tro-
ph.G
A]
23
Jan
2017

2 F. Belfiore et al.
it is likely that more than one mechanism is at play (Schawin-ski et al. 2007; Peng et al. 2010; Schawinski et al. 2014; Mendelet al. 2013; Peng et al. 2015; Smethurst et al. 2015). A growingbody of evidence points towards at least two quenching pathways:an environment-dependent channel, acting differentially on centraland satellite galaxies, and a mass-dependent channel, which maybe associated with internal processes (Silk 1977; Rees & Ostriker1977; Kauffmann et al. 2006). This inference is supported by theseparability of the effects of mass and environment on the passivefraction (Baldry et al. 2006; Peng et al. 2010; Thomas et al. 2010).These two quenching pathways have each been associated with sev-eral physical processes: ram pressure stripping (Larson et al. 1980),harassment and strangulation (Gunn & Gott 1972; Peng et al. 2015)for the environment-related channel and radio mode feedback fromactive galactic nuclei (AGN, Dekel & Birnboim 2006; Croton et al.2006; Cattaneo et al. 2009), halo mass shock heating (Birnboim& Dekel 2003; Keres et al. 2005; Dekel & Birnboim 2006; Kereset al. 2009) or morphological quenching (Martig et al. 2009; Genzelet al. 2014; Forbes et al. 2014) for the mass-dependant channel. Ithas also been suggested that both mass and environmental quench-ing may be manifestations of the same quenching channel (Knobelet al. 2015; Carollo et al. 2016).
Observationally much work has been dedicated to the study ofenvironmental effects, demonstrating that local environment cor-relates well with morphology (e.g Dressler 1980; Bamford et al.2009), colour (Blanton et al. 2005b; Baldry et al. 2006; Peng et al.2010) or gas content (Cortese et al. 2011; Boselli et al. 2014). Thedirect effect of the hot cluster atmosphere on infalling galaxies (rampressure stripping) is further observed both via trails of HI (e.gChung et al. 2009) and ionised gas (e.g Fumagalli et al. 2014; Pog-gianti et al. 2016).
Regarding the mass quenching regime, the observational pic-ture is much more complex. Several studies agree on the fact thatthe presence of a massive bulge is the single best observational pa-rameter correlating with the probability of a galaxy to be passive(Pasquali et al. 2012; Cheung et al. 2012; Wake et al. 2012; Blucket al. 2014). Since black hole mass is correlated to the bulge mass(Marconi & Hunt 2003; Häring & Rix 2004; McConnell & Ma2013), it can be expected that galaxies with more massive bulgesexperience a larger amount of energetic feedback from their blackholes. The details of the coupling between the black hole and itshost galaxy are, however, not currently understood. As recently re-viewed by Heckman & Best (2014), AGN appear as a bimodal pop-ulation that can be broadly divided into radiative-mode (includingSeyfert galaxies and quasars) and radio-mode AGN. In the low red-shift Universe, no direct correlation is observed between radiative-mode AGN and the shutdown of star formation, as radiative-modeAGN are often associated with the presence of star formation inthe central regions of galaxies (inner few kpc). While radiative-mode AGN are observed to power large scale outflows (Maiolinoet al. 2012; Cicone et al. 2014; Carniani et al. 2015), the duty cy-cle and time-scales of these phenomena is uncertain, thus makingtheir impact on the exhaustion of the cold gas reservoir in galaxiesquestionable. Radio mode AGN, on the other hand, are observed toinflate large bubbles of ionised gas in massive haloes, thus playingan important contribution to offsetting the cooling of the gas in thehalo (Fabian 2012). The extension of this feedback mechanisms tolower masses (halo mass < 1012 M) is observationally uncertain.
Both environmental and mass quenching (through radio-modeAGN heating) channels are included in recent semi-analytical mod-els (Croton et al. 2006; Bower et al. 2006) and in cosmologicalhydrodynamical simulations via sub-grid prescriptions (Gabor &
Davé 2012; Vogelsberger et al. 2014; Schaye et al. 2014) in or-der to match the stellar mass function and the bimodality of theobserved galaxy population. In recent years, models of galaxy for-mation and evolution have become able to qualitatively reproducethe main features of the bimodal galaxy population (e.g. Sales et al.2014; Trayford et al. 2016). Namely, in simulations environmen-tal quenching appears to be the main cause of growth of the redsequence at low masses, while AGN radio-mode heating is respon-sible for the presence of high-mass central passive galaxies. How-ever, while qualitative agreement with observations is promising,this success does not imply that the sub-grid recipes implementedfor AGN feedback are physically correct.
Observationally, further insight into the quenching processcould be obtained by a statistical study of how it proceeds insidegalaxies: ‘inside out’ versus ‘outside in’ scenarios (e.g Tacchellaet al. 2015; Li et al. 2015), and what role the different morphologi-cal components (disc, bar, bulge) have in the process (Martig et al.2009; Masters et al. 2012). Current integral field spectroscopy (IFS)galaxy surveys (CALIFA, Sánchez et al. 2012; SAMI, Allen et al.2015; MaNGA, Bundy et al. 2015) promise to revolutionise theobservational picture, by enabling the study of the relation betweenstar formation and quiescence on resolved scales. Nebular emissionlines, originating from SF regions, are the ideal tool to trace current(<100 Myr old) star formation on the kpc scales (Kennicutt 1998)probed by a survey like MaNGA (mean redshift < z >∼ 0.03), pro-vided other contributions to line emission (AGN, old hot stars etc)can be disentangled.
In this paper we make use of a large sample of ∼ 600 galax-ies observed as part of the Sloan digital sky survey IV (Blantonet al., submitted) Mapping nearby galaxies at Apache Point Ob-servatory (MaNGA) survey, and build on the analysis presented inBelfiore et al. (2016) (henceforth Paper I) to define spatially re-solved ‘quiescence’ and make an unbiased census of star formingand quiescent regions within the z∼0 galaxy population. This workis structured as follows. In Sec. 2 we briefly recap the relevant prop-erties of the MaNGA data and our spectral fits. In Sec. 3 we sum-marise the main findings of Paper I, including our new emission-line based galaxy classification, the importance of low ionisationemission-line regions (LIERs) in the context of understanding qui-escence in galaxies and the stellar populations properties of the dif-ferent galaxy classes. In Sec. 4 we explore the role of LIER galaxieswithin the bimodal galaxy population, while in Sec. 5 we gather ev-idence regarding the origin of the ionised gas in LIERs. Finally inSec. 6 we discuss possible evolutionary scenarios for LIER galax-ies. We conclude in Sec. 8.
Throughout this work redshifts, optical and UV photome-try and stellar masses are taken from the MaNGA targeting cat-alogue, based on an extended version of the NASA Sloan Atlas(NASA-Sloan catalogue (NSA v1_0_11, Blanton et al. 2011). Stel-lar masses are derived using a Chabrier (2003) initial mass functionand using the kcorrect software package (version v4_2, Blanton& Roweis 2007) with Bruzual & Charlot (2003) simple stellar pop-ulation models. All quoted magnitudes are in the AB system andk-corrected to rest frame after correction for galactic extinction. Ef-fective radii are measured from the SDSS photometry by perform-ing a Sérsic fit in the r-band. Single fibre spectroscopic data fromthe SDSS Legacy Survey data release 7, (Abazajian et al. 2009) forthe main galaxy sample targets (Strauss et al. 2002) are referred toas legacy SDSS. When quoting luminosities, masses and distances
1 http://www.sdss.org/dr13/manga/manga-target-selection/nsa/
MNRAS 000, 1–17 (2016)

The transition from star formation to quiescence 3
we make use of a ΛCDM cosmology with Ωm = 0.3, ΩΛ = 0.7 andH0 = 70 km−1s−1Mpc−1.
2 THE MANGA DATA
MaNGA (Bundy et al. 2015; Yan et al. 2016b) is an IFS survey,making use of the SDSS 2.5m telescope at Apache Point Observa-tory (Gunn et al. 2006), aimed at obtaining spatially resolved spec-troscopy for 10 000 nearby galaxies in the redshift range 0.01 <z < 0.15. Observations are obtained using purpose-built hexagonalintegral field units (IFUs, Drory et al. 2015), assembled from 2′′ di-ameter fibres, which are fed to the dual beam BOSS spectrographscovering the wavelength range 3600 and 10300 Å with a spectralresolution R ∼ 2000 (Smee et al. 2013). The size distribution ofthe IFUs is optimised to match the size and density of galaxy tar-gets on the sky (Wake at al., in prep.), in order to cover 2/3 of thetargets to 1.5 effective radii (Re) and 1/3 of the targets to 2.5 Re.The MaNGA sample is selected to be flat in i-band absolute mag-nitude. At each i-band magnitude (and thus approximately in eachstellar mass bin) the MaNGA primary and secondary samples areselected to be volume limited within a prescribed redshift range.
Seventeen galaxy IFUs (ranging from 19-fibre IFU, 12′′ onsky diameter, to 127-fibre IFU, 32′′ on sky diameter) are observedsimultaneously, together with a set of twelve 7-fibre minibundlesused for flux calibration (Yan et al. 2016a) and 92 single fibres forsky subtraction. A three-point dithering pattern is used during ob-servations to compensate for light loss and obtain a uniform pointspread function (PSF, Law et al. 2015). The MaNGA data werereduced using version v1_3_3 of the MaNGA reduction pipeline(Law et al. 2016). The wavelength calibrated, sky subtracted andflux calibrated MaNGA fibre spectra (error vectors and mask vec-tors) and their respective astrometric solutions are combined to pro-duce final datacubes with pixel size set to 0.5′′. The median PSFof the MaNGA datacubes is estimated to have a full width at half-maximum (FHWM) of 2.5′′. The MaNGA sample has been demon-strated to be well-suited for studies of gas physics and stellar pop-ulation properties of nearby galaxies as shown in preliminary anal-ysis of data from the MaNGA prototype instrument (Belfiore et al.2015; Li et al. 2015; Wilkinson et al. 2015).
Physical parameters of the continuum and the emission linesare obtained via a customised spectral fitting procedure describedin Paper I (Sec. 2.2). In short, spaxels are binned for optimising theS/N ratio in the continuum, which is then fitted with a set of MIUS-CAT simple stellar population templates (Vazdekis et al. 2012) viathe penalised pixel fitting routine (Cappellari & Emsellem 2004).Subsequently a new binning is performed, optimising the Hα S/N,which is used to fit nebular emission lines. Emission lines are fittedas sets of Gaussians (one per line) with a common velocity. Furtherconstrains are imposed on lines originating from the same ion.
3 LIER EMISSION IN GALAXIES: CLASSIFICATIONAND OPEN QUESTIONS
3.1 Paper I: A revised classification scheme based onspatially resolved diagnostic diagrams
In Paper I we investigated the spatial distribution and prop-erties of galactic regions that are classified as ‘LINERs’ (lowionisation nuclear emission-line regions) in the conventional[SII]λλ6717,6731/Hα versus [OIII]λ5007/Hβ BPT (Baldwinet al. 1981) diagnostic diagram. We showed that such regions are
not nuclear, but distributed on large (kpc) scales, hence motivatingthe relabelling of these regions as ‘LIERs’ (i.e. dropping the ‘N’,which stood for ‘nuclear’, from the historical acronym). We madeuse of different lines of evidence to argue against the AGN originof LIER emission, instead supporting the scenario where LIERsare caused by photoionisation from a diffuse ionising backgroundproduced by hot evolved stars.
More specifically we summarise the main conclusions of Pa-per I as follows:
(i) LIER emission is spatially strongly correlated with absenceof young stellar populations (as traced by stellar indices likeDN(4000) and HδA).
(ii) Post asymptotic giant branch (pAGB) stars have been shownto produce the required hard ionising spectrum necessary to exciteLIER emission (Binette et al. 1994; Stasinska et al. 2008). Stellarevolution models including the pAGB phase demonstrate that thepAGB hypothesis is energetically viable for virtually all LIERs, asthe observed EW(Hα) lie in the same range as model predictions(0.5 - 3.0 Å).
(iii) Although weak AGN may appear as true LINERs when ob-served on scales of 100 pc or less, a typical low luminosity AGNdoes not emit enough energy to be the dominant contributor to theionising flux on the kpc scales probed by the 3′′ SDSS fibre (fromthe legacy SDSS, < z >∼ 0.1) or by MaNGA (< z >∼ 0.03)
(iv) In LIER galaxies not contaminated by SF, line ratios sensi-tive to the ionisation parameter ([OIII]λ5007/[OII]λ3727 and par-tially [OIII]λ5007/Hβ ) show flat or very shallow profiles over ra-dial scales of tens of kpc, at odds with the steeper profiles predictedin the AGN scenario.
(v) The distribution of EW(Hα) in LIERs is flat as a functionof galactocentric radius and presents a remarkably small scatter, asexpected in the case of nebular lines being excited by hot evolvedstars associated with the old stellar population. On the other hand,in the AGN scenario, a large scatter is expected in the EW(Hα)distribution, as line and stellar continuum emission would originatefrom independent sources.
While previous work has associated LIER emission in red (el-liptical) galaxies with pAGB stars (Binette et al. 1994; Sarzi et al.2010; Yan & Blanton 2012; Singh et al. 2013), we note that HubbleSpace Telescope imaging of very nearby elliptical galaxies strug-gles to account for the number of UV bright (especially pAGB)stars predicted by stellar population models (Brown et al. 1998,2008; Rosenfield et al. 2012). If models have substantially overes-timated the occurrence of pAGB stars, other hot evolved stars (mostnotably extreme horizontal branch stars) may represent a more size-able contribution to the ionising photon budget leading to LIERemission. For the purposes of this paper, the exact nature of theevolved stellar sources powering the LIER emission does not affectany of the conclusions.
In this framework LIERs are direct tracers of regions domi-nated by old stellar populations where, despite the presence of gas,star formation is no longer taking place. Importantly, LIERs appearboth in red sequence galaxies, which host no current star formation,but also in the central regions of spiral galaxies, where star forma-tion actively takes place at larger galactocentric radii (as recentlyhighlighted by the contributions from the CALIFA survey, Singhet al. 2013; Gomes et al. 2016). We refer to these two classes ofgalaxies ‘extended LIER’ (eLIER) and ‘central LIER’ (cLIER) re-spectively, with the absence or presence of SF regions being the dis-criminating factor. Examples of galaxies in each class are given inFig. 1, together with maps of their line emission (Hα flux and EW),
MNRAS 000, 1–17 (2016)

4 F. Belfiore et al.
!!!!!!
!!!!!!!!!!!
star forming (SF)
central LIER (cLIER) extended LIER (eLIER)
Figure 1. Example of the different properties of SF (top three), cLIER (middle three) and eLIER (bottom three) galaxies. Each row represents a differentgalaxy (labelled with its MaNGA-ID on the left). The columns represent respectively (1) SDSS g-r-i composite image with MaNGA bundle superimposed, (2)MaNGA Hα map, (3) MaNGA EW(Hα) map, (4) MaNGA map of DN(4000), (5) MaNGA map of HδA, (6) BPT map of the MaNGA galaxies based on the[SII] BPT diagram. SF regions are colour-coded in blue, LIER in orange, Seyfert-like in red, (7) velocity field of the stars, (8) velocity field of the gas. For allmaps, the colour bar increases from blue to red and the values corresponding to the minimum and maximum of the colour-bars are annotated on the top rightcorner of each map. The average PSF for the MaNGA data is shown in the bottom right corner of the maps.
age-sensitive stellar population indices (DN(4000) and EW(HδA))and BPT classification (blue corresponding to SF, orange to LIERand red to Sy-like regions).
In this work we make use of 583 galaxies selected from thesample described in Paper I. In particular, we exclude Seyfertgalaxies, mergers and galaxies with an ambiguous classificationand classify all the remaining galaxies as described in Paper I, i.e.:
(i) Line-less galaxies: No detected line emission (averageEW(Hα) <1.0 Å within 1 Re).
(ii) Extended LIER galaxies (eLIER): galaxies dominated byLIER emission at all radii where emission lines are detected. Noevidence for any star forming regions.
(iii) Central LIER galaxies (cLIER): galaxies where LIER emis-sion is resolved and located in the central regions, while ionisationfrom star formation dominates at larger galactocentric distances.
MNRAS 000, 1–17 (2016)

The transition from star formation to quiescence 5
(iv) Star forming galaxies (SF): galaxies dominated by star for-mation in the central regions and at all radii within the galaxy disc.
As discussed in Paper I, other ‘ionisation morphologies’ are ex-tremely rare. For example, we find no galaxy with a line-less bulgeand a star forming disc. The 583 galaxies used in this paper subdi-vide in the classes above as follows: 314 SF, 57 cLIER, 61 eLIERand 151 line-less.
3.2 From nebular lines to stellar indices: tracing starformation and quiescence
The realisation that LIER emission is not related to nuclear activity,but simply a consequence of presence of a diffuse UV backgrounddue to evolved stellar populations, leads us to reconsider the con-ventional definition of quiescence as absence of nebular line emis-sion. Namely, both LIER and line-less regions (EW(Hα) < 1 Å)can ben defined as ‘quiescent’ (or ‘passive’), to highlight the factthat they do not host current star formation as traced by the domi-nant component of line emission.
An alternative definition of quiescence may rely on probes ofstar formation on longer time-scales, such as the so-called 4000-Åbreak (DN(4000), Balogh et al. 1999) that is a sensitive tracer of theage of the stellar population. More specifically, while DN(4000)is also sensitive to metallicity effects (for stellar population olderthan 1 Gyr), the combination of DN(4000) and the stellar indexEW(HδA) is less sensitive to the effect of metallicity and has beenused in the literature as a probe for the galaxy’s star formation his-tory (e.g. Kauffmann et al. 2003b,a; Li et al. 2015). In Paper Iwe have demonstrated that a selection on DN(4000) or EW(Hα)is generally equivalent to our emission-line base classification, asLIERs are characterised by the absence of young stars.
In Fig. 2(a) we plot the MaNGA spaxels divided by galaxyclass (SF, cLIER, eLIER and line-less) in the DN(4000) versusEW(HδA) plane. Model tracks, based on Maraston & Stromback(2011) stellar population models, are shown for a burst of star for-mation (with solar metallicity, solid black line in all panels) andthree models with continuous, exponentially declining star forma-tion (where the SFR decline time-scale, τ , is varied in the range0.1-10 Gyr). Except for the increase in EW(HδA) observed in theburst model at young ages (< 1 Gyr), stellar population age in-creases going from top-left to bottom-right. The black dotted mod-els in the eLIER and line-less panels correspond to a burst of twicesolar metallicity, and confirm that metallicity does not substantiallyaffect the position in the DN(4000) versus EW(HδA). In all panels,the burst model defines an envelope in DN(4000)-EW(HδA), withcontinuous SFR models occupying regions at lower DN(4000) fora fixed EW(HδA) value.
Continuous star formation models are an excellent representa-tion of the data for SF galaxies, with the model with τ=10 Gyr pass-ing through the locus of the data. The data for cLIERs is bimodalin the DN(4000) versus EW(HδA) plane, spanning the full range ofstellar ages. The peak at DN(4000)∼ 1.4 is well-fitted by continu-ous SFR models with a decline time-scale of several Gyr. However,the second peak (DN(4000) ∼ 1.7) and the high-DN(4000) tail ofthe distribution is harder to fit with the available models becauseit lies above the burst model track. Dust can have an effect on thecomputed indices, especially DN(4000), and contribute to resolv-ing the observed discrepancy.
The stellar populations of eLIERs and line-less galaxies areindistinguishable in the DN(4000)-EW(HδA) plane and are well-fitted by the burst model at old (> 10 Gyr) ages. While the lo-
cus of the data does not require significantly α-enhanced stellarpopulations, α-enhancement can successfully explain the observedspread to higher EW(HδA) at fixed DN(4000) (dashed model trackin eLIER panel, Thomas et al. 2004, 2011).
In Fig. 2(b), we show the same plot, but colour-coded by thefraction of spaxels classified as LIER across the DN(4000) versusEW(HδA) plane. The results demonstrate the strong correspon-dence between LIERs and old stellar populations, with cLIERsshowing a transition from LIER-dominated central regions to SF-dominated outskirts.
The tight relation between line emission and stellar popula-tions leads us to further investigate the emission-line based galaxyclassification in the context of the broader physical properties ofgalaxies. In this work we wish to address the question of howemission-line-based galaxy categories (SF, cLIER, cLIER and line-less) fit within the overall galaxy bimodality in terms of their fun-damental properties (colours/morphology/kinematics). For exam-ple, can we interpret the SF, cLIER, eLIER and line-less galaxiessequence of increasing ‘quiescence’ as an evolutionary sequence?Where does the gas in eLIER galaxies come from and what makesthese galaxies different from line-less galaxies? Here, we attemptto answer these questions by taking advantage of both the MaNGAdata and legacy SDSS photometry and spectroscopy.
4 LIER GALAXIES WITHIN THE BIMODAL GALAXYPOPULATION
4.1 Integrated colours and star formation rates
The physical origin of the colour bimodality in the galaxy popula-tion lies in the idea of using galaxy colour as ‘clocks’. Both UVand blue colours evolve quickly once O and B stars disappear fromthe galaxy spectrum. In particular, NUV emission declines moreslowly than Hα (∼ 106−107 yr), but faster than blue optical con-tinuum (∼ 109 yr), making UV-optical colours a sensitive probe tothe fading of young stellar populations.
Fig. 3 shows the NUV − r versus Mi (i-band absolute magni-tude) diagram for the current MaNGA sample, with galaxies sub-divided according to the emission-line-based classification schemeintroduced in this work. We observe that SF galaxies constitutethe vast majority of the blue cloud (NUV − r < 4), while line-less and eLIER galaxies are concentrated on the red sequence(NUV − r > 5). The most striking feature of Fig. 3 is that a largefraction of cLIER galaxies (∼40 %) are found in the green valley(4 < NUV − r < 5), with the remaining ones also lying at interme-diate UV-optical colours (the mean NUV−r for cLIERs is 4. 1 witha standard deviation of 1.0 mag). The prevalence of cLIER galaxiesin the green valley is not surprising, since the integrated coloursare affected by both the light from the red, old, LIER-like centralregions and light from the blue, star forming disc, thus generat-ing the observed intermediate integrated colours. The separationof cLIER galaxies from the blue cloud is less evident when usingoptical colours (for example u− r or g− r instead of NUV − r). In-deed, using g− i colours, cLIER galaxies are consistent with lyingon the red sequence, and have equivalent colour to eLIERs and line-less galaxies. Further details on the UV-optical colours of differentgalaxy classes are summarised in Table 1.
Fig. 4 presents an even more striking illustration of the transi-tion nature of cLIER galaxies, by representing the MaNGA galax-ies in the SFR-M? plane. The SFR is calculated from the extinction-corrected Hα flux within the MaNGA bundle and using the Ken-nicutt (1998) conversion factor. The procedure used to correct the
MNRAS 000, 1–17 (2016)

6 F. Belfiore et al.
Figure 2. a) Density plot in the DN(4000) versus EW(HδA) plane for spaxels in the different galaxy classes (SF, cLIER, eLIER and line-less) defined in thiswork. Different burst and continuous SFR models based on Maraston & Stromback (2011) stellar population models are overplotted (details in the legend). b)Same as a) but with the colour-coding reflecting the fraction of spaxels classified as LIER in each region of the DN(4000) versus EW(HδA) plane.
SFR for LIER emission is based on the assumption that the to-tal Hα flux can be decomposed into a contribution from star for-mation (with line ratios typical of star forming regions) and fromLIERs/diffuse ionised gas (with line ratios typical of LIERs). Thedetails of the correction procedure are presented in Appendix A.This procedure generates SFR estimates that are on average indis-tinguishable from the SFR computed using only the spaxels classi-fied as star forming using the [SII] BPT diagram. For LIER regions,only a small fraction of the Hα flux can be attributed to underly-ing star formation, and we thus consider the SFR for eLIER andline-less galaxies as upper limits. We do not apply any aperturecorrection to the MaNGA-derived SFR. Errors on the SFR are es-timated by propagating the uncertainties in the flux and extinctioncorrection.
Fig. 4 demonstrates that SF galaxies lie on the ‘main se-quence’ (Brinchmann et al. 2004; Salim et al. 2007; Peng et al.2010; Renzini & Peng 2015) while the cLIER galaxies lie sys-tematically below it, although above the passive galaxy population,consisting of eLIERs and line-less galaxies. For reference we plotthe ‘main sequence’ at z ∼ 0 from Renzini & Peng (2015) (black
solid line in Fig. 4), obtained from legacy SDSS spectroscopy, andthe best-fitting line to the SF galaxy population using the currentMaNGA sample (with 9 < log(M?/M) < 11.5, magenta line inFig. 4), given by
log(
SFRMyr−1
)=−7.5 ±0.2+(0.73 ±0.02) log
(M?
M
)(1)
Considering the differences in sample selection and methodologyfor calculating stellar mass and SFR, results from legacy SDSS arein excellent agreement with the MaNGA result presented here. At afixed stellar mass, cLIER galaxies lie on average 0.8 dex below themain sequence defined by the SF population, although they actuallyspread across the entire green valley with large scatter.
Summarising, the key results from this section are the follow-ing: (1) eLIER and quiescent line-less galaxies are indistinguish-able in terms of colours; (2) most green valley galaxies are not suchbecause of dust reddening or globally intermediate stellar popula-tions, but are associated with galaxies (cLIERs) in which quiescent(non-SF) central regions co-exist with outer star formation. Thesegalaxies lie in the transition region between the star formation mainsequence and quiescent galaxies.
MNRAS 000, 1–17 (2016)

The transition from star formation to quiescence 7
Figure 3. MaNGA galaxies in the NUV − r versus Mi (colour-magnitude) diagram. Galaxies are divided according the emission line-based classificationintroduced in Paper I (see also Section 2 of this work). Contours represent galaxy density in the MaNGA parent sample, while dashed lines provide a simpledivision between the red sequence (NUV − r > 5), green valley (4 < NUV − r < 5) and blue cloud (NUV − r < 4). The green valley is preferentially occupiedby cLIER galaxies, while eLIER and line-less galaxies are mostly found on the red sequence (NUV − r > 5).
Table 1. Classification statistics of emission line galaxies in the NUV − r colour-magnitude diagram and mean (± standard deviation) for selected UV andoptical colours. Appropriate volume weights have been applied to correct for the MaNGA selection function.
Galaxy class Blue cloud Green Valley Red sequence NUV − r u− r g− rNUV − r < 4 4 < NUV − r < 5 NUV − r > 5 µ±σ µ±σ µ±σ
SF 92% 7% 1% 2.8 ± 0.8 1.6 ± 0.4 0.55 ± 0.16cLIER 48% 39% 13% 4.1 ± 1.0 2.2± 0.3 0.74 ± 0.10eLIER 0 19% 81% 5.4 ± 0.6 2.5 ± 0.2 0.78 ± 0.09
line-less 1% 14% 85% 5.5 ± 0.7 2.4 ± 0.2 0.76 ± 0.09
4.2 Morphological type
The traditional morphological dichotomy between early type(ETG, E and S0) and late type galaxies (LTG, spirals), as im-plemented in the revised Hubble classification (Sandage 1961), isbased on the presence or absence respectively of spirals arms and/ordust lanes when galaxies are seen edge on. Subsequent revisions tothis classification, including recent advanced made possible by IFSobservations, have conclusively demonstrated that a large fractionof ETG contain discs seen at a variety of inclinations (dubbed as‘fast rotators’ by the ATLAS3D project). Only the most massiveend of the ETG population is populated by true dispersion dom-inated systems (‘slow rotators’), with very little ordered angularmomentum (Emsellem et al. 2007, 2011; Cappellari et al. 2011a).Extensions to higher redshift (Bundy et al. 2010) seem to confirmthis general picture.
Visual morphological classifications from the Galaxy Zoo 2project (Lintott et al. 2008; Willett et al. 2013), based on legacySDSS imaging, were used to subdivide MaNGA galaxies into ETG
and LTG. In particular, we make use of the detailed classificationfrom Galaxy Zoo 2, which asked its volunteer citizen scientists toidentify several morphological features (spirals, bars etc) in SDSSthree-colour image cutouts. Individual classifications are processedas detailed in Willett et al. (2013) and statistically ‘de-biased’ totake into account the fact that is it harder to identify fine mor-phological features for smaller, fainter galaxies. The nature of theGalaxy Zoo vote fractions means that they can be interpreted asconditional probabilities, although one needs to take into accountthat not all parameters are estimated for all galaxies, given the deci-sion tree nature of the Galaxy Zoo 2 classifications. Vote fractionsfor certain questions (hence features) are only computed if previ-ous questions in the decision tree are ‘well-answered’ (as detailedin Willett et al. 2013, section 3.3 and table 3).
In Fig. 5 we plot the median trends in bins of stellar mass for
MNRAS 000, 1–17 (2016)

8 F. Belfiore et al.
Figure 4. The SFR-M? plane for MaNGA galaxies. The SFR from the extinction-corrected Hα flux by summing the flux in spaxels classified as SF. The blackline represent the ‘main sequence’ for SF galaxies from legacy SDSS spectroscopy (Renzini & Peng 2015). The magenta line represents the best fitting ‘mainsequence’ using the SF galaxies in the MaNGA sample.
the de-biased probability of the presence of disc or other feature2 inour MaNGA galaxy sample, classified according to the emission-line based classification. In order to study trends as a function ofstellar mass we correct for the effect of the MaNGA selection func-tion. The error bars represent the error on the mean in each massbin. The results from the Galaxy Zoo 2 classifications demonstratethat eLIER and line-less galaxies have mutually consistent mor-phologies and are visually classified as ETGs. SF and cLIER galax-ies, on the other hand, also have mutually consistent disc fractionsand are consistent with being LTGs. Although outliers are presentin either direction (SF galaxies with no disc features or line-lessgalaxies classified as discs), these do not dominate the sample av-eraged trends.
Interestingly, previous work based on Galaxy Zoo has high-lighted the fact that when galaxies are classified into a red sequenceand blue cloud using optical colours, the red sequence host a sub-stantial fraction of red (‘anemic’) spirals (Bamford et al. 2009;Masters et al. 2010). cLIER galaxies, because of their substantiallyredder optical colours than the mean of the blue cloud (see Table1) and their disc-like morphology, may appear as ‘red spirals’ inintegrated colours. This class of galaxies represents a natural linkbetween normal spirals and lenticular (S0) galaxies, as suggestedin the revised ‘trident’ morphological classification van den Bergh(1976) and further updated by Cappellari et al. (2011a).
Further support towards a relation between the anemic spi-
2 Task 1 in Galaxy Zoo 2, addressing the question: Is the galaxy simplysmooth and rounded, with no sign of a disc?
ral class and cLIERs is given by the fact that anemic spirals insingle-fibre spectroscopy (Masters et al. 2010) are often classifiedas LIERs, have lower EW(Hα) than SF galaxies, present oldermean stellar ages (Tojeiro et al. 2013) and are found to be an in-significant fraction of the total spiral population for M? < 1010 M(Wolf et al. 2009) while representing as much as 40% of the spiralpopulation at the highest masses (M? > 1010.8 M, Masters et al.2010).
4.3 The importance of the bulge
Morphological features such as spiral arms and bars only captureone aspect of the complex problem of morphological classifica-tion of galaxies. Another characteristic generally associated withthe study of galaxy morphology is the presence and importanceof a central spheroidal component (the bulge). Unfortunately, al-though parametric bulge-disc decomposition is a well-establishedtechnique, studies based on photometry alone are limited by thewell-known intrinsic degeneracies in the method (Rybicki 1987;Gerhard & Binney 1996). Although potentially even more biased,‘cheaper’ proxies such as the ‘concentration’ index (here definedas C = R90/R50 where R are Petrosian radii) or a galaxy-averagedSérsic index have often been used on large photometric samples toprovide an observationally more well-defined estimate of the im-portance of the bulge/spheroidal component. As a complement tothese photometric indicators we also study the central stellar veloc-ity dispersion extracted from the MaNGA data, which is a directproxy for the depth of the bulge gravitational potential.
MNRAS 000, 1–17 (2016)

The transition from star formation to quiescence 9
Figure 5. a) Average disc vote fraction from Galaxy Zoo 2 (Willett et al. 2013) in bins of stellar mass for MaNGA galaxies of different classes. The votefraction can be interpreted as a probability and has been statistically de-biased to account for the increasing difficulty of detecting fainter morphologicalfeatures at higher redshift following Willett et al. (2013). b), c) Average Sérsic index and concentration (defined as R90/R50, where R are Petrosian radii) inbins of stellar mass. Sérsic parameters and Petrosian radii are obtained from the NSA (Blanton et al. 2011) and are based on legacy SDSS r-band imaging. d)Average stellar velocity dispersion within 0.5 Re in bins of stellar mass. Velocity dispersions are calculated from the MaNGA data and Re is the Sérsic r-bandeffective radius from the NSA catalogue.
In this context, it is important to note that, if the bulge isdefined kinematically, the classical lenticular (S0) morphologicalclass is found to span a wide range in bulge fraction, forming asequence essentially parallel to the classical increase in bulge frac-tion from Sc to Sa for LTGs (Cappellari et al. 2011b; Krajnovicet al. 2013; Cappellari 2016). Indeed, it is arguable whether the tra-ditional S0 morphological classification is in itself meaningful, asIFS surveys have demonstrated that the photometry alone is a verypoor predictor of the degree of rotational support for ETG, with S0likely to be classified as classical dispersion dominated ellipticalswhen viewed at low inclinations (e.g Emsellem et al. 2011).
In Fig, 5b), c), d) we show the average Sérsic index, concen-tration and stellar velocity dispersion within 0.5 Re (< σ? >) asa function of galaxy class in bins of stellar mass. In each bin, anaverage value is plotted only if there are more than four galaxiesin the bin. As expected from their early type morphology, bothline-less and eLIER galaxies show higher Sérsic indices, concen-trations and < σ? > than cLIER and SF galaxies in all stellarmass bins. cLIERs have Sérsic indices, concentrations and < σ? >intermediate between eLIER/line-less and SF galaxies, consistent
with the idea of being the subset of disc-dominated galaxies withlargest bulge component at each stellar mass. For purely SF galax-ies Sérsic index, concentration and < σ? > all increase as a func-tion of mass, matching those of cLIER galaxies in the mass bin11.0 < log(M?/M) < 11.5. Note that when using the central ve-locity dispersion as a tracer of the bulge potential we recover thesame overall trends as for pure photometric tracers like Sérsic in-dex and concentration, thus confirming that our results are not dom-inated by the uncertainty in the photometry.
5 KINEMATIC MISALIGNMENT
Kinematic decoupling between the gaseous and stellar componentshas been observed to be common in local ETGs (Bertola et al. 1999;Sarzi et al. 2006; Davis et al. 2011), with hints of this behaviourbeing already present at high redshift (Wisnioski et al. 2015). Thedistribution of misalignments between the gas and stars is a directprobe of the origin of the gas in ETG. Theoretically, a newly formedgas disc is predicted to precess due to the effect of the gravitational
MNRAS 000, 1–17 (2016)

10 F. Belfiore et al.
potential of the stars, with gas precessing faster at smaller radii,where the torque is larger. Cloud-cloud collisions will also workto realign the differently precessing gas rings, and the system willeventually settle into a configuration where the gas and stellar com-ponents are either aligned or misaligned by 180. The relaxationtime for this process was initially predicted to be of the order of thedynamical time (Tohline & Durisen 1982; Lake & Norman 1983),however recent work based on hydrodynamics in the cosmologi-cal framework has highlighted that misalignments might persist onmuch longer (several Gyr) time-scales (van de Voort et al. 2015),mostly because of the effect of continuous cosmological accretion.This longer relaxation time-scale also provides a better fit to themisalignment distributions observed in the literature (Davis & Bu-reau 2016). For weakly triaxial systems stable gaseous orbits areallowed both in the plane containing the long and intermediate axesand the plane of the short and intermediate axis (Franx et al. 1991).If the origin of the gas is external, therefore, the distribution of thegas-stars kinematic misalignment should display three peaks, re-spectively at 0,90,180, with the peak around 90 being weakerand scaling with the degree of triaxiality.
In this section we derive the kinematic position angle (PA)of both gas and stars following the procedure in Krajnovic et al.(2006). In short, having fixed the kinematical centre to the photo-metric one, the algorithm constructs a bi-antisymmetric version ofthe velocity field and compares it with the observed velocity field.The resulting PA is thus only representative of the axis of symme-try of the velocity field and the measurement does not imply thatthe galaxy is best fitted with a thin disc model. In our sample fourgalaxies present particularly complex gaseous kinematics with noobvious symmetry axis and have been excluded from the followinganalysis. Two of these galaxies show approaching/trailing featureswhile other two show evidence for extreme changes in the directionof rotation of the gas (MaNGA-ID 1-38167, 1-274663).
The remaining eLIER galaxies in our sample display a widerange of gas velocity field patterns. While some galaxies are con-sistent with a gaseous disc rotation, in other systems the velocityfield appears disturbed. Overall, the large majority of galaxies inthis class show coherent velocity shear patterns, showing both redand blue-shifted emission. However, these gas flows are not alwaysassociated with large-scale rotation. For example, in Cheung et al.(2016) we propose a biconical outflow model for an eLIER galaxy(MaNGA-ID 1-217022) that has recently been subject to a minormerger event (as demonstrated by the presence of a nearby compan-ion and the detection of neutral gas via the NaD absorption feature).
The observed distribution of stars-gas misalignment for theeLIER galaxies in our sample is shown in Fig. 6, with 30 out of 49galaxies having misalignments larger than 30. Making the appro-priate volume corrections, necessary in order to take into accountthe MaNGA selection function, we infer that 65± 7% of eLIERsare misaligned with |φstars − φgas| > 30. This number is signifi-cantly larger from that inferred by the SAURON and ATLAS3D
surveys (Sarzi et al. 2006; Davis et al. 2011). However, both sur-veys adopt a pure morphological selection, thus including galaxieswith residual star formation into their sample, which would not beclassified as eLIERs. Galaxies with detectable star formation (SFand cLIERs) have a misalignment distribution strongly peaked atzero (Fig. 6, bottom panel, only 11±2% with |φstars−φgas|> 30),thus a small contamination from SF or cLIER galaxies can bringour result in line with previous work. Moreover our results con-firm the theoretical prediction for the case of external accretion, asthe observed distribution of misalignments for eLIERs is peaked at0,90 and 180.
Figure 6. Histograms of the distribution of kinematic misalignments be-tween the position angle of the major axis of the stellar component and ofthe ionised gas for the eLIER galaxies (top) and SF and cLIER galaxies(bottom) in the current MaNGA sample.
In absence of internal processes (i.e. stellar mass-loss), themisalignment histogram is predicted to be symmetric around 90
(Davis & Bureau 2016). Making the assumption of isotropicaccretion and long relaxation times, one would naively expect150/180∼83% of galaxies to have misalignments larger than 30.The presence of a stronger peak at zero and the fact that the numberof misaligned galaxies is lower than a naive estimate for isotropicaccretion implies that internal processes are also likely to play arole, although secondary, in shaping the observed misalignmentdistribution. In particular, stellar mass-loss will not only inject intothe ISM some amount of gas sharing the same kinematic propertiesas the parent stars, but would also create additional torque on theaccreted misaligned gas and contribute to realign it with the stel-lar kinematic field. Both effects would contribute to increase thefraction of aligned galaxies.
6 THE EFFECT OF ENVIRONMENT
Fundamental properties of the bimodal galaxy population, includ-ing colour, SFR and passive fraction are found to depend both onstellar mass and environment (Blanton et al. 2005a; Baldry et al.2006; Peng et al. 2010). Using data from legacy SDSS, it has beendemonstrated that the change in EW(Hα) distribution as a func-tion of environment is predominantly due to a change in the rel-ative number of SF and passive galaxies (Balogh et al. 2004). Ifone restricts the study to SF galaxies, the EW(Hα) (or equivalently
MNRAS 000, 1–17 (2016)
The transition from star formation to quiescence 11
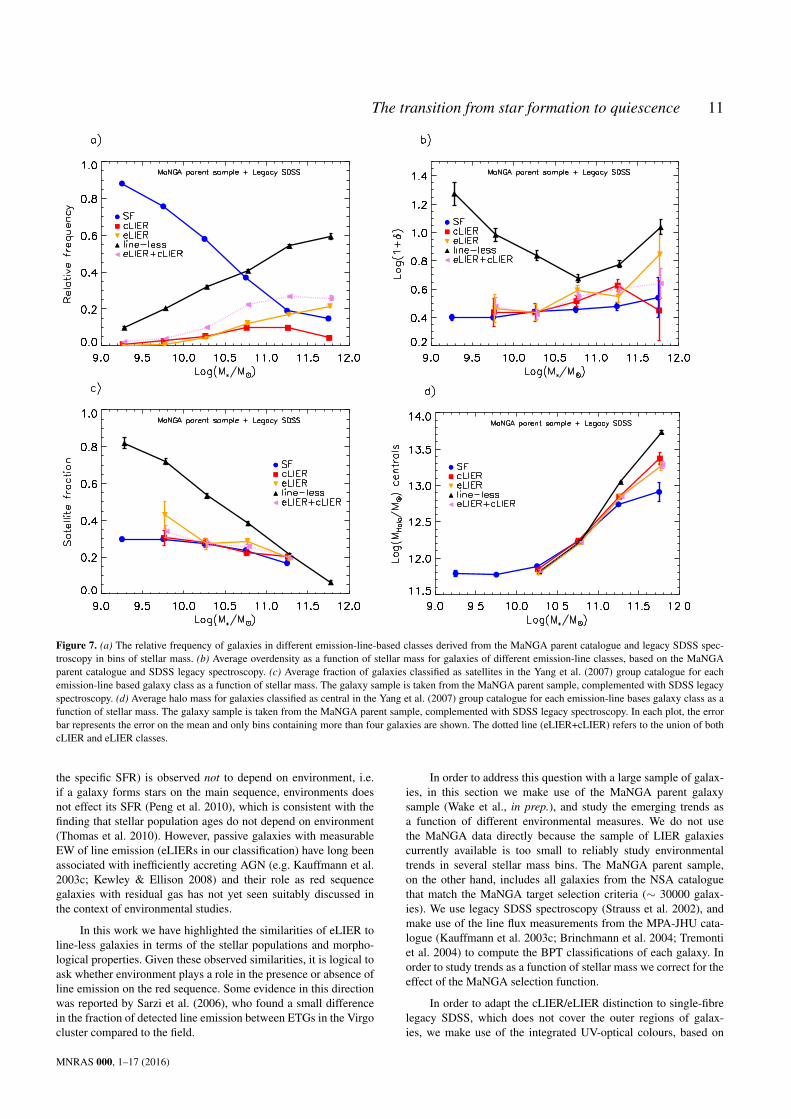
Figure 7. (a) The relative frequency of galaxies in different emission-line-based classes derived from the MaNGA parent catalogue and legacy SDSS spec-troscopy in bins of stellar mass. (b) Average overdensity as a function of stellar mass for galaxies of different emission-line classes, based on the MaNGAparent catalogue and SDSS legacy spectroscopy. (c) Average fraction of galaxies classified as satellites in the Yang et al. (2007) group catalogue for eachemission-line based galaxy class as a function of stellar mass. The galaxy sample is taken from the MaNGA parent sample, complemented with SDSS legacyspectroscopy. (d) Average halo mass for galaxies classified as central in the Yang et al. (2007) group catalogue for each emission-line bases galaxy class as afunction of stellar mass. The galaxy sample is taken from the MaNGA parent sample, complemented with SDSS legacy spectroscopy. In each plot, the errorbar represents the error on the mean and only bins containing more than four galaxies are shown. The dotted line (eLIER+cLIER) refers to the union of bothcLIER and eLIER classes.
the specific SFR) is observed not to depend on environment, i.e.if a galaxy forms stars on the main sequence, environments doesnot effect its SFR (Peng et al. 2010), which is consistent with thefinding that stellar population ages do not depend on environment(Thomas et al. 2010). However, passive galaxies with measurableEW of line emission (eLIERs in our classification) have long beenassociated with inefficiently accreting AGN (e.g. Kauffmann et al.2003c; Kewley & Ellison 2008) and their role as red sequencegalaxies with residual gas has not yet seen suitably discussed inthe context of environmental studies.
In this work we have highlighted the similarities of eLIER toline-less galaxies in terms of the stellar populations and morpho-logical properties. Given these observed similarities, it is logical toask whether environment plays a role in the presence or absence ofline emission on the red sequence. Some evidence in this directionwas reported by Sarzi et al. (2006), who found a small differencein the fraction of detected line emission between ETGs in the Virgocluster compared to the field.
In order to address this question with a large sample of galax-ies, in this section we make use of the MaNGA parent galaxysample (Wake et al., in prep.), and study the emerging trends asa function of different environmental measures. We do not usethe MaNGA data directly because the sample of LIER galaxiescurrently available is too small to reliably study environmentaltrends in several stellar mass bins. The MaNGA parent sample,on the other hand, includes all galaxies from the NSA cataloguethat match the MaNGA target selection criteria (∼ 30000 galax-ies). We use legacy SDSS spectroscopy (Strauss et al. 2002), andmake use of the line flux measurements from the MPA-JHU cata-logue (Kauffmann et al. 2003c; Brinchmann et al. 2004; Tremontiet al. 2004) to compute the BPT classifications of each galaxy. Inorder to study trends as a function of stellar mass we correct for theeffect of the MaNGA selection function.
In order to adapt the cLIER/eLIER distinction to single-fibrelegacy SDSS, which does not cover the outer regions of galax-ies, we make use of the integrated UV-optical colours, based on
MNRAS 000, 1–17 (2016)
12 F. Belfiore et al.
the findings in section 4.1 above. We assume that both cLIERsand eLIERs would appear as LIER galaxies in single fibre spec-troscopy. A galaxy appearing as LIER in single-fibre spectroscopyis classified as cLIER if it lies on the blue cloud or the greenvalley (NUV − r < 5) and eLIER if it lies on the red sequence(NUV − r > 5) using UV-optical colours. We make use of theMaNGA parent sample instead of the full legacy SDSS in an at-tempt to minimise the role of aperture effects in this classification,an effect that is otherwise difficult to quantify. According to sec-tion 4.1, our mixed spectroscopic + photometric eLIER/cLIER dis-tinction introduces a 19% contamination for eLIERs and 13% con-tamination for cLIERs. Similarly, in the attempt to replicate in thebest possible way the MaNGA-based classification, galaxies withEW(Hα) < 1.0 Å within the 3′′ SDSS fibre are considered line-less. Seyfert AGN, as identified using the [SII] BPT diagram, areexcluded from this analysis.
In Fig. 7a) we show the fraction of galaxies in each class asa function of mass in the MaNGA parent sample. This figure is tobe compared with the equivalent figure in Paper I (Fig. 6) for theMaNGA sample which is also used in this work. Qualitatively themass trends for each class are similar, however some differences arealso present. In particular, the classification based on legacy SDSSfinds less LIER galaxies than in the MaNGA data, which might bedue to residual aperture effects.
In order to study environmental effect, we make use of adap-tive aperture environmental measure presented in Etherington &Thomas (2015). The cosmic density ρ field is calculated using acylinder centred on each galaxy and with length of 1000 km s−1
and radius given by the distance to the fifth nearest neighbour moreluminous than Mr < −20.26 (where Mr is the k-corrected r-bandmagnitude). The environment estimator is cast in terms of an over-density (δ = (ρ−ρm)/ρm) relative to the average density of tracergalaxies ρm and is most sensitive to scales around 2 Mpc (Ether-ington & Thomas 2015).
We further make use of the environmental information pro-vided by the Yang et al. (2005, 2007) group catalogue. The cat-alogue is based on a halo-finding algorithm applied to the NYU-Value Added Catalogue (Blanton et al. 2005a), based on legacySDSS DR7 data. Galaxies belonging to the same dark matter haloare defined to constitute a ‘group’ (where the term group is usedhere irrespective of the number of galaxies in the association). Themost luminous galaxy in each group is defined to be the ‘central’,while the other galaxies in each group are defined to be ‘satellites’.Note that, following this definition, centrals do not need to neces-sarily lie at the geometric centre of the dark matter halo. Severalgalaxies are assigned to haloes that contain no other galaxy withinthem; these galaxies are called centrals even though no satellitesare detected in SDSS (although deeper observations might revealtheir presence). The halo mass (Mhalo) is calculated for each groupby Yang et al. (2007) considering the characteristic integrated lu-minosity (above some flux limit, and corrected for incompleteness)of the group members calibrated against the dark matter massesderived from models.
In Fig. 7b) we show the mean environmental density as a func-tion of stellar mass for each galaxy class (SF, cLIER, eLIER andline-less). The plot demonstrates that (1) At fixed stellar mass, line-less galaxies always live in denser environments than eLIER galax-ies. The relative difference in environmental density between thetwo galaxy classes is large at both the lowest and highest stellarmasses, with a minimum difference at M? ∼ 1010.5 M. (2) Thereis only a marginal difference in environmental density between SF
galaxies and cLIER or eLIERs, with eLIERs living in marginallydenser environments.
For the purpose of the study of line emission in the overallgalaxy population, the most striking feature of of Fig. 7b) is thelarge difference in environmental density between eLIERs (i.e. redsequence galaxies with line emission) and line-less galaxies (i.e.red sequence galaxies with EW(Hα) < 1.0 Å). The legacy SDSSdata demonstrate clearly that the lack of line emission on the redsequence is associated with higher environmental densities. We dis-cuss the possible physical processes that could be responsible forthis phenomenon in section 7.2.
Fig. 7c) demonstrates that line-less galaxies have a substan-tially higher satellite fraction than any other galaxies class at allstellar masses lower than M?∼ 1011 M. Hence, the increase in theenvironmental density of line-less galaxies at low stellar masses ismostly driven by the fact that these galaxies are preferentially satel-lites.
At high stellar masses, on the other hand, line-less centralgalaxies have a higher mean halo mass than other galaxy classes(Fig. 7d). Higher mass haloes tend to have a higher number ofsatellites and also to be more strongly clustered, thus explainingthe increase in environmental density at the high-mass end. Thefigure also shows that in the highest mass bin, SF galaxies reside inlower-mass haloes than LIER galaxies (both eLIERs and cLIERs).
7 DISCUSSION: AN EVOLUTIONARY SCENARIO FORLIERS
7.1 Inside-out quenching and the nature of cLIER galaxies
7.1.1 A slow quenching pathway for late-type galaxies
The properties of cLIERs are such that they can be considered ob-jects in transition (in the process of being ‘quenched’) from the SFblue cloud towards the quiescent red sequence. The MaNGA spa-tially resolved data further demonstrate that star formation in thesegalaxies terminates from the inside out, with LIER emission ap-pearing in the central regions, while star formation continues in thedisc. The quenching process is not only evident via the lack of de-tected star formation in diagnostic diagrams, but also in the stellarpopulation properties, as LIER emission is strongly correlated withold stellar populations (section 3.2, also Paper I, section 7).
The process leading to the quenching of the central regions islikely to be gentle, since it does not involve a change in the over-all morphology and kinematics of the galaxy, although it is asso-ciated with the presence of a large central spheroidal component.cLIER galaxies are thus consistent with the idea of a ‘slow quench-ing mode’ for LTGs (e.g. Schawinski et al. 2014; Smethurst et al.2015). Different lines of evidence point towards the need of a sucha ‘slow quenching’ pathway for LTGs associated with the increas-ing importance of the bulge component. Cappellari et al. (2013),for example, argue that the quenching process involved in the pro-duction of fast rotator ETGs needs to increase the bulge size, whileat the same time removing the gas reservoir and/or shutting downstar formation and maintaining the flatness of the disc at large radii.At higher redshift Bell et al. (2012) and Bundy et al. (2010) arguefor a similar slow quenching pathway initiated by gradual changesin internal structure.
A possible quenching mechanism, much discussed in the lit-erature (e.g. Wake et al. 2012; Bluck et al. 2014), assumes thehigher central spheroidal masses to be directly connected to thecause of galaxy starvation via AGN radio-mode feedback. Indeed,
MNRAS 000, 1–17 (2016)

The transition from star formation to quiescence 13
larger bulge/spheroid masses imply larger black hole masses, hencehigher capability of halo heating through radio-mode episodes(Heckman & Best 2014), which in turn may result into lack of gascooling on to the host galaxy. While the inclusion of AGN radio-mode feedback in galaxy formation models has proven to be ableto successfully solve a number of longstanding problems, directevidence for this feedback mode in galaxies with M? ∼ 1010 Mremains lacking. It may be natural to assume that this feedbackmode, generally predicted to be important in much more massivehaloes (clusters, e.g. Fabian 2012) would equally affect lower masshaloes. However, other alternatives sharing the same scaling rela-tion cannot be ruled out.
The interruption of the inflow of cold gas on to the galaxy(‘strangulation’), due to either heating of the gas in the halo or viahalo mass shock heating, can lead to an inside-out quenching sig-nature, assuming that the remaining cold gas is consumed morequickly in the central regions of galaxies. As illustrated by Leroyet al. (2008) the efficiency of star formation (i.e. the number of starsformed per unit gas mass) is not constant across galaxy discs, butis observed to steadily decrease with galactocentric distance, thusmaking this scenario a viable option.
7.1.2 Secular processes and bulge growth
While a gas exhaustion scenario naturally produces slow, inside-out quenching, the simple strangulation scenario does not directlyaddress the larger bulge components observed in cLIER galaxiescompared to SF galaxies of the same stellar mass (unless one makesthe additional assumption that bulge mass is driving the heating ofthe halo via radio-mode feedback).
Alternatively, the larger bulge masses, together with the im-plied slow time-scale for the quenching process, may argue infavour of secular processes (i.e. mechanisms internal to the galax-ies) playing a role in the quenching process in cLIERs. Bars, for ex-ample, tend to funnel gas towards the galactic central regions, thuscontributing to the formation of (pseudo)bulges (Kormendy et al.2010; Simmons et al. 2013; Cheung et al. 2013). Moreover, simu-lations show that the torques and stresses created by both bars andbulges on the cold gas component can lead to lower star formationefficiency, especially in the regions swept up by the bar (Emsellemet al. 2014; Fanali et al. 2015). Indeed, bar fraction is known tocorrelate with the galaxy’s stellar mass, colour and specific SFR(Nair & Abraham 2010; Masters et al. 2011), in the sense of red-der and more massive, lower specific SFR discs having higher barfraction. Moreover, bar fraction is observed to be higher in HI poorgalaxies (Masters et al. 2012), although no similar investigation ofthe molecular gas content of a large sample of barred and unbarredgalaxies has been possible to date (see Saintonge et al. 2012 for thelargest sample to date).
Using the current MaNGA sample, for galaxies withlog(M?/M) > 10 the bar fraction (defined as disc galaxies withpbar > 0.3 from Galaxy Zoo 2) is 32± 5% for the SF discs, and41± 11% for the cLIERs. We thus conclude that the difference inbar fraction between the two classes is not significant with the cur-rent sample size, and a larger sample is needed to observationallytest the relative occurrence of bars in SF galaxies are cLIERs.
Models predict that disc instabilities represent the dominantcontribution to the formation of bulges in massive galaxies (M? >1010 M, De Lucia et al. 2011). Disc stability can be parametrisedin terms of the stability parameter (Q, Toomre 1964), which inthe case of gas+stars systems can be extended to include the twocomponents (Jog & Solomon 1984; Elmegreen 1995; Martig et al.
2009; Romeo & Wiegert 2011). The presence of a significantbulge goes towards increasing the stability of a cold gas disc togravitational collapse. Indeed, results from the COLD-GASS sur-vey (Saintonge et al. 2011) demonstrate that galaxies with signifi-cant bulges have lower star formation efficiencies (Saintonge et al.2012). Spatially resolved observations of the gas component for theMaNGA sample would be crucial in testing the role of the bulge indriving the star formation efficiency in different galaxy classes.
Star formation efficiency for cold gas is found to be systemat-ically lower in ellipticals (Martig et al. 2013; Davis et al. 2014) andin the bulge of our own Galaxy (Longmore et al. 2013). Therefore,the absence of the star formation in the central regions of cLIERscould be due to a significantly lower star formation efficiency, evenin presence of a large molecular gas reservoir, in a similar fashionas the ‘central molecular zone’ in the Milky Way, which is found tohave a star formation efficiency approximately 10 times lower thanthe Milky Way disc. In fact, the Milky Way itself is a likely cLIERcandidate, given its inferred green valley optical colours and SFRlower than the star formation main sequence (Mutch et al. 2011).
In this context, secular evolution processes (interaction with abar or spiral density waves) and radial flows represent a possibleexplanation for the presence of cold gas in the central regions ofcLIERs, which is required in order to explain the observed LIERemission. The kinematic correspondence between the stars and gas,which is preserved in the central regions of cLIER galaxies, furthersupports a scenario where the gas in the central region of cLIERgalaxies is either integral part of the disc or has been acquired fromit. Indeed, the absence of line-less bulges in the current sample isa strong indication that central regions of bulge + disc systems arealways more gas rich than galaxies on the red sequence and pointstowards the importance of the SF disc as a possible reservoir of gasin these systems.
In summary, cLIER galaxies are consistent with both a sce-nario of slow gas exhaustion and a scenario of reduced star forma-tion efficiency in the bulge, driven by dynamical processes. Thecold gas content of the central regions of these galaxies is notknown, however some amount of gas must be present in order toallow for the observed LIER emission. This gas shares the samekinematics of the SF disc and is thus possibly driven into the cen-tral regions by bars or other disc instabilities. Followup resolvedstudies of the cold gas content of bulge + disc systems are neededin order to shed further light into the reasons for the absence of starformation in the central regions of cLIERs.
7.2 Ionised gas on the red sequence and the nature of eLIERgalaxies
7.2.1 Origin of the gas in red galaxies
It has long been argued that red sequence galaxies have a large andplentiful source of ionised gas in their old stellar populations. Stel-lar evolution predicts that an old stellar population returns of theorder of half its stellar mass to the ISM over a Hubble time (Ciottiet al. 1991; Padovani & Matteucci 1993; Jungwiert et al. 2001).Mass return is dominated by stellar mass-loss during the evolutionof intermediate and low mass stars along the red giant branch andthe post AGB phases. Padovani & Matteucci (1993) predict that,for a Salpeter initial mass function, a 15 Gyr old population willlead to a mass-loss rate per unit stellar mass of
M? = 2.3 ·10−12 M? yr−1. (2)
MNRAS 000, 1–17 (2016)

14 F. Belfiore et al.
The mass of ionised gas can be estimated from the Hα lumi-nosity as
MHII = 2.3 ·103(
LHα
1038 erg s−1
)(102 cm−3
ne
)M. (3)
For typical integrated Hα luminosities observed in eLIERs,this implies a mass of about∼ 104−105 M. Therefore, for eLIERgalaxies of typical mass of about 1010.5 M, the typical nebular lineluminosities can easily be accounted for by gas injected into theISM by stellar mass-losses over a time-scale of only a few millionyears.
However, the kinematic signatures of the ionised gas are ex-pected to be similar to those of the parent stars. This predictions isat odds with the observational evidence that a large fraction (∼ 65%) of eLIER galaxies are kinematically misaligned. Thus, stellarmass loss can only be responsible for a minor fraction of the gasassociated with LIER emission. Instead it is likely that the gas sup-plied by stellar mass-loss is quickly transferred into the hot X-rayemitting phase, with only a small fraction succeeding to cool. In-deed, the standard paradigm of the ISM in red sequence galaxiesassumes that supersonic motion of the ejecta through the ambienthot medium generates a strong shock that thermalises the gas tothe kinetic temperature of the stars, ∼ 106−107 K, on a time-scaleof ∼ 105− 106 yr (Sanders 1981; Mathews 1990). Episodic AGNactivity could also be responsible for balancing cooling (Ciotti &Ostriker 2007; Schawinski et al. 2007; Cheung et al. 2016) andmaintaining the gas in a hot state.
In summary, the existence of a large population of red se-quence galaxies with EW(Hα)< 1 and the same stellar populationproperties as eLIERs suggests that stellar mass-loss cannot be themain source of cool gas in these galaxies. This inference is con-firmed by the fact that in our sample of eLIERs external accretionis required in at least 65 % of the population to explain the observedkinematic misalignment between gas and stars.
7.2.2 The role of environment on the red sequence
As discussed in section 6, environmental effects are known to playa key role in determining the passive fraction of galaxies (Dressler1980; Peng et al. 2010). In this work, we have shown that, on topof determining the passive faction, environmental effects also affectthe presence of line emission and thus the cold gas content in redsequence galaxies. In particular, we have demonstrated that red se-quence galaxies with small or undetected line emission (EW(Hα)< 1 Å) live in denser environments, both as centrals and satellites,than eLIERs of the same mass.
At the high end of the stellar mass function line-less galaxiesare mostly the central galaxies in high-mass haloes. Their positionwithin a large halo would both impede accretion of external coldgas and heat up the gas recycled via stellar evolution, thus leav-ing the galaxy line-less. Analysis of the stellar kinematics of theMaNGA data further demonstrates that at high masses most galax-ies classified as slow rotators are line-less, as expected from thekinematics-density relation (Cappellari et al. 2011b). These cen-tral, massive, slowly-rotating line-less galaxies represent the strik-ing endpoint of galaxy evolution.
At the low mass end, environment is known to play a crucialrole in making galaxies line-less, albeit via a different route (e.g.Geha et al. 2012). We demonstrate in Fig. 7 that for M? < 1010 Mmore than 70 % of line-less galaxies are satellites, in contrast withthe much lower satellite fraction for eLIERs (∼ 40 %). Satellites
are generally not thought to accrete gas after falling into the hotenvironment of galaxy overdensities (or anyhow to accrete at asubstantially lower rate than centrals, Keres et al. 2009) and arelikely to undergo some amount of ram-pressure stripping as theyenter a massive halo. Moreover, while at first the merger rate is en-hanced as galaxies fall into rich haloes, once the galaxies virialisethe large velocity dispersion within cluster considerably suppressesthe subsequent merger rate (van Dokkum et al. 1999), thus makingit harder to obtain gas from gas rich mergers. While it is possiblethat some amount of dense gas survives the infall event and allowsthe satellite galaxy to continue forming stars for a time-scale com-parable to the depletion time (Wetzel et al. 2013), once star forma-tion ceases the strong environmental effects are likely to seriouslydisrupt the diffuse gas component and finally leave the galaxy line-less.
8 CONCLUSIONS
In this paper we study the properties of galaxies based on theirspatially resolved ionised gas emission. We make use of spatiallyresolved spectroscopy for a sample of 586 galaxies from SDSS-IV MaNGA, and classify galaxies according to the classificationscheme introduced in Belfiore et al. (2016), which properly ac-counts for the ubiquitous presence of low ionisation emission lineregions (LIERs). Within this framework non-active galaxies areclassified in four classes: (1) star forming galaxies (SF), (2) galax-ies characterised by LIER emission at small galactocentric radiiand star formation at larger radii (cLIERs), (3) galaxies charac-terised by LIER emission at all radii where line emission is detected(eLIERs), (4) Line-less galaxies, operationally defined to have av-erage EW(Hα) < 1 Å within 1.0 Re.
In this work we place these galaxy classes within the con-text of the evolving galaxy population by studying their integratedcolours and SFR, morphology and kinematics. We complement theMaNGA data with environmental information for the much largerMaNGA parent sample (∼ 30 000 galaxies with legacy SDSS spec-troscopy) to be able to disentangle the effect of mass and envi-ronment on line emission on the red sequence. In the followingwe summarise the fundamental properties of the two new galaxyclasses we have focused on.
Central LIER galaxies (cLIERs)
(i) Stellar populations: cLIERs span a wide range of stellar ages,with old central LIER regions and outer regions characterised byyoung stellar populations.
(ii) Colours and SFR: cLIERs lie preferentially in and aroundthe green valley in UV-optical colours, although they appear in-creasingly consistent with the red sequence using optical coloursalone (u− r or g− r). In the SFR-M? diagram cLIERs lie 0.8 dexbelow the main sequence of star forming galaxies, albeit with alarge scatter.
(iii) Morphology: cLIER galaxies are visually classified as discgalaxies, but have larger bulge fraction than star forming galaxies ofthe same mass, as traced via photometric indices and spectroscopicstellar velocity dispersion measurements.
(iv) Kinematics: cLIERs display regular disc-like kinematics inboth gas and stars, which are mutually aligned.
(v) Environment: cLIERs live in slightly denser environmentsthan SF galaxies for log(M?/M) = 10.5−11.5, but have the samesatellite fraction.
MNRAS 000, 1–17 (2016)
The transition from star formation to quiescence 15
cLIERs are consistent with originating from SF galaxies that areslowly quenching. The inside-out quenching pattern is consistentwith both gas exhaustion and/or a decrease in the star formation ef-ficiency. In either case, the presence of a bulge is closely connectedto the lack of central star formation in these galaxies. The star form-ing disc is the likely source of the LIER emitting gas present in thecentral regions.
Extended LIER galaxies (eLIERs)
(i) Stellar populations: eLIERs have old stellar populations, in-distinguishable from those of line-less galaxies.
(ii) Colours and SFR: eLIERs lie on the red sequence in colour-magnitude diagrams, with only a small contamination to the greenvalley.
(iii) Morphology: eLIER galaxies are visually classified as earlytype galaxies and have similar bulges to those of line-less galaxiesof the same stellar mass.
(iv) Kinematics: eLIERs display a variety of gas kinematics, butgenerally present well-defined rotation/flows on kpc scales. The ve-locity field of gas and stars are often observed to be misaligned(65±7% of eLIERs are misaligned by more than 30).
(v) Environment: eLIERs live in denser environments than SFand cLIERs at high masses (M? > 1010.5M), as expected from thewell-known correlation between colour and passive fraction. Moreimportantly eLIERs tend to live in less dense environments thanline-less galaxies of the same mass. At the high mass end, line-lessgalaxies are mostly centrals in high mass haloes, while at the lowmass end line-less galaxies are mostly satellites.
eLIERs are red sequence galaxies with residual cold gas, acquiredmostly via external sources. While this gas does not form stars,it is illuminated by the diffuse ionisation field from hot old starsand shines with LIER line ratios. LIER emission is suppressed inhigh density environments, likely because of lack of gas, which haseither been consumed due to the shut down of inflows or otherwiseheated and/or tidally stripped by the hot halo gas.
ACKNOWLEDGEMENTS
We are grateful to the referee, A. Renzini, for his comments and insightthat have greatly improved the quality of the paper. F.B., R.M and K.Macknowledge funding from the United Kingdom Science and TechnologyFacilities Council (STFC). R.M. acknowledges support from the Euro-pean Research Council (ERC) Advanced Grant 695671 ‘QUENCH’. A.R-L acknowledges partial support from the DIULS regular project PR15143.M.B was supported by NSF/AST-1517006. K.B. was supported by WorldPremier International Research Centre Initiative (WPI Initiative), MEXT,Japan and by JSPS KAKENHI Grant Number 15K17603. A.W. acknowl-edges support from a Leverhulme Early Career Fellowship. A.D. acknowl-edges support from The Grainger Foundation. The authors are thankfulto Y. Peng and D. Goddard for their help with the environmental mea-sures for the SDSS galaxy sample and to M. Blanton for developingand maintaining the NASA-Sloan Atlas; to the members of the SDSS-IV MaNGA collaboration, in particular the dedicated team of observersat APO. The visual classification of the Galaxy Zoo galaxies was madeby more than 100 000 volunteers. Their contributions are acknowledgedat http://www.galaxyzoo.org/Volunteers.aspx. This work makesuse of data from SDSS-I-II and IV. This research made use of Marvin
(Cherinka et al., in prep), a core Python package and web framework forMaNGA data, developed by Brian Cherinka, José Sánchez-Gallego andBrett Andrews.
Funding for SDSS-I-II and SDSS-IV has been provided by the Al-fred P. Sloan Foundation and Participating Institutions. Additional fund-
ing for SDSS-II comes the National Science Foundation, the U.S. Depart-ment of Energy, the National Aeronautics and Space Administration, theJapanese Monbukagakusho, the Max Planck Society, and the Higher Edu-cation Funding Council for England. Additional funding towards SDSS-IVhas been provided by the U.S. Department of Energy Office of Science.SDSS-IV acknowledges support and resources from the Centre for High-Performance Computing at the University of Utah. The SDSS web site iswww.sdss.org.
The participating Institution in SDSS-II include the American Mu-seum of Natural History, Astrophysical Institute Potsdam, University ofBasel, University of Cambridge, Case Western Reserve University, Univer-sity of Chicago, Drexel University, Fermilab, the Institute for AdvancedStudy, the Japan Participation Group, Johns Hopkins University, the JointInstitute for Nuclear Astrophysics, the Kavli Institute for Particle Astro-physics and Cosmology, the Korean Scientist Group, the Chinese Academyof Sciences (LAMOST), Los Alamos National Laboratory, Max-Planck-Institut für Astronomie (MPIA Heidelberg), Max-Planck-Institut für Astro-physik (MPA Garching), New Mexico State University, Ohio State Univer-sity, University of Pittsburgh, University of Portsmouth, Princeton Univer-sity, the United States Naval Observatory, and the University of Washington.
SDSS-IV is managed by the Astrophysical Research Consortiumfor the Participating Institutions of the SDSS Collaboration includingthe Brazilian Participation Group, the Carnegie Institution for Science,Carnegie Mellon University, the Chilean Participation Group, the FrenchParticipation Group, Harvard-Smithsonian Center for Astrophysics, Insti-tuto de Astrofísica de Canarias, The Johns Hopkins University, Kavli Insti-tute for the Physics and Mathematics of the Universe (IPMU) / University ofTokyo, Lawrence Berkeley National Laboratory, Leibniz Institut für Astro-physik Potsdam (AIP), Max-Planck-Institut für Astronomie (MPIA Heidel-berg), Max-Planck-Institut für Astrophysik (MPA Garching), Max-Planck-Institut für Extraterrestrische Physik (MPE), National Astronomical Obser-vatory of China, New Mexico State University, New York University, Uni-versity of Notre Dame, Observatário Nacional / MCTI, The Ohio State Uni-versity, Pennsylvania State University, Shanghai Astronomical Observatory,United Kingdom Participation Group, Universidad Nacional Autónoma deMéxico, University of Arizona, University of Colorado Boulder, Univer-sity of Oxford, University of Portsmouth, University of Utah, Universityof Virginia, University of Washington, University of Wisconsin, VanderbiltUniversity, and Yale University.
All data taken as part of SDSS-IV is scheduled to be releasedto the community in fully reduced form at regular intervals throughdedicated data releases. The MaNGA data used in this work is partof SDSS data release 13 (Albareti et al. 2016), publicly available athttp://www.sdss.org/dr13/manga/manga-data/.
REFERENCES
Abazajian K. N., et al., 2009, ApJS, 182, 543Albareti F. D., et al., 2016, arXivAllen J. T., et al., 2015, MNRAS, 446, 1567Baldry I. K., Glazebrook K., Brinkmann J., Ivezic Z., Lupton R. H., Nichol
R. C., Szalay A. S., 2004, ApJ, 600, 681Baldry I. K., Balogh M. L., Bower R. G., Glazebrook K., Nichol R. C.,
Bamford S. P., Budavari T., 2006, MNRAS, 373, 469Baldwin J. A., Phillips M. M., Terlevich R., 1981, PASP, 93, 5Balogh M. L., Morris S. L., Yee H. K. C., Carlberg R. G., Ellingson E.,
1999, ApJ, 527, 54Balogh M. L., Baldry I. K., Nichol R. C., Miller C., R B., Glazebrook K.,
2004, ApJ, 615, L101Bamford S. P., et al., 2009, MNRAS, 393, 1324Belfiore F., et al., 2015, MNRAS, 449, 867Belfiore F., et al., 2016, MNRAS, 461, 3111Bell E. F., et al., 2012, ApJ, 753, 167Bertola F., Corsini E. M., Vega Beltran J. C., Pizzella A., Sarzi M., Cappel-
lari M., J. G. Funes S., 1999, ApJ, 519, L127Binette L., Magris C. G., Stasinska G., Bruzual A. G., 1994, A&A, 292, 13
MNRAS 000, 1–17 (2016)
16 F. Belfiore et al.
Birnboim Y., Dekel A., 2003, MNRAS, 345, 349Blanc G. A., Heiderman A., Gebhardt K., Evans N. J., Adams J., 2009, ApJ,
704, 842Blanton M. R., Moustakas J., 2009, Annu. Rev. Astron. Astrophys, 47, 159Blanton M. R., Roweis S., 2007, AJ, 133, 734Blanton M. R., et al., 2003, ApJ, 594, 186Blanton M. R., et al., 2005a, AJ, 129, 2562Blanton M., Eisenstein D., Hogg D., Schlegel D., Brinkmann J., 2005b,
ApJ, 629, 143Blanton M. R., Kazin E., Muna D., Weaver B. A., Price-Whelan A., 2011,
AJ, 142, 31Bluck A. F. L., Mendel J. T., Ellison S. L., Moreno J., Simard L., Patton
D. R., Starkenburg E., 2014, MNRAS, 441, 599Boselli A., Cortese L., Boquien M., 2014, A&A, 564, A65Bower R. G., Benson A. J., Malbon R., Helly J. C., Frenk C. S., Baugh
C. M., Cole S., Lacey C. G., 2006, MNRAS, 370, 645Brinchmann J., Charlot S., White S. D. M., Tremonti C., Kauffmann G.,
Heckman T., Brinkmann J., 2004, MNRAS, 351, 1151Brown T., Ferguson H., Stanford S., Deharveng J.-M., 1998, ApJ, 504, 113Brown T. M., Smith E., Ferguson H. C., Sweigart A. V., Kimble R. a., Bow-
ers C. W., 2008, ApJ, 682, 319Bruzual G., Charlot S., 2003, MNRAS, 344, 1000Bundy K., et al., 2010, ApJS, 719, 1969Bundy K., et al., 2015, ApJ, 798, 7Calzetti D., 2001, PASP, 113, 1449Cappellari M., 2016, Annu. Rev. Astron. Astrophys, 54, 1Cappellari M., Emsellem E., 2004, PASP, 116, 138Cappellari M., et al., 2011a, MNRAS, 413, 813Cappellari M., et al., 2011b, MNRAS, 416, 1680Cappellari M., et al., 2013, MNRAS, 432, 1862Cardelli J. A., Clayton G. C., Mathis J. S., 1989, ApJ, 345, 245Carniani S., et al., 2015, A&A, 580, A102Carollo C. M., Cibinel A., Lilly S. J., Pipino A., Bonoli S., Finoguenov A.,
2016, ApJ, 818, 0Cattaneo a., et al., 2009, Nature, 460, 213Chabrier G., 2003, PASP, 115, 763Cheung E., et al., 2012, ApJ, 760, 131Cheung E., et al., 2013, ApJ, 779, 162Cheung E., et al., 2016, Nature, 533, 504Chung A., van Gorkom J. H., Kenney J. D. P., Crowl H., Vollmer B., 2009,
AJ, 138, 1741Cicone C., et al., 2014, A&A, 562, A21Ciotti L., Ostriker J. P., 2007, ApJ, 665, 1038Ciotti L., et al., 1991, ApJ, 376, 380Cortese L., Catinella B., Boissier S., Boselli A., Heinis S., 2011, MNRAS,
415, 1797Croton D. J., et al., 2006, MNRAS, 365, 11Davis T. A., Bureau M., 2016, MNRAS, 457, 272Davis T. a., et al., 2011, MNRAS, 417, 882Davis T. a., et al., 2014, MNRAS, 444, 3427De Lucia G., Fontanot F., Wilman D., Monaco P., 2011, MNRAS, 414, 1439Dekel A., Birnboim Y., 2006, MNRAS, 368, 2Dressler a., 1980, ApJ, 236, 351Driver S. P., et al., 2011, MNRAS, 413, 971Drory N., et al., 2015, AJ, 149, 77Elmegreen B. G., 1995, MNRAS, 275, 944Emsellem E., et al., 2007, MNRAS, 379, 401Emsellem E., et al., 2011, MNRAS, 414, 888Emsellem E., Renaud F., Bournaud F., Elmegreen B., Combes F., Gabor J.,
2014, MNRAS, 446, 2468Etherington J., Thomas D., 2015, MNRAS, 451, 660Fabian A., 2012, ARA&A, 50, 455Fanali R., Dotti M., Fiacconi D., Haardt F., 2015, MNRAS, 454, 3641Forbes J. C., Krumholz M. R., Burkert A., Dekel A., 2014, MNRAS, 438,
1552Franx M., Illingworth G., de Zeeuw T., 1991, ApJ, 383, 112Fumagalli M., Fossati M., Hau G. K. T., Gavazzi G., Bower R., Sun M.,
Boselli A., 2014, MNRAS, 445, 4335
Gabor J. M., Davé R., 2012, MNRAS, 427, 1816Geha M., Blanton M. R., Yan R., Tinker J. L., Haven N., 2012, ApJ, 85, 85Genzel R., et al., 2014, ApJ, 785, 75Gerhard O., Binney J., 1996, MNRAS, 279, 993Gomes J. M., Papaderos P., Vílchez J. M., Kehrig C., Breda I., Lehnert
M. D., 2016, A&A, 585, A92Gunn J. E., Gott J. R., 1972, ApJ, 176, 1Gunn J. E., et al., 2006, AJ, 131, 2332Häring N., Rix H.-W., 2004, ApJ, p. L89Heckman T. M., Best P. N., 2014, ARA&A, 52, 589Jog C. J., Solomon P. M., 1984, ApJ, 276, 127Jungwiert B., Combes F., Palous J., 2001, A&A, 35, 85Kauffmann G., et al., 2003a, MNRAS, 341, 54Kauffmann G., et al., 2003b, MNRAS, 341, 33Kauffmann G., et al., 2003c, MNRAS, 346, 1055Kauffmann G., Heckman T. M., De Lucia G., Brinchmann J., Charlot S.,
Tremonti C., White S. D. M., Brinkmann J., 2006, MNRAS, 367, 1394Kennicutt R. C., 1998, ARA&A, 36, 189Keres D., Katz N., Weinberg D. H., Dave’ R., 2005, MNRAS, 363, 2Keres D., Katz N., Fardal M., Dav?? R., Weinberg D. H., 2009, MNRAS,
395, 160Kewley L. J., Ellison S. L., 2008, ApJ, 681, 1183Knobel C., Lilly S. J., Woo J., Kovac K., 2015, ApJ, 800, 24Kormendy J., Drory N., Bender R., Cornell M. E., 2010, ApJ, 723, 54Krajnovic D., Cappellari M., De Zeeuw P. T., Copin Y., 2006, MNRAS,
366, 787Krajnovic D., et al., 2013, MNRAS, 432, 1768Lake G., Norman C., 1983, ApJ, 270, 51Larson R. B., Tinsley B. M., Caldwell C. N., 1980, ApJ, 237, 692Law D. R., et al., 2015, AJ, 150, 19Law D. R., et al., 2016, AJ, 152, 83Leroy A. K., Walter F., Brinks E., Bigiel F., de Blok W. J. G., Madore B.,
Thornley M. D., 2008, AJ, 136, 2782Li C., et al., 2015, ApJ, 804, 125Lilly S. J., et al., 2007, ApJS, 172, 70Lintott C. J., et al., 2008, MNRAS, 389, 1179Longmore S. N., et al., 2013, MNRAS, 429, 987Maiolino R., et al., 2012, MNRAS, 425, L66Maraston C., Stromback G., 2011, MNRAS, 418, 2785Marconi A., Hunt L. K., 2003, ApJ, 589, L21Martig M., Bournaud F., Teyssier R., Dekel A., 2009, ApJ, 707, 250Martig M., et al., 2013, MNRAS, 432, 1914Masters K. L., et al., 2010, MNRAS, 405, 783Masters K. L., et al., 2011, MNRAS, 418, 1055Masters K. L., et al., 2012, MNRAS, 424, 2180Mathews W. G., 1990, ApJ, 354, 468McConnell N. J., Ma C.-P., 2013, ApJ, 764, 184Mendel T. J., Simard L., Ellison S. L., Patton D. R., 2013, MNRAS, 429,
2212Mutch S. J., Croton D. J., Poole G. B., 2011, ApJ, 736, 84Nair P. B., Abraham R. G., 2010, ApJ, 714, L260O’Donnell J. E., 1994, ApJ, 422, 158Osterbrock D. E., Ferland G. J., 2006, Astrophysics of gaseous nebulae and
active galactic nuclei. University Science Books, Mill Valley, CAPadovani P., Matteucci F., 1993, ApJ, 416, 26Pasquali A., Gallazzi A., van den Bosch F. C., 2012, MNRAS, 425, 273Peng Y.-j., et al., 2010, ApJ, 721, 193Peng Y., Maiolino R., Cochrane R., 2015, Nature, 521, 192Poggianti B. M., et al., 2016, AJ, 151, 78Rees M., Ostriker J., 1977, MNRAS, 179, 541Renzini A., Peng Y.-j., 2015, ApJ, 801, L29Romeo A. B., Wiegert J., 2011, MNRAS, 416, 1191Rosenfield P., et al., 2012, ApJ, 755, 131Rybicki G., 1987, in de Zeeuw P., ed., IAU Symposium Vol. 127, Struct.
Dyn. Elliptical Galaxies. p. 397Saintonge A., et al., 2011, MNRAS, 415, 61Saintonge A., et al., 2012, ApJ, 758, 73Sales L. V., et al., 2014, MNRAS, 447, L6
MNRAS 000, 1–17 (2016)
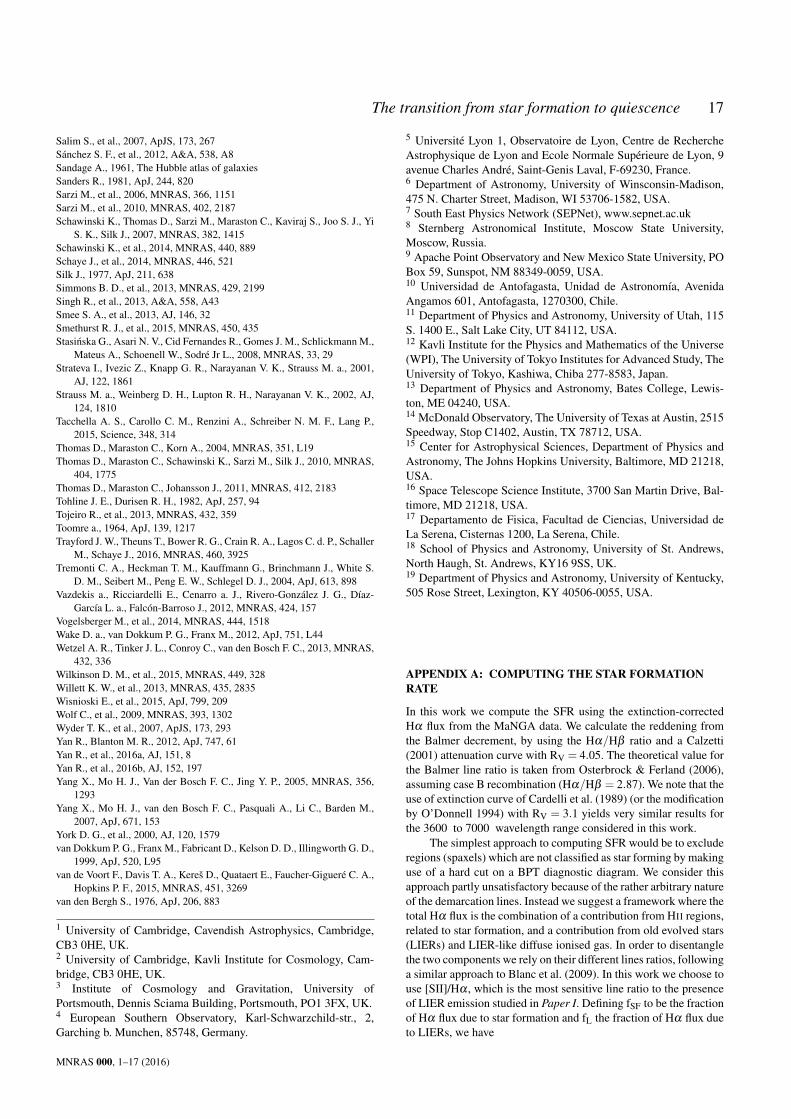
The transition from star formation to quiescence 17
Salim S., et al., 2007, ApJS, 173, 267Sánchez S. F., et al., 2012, A&A, 538, A8Sandage A., 1961, The Hubble atlas of galaxiesSanders R., 1981, ApJ, 244, 820Sarzi M., et al., 2006, MNRAS, 366, 1151Sarzi M., et al., 2010, MNRAS, 402, 2187Schawinski K., Thomas D., Sarzi M., Maraston C., Kaviraj S., Joo S. J., Yi
S. K., Silk J., 2007, MNRAS, 382, 1415Schawinski K., et al., 2014, MNRAS, 440, 889Schaye J., et al., 2014, MNRAS, 446, 521Silk J., 1977, ApJ, 211, 638Simmons B. D., et al., 2013, MNRAS, 429, 2199Singh R., et al., 2013, A&A, 558, A43Smee S. A., et al., 2013, AJ, 146, 32Smethurst R. J., et al., 2015, MNRAS, 450, 435Stasinska G., Asari N. V., Cid Fernandes R., Gomes J. M., Schlickmann M.,
Mateus A., Schoenell W., Sodré Jr L., 2008, MNRAS, 33, 29Strateva I., Ivezic Z., Knapp G. R., Narayanan V. K., Strauss M. a., 2001,
AJ, 122, 1861Strauss M. a., Weinberg D. H., Lupton R. H., Narayanan V. K., 2002, AJ,
124, 1810Tacchella A. S., Carollo C. M., Renzini A., Schreiber N. M. F., Lang P.,
2015, Science, 348, 314Thomas D., Maraston C., Korn A., 2004, MNRAS, 351, L19Thomas D., Maraston C., Schawinski K., Sarzi M., Silk J., 2010, MNRAS,
404, 1775Thomas D., Maraston C., Johansson J., 2011, MNRAS, 412, 2183Tohline J. E., Durisen R. H., 1982, ApJ, 257, 94Tojeiro R., et al., 2013, MNRAS, 432, 359Toomre a., 1964, ApJ, 139, 1217Trayford J. W., Theuns T., Bower R. G., Crain R. A., Lagos C. d. P., Schaller
M., Schaye J., 2016, MNRAS, 460, 3925Tremonti C. A., Heckman T. M., Kauffmann G., Brinchmann J., White S.
D. M., Seibert M., Peng E. W., Schlegel D. J., 2004, ApJ, 613, 898Vazdekis a., Ricciardelli E., Cenarro a. J., Rivero-González J. G., Díaz-
García L. a., Falcón-Barroso J., 2012, MNRAS, 424, 157Vogelsberger M., et al., 2014, MNRAS, 444, 1518Wake D. a., van Dokkum P. G., Franx M., 2012, ApJ, 751, L44Wetzel A. R., Tinker J. L., Conroy C., van den Bosch F. C., 2013, MNRAS,
432, 336Wilkinson D. M., et al., 2015, MNRAS, 449, 328Willett K. W., et al., 2013, MNRAS, 435, 2835Wisnioski E., et al., 2015, ApJ, 799, 209Wolf C., et al., 2009, MNRAS, 393, 1302Wyder T. K., et al., 2007, ApJS, 173, 293Yan R., Blanton M. R., 2012, ApJ, 747, 61Yan R., et al., 2016a, AJ, 151, 8Yan R., et al., 2016b, AJ, 152, 197Yang X., Mo H. J., Van der Bosch F. C., Jing Y. P., 2005, MNRAS, 356,
1293Yang X., Mo H. J., van den Bosch F. C., Pasquali A., Li C., Barden M.,
2007, ApJ, 671, 153York D. G., et al., 2000, AJ, 120, 1579van Dokkum P. G., Franx M., Fabricant D., Kelson D. D., Illingworth G. D.,
1999, ApJ, 520, L95van de Voort F., Davis T. A., Kereš D., Quataert E., Faucher-Gigueré C. A.,
Hopkins P. F., 2015, MNRAS, 451, 3269van den Bergh S., 1976, ApJ, 206, 883
1 University of Cambridge, Cavendish Astrophysics, Cambridge,CB3 0HE, UK.2 University of Cambridge, Kavli Institute for Cosmology, Cam-bridge, CB3 0HE, UK.3 Institute of Cosmology and Gravitation, University ofPortsmouth, Dennis Sciama Building, Portsmouth, PO1 3FX, UK.4 European Southern Observatory, Karl-Schwarzchild-str., 2,Garching b. Munchen, 85748, Germany.
5 Université Lyon 1, Observatoire de Lyon, Centre de RechercheAstrophysique de Lyon and Ecole Normale Supérieure de Lyon, 9avenue Charles André, Saint-Genis Laval, F-69230, France.6 Department of Astronomy, University of Winsconsin-Madison,475 N. Charter Street, Madison, WI 53706-1582, USA.7 South East Physics Network (SEPNet), www.sepnet.ac.uk8 Sternberg Astronomical Institute, Moscow State University,Moscow, Russia.9 Apache Point Observatory and New Mexico State University, POBox 59, Sunspot, NM 88349-0059, USA.10 Universidad de Antofagasta, Unidad de Astronomía, AvenidaAngamos 601, Antofagasta, 1270300, Chile.11 Department of Physics and Astronomy, University of Utah, 115S. 1400 E., Salt Lake City, UT 84112, USA.12 Kavli Institute for the Physics and Mathematics of the Universe(WPI), The University of Tokyo Institutes for Advanced Study, TheUniversity of Tokyo, Kashiwa, Chiba 277-8583, Japan.13 Department of Physics and Astronomy, Bates College, Lewis-ton, ME 04240, USA.14 McDonald Observatory, The University of Texas at Austin, 2515Speedway, Stop C1402, Austin, TX 78712, USA.15 Center for Astrophysical Sciences, Department of Physics andAstronomy, The Johns Hopkins University, Baltimore, MD 21218,USA.16 Space Telescope Science Institute, 3700 San Martin Drive, Bal-timore, MD 21218, USA.17 Departamento de Fisica, Facultad de Ciencias, Universidad deLa Serena, Cisternas 1200, La Serena, Chile.18 School of Physics and Astronomy, University of St. Andrews,North Haugh, St. Andrews, KY16 9SS, UK.19 Department of Physics and Astronomy, University of Kentucky,505 Rose Street, Lexington, KY 40506-0055, USA.
APPENDIX A: COMPUTING THE STAR FORMATIONRATE
In this work we compute the SFR using the extinction-correctedHα flux from the MaNGA data. We calculate the reddening fromthe Balmer decrement, by using the Hα/Hβ ratio and a Calzetti(2001) attenuation curve with RV = 4.05. The theoretical value forthe Balmer line ratio is taken from Osterbrock & Ferland (2006),assuming case B recombination (Hα/Hβ = 2.87). We note that theuse of extinction curve of Cardelli et al. (1989) (or the modificationby O’Donnell 1994) with RV = 3.1 yields very similar results forthe 3600 to 7000 wavelength range considered in this work.
The simplest approach to computing SFR would be to excluderegions (spaxels) which are not classified as star forming by makinguse of a hard cut on a BPT diagnostic diagram. We consider thisapproach partly unsatisfactory because of the rather arbitrary natureof the demarcation lines. Instead we suggest a framework where thetotal Hα flux is the combination of a contribution from HII regions,related to star formation, and a contribution from old evolved stars(LIERs) and LIER-like diffuse ionised gas. In order to disentanglethe two components we rely on their different lines ratios, followinga similar approach to Blanc et al. (2009). In this work we choose touse [SII]/Hα , which is the most sensitive line ratio to the presenceof LIER emission studied in Paper I. Defining fSF to be the fractionof Hα flux due to star formation and fL the fraction of Hα flux dueto LIERs, we have
MNRAS 000, 1–17 (2016)
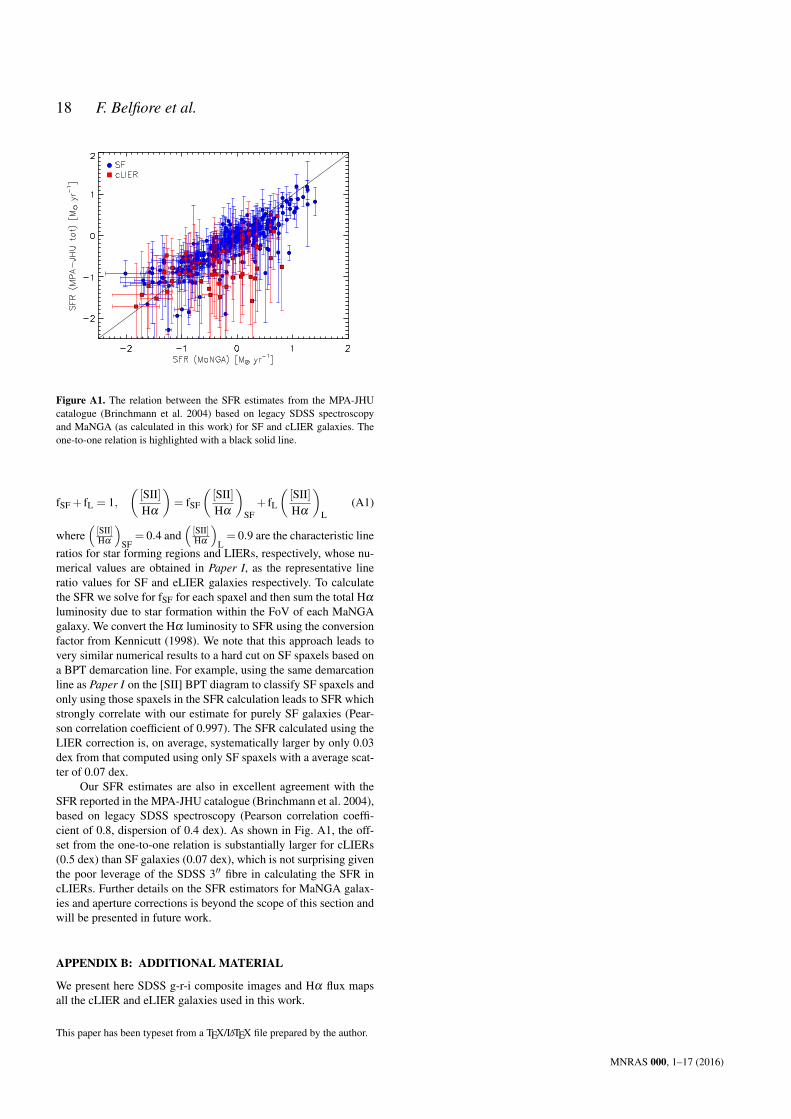
18 F. Belfiore et al.
Figure A1. The relation between the SFR estimates from the MPA-JHUcatalogue (Brinchmann et al. 2004) based on legacy SDSS spectroscopyand MaNGA (as calculated in this work) for SF and cLIER galaxies. Theone-to-one relation is highlighted with a black solid line.
fSF + fL = 1,([SII]Hα
)= fSF
([SII]Hα
)SF
+ fL
([SII]Hα
)L
(A1)
where([SII]Hα
)SF
= 0.4 and([SII]Hα
)L= 0.9 are the characteristic line
ratios for star forming regions and LIERs, respectively, whose nu-merical values are obtained in Paper I, as the representative lineratio values for SF and eLIER galaxies respectively. To calculatethe SFR we solve for fSF for each spaxel and then sum the total Hα
luminosity due to star formation within the FoV of each MaNGAgalaxy. We convert the Hα luminosity to SFR using the conversionfactor from Kennicutt (1998). We note that this approach leads tovery similar numerical results to a hard cut on SF spaxels based ona BPT demarcation line. For example, using the same demarcationline as Paper I on the [SII] BPT diagram to classify SF spaxels andonly using those spaxels in the SFR calculation leads to SFR whichstrongly correlate with our estimate for purely SF galaxies (Pear-son correlation coefficient of 0.997). The SFR calculated using theLIER correction is, on average, systematically larger by only 0.03dex from that computed using only SF spaxels with a average scat-ter of 0.07 dex.
Our SFR estimates are also in excellent agreement with theSFR reported in the MPA-JHU catalogue (Brinchmann et al. 2004),based on legacy SDSS spectroscopy (Pearson correlation coeffi-cient of 0.8, dispersion of 0.4 dex). As shown in Fig. A1, the off-set from the one-to-one relation is substantially larger for cLIERs(0.5 dex) than SF galaxies (0.07 dex), which is not surprising giventhe poor leverage of the SDSS 3′′ fibre in calculating the SFR incLIERs. Further details on the SFR estimators for MaNGA galax-ies and aperture corrections is beyond the scope of this section andwill be presented in future work.
APPENDIX B: ADDITIONAL MATERIAL
We present here SDSS g-r-i composite images and Hα flux mapsall the cLIER and eLIER galaxies used in this work.
This paper has been typeset from a TEX/LATEX file prepared by the author.
MNRAS 000, 1–17 (2016)
The transition from star formation to quiescence 19
Figure B1. Top: SDSS g-r-i colour composite images (with MaNGA IFU bundle FoV superimposed) for the sample of cLIER galaxies studied in this work.Bottom: MaNGA Hα flux maps for the sample of cLIER galaxies studied in this work.
MNRAS 000, 1–17 (2016)

20 F. Belfiore et al.
Figure B2. Top: SDSS g-r-i colour composite images (with MaNGA IFU bundle FoV superimposed) for the sample of eLIER galaxies studied in this work.Bottom: MaNGA Hα flux maps for the sample of eLIER galaxies studied in this work.
MNRAS 000, 1–17 (2016)
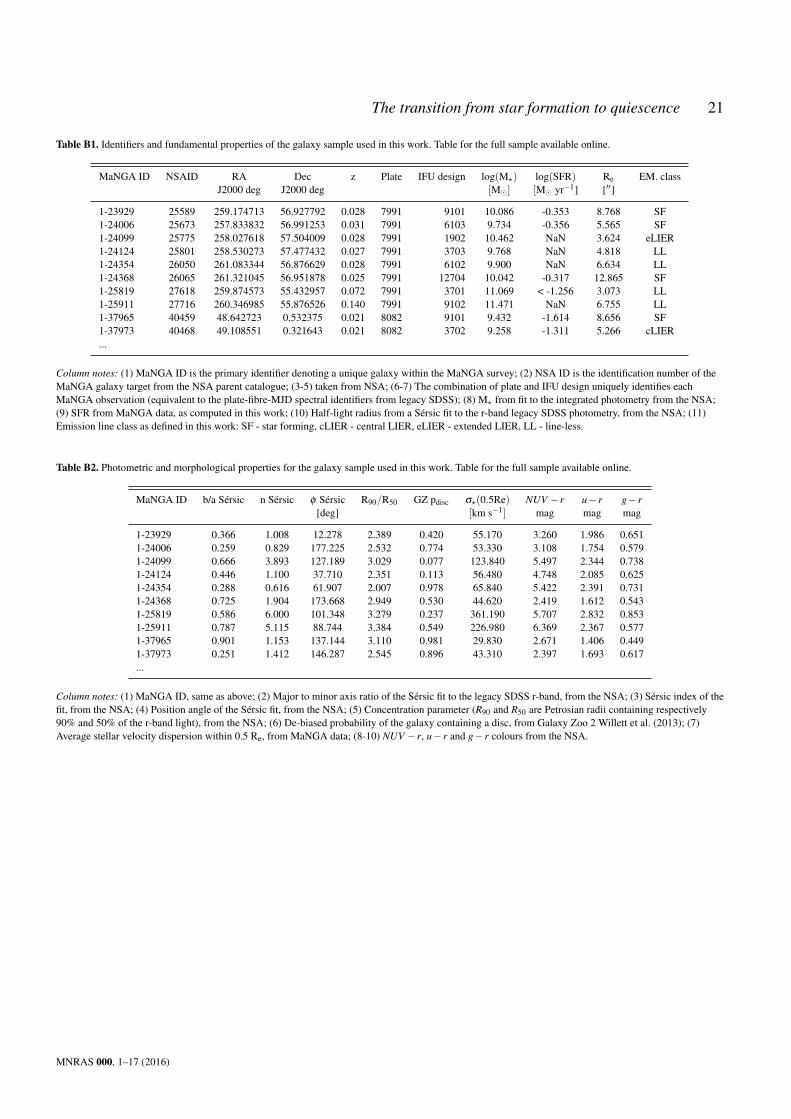
The transition from star formation to quiescence 21
Table B1. Identifiers and fundamental properties of the galaxy sample used in this work. Table for the full sample available online.
MaNGA ID NSAID RA Dec z Plate IFU design log(M?) log(SFR) Re EM. classJ2000 deg J2000 deg [M] [M yr−1] [′′]
1-23929 25589 259.174713 56.927792 0.028 7991 9101 10.086 -0.353 8.768 SF1-24006 25673 257.833832 56.991253 0.031 7991 6103 9.734 -0.356 5.565 SF1-24099 25775 258.027618 57.504009 0.028 7991 1902 10.462 NaN 3.624 eLIER1-24124 25801 258.530273 57.477432 0.027 7991 3703 9.768 NaN 4.818 LL1-24354 26050 261.083344 56.876629 0.028 7991 6102 9.900 NaN 6.634 LL1-24368 26065 261.321045 56.951878 0.025 7991 12704 10.042 -0.317 12.865 SF1-25819 27618 259.874573 55.432957 0.072 7991 3701 11.069 < -1.256 3.073 LL1-25911 27716 260.346985 55.876526 0.140 7991 9102 11.471 NaN 6.755 LL1-37965 40459 48.642723 0.532375 0.021 8082 9101 9.432 -1.614 8.656 SF1-37973 40468 49.108551 0.321643 0.021 8082 3702 9.258 -1.311 5.266 cLIER...
Column notes: (1) MaNGA ID is the primary identifier denoting a unique galaxy within the MaNGA survey; (2) NSA ID is the identification number of theMaNGA galaxy target from the NSA parent catalogue; (3-5) taken from NSA; (6-7) The combination of plate and IFU design uniquely identifies eachMaNGA observation (equivalent to the plate-fibre-MJD spectral identifiers from legacy SDSS); (8) M? from fit to the integrated photometry from the NSA;(9) SFR from MaNGA data, as computed in this work; (10) Half-light radius from a Sérsic fit to the r-band legacy SDSS photometry, from the NSA; (11)Emission line class as defined in this work: SF - star forming, cLIER - central LIER, eLIER - extended LIER, LL - line-less.
Table B2. Photometric and morphological properties for the galaxy sample used in this work. Table for the full sample available online.
MaNGA ID b/a Sérsic n Sérsic φ Sérsic R90/R50 GZ pdisc σ?(0.5Re) NUV − r u− r g− r[deg] [km s−1] mag mag mag
1-23929 0.366 1.008 12.278 2.389 0.420 55.170 3.260 1.986 0.6511-24006 0.259 0.829 177.225 2.532 0.774 53.330 3.108 1.754 0.5791-24099 0.666 3.893 127.189 3.029 0.077 123.840 5.497 2.344 0.7381-24124 0.446 1.100 37.710 2.351 0.113 56.480 4.748 2.085 0.6251-24354 0.288 0.616 61.907 2.007 0.978 65.840 5.422 2.391 0.7311-24368 0.725 1.904 173.668 2.949 0.530 44.620 2.419 1.612 0.5431-25819 0.586 6.000 101.348 3.279 0.237 361.190 5.707 2.832 0.8531-25911 0.787 5.115 88.744 3.384 0.549 226.980 6.369 2.367 0.5771-37965 0.901 1.153 137.144 3.110 0.981 29.830 2.671 1.406 0.4491-37973 0.251 1.412 146.287 2.545 0.896 43.310 2.397 1.693 0.617...
Column notes: (1) MaNGA ID, same as above; (2) Major to minor axis ratio of the Sérsic fit to the legacy SDSS r-band, from the NSA; (3) Sérsic index of thefit, from the NSA; (4) Position angle of the Sérsic fit, from the NSA; (5) Concentration parameter (R90 and R50 are Petrosian radii containing respectively90% and 50% of the r-band light), from the NSA; (6) De-biased probability of the galaxy containing a disc, from Galaxy Zoo 2 Willett et al. (2013); (7)Average stellar velocity dispersion within 0.5 Re, from MaNGA data; (8-10) NUV − r, u− r and g− r colours from the NSA.
MNRAS 000, 1–17 (2016)