sealaska annual report - sealaska corporation sealaska annual... · sealaska annual report please...
TRANSCRIPT
www.sealaska.com
Sealaska Annual Report
STABILITY IN MOTION
2015
Photo credits: Linda Demmert, Bethany Goodrich, Eirik Johnson, Mark Kelley, Katarina Sostaric, Brian Wallace and the Traver Gallery.
© 2016 Sealaska Corporation. Produced by Morgan Howard Communications. Designed by Mark Tolleshaug. Printed by Visions, Inc.
Paper is certified by the Rainforest Alliance for FSC standards.
20
15 S
EA
LA
SK
A A
NN
UA
L R
EP
OR
T
Please recycle
Remembering Sealaska Leaders Who Have Walked Into the Forest
IN MEMORY
ROBERT LOESCHER (1947–2015)
• SealaskaPresidentandCEO1997–2001
• ExecutiveVicePresident1989
• VicePresident1986–1989
• NaturalResources1979
Former Sealaska Directors (years served)
• JudsonL.Brown1974–1987
• CharlesCarlson1981–1993
• NilesCesar1987–1990
• LawrenceW.DaltonSr.1974–1978
• Robert“Jeff”DavidSr.1974–1979
• JosephDemmertJr.1983–2005
• L.EmbertDemmertSr.1985–1994
• RaymondQ.Demmert1978–1992
• Murlin“Mike”G.Everson1978–1981
• CyrilW.GeorgeSr.1972–1974
• LouisJ.Gloria1979–1988
• AndrewJohnHopeJr.1974–1991
• ClarenceM.JacksonSr.1972–2013(Emeritus)
• MarkJacobsJr.1972–1979
• GordonJamesSr.1988–2004
• LeonardKato1972–1976
• Richard“Dick”Kito1972–1983
• RogerJ.Lang1972–1987
• CharlesNelsonSr.1972–1974
• Dr.WalterA.Soboleff1980–1988
• RichardStittSr.1988–2004
• Dr.AlfredE.WidmarkSr.1985–1988
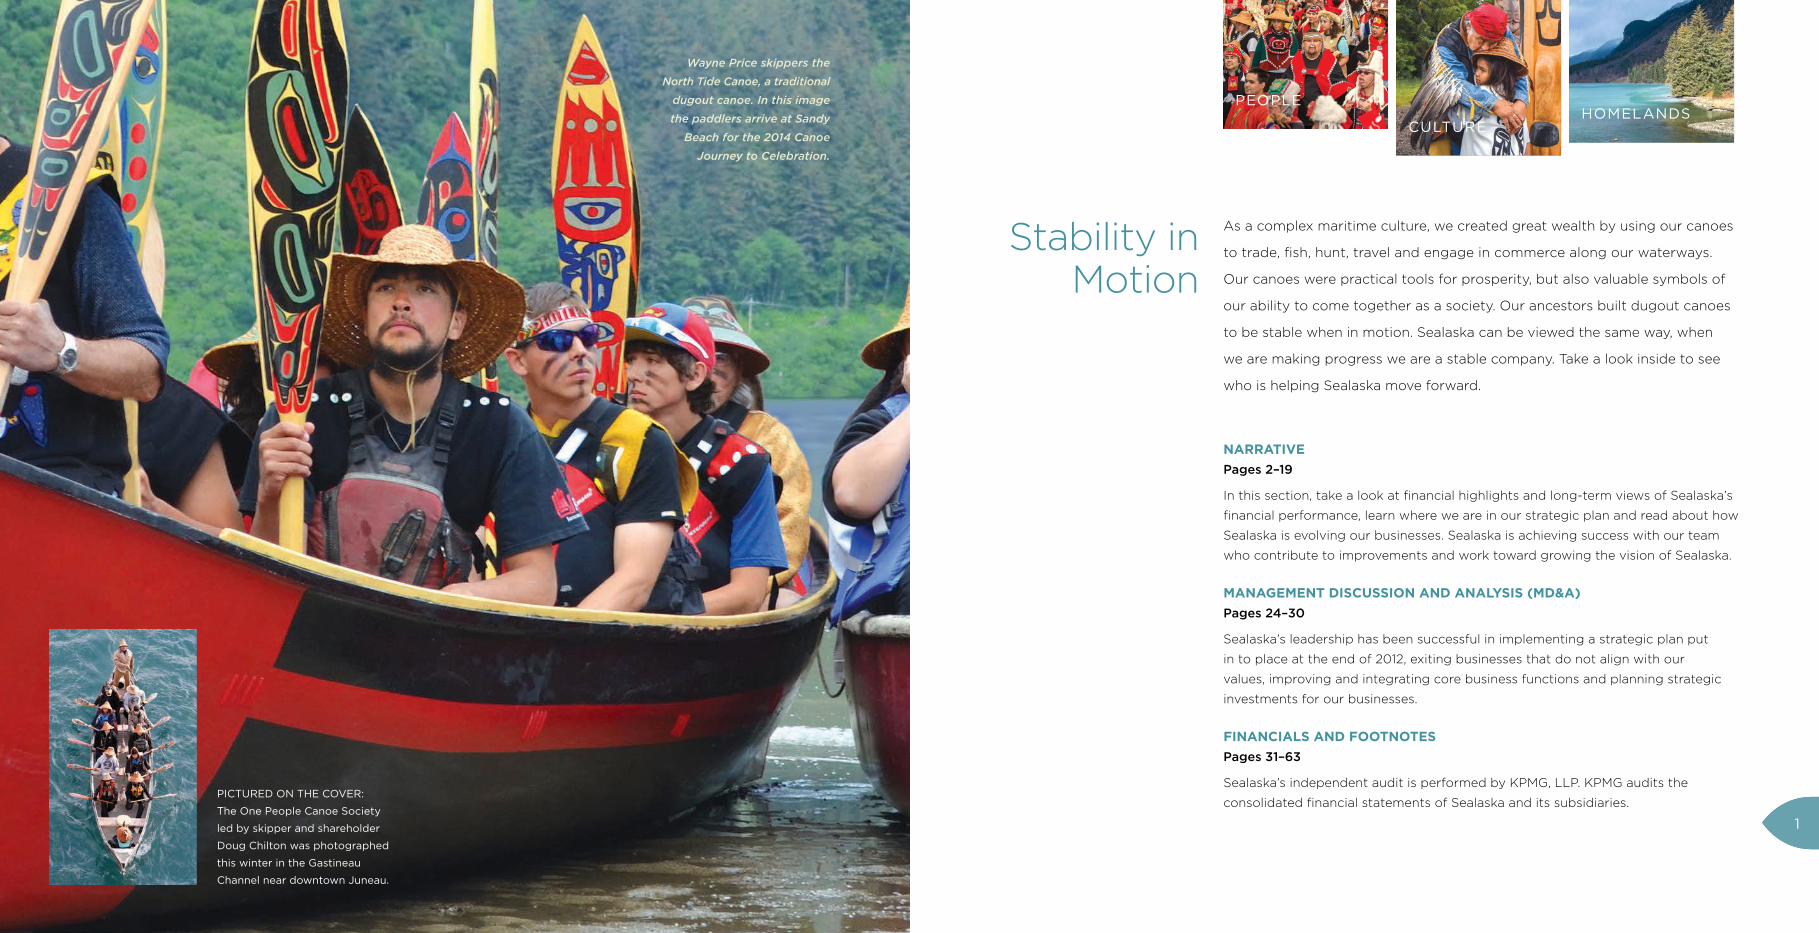
PICTURED ON THE COVER:
The One People Canoe Society
led by skipper and shareholder
Doug Chilton was photographed
this winter in the Gastineau
Channel near downtown Juneau.
Wayne Price skippers the
North Tide Canoe, a traditional
dugout canoe. In this image
the paddlers arrive at Sandy
Beach for the 2014 Canoe
Journey to Celebration.
NARRATIVE Pages 2–19
In this section, take a look at financial highlights and long-term views of Sealaska’s
financial performance, learn where we are in our strategic plan and read about how
Sealaska is evolving our businesses. Sealaska is achieving success with our team
who contribute to improvements and work toward growing the vision of Sealaska.
MANAGEMENT DISCUSSION AND ANALYSIS (MD&A)Pages 24–30
Sealaska’s leadership has been successful in implementing a strategic plan put
in to place at the end of 2012, exiting businesses that do not align with our
values, improving and integrating core business functions and planning strategic
investments for our businesses.
FINANCIALS AND FOOTNOTESPages 31–63
Sealaska’s independent audit is performed by KPMG, LLP. KPMG audits the
consolidated financial statements of Sealaska and its subsidiaries.
As a complex maritime culture, we created great wealth by using our canoes
to trade, fish, hunt, travel and engage in commerce along our waterways.
Our canoes were practical tools for prosperity, but also valuable symbols of
our ability to come together as a society. Our ancestors built dugout canoes
to be stable when in motion. Sealaska can be viewed the same way, when
we are making progress we are a stable company. Take a look inside to see
who is helping Sealaska move forward.
Stability in Motion
PEOPLE
CULTUREHOMELANDS
1
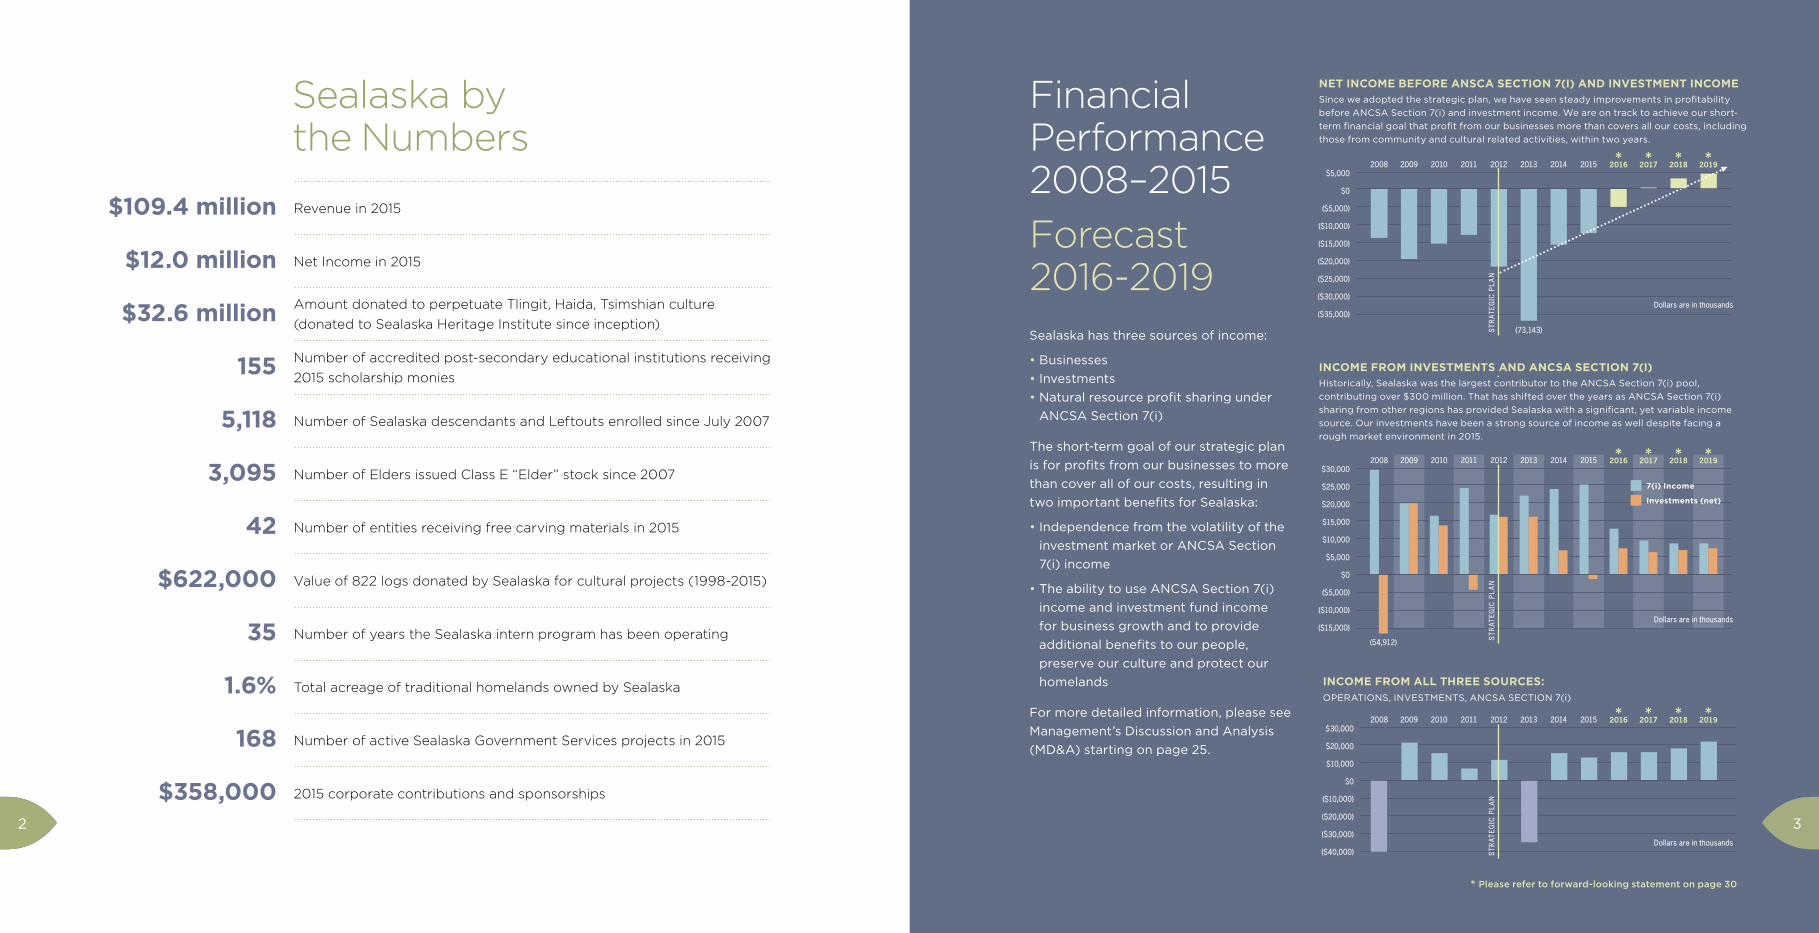
$109.4 million
$12.0 million
$32.6 million
155
5,118
3,095
42
$622,000
35
1.6%
168
$358,000
Revenue in 2015
Net Income in 2015
Amount donated to perpetuate Tlingit, Haida, Tsimshian culture
(donated to Sealaska Heritage Institute since inception)
Number of accredited post-secondary educational institutions receiving
2015 scholarship monies
Number of Sealaska descendants and Leftouts enrolled since July 2007
Number of Elders issued Class E “Elder” stock since 2007
Number of entities receiving free carving materials in 2015
Value of 822 logs donated by Sealaska for cultural projects (1998-2015)
Number of years the Sealaska intern program has been operating
Total acreage of traditional homelands owned by Sealaska
Number of active Sealaska Government Services projects in 2015
2015 corporate contributions and sponsorships
Sealaska by the Numbers
Financial Performance 2008–2015
Forecast 2016-2019Sealaska has three sources of income:
• Businesses
• Investments
• Natural resource profit sharing under
ANCSA Section 7(i)
The short-term goal of our strategic plan
is for profits from our businesses to more
than cover all of our costs, resulting in
two important benefits for Sealaska:
• Independence from the volatility of the
investment market or ANCSA Section
7(i) income
• The ability to use ANCSA Section 7(i)
income and investment fund income
for business growth and to provide
additional benefits to our people,
preserve our culture and protect our
homelands
For more detailed information, please see
Management’s Discussion and Analysis
(MD&A) starting on page 25.
NET INCOME BEFORE ANSCA SECTION 7(I) AND INVESTMENT INCOME Since we adopted the strategic plan, we have seen steady improvements in profitability
before ANCSA Section 7(i) and investment income. We are on track to achieve our short-
term financial goal that profit from our businesses more than covers all our costs, including
those from community and cultural related activities, within two years.
INCOME FROM ALL THREE SOURCES: OPERATIONS, INVESTMENTS, ANCSA SECTION 7(i)
(73,143)
$5,000
$0
($5,000)
($10,000)
($15,000)
($20,000)
($25,000)
($30,000)
($35,000)Dollars are in thousands
ST
RAT
EG
IC P
LA
N
* * *2008 2009 2010 2011 2012 2013 2014 2015 2016 2017 2018 2019*
$30,000
$20,000
$10,000
$0
($10,000)
($20,000)
($30,000)
($40,000)Dollars are in thousands
ST
RAT
EG
IC P
LA
N
* * *2008 2009 2010 2011 2012 2013 2014 2015 2016 2017 2018 2019*
INCOME FROM INVESTMENTS AND ANCSA SECTION 7(I)Historically, Sealaska was the largest contributor to the ANCSA Section 7(i) pool,
contributing over $300 million. That has shifted over the years as ANCSA Section 7(i)
sharing from other regions has provided Sealaska with a significant, yet variable income
source. Our investments have been a strong source of income as well despite facing a
rough market environment in 2015.
* Please refer to forward-looking statement on page 30
$30,000
$25,000
$20,000
$15,000
$10,000
$5,000
$0
($5,000)
($10,000)
($15,000)
7(i) Income
Investments (net)
(54,912)
Dollars are in thousands
ST
RAT
EG
IC P
LA
N
* * * *2008 2009 2010 2011 2012 2013 2014 2015 2016 2017 2018 2019
32
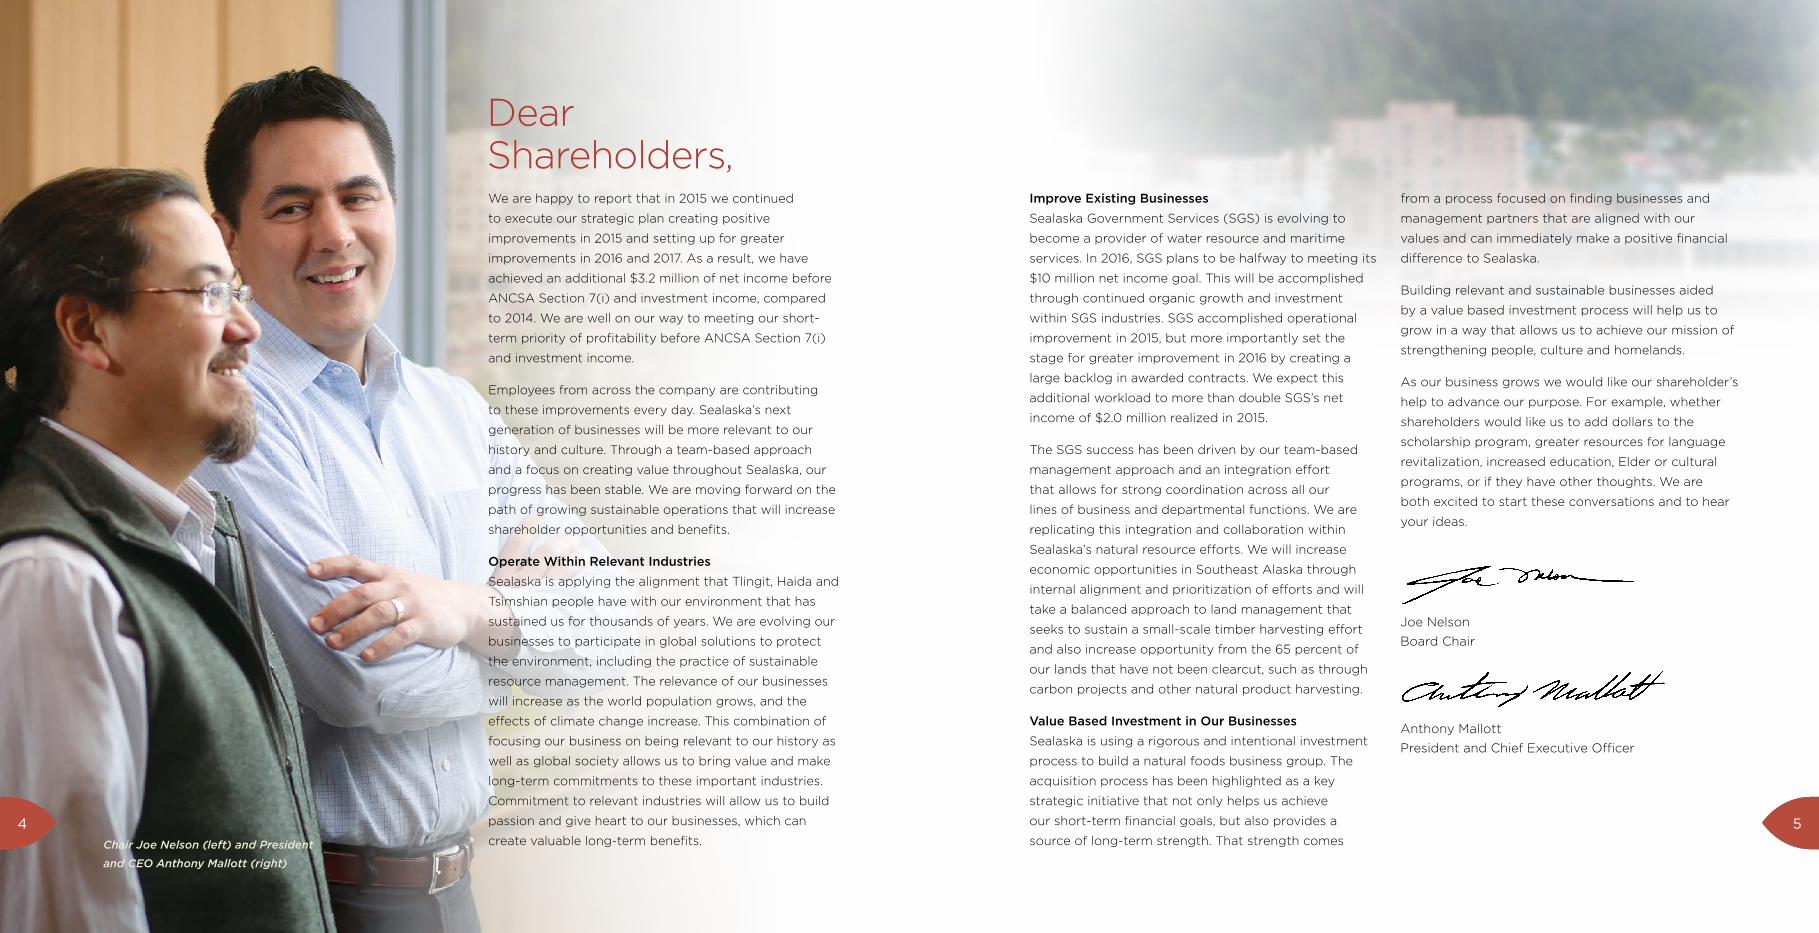
We are happy to report that in 2015 we continued
to execute our strategic plan creating positive
improvements in 2015 and setting up for greater
improvements in 2016 and 2017. As a result, we have
achieved an additional $3.2 million of net income before
ANCSA Section 7(i) and investment income, compared
to 2014. We are well on our way to meeting our short-
term priority of profitability before ANCSA Section 7(i)
and investment income.
Employees from across the company are contributing
to these improvements every day. Sealaska’s next
generation of businesses will be more relevant to our
history and culture. Through a team-based approach
and a focus on creating value throughout Sealaska, our
progress has been stable. We are moving forward on the
path of growing sustainable operations that will increase
shareholder opportunities and benefits.
Operate Within Relevant Industries
Sealaska is applying the alignment that Tlingit, Haida and
Tsimshian people have with our environment that has
sustained us for thousands of years. We are evolving our
businesses to participate in global solutions to protect
the environment, including the practice of sustainable
resource management. The relevance of our businesses
will increase as the world population grows, and the
effects of climate change increase. This combination of
focusing our business on being relevant to our history as
well as global society allows us to bring value and make
long-term commitments to these important industries.
Commitment to relevant industries will allow us to build
passion and give heart to our businesses, which can
create valuable long-term benefits.
DearShareholders,
Chair Joe Nelson (left) and President
and CEO Anthony Mallott (right)
Improve Existing Businesses
Sealaska Government Services (SGS) is evolving to
become a provider of water resource and maritime
services. In 2016, SGS plans to be halfway to meeting its
$10 million net income goal. This will be accomplished
through continued organic growth and investment
within SGS industries. SGS accomplished operational
improvement in 2015, but more importantly set the
stage for greater improvement in 2016 by creating a
large backlog in awarded contracts. We expect this
additional workload to more than double SGS’s net
income of $2.0 million realized in 2015.
The SGS success has been driven by our team-based
management approach and an integration effort
that allows for strong coordination across all our
lines of business and departmental functions. We are
replicating this integration and collaboration within
Sealaska’s natural resource efforts. We will increase
economic opportunities in Southeast Alaska through
internal alignment and prioritization of efforts and will
take a balanced approach to land management that
seeks to sustain a small-scale timber harvesting effort
and also increase opportunity from the 65 percent of
our lands that have not been clearcut, such as through
carbon projects and other natural product harvesting.
Value Based Investment in Our Businesses
Sealaska is using a rigorous and intentional investment
process to build a natural foods business group. The
acquisition process has been highlighted as a key
strategic initiative that not only helps us achieve
our short-term financial goals, but also provides a
source of long-term strength. That strength comes
from a process focused on finding businesses and
management partners that are aligned with our
values and can immediately make a positive financial
difference to Sealaska.
Building relevant and sustainable businesses aided
by a value based investment process will help us to
grow in a way that allows us to achieve our mission of
strengthening people, culture and homelands.
As our business grows we would like our shareholder’s
help to advance our purpose. For example, whether
shareholders would like us to add dollars to the
scholarship program, greater resources for language
revitalization, increased education, Elder or cultural
programs, or if they have other thoughts. We are
both excited to start these conversations and to hear
your ideas.
Joe Nelson
Board Chair
Anthony Mallott
President and Chief Executive Officer
54
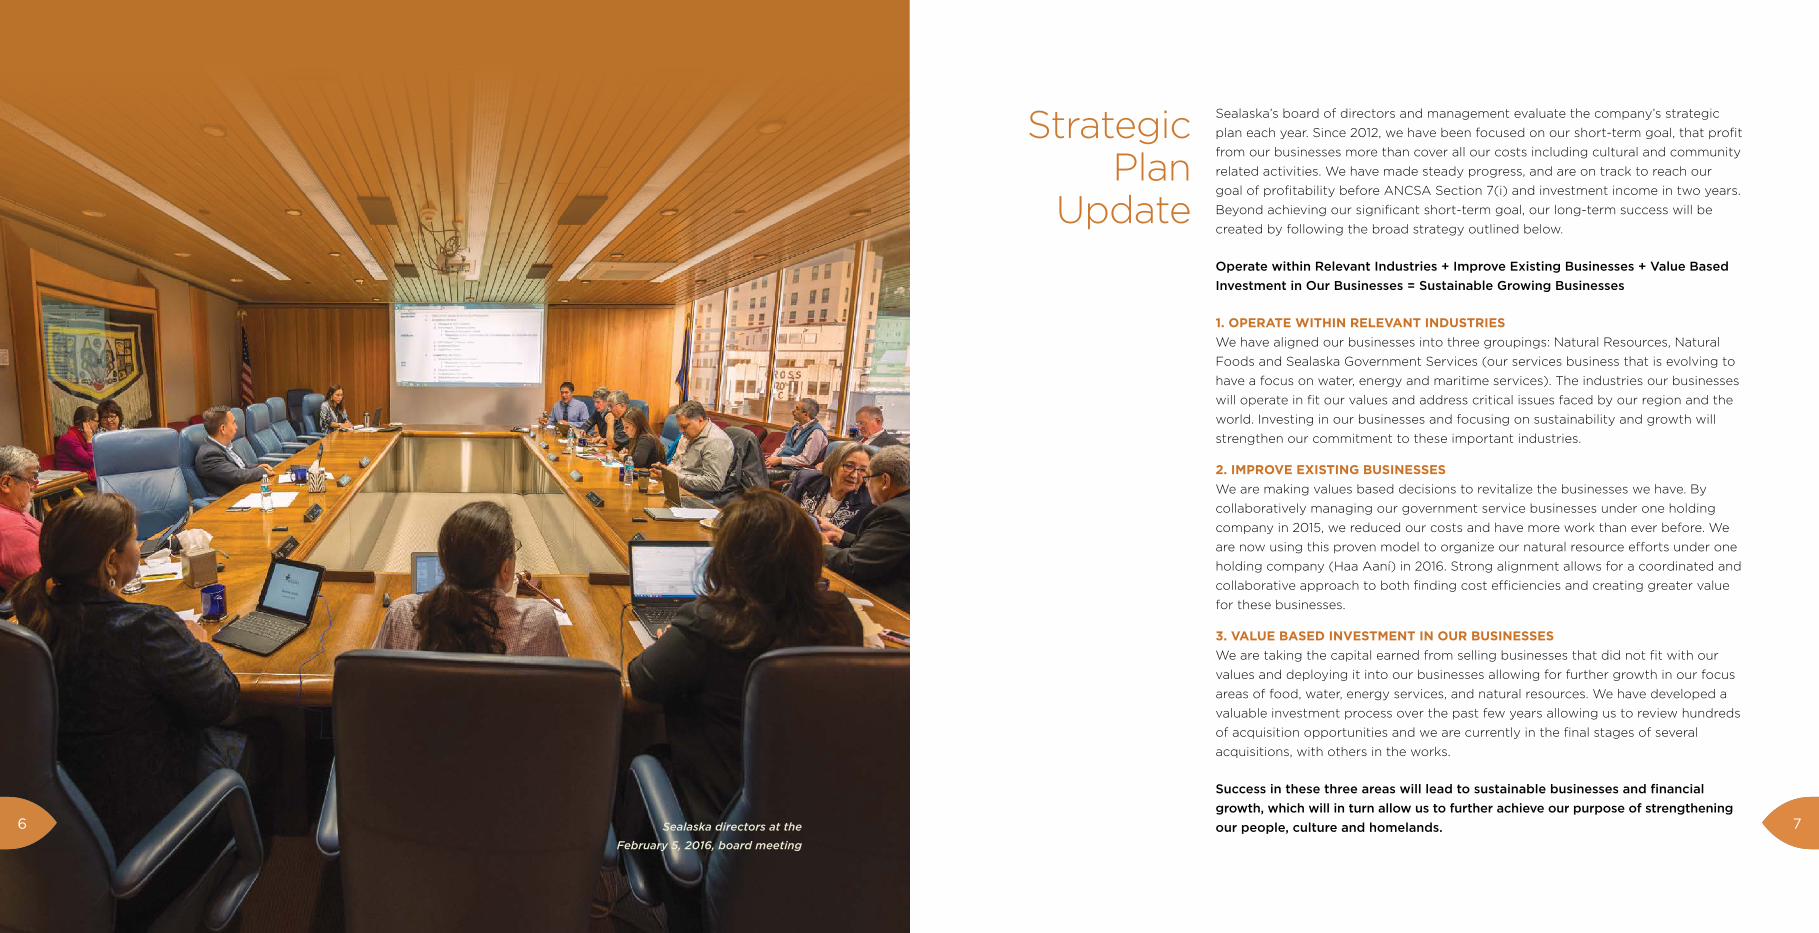
Sealaska directors at the
February 5, 2016, board meeting
Sealaska’s board of directors and management evaluate the company’s strategic
plan each year. Since 2012, we have been focused on our short-term goal, that profit
from our businesses more than cover all our costs including cultural and community
related activities. We have made steady progress, and are on track to reach our
goal of profitability before ANCSA Section 7(i) and investment income in two years.
Beyond achieving our significant short-term goal, our long-term success will be
created by following the broad strategy outlined below.
Operate within Relevant Industries + Improve Existing Businesses + Value Based
Investment in Our Businesses = Sustainable Growing Businesses
1. OPERATE WITHIN RELEVANT INDUSTRIES We have aligned our businesses into three groupings: Natural Resources, Natural
Foods and Sealaska Government Services (our services business that is evolving to
have a focus on water, energy and maritime services). The industries our businesses
will operate in fit our values and address critical issues faced by our region and the
world. Investing in our businesses and focusing on sustainability and growth will
strengthen our commitment to these important industries.
2. IMPROVE EXISTING BUSINESSES We are making values based decisions to revitalize the businesses we have. By
collaboratively managing our government service businesses under one holding
company in 2015, we reduced our costs and have more work than ever before. We
are now using this proven model to organize our natural resource efforts under one
holding company (Haa Aaní) in 2016. Strong alignment allows for a coordinated and
collaborative approach to both finding cost efficiencies and creating greater value
for these businesses.
3. VALUE BASED INVESTMENT IN OUR BUSINESSES We are taking the capital earned from selling businesses that did not fit with our
values and deploying it into our businesses allowing for further growth in our focus
areas of food, water, energy services, and natural resources. We have developed a
valuable investment process over the past few years allowing us to review hundreds
of acquisition opportunities and we are currently in the final stages of several
acquisitions, with others in the works.
Success in these three areas will lead to sustainable businesses and financial
growth, which will in turn allow us to further achieve our purpose of strengthening
our people, culture and homelands.
StrategicPlan
Update
76
Sealaska Government Services (SGS) is
the holding company that contains our
federal service businesses. SGS provides
management and administrative
functions such as accounting, human
resources and general business
development services. This streamlined
approach to management allows
our businesses to focus on providing
technical and operational services to
our clients while SGS provides general
and administrative functions common
to each business. Through better
economies of scale and quick and lean
communication this model saves time
and money, making SGS and Sealaska
more effective and efficient.
Sealaska’s values guided SGS to refocus
its business services on critical issues
including food, water and energy.
SGS consolidated its services into
three primary groups—environmental,
construction management and
information technology/data. These
services can improve water quality
and access, increase food security,
or improve energy generation and
transmission. These strategic niche
areas are examples of how Sealaska is
positioning itself for future growth.
SGS highlights from 2015 include:
Water-Based Services:
The US Army Corps of Engineers and
Sealaska Constructors (SeaCon)
• SeaCon is working on a contract with
the Army Corps of Engineers to build
a 4,000-ft levee to restore the salmon
habitat in the Qwuloolt Estuary in
Washington state. The Tulalip Tribes,
the Army Corps and many community
partners have been working on this
project for more than two decades.
• SeaCon completed a National Park
Service contract to demolish several
boulders in Glines Canyon, below the
former Elwha Dam in Washington state.
With the boulders gone, salmon can
swim freely upstream, which improves
the overall ecosystem of the river.
The Elwha River once had one of
the largest Chinook runs in the US
and the restoration of this salmon and
trout habitat has key significance for
Native people.
Data Management and Analytics:
Bureau of Indian Affairs and Managed
Business Solutions (MBS)
• MBS won a competitive, five-year, $50
million contract to provide geospatial
mapping development and support
services—editing, storing, analyzing and
displaying geographic information—to
help tribes make real-time decisions to
sustainably manage their Native lands.
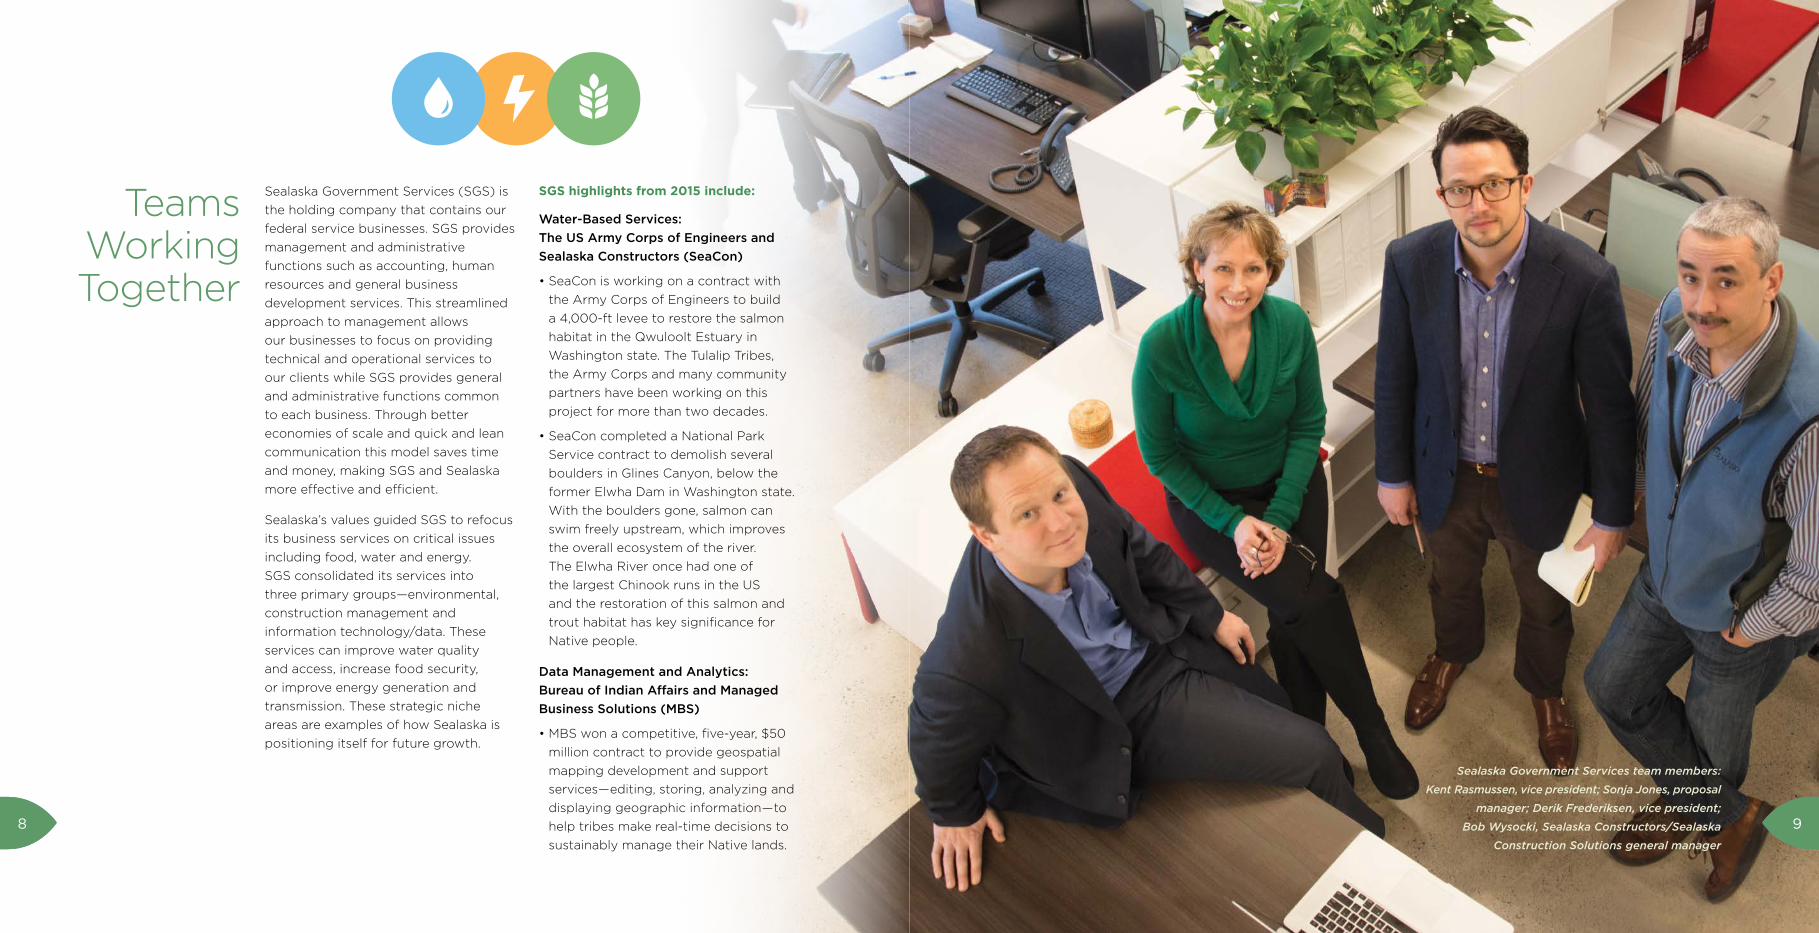
TeamsWorking Together
Sealaska Government Services team members:
Kent Rasmussen, vice president; Sonja Jones, proposal
manager; Derik Frederiksen, vice president;
Bob Wysocki, Sealaska Constructors/Sealaska
Construction Solutions general manager
98
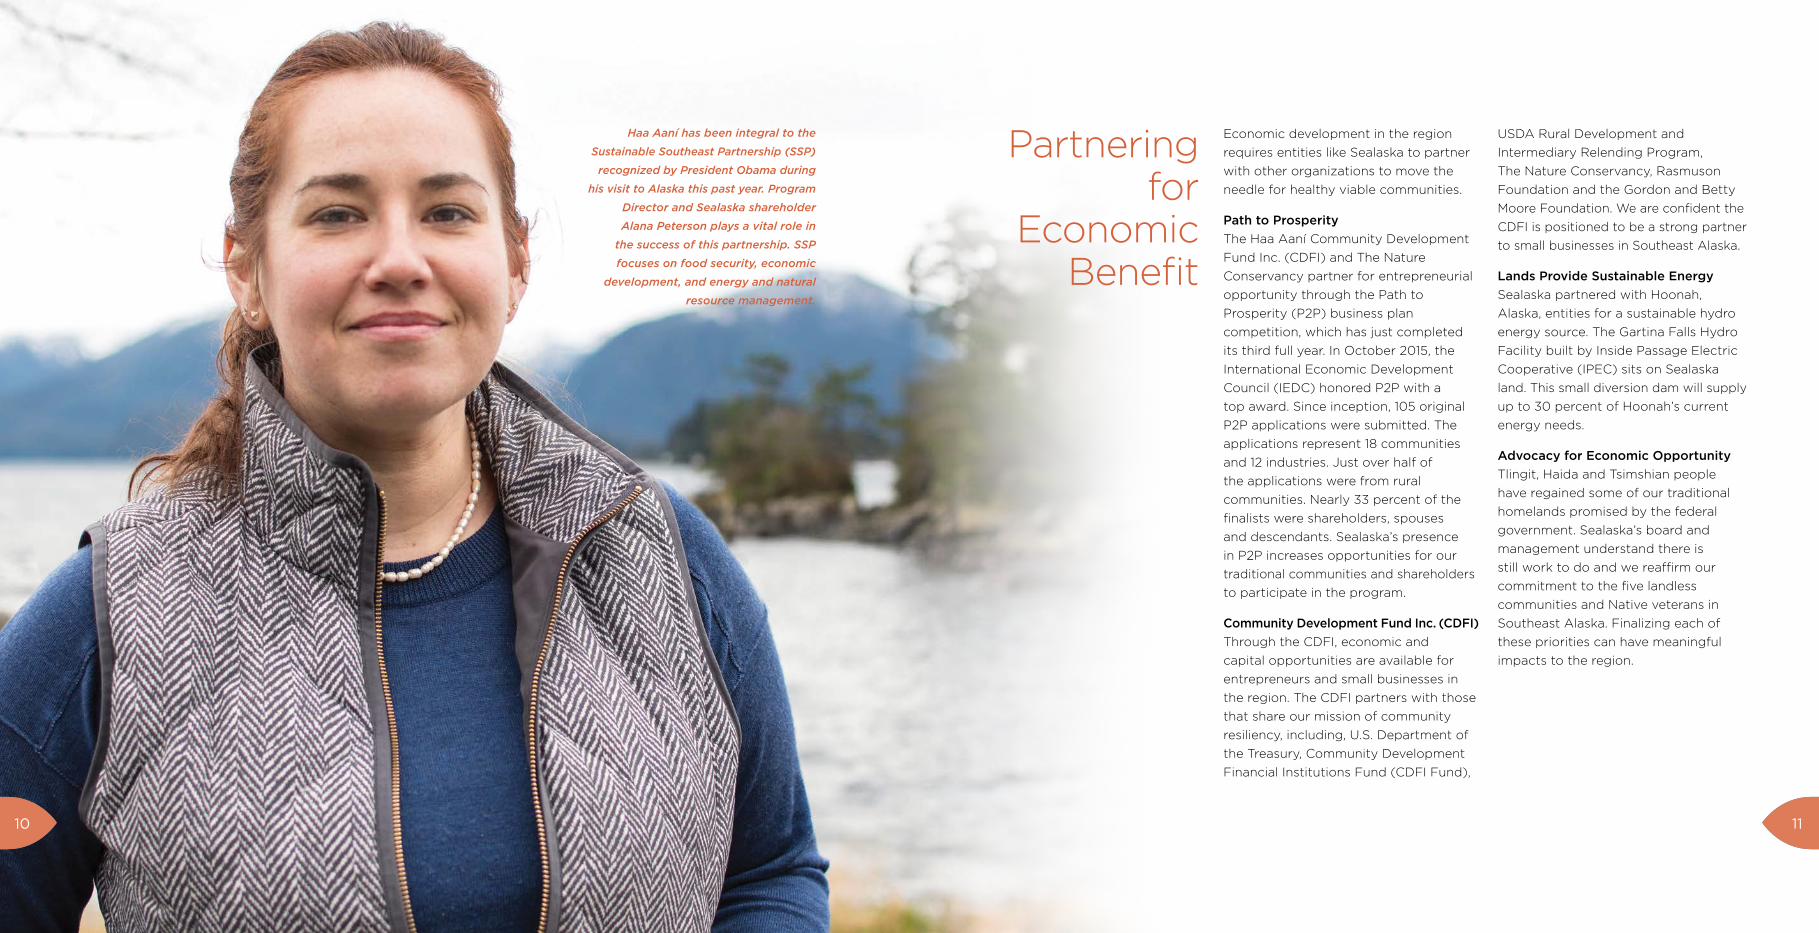
Haa Aaní has been integral to the
Sustainable Southeast Partnership (SSP)
recognized by President Obama during
his visit to Alaska this past year. Program
Director and Sealaska shareholder
Alana Peterson plays a vital role in
the success of this partnership. SSP
focuses on food security, economic
development, and energy and natural
resource management.
Economic development in the region
requires entities like Sealaska to partner
with other organizations to move the
needle for healthy viable communities.
Path to Prosperity
The Haa Aaní Community Development
Fund Inc. (CDFI) and The Nature
Conservancy partner for entrepreneurial
opportunity through the Path to
Prosperity (P2P) business plan
competition, which has just completed
its third full year. In October 2015, the
International Economic Development
Council (IEDC) honored P2P with a
top award. Since inception, 105 original
P2P applications were submitted. The
applications represent 18 communities
and 12 industries. Just over half of
the applications were from rural
communities. Nearly 33 percent of the
finalists were shareholders, spouses
and descendants. Sealaska’s presence
in P2P increases opportunities for our
traditional communities and shareholders
to participate in the program.
Community Development Fund Inc. (CDFI)
Through the CDFI, economic and
capital opportunities are available for
entrepreneurs and small businesses in
the region. The CDFI partners with those
that share our mission of community
resiliency, including, U.S. Department of
the Treasury, Community Development
Financial Institutions Fund (CDFI Fund),
USDA Rural Development and
Intermediary Relending Program,
The Nature Conservancy, Rasmuson
Foundation and the Gordon and Betty
Moore Foundation. We are confident the
CDFI is positioned to be a strong partner
to small businesses in Southeast Alaska.
Lands Provide Sustainable Energy
Sealaska partnered with Hoonah,
Alaska, entities for a sustainable hydro
energy source. The Gartina Falls Hydro
Facility built by Inside Passage Electric
Cooperative (IPEC) sits on Sealaska
land. This small diversion dam will supply
up to 30 percent of Hoonah’s current
energy needs.
Advocacy for Economic Opportunity
Tlingit, Haida and Tsimshian people
have regained some of our traditional
homelands promised by the federal
government. Sealaska’s board and
management understand there is
still work to do and we reaffirm our
commitment to the five landless
communities and Native veterans in
Southeast Alaska. Finalizing each of
these priorities can have meaningful
impacts to the region.
Partnering for
Economic Benefit
1110
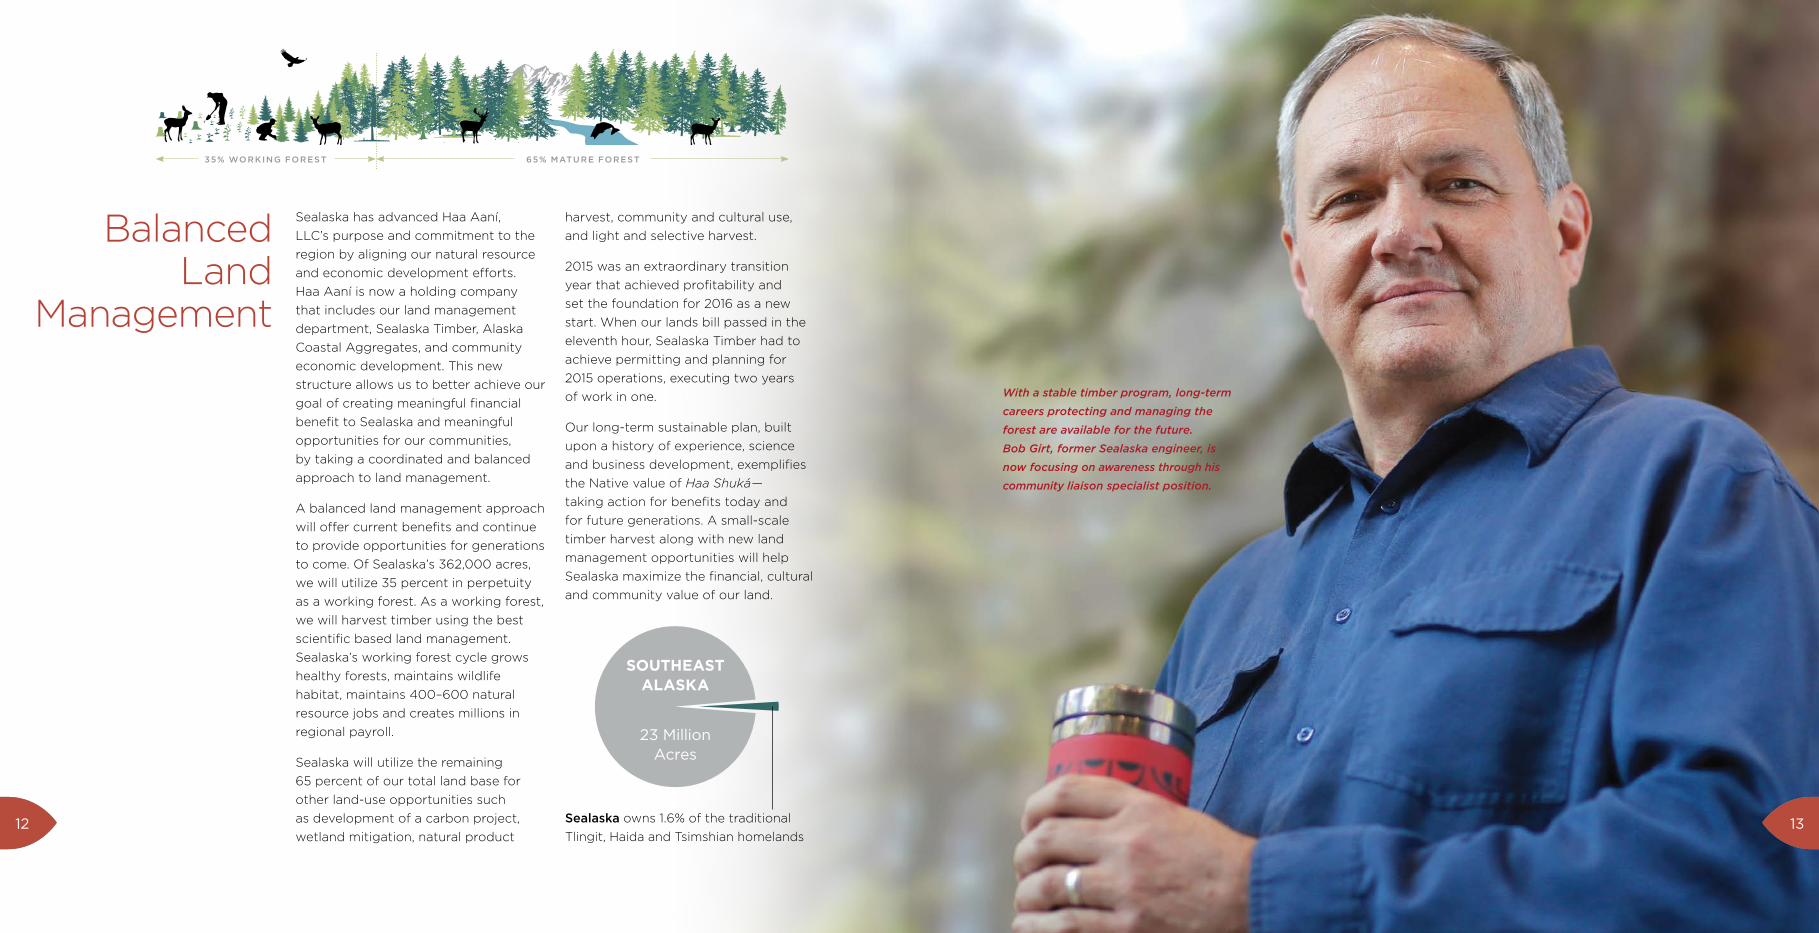
65% MATURE FOREST35% WORKING FOREST
s
Sealaska has advanced Haa Aaní,
LLC’s purpose and commitment to the
region by aligning our natural resource
and economic development efforts.
Haa Aaní is now a holding company
that includes our land management
department, Sealaska Timber, Alaska
Coastal Aggregates, and community
economic development. This new
structure allows us to better achieve our
goal of creating meaningful financial
benefit to Sealaska and meaningful
opportunities for our communities,
by taking a coordinated and balanced
approach to land management.
A balanced land management approach
will offer current benefits and continue
to provide opportunities for generations
to come. Of Sealaska’s 362,000 acres,
we will utilize 35 percent in perpetuity
as a working forest. As a working forest,
we will harvest timber using the best
scientific based land management.
Sealaska’s working forest cycle grows
healthy forests, maintains wildlife
habitat, maintains 400–600 natural
resource jobs and creates millions in
regional payroll.
Sealaska will utilize the remaining
65 percent of our total land base for
other land-use opportunities such
as development of a carbon project,
wetland mitigation, natural product
harvest, community and cultural use,
and light and selective harvest.
2015 was an extraordinary transition
year that achieved profitability and
set the foundation for 2016 as a new
start. When our lands bill passed in the
eleventh hour, Sealaska Timber had to
achieve permitting and planning for
2015 operations, executing two years
of work in one.
Our long-term sustainable plan, built
upon a history of experience, science
and business development, exemplifies
the Native value of Haa Shuká—
taking action for benefits today and
for future generations. A small-scale
timber harvest along with new land
management opportunities will help
Sealaska maximize the financial, cultural
and community value of our land.
Balanced Land
Management
Sealaska owns 1.6% of the traditional
Tlingit, Haida and Tsimshian homelands
SOUTHEASTALASKA
23 MillionAcres
With a stable timber program, long-term
careers protecting and managing the
forest are available for the future.
Bob Girt, former Sealaska engineer, is
now focusing on awareness through his
community liaison specialist position.
1312
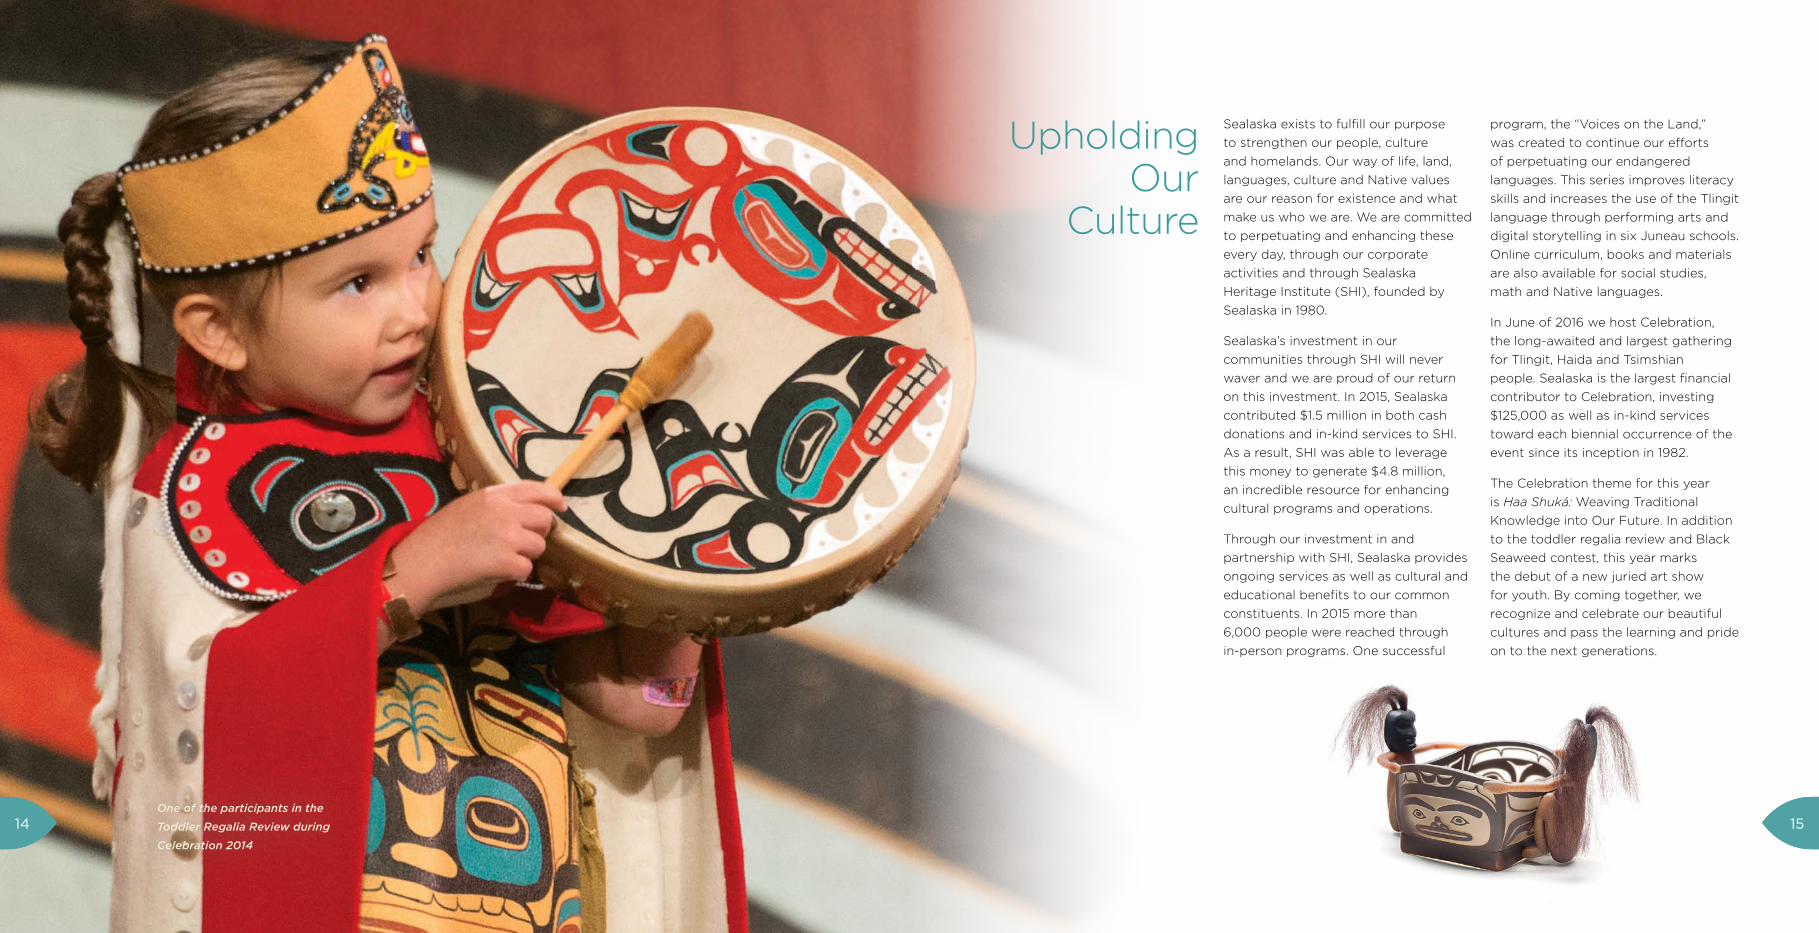
One of the participants in the
Toddler Regalia Review during
Celebration 2014
Sealaska exists to fulfill our purpose
to strengthen our people, culture
and homelands. Our way of life, land,
languages, culture and Native values
are our reason for existence and what
make us who we are. We are committed
to perpetuating and enhancing these
every day, through our corporate
activities and through Sealaska
Heritage Institute (SHI), founded by
Sealaska in 1980.
Sealaska’s investment in our
communities through SHI will never
waver and we are proud of our return
on this investment. In 2015, Sealaska
contributed $1.5 million in both cash
donations and in-kind services to SHI.
As a result, SHI was able to leverage
this money to generate $4.8 million,
an incredible resource for enhancing
cultural programs and operations.
Through our investment in and
partnership with SHI, Sealaska provides
ongoing services as well as cultural and
educational benefits to our common
constituents. In 2015 more than
6,000 people were reached through
in-person programs. One successful
program, the “Voices on the Land,”
was created to continue our efforts
of perpetuating our endangered
languages. This series improves literacy
skills and increases the use of the Tlingit
language through performing arts and
digital storytelling in six Juneau schools.
Online curriculum, books and materials
are also available for social studies,
math and Native languages.
In June of 2016 we host Celebration,
the long-awaited and largest gathering
for Tlingit, Haida and Tsimshian
people. Sealaska is the largest financial
contributor to Celebration, investing
$125,000 as well as in-kind services
toward each biennial occurrence of the
event since its inception in 1982.
The Celebration theme for this year
is Haa Shuká: Weaving Traditional
Knowledge into Our Future. In addition
to the toddler regalia review and Black
Seaweed contest, this year marks
the debut of a new juried art show
for youth. By coming together, we
recognize and celebrate our beautiful
cultures and pass the learning and pride
on to the next generations.
UpholdingOur
Culture
1514
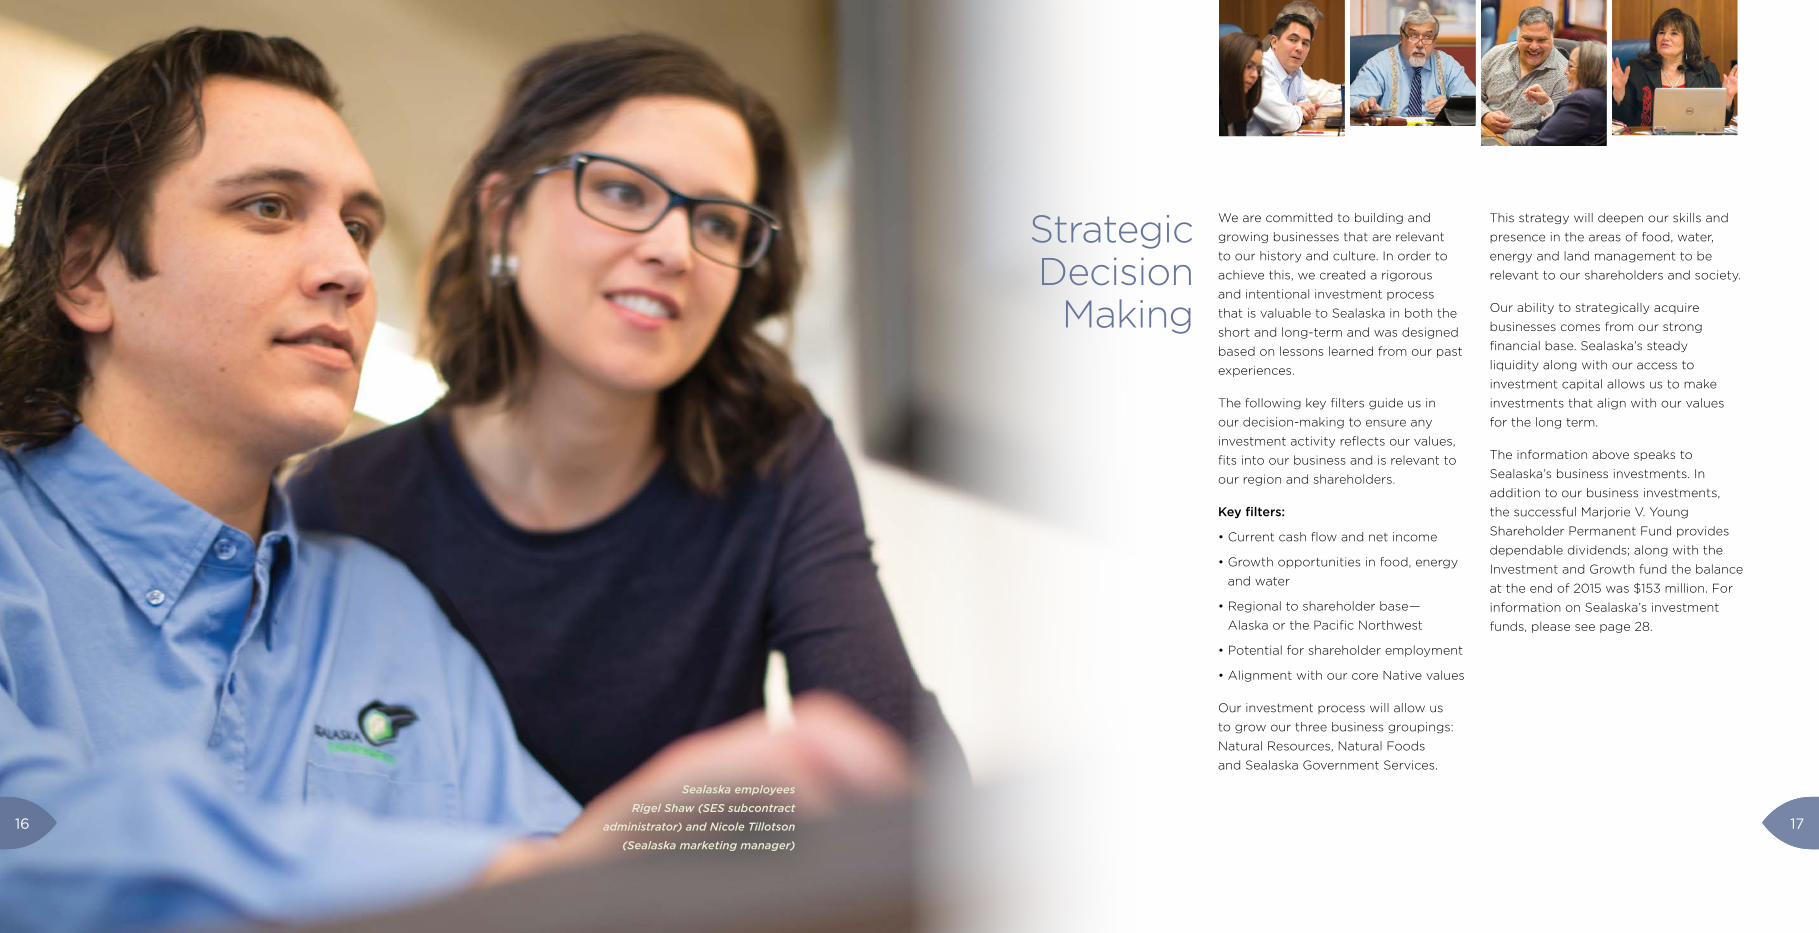
Sealaska employees
Rigel Shaw (SES subcontract
administrator) and Nicole Tillotson
(Sealaska marketing manager)
StrategicDecision
Making
We are committed to building and
growing businesses that are relevant
to our history and culture. In order to
achieve this, we created a rigorous
and intentional investment process
that is valuable to Sealaska in both the
short and long-term and was designed
based on lessons learned from our past
experiences.
The following key filters guide us in
our decision-making to ensure any
investment activity reflects our values,
fits into our business and is relevant to
our region and shareholders.
Key filters:
• Current cash flow and net income
• Growth opportunities in food, energy
and water
• Regional to shareholder base—
Alaska or the Pacific Northwest
• Potential for shareholder employment
• Alignment with our core Native values
Our investment process will allow us
to grow our three business groupings:
Natural Resources, Natural Foods
and Sealaska Government Services.
This strategy will deepen our skills and
presence in the areas of food, water,
energy and land management to be
relevant to our shareholders and society.
Our ability to strategically acquire
businesses comes from our strong
financial base. Sealaska’s steady
liquidity along with our access to
investment capital allows us to make
investments that align with our values
for the long term.
The information above speaks to
Sealaska’s business investments. In
addition to our business investments,
the successful Marjorie V. Young
Shareholder Permanent Fund provides
dependable dividends; along with the
Investment and Growth fund the balance
at the end of 2015 was $153 million. For
information on Sealaska’s investment
funds, please see page 28.
1716
Unlike typical for-profit companies,
Sealaska considers and plans for
shareholder benefits. A typical
corporation benefits its shareholders in
two ways: (1) by increasing stock value;
(2) distribution payments.
Sealaska provides a range of benefits to
our shareholder base. Every dollar we
make benefits shareholders. The board
and management are mandated by
ANCSA to create strong and sustainable
operations to advance our purpose
of strengthening people, culture and
homelands.
Sealaska is built by and for its Native
shareholders for the benefit of current
and future generations.
Workforce Development
We view our shareholder talent as our
key to success. As of January 2016,
Sealaska and its businesses have 132
active employees.
With a sustainable timber program,
Sealaska is looking for and ready to
train shareholders and their families for
careers within the forest.
Sealaska supports learning activities such
as Latseen leadership camps in Juneau,
Alaska, or Sockeye science camp in
Seattle, Washington.
As shareholders and descendants
graduate from high school, they may be
eligible for yearly scholarships or summer
internships at Sealaska headquarters and
businesses.
Valuable experience can also be gained
by serving as a board youth advisor.
Benefits Beyond Dividends
Sealaska joined the Hoonah Native Forest
Partnership (HNFP), a science-based,
community forest approach to watershed
planning with a focus on workforce
development. Several shareholder
jobs have been created, including an
internship for Michaela Demmert this
summer in the Sealaska office.
The Elders Settlement Trust continues to
provide monetary benefit to our Elders
as they reach age 65. Since inception,
the trust has paid out more than $11
million to our Elders. Since 1998 Sealaska
has donated more than 800 logs to
regional clans, Native organizations and
communities. These donations support
and advance cultural projects and uphold
our purpose to strengthen people, culture
and homelands.
Sealaska is a thought leader in the
Alaska Native community and at home
in Southeast Alaska. Our leadership
advocates for many issues important
to shareholders, from landless claims
to language recognition and
subsistence issues.
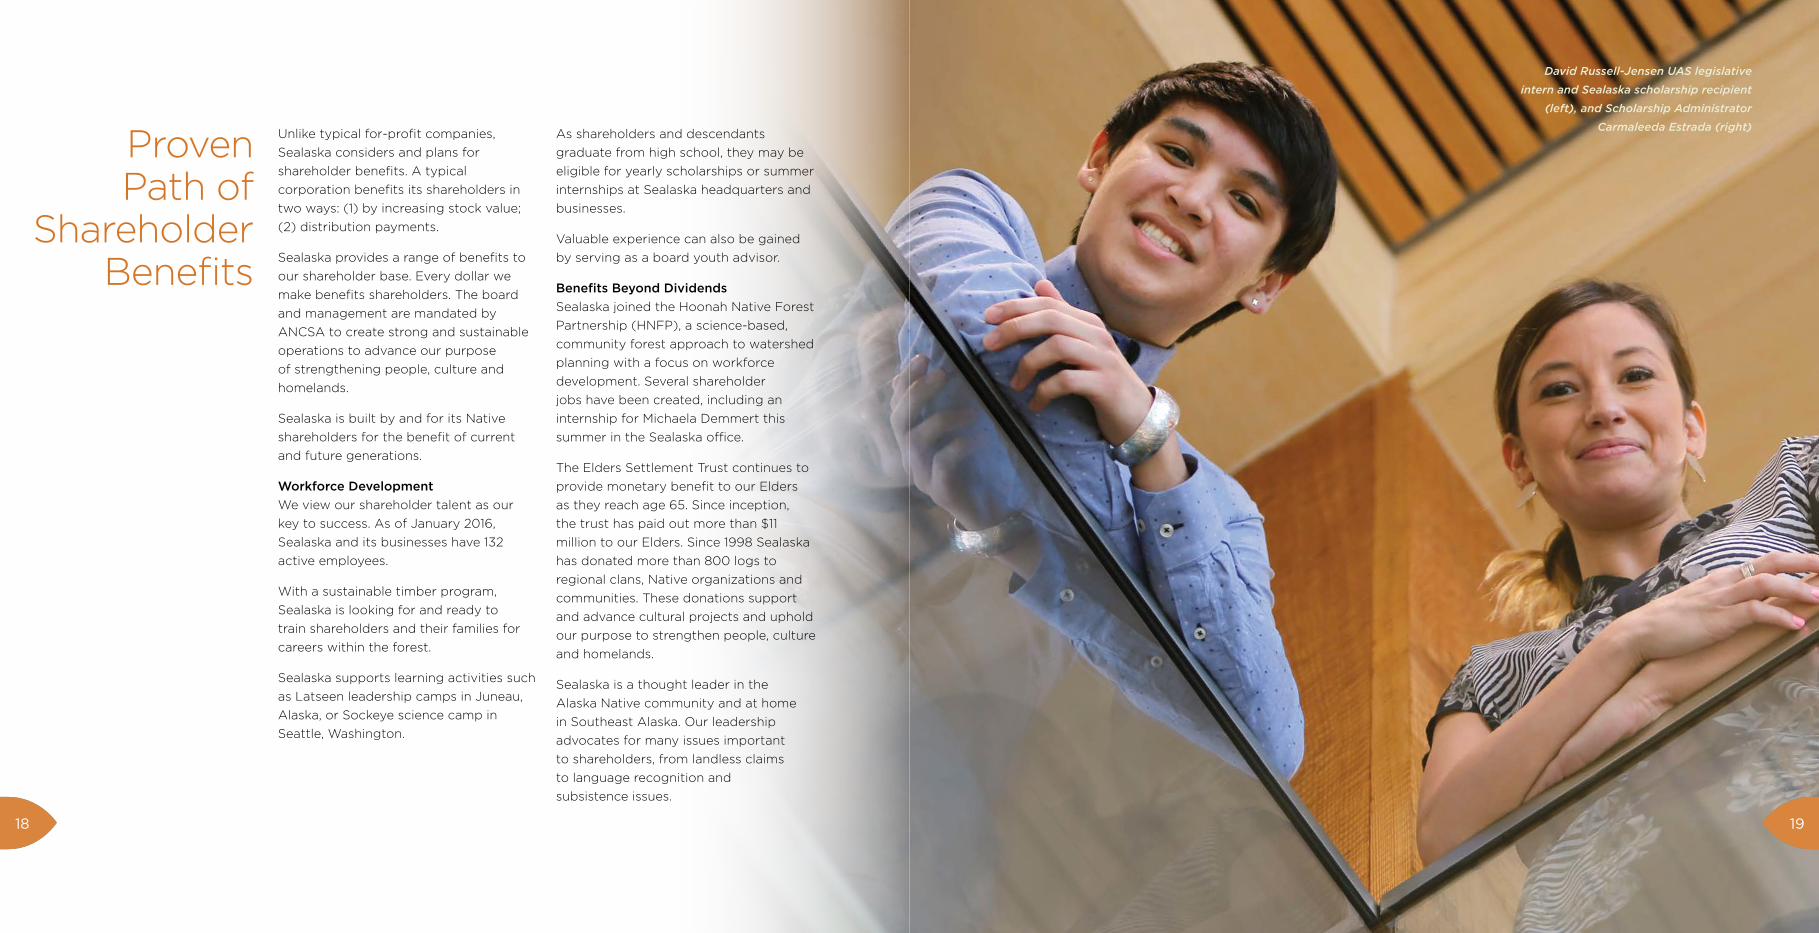
Proven Path of
Shareholder Benefits
David Russell-Jensen UAS legislative
intern and Sealaska scholarship recipient
(left), and Scholarship Administrator
Carmaleeda Estrada (right)
1918
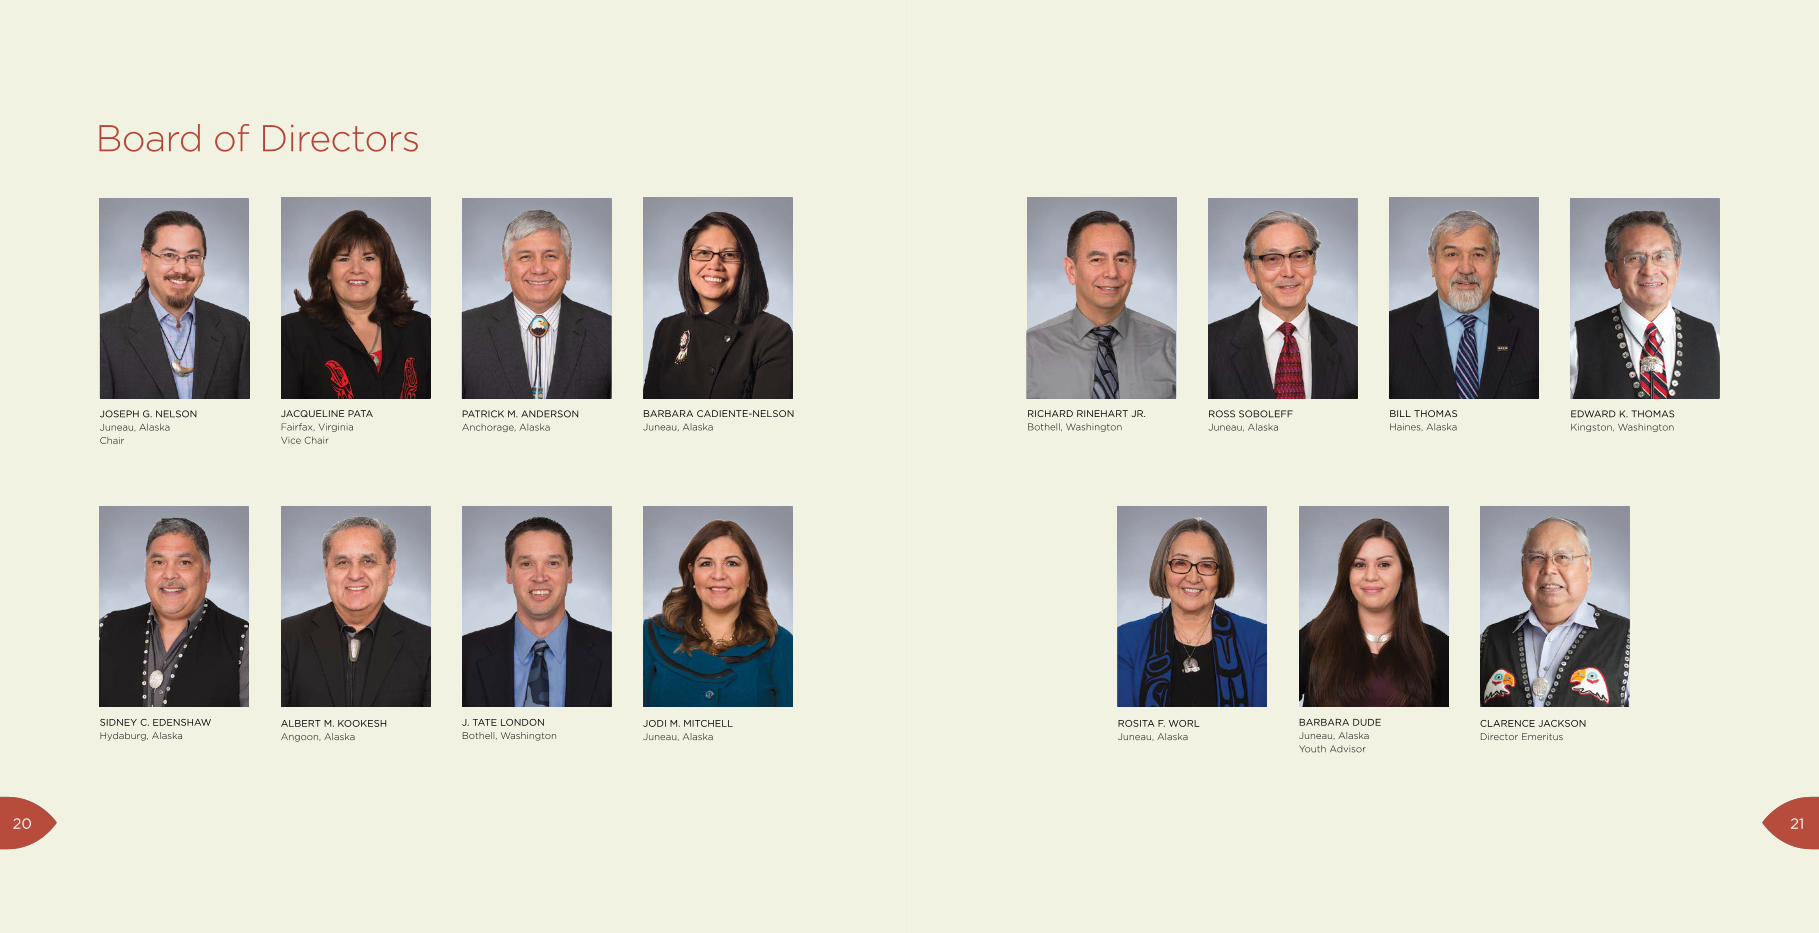
Board of Directors
JACQUELINE PATA
Fairfax, Virginia
Vice Chair
JOSEPH G. NELSON
Juneau, Alaska
Chair
PATRICK M. ANDERSON
Anchorage, Alaska
BARBARA CADIENTE-NELSON
Juneau, Alaska
J. TATE LONDON
Bothell, WashingtonALBERT M. KOOKESH
Angoon, Alaska
JODI M. MITCHELL
Juneau, Alaska
SIDNEY C. EDENSHAW
Hydaburg, Alaska
BILL THOMAS
Haines, Alaska
EDWARD K. THOMAS
Kingston, Washington
ROSS SOBOLEFF
Juneau, Alaska
RICHARD RINEHART JR.
Bothell, Washington
BARBARA DUDE
Juneau, Alaska
Youth Advisor
CLARENCE JACKSON
Director Emeritus
ROSITA F. WORL
Juneau, Alaska
2120
Management
DERIK FREDERIKSEN
Vice President,
Sealaska Government Services
ED DAVIS
Director, Haa Aaní
Economic Development
LESLIE FROST
Chief Financial Officer,
Sealaska Government Services
BILL BENNETT
General Manager,
Alaska Coastal Aggregates
JAELEEN ARAUJO
Vice President General Counsel
and Corporate Secretary
ANTHONY MALLOTT
President and
Chief Executive Officer
TERRY DOWNES
Chief Operating Officer
DOUG MORRIS
Vice President and
Chief Financial Officer
DUANE WOODRUFF
Vice President,
Sealaska Timber Corporation
BOB WYSOCKI
General Manager,
Sealaska Construction Solutions
and Sealaska Constructors
KENT RASMUSSEN
Vice President,
Sealaska Government Services
PETER McCORMICK
General Manager,
Sealaska Environmental Services
RICH MAINWARING
General Manager,
Managed Business Solutions
DAVID KOSTOROWSKI
General Manager,
Sealaska Technical Services
SONJA L. JONES
Proposal Manager,
Sealaska Government Services
2322
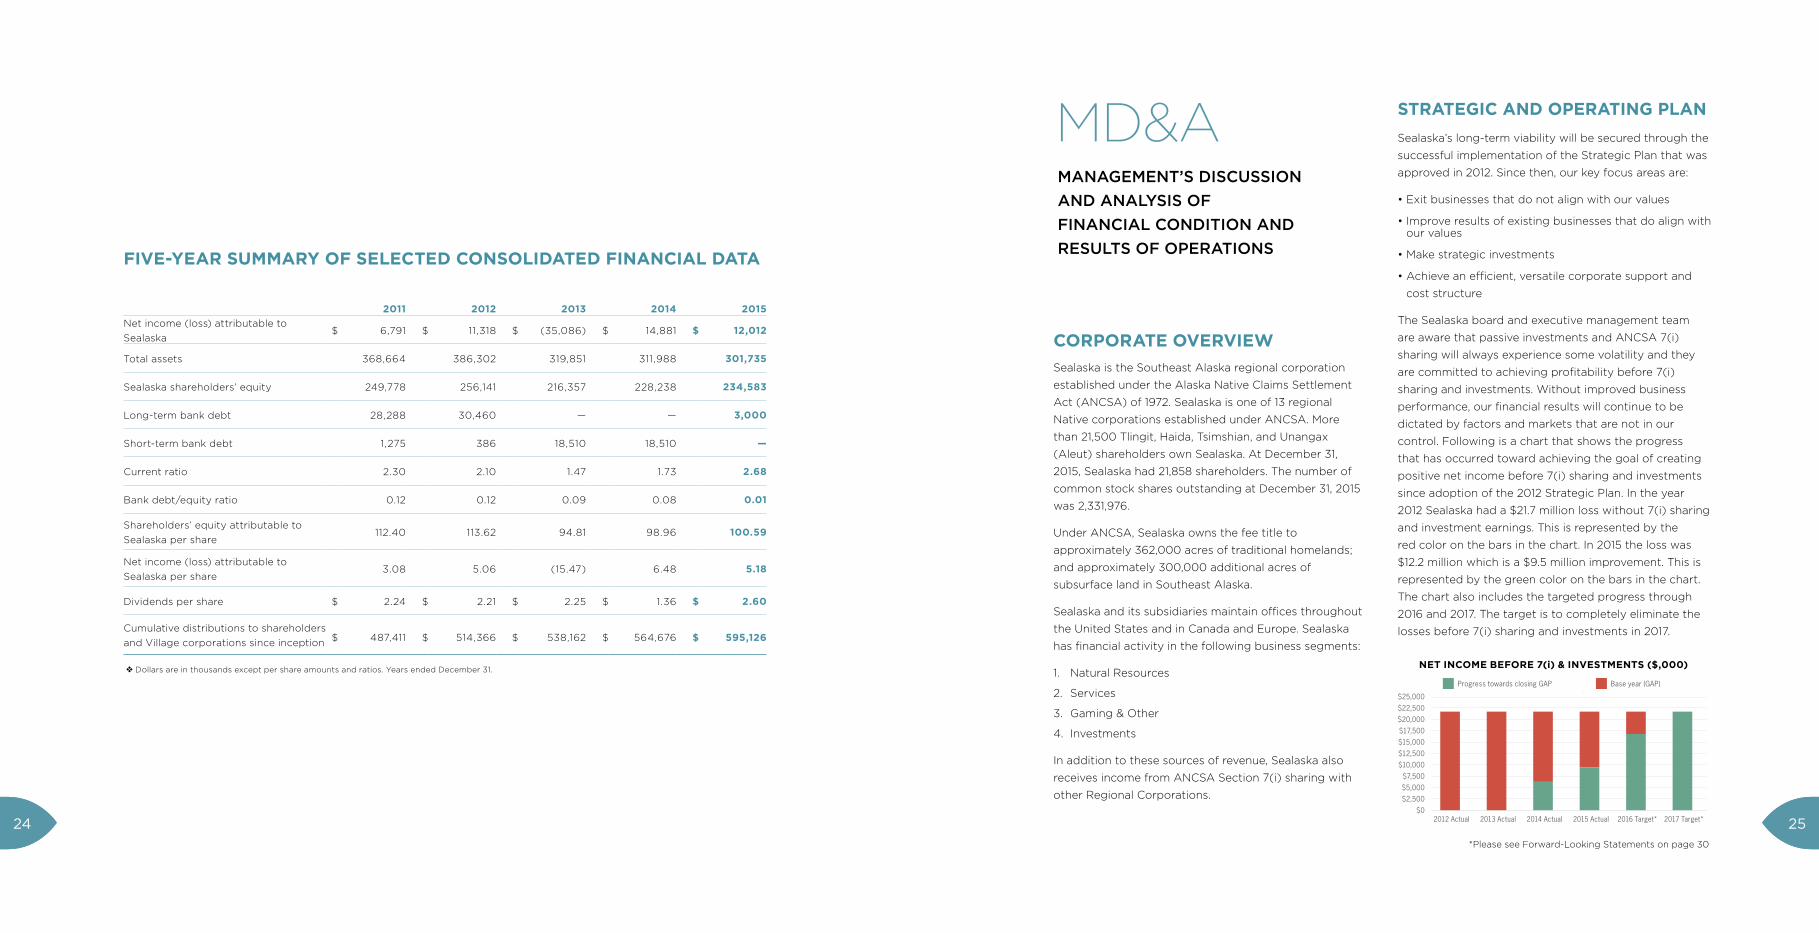
FIVE-YEAR SUMMARY OF SELECTED CONSOLIDATED FINANCIAL DATA
2011 2012 2013 2014 2015Net income (loss) attributable to
Sealaska$ 6,791 $ 11,318 $ (35,086) $ 14,881 $ 12,012
Total assets 368,664 386,302 319,851 311,988 301,735
Sealaska shareholders’ equity 249,778 256,141 216,357 228,238 234,583
Long-term bank debt 28,288 30,460 — — 3,000
Short-term bank debt 1,275 386 18,510 18,510 —
Current ratio 2.30 2.10 1.47 1.73 2.68
Bank debt/equity ratio 0.12 0.12 0.09 0.08 0.01
Shareholders’ equity attributable to
Sealaska per share 112.40 113.62 94.81 98.96 100.59
Net income (loss) attributable to
Sealaska per share 3.08 5.06 (15.47) 6.48 5.18
Dividends per share $ 2.24 $ 2.21 $ 2.25 $ 1.36 $ 2.60
Cumulative distributions to shareholders
and Village corporations since inception $ 487,411 $ 514,366 $ 538,162 $ 564,676 $ 595,126
❖ Dollars are in thousands except per share amounts and ratios. Years ended December 31.
CORPORATE OVERVIEWSealaska is the Southeast Alaska regional corporation
established under the Alaska Native Claims Settlement
Act (ANCSA) of 1972. Sealaska is one of 13 regional
Native corporations established under ANCSA. More
than 21,500 Tlingit, Haida, Tsimshian, and Unangax
(Aleut) shareholders own Sealaska. At December 31,
2015, Sealaska had 21,858 shareholders. The number of
common stock shares outstanding at December 31, 2015
was 2,331,976.
Under ANCSA, Sealaska owns the fee title to
approximately 362,000 acres of traditional homelands;
and approximately 300,000 additional acres of
subsurface land in Southeast Alaska.
Sealaska and its subsidiaries maintain offices throughout
the United States and in Canada and Europe. Sealaska
has financial activity in the following business segments:
1. Natural Resources
2. Services
3. Gaming & Other
4. Investments
In addition to these sources of revenue, Sealaska also
receives income from ANCSA Section 7(i) sharing with
other Regional Corporations.
STRATEGIC AND OPERATING PLAN Sealaska’s long-term viability will be secured through the
successful implementation of the Strategic Plan that was
approved in 2012. Since then, our key focus areas are:
• Exit businesses that do not align with our values
• Improve results of existing businesses that do align with our values
• Make strategic investments
• Achieve an efficient, versatile corporate support and
cost structure
The Sealaska board and executive management team
are aware that passive investments and ANCSA 7(i)
sharing will always experience some volatility and they
are committed to achieving profitability before 7(i)
sharing and investments. Without improved business
performance, our financial results will continue to be
dictated by factors and markets that are not in our
control. Following is a chart that shows the progress
that has occurred toward achieving the goal of creating
positive net income before 7(i) sharing and investments
since adoption of the 2012 Strategic Plan. In the year
2012 Sealaska had a $21.7 million loss without 7(i) sharing
and investment earnings. This is represented by the
red color on the bars in the chart. In 2015 the loss was
$12.2 million which is a $9.5 million improvement. This is
represented by the green color on the bars in the chart.
The chart also includes the targeted progress through
2016 and 2017. The target is to completely eliminate the
losses before 7(i) sharing and investments in 2017.
MANAGEMENT’S DISCUSSION
AND ANALYSIS OF
FINANCIAL CONDITION AND
RESULTS OF OPERATIONS
MD&A
$25,000
$22,500
$20,000
$17,500
$15,000
$12,500
$10,000
$7,500
$5,000
$2,500
$02012 Actual 2013 Actual 2014 Actual 2015 Actual 2016 Target* 2017 Target*
NET INCOME BEFORE 7(i) & INVESTMENTS ($,000)
Progress towards closing GAP Base year (GAP)
*Please see Forward-Looking Statements on page 30
2524
For 2016 we have carried forward cost efficiencies and
expect continued improvements in Natural Resources and
Government Services.
• Government Services is focused on performing on
the largest backlog of business it has ever had, which
sets the segment up for increased profitability in 2016.
Business development efforts and operating efficiency
improvements continue across the platform.
• Natural Resource income will benefit from harvest on
the new lands as we transition out of the start-up phase.
• The acquisition process has a number of opportunities
that when finalized are expected to add to our business
performance within the 2016 and 2017 results.
• Investment income is planned to show improvement
over 2016, but will continue to face risk across markets.
• ANCSA Section 7(i) revenue is expected to be $10
million less in 2016 due to low commodity prices for zinc
and oil.
Achieving the 2016 target will require diligent progress
toward the initiatives established in 2012, and require that
Sealaska continue to build on the cultural transformation
that will create long-term success.
FINANCIAL OVERVIEWSealaska’s consolidated continuing operations produced
revenues of $109.4 million in 2015, down from $121.6
million in 2014. Net income is $12.0 million, down from
the net income of $14.9 million in 2014. Volatile markets
in 2015 resulted in an approximate $6.9 million decline
in investment gain. The operational improvements at
Sealaska contributed to the $12.0 million net income
despite the volatility of the passive investment income
portfolio. Total Sealaska Shareholders’ Equity at December
31, 2015 of $234.6 million is up from $228.2 million at
December 31, 2014.
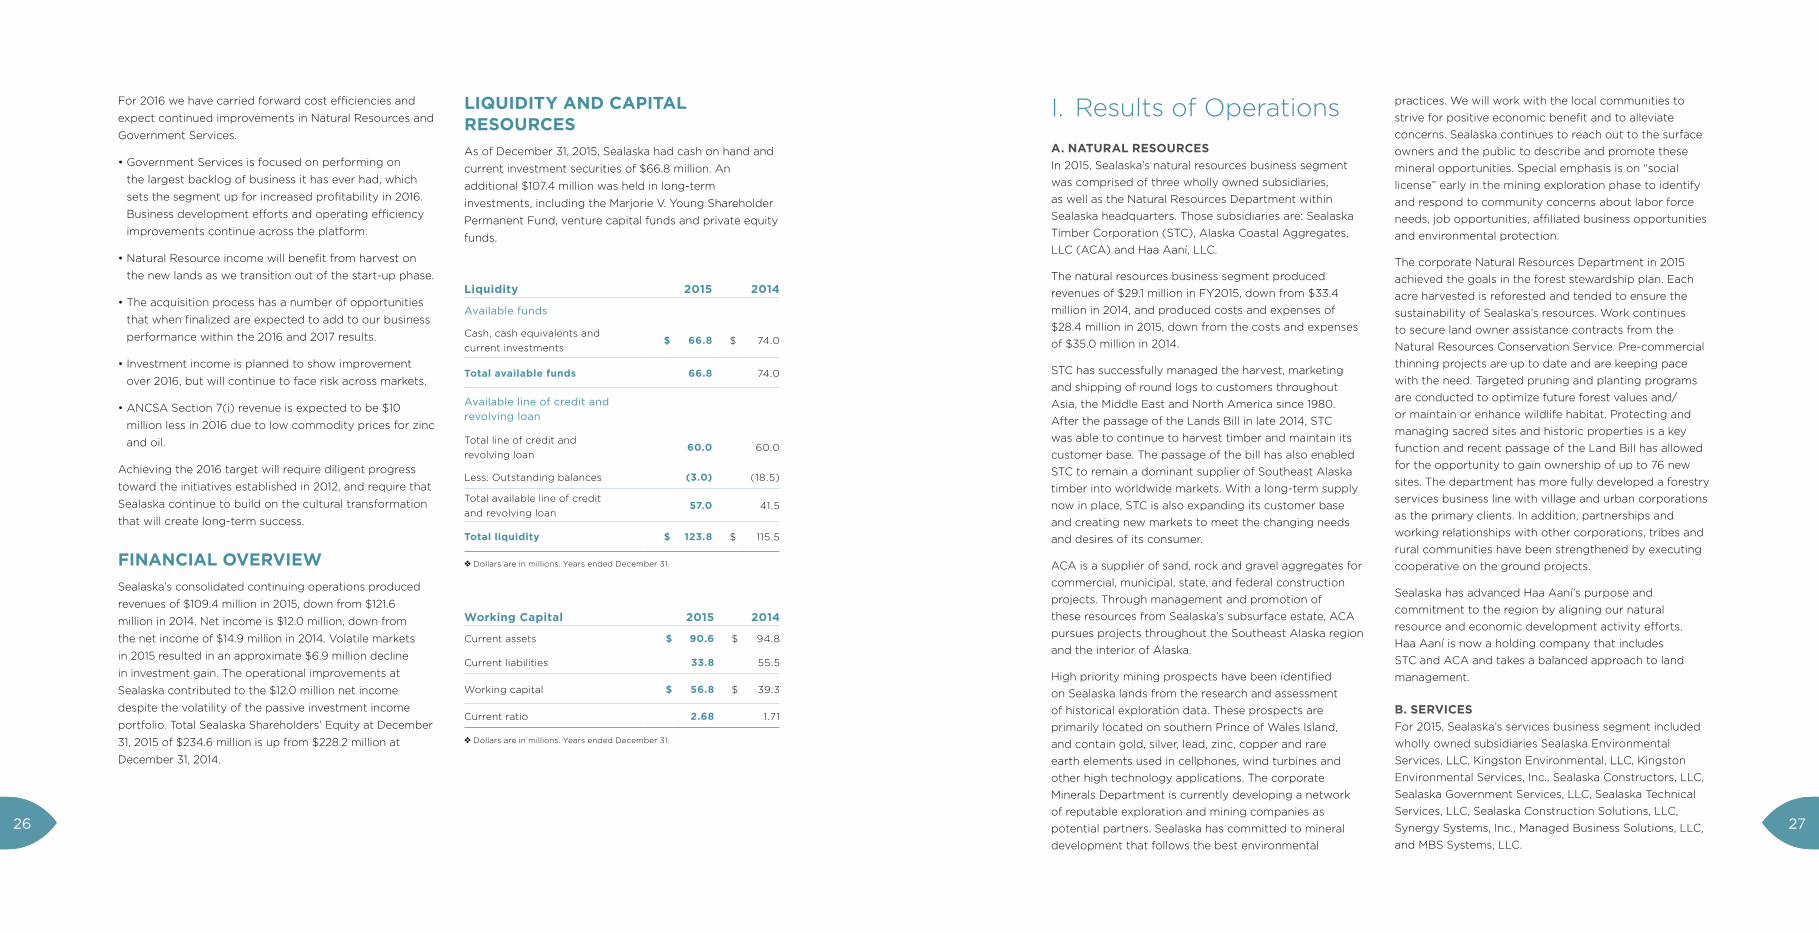
LIQUIDITY AND CAPITAL RESOURCESAs of December 31, 2015, Sealaska had cash on hand and
current investment securities of $66.8 million. An
additional $107.4 million was held in long-term
investments, including the Marjorie V. Young Shareholder
Permanent Fund, venture capital funds and private equity
funds.
Liquidity 2015 2014
Available funds
Cash, cash equivalents and
current investments$ 66.8 $ 74.0
Total available funds 66.8 74.0
Available line of credit and
revolving loan
Total line of credit and
revolving loan 60.0 60.0
Less: Outstanding balances (3.0) (18.5)
Total available line of credit
and revolving loan57.0 41.5
Total liquidity $ 123.8 $ 115.5
❖ Dollars are in millions. Years ended December 31.
Working Capital 2015 2014
Current assets $ 90.6 $ 94.8
Current liabilities 33.8 55.5
Working capital $ 56.8 $ 39.3
Current ratio 2.68 1.71
❖ Dollars are in millions. Years ended December 31.
I. Results of Operations
A. NATURAL RESOURCESIn 2015, Sealaska’s natural resources business segment
was comprised of three wholly owned subsidiaries,
as well as the Natural Resources Department within
Sealaska headquarters. Those subsidiaries are: Sealaska
Timber Corporation (STC), Alaska Coastal Aggregates,
LLC (ACA) and Haa Aaní, LLC.
The natural resources business segment produced
revenues of $29.1 million in FY2015, down from $33.4
million in 2014, and produced costs and expenses of
$28.4 million in 2015, down from the costs and expenses
of $35.0 million in 2014.
STC has successfully managed the harvest, marketing
and shipping of round logs to customers throughout
Asia, the Middle East and North America since 1980.
After the passage of the Lands Bill in late 2014, STC
was able to continue to harvest timber and maintain its
customer base. The passage of the bill has also enabled
STC to remain a dominant supplier of Southeast Alaska
timber into worldwide markets. With a long-term supply
now in place, STC is also expanding its customer base
and creating new markets to meet the changing needs
and desires of its consumer.
ACA is a supplier of sand, rock and gravel aggregates for
commercial, municipal, state, and federal construction
projects. Through management and promotion of
these resources from Sealaska’s subsurface estate, ACA
pursues projects throughout the Southeast Alaska region
and the interior of Alaska.
High priority mining prospects have been identified
on Sealaska lands from the research and assessment
of historical exploration data. These prospects are
primarily located on southern Prince of Wales Island,
and contain gold, silver, lead, zinc, copper and rare
earth elements used in cellphones, wind turbines and
other high technology applications. The corporate
Minerals Department is currently developing a network
of reputable exploration and mining companies as
potential partners. Sealaska has committed to mineral
development that follows the best environmental
practices. We will work with the local communities to
strive for positive economic benefit and to alleviate
concerns. Sealaska continues to reach out to the surface
owners and the public to describe and promote these
mineral opportunities. Special emphasis is on “social
license” early in the mining exploration phase to identify
and respond to community concerns about labor force
needs, job opportunities, affiliated business opportunities
and environmental protection.
The corporate Natural Resources Department in 2015
achieved the goals in the forest stewardship plan. Each
acre harvested is reforested and tended to ensure the
sustainability of Sealaska’s resources. Work continues
to secure land owner assistance contracts from the
Natural Resources Conservation Service. Pre-commercial
thinning projects are up to date and are keeping pace
with the need. Targeted pruning and planting programs
are conducted to optimize future forest values and/
or maintain or enhance wildlife habitat. Protecting and
managing sacred sites and historic properties is a key
function and recent passage of the Land Bill has allowed
for the opportunity to gain ownership of up to 76 new
sites. The department has more fully developed a forestry
services business line with village and urban corporations
as the primary clients. In addition, partnerships and
working relationships with other corporations, tribes and
rural communities have been strengthened by executing
cooperative on the ground projects.
Sealaska has advanced Haa Aaní’s purpose and
commitment to the region by aligning our natural
resource and economic development activity efforts.
Haa Aaní is now a holding company that includes
STC and ACA and takes a balanced approach to land
management.
B. SERVICESFor 2015, Sealaska’s services business segment included
wholly owned subsidiaries Sealaska Environmental
Services, LLC, Kingston Environmental, LLC, Kingston
Environmental Services, Inc., Sealaska Constructors, LLC,
Sealaska Government Services, LLC, Sealaska Technical
Services, LLC, Sealaska Construction Solutions, LLC,
Synergy Systems, Inc., Managed Business Solutions, LLC,
and MBS Systems, LLC.
2726
The services business segment generated revenues of
$80.2 million in 2015, down from $81.2 million in 2014,
and incurred costs and expenses of $76.5 million in 2015
down from $77.8 million in 2014.
The services businesses continued to grow profitability
in 2015 and made a profit of $3.8 million, despite sales
being slightly reduced, as we continue to reduce costs
and focus on higher value added work. Year-on-year
operating profits improved from 2014. We continue to
focus on our strengths in our core markets, which are
water and maritime services including environmental
monitoring, niche construction and data analytics. We
built a strong backlog in 2015 and as a result we are
forecasting good sales and profit growth in 2016.
In 2013, Sealaska decided to exit guard services and
logistics businesses. Sealaska Global Logistics, LLC was
sold in 2013. Security Alliance, LLC performed well in
2015 and Sealaska is actively marketing this company
for sale. Accordingly, Security Alliance, LLC and Sealaska
Global Logistics, LLC, are reported in Discontinued
Operations for the three years presented in the
consolidated statement of operations.
C. GAMINGThe gaming business segment generated revenues
of $296,000 in 2015, up from $154,000 in 2014, and
incurred costs and expenses of $480,000 in 2015, down
from the costs and expenses of $604,000 in 2014.
Sealaska’s gaming business is managed by its wholly
owned subsidiary End-to-End Enterprises, LLC (E2E).
The sole gaming project under E2E is the Cloverdale
Rancheria casino and resort project, approximately 90
miles north of San Francisco on Highway 101. E2E and the
Cloverdale Rancheria of Pomo Indians are collaborating
to find a new investor and to secure the governmental
approvals to construct and operate a casino.
The property and the project are well positioned for
casino and resort development. The land has a favorable
Indian Land Opinion confirming the land is qualified for
Indian Trust Land status and in April 2014, the Bureau of
Indian Affairs released the Final Environmental Impact
Statement that is required for the land to be taken into
trust. The next significant milestone for the project will
be the record of decision.
D. INVESTMENTSFor 2015, Sealaska’s investments business segment
primarily included the Marjorie V. Young (MVY)
Shareholder Permanent Fund and the Investment and
Growth (I&G) Fund.
The investment business segment incurred investment
losses of $516,000 in 2015, down from investment gains
of $6.4 million in 2014, and incurred costs and expenses
of $270,000 in 2015, down from $461,000 in 2014.
Despite the downturn of the investment market in late
2015, Sealaska’s investment portfolio outperformed the
target benchmark.
The combined balance of the MVY Shareholder
Permanent Fund and the I&G Fund was $160.9 million at
the start of the year, and ended 2015 with a combined
balance of $152.7 million invested in stocks, bonds,
real estate and private equity investments. Of these
investments, $45.3 million and $48.7 million were held as
current assets in 2015 and 2014, respectively.
Both funds have maintained strong, long-term
performance, which shows the strength of the funds’
diversification strategy directed by the board-approved
investment policy. Sealaska utilizes an institutional
investment consultant and the services of several
external investment managers.
1. Marjorie V. Young Shareholder Permanent Fund Sealaska’s MVY Shareholder Permanent Fund
was created in 1987 to provide shareholders with
meaningful and consistent dividends over time. Sealaska
management and the Board of Directors, along with
their investment advisors and investment managers,
constantly evaluate the risk exposure of the total
portfolio and make changes whenever necessary to
lessen risk—if doing so does not inordinately affect long-
term expected returns.
2. Investment and Growth Fund The Investment and Growth Fund is managed with both
a short-term and long-term investment horizon and is
used for both operational needs and new investments.
The management focus of the fund is to grow principal
with a prudent level of risk, maintain sufficient liquidity
to fund Sealaska’s current business operations, and
provide a source of capital for corporate development.
E. CORPORATE AND OTHER INCOMEFor 2015, Sealaska’s corporate and other income
included the revenue generating departments at
the corporate headquarters, such as the Real Estate
Department, which leases office space to others in
Sealaska’s Juneau headquarters.
The corporate and other income business segment
generated revenues of $294,000 in 2015, down from
$501,000 in 2014, and incurred costs and expenses of
$1.5 million in 2015, down from $1.8 million in 2014.
II. Shareholder Benefits and Services
A. SEALASKA HERITAGE INSTITUTEClan leaders, traditional scholars and Elders conceived
Sealaska Heritage Institute (SHI) at the first Sealaska
Elder’s Conference in 1980. Sealaska formally
established SHI with the mission of perpetuating and
enhancing the Tlingit, Haida and Tsimshian cultures
of Southeast Alaska, and to promote cross cultural
understanding.
In 2015, Sealaska contributed $1.5 million in cash and
in-kind services to support the operations of SHI. Using
Sealaska’s cash and in-kind donations as leverage,
SHI raised an additional $4.7 million in grants, revenue
and sales and provided direct service to over 10,000
individuals through its programs and activities.
The return on Sealaska’s yearly financial contribution is
Native language, culture and arts education curricula
professional development for teachers and artists;
the Sealaska scholarship program; and research and
published material on Native history and culture and
public policy issues affecting Alaska Natives.
The cornerstone of Sealaska’s investment in SHI is the
opening of the Walter Soboleff building. The building
houses its archival and ethnographic collection; and
its market of Native art. Its programs and museum
exhibitions serve as an education center for Native
people, the general public and visitors to Alaska.
In addition, STC contributed $338,000 toward
scholarships, and Sealaska contributed $196,000 for a
total of $534,000. Sealaska’s contribution comes from
the scholarship endowment set up in 1989, which has
contributed $8.1 million to SHI’s scholarship program
since inception.
B. HAA AANÍ COMMUNITY DEVELOPMENT FUND, INC. (CDFI) The CDFI is an Emerging Native CDFI and achieved
nonprofit 501(c)(3) status in 2013. The CDFI raised
capital funding of $2 million in 2015 and deployed
six loans in the region supporting 42 jobs. The CDFI
provides access to capital for entrepreneurs in the form
of loans and technical services in Southeast Alaska.
The CDFI achieved significant milestones in 2015: 1) The
CDFI’s Path to Prosperity (P2P) Program received the
International Economic Development Council’s Silver
Award for Business Retention and Expansion Category,
and completed its third season with 115 total applicants
from 18 different communities focused on 12 different
industries. The winners of P2P support more than 25
jobs throughout Southeast Alaska. 2) The CDFI received
a U.S. Treasury CDFI Fund Technical Assistance Award
of $144,000 which will build capacity. The CDFI was
one of 14 CDFI’s in the U.S. and the only Alaska CDFI
to receive the award. 3) The CDFI received the USDA’s
Intermediary Relending Program (IRP) Award of $1
million, which allows the CDFI to expand loan programs
into rural communities. This is largest, and one of three
IRP programs in Alaska. In 2016, the CDFI will build its
loan portfolio from its funding sources, expand capacity
by bringing on a community lender, develop workforce
development programs to build capacity in the
Southeast Alaska region, and rebrand the organization
to align with its strategic direction.
C. ELDERS’ SETTLEMENT TRUST The Elders’ Settlement Trust (EST) is a grantor trust
created to provide a special economic benefit to
original shareholders at the age of 65. The assets
2928
and liabilities of the EST are reported on Sealaska’s
consolidated financial statements (see notes 4 and 13 of
the consolidated financial statements). The EST, which
is governed by a Board of Trustees, assumes a long-
term annualized rate of return of 6.25 percent in order
for the trust to meet the estimated benefit payments.
Since the trust’s inception, more than $11.5 million in
benefits have been provided.
D. DISTRIBUTIONS Since its inception in 1972, Sealaska has distributed
$595.1 million in dividends and ANCSA Section 7(j)
payments to shareholders and village corporations.
The outstanding shares of dividend paying stock are
affected by the open enrollment of Descendants when
they reach 18 years of age, enrollment of Leftouts, and
of the additional shares issued to Elders reaching the
age of 65. Adding more dividend-paying stock for the
reasons described above means that dividends will be
paid to a larger number of individuals and may result
in smaller dividends to original shareholders. However,
the recipients of Descendant and Leftout shares do not
receive ANCSA Section 7(j) payments. This protects a
portion of the distributions for holders of original shares
who do receive those Section 7(j) payments. Also,
when holders of life estate Class D (Descendant), Class
E (Elders) and Class L (Leftouts) shares pass away,
their life estate shares are canceled. Under the current
operations dividend policy to distribute 35 percent
of Sealaska Corporation’s consolidated net earnings
(less earnings associated with the Permanent Fund)
averaged over five years, 2013 financial results will
negatively affect the operations dividend calculation for
the next three years.
III. Special Note Regarding Forward-Looking Statements
Certain sections of the annual report contain forward-
looking statements that are based on management’s
expectations, estimates, projections and assumptions.
Words such as “expects,” “anticipates,” “plans,”
“believes,” “scheduled,” “estimates” and variations of
these words and similar expressions are intended to
identify forward-looking statements, which include
but are not limited to projections of revenues, income,
segment performance, cash flows, contract awards,
deliveries and backlog. These statements are not
guarantees of future performance and involve certain
risks and uncertainties, which are difficult to predict.
Therefore, actual future results and trends may differ
materially from what is forecast in forward-looking
statements. All forward-looking statements speak
only as of the date of this report or, in the case of any
document incorporated by reference, the date of that
document. All subsequent written and oral forward-
looking statements attributable to the company or any
person acting on the company’s behalf are qualified
by the cautionary statements in this section. The
company does not undertake any obligation to update
or publicly release any revisions to forward-looking
statements to reflect events, circumstances or changes
in expectations after the date of this report.
IV. Significant Accounting Policies
Sealaska’s consolidated financial statements and
accompanying notes have been prepared in accordance
with Generally Accepted Accounting Principles (GAAP).
The preparation of these financial statements requires
the Sealaska’s management to make estimates,
judgments and assumptions that affect reported
amounts of assets, liabilities, revenues and expenses.
Sealaska bases its estimates on historical experience
and assumptions believed to be reasonable under
current facts and circumstances. Actual amounts and
results could differ from these estimates made by
management. To ensure full disclosure and accurate
representation of the financial condition of the
company, Sealaska continually evaluates the accounting
policies and estimates used to prepare the consolidated
financial statements. See also the Notes to Consolidated
Financial Statements.
Independent Auditors' ReportTHE BOARD OF DIRECTORS SEALASKA CORPORATION:
We have audited the accompanying consolidated financial
statements of Sealaska Corporation and its subsidiaries, which
comprise the consolidated balance sheets as of December 31,
2015 and 2014, and the related consolidated statements of
operations, shareholders’ equity, and cash flows for each of the
years in the three-year period ended December 31, 2015 and
the related notes to the consolidated financial statements.
Management’s Responsibility for the Financial Statements
Management is responsible for the preparation and fair
presentation of these consolidated financial statements in
accordance with U.S. generally accepted accounting principles;
this includes the design, implementation, and maintenance
of internal control relevant to the preparation and fair
presentation of consolidated financial statements that are free
from material misstatement, whether due to fraud or error.
Auditors’ Responsibility
Our responsibility is to express an opinion on these
consolidated financial statements based on our audits. We
conducted our audits in accordance with auditing standards
generally accepted in the United States of America. Those
standards require that we plan and perform the audit to obtain
reasonable assurance about whether the consolidated financial
statements are free from material misstatement.
An audit involves performing procedures to obtain audit
evidence about the amounts and disclosures in the
consolidated financial statements. The procedures selected
depend on the auditors’ judgment, including the assessment
of the risks of material misstatement of the consolidated
financial statements, whether due to fraud or error. In making
those risk assessments, the auditor considers internal control
relevant to the entity’s preparation and fair presentation of
the consolidated financial statements in order to design audit
procedures that are appropriate in the circumstances, but not
for the purpose of expressing an opinion on the effectiveness
of the entity’s internal control. Accordingly, we express no such
opinion. An audit also includes evaluating the appropriateness
of accounting policies used and the reasonableness of
significant accounting estimates made by management, as
well as evaluating the overall presentation of the consolidated
financial statements.
We believe that the audit evidence we have obtained is
sufficient and appropriate to provide a basis for our audit
opinion.
Opinion
In our opinion, the consolidated financial statements referred
to above present fairly, in all material respects, the financial
position of Sealaska Corporation and its subsidiaries as
of December 31, 2015 and 2014, and the results of their
operations and their cash flows for each of the years in the
three-year period ended December 31, 2015, in accordance
with U.S. generally accepted accounting principles.
April 15, 2016
Anchorage, Alaska
3130
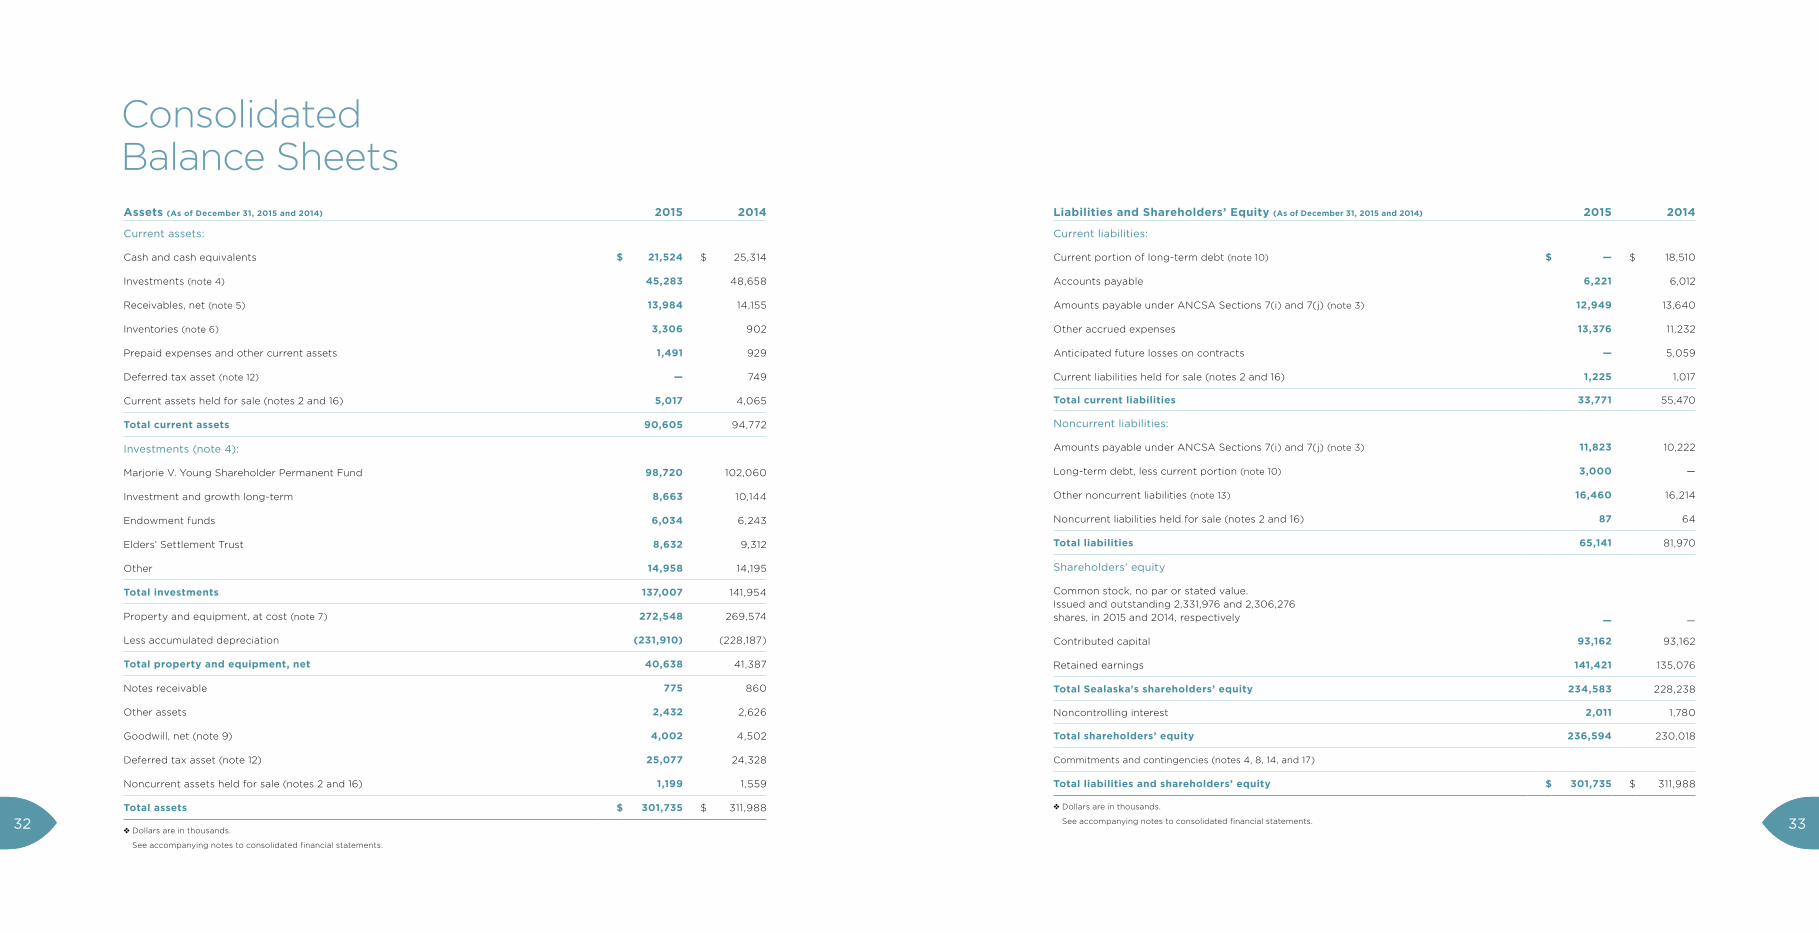
Consolidated Balance SheetsAssets (As of December 31, 2015 and 2014) 2015 2014
Current assets:
Cash and cash equivalents $ 21,524 $ 25,314
Investments (note 4) 45,283 48,658
Receivables, net (note 5) 13,984 14,155
Inventories (note 6) 3,306 902
Prepaid expenses and other current assets 1,491 929
Deferred tax asset (note 12) — 749
Current assets held for sale (notes 2 and 16) 5,017 4,065
Total current assets 90,605 94,772
Investments (note 4):
Marjorie V. Young Shareholder Permanent Fund 98,720 102,060
Investment and growth long-term 8,663 10,144
Endowment funds 6,034 6,243
Elders’ Settlement Trust 8,632 9,312
Other 14,958 14,195
Total investments 137,007 141,954
Property and equipment, at cost (note 7) 272,548 269,574
Less accumulated depreciation (231,910) (228,187)
Total property and equipment, net 40,638 41,387
Notes receivable 775 860
Other assets 2,432 2,626
Goodwill, net (note 9) 4,002 4,502
Deferred tax asset (note 12) 25,077 24,328
Noncurrent assets held for sale (notes 2 and 16) 1,199 1,559
Total assets $ 301,735 $ 311,988
❖ Dollars are in thousands.
See accompanying notes to consolidated financial statements.
Liabilities and Shareholders’ Equity (As of December 31, 2015 and 2014) 2015 2014
Current liabilities:
Current portion of long-term debt (note 10) $ — $ 18,510
Accounts payable 6,221 6,012
Amounts payable under ANCSA Sections 7(i) and 7(j) (note 3) 12,949 13,640
Other accrued expenses 13,376 11,232
Anticipated future losses on contracts — 5,059
Current liabilities held for sale (notes 2 and 16) 1,225 1,017
Total current liabilities 33,771 55,470
Noncurrent liabilities:
Amounts payable under ANCSA Sections 7(i) and 7(j) (note 3) 11,823 10,222
Long-term debt, less current portion (note 10) 3,000 —
Other noncurrent liabilities (note 13) 16,460 16,214
Noncurrent liabilities held for sale (notes 2 and 16) 87 64
Total liabilities 65,141 81,970
Shareholders’ equity
Common stock, no par or stated value.
Issued and outstanding 2,331,976 and 2,306,276
shares, in 2015 and 2014, respectively — —
Contributed capital 93,162 93,162
Retained earnings 141,421 135,076
Total Sealaska's shareholders’ equity 234,583 228,238
Noncontrolling interest 2,011 1,780
Total shareholders’ equity 236,594 230,018
Commitments and contingencies (notes 4, 8, 14, and 17)
Total liabilities and shareholders’ equity $ 301,735 $ 311,988
❖ Dollars are in thousands.
See accompanying notes to consolidated financial statements. 3332
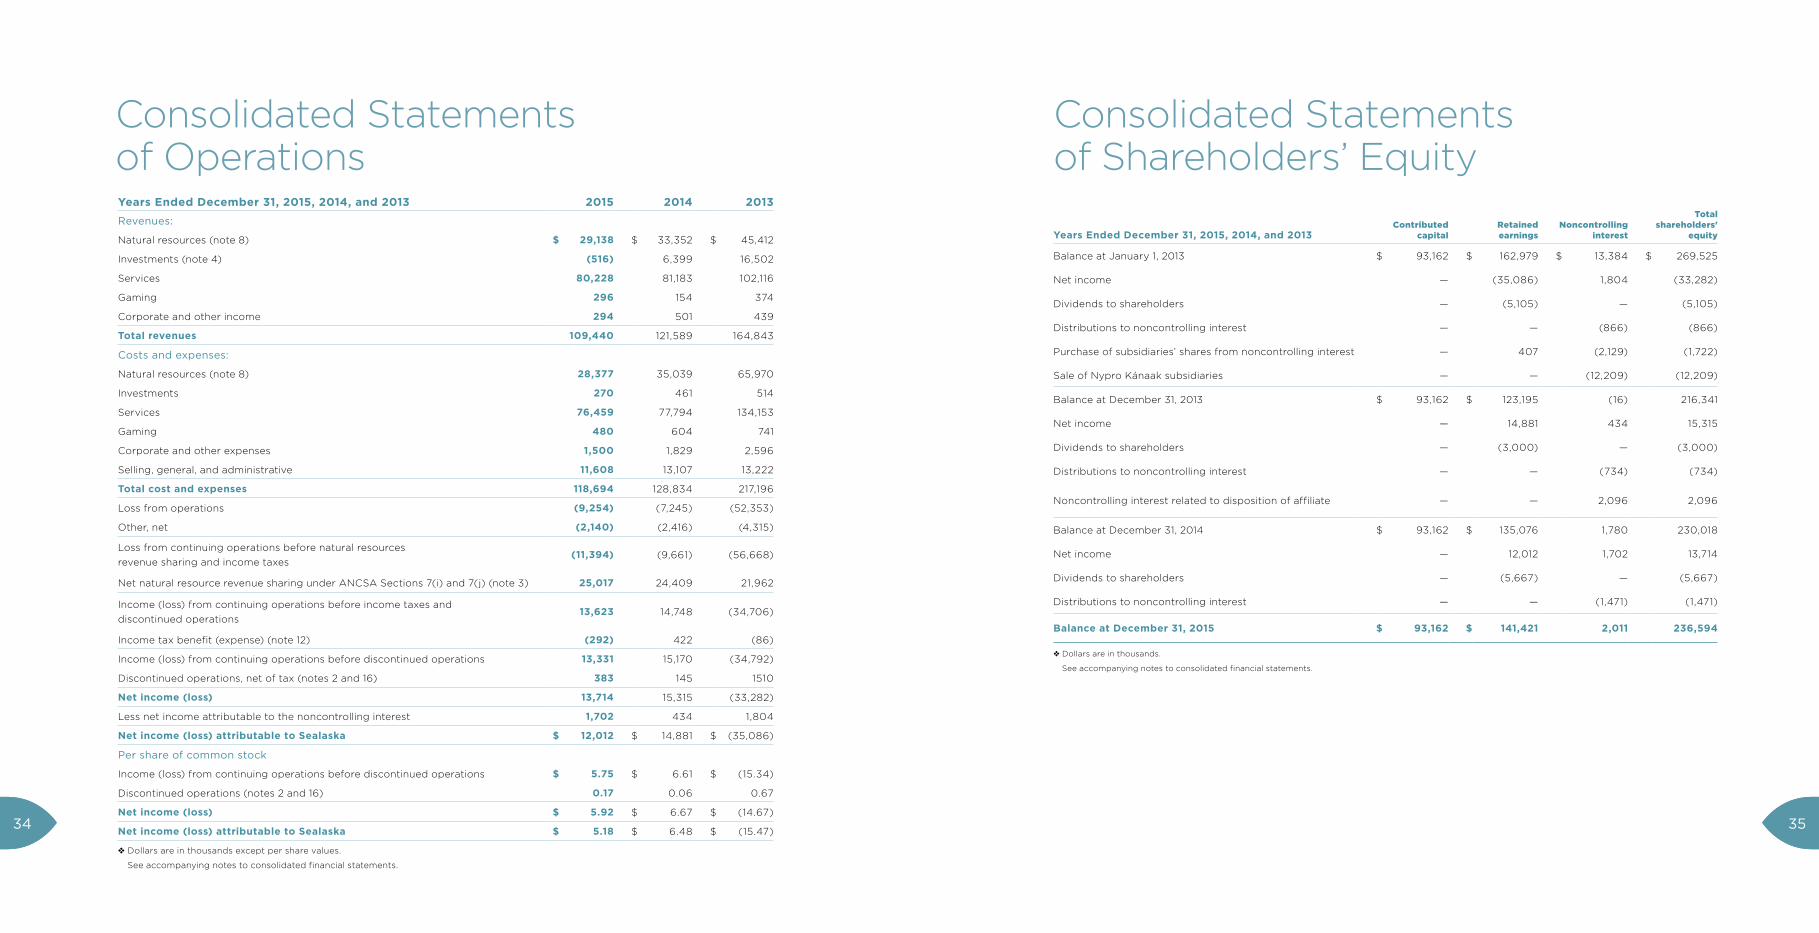
Consolidated Statements of OperationsYears Ended December 31, 2015, 2014, and 2013 2015 2014 2013
Revenues:
Natural resources (note 8) $ 29,138 $ 33,352 $ 45,412
Investments (note 4) (516) 6,399 16,502
Services 80,228 81,183 102,116
Gaming 296 154 374
Corporate and other income 294 501 439
Total revenues 109,440 121,589 164,843
Costs and expenses:
Natural resources (note 8) 28,377 35,039 65,970
Investments 270 461 514
Services 76,459 77,794 134,153
Gaming 480 604 741
Corporate and other expenses 1,500 1,829 2,596
Selling, general, and administrative 11,608 13,107 13,222
Total cost and expenses 118,694 128,834 217,196
Loss from operations (9,254) (7,245) (52,353)
Other, net (2,140) (2,416) (4,315)
Loss from continuing operations before natural resources
revenue sharing and income taxes(11,394) (9,661) (56,668)
Net natural resource revenue sharing under ANCSA Sections 7(i) and 7(j) (note 3) 25,017 24,409 21,962
Income (loss) from continuing operations before income taxes and
discontinued operations13,623 14,748 (34,706)
Income tax benefit (expense) (note 12) (292) 422 (86)
Income (loss) from continuing operations before discontinued operations 13,331 15,170 (34,792)
Discontinued operations, net of tax (notes 2 and 16) 383 145 1510
Net income (loss) 13,714 15,315 (33,282)
Less net income attributable to the noncontrolling interest 1,702 434 1,804
Net income (loss) attributable to Sealaska $ 12,012 $ 14,881 $ (35,086)
Per share of common stock
Income (loss) from continuing operations before discontinued operations $ 5.75 $ 6.61 $ (15.34)
Discontinued operations (notes 2 and 16) 0.17 0.06 0.67
Net income (loss) $ 5.92 $ 6.67 $ (14.67)
Net income (loss) attributable to Sealaska $ 5.18 $ 6.48 $ (15.47)
❖ Dollars are in thousands except per share values.
See accompanying notes to consolidated financial statements.
Consolidated Statements of Shareholders’ Equity
Years Ended December 31, 2015, 2014, and 2013Contributed
capitalRetained earnings
Noncontrolling interest
Total shareholders'
equity
Balance at January 1, 2013 $ 93,162 $ 162,979 $ 13,384 $ 269,525
Net income — (35,086) 1,804 (33,282)
Dividends to shareholders — (5,105) — (5,105)
Distributions to noncontrolling interest — — (866) (866)
Purchase of subsidiaries’ shares from noncontrolling interest — 407 (2,129) (1,722)
Sale of Nypro Kánaak subsidiaries — — (12,209) (12,209)
Balance at December 31, 2013 $ 93,162 $ 123,195 (16) 216,341
Net income — 14,881 434 15,315
Dividends to shareholders — (3,000) — (3,000)
Distributions to noncontrolling interest — — (734) (734)
Noncontrolling interest related to disposition of affiliate — — 2,096 2,096
Balance at December 31, 2014 $ 93,162 $ 135,076 1,780 230,018
Net income — 12,012 1,702 13,714
Dividends to shareholders — (5,667) — (5,667)
Distributions to noncontrolling interest — — (1,471) (1,471)
Balance at December 31, 2015 $ 93,162 $ 141,421 2,011 236,594
❖ Dollars are in thousands.
See accompanying notes to consolidated financial statements.
3534
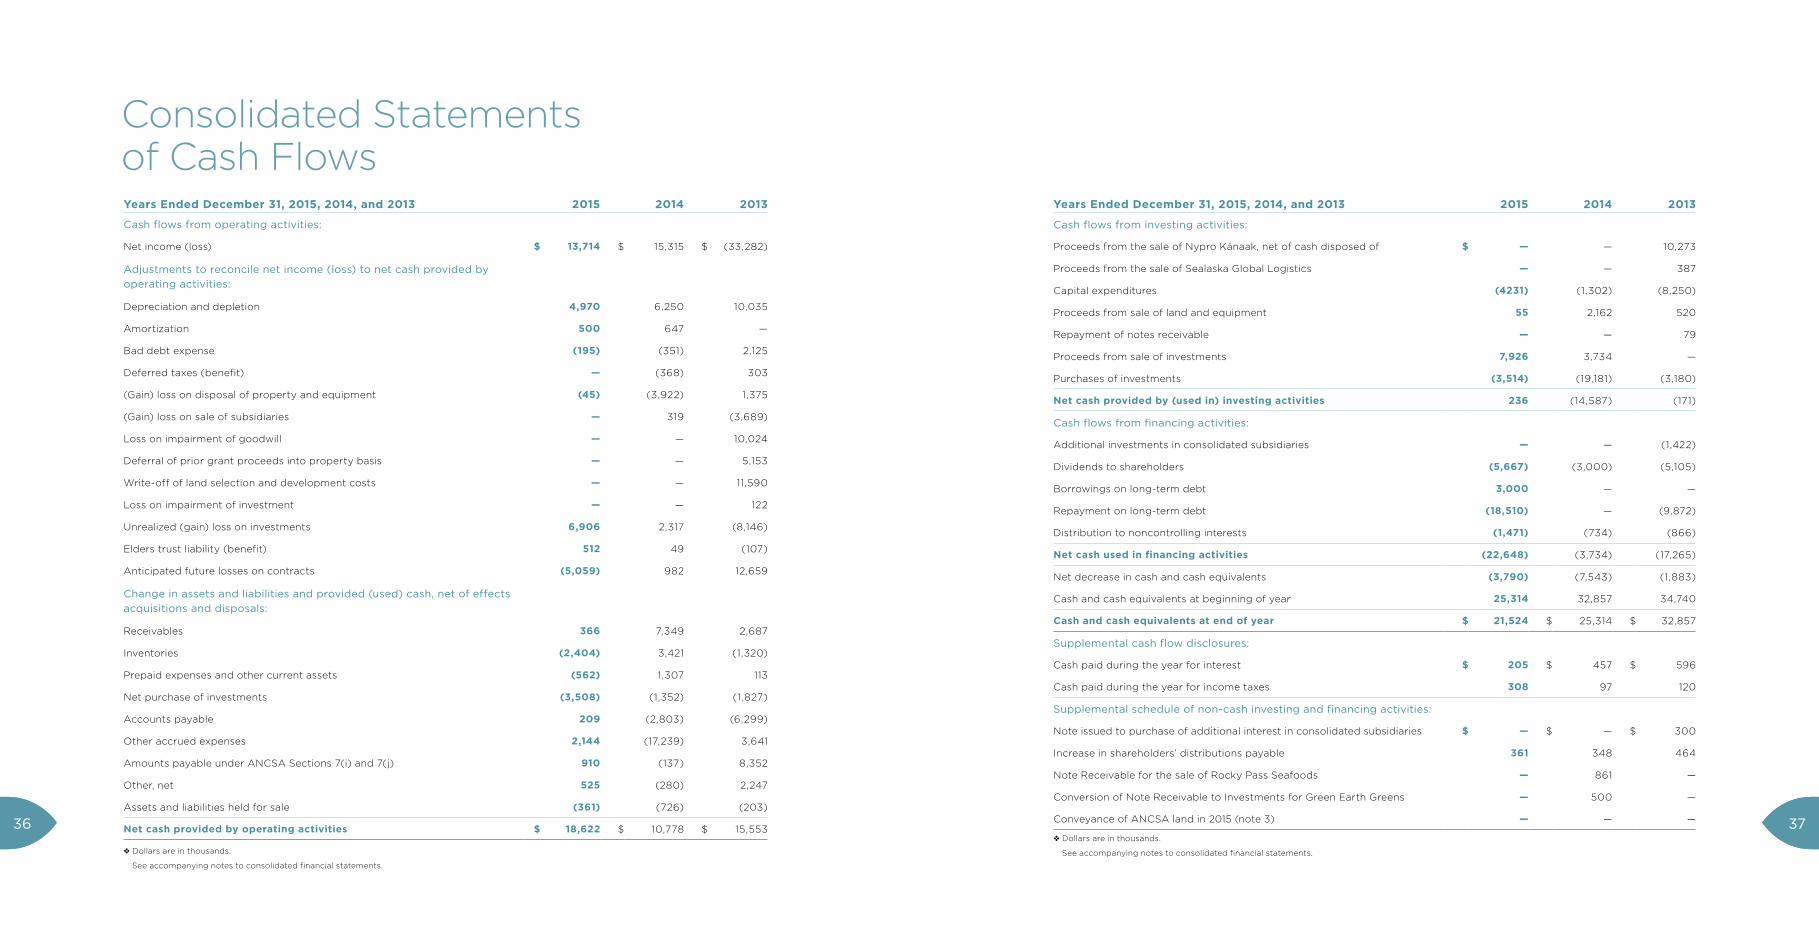
Consolidated Statements of Cash FlowsYears Ended December 31, 2015, 2014, and 2013 2015 2014 2013
Cash flows from operating activities:
Net income (loss) $ 13,714 $ 15,315 $ (33,282)
Adjustments to reconcile net income (loss) to net cash provided by
operating activities:
Depreciation and depletion 4,970 6,250 10,035
Amortization 500 647 —
Bad debt expense (195) (351) 2,125
Deferred taxes (benefit) — (368) 303
(Gain) loss on disposal of property and equipment (45) (3,922) 1,375
(Gain) loss on sale of subsidiaries — 319 (3,689)
Loss on impairment of goodwill — — 10,024
Deferral of prior grant proceeds into property basis — — 5,153
Write-off of land selection and development costs — — 11,590
Loss on impairment of investment — — 122
Unrealized (gain) loss on investments 6,906 2,317 (8,146)
Elders trust liability (benefit) 512 49 (107)
Anticipated future losses on contracts (5,059) 982 12,659
Change in assets and liabilities and provided (used) cash, net of effects
acquisitions and disposals:
Receivables 366 7,349 2,687
Inventories (2,404) 3,421 (1,320)
Prepaid expenses and other current assets (562) 1,307 113
Net purchase of investments (3,508) (1,352) (1,827)
Accounts payable 209 (2,803) (6,299)
Other accrued expenses 2,144 (17,239) 3,641
Amounts payable under ANCSA Sections 7(i) and 7(j) 910 (137) 8,352
Other, net 525 (280) 2,247
Assets and liabilities held for sale (361) (726) (203)
Net cash provided by operating activities $ 18,622 $ 10,778 $ 15,553
❖ Dollars are in thousands.
See accompanying notes to consolidated financial statements.
Years Ended December 31, 2015, 2014, and 2013 2015 2014 2013
Cash flows from investing activities:
Proceeds from the sale of Nypro Kánaak, net of cash disposed of $ — — 10,273
Proceeds from the sale of Sealaska Global Logistics — — 387
Capital expenditures (4231) (1,302) (8,250)
Proceeds from sale of land and equipment 55 2,162 520
Repayment of notes receivable — — 79
Proceeds from sale of investments 7,926 3,734 —
Purchases of investments (3,514) (19,181) (3,180)
Net cash provided by (used in) investing activities 236 (14,587) (171)
Cash flows from financing activities:
Additional investments in consolidated subsidiaries — — (1,422)
Dividends to shareholders (5,667) (3,000) (5,105)
Borrowings on long-term debt 3,000 — —
Repayment on long-term debt (18,510) — (9,872)
Distribution to noncontrolling interests (1,471) (734) (866)
Net cash used in financing activities (22,648) (3,734) (17,265)
Net decrease in cash and cash equivalents (3,790) (7,543) (1,883)
Cash and cash equivalents at beginning of year 25,314 32,857 34,740
Cash and cash equivalents at end of year $ 21,524 $ 25,314 $ 32,857
Supplemental cash flow disclosures:
Cash paid during the year for interest $ 205 $ 457 $ 596
Cash paid during the year for income taxes 308 97 120
Supplemental schedule of non-cash investing and financing activities:
Note issued to purchase of additional interest in consolidated subsidiaries $ — $ — $ 300
Increase in shareholders’ distributions payable 361 348 464
Note Receivable for the sale of Rocky Pass Seafoods — 861 —
Conversion of Note Receivable to Investments for Green Earth Greens — 500 —
Conveyance of ANCSA land in 2015 (note 3) — — —
❖ Dollars are in thousands.
See accompanying notes to consolidated financial statements.
3736
1. Operations and Summary of Significant Accounting Policies
OperationsSealaska Corporation (Sealaska or Corporation) is a
Regional Alaska Native Corporation formed under
the Alaska Native Claims Settlement Act (ANCSA).
Sealaska’s four primary continuing business activities
relate to the development, production, and sale of
natural resources; environmental remediation and
water and energy services; information technology; and
construction. In addition, Sealaska holds and manages
an extensive investment portfolio and participates in
gaming (e.g., establishment and development of casino
projects). ANCSA is further described in note 3.
Basis of Presentation and Significant Accounting Policies
(A) PRINCIPLES OF CONSOLIDATIONThe accompanying consolidated financial statements
include the accounts of Sealaska Corporation,
and its majority-owned subsidiaries (collectively,
the Corporation). All significant intercompany
balances and transactions have been eliminated in
consolidation. The Corporation has no involvement with
variable interest entities. The Corporation accounts
for investments over which it has significant influence
but not a controlling financial interest using the equity
method of accounting.
(B) RECLASSIFICATIONSIn order to make the consolidated financial statements
comparable with the 2015 presentation, certain reclassi-
fications have been made to the 2014 and 2013 figures.
(C) REVENUE RECOGNITION AND RECEIVABLESA significant source of the Corporation’s revenue is
through professional service contracts. The Corporation
adheres to the guidance for revenue recognition
contained in the Financial Accounting Standards
Board (FASB) Accounting Standards Codification
(ASC) Topic 912, Contractors – Federal Government.
Revenue from government service contracts is
recognized as the services are rendered, as the
costs are incurred or based on the specific terms of
the contract. Revenues from fixed fee construction
contracts are recognized by the percentage of
completion method, measured by percentage of costs
incurred to date, including labor incurred and materials
procured to date, to estimated total costs for each
contract. This method is used because management
considers labor cost and materials procurement to
be the best available measure of progress on these
contracts.
As some of the contracts extend over one or more
accounting periods, revisions in cost and earnings
estimates are reflected in the period during which the
facts requiring the revision become known.
Provisions for estimated losses on uncompleted
contracts are made in the period in which the losses
are determined. Changes in job performance, job
conditions, and estimated profitability, including those
arising from contract penalty provisions, and final
contract settlements may result in revisions to costs
and income and are recognized in the period in which
the revisions are determined.
Revenue from cost-plus-fee contracts is recognized on
the basis of costs incurred during the period plus the
fee earned. If contract costs and estimated earnings
exceed related billings on any uncompleted contract,
the difference is shown as a current asset. If billings
Notes to Consolidated Financial Statements
exceed related contract costs and estimated earnings
on any uncompleted contract, the difference is shown
as a current liability.
Equipment sales and rental revenue is recognized in
the period in which the rental or sales arrangement is
incurred, the equipment has been delivered, and when
collectibility is reasonably assured.
Natural resource revenue distributed to the Corporation
by other regional corporations is recorded as revenue
when received from the other regional corporations.
Natural resource revenue derived from the sale of
timber is recognized when earned, and the risks of
ownership have been transferred to the buyer, which is
generally upon shipment to the customer.
(D) TRADE ACCOUNTS RECEIVABLETrade accounts receivable are recorded at the invoiced
amount and do not bear interest. The Corporation
maintains an allowance for doubtful accounts for
estimated losses inherent in its accounts receivable
portfolio. In establishing the required allowance,
management considers historical losses adjusted
to take into account current market conditions and
its customers’ financial condition, the amount of
receivables in dispute, and the current receivables aging
and current payment patterns. The Corporation reviews
its allowance for doubtful accounts monthly. Past due
balances over 90 days and over a specified amount are
reviewed individually for collectibility. Account balances
are charged off against the allowance after all means
of collection have been exhausted and the potential for
recovery is considered remote. Writeoffs for 2015, 2014,
and 2013 were $1,000, $0, and $463,000, respectively.
The Corporation does not have any off-balance sheet
credit exposure related to its customers.
(E) CASH AND CASH EQUIVALENTSSealaska maintains its cash in bank accounts with
various financial institutions. At times, the balances
may exceed federally insured limits. For purposes of
the consolidated statements of cash flows, Sealaska
considers all highly liquid debt instruments with original
maturities of three months or less from the date of
purchase to be cash equivalents, except for certain
cash and cash equivalents included in the investment
portfolio that are intended to be invested on a long-
term basis.
(F) INVESTMENTSSealaska’s investments in marketable debt and equity
securities (note 4) are classified as trading securities
and are recorded at fair value. Fair value is based upon
quoted market prices. The increase or decrease in fair
value from period to period relating to marketable
securities included in Sealaska’s investment portfolio
is included in the determination of income or loss.
Interest and dividend income is recognized as earned.
Gains or losses on the sale of marketable securities are
determined on a specific identification basis.
Certain investments are valued at the net asset value
(NAV) per share/unit reported at the close of each
business day. NAV is used by the Corporation as a
practical expedient to estimating fair value as these
funds do not have readily determinable fair values.
Sealaska accounts for certain noncontrolling interests,
less than 50% ownership and control, in privately held
corporations, LLCs, and partnerships (the investee)
using the equity method of accounting. Under the
equity method, Sealaska’s original investment in
the investee is recorded at cost and subsequently
adjusted for changes in the net assets of the investee.
The carrying amount of the investment is periodically
increased (decreased) by the proportionate share in the
earnings (losses) of the investee.
Sealaska records its ownership of Green Earth Greens,
Inc. and Native American Bank via the cost method, as
Sealaska does not exercise significant influence over
these investees.
During 2014, Sealaska converted a loan of $500,000
for working capital needs made in 2012 to additional
Series B Preferred Stock at the mutual agreement
of the majority owners of Green Earth Greens, Inc.
and Sealaska. This purchase of 3.7 million shares of
Series B Preferred Stock increases Sealaska’s ownership
percentage of Green Earth Greens, Inc. to 2.75%.
3938
(G) INVENTORIESInventories are stated at the lower of cost (determined
on a first-in, first-out basis) or estimated net realizable
value. Inventories consist primarily of sorted/scaled
timber, manufacturing materials, and finished goods.
(H) DISCONTINUED OPERATIONS AND ASSETS AND LIABILITIES HELD FOR SALEThe Corporation presents discontinued operations
in the consolidated statements of operations for the
operating results of the “components of an entity”
that either has been disposed of or is classified as held
for sale. A component of an entity is further defined
as an entity comprising operations and cash flows
that can be clearly distinguished, operationally and
for financial reporting purposes, from the rest of the
entity. A component of an entity may be a reportable
segment or an operating segment, a reporting unit, a
subsidiary, or an asset group. Any goodwill attributable
to components classified as assets held for sale is
included in the financial statement caption “Goodwill”
rather than being reclassified to assets held for sale. As
of December 31, 2015 and 2014, there was no goodwill
attributable to assets held for sale. The Corporation
elected to present assets held for sale as both current
and noncurrent amounts and to not present separately
in the consolidated statements of cash flows the
information related to discontinued operations.
In April 2014, the FASB issued ASU No. 2014-08,
Reporting Discontinued Operations and Disclosures of
Disposals of Components of an Entity. ASU 2014-08
changed the requirements for reporting discontinued
operations. This ASU limits discontinued operations
reporting to disposals of components of an entity that
represent strategic shifts that have a major effect on
an entity’s operations and financial results. As a result,
the Corporation expects to report fewer discontinued
operations under the new standard than would
otherwise be reported under previous requirements.
The new standard is effective for any disposals of
components of the Corporation in annual reporting
periods beginning after December 15, 2014. The
Corporation early implemented the provisions of ASU
2014-08 as of January 1, 2014.
(I) PROPERTY AND EQUIPMENTProperty and equipment are stated at cost.
Depreciation and amortization of property, equipment,
and leasehold improvements are provided primarily
on the straightline method over the shorter of the
expected useful lives of the assets or the lease term as
follows:
Buildings, leaseholds and improvements 15–45 years
Equipment and furnishings 5–20 years
Computer and office equipment 3–5 years
(J) TIMBER OPERATIONSCosts of logging yards and camps are amortized as
timber is harvested, based on estimated volumes of
timber to be removed from each tax reporting block.
Costs of logging roads are amortized using a composite
rate for each tax reporting block based on actual road
costs incurred, anticipated future road costs to be
incurred, and estimated volumes to be removed from
the respective tax block.
Costs of silviculture and reforestation activities, net
of grants received, are capitalized as an element of
property, plant, and equipment and depleted as the
associated timber is harvested.
Depletion of purchased timber is provided based on
amounts harvested in relation to volumes purchased.
Timber and mineral resources received under the
provisions of ANCSA are carried at zero value and no
depletion expense is recorded when such resources
are harvested or extracted. For tax purposes, depletion
is reported based upon the higher of the estimated
fair value of a specific timber block or mineral deposit
as of the date of conveyance or first commercial
development.
(K) ROADS AND YARDS ASSETSRoads and yards constructed for the harvest of timber
are amortized based on units of production, which are
calculated by taking the total estimated future asset
capital costs plus the current known net actual capital
costs, all divided by the total future harvest (estimated
total or remaining timber volume to be harvested).
Roads and yards are classified as long-lived assets
and are reviewed for impairment whenever events or
changes in circumstances indicate that the carrying
amounts may not be recoverable. Recoverability
of the road assets is measured by a comparison
of the carrying amounts of the asset to estimated
undiscounted cash flows expected to be generated by
the asset group the roads are a part of. If the carrying
amount of an asset exceeds its estimated future cash
flows, an impairment charge is recognized by the
amount by which the carrying amount of an asset
exceeds its estimated fair value.
(L) LONG-LIVED ASSETSLong-lived assets, such as property and equipment, are
reviewed for impairment whenever events or changes
in circumstances indicate that the carrying amounts of
assets may not be recoverable.
Recoverability of assets to be held and used is
measured by a comparison of the carrying amount of
an asset to estimated undiscounted future cash flows
expected to be generated by the asset. If the carrying
amount of an asset exceeds its estimated future cash
flows, an impairment charge is recognized by the
amount by which the carrying amount of the asset
exceeds the fair value of the asset.
(M) GOODWILL AND OTHER INTANGIBLE ASSETSGoodwill is an asset representing the future economic
benefits arising from other assets acquired in a business
combination that are not individually identified and
separately recognized.
The Corporation has elected to amortize goodwill on a
straightline basis over 10 years. Goodwill must be tested
for impairment when a triggering event occurs that
indicates that the fair value of a reporting unit may be
below its carrying amount. The goodwill impairment
amount, if any, represents the excess of the reporting
unit’s carrying amount over its fair value, limited to the
carrying amount of goodwill of the reporting unit. The
Corporation has made an accounting policy decision
to test goodwill impairment at the Corporation’s
consolidated level.
Other intangible assets consist of customer
relationships. Customer relationships are amortized over
their estimated useful lives, typically between seven to
eight years using the straightline method.
(N) OTHER EXPENSEThe Company has reported $2.1 million, $2.4 million,
and $4.3 million in other expense for the years ended
December 31, 2015, 2014, and 2013, respectively.
Within these amounts are charitable contributions of
$1.5 million, $1.7 million, and $3.8 million for the years
ended December 31, 2015, 2014, and 2013, respectively.
Also included within these amounts is an increase
adjustment to the elder’s liability of $512,000 and
$49,000 for the years ended December 31, 2015
and 2014, respectively, and a decrease adjustment
of $107,000 for the year ended December 31, 2013.
Remaining amounts related to other net miscellaneous
expense of $88,000, $651,000, and $607,000 for
the years ended December 31, 2015, 2014, and 2013,
respectively.
(O) ALASKA NATIVE CLAIMS SETTLEMENT ACT ASSETSSealaska has received substantial natural resource
assets under the provisions of ANCSA as described in
note 8. These assets are carried in the accompanying
consolidated financial statements at zero value. For
tax reporting purposes, these assets have a tax basis,
when determined, as the higher of their estimated fair
value at the date of conveyance or first commercial
development. As a result, a substantial difference
between the book and tax basis exists, which is
considered a temporary difference for purposes of
reporting income taxes under U.S. generally accepted
accounting principles.
(P) ANCSA SECTION 7(i) ACCOUNTINGProperty and Equipment: In Section 7(i) accounting,
ANCSA fixed assets are expensed in the year they are
purchased. For book accounting, all fixed assets are
depreciated using the straightline method based on
their useful life.4140
Roads and Yards: In Section 7(i) accounting, ANCSA
roads are segregated into three categories: mainline,
secondary, and spur. Mainline and secondary roads
are amortized based on units of production and the
useful life of 10 and three years, respectively. Spur
roads are expensed in the year they are placed into
service. The book treatment is addressed in the fixed
assets note above. Yards are treated consistently for
Section 7(i) and book accounting.
Inventories: Section 7(i) accounting allows for the
deduction of the cost of inventories from revenues in
determining Section 7(i) sharable income. For book
purposes, inventories are reported at lower of cost or
estimated net realizable value under current assets on
the consolidated balance sheets.
Accounts Receivable: Section 7(i) accounting allows for
the deduction of outstanding accounts receivable from
revenues in determining Section 7(i) sharable income.
For book purposes, accounts receivable are reported
under current assets on the consolidated balance
sheets and the associated revenues are recognized as
described in note 1(c).
(Q) INCOME TAXESIncome taxes are accounted for under the asset and
liability method. Deferred tax assets and liabilities are
recognized for the future tax consequences attributable
to differences between the financial statement carrying
amounts of existing assets and liabilities and their
respective tax bases and operating loss and tax credit
carryforwards. Deferred tax assets and liabilities are
measured using enacted tax rates expected to apply to
taxable income in the years in which those temporary
differences are expected to be recovered or settled. The
effect on deferred tax assets and liabilities of a change
in tax rates is recognized in income in the period that
includes the enactment date. Uncertain tax positions are
recorded when they are determined to be more likely
than not of being sustained on Sealaska’s tax return. See
note 12 for further discussion of income taxes.
Funds and properties received from the
U.S. government under ANCSA are not subject to
income taxes.
(R) NET INCOME PER SHARE Net income per share information in the consolidated
financial statements is based on weighted average
shares outstanding. Sealaska has no agreements or
securities outstanding that represent dilutive potential
common shares.
The number of common stock shares outstanding
at December 31, 2015 and 2014 was 2,331,976 and
2,306,276, respectively. The stock, dividends paid, and
other stock rights are restricted; the stock may not be
sold, pledged, assigned, or otherwise alienated except
in certain circumstances by gift, court order, or death;
the stock carries voting rights only if the holder thereof
is an eligible Native. All classes of stock carry economic
rights.
On June 23, 2007, Sealaska’s shareholders authorized
the issuance of two additional classes of common
stock without consideration. Class D stock is issuable
to Alaska Natives born after December 18, 1971, who are
18 years of age or older and are lineal descendants of
an original Sealaska shareholder and meet certain other
requirements. Class L stock is issuable to Alaska Natives
born before December 18, 1971, who were eligible to
enroll in Sealaska Corporation in 1971 (pursuant to
ANCSA) but were not so enrolled and who meet certain
other requirements.
On June 27, 2009, Sealaska’s shareholders authorized
the issuance of an additional class of common stock
without consideration. Class E stock is issuable to Alaska
Natives born before December 18, 1971, who are original
shareholders of Sealaska who have reached the age of
65 years or older, and meet certain other requirements.
10,900 shares of Class E stock, 14,800 shares of Class D
stock, and 0 shares of Class L stock were issued in 2015.
9,800 shares of Class E stock, 14,300 shares of Class D
stock, and 200 shares of Class L stock were issued in
2014. 9,500 shares of Class E stock, 18,100 shares of
Class D stock, and 200 shares of Class L stock were
issued in 2013.
(S) FAIR VALUEASC Topic 820, Fair Value Measurement, establishes
a framework for fair value measurement in the
consolidated financial statements by providing a
definition of fair value, provides guidance on the
methods used to estimate fair value, and expands
disclosures about fair value measurements.
Fair Value MeasurementsASC Topic 820 defines fair value as the price that
would be received to sell an asset or the amount paid
to transfer a liability in an orderly transaction between
market participants (an exit price) at the measurement
date. Fair value is a marketbased measurement
considered from the perspective of a market
participant. Sealaska uses market data or assumptions
that market participants would use in pricing the asset
or liability, including assumptions about risk and the
risks inherent in the inputs to the valuation. These inputs
can be readily observable, market corroborated, or
unobservable. Sealaska applies both market and income
approaches for recurring fair value measurements, using
the best available information while utilizing valuation
techniques that maximize the use of observable inputs
and minimize the use of unobservable inputs.
Fair Value HierarchyASC Topic 820 establishes a fair value hierarchy
that prioritizes the inputs to valuation techniques
used to measure fair value. The hierarchy gives
the highest priority to unadjusted quoted prices
in active markets for identical assets or liabilities
(Level 1 measurements) and the lowest priority to
measurements involving significant unobservable inputs
(Level 3 measurements). The three levels of the fair
value hierarchy are as follows:
• Level 1 inputs are quoted prices (unadjusted) in
active markets for identical assets or liabilities
that Sealaska has the ability to access at the
measurement date.
• Level 2 inputs are other than quoted prices in active
markets, which are either directly or indirectly
observable as of the reporting date, and fair value
is determined through the use of models or other
valuation methodologies. Investments that are
generally included in this category are publicly
traded equity securities with legal or contractual
restrictions, which are specific to the securities, as
well as other securities with directly or indirectly
observable inputs.
• Level 3 inputs are unobservable and include
situations where there is little, if any, market activity
for the investment. Fair value for these investments
are determined using valuation methodologies
that consider a range of factors, including but not
limited to the price at which the investment was
acquired, the nature of the investment, local market
conditions, trading values on public exchanges
for comparable securities, current and projected
operating performance, and financing transactions
subsequent to the acquisition of the investment.
The inputs into the determination of fair value
require significant management judgment. Due to
the inherent uncertainty of these estimates, these
values may differ materially from the values that
would have been used had a ready market for these
investments existed. Investments that are included
in this category generally are privately held debt and
equity securities. The level in the fair value hierarchy
within which a fair measurement in its entirety falls is
based on the lowest level input that is significant to
the fair value measurement in its entirety.
Fair Value Measurements on a Nonrecurring Basis Sealaska follows the fair value measurement
requirements related to nonfinancial assets and
nonfinancial liabilities that are not required or permitted
to be measured at fair value on a recurring basis.
Those include assets measured at fair value in goodwill
impairment testing and nonfinancial long-lived assets
measured at fair value for impairment assessment.
During 2013, using Level 3 inputs and an income
valuation technique, Sealaska performed an impairment
assessment of certain long-lived assets and goodwill,
resulting in goodwill impairment of $10 million. During
2015 and 2014, an impairment assessment of long-lived
assets and goodwill was not considered necessary, as
no triggering events were identified.
4342
Financial Instruments The carrying amounts of cash and cash equivalents,
accounts receivable, notes receivable, and accounts
payable approximate fair value because of the short-
term nature of these instruments. The carrying amounts
of investment securities are stated at fair value. The
carrying value of debt approximates fair value as the
debt bears interest that adjusts based upon market
interest rates.
(T) RECENTLY ISSUED ACCOUNTING STANDARDSIn July 2013, the FASB issued ASU 2013-11, Income
Taxes (Topic 740): Presentation of an Unrecognized
Tax Benefit When a Net Operation Loss Carryforward,
a Similar Tax Loss, or a Tax Credit Carryforward Exists.
ASU 2013-11 requires an unrecognized tax benefit,
or a portion of an unrecognized tax benefit, to be
presented in the consolidated financial statements as
a reduction to a deferred tax asset for a net operating
loss carryforward, a similar tax loss, or a tax credit
carryforward. ASU 2013-11 is effective for fiscal years,
and interim periods within those years, beginning
after December 15, 2014. The new standard is to be
applied prospectively but retrospective application is
permitted. The Corporation implemented the provisions
of ASU 2013-11 as of January 1, 2015 with a prospective
application.
In November 2015, the FASB issued ASU No. 2015-
07, Balance Sheet Classification of Deferred Taxes.
ASU 2015-17 requires entities with a classified balance
sheet to present all deferred tax asset and liabilities as
noncurrent. Classifying all deferred taxes as noncurrent
may simplify Corporation’s processes because it will
not need to separately identify the net current and
net noncurrent deferred tax asset or liability in each
jurisdiction and allocate valuation allowances. The new
standard is effective for the Corporation for annual
reporting periods beginning after December 15, 2016.
The new standard can be applied either prospectively
or retrospectively. The Corporation implemented the
provisions of ASU 2015-17 as of January 1, 2015, with a
prospective application.
In May 2014, the FASB issued ASU No. 2014-09,
Revenue from Contracts with Customers. ASU 2014-09
requires an entity to recognize revenue to depict the
transfer of promised goods or services to customers
in an amount that reflects the consideration to which
the entity expects to be entitled in exchange for those
goods or services. An entity should also disclose
sufficient quantitative and qualitative information to
enable users of consolidated financial statements to
understand the nature, amount, timing, and uncertainty
of revenue and cash flows arising from contracts with
customers. The new standard is effective for annual
reporting periods beginning after December 15, 2018.
The Corporation will implement the provisions of ASU
2014-09 as of January 1, 2019. The Corporation has not
yet determined the impact of the new standard on its
current policies for revenue recognition.
In February 2016, the FASB issued ASU No. 2016-
02, Leases. ASU 2016-02 changes requirements for
reporting leases. This ASU increases transparency and
comparability among organizations by recognizing
lease assets and lease liabilities on the consolidated
balance sheets and disclosing key information about the
lease arrangements. Under the ASU, all leases create an
asset and a liability and lessees will now be required to
recognize those assets and liabilities that arise from the
leases. A lessee should recognize on the consolidated
balance sheets a liability to make lease payments
and a right-of-use asset representing its right to the
underlying asset for the lease term. The accounting
applied by the lessor is largely unchanged by the ASU.
The new standard is effective for the Corporation for
annual reporting periods beginning after December 15,
2019. The Corporation will implement the provisions of
ASU 2016-02 as of January 1, 2020. The Corporation has
not yet determined the impact of the new standard on
its current policies for leases.
(U) FOREIGN CURRENCY TRANSACTIONSThe consolidated financial statements of Sealaska’s
foreign operations have been translated into U.S. dollars
in accordance with ASC 830, Foreign Currency
Matters. As the U.S. dollar is the functional currency of
Sealaska’s subsidiary operations, there are no foreign
currency translation adjustments and all gains and
losses from remeasuring foreign currency transactions
into the functional currency are included in income.
(V) USE OF ESTIMATESThe preparation of consolidated financial statements
in conformity with U.S. generally accepted accounting
principles requires management to make estimates and
assumptions that affect reported amounts of assets
and liabilities and disclosures of contingent assets
and liabilities at the date of the consolidated financial
statements and the reported amounts of revenues and
expenses during the reporting period. Actual results
could differ from those estimates. Significant estimates
include provisions relating to uncollectible receivables,
useful lives of capitalized timber costs, property and
equipment, the related depreciation and valuation
of certain underlying assets of limited partnership
investments and amortization, realization of deferred
taxes, and impairment of long-lived assets and goodwill.
The recorded amounts are currently believed by
management to be sufficient. However, such estimates
could significantly change in future periods to reflect
new laws, regulations, or information. It is not possible
to determine whether changes in amounts recorded,
due to such changed circumstances, will occur or
to reasonably estimate the amount or range of any
potential additional loss.
2. Acquisitions and Divestitures of Subsidiaries
(A) ROCKY PASS SEAFOODS, LLCIn December 2014, Haa Aaní, LLC sold the assets
of Rocky Pass Seafoods, LLC for $1,000,000. Haa
Aaní, LLC recorded a loss on sale of $361,000 for the
transaction. Haa Aaní, LLC recorded a $1,000,000
non interest bearing note receivable at its discounted
value of $861,000 secured by an assignment with
security interest in Kake Tribal Corporation’s interest
in Section 7(j) payments made by Sealaska in equal
payments over nine years from 2016 through 2024.
(B) SECURITY ALLIANCE OF FLORIDA, LLCIn September 2013, Sealaska Security Holdings, LLC
purchased an additional 15% of Security Alliance of
Florida, LLC (Security Alliance) for $1.4 million. The
additional purchase brings the ownership percentage
by Sealaska Security Holdings, LLC to 85%. The
$1.4 million purchase price exceeded the book value of
the noncontrolling interest by approximately $12,000 and
represents additional paidin capital. Sealaska recorded
this $12,000 amount to its retained earnings. Sealaska
is actively working to sell Security Alliance, and is
presenting it as an asset held for sale at December 31,
2015. Prior year’s services revenues and income
(loss) from discontinuing operations were $21.8 million
and $145,000, respectively, in 2014 and $21.3 million
and $(603,000), respectively, in 2013. These amounts
have been reclassified to discontinued operations in
accordance with ASC Subtopic 360-10, Accounting for
the Impairment or Disposal of Long-Lived Assets.
4544
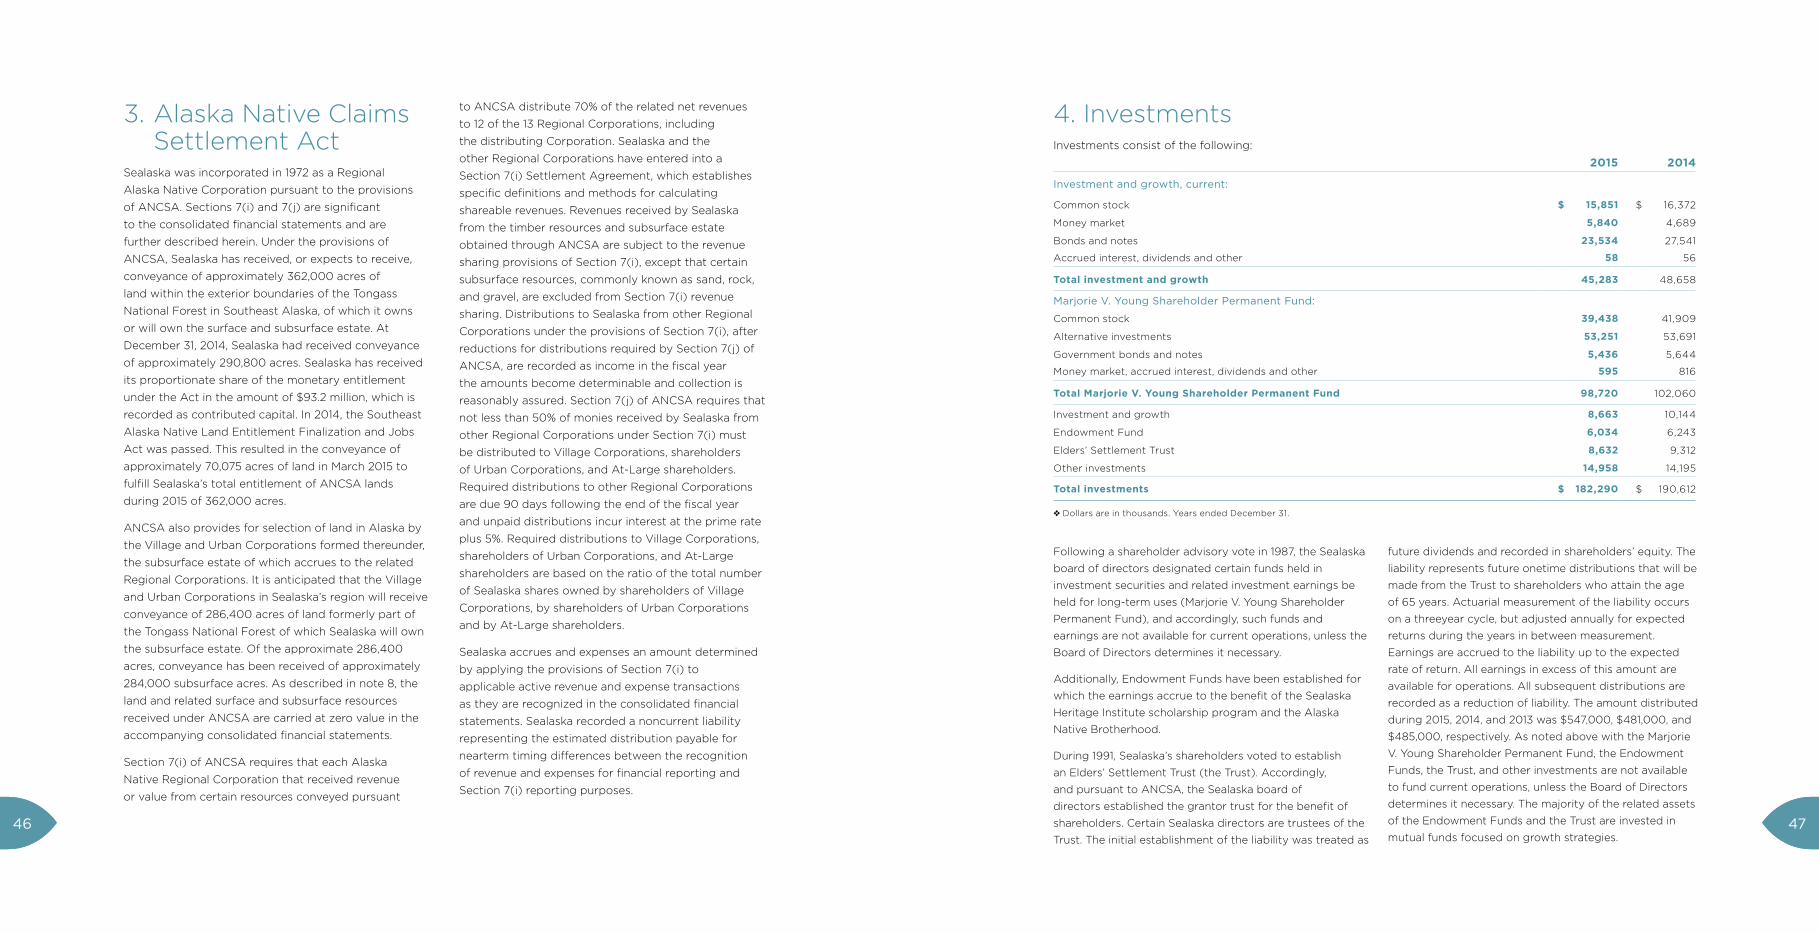
3. Alaska Native Claims Settlement Act
Sealaska was incorporated in 1972 as a Regional
Alaska Native Corporation pursuant to the provisions
of ANCSA. Sections 7(i) and 7(j) are significant
to the consolidated financial statements and are
further described herein. Under the provisions of
ANCSA, Sealaska has received, or expects to receive,
conveyance of approximately 362,000 acres of
land within the exterior boundaries of the Tongass
National Forest in Southeast Alaska, of which it owns
or will own the surface and subsurface estate. At
December 31, 2014, Sealaska had received conveyance
of approximately 290,800 acres. Sealaska has received
its proportionate share of the monetary entitlement
under the Act in the amount of $93.2 million, which is
recorded as contributed capital. In 2014, the Southeast
Alaska Native Land Entitlement Finalization and Jobs
Act was passed. This resulted in the conveyance of
approximately 70,075 acres of land in March 2015 to
fulfill Sealaska’s total entitlement of ANCSA lands
during 2015 of 362,000 acres.
ANCSA also provides for selection of land in Alaska by
the Village and Urban Corporations formed thereunder,
the subsurface estate of which accrues to the related
Regional Corporations. It is anticipated that the Village
and Urban Corporations in Sealaska’s region will receive
conveyance of 286,400 acres of land formerly part of
the Tongass National Forest of which Sealaska will own
the subsurface estate. Of the approximate 286,400
acres, conveyance has been received of approximately
284,000 subsurface acres. As described in note 8, the
land and related surface and subsurface resources
received under ANCSA are carried at zero value in the
accompanying consolidated financial statements.
Section 7(i) of ANCSA requires that each Alaska
Native Regional Corporation that received revenue
or value from certain resources conveyed pursuant
to ANCSA distribute 70% of the related net revenues
to 12 of the 13 Regional Corporations, including
the distributing Corporation. Sealaska and the
other Regional Corporations have entered into a
Section 7(i) Settlement Agreement, which establishes
specific definitions and methods for calculating
shareable revenues. Revenues received by Sealaska
from the timber resources and subsurface estate
obtained through ANCSA are subject to the revenue
sharing provisions of Section 7(i), except that certain
subsurface resources, commonly known as sand, rock,
and gravel, are excluded from Section 7(i) revenue
sharing. Distributions to Sealaska from other Regional
Corporations under the provisions of Section 7(i), after
reductions for distributions required by Section 7(j) of
ANCSA, are recorded as income in the fiscal year
the amounts become determinable and collection is
reasonably assured. Section 7(j) of ANCSA requires that
not less than 50% of monies received by Sealaska from
other Regional Corporations under Section 7(i) must
be distributed to Village Corporations, shareholders
of Urban Corporations, and At-Large shareholders.
Required distributions to other Regional Corporations
are due 90 days following the end of the fiscal year
and unpaid distributions incur interest at the prime rate
plus 5%. Required distributions to Village Corporations,
shareholders of Urban Corporations, and At-Large
shareholders are based on the ratio of the total number
of Sealaska shares owned by shareholders of Village
Corporations, by shareholders of Urban Corporations
and by At-Large shareholders.
Sealaska accrues and expenses an amount determined
by applying the provisions of Section 7(i) to
applicable active revenue and expense transactions
as they are recognized in the consolidated financial
statements. Sealaska recorded a noncurrent liability
representing the estimated distribution payable for
nearterm timing differences between the recognition
of revenue and expenses for financial reporting and
Section 7(i) reporting purposes.
4. InvestmentsInvestments consist of the following:
2015 2014
Investment and growth, current:
Common stock $ 15,851 $ 16,372
Money market 5,840 4,689
Bonds and notes 23,534 27,541
Accrued interest, dividends and other 58 56
Total investment and growth 45,283 48,658
Marjorie V. Young Shareholder Permanent Fund:
Common stock 39,438 41,909
Alternative investments 53,251 53,691
Government bonds and notes 5,436 5,644
Money market, accrued interest, dividends and other 595 816
Total Marjorie V. Young Shareholder Permanent Fund 98,720 102,060
Investment and growth 8,663 10,144
Endowment Fund 6,034 6,243
Elders’ Settlement Trust 8,632 9,312
Other investments 14,958 14,195
Total investments $ 182,290 $ 190,612
❖ Dollars are in thousands. Years ended December 31.
Following a shareholder advisory vote in 1987, the Sealaska
board of directors designated certain funds held in
investment securities and related investment earnings be
held for long-term uses (Marjorie V. Young Shareholder
Permanent Fund), and accordingly, such funds and
earnings are not available for current operations, unless the
Board of Directors determines it necessary.
Additionally, Endowment Funds have been established for
which the earnings accrue to the benefit of the Sealaska
Heritage Institute scholarship program and the Alaska
Native Brotherhood.
During 1991, Sealaska’s shareholders voted to establish
an Elders’ Settlement Trust (the Trust). Accordingly,
and pursuant to ANCSA, the Sealaska board of
directors established the grantor trust for the benefit of
shareholders. Certain Sealaska directors are trustees of the
Trust. The initial establishment of the liability was treated as
future dividends and recorded in shareholders’ equity. The
liability represents future onetime distributions that will be
made from the Trust to shareholders who attain the age
of 65 years. Actuarial measurement of the liability occurs
on a threeyear cycle, but adjusted annually for expected
returns during the years in between measurement.
Earnings are accrued to the liability up to the expected
rate of return. All earnings in excess of this amount are
available for operations. All subsequent distributions are
recorded as a reduction of liability. The amount distributed
during 2015, 2014, and 2013 was $547,000, $481,000, and
$485,000, respectively. As noted above with the Marjorie
V. Young Shareholder Permanent Fund, the Endowment
Funds, the Trust, and other investments are not available
to fund current operations, unless the Board of Directors
determines it necessary. The majority of the related assets
of the Endowment Funds and the Trust are invested in
mutual funds focused on growth strategies.4746
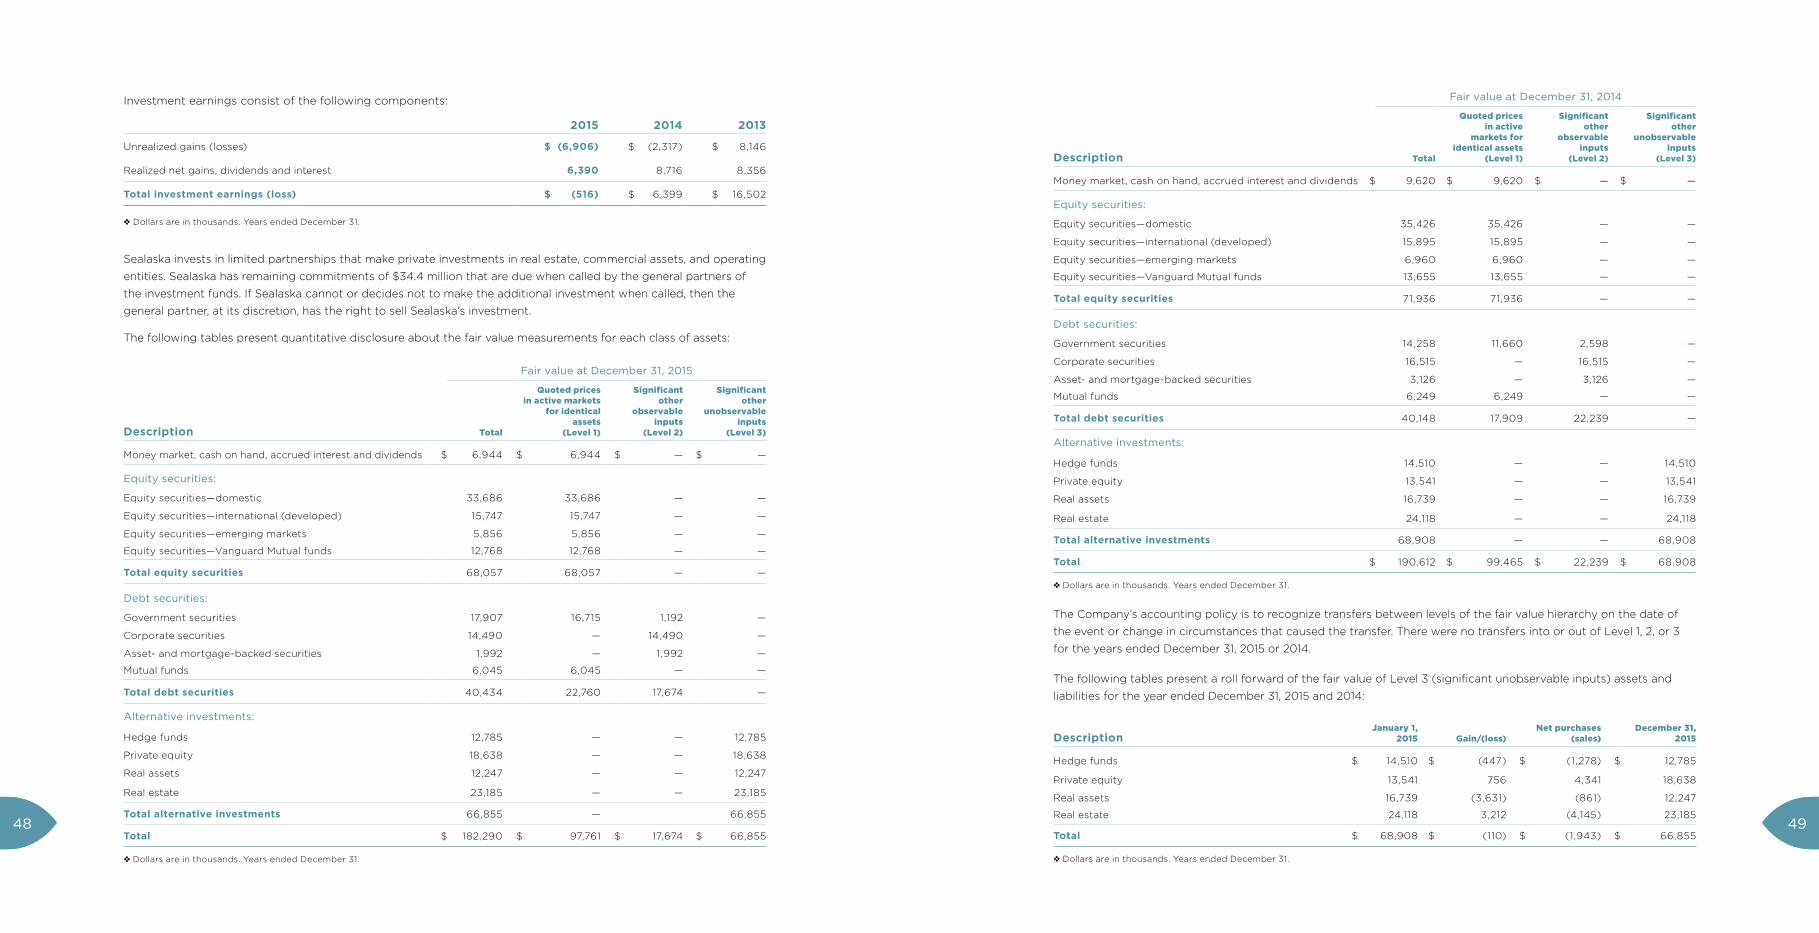
Investment earnings consist of the following components:
2015 2014 2013
Unrealized gains (losses) $ (6,906) $ (2,317) $ 8,146
Realized net gains, dividends and interest 6,390 8,716 8,356
Total investment earnings (loss) $ (516) $ 6,399 $ 16,502
❖ Dollars are in thousands. Years ended December 31.
Sealaska invests in limited partnerships that make private investments in real estate, commercial assets, and operating
entities. Sealaska has remaining commitments of $34.4 million that are due when called by the general partners of
the investment funds. If Sealaska cannot or decides not to make the additional investment when called, then the
general partner, at its discretion, has the right to sell Sealaska’s investment.
The following tables present quantitative disclosure about the fair value measurements for each class of assets:
Fair value at December 31, 2015
Description Total
Quoted prices in active markets
for identical assets
(Level 1)
Significant other
observable inputs
(Level 2)
Significant other
unobservable inputs
(Level 3)
Money market, cash on hand, accrued interest and dividends $ 6,944 $ 6,944 $ — $ —
Equity securities:
Equity securities—domestic 33,686 33,686 — —
Equity securities—international (developed) 15,747 15,747 — —
Equity securities—emerging markets 5,856 5,856 — —
Equity securities—Vanguard Mutual funds 12,768 12,768 — —
Total equity securities 68,057 68,057 — —
Debt securities:
Government securities 17,907 16,715 1,192 —
Corporate securities 14,490 — 14,490 —
Asset- and mortgage-backed securities 1,992 — 1,992 —
Mutual funds 6,045 6,045 — —
Total debt securities 40,434 22,760 17,674 —
Alternative investments:
Hedge funds 12,785 — — 12,785
Private equity 18,638 — — 18,638
Real assets 12,247 — — 12,247
Real estate 23,185 — — 23,185
Total alternative investments 66,855 — 66,855
Total $ 182,290 $ 97,761 $ 17,674 $ 66,855
❖ Dollars are in thousands. Years ended December 31.
Fair value at December 31, 2014
Description Total
Quoted prices in active
markets for identical assets
(Level 1)
Significant other
observable inputs
(Level 2)
Significant other
unobservable inputs
(Level 3)
Money market, cash on hand, accrued interest and dividends $ 9,620 $ 9,620 $ — $ —
Equity securities:
Equity securities—domestic 35,426 35,426 — —
Equity securities—international (developed) 15,895 15,895 — —
Equity securities—emerging markets 6,960 6,960 — —
Equity securities—Vanguard Mutual funds 13,655 13,655 — —
Total equity securities 71,936 71,936 — —
Debt securities:
Government securities 14,258 11,660 2,598 —
Corporate securities 16,515 — 16,515 —
Asset- and mortgage-backed securities 3,126 — 3,126 —
Mutual funds 6,249 6,249 — —
Total debt securities 40,148 17,909 22,239 —
Alternative investments:
Hedge funds 14,510 — — 14,510
Private equity 13,541 — — 13,541
Real assets 16,739 — — 16,739
Real estate 24,118 — — 24,118
Total alternative investments 68,908 — — 68,908
Total $ 190,612 $ 99,465 $ 22,239 $ 68,908
❖ Dollars are in thousands. Years ended December 31.
The Company’s accounting policy is to recognize transfers between levels of the fair value hierarchy on the date of
the event or change in circumstances that caused the transfer. There were no transfers into or out of Level 1, 2, or 3
for the years ended December 31, 2015 or 2014.
The following tables present a roll forward of the fair value of Level 3 (significant unobservable inputs) assets and
liabilities for the year ended December 31, 2015 and 2014:
DescriptionJanuary 1,
2015 Gain/(loss)Net purchases
(sales)December 31,
2015
Hedge funds $ 14,510 $ (447) $ (1,278) $ 12,785
Private equity 13,541 756 4,341 18,638
Real assets 16,739 (3,631) (861) 12,247
Real estate 24,118 3,212 (4,145) 23,185
Total $ 68,908 $ (110) $ (1,943) $ 66,855
❖ Dollars are in thousands. Years ended December 31.
4948
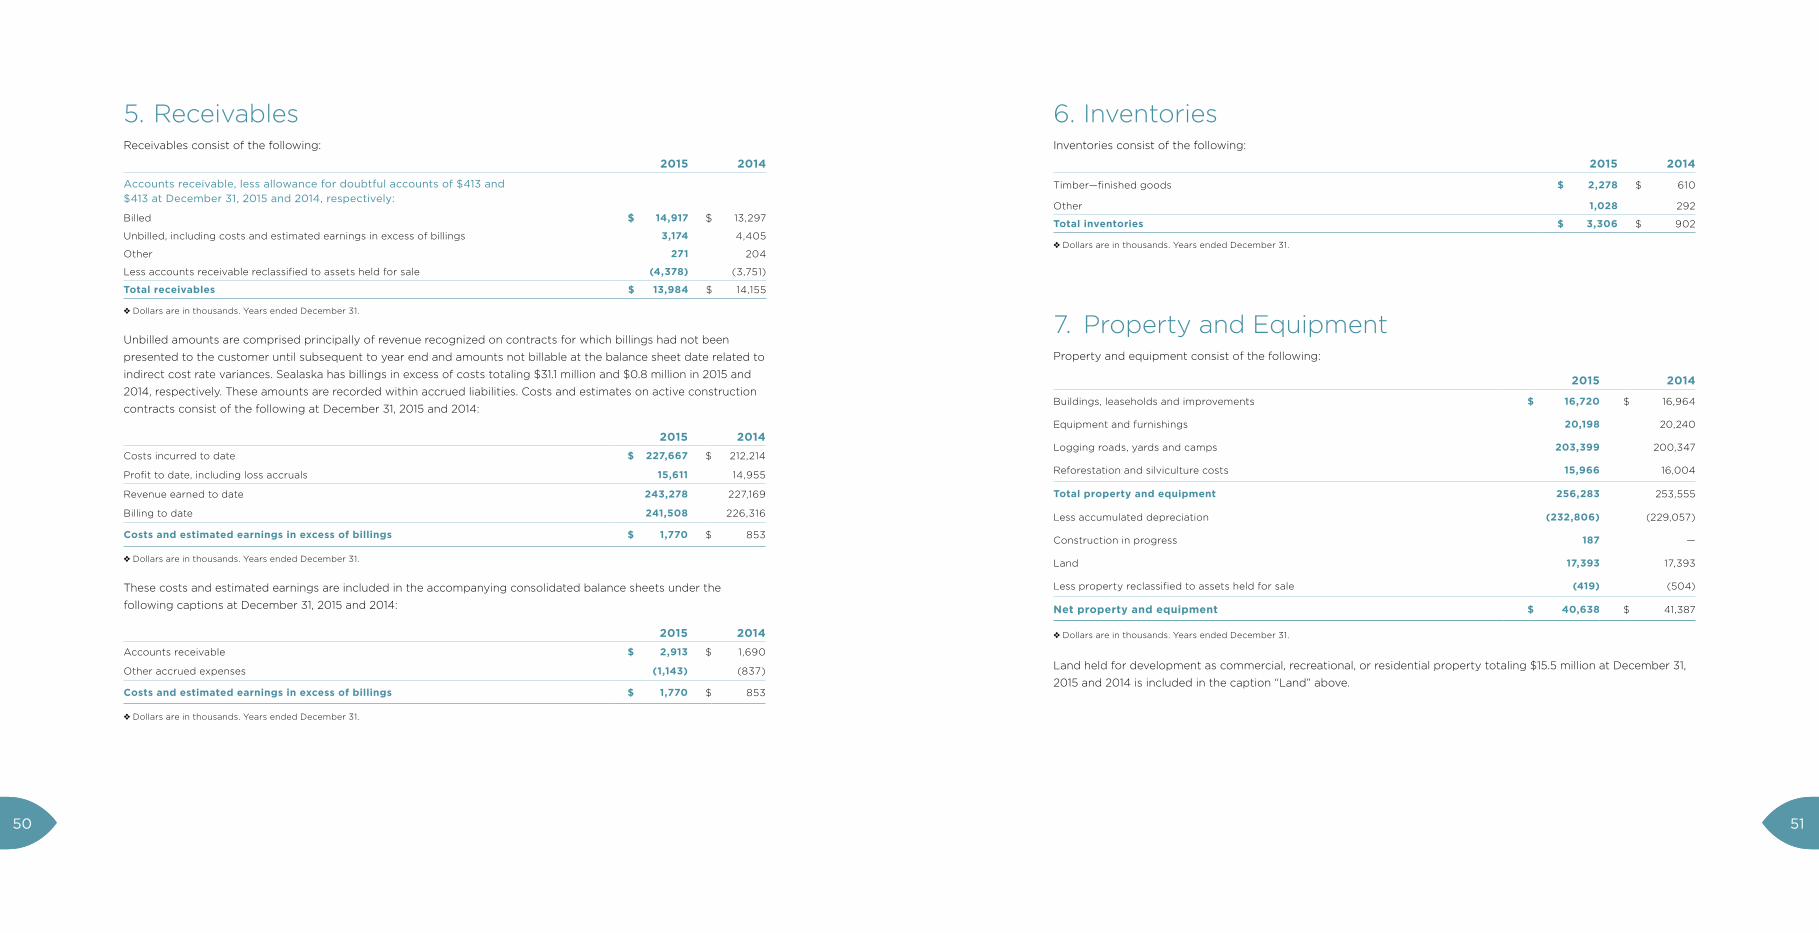
5. ReceivablesReceivables consist of the following:
2015 2014
Accounts receivable, less allowance for doubtful accounts of $413 and
$413 at December 31, 2015 and 2014, respectively:
Billed $ 14,917 $ 13,297
Unbilled, including costs and estimated earnings in excess of billings 3,174 4,405
Other 271 204
Less accounts receivable reclassified to assets held for sale (4,378) (3,751)
Total receivables $ 13,984 $ 14,155
❖ Dollars are in thousands. Years ended December 31.
Unbilled amounts are comprised principally of revenue recognized on contracts for which billings had not been
presented to the customer until subsequent to year end and amounts not billable at the balance sheet date related to
indirect cost rate variances. Sealaska has billings in excess of costs totaling $31.1 million and $0.8 million in 2015 and
2014, respectively. These amounts are recorded within accrued liabilities. Costs and estimates on active construction
contracts consist of the following at December 31, 2015 and 2014:
2015 2014Costs incurred to date $ 227,667 $ 212,214
Profit to date, including loss accruals 15,611 14,955
Revenue earned to date 243,278 227,169
Billing to date 241,508 226,316
Costs and estimated earnings in excess of billings $ 1,770 $ 853
❖ Dollars are in thousands. Years ended December 31.
These costs and estimated earnings are included in the accompanying consolidated balance sheets under the
following captions at December 31, 2015 and 2014:
2015 2014Accounts receivable $ 2,913 $ 1,690
Other accrued expenses (1,143) (837)
Costs and estimated earnings in excess of billings $ 1,770 $ 853
❖ Dollars are in thousands. Years ended December 31.
6. InventoriesInventories consist of the following:
2015 2014
Timber—finished goods $ 2,278 $ 610
Other 1,028 292
Total inventories $ 3,306 $ 902
❖ Dollars are in thousands. Years ended December 31.
7. Property and EquipmentProperty and equipment consist of the following:
2015 2014
Buildings, leaseholds and improvements $ 16,720 $ 16,964
Equipment and furnishings 20,198 20,240
Logging roads, yards and camps 203,399 200,347
Reforestation and silviculture costs 15,966 16,004
Total property and equipment 256,283 253,555
Less accumulated depreciation (232,806) (229,057)
Construction in progress 187 —
Land 17,393 17,393
Less property reclassified to assets held for sale (419) (504)
Net property and equipment $ 40,638 $ 41,387
❖ Dollars are in thousands. Years ended December 31.
Land held for development as commercial, recreational, or residential property totaling $15.5 million at December 31,
2015 and 2014 is included in the caption “Land” above.
5150
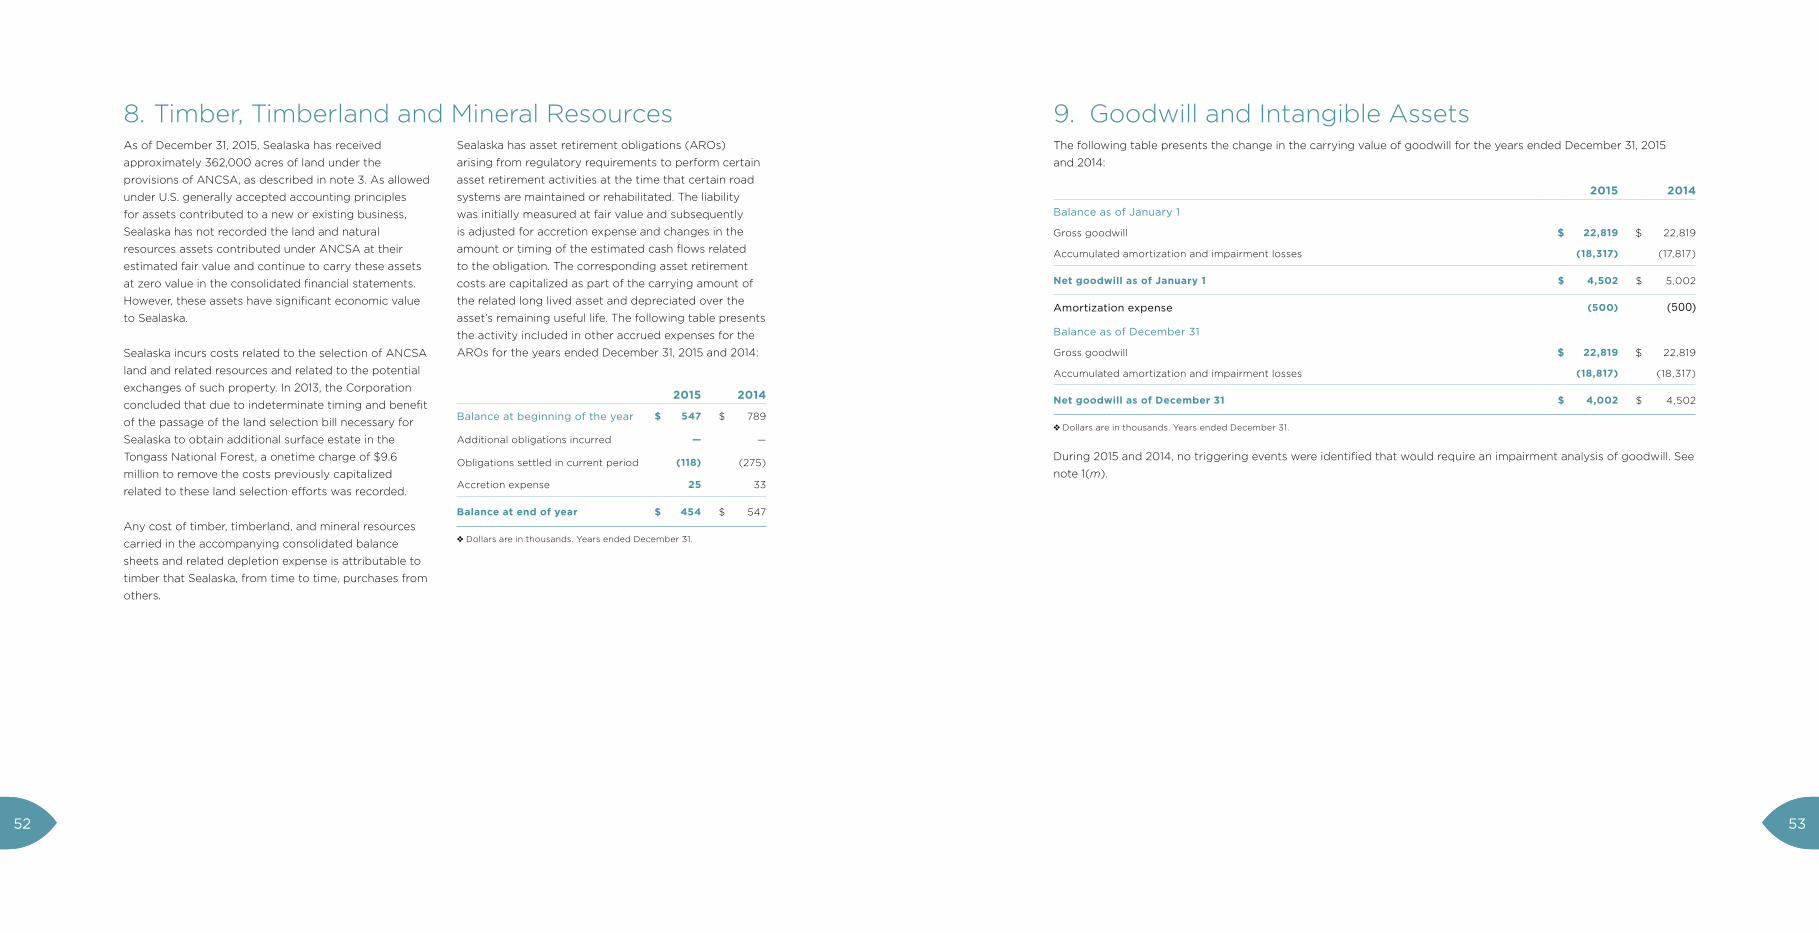
8. Timber, Timberland and Mineral ResourcesAs of December 31, 2015, Sealaska has received
approximately 362,000 acres of land under the
provisions of ANCSA, as described in note 3. As allowed
under U.S. generally accepted accounting principles
for assets contributed to a new or existing business,
Sealaska has not recorded the land and natural
resources assets contributed under ANCSA at their
estimated fair value and continue to carry these assets
at zero value in the consolidated financial statements.
However, these assets have significant economic value
to Sealaska.
Sealaska incurs costs related to the selection of ANCSA
land and related resources and related to the potential
exchanges of such property. In 2013, the Corporation
concluded that due to indeterminate timing and benefit
of the passage of the land selection bill necessary for
Sealaska to obtain additional surface estate in the
Tongass National Forest, a onetime charge of $9.6
million to remove the costs previously capitalized
related to these land selection efforts was recorded.
Any cost of timber, timberland, and mineral resources
carried in the accompanying consolidated balance
sheets and related depletion expense is attributable to
timber that Sealaska, from time to time, purchases from
others.
Sealaska has asset retirement obligations (AROs)
arising from regulatory requirements to perform certain
asset retirement activities at the time that certain road
systems are maintained or rehabilitated. The liability
was initially measured at fair value and subsequently
is adjusted for accretion expense and changes in the
amount or timing of the estimated cash flows related
to the obligation. The corresponding asset retirement
costs are capitalized as part of the carrying amount of
the related long lived asset and depreciated over the
asset’s remaining useful life. The following table presents
the activity included in other accrued expenses for the
AROs for the years ended December 31, 2015 and 2014:
2015 2014
Balance at beginning of the year $ 547 $ 789
Additional obligations incurred — —
Obligations settled in current period (118) (275)
Accretion expense 25 33
Balance at end of year $ 454 $ 547
❖ Dollars are in thousands. Years ended December 31.
9. Goodwill and Intangible AssetsThe following table presents the change in the carrying value of goodwill for the years ended December 31, 2015
and 2014:
2015 2014
Balance as of January 1
Gross goodwill $ 22,819 $ 22,819
Accumulated amortization and impairment losses (18,317) (17,817)
Net goodwill as of January 1 $ 4,502 $ 5,002
Amortization expense (500) (500)
Balance as of December 31
Gross goodwill $ 22,819 $ 22,819
Accumulated amortization and impairment losses (18,817) (18,317)
Net goodwill as of December 31 $ 4,002 $ 4,502
❖ Dollars are in thousands. Years ended December 31.
During 2015 and 2014, no triggering events were identified that would require an impairment analysis of goodwill. See
note 1(m).
5352
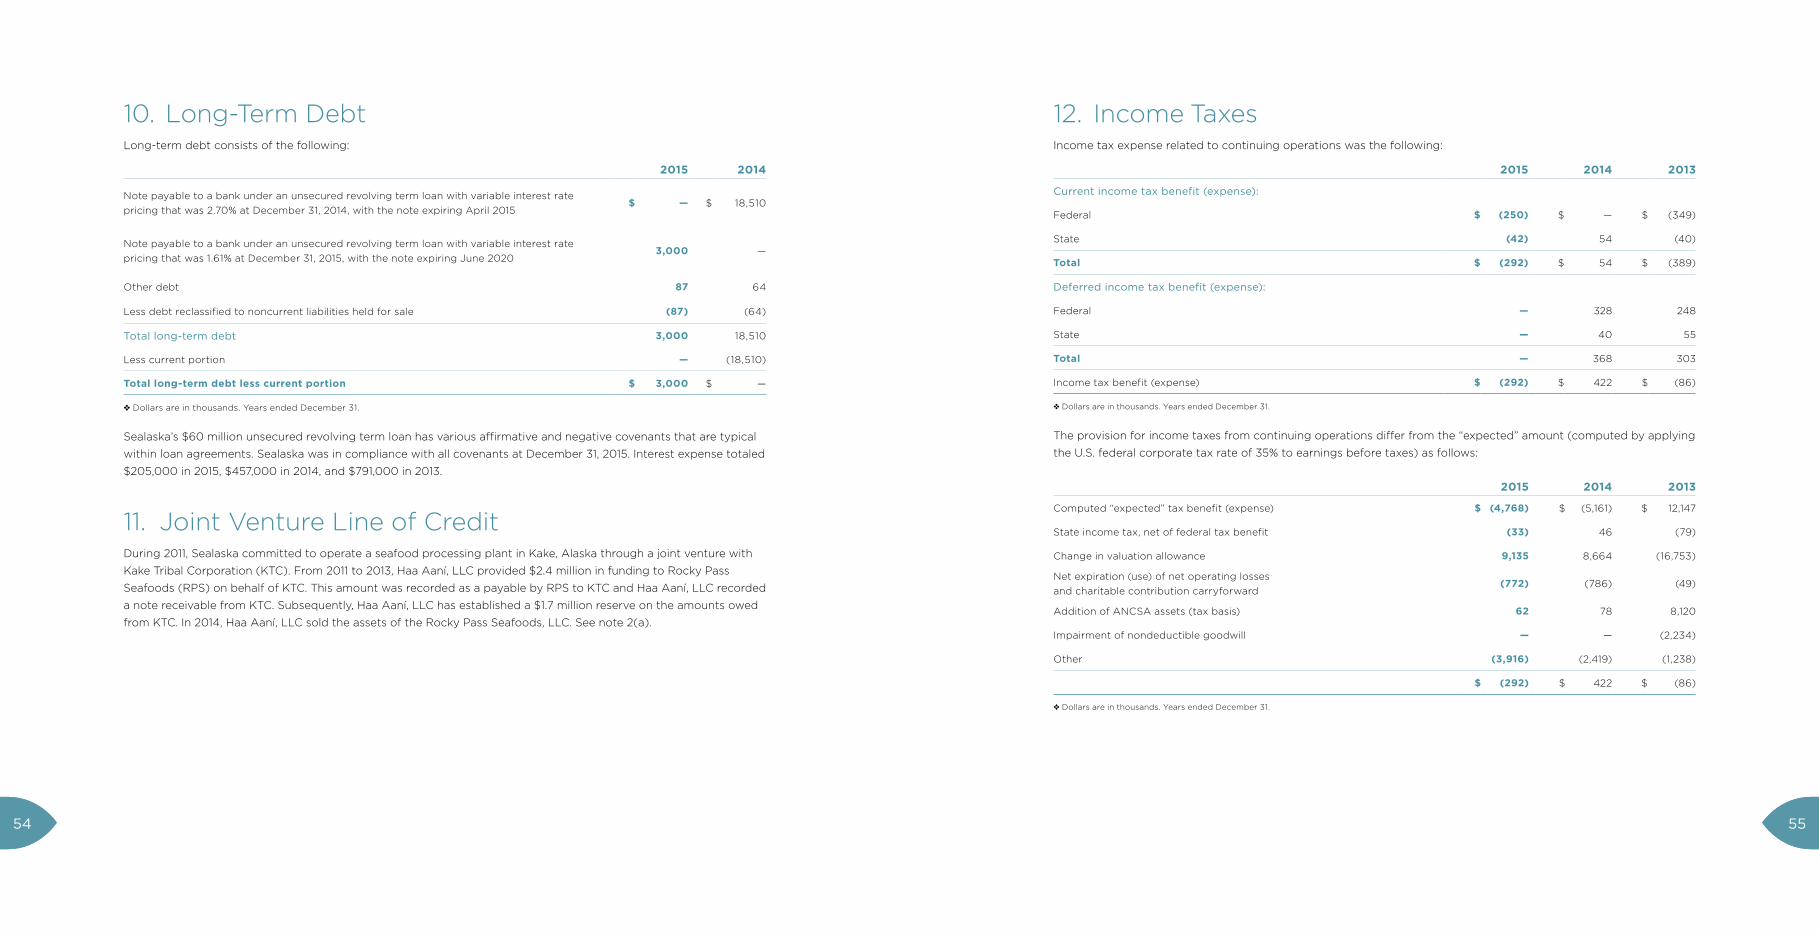
10. Long-Term DebtLong-term debt consists of the following:
2015 2014
Note payable to a bank under an unsecured revolving term loan with variable interest rate
pricing that was 2.70% at December 31, 2014, with the note expiring April 2015$ — $ 18,510
Note payable to a bank under an unsecured revolving term loan with variable interest rate
pricing that was 1.61% at December 31, 2015, with the note expiring June 20203,000 —
Other debt 87 64
Less debt reclassified to noncurrent liabilities held for sale (87) (64)
Total long-term debt 3,000 18,510
Less current portion — (18,510)
Total long-term debt less current portion $ 3,000 $ —
❖ Dollars are in thousands. Years ended December 31.
Sealaska’s $60 million unsecured revolving term loan has various affirmative and negative covenants that are typical
within loan agreements. Sealaska was in compliance with all covenants at December 31, 2015. Interest expense totaled
$205,000 in 2015, $457,000 in 2014, and $791,000 in 2013.
11. Joint Venture Line of CreditDuring 2011, Sealaska committed to operate a seafood processing plant in Kake, Alaska through a joint venture with
Kake Tribal Corporation (KTC). From 2011 to 2013, Haa Aaní, LLC provided $2.4 million in funding to Rocky Pass
Seafoods (RPS) on behalf of KTC. This amount was recorded as a payable by RPS to KTC and Haa Aaní, LLC recorded
a note receivable from KTC. Subsequently, Haa Aaní, LLC has established a $1.7 million reserve on the amounts owed
from KTC. In 2014, Haa Aaní, LLC sold the assets of the Rocky Pass Seafoods, LLC. See note 2(a).
12. Income TaxesIncome tax expense related to continuing operations was the following:
2015 2014 2013
Current income tax benefit (expense):
Federal $ (250) $ — $ (349)
State (42) 54 (40)
Total $ (292) $ 54 $ (389)
Deferred income tax benefit (expense):
Federal — 328 248
State — 40 55
Total — 368 303
Income tax benefit (expense) $ (292) $ 422 $ (86)
❖ Dollars are in thousands. Years ended December 31.
The provision for income taxes from continuing operations differ from the “expected” amount (computed by applying
the U.S. federal corporate tax rate of 35% to earnings before taxes) as follows:
2015 2014 2013
Computed “expected” tax benefit (expense) $ (4,768) $ (5,161) $ 12,147
State income tax, net of federal tax benefit (33) 46 (79)
Change in valuation allowance 9,135 8,664 (16,753)
Net expiration (use) of net operating losses
and charitable contribution carryforward(772) (786) (49)
Addition of ANCSA assets (tax basis) 62 78 8,120
Impairment of nondeductible goodwill — — (2,234)
Other (3,916) (2,419) (1,238)
$ (292) $ 422 $ (86)
❖ Dollars are in thousands. Years ended December 31.
5554
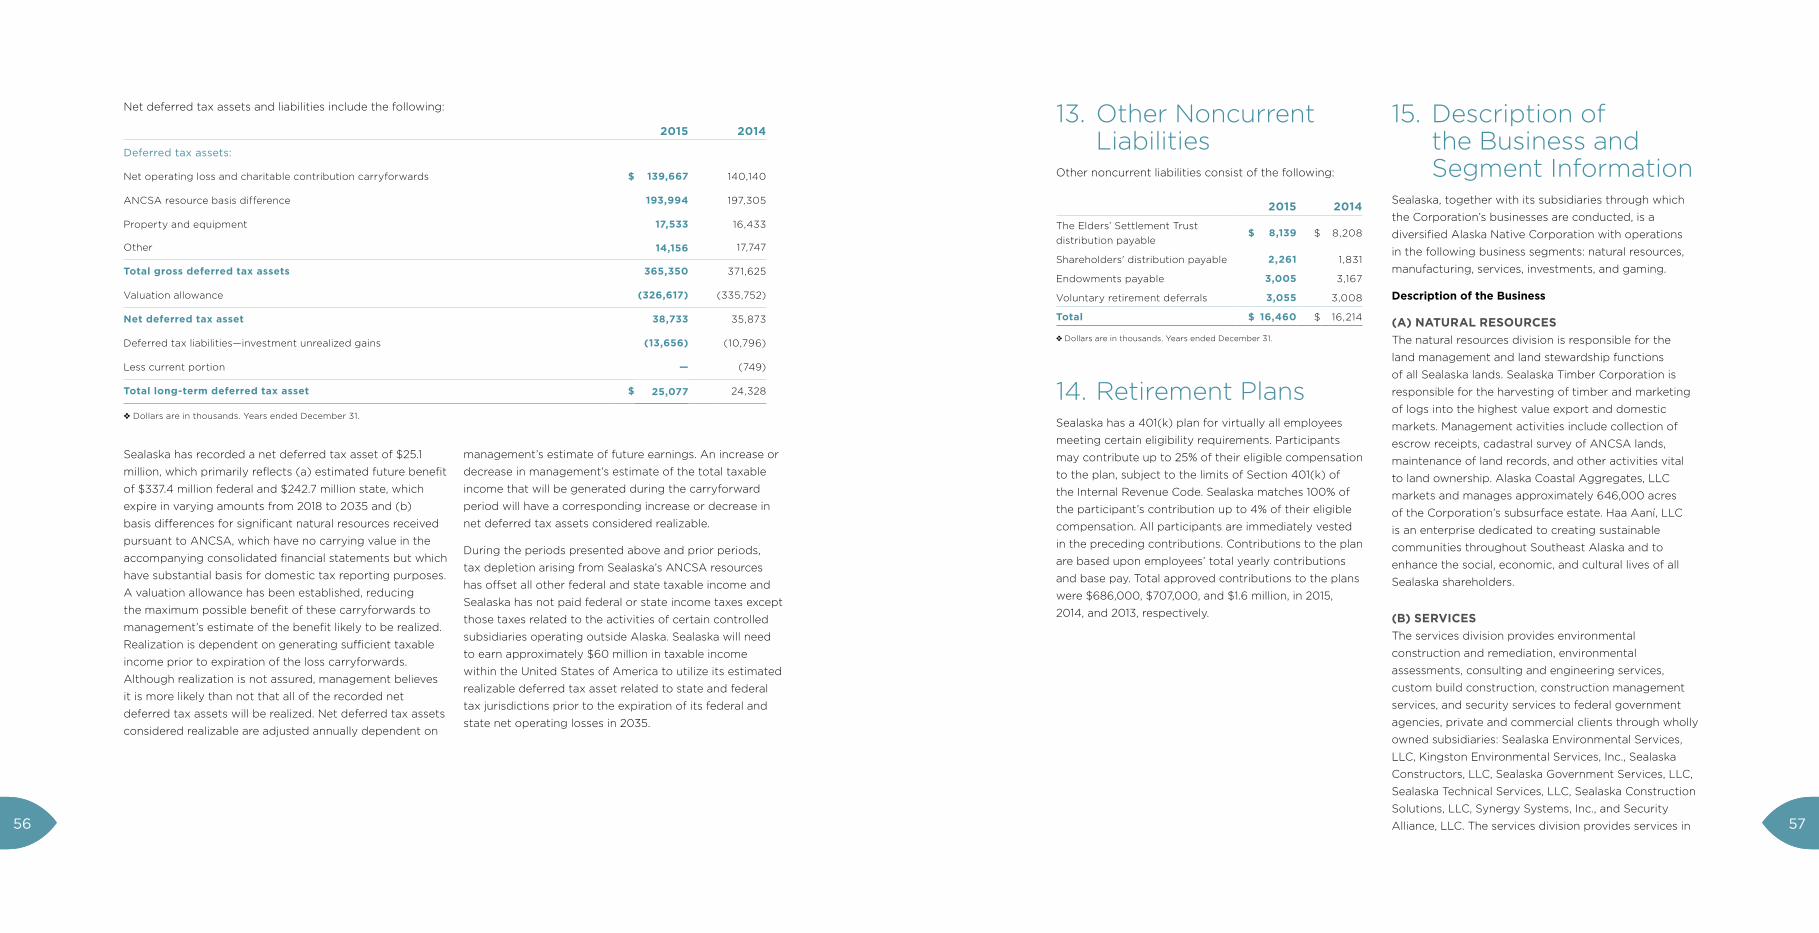
Net deferred tax assets and liabilities include the following:
2015 2014
Deferred tax assets:
Net operating loss and charitable contribution carryforwards $ 139,667 140,140
ANCSA resource basis difference 193,994 197,305
Property and equipment 17,533 16,433
Other 14,156 17,747
Total gross deferred tax assets 365,350 371,625
Valuation allowance (326,617) (335,752)
Net deferred tax asset 38,733 35,873
Deferred tax liabilities—investment unrealized gains (13,656) (10,796)
Less current portion — (749)
Total long-term deferred tax asset $ 25,077 24,328
❖ Dollars are in thousands. Years ended December 31.
Sealaska has recorded a net deferred tax asset of $25.1
million, which primarily reflects (a) estimated future benefit
of $337.4 million federal and $242.7 million state, which
expire in varying amounts from 2018 to 2035 and (b)
basis differences for significant natural resources received
pursuant to ANCSA, which have no carrying value in the
accompanying consolidated financial statements but which
have substantial basis for domestic tax reporting purposes.
A valuation allowance has been established, reducing
the maximum possible benefit of these carryforwards to
management’s estimate of the benefit likely to be realized.
Realization is dependent on generating sufficient taxable
income prior to expiration of the loss carryforwards.
Although realization is not assured, management believes
it is more likely than not that all of the recorded net
deferred tax assets will be realized. Net deferred tax assets
considered realizable are adjusted annually dependent on
management’s estimate of future earnings. An increase or
decrease in management’s estimate of the total taxable
income that will be generated during the carryforward
period will have a corresponding increase or decrease in
net deferred tax assets considered realizable.
During the periods presented above and prior periods,
tax depletion arising from Sealaska’s ANCSA resources
has offset all other federal and state taxable income and
Sealaska has not paid federal or state income taxes except
those taxes related to the activities of certain controlled
subsidiaries operating outside Alaska. Sealaska will need
to earn approximately $60 million in taxable income
within the United States of America to utilize its estimated
realizable deferred tax asset related to state and federal
tax jurisdictions prior to the expiration of its federal and
state net operating losses in 2035.
13. Other Noncurrent Liabilities
Other noncurrent liabilities consist of the following:
2015 2014
The Elders’ Settlement Trust
distribution payable$ 8,139 $ 8,208
Shareholders' distribution payable 2,261 1,831
Endowments payable 3,005 3,167
Voluntary retirement deferrals 3,055 3,008
Total $ 16,460 $ 16,214
❖ Dollars are in thousands. Years ended December 31.
14. Retirement PlansSealaska has a 401(k) plan for virtually all employees
meeting certain eligibility requirements. Participants
may contribute up to 25% of their eligible compensation
to the plan, subject to the limits of Section 401(k) of
the Internal Revenue Code. Sealaska matches 100% of
the participant’s contribution up to 4% of their eligible
compensation. All participants are immediately vested
in the preceding contributions. Contributions to the plan
are based upon employees’ total yearly contributions
and base pay. Total approved contributions to the plans
were $686,000, $707,000, and $1.6 million, in 2015,
2014, and 2013, respectively.
15. Description of the Business and Segment Information
Sealaska, together with its subsidiaries through which
the Corporation’s businesses are conducted, is a
diversified Alaska Native Corporation with operations
in the following business segments: natural resources,
manufacturing, services, investments, and gaming.
Description of the Business
(A) NATURAL RESOURCESThe natural resources division is responsible for the
land management and land stewardship functions
of all Sealaska lands. Sealaska Timber Corporation is
responsible for the harvesting of timber and marketing
of logs into the highest value export and domestic
markets. Management activities include collection of
escrow receipts, cadastral survey of ANCSA lands,
maintenance of land records, and other activities vital
to land ownership. Alaska Coastal Aggregates, LLC
markets and manages approximately 646,000 acres
of the Corporation’s subsurface estate. Haa Aaní, LLC
is an enterprise dedicated to creating sustainable
communities throughout Southeast Alaska and to
enhance the social, economic, and cultural lives of all
Sealaska shareholders.
(B) SERVICESThe services division provides environmental
construction and remediation, environmental
assessments, consulting and engineering services,
custom build construction, construction management
services, and security services to federal government
agencies, private and commercial clients through wholly
owned subsidiaries: Sealaska Environmental Services,
LLC, Kingston Environmental Services, Inc., Sealaska
Constructors, LLC, Sealaska Government Services, LLC,
Sealaska Technical Services, LLC, Sealaska Construction
Solutions, LLC, Synergy Systems, Inc., and Security
Alliance, LLC. The services division provides services in 5756
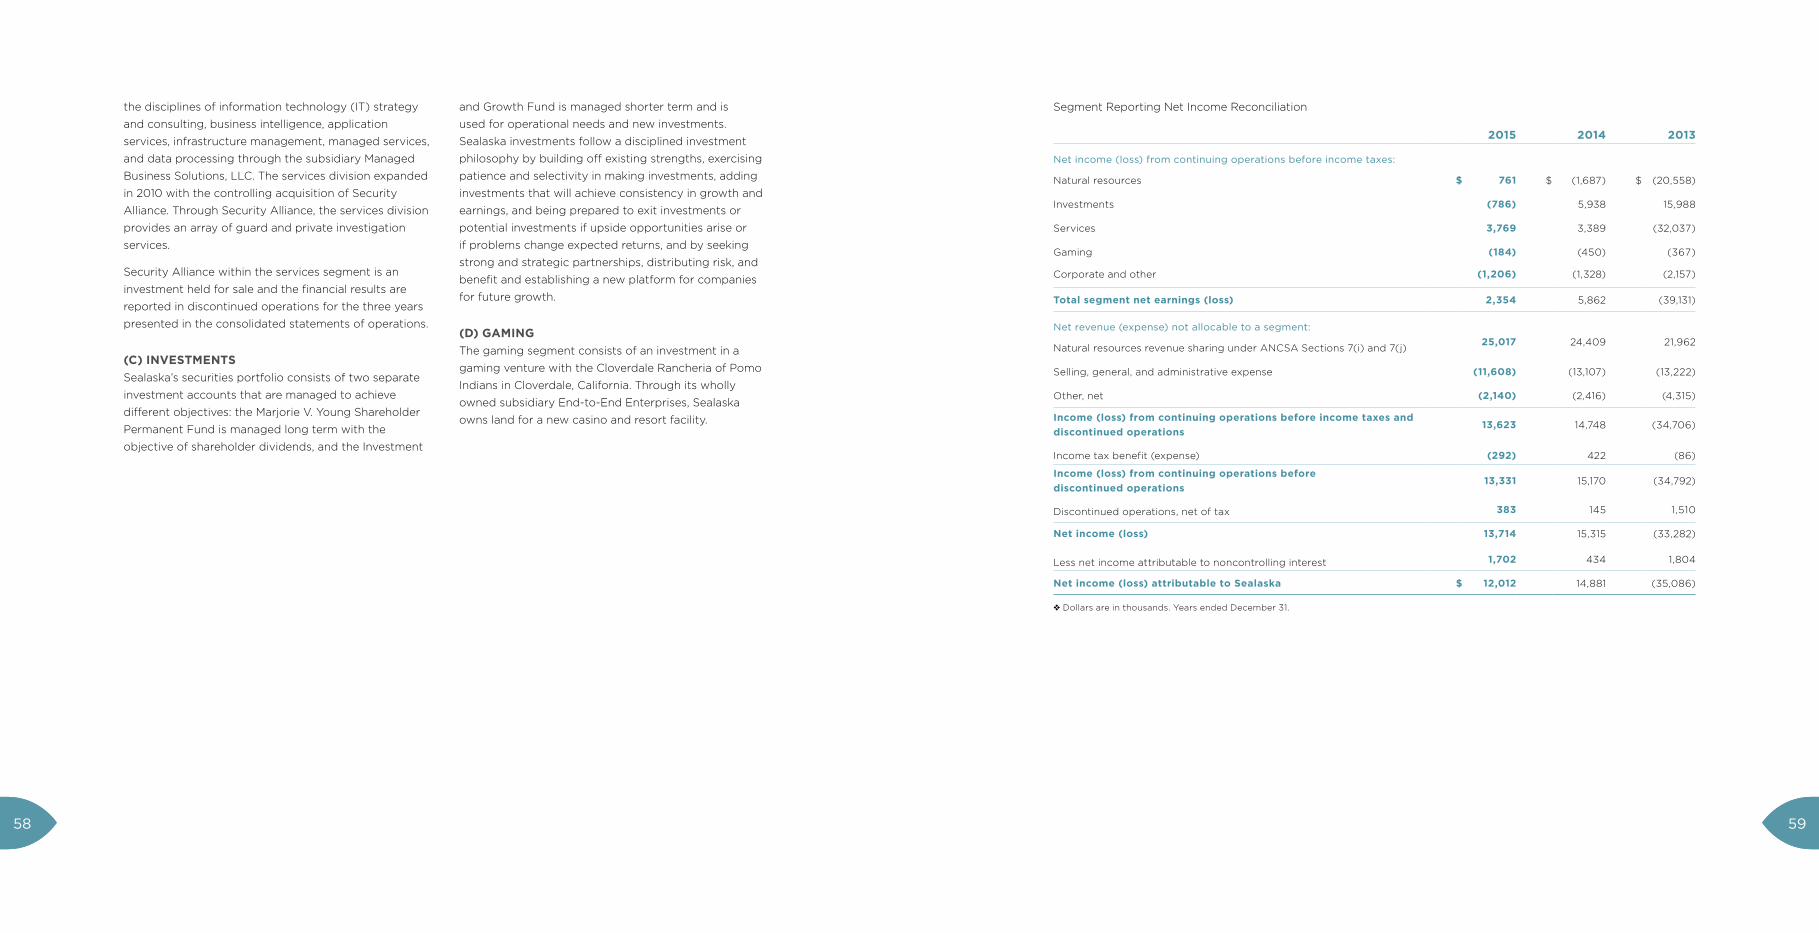
the disciplines of information technology (IT) strategy
and consulting, business intelligence, application
services, infrastructure management, managed services,
and data processing through the subsidiary Managed
Business Solutions, LLC. The services division expanded
in 2010 with the controlling acquisition of Security
Alliance. Through Security Alliance, the services division
provides an array of guard and private investigation
services.
Security Alliance within the services segment is an
investment held for sale and the financial results are
reported in discontinued operations for the three years
presented in the consolidated statements of operations.
(C) INVESTMENTSSealaska’s securities portfolio consists of two separate
investment accounts that are managed to achieve
different objectives: the Marjorie V. Young Shareholder
Permanent Fund is managed long term with the
objective of shareholder dividends, and the Investment
and Growth Fund is managed shorter term and is
used for operational needs and new investments.
Sealaska investments follow a disciplined investment
philosophy by building off existing strengths, exercising
patience and selectivity in making investments, adding
investments that will achieve consistency in growth and
earnings, and being prepared to exit investments or
potential investments if upside opportunities arise or
if problems change expected returns, and by seeking
strong and strategic partnerships, distributing risk, and
benefit and establishing a new platform for companies
for future growth.
(D) GAMINGThe gaming segment consists of an investment in a
gaming venture with the Cloverdale Rancheria of Pomo
Indians in Cloverdale, California. Through its wholly
owned subsidiary End-to-End Enterprises, Sealaska
owns land for a new casino and resort facility.
Segment Reporting Net Income Reconciliation
2015 2014 2013
Net income (loss) from continuing operations before income taxes:
Natural resources $ 761 $ (1,687) $ (20,558)
Investments (786) 5,938 15,988
Services 3,769 3,389 (32,037)
Gaming (184) (450) (367)
Corporate and other (1,206) (1,328) (2,157)
Total segment net earnings (loss) 2,354 5,862 (39,131)
Net revenue (expense) not allocable to a segment:
Natural resources revenue sharing under ANCSA Sections 7(i) and 7(j)25,017 24,409 21,962
Selling, general, and administrative expense (11,608) (13,107) (13,222)
Other, net (2,140) (2,416) (4,315)
Income (loss) from continuing operations before income taxes and discontinued operations
13,623 14,748 (34,706)
Income tax benefit (expense) (292) 422 (86)
Income (loss) from continuing operations before discontinued operations
13,331 15,170 (34,792)
Discontinued operations, net of tax 383 145 1,510
Net income (loss) 13,714 15,315 (33,282)
Less net income attributable to noncontrolling interest 1,702 434 1,804
Net income (loss) attributable to Sealaska $ 12,012 14,881 (35,086)
❖ Dollars are in thousands. Years ended December 31.
5958
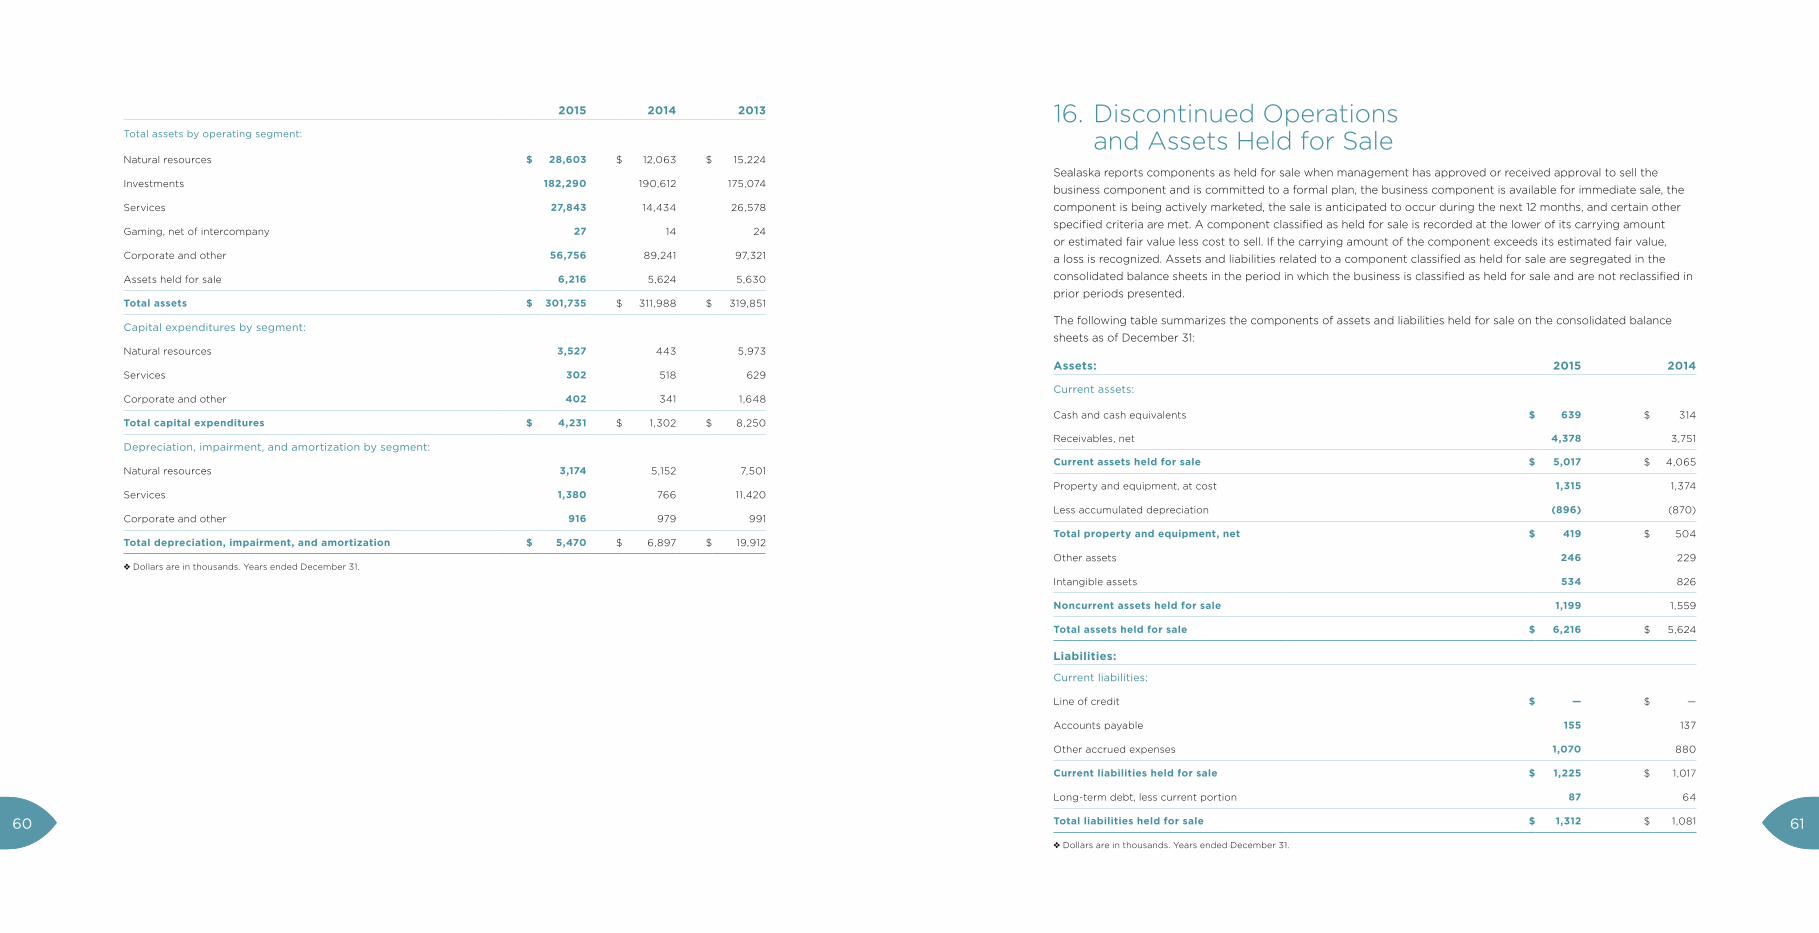
2015 2014 2013
Total assets by operating segment:
Natural resources $ 28,603 $ 12,063 $ 15,224
Investments 182,290 190,612 175,074
Services 27,843 14,434 26,578
Gaming, net of intercompany 27 14 24
Corporate and other 56,756 89,241 97,321
Assets held for sale 6,216 5,624 5,630
Total assets $ 301,735 $ 311,988 $ 319,851
Capital expenditures by segment:
Natural resources 3,527 443 5,973
Services 302 518 629
Corporate and other 402 341 1,648
Total capital expenditures $ 4,231 $ 1,302 $ 8,250
Depreciation, impairment, and amortization by segment:
Natural resources 3,174 5,152 7,501
Services 1,380 766 11,420
Corporate and other 916 979 991
Total depreciation, impairment, and amortization $ 5,470 $ 6,897 $ 19,912
❖ Dollars are in thousands. Years ended December 31.
16. Discontinued Operations and Assets Held for Sale
Sealaska reports components as held for sale when management has approved or received approval to sell the
business component and is committed to a formal plan, the business component is available for immediate sale, the
component is being actively marketed, the sale is anticipated to occur during the next 12 months, and certain other
specified criteria are met. A component classified as held for sale is recorded at the lower of its carrying amount
or estimated fair value less cost to sell. If the carrying amount of the component exceeds its estimated fair value,
a loss is recognized. Assets and liabilities related to a component classified as held for sale are segregated in the
consolidated balance sheets in the period in which the business is classified as held for sale and are not reclassified in
prior periods presented.
The following table summarizes the components of assets and liabilities held for sale on the consolidated balance
sheets as of December 31:
Assets: 2015 2014
Current assets:
Cash and cash equivalents $ 639 $ 314
Receivables, net 4,378 3,751
Current assets held for sale $ 5,017 $ 4,065
Property and equipment, at cost 1,315 1,374
Less accumulated depreciation (896) (870)
Total property and equipment, net $ 419 $ 504
Other assets 246 229
Intangible assets 534 826
Noncurrent assets held for sale 1,199 1,559
Total assets held for sale $ 6,216 $ 5,624
Liabilities:
Current liabilities:
Line of credit $ — $ —
Accounts payable 155 137
Other accrued expenses 1,070 880
Current liabilities held for sale $ 1,225 $ 1,017
Long-term debt, less current portion 87 64
Total liabilities held for sale $ 1,312 $ 1,081
❖ Dollars are in thousands. Years ended December 31.
6160
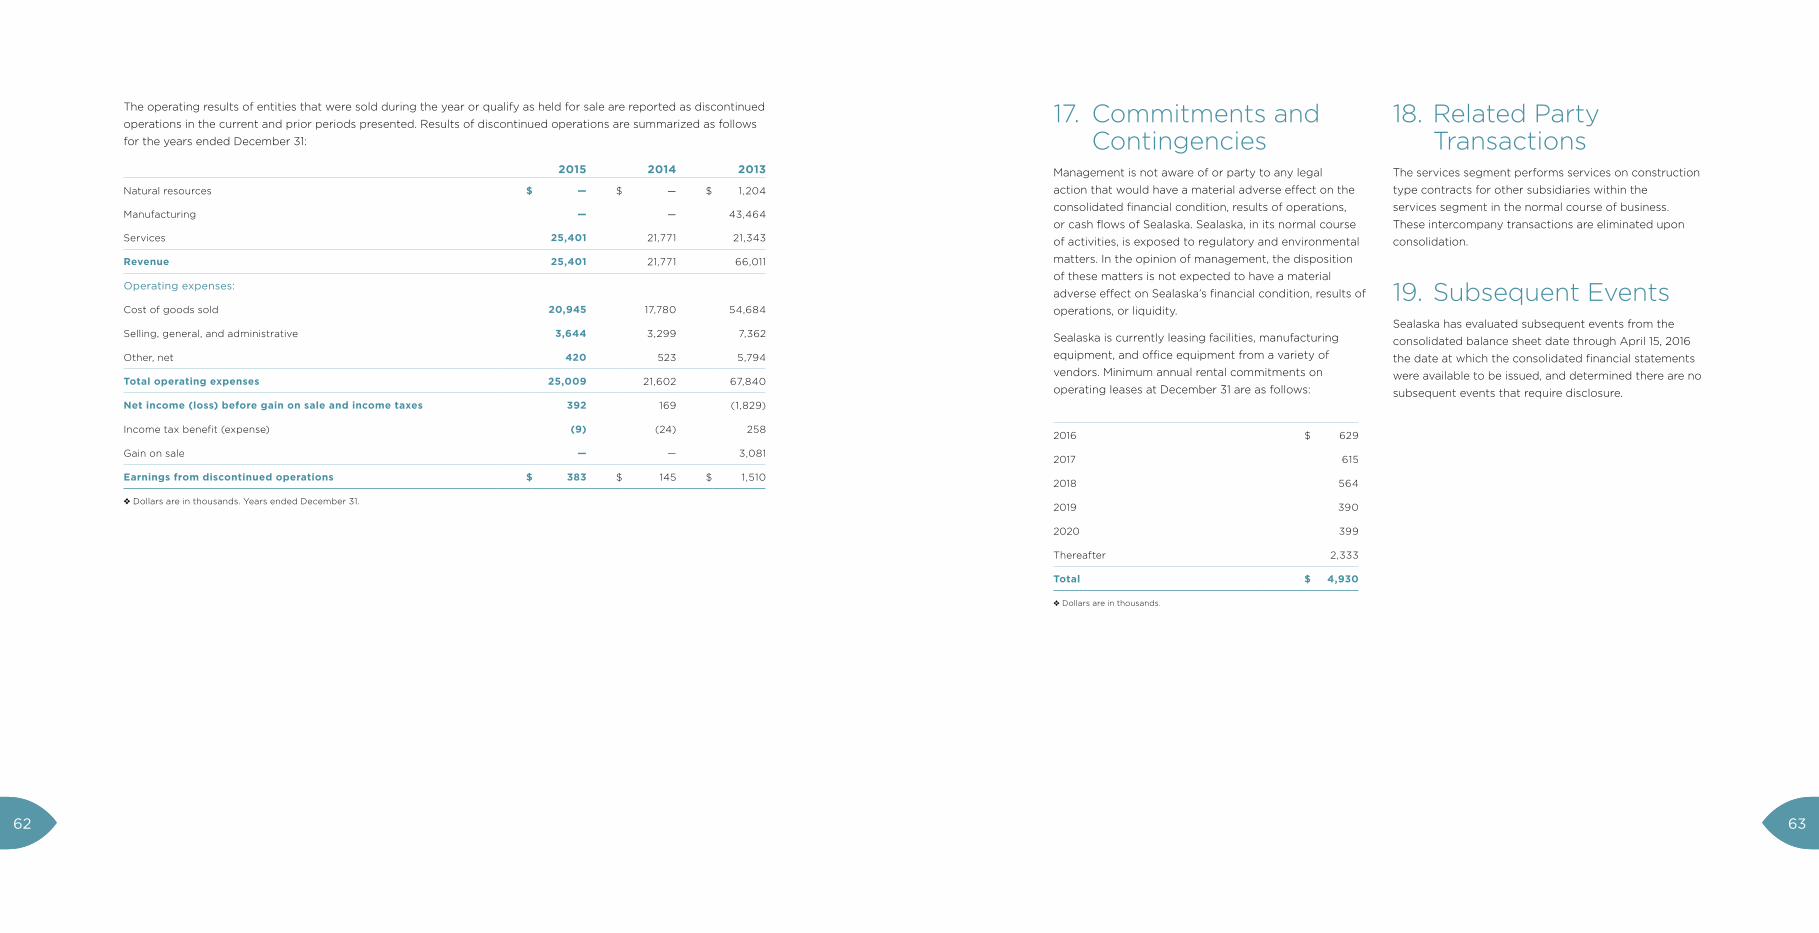
The operating results of entities that were sold during the year or qualify as held for sale are reported as discontinued
operations in the current and prior periods presented. Results of discontinued operations are summarized as follows
for the years ended December 31:
2015 2014 2013
Natural resources $ — $ — $ 1,204
Manufacturing — — 43,464
Services 25,401 21,771 21,343
Revenue 25,401 21,771 66,011
Operating expenses:
Cost of goods sold 20,945 17,780 54,684
Selling, general, and administrative 3,644 3,299 7,362
Other, net 420 523 5,794
Total operating expenses 25,009 21,602 67,840
Net income (loss) before gain on sale and income taxes 392 169 (1,829)
Income tax benefit (expense) (9) (24) 258
Gain on sale — — 3,081
Earnings from discontinued operations $ 383 $ 145 $ 1,510
❖ Dollars are in thousands. Years ended December 31.
17. Commitments and Contingencies
Management is not aware of or party to any legal
action that would have a material adverse effect on the
consolidated financial condition, results of operations,
or cash flows of Sealaska. Sealaska, in its normal course
of activities, is exposed to regulatory and environmental
matters. In the opinion of management, the disposition
of these matters is not expected to have a material
adverse effect on Sealaska’s financial condition, results of
operations, or liquidity.
Sealaska is currently leasing facilities, manufacturing
equipment, and office equipment from a variety of
vendors. Minimum annual rental commitments on
operating leases at December 31 are as follows:
2016 $ 629
2017 615
2018 564
2019 390
2020 399
Thereafter 2,333
Total $ 4,930
❖ Dollars are in thousands.
18. Related Party Transactions
The services segment performs services on construction
type contracts for other subsidiaries within the
services segment in the normal course of business.
These intercompany transactions are eliminated upon
consolidation.
19. Subsequent EventsSealaska has evaluated subsequent events from the
consolidated balance sheet date through April 15, 2016
the date at which the consolidated financial statements
were available to be issued, and determined there are no
subsequent events that require disclosure.
6362
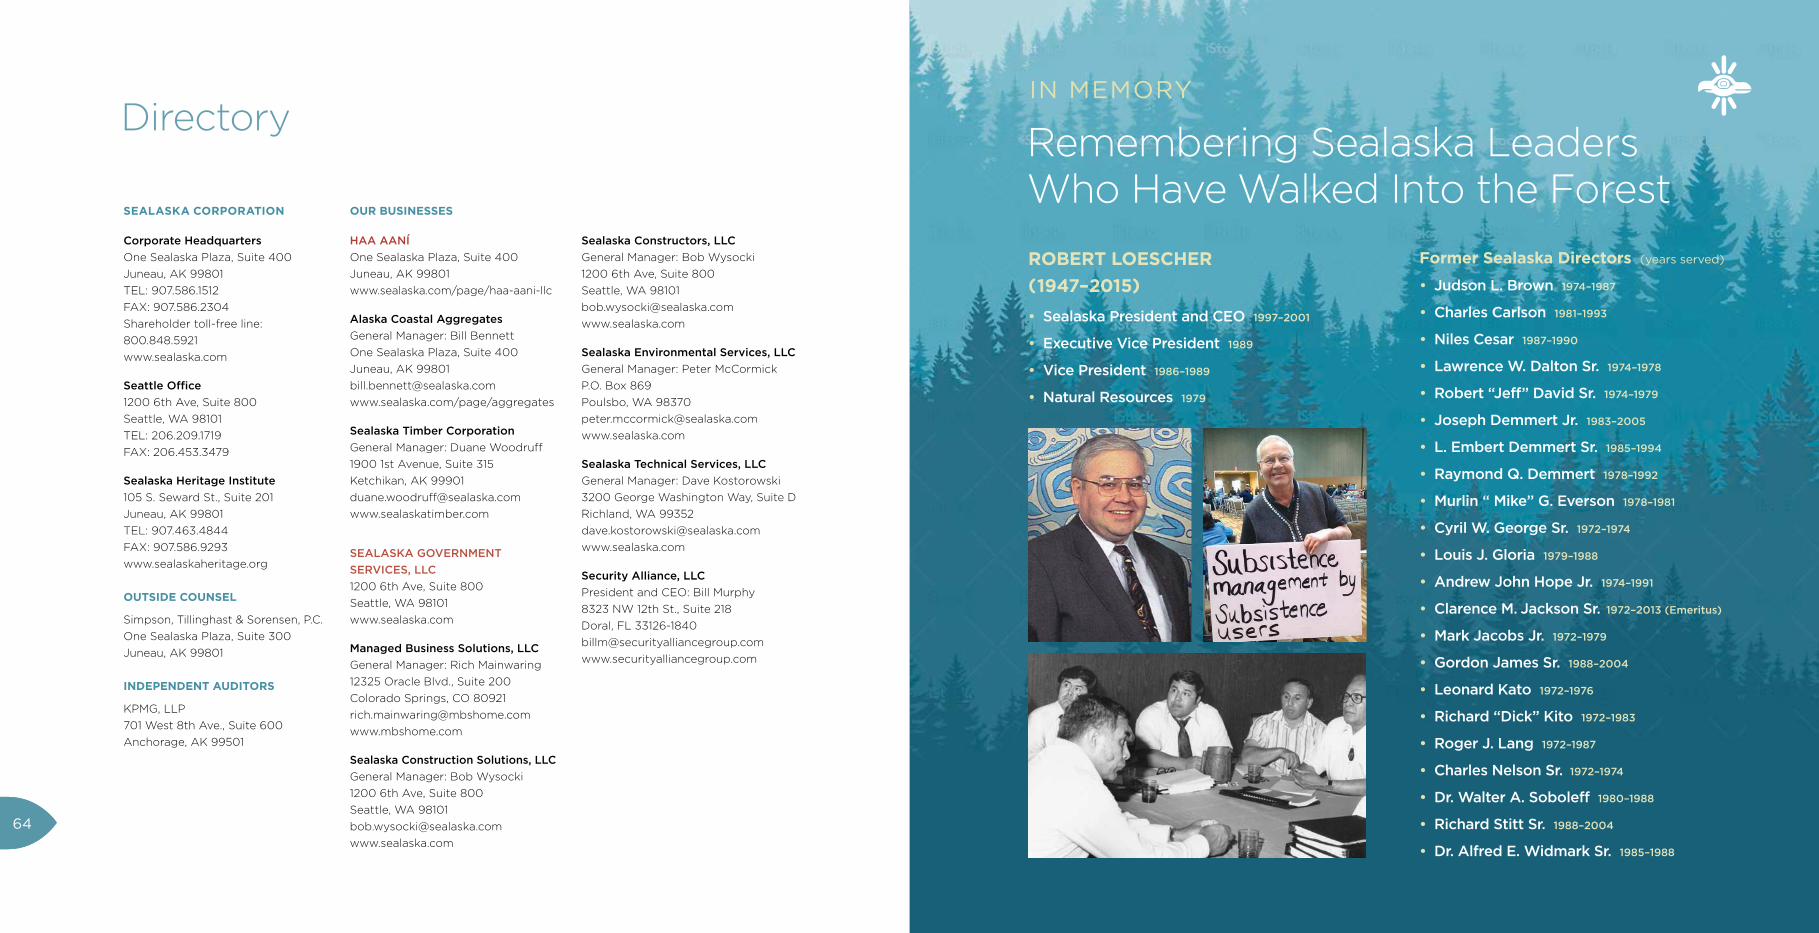
Remembering Sealaska Leaders Who Have Walked Into the Forest
IN MEMORY
ROBERT LOESCHER (1947–2015)
• SealaskaPresidentandCEO1997–2001
• ExecutiveVicePresident1989
• VicePresident1986–1989
• NaturalResources1979
Former Sealaska Directors (years served)
• JudsonL.Brown1974–1987
• CharlesCarlson1981–1993
• NilesCesar1987–1990
• LawrenceW.DaltonSr.1974–1978
• Robert“Jeff”DavidSr.1974–1979
• JosephDemmertJr.1983–2005
• L.EmbertDemmertSr.1985–1994
• RaymondQ.Demmert1978–1992
• Murlin“Mike”G.Everson1978–1981
• CyrilW.GeorgeSr.1972–1974
• LouisJ.Gloria1979–1988
• AndrewJohnHopeJr.1974–1991
• ClarenceM.JacksonSr.1972–2013(Emeritus)
• MarkJacobsJr.1972–1979
• GordonJamesSr.1988–2004
• LeonardKato1972–1976
• Richard“Dick”Kito1972–1983
• RogerJ.Lang1972–1987
• CharlesNelsonSr.1972–1974
• Dr.WalterA.Soboleff1980–1988
• RichardStittSr.1988–2004
• Dr.AlfredE.WidmarkSr.1985–1988
PICTURED ON THE COVER:
The One People Canoe Society
led by skipper and shareholder
Doug Chilton was photographed
this winter in the Gastineau
Channel near downtown Juneau.
Wayne Price skippers the
North Tide Canoe, a traditional
dugout canoe. In this image
the paddlers arrive at Sandy
Beach for the 2014 Canoe
Journey to Celebration.
Directory
HAA AANÍ
One Sealaska Plaza, Suite 400
Juneau, AK 99801
www.sealaska.com/page/haa-aani-llc
Alaska Coastal Aggregates
General Manager: Bill Bennett
One Sealaska Plaza, Suite 400
Juneau, AK 99801
www.sealaska.com/page/aggregates
Sealaska Timber Corporation
General Manager: Duane Woodruff
1900 1st Avenue, Suite 315
Ketchikan, AK 99901
www.sealaskatimber.com
SEALASKA GOVERNMENT
SERVICES, LLC
1200 6th Ave, Suite 800
Seattle, WA 98101
www.sealaska.com
Managed Business Solutions, LLC
General Manager: Rich Mainwaring
12325 Oracle Blvd., Suite 200
Colorado Springs, CO 80921
www.mbshome.com
Sealaska Construction Solutions, LLC
General Manager: Bob Wysocki
1200 6th Ave, Suite 800
Seattle, WA 98101
www.sealaska.com
Sealaska Constructors, LLC
General Manager: Bob Wysocki
1200 6th Ave, Suite 800
Seattle, WA 98101
www.sealaska.com
Sealaska Environmental Services, LLC
General Manager: Peter McCormick
P.O. Box 869
Poulsbo, WA 98370
www.sealaska.com
Sealaska Technical Services, LLC
General Manager: Dave Kostorowski
3200 George Washington Way, Suite D
Richland, WA 99352
www.sealaska.com
Security Alliance, LLC
President and CEO: Bill Murphy
8323 NW 12th St., Suite 218
Doral, FL 33126-1840
www.securityalliancegroup.com
Corporate Headquarters
One Sealaska Plaza, Suite 400
Juneau, AK 99801
TEL: 907.586.1512
FAX: 907.586.2304
Shareholder toll-free line:
800.848.5921
www.sealaska.com
Seattle Office
1200 6th Ave, Suite 800
Seattle, WA 98101
TEL: 206.209.1719
FAX: 206.453.3479
Sealaska Heritage Institute
105 S. Seward St., Suite 201
Juneau, AK 99801
TEL: 907.463.4844
FAX: 907.586.9293
www.sealaskaheritage.org
OUTSIDE COUNSEL
Simpson, Tillinghast & Sorensen, P.C.
One Sealaska Plaza, Suite 300
Juneau, AK 99801
INDEPENDENT AUDITORS
KPMG, LLP
701 West 8th Ave., Suite 600
Anchorage, AK 99501
SEALASKA CORPORATION OUR BUSINESSES
64
www.sealaska.com
Sealaska Annual Report
STABILITY IN MOTION
2015
Photo credits: Linda Demmert, Bethany Goodrich, Eirik Johnson, Mark Kelley, Katarina Sostaric, Brian Wallace and the Traver Gallery.
© 2016 Sealaska Corporation. Produced by Morgan Howard Communications. Designed by Mark Tolleshaug. Printed by Visions, Inc.
Paper is certified by the Rainforest Alliance for FSC standards.
20
15 S
EA
LA
SK
A A
NN
UA
L R
EP
OR
T
Please recycle