values in action - sealaska corporation sealaska annual... · nypro kánaak managing director:...
TRANSCRIPT

www.sealaska.com
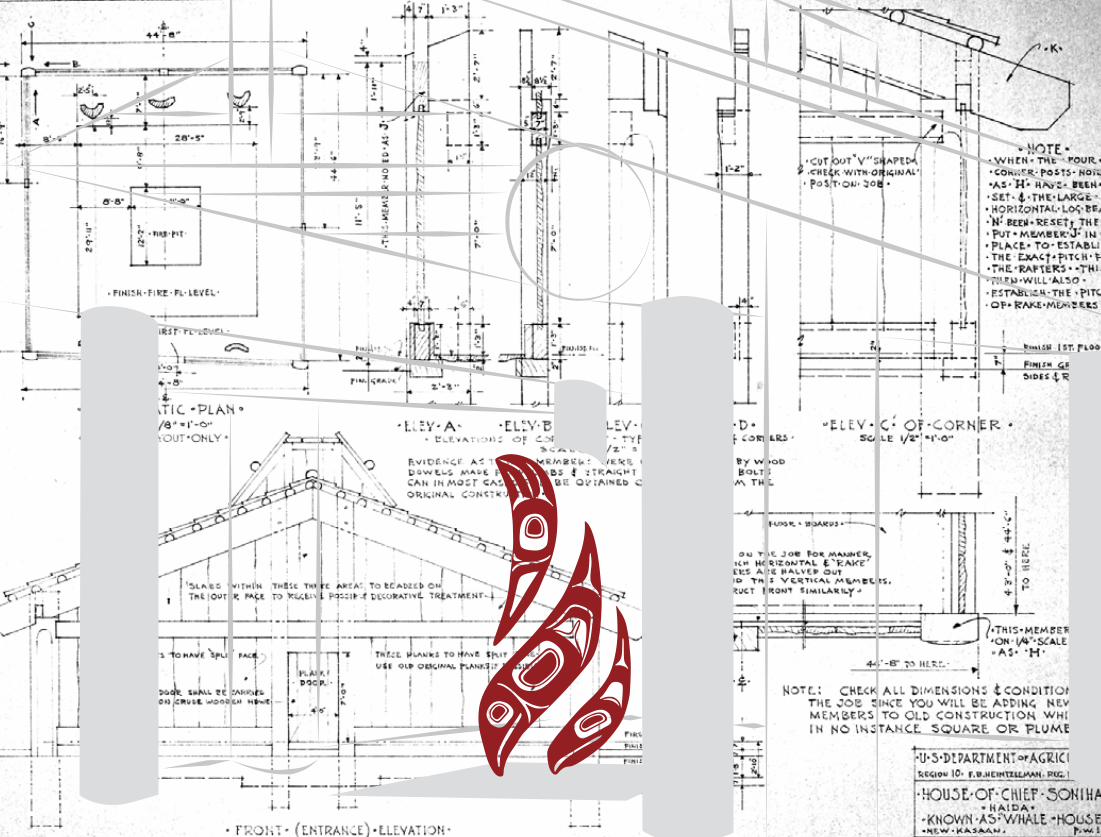
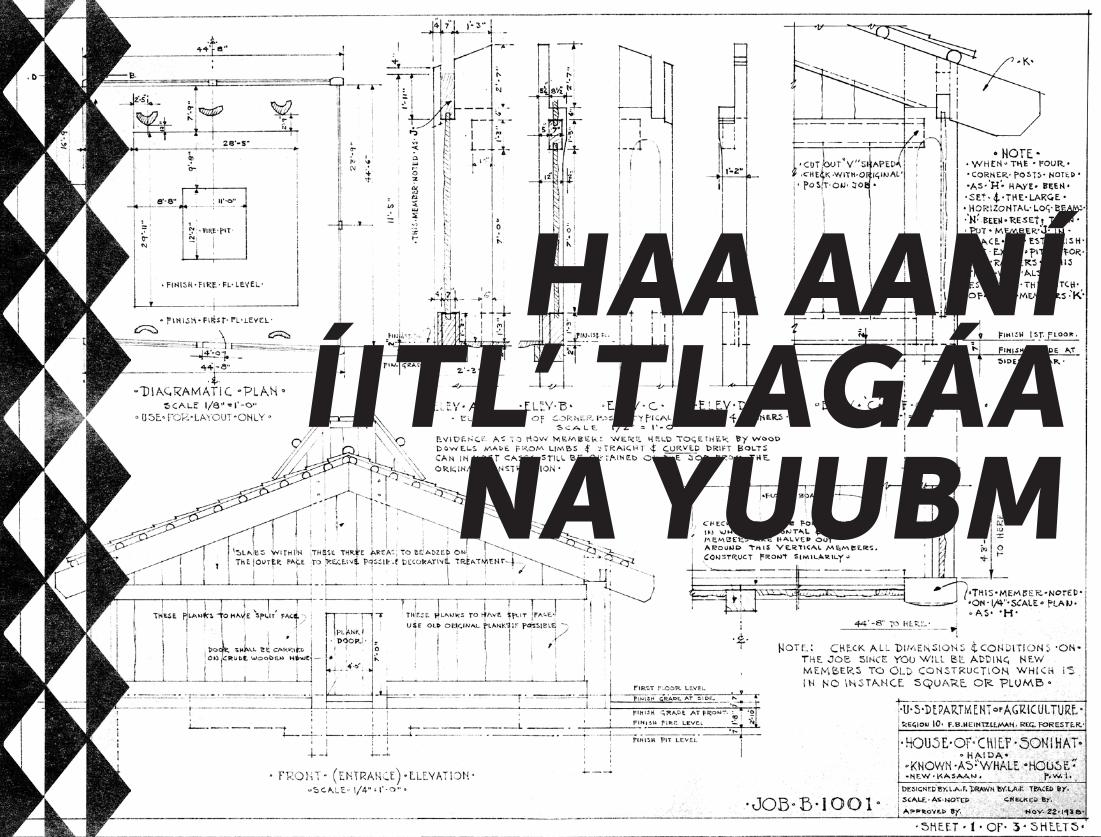
Repeated graphics: Killer Whale Teeth by Larry McNeil and
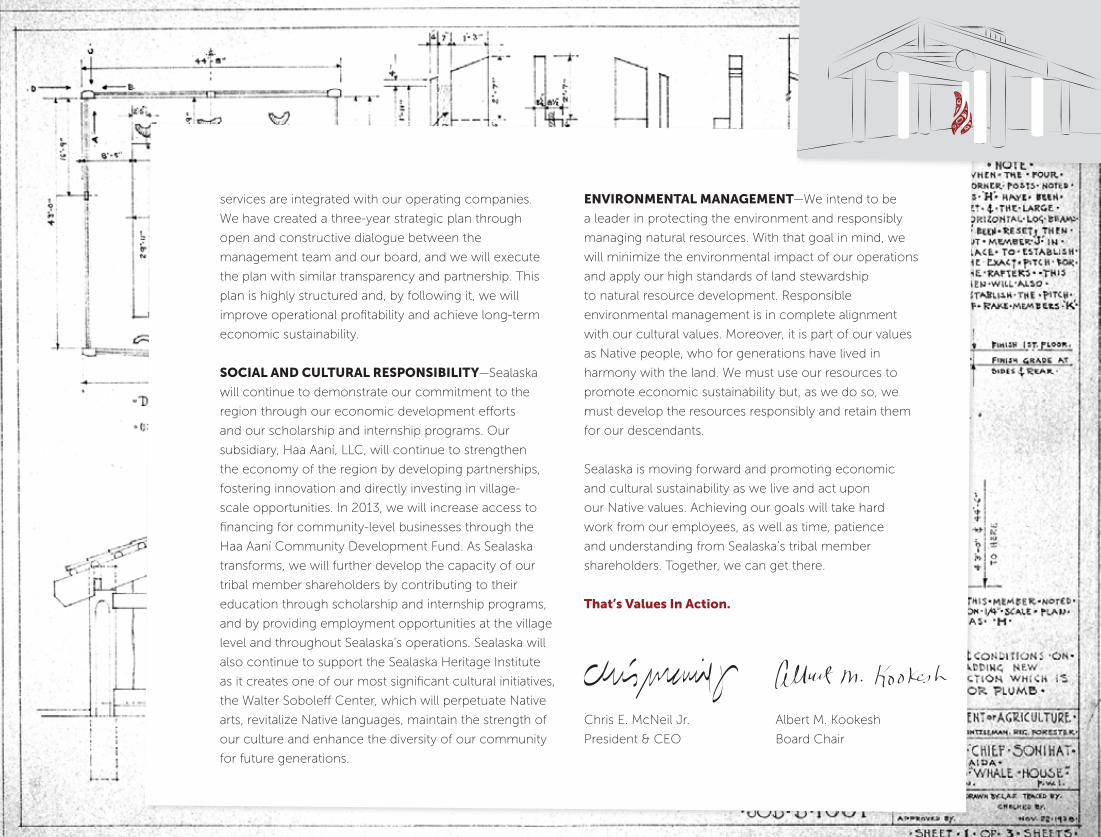
drawing of the house of Chief Son-I-Hat, Haida, courtesy of
Alaska State Library Historical Collection.
Photography: Todd Antioquia, Scott Areman and Ivan Simonek
Design: Pyramid Communications
Printing: Visions, Inc.
VALUES IN ACTION
Sealaska Annual Report 2012
SE
AL
AS
KA
AN
NU
AL R
EP
OR
T 2
012
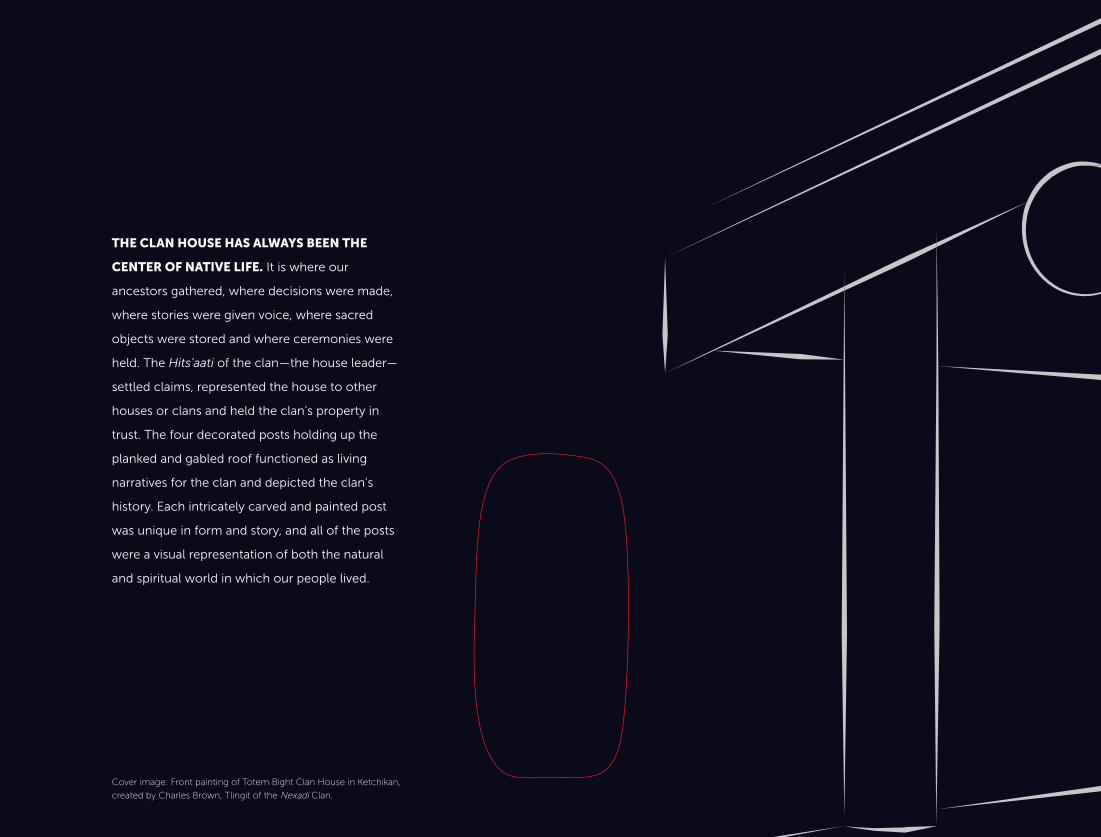
ThE CLAN hOUSE hAS ALwAyS bEEN ThE
CENTER Of NATIVE LIfE. It is where our
ancestors gathered, where decisions were made,
where stories were given voice, where sacred
objects were stored and where ceremonies were
held. The Hits’aati of the clan—the house leader—
settled claims, represented the house to other
houses or clans and held the clan’s property in
trust. The four decorated posts holding up the
planked and gabled roof functioned as living
narratives for the clan and depicted the clan’s
history. Each intricately carved and painted post
was unique in form and story, and all of the posts
were a visual representation of both the natural
and spiritual world in which our people lived.
Cover image: Front painting of Totem Bight Clan House in Ketchikan,
created by Charles Brown, Tlingit of the Nexadi Clan.
SEALASKA CORPORATION
Corporate HeadquartersOne Sealaska Plaza, Suite 400
Juneau, AK 99801
TEL: 907.586.1512
FAX: 907.586.2304
Shareholder toll-free line:
800.848.5921
www.sealaska.com
Seattle Office13810 S.E. Eastgate Way, Suite 420
Bellevue, WA 98005
TEL: 425.283.0600
FAX: 425.283.0650
Sealaska Heritage InstituteOne Sealaska Plaza, Suite 301
Juneau, AK 99801
TEL: 907.463.4844
FAX: 907.586.9293
www.sealaskaheritage.org
www.alaskanativeartists.com
OUTSIDE COUNSELSimpson, Tillinghast & Sorensen, P.C.
One Sealaska Plaza, Suite 300
Juneau, AK 99801
INDEPENDENT AUDITORSKPMG
1918 8th Avenue, Suite 2900
Seattle, WA 98101
SEALASKA SUbSIDIARIES
Alaska Coastal AggregatesGeneral Manager: Bill Bennett
One Sealaska Plaza, Suite 400
Juneau, AK 99801
www.sealaska.com/page/aggregates
Haa Aaní, LLC President and CEO: Russell Dick
One Sealaska Plaza, Suite 400
Juneau, AK 99801
www.sealaska.com/page/haa-aani-llc
Nypro KánaakManaging Director: Julio Oropeza
www.nyprokanaak.com
Nypro Kánaak AlabamaGeneral Manager: Kevin Bokros
208 Nypro Lane
Dothan, AL 36305
www.nyprokanaak.com
Nypro Kánaak GuadalajaraGeneral Manager: Alejandro Hernandez
Ignacio Jacobo #23
Parquel Industrial Belenes
45101, Zapopan Jalisco, MX
Nypro Kánaak IowaGeneral Manager: Dennie Heckman
400 North Harvey Road
Mt. Pleasant, IA 52641
www.nyprokanaak.com
Managed Business SolutionsPresident and CEO: Jon Duncan
12325 Oracle Blvd., Suite 200
Colorado Springs, CO 80921
www.mbshome.com
Sealaska Environmental ServicesPresident and CEO: Derik Frederiksen
One Sealaska Plaza, Suite 400
Juneau, AK 99801
www.sealaskaenvironmental.com
Sealaska Timber CorporationPresident and CEO: Wade Zammit
1900 1st Avenue, Suite 315
Ketchikan, AK 99901
www.sealaskatimber.com
Security AlliancePresident and CEO: Bill Murphy
8323 NW 12th St., Suite 218
Doral, FL 33126-1840
www.securityalliancegroup.com
Synergy Systems General Manager: Bob Wysocki
13810 S.E. Eastgate Way, Suite 420
Bellevue, WA 98005
www.sealaska.com/page/synergy_systems
DIRECTORy

2
Our future is bright! Living our core
Native values ensures strong culture
and communities for our children.
An impromptu performance, waiting
for the gathering of canoes just prior
to Celebration 2012, is evidence our
culture thrives on our homeland.

3
TOday, The clan hOuse remains The symbOlic
cenTer Of Our culTure and Our exisTence. Houses
like the Chief Shakes Tribal House in Wrangell and the Chief
Son-i-Hat Whale House in Kasaan are being restored to their
original conditions so that they will once again take their rightful
places as cultural and social centers in their home villages.
In the past, these traditional homes united our people by
providing them with space to share ideas, discuss plans and
decide how to move forward. At a regional level, Sealaska now
fulfills that function, serving as a metaphorical clan house for
our people and providing space for us—the Tlingit, Haida and
Tsimshian of Southeast Alaska—to come together. At the center
of the Sealaska clan house is the fire that embodies our hopes,
our aspirations and our vision for our people. The working level
of the house represents our operating goals of sustainability,
opportunity and prosperity. And, finally, the four posts symbolize
our core cultural values: Haa Latseen, our strength and
leadership; Haa Shagóon, our past, present and future;
Haa Aaní, our land; and Wooch.Yax, balance, reciprocity and
respect. Just as the four posts anchor the house and hold up
the structure, these four values ground us in our culture and
give us a distinct voice in a global marketplace.
With these values in mind, we are reshaping Sealaska, aligning
our operations with our core capabilities and charting our
path forward. We are continually putting our values into
action and, it is with a sense of hope and excitement, that we
present this year’s annual report to you. Inside, we highlight
some of the most exciting cultural projects being carried out
in our communities, and share our vision of a sustainable and
transformative 2013 that is shaped by our Native values.
charTing Our paTh fOrward
Values in acTiOn
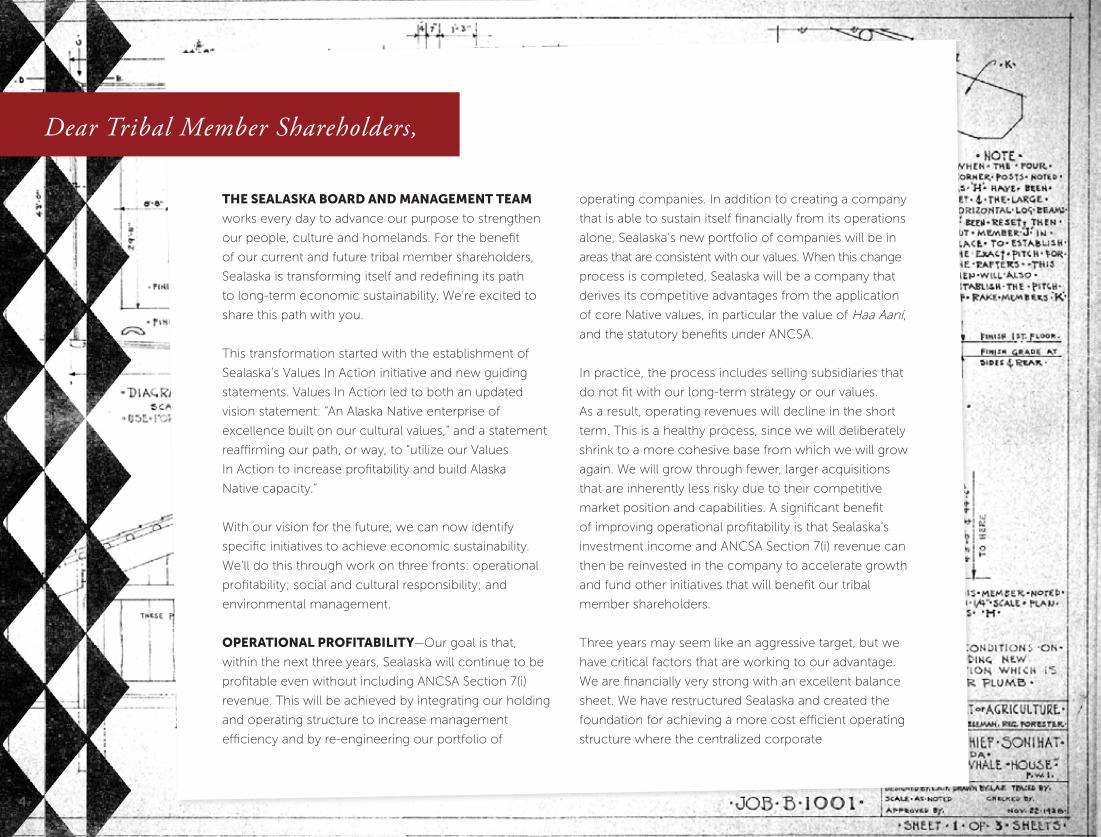
The sealaska bOard and managemenT Team
works every day to advance our purpose to strengthen
our people, culture and homelands. For the benefit
of our current and future tribal member shareholders,
Sealaska is transforming itself and redefining its path
to long-term economic sustainability. We’re excited to
share this path with you.
This transformation started with the establishment of
Sealaska’s Values In Action initiative and new guiding
statements. Values In Action led to both an updated
vision statement: “An Alaska Native enterprise of
excellence built on our cultural values,” and a statement
reaffirming our path, or way, to “utilize our Values
In Action to increase profitability and build Alaska
Native capacity.”
With our vision for the future, we can now identify
specific initiatives to achieve economic sustainability.
We’ll do this through work on three fronts: operational
profitability; social and cultural responsibility; and
environmental management.
OperaTiOnal prOfiTabiliTy—Our goal is that,
within the next three years, Sealaska will continue to be
profitable even without including ANCSA Section 7(i)
revenue. This will be achieved by integrating our holding
and operating structure to increase management
efficiency and by re-engineering our portfolio of
operating companies. In addition to creating a company
that is able to sustain itself financially from its operations
alone, Sealaska’s new portfolio of companies will be in
areas that are consistent with our values. When this change
process is completed, Sealaska will be a company that
derives its competitive advantages from the application
of core Native values, in particular the value of Haa Aaní,
and the statutory benefits under ANCSA.
In practice, the process includes selling subsidiaries that
do not fit with our long-term strategy or our values.
As a result, operating revenues will decline in the short
term. This is a healthy process, since we will deliberately
shrink to a more cohesive base from which we will grow
again. We will grow through fewer, larger acquisitions
that are inherently less risky due to their competitive
market position and capabilities. A significant benefit
of improving operational profitability is that Sealaska’s
investment income and ANCSA Section 7(i) revenue can
then be reinvested in the company to accelerate growth
and fund other initiatives that will benefit our tribal
member shareholders.
Three years may seem like an aggressive target, but we
have critical factors that are working to our advantage.
We are financially very strong with an excellent balance
sheet. We have restructured Sealaska and created the
foundation for achieving a more cost efficient operating
structure where the centralized corporate
Dear Tribal Member Shareholders,
4
5
services are integrated with our operating companies.
We have created a three-year strategic plan through
open and constructive dialogue between the
management team and our board, and we will execute
the plan with similar transparency and partnership. This
plan is highly structured and, by following it, we will
improve operational profitability and achieve long-term
economic sustainability.
sOcial and culTural respOnsibiliTy—Sealaska
will continue to demonstrate our commitment to the
region through our economic development efforts
and our scholarship and internship programs. Our
subsidiary, Haa Aaní, LLC, will continue to strengthen
the economy of the region by developing partnerships,
fostering innovation and directly investing in village-
scale opportunities. In 2013, we will increase access to
financing for community-level businesses through the
Haa Aaní Community Development Fund. As Sealaska
transforms, we will further develop the capacity of our
tribal member shareholders by contributing to their
education through scholarship and internship programs,
and by providing employment opportunities at the village
level and throughout Sealaska’s operations. Sealaska will
also continue to support the Sealaska Heritage Institute
as it creates one of our most significant cultural initiatives,
the Walter Soboleff Center, which will perpetuate Native
arts, revitalize Native languages, maintain the strength of
our culture and enhance the diversity of our community
for future generations.
enVirOnmenTal managemenT—We intend to be
a leader in protecting the environment and responsibly
managing natural resources. With that goal in mind, we
will minimize the environmental impact of our operations
and apply our high standards of land stewardship
to natural resource development. Responsible
environmental management is in complete alignment
with our cultural values. Moreover, it is part of our values
as Native people, who for generations have lived in
harmony with the land. We must use our resources to
promote economic sustainability but, as we do so, we
must develop the resources responsibly and retain them
for our descendants.
Sealaska is moving forward and promoting economic
and cultural sustainability as we live and act upon
our Native values. Achieving our goals will take hard
work from our employees, as well as time, patience
and understanding from Sealaska’s tribal member
shareholders. Together, we can get there.
That’s Values in action.
Chris E. McNeil Jr. Albert M. Kookesh
President & CEO Board Chair
6
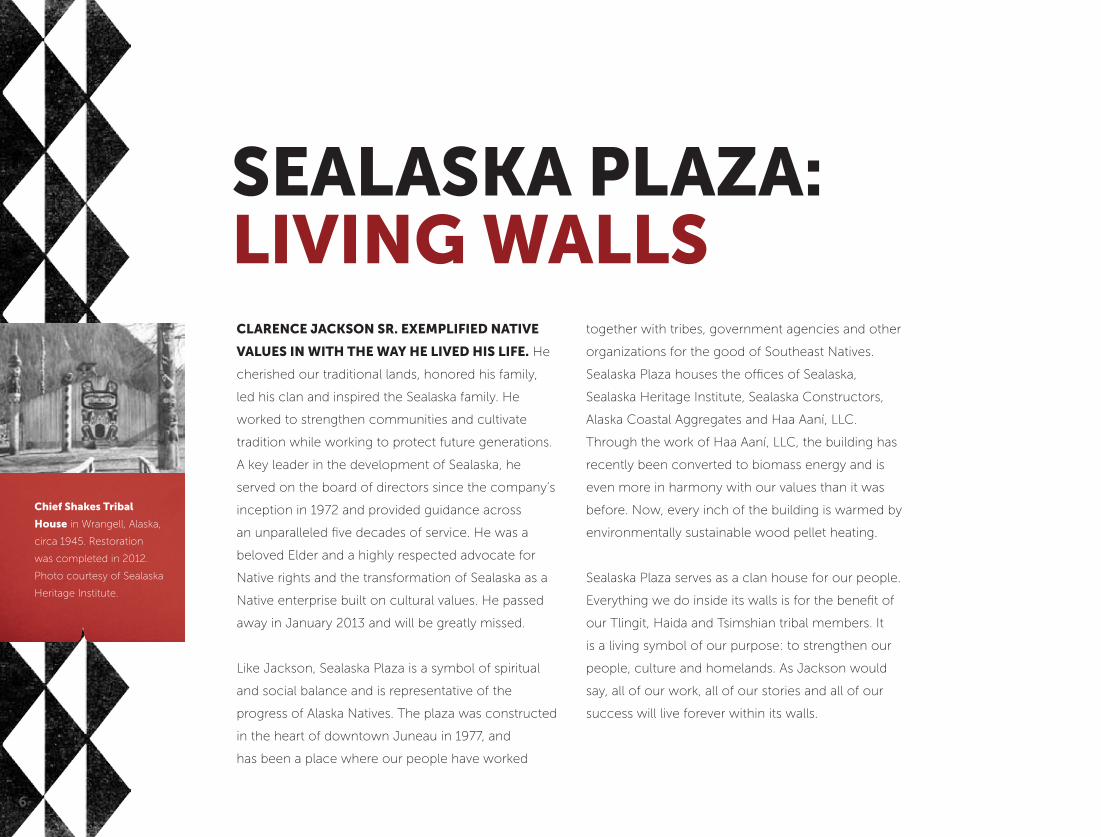
clarence JacksOn sr. exemplified naTiVe
Values in wiTh The way he liVed his life. He
cherished our traditional lands, honored his family,
led his clan and inspired the Sealaska family. He
worked to strengthen communities and cultivate
tradition while working to protect future generations.
A key leader in the development of Sealaska, he
served on the board of directors since the company’s
inception in 1972 and provided guidance across
an unparalleled five decades of service. He was a
beloved Elder and a highly respected advocate for
Native rights and the transformation of Sealaska as a
Native enterprise built on cultural values. He passed
away in January 2013 and will be greatly missed.
Like Jackson, Sealaska Plaza is a symbol of spiritual
and social balance and is representative of the
progress of Alaska Natives. The plaza was constructed
in the heart of downtown Juneau in 1977, and
has been a place where our people have worked
together with tribes, government agencies and other
organizations for the good of Southeast Natives.
Sealaska Plaza houses the offices of Sealaska,
Sealaska Heritage Institute, Sealaska Constructors,
Alaska Coastal Aggregates and Haa Aaní, LLC.
Through the work of Haa Aaní, LLC, the building has
recently been converted to biomass energy and is
even more in harmony with our values than it was
before. Now, every inch of the building is warmed by
environmentally sustainable wood pellet heating.
Sealaska Plaza serves as a clan house for our people.
Everything we do inside its walls is for the benefit of
our Tlingit, Haida and Tsimshian tribal members. It
is a living symbol of our purpose: to strengthen our
people, culture and homelands. As Jackson would
say, all of our work, all of our stories and all of our
success will live forever within its walls.
sealaska plaza: liVing walls
chief shakes Tribal
house in Wrangell, Alaska,
circa 1945. Restoration
was completed in 2012.
Photo courtesy of Sealaska
Heritage Institute.
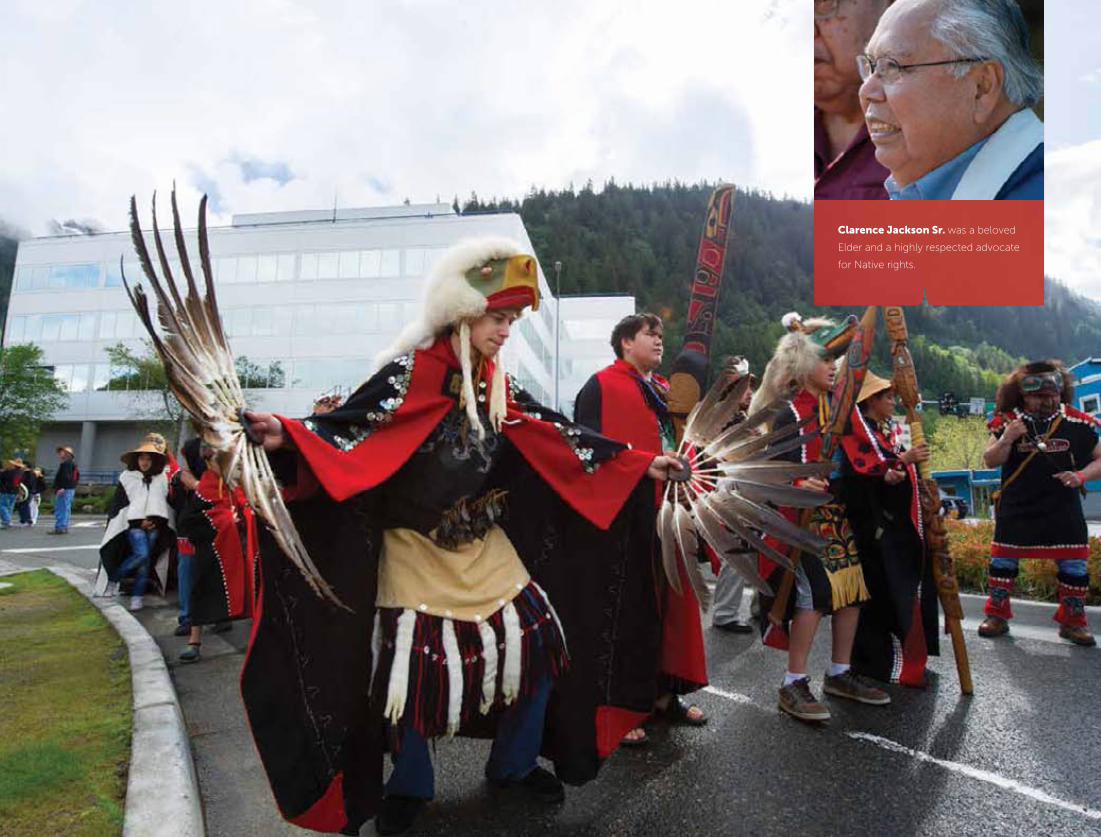
clarence Jackson sr. was a beloved
Elder and a highly respected advocate
for Native rights.
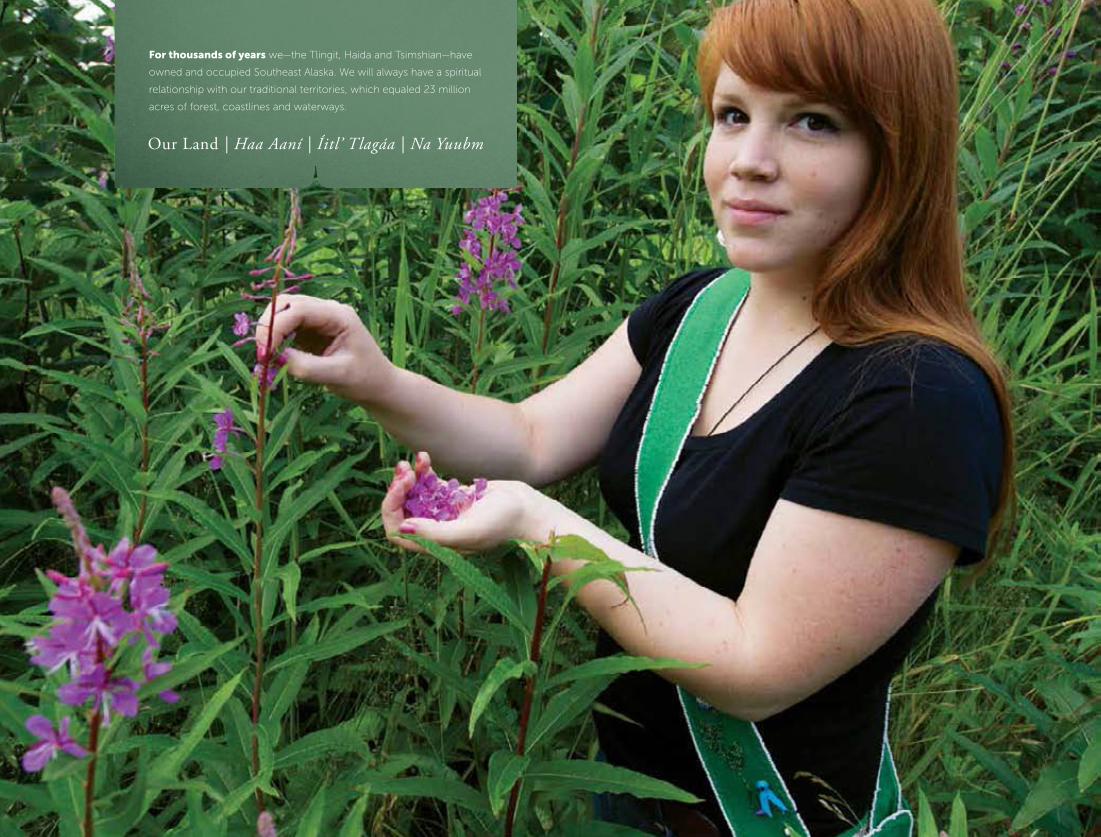
Our Land | Haa Aaní | Íitl’ Tlagáa | Na Yuubm
for thousands of years we—the Tlingit, Haida and Tsimshian—have
owned and occupied Southeast Alaska. We will always have a spiritual
relationship with our traditional territories, which equaled 23 million
acres of forest, coastlines and waterways.
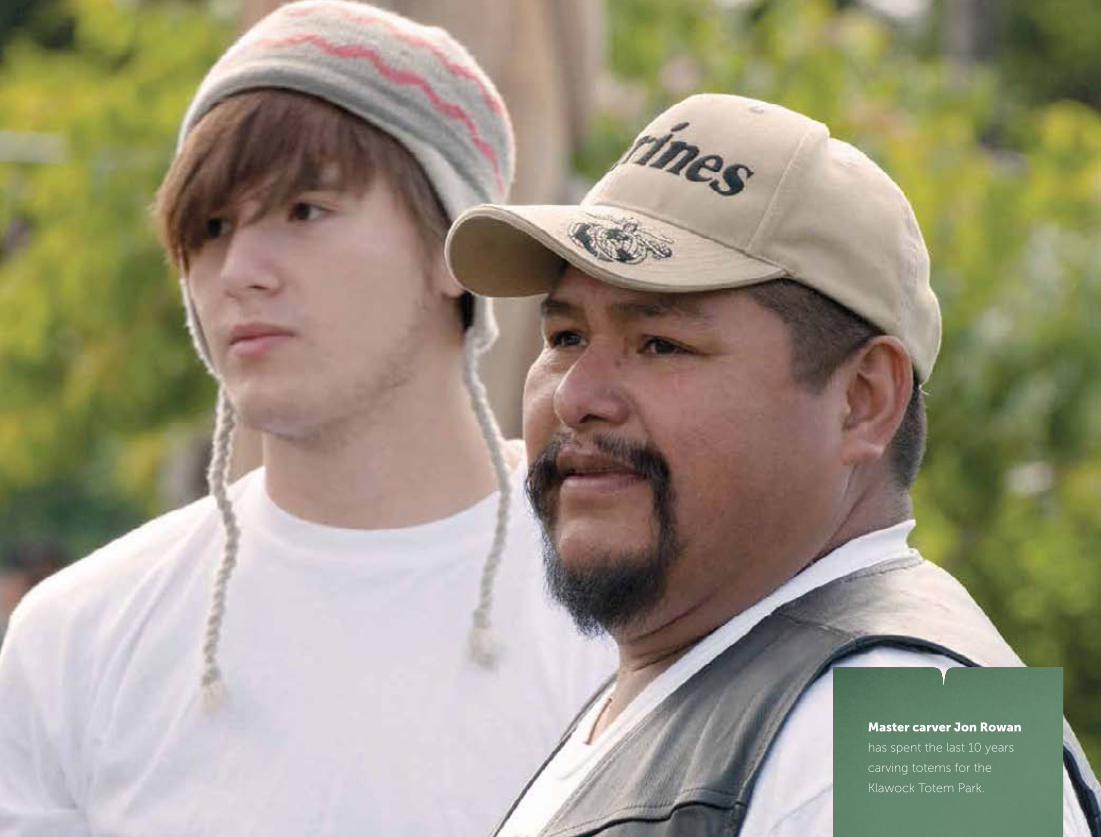
master carver Jon rowan
has spent the last 10 years
carving totems for the
Klawock Totem Park.
haa aanííitl’ tlagáa
na Yuubm
master carver Jon rowan
has spent the last 10 years
carving totems for the
Klawock Totem Park.
10
klawOck TOTem park cOnnecTs
culTure and land
“Give us a log and we’ll carve your totem pole.”
Those simple words were the beginning of a cultural
and artistic journey for master carver Jon Rowan,
who has spent the last 10 years carving totems for
the Klawock Totem Park on Prince of Wales Island.
Rowan lives and breathes totems, wielding the tools
of his trade with deceptive ease. Most days you’ll
find him in a modest carver’s shed, surrounded by
totems that he and his apprentices have been carving
for the park. The park boasts 21 poles which were
moved to Klawock from the ancient winter village of
Tuxekan, just north of Klawock, in the early 1900s.
In the 1930s, many of the poles were refurbished or
re-carved by the Civilian Conservation Corps, which
was a federal agency formed under the New Deal to
provide employment and vocational training through
conservation and natural resources development
work. Rowan has continued the work of replacing
the park’s weather-beaten and decaying poles since
2003. He estimates that it takes approximately 350
hours to carve each pole. Sealaska has donated
seven logs for the project. In 2002, three new poles
were erected and in 2005 another five poles were
raised amidst a community celebration that was
attended by more than 700 people.
Once thought by Christian settlers to be pagan icons,
totems were destroyed and banned during the period
Our Land | Haa Aaní | Íitl’ Tlagáa | Na Yuubm

Our Land | Haa Aaní | Íitl’ Tlagáa | Na Yuubm
xaada Tak’analang haida descendant dancers gather at the raising
of totems at the Klawock Totem Park.
12
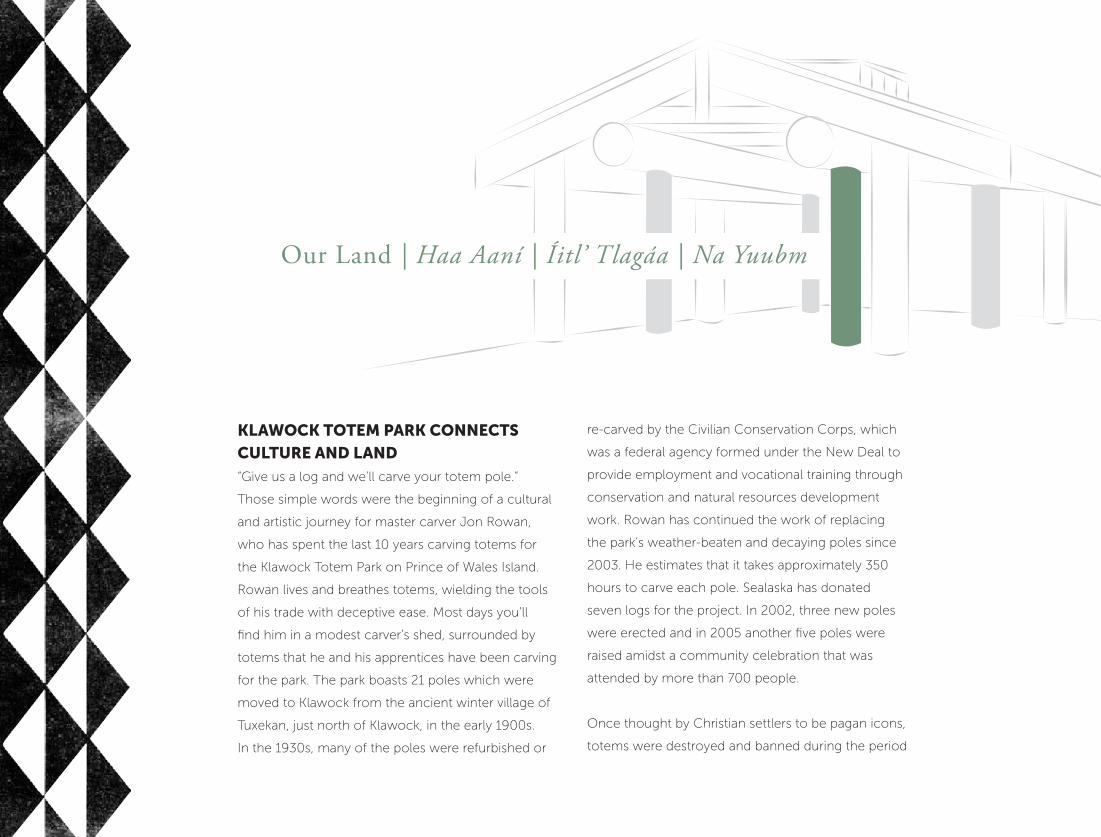
sitka clan house hosts
a 1904 Tlingit potlatch.
Photo: Alaska State Library,
Case & Draper Photograph
Collection, P39-0401.
“We’ve been here for thousands of years, and these poles remind us of that every day.”
of western settlement. It wasn’t until later that the
totems were seen for what they are: proof of family
lineages and documentation of legends and
historical events.
Besides being a master carver, Rowan speaks Tlingit
and is the leader of a 60-member-strong dance
group. “I’ve been carving since I was six years old.
The poles connect us to our heritage and connect us
to the land. We’ve been here for thousands of years,
and these poles remind us of that every day.”
businesses adVancing haa aaníSoutheast Alaska Natives have always revered the
land. In addition to providing food and shelter, it
is a spiritual place—a place to rejuvenate and gain
strength for the trials of everyday life. Our businesses
place the same value on the land. Haa Aaní, LLC
works to create sustainable economies in Southeast
villages so that tribal members can remain in their
home villages and work jobs that are compatible
with subsistence and traditional lifestyles. In 2012,
Haa Aaní expanded mariculture opportunities in
Yakutat and Angoon and held Southeast Alaska’s
first Oyster Festival as a marketing event for local
entrepreneurs. The company also advanced its
initiative to reduce energy costs in rural communities
by promoting biomass heating projects across
the region.
In 2012, Sealaska Environmental Services (SES)
provided remediation and mitigation services for
the Bremerton Shipyard, as well as contaminated
sites in the community of Tukwila—both locations
in Washington state. Sealaska Timber Corporation
(STC), despite the uncertainty of future timber supply,
continued with its log donation program, supplying
dozens of logs for cultural projects, including the
Chief Shakes Tribal House in Wrangell and the
Klawock Totem Park.

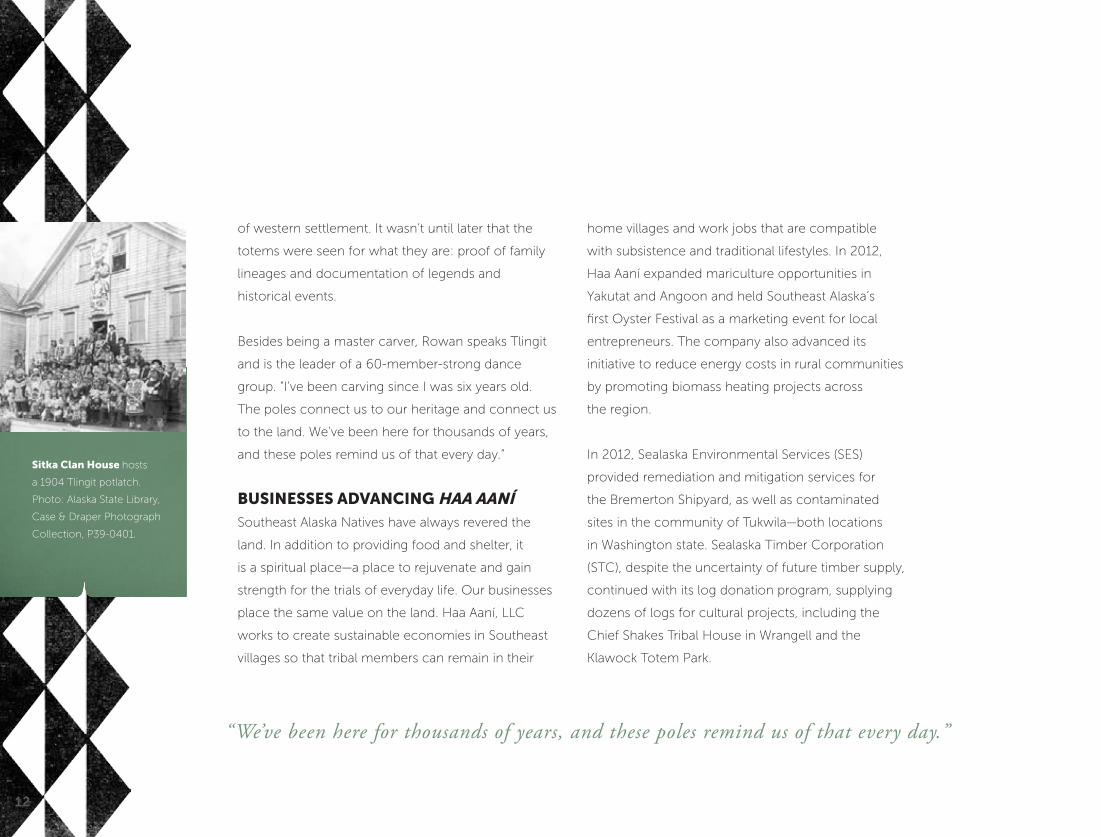
The walter soboleff center, in the
center of downtown Juneau, will
showcase traditional and modern
Southeast Alaskan Native art.
haa shagóoníitl’ Kuníisii
na hlagigYadm

The walter soboleff center, in the
center of downtown Juneau, will
showcase traditional and modern
Southeast Alaskan Native art.
14
walTer sObOleff cenTer:
reflecTing The pasT, enVisiOning
The fuTure
Sealaska Heritage Institute (SHI) President Rosita
Worl stands in her office at Sealaska Plaza and points
to a piece of land just down the street. Years of
neglect earned the property the lowly name “the
pit,” a name that persisted until Sealaska purchased
and landscaped the property with the intention of
donating it to SHI. Now, that piece of land is the
future home of the Walter Soboleff Center, a state-
of-the-art Native cultural center that will showcase
traditional and modern Southeast Alaskan Native
art, historical archives, an ethnographic collection,
educational and language programs, and the
administrative offices of SHI.
Worl has been involved in all aspects of the new
center, which is scheduled to break ground in
spring of 2013. “The center will be a living example
and testament to our history, and a dynamic tie to
our future. It will provide artist-in-residence space,
exhibition, demonstration and research areas, and a
history center where instructors and artists can share
their knowledge and techniques, perpetuating and
revitalizing Southeast Alaska’s endangered Native arts.”
Many traditional forms of art are in danger of being
lost and could disappear entirely within our lifetime.
Fortunately, master carvers and other artists who take
on young apprentices are helping to prevent this.
Our Past, Present and Future | Haa Shagóon | Íitl’ Kuníisii | Na Hlagigyadm
Our Past, Present and Future | Haa Shagóon | Íitl’ Kuníisii | Na Hlagigyadm
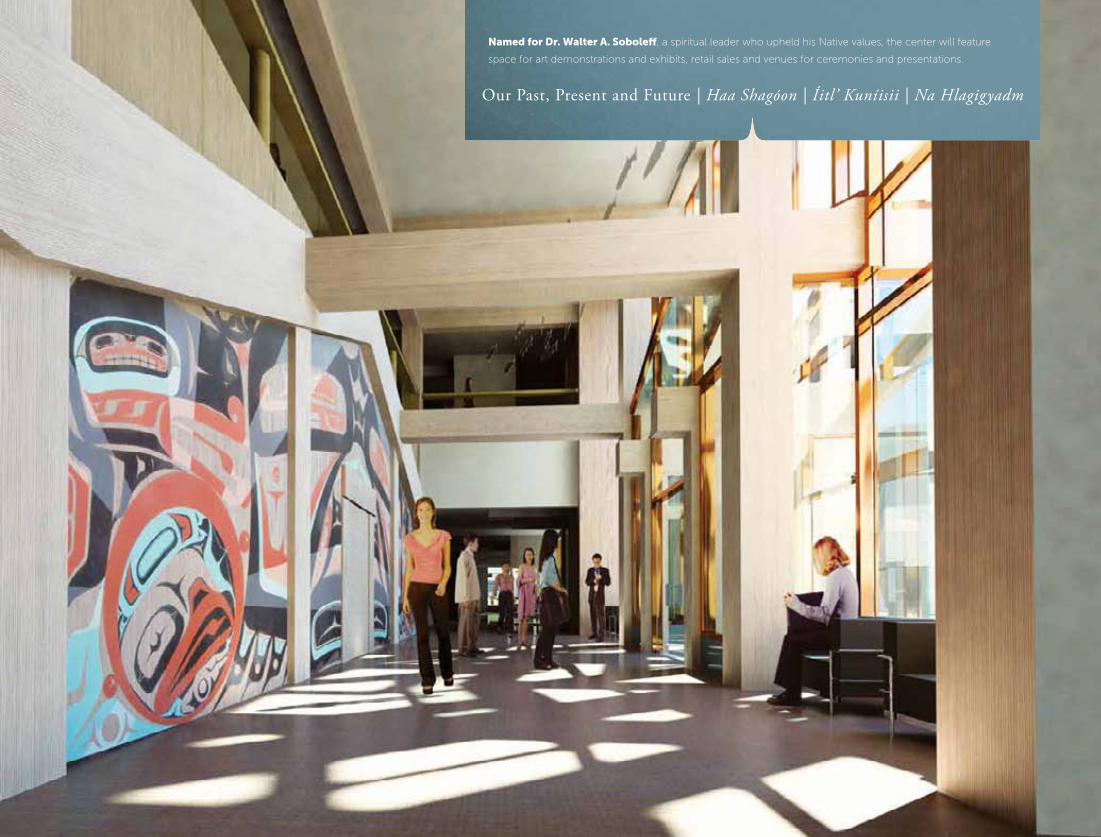
named for dr. walter a. soboleff, a spiritual leader who upheld his Native values, the center will feature
space for art demonstrations and exhibits, retail sales and venues for ceremonies and presentations.

16
In addition, cultural programs, such as beading and
moccasin-sewing classes sponsored by SHI, are
helping younger generations connect with their
culture and heritage.
SHI is building the center under the principle of
preserving the past while promoting the future.
According to Worl, Native languages are in danger of
extinction. Right now, there are fewer than 150 fluent
Tlingit speakers and fewer than 10 fluent speakers
each of Haida and Tsimshian. “Reconnecting with
our heritage, preserving sacred clan objects, curating
historical documents and educating our youth—all
while advancing the field of modern Native art—is
what the center is all about.”
businesses adVancing haa shagóOnIn the business world, Haa Shagóon translates to
making smart decisions in the present that honor
our knowledge of the past and create models
of sustainability for the future. Sealaska Timber
Corporation (STC) embodies this value, making
responsible use of our natural resources, which
have provided predictable and stable dividends
to Sealaska tribal member shareholders for more
than 30 years. In 2012, STC had the best financial
performance since 2007, when the harvest level
was reduced to 50 mm of board feet. Sealaska
Environmental Services (SES) also made sustainable
operations a key focus, practicing both social and
environmental responsibility through its work with
the U.S. Army Corps of Engineers and other United
States government agencies. SES employs 12 tribal
member shareholders and in 2012 placed many of
these employees—some of them former interns—into
positions of increasing authority. Sealaska believes
in implementing sustainable practices in our offices
and embedding them into our daily activities. In
2012, Sealaska headquarters and six subsidiary offices
earned ISO 14001 environmental management
certification—a testament to our wise use of
resources, recycling and waste reduction.
angoon clan house,
Dakl’aweidi Clan, Keet
Hit (Killerwhale House)
with Brown Bear Totem,
Teikweidi Clan, 1900-1940.
Photo: Alaska State Library,
Vincent Soboleff Photograph
Collection, P001-061
“The center will be a living testament to our history and a dynamic tie to our future.”

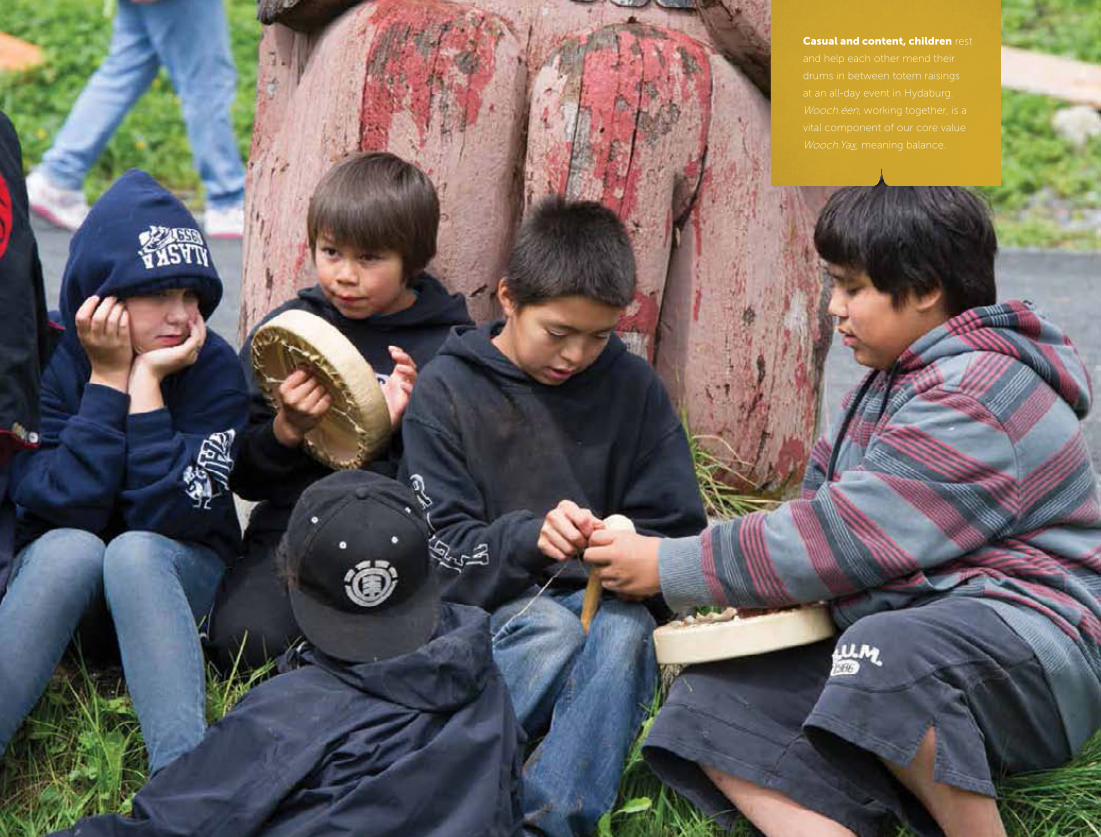
casual and content, children rest
and help each other mend their
drums in between totem raisings
at an all-day event in Hydaburg.
Wooch.éen, working together, is a
vital component of our core value
Wooch.Yax, meaning balance.
Wooch.Yaxgu dlúu
ama macKshm
casual and content, children rest
and help each other mend their
drums in between totem raisings
at an all-day event in Hydaburg.
Wooch.éen, working together, is a
vital component of our core value
Wooch.Yax, meaning balance.
18
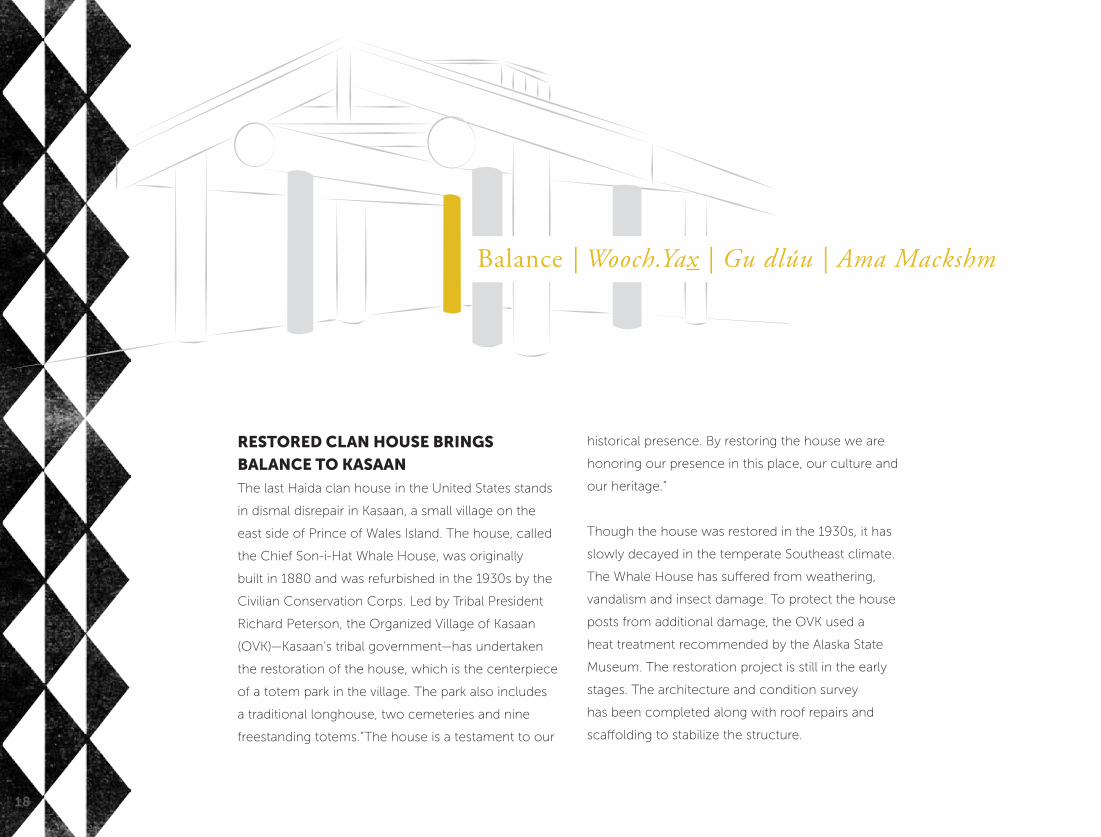
resTOred clan hOuse brings
balance TO kasaan
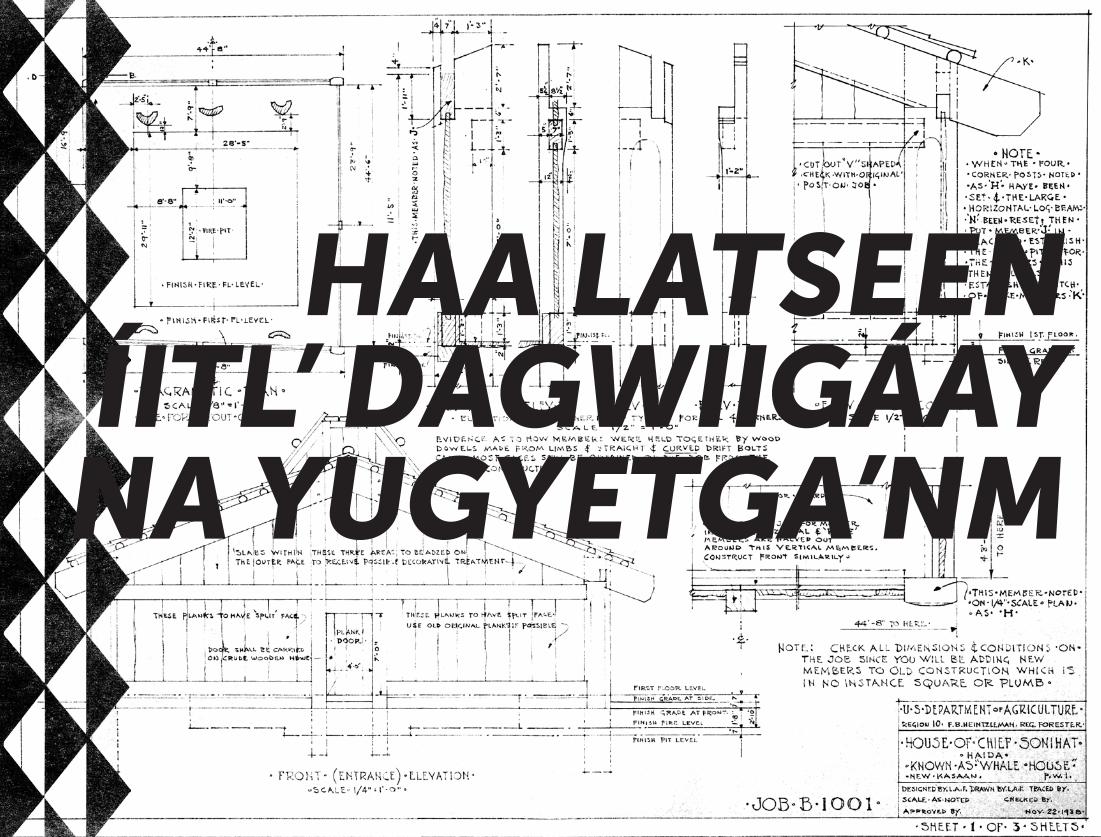
The last Haida clan house in the United States stands
in dismal disrepair in Kasaan, a small village on the
east side of Prince of Wales Island. The house, called
the Chief Son-i-Hat Whale House, was originally
built in 1880 and was refurbished in the 1930s by the
Civilian Conservation Corps. Led by Tribal President
Richard Peterson, the Organized Village of Kasaan
(OVK)—Kasaan’s tribal government—has undertaken
the restoration of the house, which is the centerpiece
of a totem park in the village. The park also includes
a traditional longhouse, two cemeteries and nine
freestanding totems.“The house is a testament to our
historical presence. By restoring the house we are
honoring our presence in this place, our culture and
our heritage.”
Though the house was restored in the 1930s, it has
slowly decayed in the temperate Southeast climate.
The Whale House has suffered from weathering,
vandalism and insect damage. To protect the house
posts from additional damage, the OVK used a
heat treatment recommended by the Alaska State
Museum. The restoration project is still in the early
stages. The architecture and condition survey
has been completed along with roof repairs and
scaffolding to stabilize the structure.
Balance | Wooch.Yax | Gu dlúu | Ama Mackshm
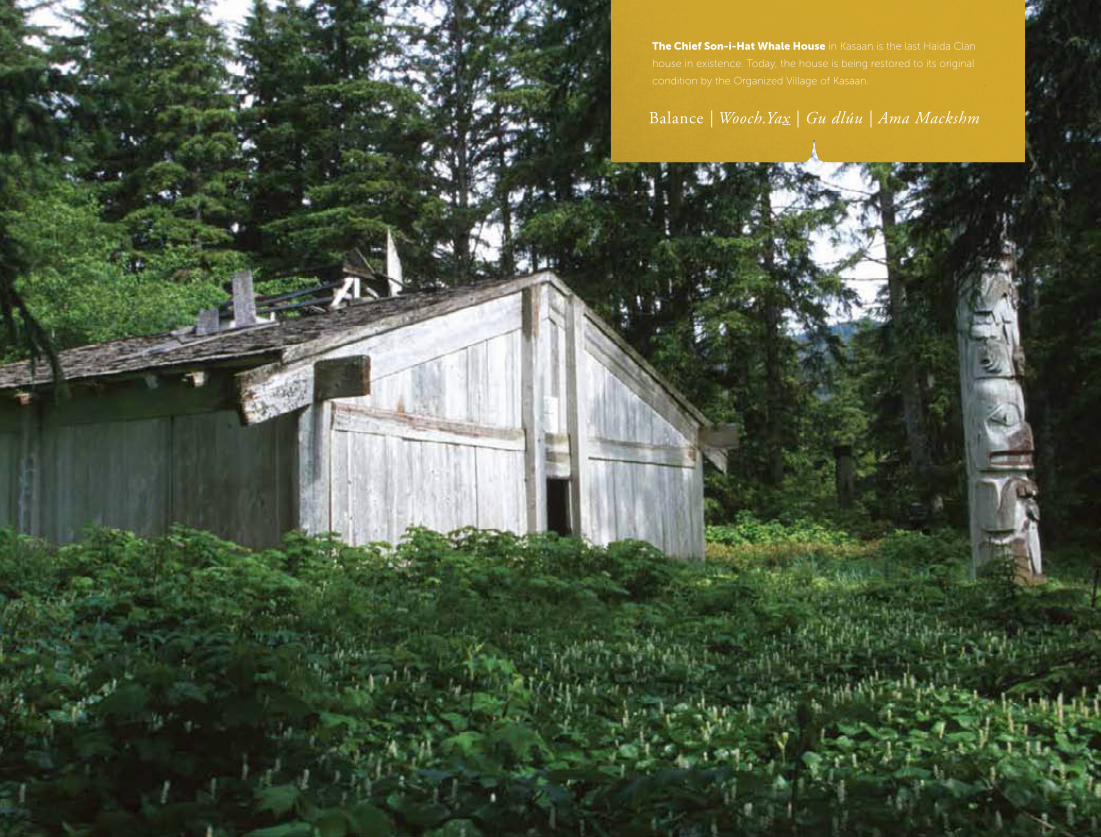
Balance | Wooch.Yax | Gu dlúu | Ama Mackshm
The chief son-i-hat whale house in Kasaan is the last Haida Clan
house in existence. Today, the house is being restored to its original
condition by the Organized Village of Kasaan.
20
“We have an opportunity to save the last Haida clan house in America. There’s a lot of history there that needs to be told.”
OVK and Peterson, a former mayor of Kasaan,
have been the driving forces behind the restoration
process and have taken responsibility for raising the
money and overseeing the multimillion dollar project.
It’s been a long road, but one that Peterson would
travel again. “We have an opportunity to save the last
Haida clan house in America. There’s a lot of history
there that needs to be told. Our children’s children
need to know how we lived tens of thousands of
years ago, and this clan house will teach them our
traditions and our values.”
businesses adVancing wOOch.yaxWooch.Yax, and its component value, Wooch.éen
(working together) is a major part of the operations
of all our subsidiaries. Working with the Hoonah
community to address its concerns, STC successfully
commenced operating in White Rock/Sitkoh Bay with
sort yard and ship loading activities in Hoonah. The
timber corporation also began a new relationship
with Papac Logging, a local contractor based
in Klawock. STC’s commitment to all Southeast
communities remains strong. In 2012, it contributed
$293,000 to the Sealaska Heritage Institute
Scholarship Fund and financed the expansion of
the Community Carving Program, managed in
cooperation with Haa Aaní, LLC and Sealaska.
Haa Aaní, LLC established the Haa Aaní Community
Development Fund as a nonprofit Native financial
institution that provides access to capital for business
expansion and start-ups in rural communities. The
fund made its first loan in 2012 to a tribal member
shareholder for her food service business that
provides fresh, wild Alaskan seafood. Haa Aaní’s
legislative efforts and partnerships at the state
level are also helping to remove impediments to
economic growth, and its collaboration with state
and federal agencies, business partners and other
stakeholders is having a positive impact on the
business environment in the region.
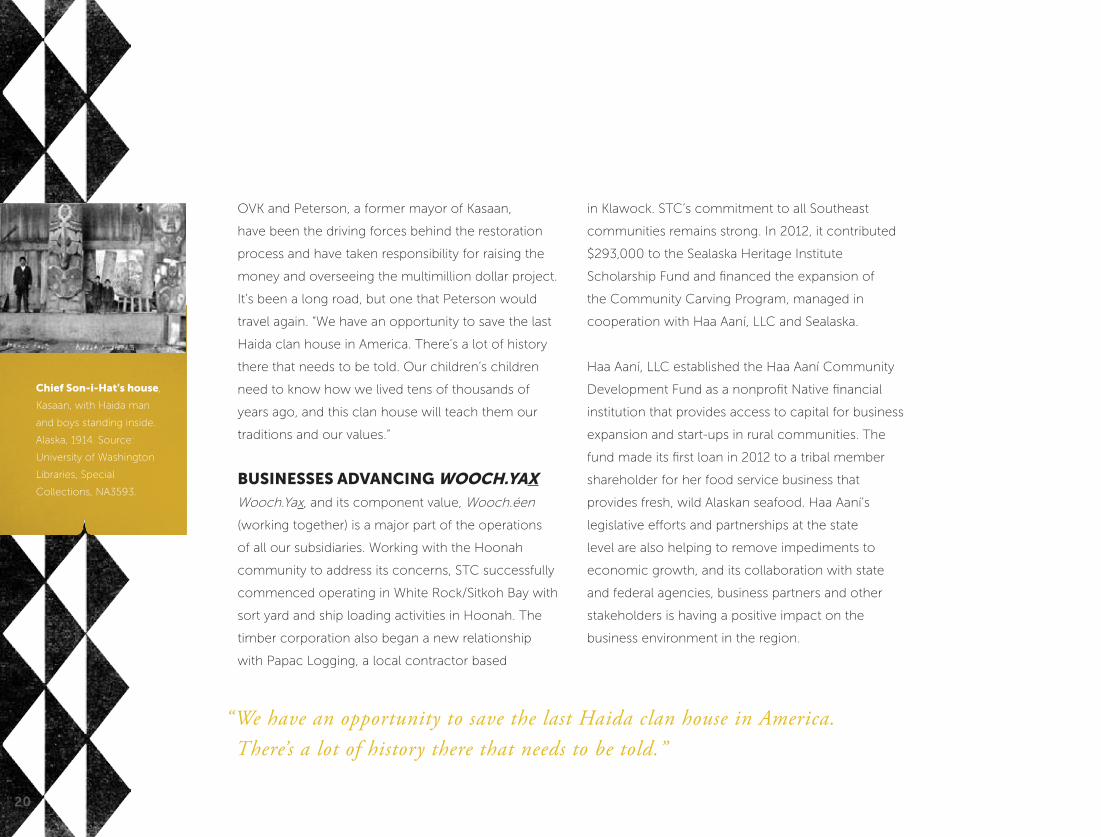
chief son-i-hat’s house,
Kasaan, with Haida man
and boys standing inside.
Alaska, 1914. Source:
University of Washington
Libraries, Special
Collections, NA3593.
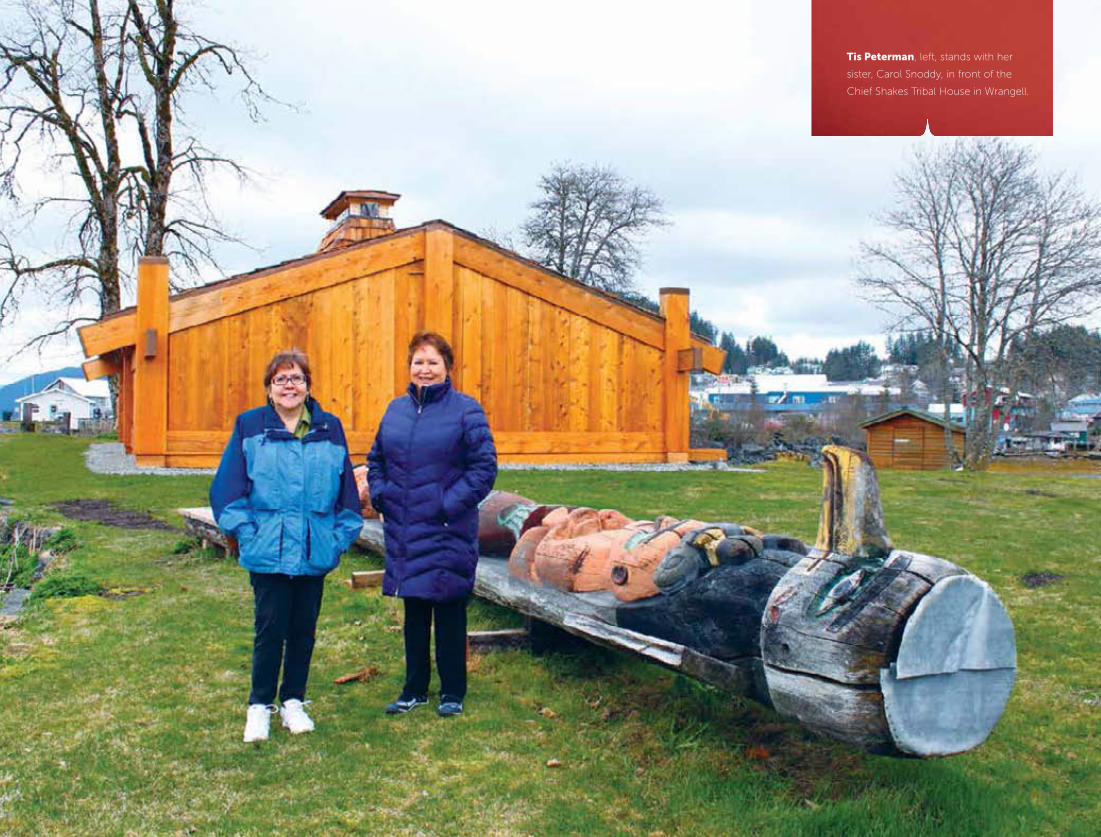
Tis peterman, left, stands with her
sister, Carol Snoddy, in front of the
Chief Shakes Tribal House in Wrangell.
haa latseeníitl’ dagWiigáaYna YugYetga’nm
Tis peterman, left, stands with her
sister, Carol Snoddy, in front of the
Chief Shakes Tribal House in Wrangell.
22
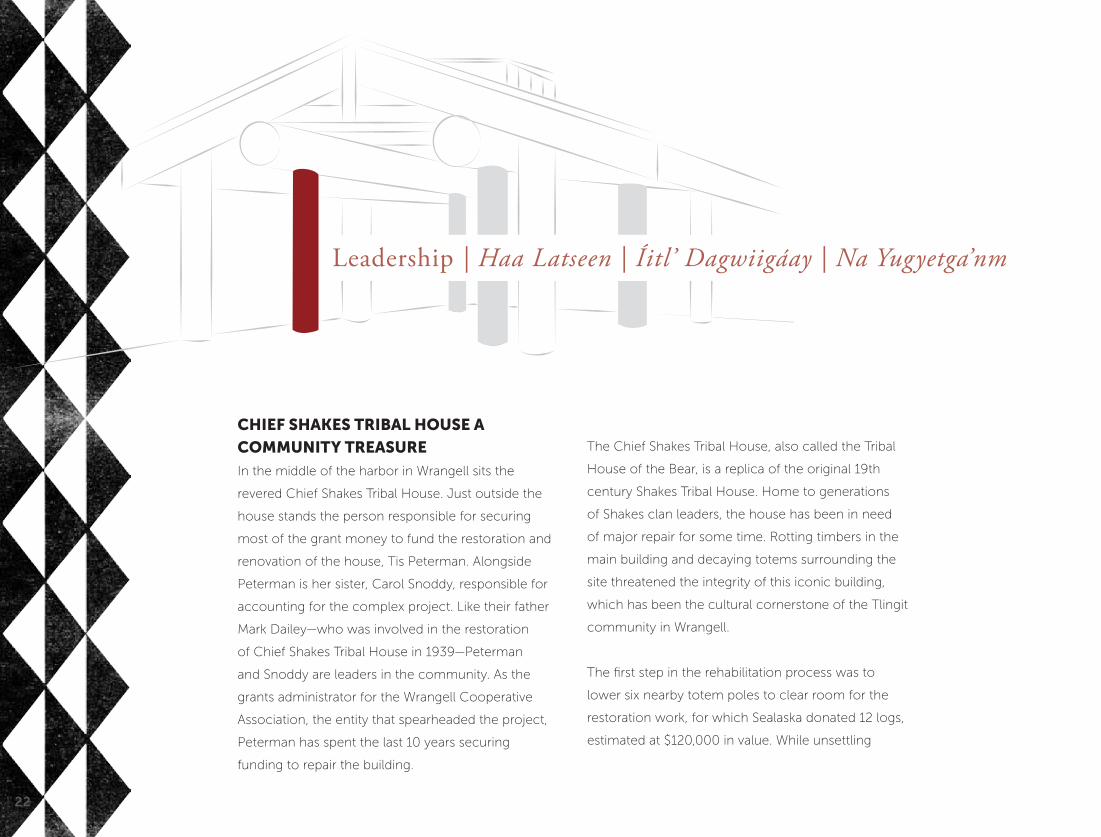
chief shakes Tribal hOuse a
cOmmuniTy Treasure
In the middle of the harbor in Wrangell sits the
revered Chief Shakes Tribal House. Just outside the
house stands the person responsible for securing
most of the grant money to fund the restoration and
renovation of the house, Tis Peterman. Alongside
Peterman is her sister, Carol Snoddy, responsible for
accounting for the complex project. Like their father
Mark Dailey—who was involved in the restoration
of Chief Shakes Tribal House in 1939—Peterman
and Snoddy are leaders in the community. As the
grants administrator for the Wrangell Cooperative
Association, the entity that spearheaded the project,
Peterman has spent the last 10 years securing
funding to repair the building.
The Chief Shakes Tribal House, also called the Tribal
House of the Bear, is a replica of the original 19th
century Shakes Tribal House. Home to generations
of Shakes clan leaders, the house has been in need
of major repair for some time. Rotting timbers in the
main building and decaying totems surrounding the
site threatened the integrity of this iconic building,
which has been the cultural cornerstone of the Tlingit
community in Wrangell.
The first step in the rehabilitation process was to
lower six nearby totem poles to clear room for the
restoration work, for which Sealaska donated 12 logs,
estimated at $120,000 in value. While unsettling
Leadership | Haa Latseen | Íitl’ Dagwiigáay | Na Yugyetga’nm
Leadership | Haa Latseen | Íitl’ Dagwiigáay | Na Yugyetga’nm
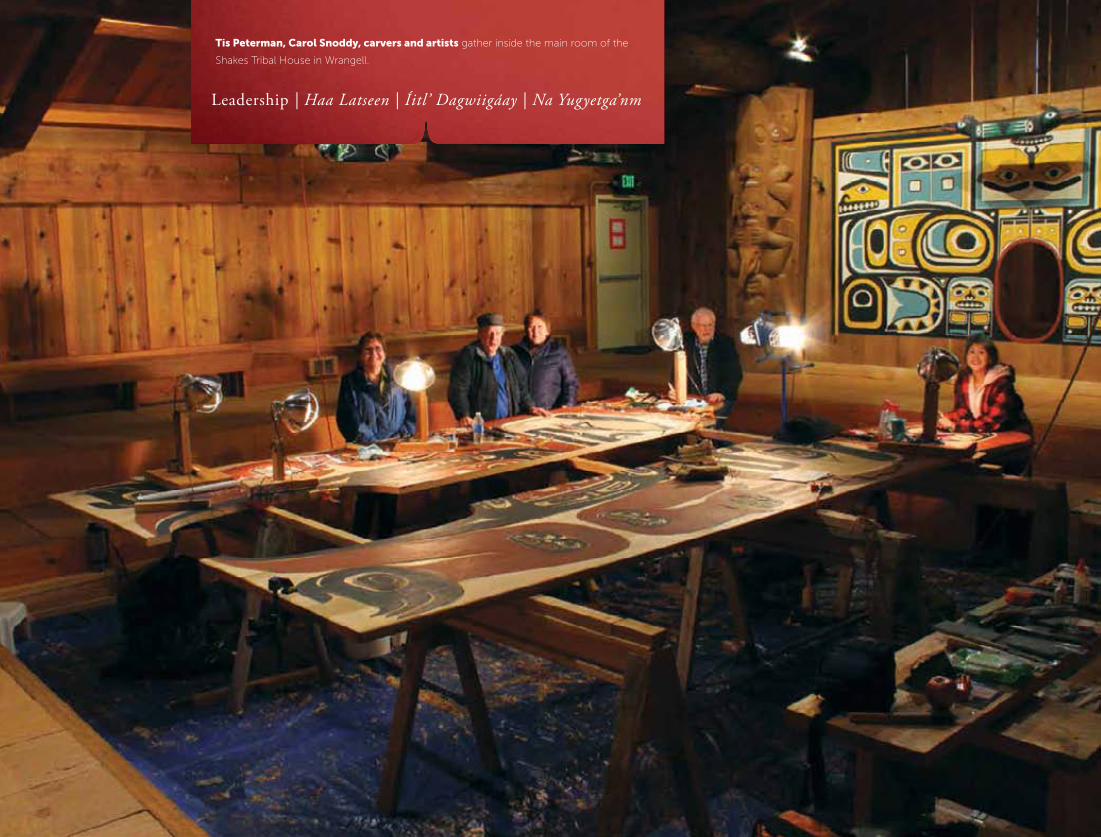
Tis peterman, carol snoddy, carvers and artists gather inside the main room of the
Shakes Tribal House in Wrangell.
24
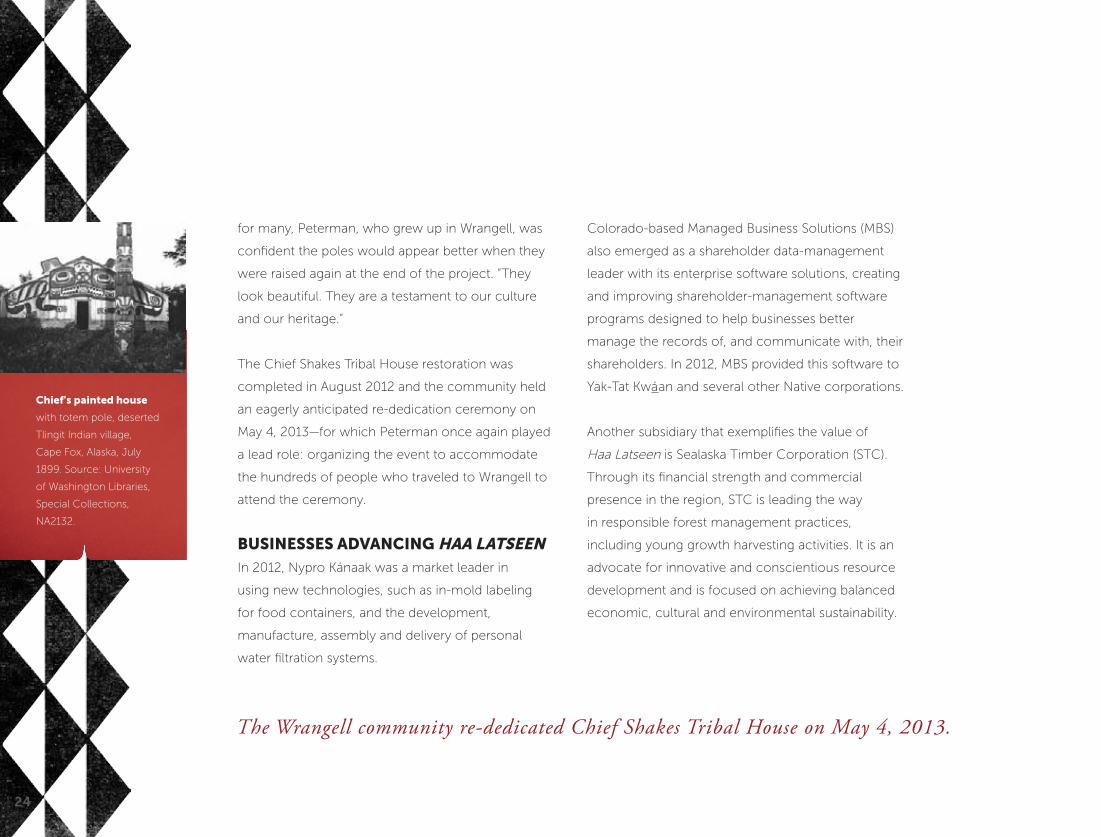
chief’s painted house
with totem pole, deserted
Tlingit Indian village,
Cape Fox, Alaska, July
1899. Source: University
of Washington Libraries,
Special Collections,
NA2132.
The Wrangell community re-dedicated Chief Shakes Tribal House on May 4, 2013.
for many, Peterman, who grew up in Wrangell, was
confident the poles would appear better when they
were raised again at the end of the project. “They
look beautiful. They are a testament to our culture
and our heritage.”
The Chief Shakes Tribal House restoration was
completed in August 2012 and the community held
an eagerly anticipated re-dedication ceremony on
May 4, 2013—for which Peterman once again played
a lead role: organizing the event to accommodate
the hundreds of people who traveled to Wrangell to
attend the ceremony.
businesses adVancing haa laTseenIn 2012, Nypro Kánaak was a market leader in
using new technologies, such as in-mold labeling
for food containers, and the development,
manufacture, assembly and delivery of personal
water filtration systems.
Colorado-based Managed Business Solutions (MBS)
also emerged as a shareholder data-management
leader with its enterprise software solutions, creating
and improving shareholder-management software
programs designed to help businesses better
manage the records of, and communicate with, their
shareholders. In 2012, MBS provided this software to
Yak-Tat Kwáan and several other Native corporations.
Another subsidiary that exemplifies the value of
Haa Latseen is Sealaska Timber Corporation (STC).
Through its financial strength and commercial
presence in the region, STC is leading the way
in responsible forest management practices,
including young growth harvesting activities. It is an
advocate for innovative and conscientious resource
development and is focused on achieving balanced
economic, cultural and environmental sustainability.

25
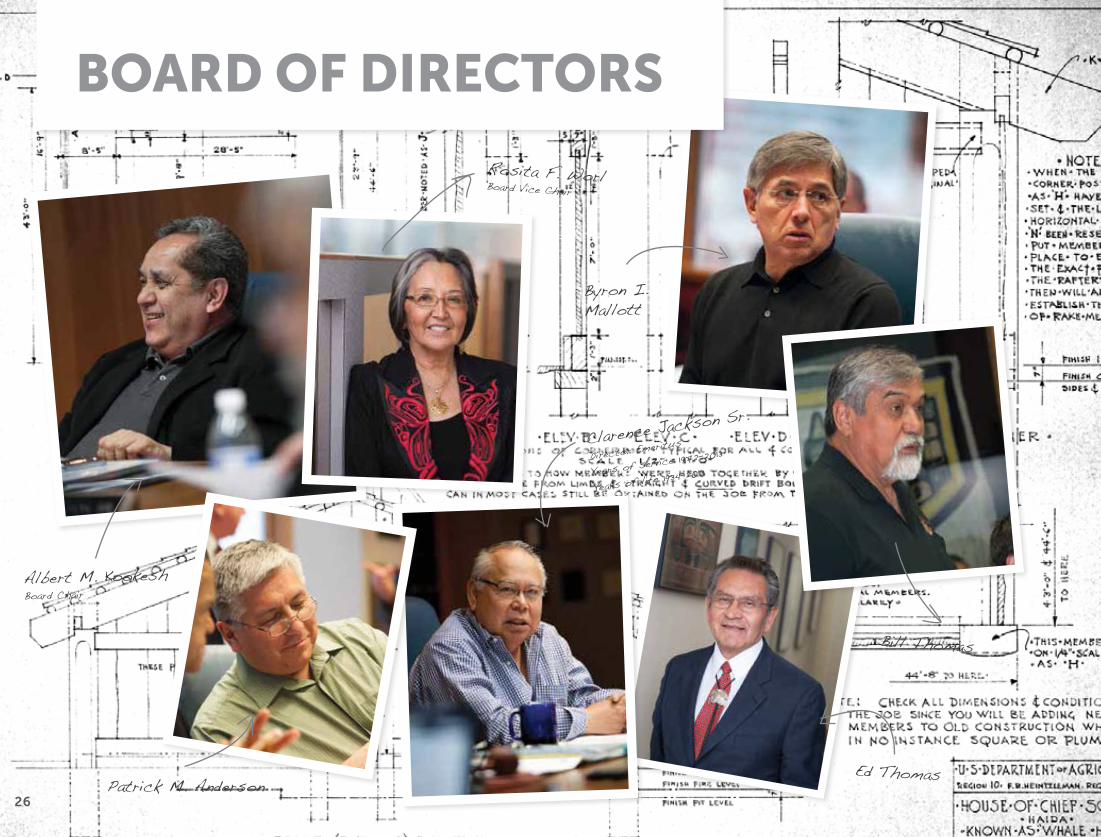
bOard Of direcTOrs
Byron I. Mallott
Rosita F. WorlBoard Vice Chair
Clarence Jackson Sr.
Director Emeritus
Years of service 1972–2013
Years of life 1934–2013
Albert M. KookeshBoard Chair
Patrick M. AndersonEd Thomas
Bill Thomas
26

Barbara Cadiente Nelson
Jodi M. Mitche
ll
J. Tate London
Joseph G. Nelson
27
JacquelineJohnson Pata
Madeline Soboleff LevyYouth Board Advisor
Sidney C. Edenshaw
Richard Rinehart
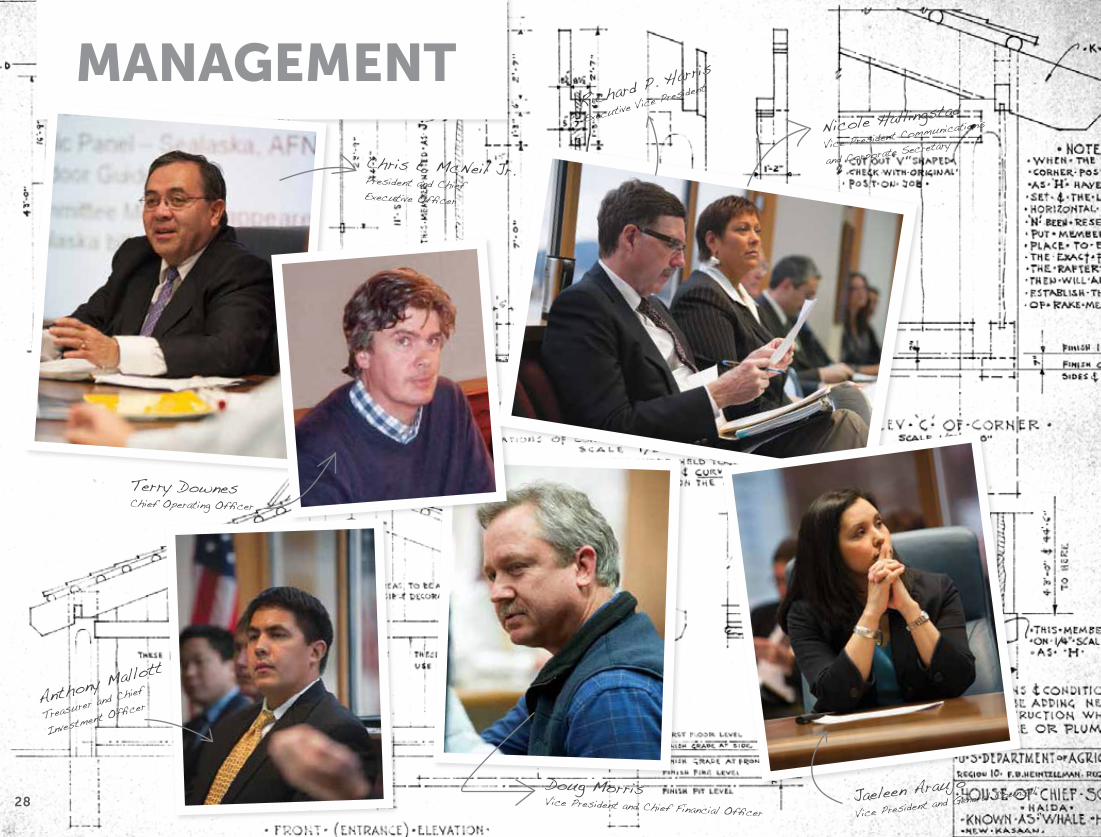
managemenT
Chris E. McNeil Jr.President and Chief Executive Officer
Richard P. Harris
Executive Vice Pres
ident
Nicole Hallingstad
Vice President Communications
and Corporate Secretary
Anthony Mallott
Treasurer and Chief
Investment Officer
Terry DownesChief Operating Officer
Doug MorrisVice President and Chief Financial Officer
Jaeleen AraujoVice President and
General Counsel28

Jason FujiokaDirector of S
ales and Marketing
Vicki SoboleffCorporate Controller
Linda Wynne
Records and I
nformation
Manager
Gail CheneyDirector of
Human Resources
Rob JohnsonInformation TechnologyManager
Ron WolfeNatural Resources Manager
29
30
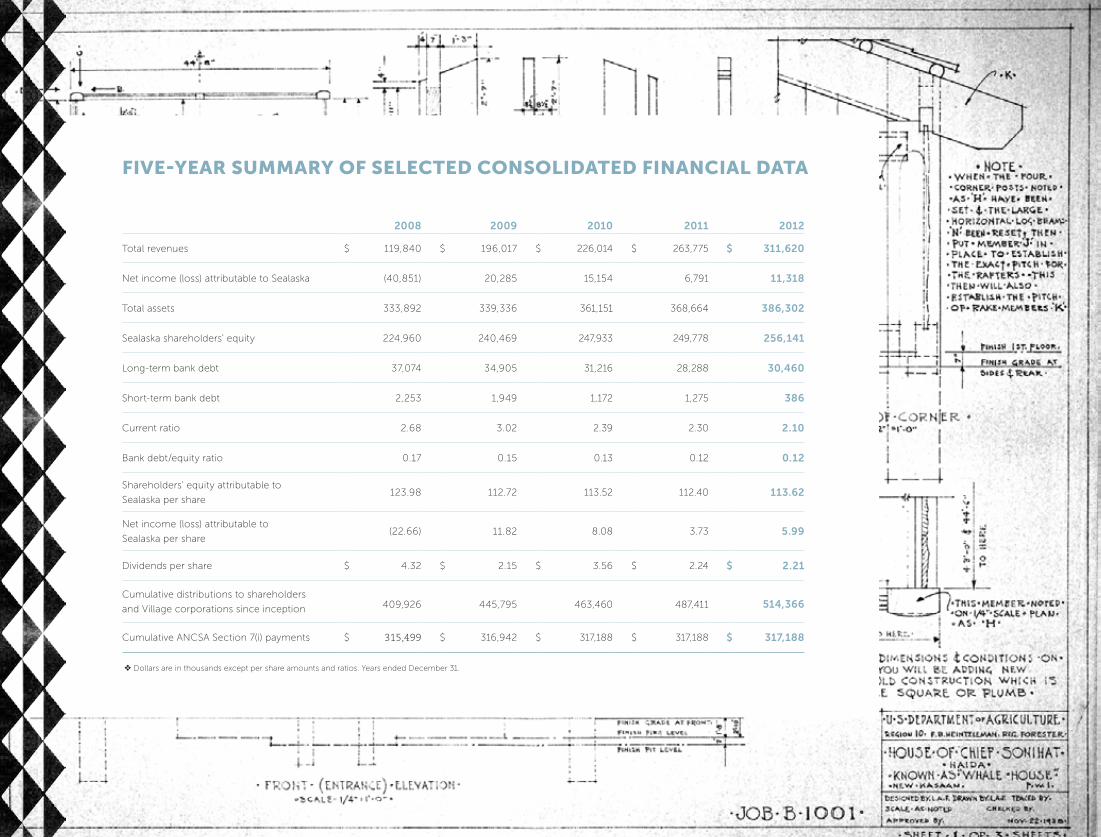
Five-year summary oF selected consolidated Financial data
2008 2009 2010 2011 2012
Total revenues $ 119,840 $ 196,017 $ 226,014 $ 263,775 $ 311,620
Net income (loss) attributable to Sealaska (40,851) 20,285 15,154 6,791 11,318
Total assets 333,892 339,336 361,151 368,664 386,302
Sealaska shareholders’ equity 224,960 240,469 247,933 249,778 256,141
Long-term bank debt 37,074 34,905 31,216 28,288 30,460
Short-term bank debt 2,253 1,949 1,172 1,275 386
Current ratio 2.68 3.02 2.39 2.30 2.10
Bank debt/equity ratio 0.17 0.15 0.13 0.12 0.12
Shareholders’ equity attributable to
Sealaska per share 123.98 112.72 113.52 112.40 113.62
Net income (loss) attributable to
Sealaska per share (22.66) 11.82 8.08 3.73 5.99
Dividends per share $ 4.32 $ 2.15 $ 3.56 $ 2.24 $ 2.21
Cumulative distributions to shareholders
and Village corporations since inception 409,926 445,795 463,460 487,411 514,366
Cumulative ANCSA Section 7(i) payments $ 315,499 $ 316,942 $ 317,188 $ 317,188 $ 317,188
❖ Dollars are in thousands except per share amounts and ratios. Years ended December 31.
31
corporate overview
Sealaska Corporation was formed in 1972 as one
of 13 Regional Native Corporations created by
the Alaska Native Claims Settlement Act (ANCSA).
Sealaska received an initial sum of money to
capitalize Sealaska and the Village corporations in
the region that was $93.2 million in total; the fee
title to at least 362,000 acres of land (surface and
subsurface land); and approximately an additional
300,000 acres of subsurface land in Southeast
Alaska. All lands were formerly part of the Tongass
National Forest. Sealaska currently has more than
21,000 tribal member shareholders descended
from the three Alaska Native groups of Southeast
Alaska: the Tlingit, Haida and Tsimshian.
Sealaska and its subsidiaries maintain offices
throughout the United States and in several
other countries, including Mexico, Canada and
in Europe. These subsidiaries operate in the
following business segments:
1. Natural Resources
2. Manufacturing
3. Services
4. Gaming
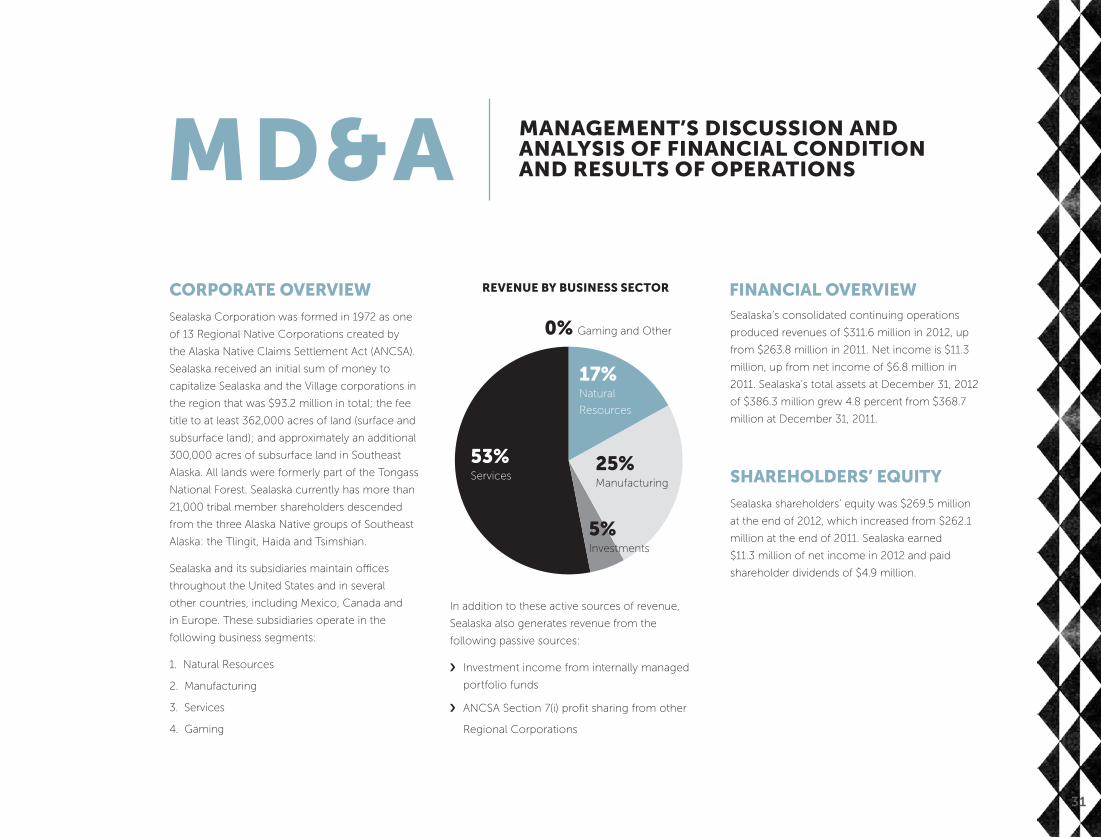
In addition to these active sources of revenue,
Sealaska also generates revenue from the
following passive sources:
› Investment income from internally managed
portfolio funds
› ANCSA Section 7(i) profit sharing from other
Regional Corporations
Sealaska’s consolidated continuing operations
produced revenues of $311.6 million in 2012, up
from $263.8 million in 2011. Net income is $11.3
million, up from net income of $6.8 million in
2011. Sealaska’s total assets at December 31, 2012
of $386.3 million grew 4.8 percent from $368.7
million at December 31, 2011.
shareholders’ equity
Sealaska shareholders’ equity was $269.5 million
at the end of 2012, which increased from $262.1
million at the end of 2011. Sealaska earned
$11.3 million of net income in 2012 and paid
shareholder dividends of $4.9 million.
md&a management’s discussion and analysis oF Financial condition and results oF operations
17%Natural
Resources
25%Manufacturing
5%Investments
53%Services
0% Gaming and Other
revenue by business sector Financial overview
32
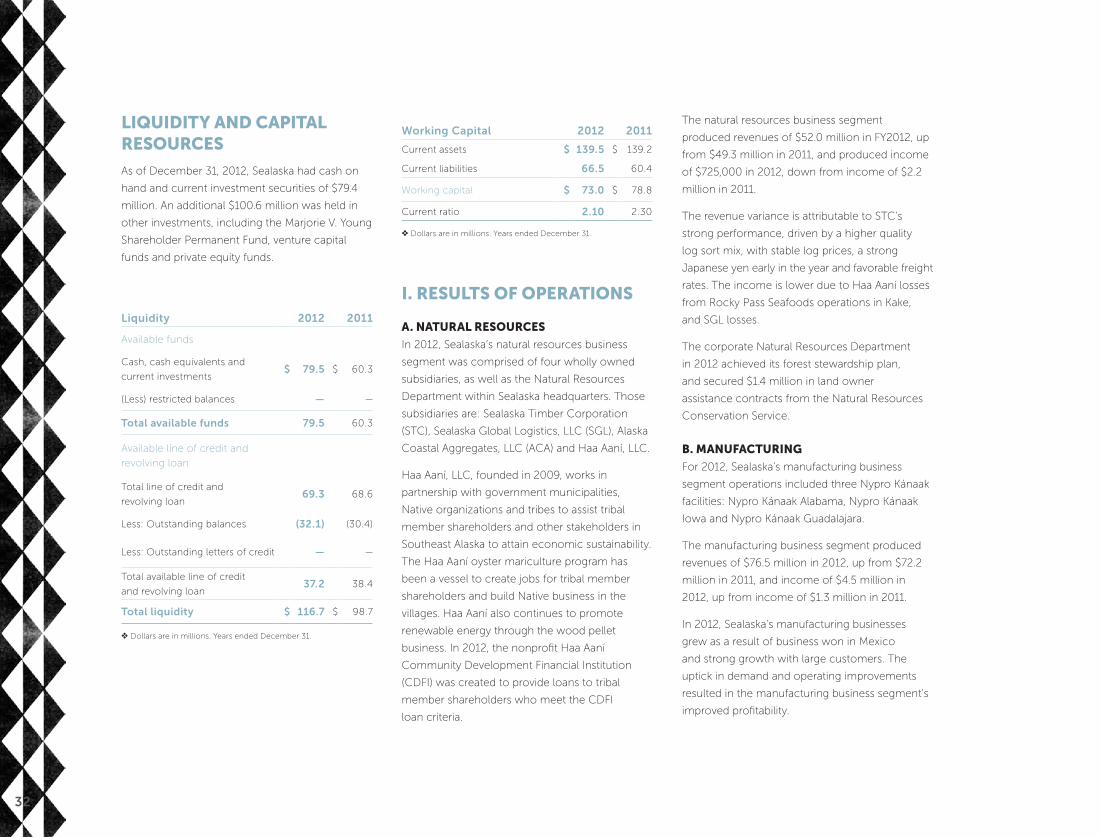
liquidity and capital resources
As of December 31, 2012, Sealaska had cash on
hand and current investment securities of $79.4
million. An additional $100.6 million was held in
other investments, including the Marjorie V. Young
Shareholder Permanent Fund, venture capital
funds and private equity funds.
Liquidity 2012 2011
Available funds
Cash, cash equivalents and
current investments$ 79.5 $ 60.3
(Less) restricted balances — —
Total available funds 79.5 60.3
Available line of credit and
revolving loan
Total line of credit and
revolving loan69.3 68.6
Less: Outstanding balances (32.1) (30.4)
Less: Outstanding letters of credit — —
Total available line of credit
and revolving loan 37.2 38.4
Total liquidity $ 116.7 $ 98.7
❖ Dollars are in millions. Years ended December 31.
Working Capital 2012 2011
Current assets $ 139.5 $ 139.2
Current liabilities 66.5 60.4
Working capital $ 73.0 $ 78.8
Current ratio 2.10 2.30
❖ Dollars are in millions. Years ended December 31.
i. results oF operations
a. natural resources
In 2012, Sealaska’s natural resources business
segment was comprised of four wholly owned
subsidiaries, as well as the Natural Resources
Department within Sealaska headquarters. Those
subsidiaries are: Sealaska Timber Corporation
(STC), Sealaska Global Logistics, LLC (SGL), Alaska
Coastal Aggregates, LLC (ACA) and Haa Aaní, LLC.
Haa Aaní, LLC, founded in 2009, works in
partnership with government municipalities,
Native organizations and tribes to assist tribal
member shareholders and other stakeholders in
Southeast Alaska to attain economic sustainability.
The Haa Aaní oyster mariculture program has
been a vessel to create jobs for tribal member
shareholders and build Native business in the
villages. Haa Aaní also continues to promote
renewable energy through the wood pellet
business. In 2012, the nonprofit Haa Aaní
Community Development Financial Institution
(CDFI) was created to provide loans to tribal
member shareholders who meet the CDFI
loan criteria.
The natural resources business segment
produced revenues of $52.0 million in FY2012, up
from $49.3 million in 2011, and produced income
of $725,000 in 2012, down from income of $2.2
million in 2011.
The revenue variance is attributable to STC’s
strong performance, driven by a higher quality
log sort mix, with stable log prices, a strong
Japanese yen early in the year and favorable freight
rates. The income is lower due to Haa Aaní losses
from Rocky Pass Seafoods operations in Kake,
and SGL losses.
The corporate Natural Resources Department
in 2012 achieved its forest stewardship plan,
and secured $1.4 million in land owner
assistance contracts from the Natural Resources
Conservation Service.
b. manuFacturing
For 2012, Sealaska’s manufacturing business
segment operations included three Nypro Kánaak
facilities: Nypro Kánaak Alabama, Nypro Kánaak
Iowa and Nypro Kánaak Guadalajara.
The manufacturing business segment produced
revenues of $76.5 million in 2012, up from $72.2
million in 2011, and income of $4.5 million in
2012, up from income of $1.3 million in 2011.
In 2012, Sealaska’s manufacturing businesses
grew as a result of business won in Mexico
and strong growth with large customers. The
uptick in demand and operating improvements
resulted in the manufacturing business segment’s
improved profitability.

33
services
managed business solutions, llc
manufacturing
nypro Kánaak
services
sealaska constructors, llcnatural resources
haa aaní, llc
3434
c. services
For 2012, Sealaska’s services business segment
included wholly owned subsidiaries Sealaska
Environmental Services, LLC, Kingston
Environmental, LLC, Kingston Environmental
Services, Inc., Sealaska Constructors, LLC, Synergy
Systems, Inc, and majority-owned subsidiaries
Managed Business Solutions, LLC, MBS Systems,
LLC and Security Alliance of Florida, LLC.
The services business segment produced
revenues of $165.3 million in 2012, up from $145.5
million in 2011, and produced a loss of $4.1 million
in 2012, down from income of $3.5 million in 2011.
The services businesses showed revenue
growth, despite a weakening market for
federal contracting. With the exception of civil
construction, each of the other business units
out-performed its 2011 results. Nonetheless, the
losses in several civil construction projects were
significant and, as a result, the services business
segment incurred a loss of $4.1 million. Toward
the end of 2012, the process of restructuring the
construction business was started and significant
action has been taken to reduce costs and
refocus on profitable contracts.
d. gaming
Sealaska’s gaming business is managed by its
wholly owned subsidiary End-to-End Enterprises,
LLC (E2E). The sole gaming project under
E2E is the Cloverdale Rancheria casino and
resort project, approximately 90 miles north
of San Francisco on Highway 101. E2E and the
Cloverdale Rancheria of Pomo Indians (Tribe) have
formally terminated the casino development and
management agreements but are collaborating
to find a new investor and to secure the
governmental approvals to construct and operate
a casino.
The property and the project are well positioned
for casino and resort development. The land has
a favorable Indian Land Opinion (ILO) confirming
the land is qualified for Indian Trust Land status
and the Final Environmental Impact Statement
(FEIS) that is required for the land to be taken
into trust, and there is a good probability that a
record of decision (ROD) will be issued in 2013.
There is a rebound in real estate values and there
is a resurgence in investor interest in casino
properties. E2E believes that there is an increasing
probability that it will recover its investment in
the casino and resort project. To facilitate that
recovery and to move the project forward, the
Tribe and E2E have retained a firm to identify
financing and investment partners.
The gaming business segment produced revenues
of $343,000 in 2012, up from $147,000 in 2011,
and a loss of $353,000 in 2012, up from a loss of
$843,000 in 2011.
e. investments
For 2012, Sealaska’s investments business
segment primarily included the Marjorie V. Young
(MVY) Shareholder Permanent Fund and the
Investment and Growth (I&G) Fund.
The investment business segment achieved
investment gains of $16.8 million in 2012, up
from investment losses of $3.9 million in 2011,
and a gain, after expenses, of $16.2 million in
2012, up from losses, including expenses, of $4.5
million in 2011.
The combined balance of the MVY Shareholder
Permanent Fund and the I&G Fund was $131.2
million at the start of the year, and ended 2012
with a combined balance of $145.3 million
invested in stocks, bonds, real estate and private
equity investments.
Both funds have maintained strong, long-term
performance, which shows the strength of the
funds’ diversification strategy directed by the
board-approved investment policy.
1. Marjorie V. Young Shareholder Permanent
Fund
Renamed as a tribute to longtime, Native leader
and retired Sealaska director Marjorie V. Young,
Sealaska’s MVY Shareholder Permanent Fund
was created in 1987 to provide tribal member
shareholders with meaningful and consistent
dividends over time.
Sealaska management and the board of
directors, along with their investment advisors
and investment managers, constantly evaluate
the risk exposure of the total portfolio and will
make changes whenever possible to lessen risk—if
doing so does not inordinately affect long-term
expected returns. Sealaska utilizes the services of
several external investment managers.
2. Investment and Growth Fund
The Investment and Growth Fund is managed
with a short-term investment horizon and is used
for both operational needs and new investments.
The management focus of the fund is to grow
principal with a prudent level of risk, maintain
sufficient liquidity to fund Sealaska’s current
business operations, and provide a source of
capital for corporate development.
35
F. corporate and other income
For 2012, Sealaska’s corporate and other income
included the revenue generating departments at
the corporate headquarters besides the Natural
Resources Department, such as Real Estate and
Diversity Solutions.
The corporate and other income business
segment produced revenues of $660,000 in
2012, up from $521,000 in 2011, and a loss of
$2.0 million in 2012 after a loss of $2.2 million
in 2011. The primary business activities included
in this segment are real estate leasing, business
development activities and pursuit of diversity
opportunities.
ii. shareholder beneFits and services
a. sealasKa heritage institute
Established in 1980, Sealaska Heritage Institute
(SHI) is Sealaska’s regional nonprofit organization
whose mission is to perpetuate and enhance
the Tlingit, Haida and Tsimshian cultures of
Southeast Alaska, and to promote cross cultural
understanding. SHI develops Native language,
culture and arts education curricula and material,
and provides professional development for
teachers and artists; manages the Sealaska
scholarship program; conducts research and
publishes material on Native history and culture;
and maintains an archival and ethnographic
collection. SHI is raising funds to build the Walter
Soboleff Center in downtown Juneau. The
center will house SHI programs; its archival and
ethnographic collection; and market Native art. Its
programs and museum exhibitions will serve as an
education center for Native people, the general
public and visitors to Alaska.
In 2012, Sealaska contributed $1.3 million in cash
and in-kind services to support the operations
of SHI. Using Sealaska donations as leverage,
SHI raised an additional $8.5 million in grants,
revenue and sales. In addition, Sealaska Timber
Corporation contributed $293,000 toward
scholarships, and Sealaska contributed $116,000
for a total of $409,000.
b. elders' settlement trust
The Elders' Settlement Trust (EST) is a grantor trust
created to provide a special economic benefit
to original tribal member shareholders at the
age of 65. The assets and liabilities of the EST
are reported on Sealaska’s consolidated financial
statements (see notes 4 and 12). The EST, which is
governed by a board of trustees, assumes a long-
term annualized rate of return of seven percent in
order for the trust to meet the estimated
benefit payments.
c. distributions
Since its inception in 1972, Sealaska has distributed
$514.4 million in dividends and ANCSA Section
7(j) payments to tribal member shareholders and
Village Corporations. The outstanding shares of
dividend paying stock are affected by the open
enrollment of Descendants when they reach 18
years of age, enrollment of Leftouts, and of the
additional shares issued to Elders reaching the
age of 65. Adding more dividend paying stock for
the reason described above means that dividends
will be paid to a larger number of individuals and
may result in smaller dividends to original tribal
member shareholders. However, the recipients
of Descendant and Leftout shares do not receive
ANCSA Section 7(j) payments. This protects a
portion of the distributions for original tribal
member shareholders who do receive those
Section 7(j) payments. Also, when holders of life
estate Class D (Descendant), Class E (Elders) and
Class L (Leftouts) shares pass away, their life estate
shares are canceled.
d. shareholder relations
At year’s end, Sealaska had 21,313 tribal member
shareholders. The Shareholder Relations
Department manages tribal member shareholders’
records, stock transfers due to gifting or estate
settlement, shareholder distributions and
processing EST payments. In 2011, Sealaska
chose to move to a mail distribution method
outside of corporate headquarters for distributions
to tribal member shareholders. This reduces
risk by increasing privacy, and saves expense.
The Shareholder Relations Department is also
responsible for the processing of applications
and the issuance of Class D and Class L stock,
following a 2007 vote by Sealaska tribal member
shareholders approving open enrollment
for eligible applicants. The department also
issues new Class E (Elders) stock to original
shareholders at the age of 65, following a 2009
vote by shareholders to provide this benefit. The
number of common stock shares outstanding at
December 31, 2012 was 2,254,376.
35
36
iii. special note regarding Forward-looKing statements
Certain sections of the annual report contain
forward-looking statements that are based
on management’s expectations, estimates,
projections and assumptions. Words such
as “expects,” “anticipates,” “plans,” “believes,”
“scheduled,” “estimates” and variations of these
words and similar expressions are intended
to identify forward-looking statements, which
include but are not limited to projections of
revenues, income, segment performance, cash
flows, contract awards, deliveries and backlog.
These statements are not guarantees of future
performance and involve certain risks and
uncertainties, which are difficult to predict.
Therefore, actual future results and trends
may differ materially from what is forecast in
forward-looking statements. All forward-looking
statements speak only as of the date of this report
or, in the case of any document incorporated
by reference, the date of that document. All
subsequent written and oral forward-looking
statements attributable to the company or any
person acting on the company’s behalf are
qualified by the cautionary statements in this
section. The company does not undertake any
obligation to update or publicly release any
revisions to forward-looking statements to reflect
events, circumstances or changes in expectations
after the date of this report.
iv. signiFicant accounting policies
Sealaska's consolidated financial statements and
accompanying notes have been prepared in
accordance with Generally Accepted Accounting
Principles (GAAP). The preparation of these
financial statements requires the company's
management to make estimates, judgments and
assumptions that affect reported amounts of
assets, liabilities, revenues and expenses. Sealaska
bases its estimates on historical experience and
assumptions believed to be reasonable under
current facts and circumstances. Actual amounts
and results could differ from these estimates
made by management.
To ensure full disclosure and accurate
representation of the financial condition of
the company, Sealaska continually evaluates
the accounting policies and estimates used to
prepare the consolidated financial statements
and, working with independent auditors
and the board of directors, adjusts financial
statements to accurately represent the financial
condition of the company. See Notes to
Consolidated Financial Statements.
v. additional inFormation
Sealaska continues to publish more concise
discussion and analysis of its operations by our
management team in the annual report. This
streamlined format, introduced in 2010, enhances
readability and is significantly shorter. Therefore,
paper and production costs are reduced. This
format aligns with important lean and green
strategies for the company. Additional operational
information is available at www.sealaska.com.
If you have a detailed financial question related
to data previously reported in the longer format,
please contact the Sealaska corporate controller
at 907.586.1512.
37
independentauditors' reportthe board oF directors SEALASKA CORPORATION:
We have audited the accompanying consolidated financial statements of
Sealaska Corporation and its subsidiaries, which comprise the consolidated
balance sheets as of December 31, 2012 and 2011, and the related
consolidated statements of operations, shareholders’ equity and cash flows
for each of the years in the three-year period ended December 31, 2012 and
the related notes to the consolidated financial statements.
Management's Responsibility for the Financial Statements
Management is responsible for the preparation and fair presentation of
these consolidated financial statements in accordance with U.S. generally
accepted accounting principles; this includes the design, implementation
and maintenance of internal control relevant to the preparation and fair
presentation of consolidated financial statements that are free from material
misstatement, whether due to fraud or error.
Auditors’ Responsibility
Our responsibility is to express an opinion on these consolidated financial
statements based on our audits. We conducted our audits in accordance
with auditing standards generally accepted in the United States of America.
Those standards require that we plan and perform the audit to obtain
reasonable assurance about whether the consolidated financial statements
are free from material misstatement.
An audit involves performing procedures to obtain audit evidence about
the amounts and disclosures in the consolidated financial statements.
The procedures selected depend on the auditors’ judgment, including
the assessment of the risks of material misstatement of the consolidated
financial statements, whether due to fraud or error. In making those risk
assessments, the auditor considers internal control relevant to the entity's
preparation and fair presentation of the consolidated financial statements in
order to design audit procedures that are appropriate in the circumstances,
but not for the purpose of expressing an opinion on the effectiveness of
the entity's internal control. Accordingly, we express no such opinion. An
audit also includes evaluating the appropriateness of accounting policies
used and the reasonableness of significant accounting estimates made
by management, as well as evaluating the overall presentation of the
consolidated financial statements.
We believe that the audit evidence we have obtained is sufficient and
appropriate to provide a basis for our audit opinion.
Opinion
In our opinion, the consolidated financial statements referred to above
present fairly in all material respects, the financial position of Sealaska
Corporation and its subsidiaries as of December 31, 2012 and 2011, and
the results of their operations and their cash flows for each of the years in
the three-year period ended December 31, 2012 in accordance with U.S.
generally accepted accounting principles.
Seattle, Washington
April 22, 2013
38
consolidated balance sheets
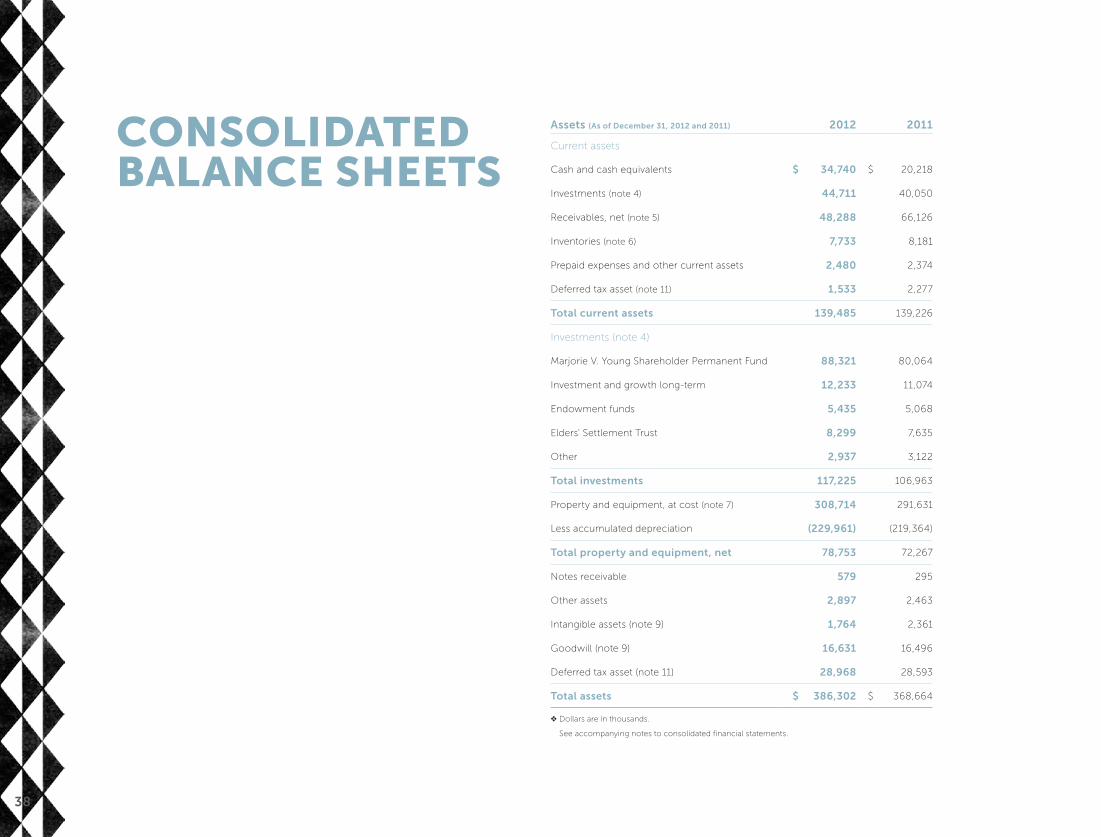
Assets (As of December 31, 2012 and 2011) 2012 2011
Current assets
Cash and cash equivalents $ 34,740 $ 20,218
Investments (note 4) 44,711 40,050
Receivables, net (note 5) 48,288 66,126
Inventories (note 6) 7,733 8,181
Prepaid expenses and other current assets 2,480 2,374
Deferred tax asset (note 11) 1,533 2,277
Total current assets 139,485 139,226
Investments (note 4)
Marjorie V. Young Shareholder Permanent Fund 88,321 80,064
Investment and growth long-term 12,233 11,074
Endowment funds 5,435 5,068
Elders' Settlement Trust 8,299 7,635
Other 2,937 3,122
Total investments 117,225 106,963
Property and equipment, at cost (note 7) 308,714 291,631
Less accumulated depreciation (229,961) (219,364)
Total property and equipment, net 78,753 72,267
Notes receivable 579 295
Other assets 2,897 2,463
Intangible assets (note 9) 1,764 2,361
Goodwill (note 9) 16,631 16,496
Deferred tax asset (note 11) 28,968 28,593
Total assets $ 386,302 $ 368,664
❖ Dollars are in thousands.
See accompanying notes to consolidated financial statements.
39
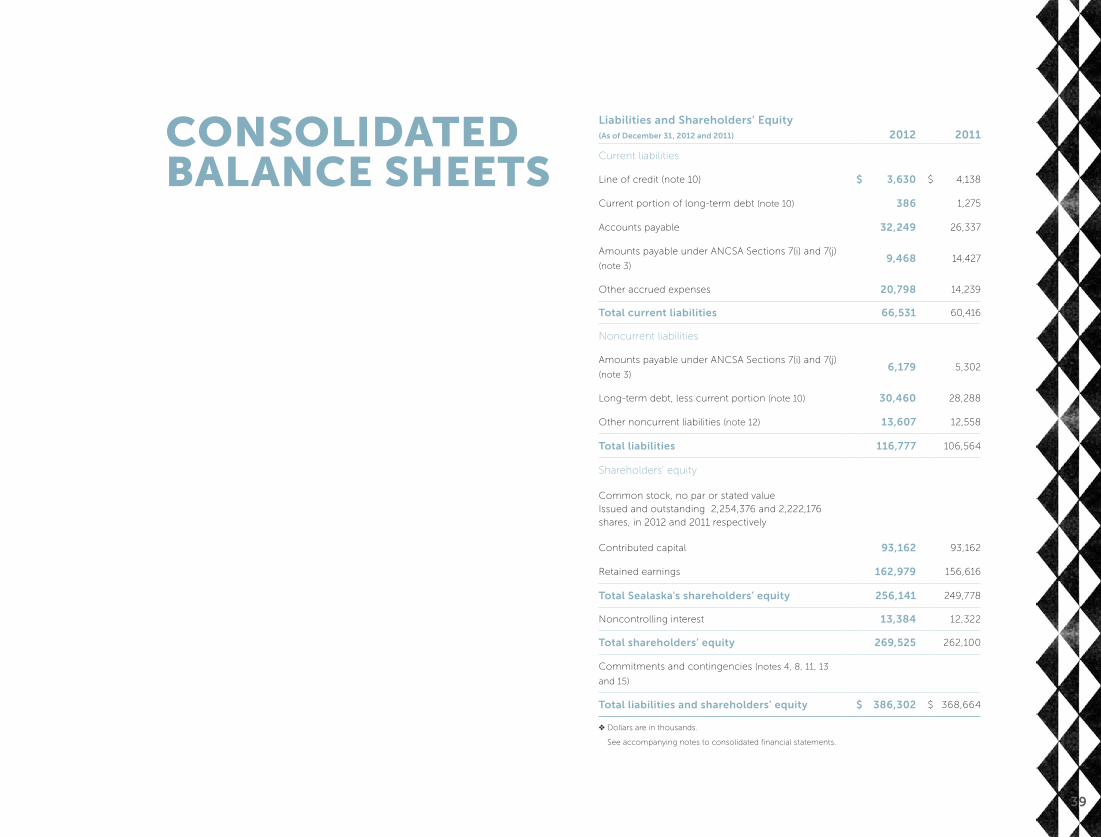
Liabilities and Shareholders’ Equity (As of December 31, 2012 and 2011) 2012 2011
Current liabilities
Line of credit (note 10) $ 3,630 $ 4,138
Current portion of long-term debt (note 10) 386 1,275
Accounts payable 32,249 26,337
Amounts payable under ANCSA Sections 7(i) and 7(j)
(note 3) 9,468 14,427
Other accrued expenses 20,798 14,239
Total current liabilities 66,531 60,416
Noncurrent liabilities
Amounts payable under ANCSA Sections 7(i) and 7(j)
(note 3) 6,179 5,302
Long-term debt, less current portion (note 10) 30,460 28,288
Other noncurrent liabilities (note 12) 13,607 12,558
Total liabilities 116,777 106,564
Shareholders’ equity
Common stock, no par or stated value Issued and outstanding 2,254,376 and 2,222,176 shares, in 2012 and 2011 respectively
Contributed capital 93,162 93,162
Retained earnings 162,979 156,616
Total Sealaska's shareholders’ equity 256,141 249,778
Noncontrolling interest 13,384 12,322
Total shareholders’ equity 269,525 262,100
Commitments and contingencies (notes 4, 8, 11, 13
and 15)
Total liabilities and shareholders’ equity $ 386,302 $ 368,664
❖ Dollars are in thousands.
See accompanying notes to consolidated financial statements.
consolidated balance sheets
40
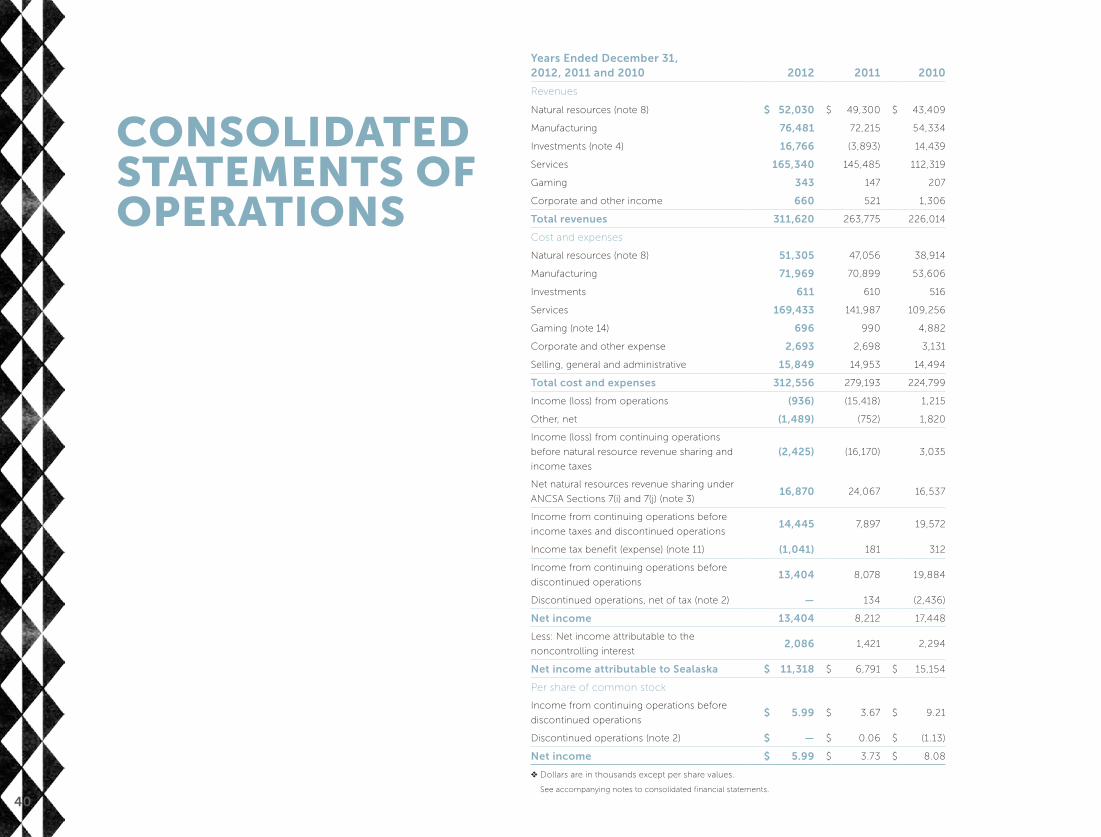
consolidated statements oF operations
Years Ended December 31, 2012, 2011 and 2010 2012 2011 2010
Revenues
Natural resources (note 8) $ 52,030 $ 49,300 $ 43,409
Manufacturing 76,481 72,215 54,334
Investments (note 4) 16,766 (3,893) 14,439
Services 165,340 145,485 112,319
Gaming 343 147 207
Corporate and other income 660 521 1,306
Total revenues 311,620 263,775 226,014
Cost and expenses
Natural resources (note 8) 51,305 47,056 38,914
Manufacturing 71,969 70,899 53,606
Investments 611 610 516
Services 169,433 141,987 109,256
Gaming (note 14) 696 990 4,882
Corporate and other expense 2,693 2,698 3,131
Selling, general and administrative 15,849 14,953 14,494
Total cost and expenses 312,556 279,193 224,799
Income (loss) from operations (936) (15,418) 1,215
Other, net (1,489) (752) 1,820
Income (loss) from continuing operations
before natural resource revenue sharing and
income taxes
(2,425) (16,170) 3,035
Net natural resources revenue sharing under
ANCSA Sections 7(i) and 7(j) (note 3)16,870 24,067 16,537
Income from continuing operations before
income taxes and discontinued operations14,445 7,897 19,572
Income tax benefit (expense) (note 11) (1,041) 181 312
Income from continuing operations before
discontinued operations13,404 8,078 19,884
Discontinued operations, net of tax (note 2) — 134 (2,436)
Net income 13,404 8,212 17,448
Less: Net income attributable to the
noncontrolling interest2,086 1,421 2,294
Net income attributable to Sealaska $ 11,318 $ 6,791 $ 15,154
Per share of common stock
Income from continuing operations before
discontinued operations$ 5.99 $ 3.67 $ 9.21
Discontinued operations (note 2) $ — $ 0.06 $ (1.13)
Net income $ 5.99 $ 3.73 $ 8.08
❖ Dollars are in thousands except per share values.
See accompanying notes to consolidated financial statements.
41
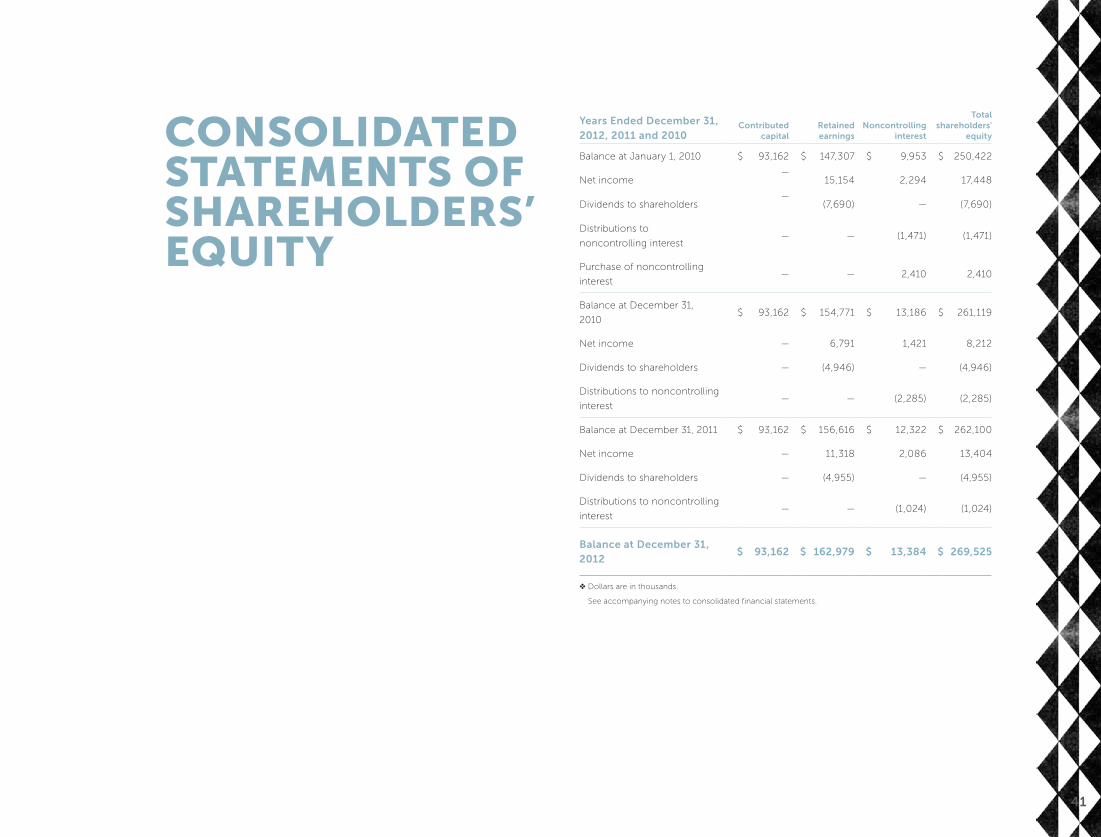
consolidated statements oF shareholders’ equity
Years Ended December 31, 2012, 2011 and 2010
Contributed capital
Retained earnings
Noncontrolling interest
Total shareholders'
equity
Balance at January 1, 2010 $ 93,162 $ 147,307 $ 9,953 $ 250,422
Net income —
15,154 2,294 17,448
Dividends to shareholders —
(7,690) — (7,690)
Distributions to
noncontrolling interest— — (1,471) (1,471)
Purchase of noncontrolling
interest— — 2,410 2,410
Balance at December 31,
2010$ 93,162 $ 154,771 $ 13,186 $ 261,119
Net income — 6,791 1,421 8,212
Dividends to shareholders — (4,946) — (4,946)
Distributions to noncontrolling
interest— — (2,285) (2,285)
Balance at December 31, 2011 $ 93,162 $ 156,616 $ 12,322 $ 262,100
Net income — 11,318 2,086 13,404
Dividends to shareholders — (4,955) — (4,955)
Distributions to noncontrolling
interest— — (1,024) (1,024)
Balance at December 31, 2012
$ 93,162 $ 162,979 $ 13,384 $ 269,525
❖ Dollars are in thousands.
See accompanying notes to consolidated financial statements.

42
consolidated statements oF cash Flows
Years Ended December 31, 2012, 2011 and 2010 2012 2011 2010
Cash flows from operating activities
Net income $ 13,404 $ 8,212 $ 17,448
Adjustments to reconcile net
income to net cash provided by
(used in) operating activities
Depreciation, amortization and
depletion 11,888 9,537 7,759
Deferred income tax expense 369 169 63
Gain on disposal of fixed assets 829 325 —
Gain on debt forgiveness — — (2,950)
Loss on impairment of goodwill 363 — —
Loss on impairment of assets 459 — 4,302
Unrealized (gain) loss on investments (12,868) 8,941 (7,241)
Net proceeds from (purchase of)
investments (2,055) (3,619) 23,572
Decrease (increase) in assets, net of
effects of acquisition
Receivables 17,838 (11,104) (25,465)
Inventories 448 (2,435) 925
Prepaid expenses and other current
assets (106) 2,816 (1,297)
Increase (decrease) in liabilities, net
of effects of acquisition
Accounts payable 5,912 3,428 6,990
Other accrued expenses 6,559 (4,213) 761
Amounts payable under ANCSA
Sections 7(i) and 7(j) (4,082) 6,348 6,655
Other, net 615 (1,277) 833
Net cash provided by operating activities
$ 39,573 $ 17,128 $ 32,355
❖ Dollars are in thousands.
See accompanying notes to consolidated financial statements.
43
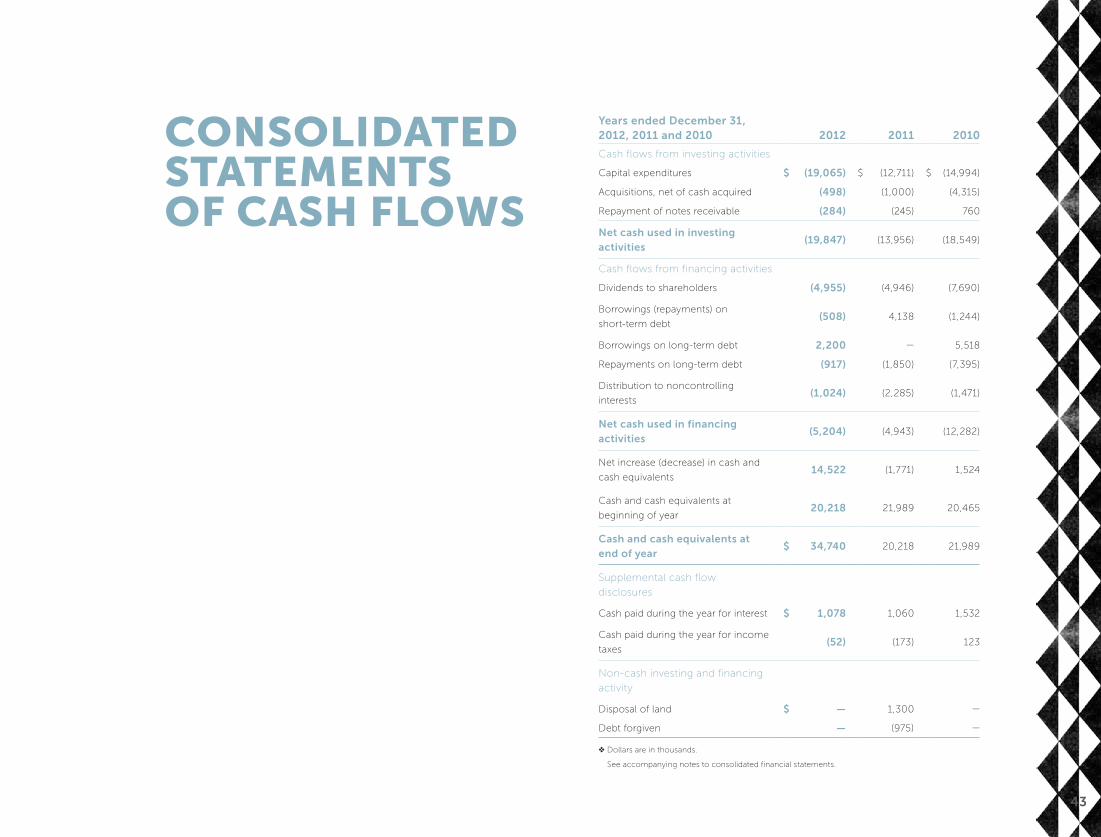
Years ended December 31, 2012, 2011 and 2010 2012 2011 2010
Cash flows from investing activities
Capital expenditures $ (19,065) $ (12,711) $ (14,994)
Acquisitions, net of cash acquired (498) (1,000) (4,315)
Repayment of notes receivable (284) (245) 760
Net cash used in investing activities
(19,847) (13,956) (18,549)
Cash flows from financing activities
Dividends to shareholders (4,955) (4,946) (7,690)
Borrowings (repayments) on
short-term debt (508) 4,138 (1,244)
Borrowings on long-term debt 2,200 — 5,518
Repayments on long-term debt (917) (1,850) (7,395)
Distribution to noncontrolling
interests (1,024) (2,285) (1,471)
Net cash used in financing activities
(5,204) (4,943) (12,282)
Net increase (decrease) in cash and
cash equivalents 14,522 (1,771) 1,524
Cash and cash equivalents at
beginning of year 20,218 21,989 20,465
Cash and cash equivalents at end of year
$ 34,740 20,218 21,989
Supplemental cash flow
disclosures
Cash paid during the year for interest $ 1,078 1,060 1,532
Cash paid during the year for income
taxes (52) (173) 123
Non-cash investing and financing
activity
Disposal of land $ — 1,300 —
Debt forgiven — (975) —
❖ Dollars are in thousands.
See accompanying notes to consolidated financial statements.
consolidated statements oF cash Flows

44
notes to consolidated Financial statements
1. operations and summary oF signiFicant accounting policies
Operations
Sealaska Corporation (Sealaska or Company) is a
Regional Alaska Native Corporation formed under
the Alaska Native Claims Settlement Act (ANCSA).
Sealaska’s five primary continuing business
activities relate to the development, production
and sale of natural resources; the manufacture
and sale of plastics, parts and products; services
related to environmental remediation, information
technology and construction; gaming; and the
management of its investment portfolio. ANCSA is
further described in note 3.
Basis of Presentation and Significant
Accounting Policies
The consolidated financial statements include
the accounts of Sealaska and its wholly and
majority owned subsidiaries. All significant
intercompany balances and transactions have
been eliminated in consolidation.
(a) revenue recognition and receivables
Revenue is recognized when earned, and the
risks of ownership have been transferred to
the buyer, which is generally upon shipment to
the customer. Receivables are recorded when
invoiced and do not bear interest. Allowance
for doubtful accounts is recorded based upon
Sealaska’s collection experience with credit losses
in existing outstanding receivables.
Revenues on long-term service contracts are
recognized ratably over the term of the contract
as services are performed or based on the
specific terms of the contracts. Unbilled revenue
represents uncompleted tasks that will be billed
at the time of completion in subsequent years.
Revenue from claims is recognized when the
amounts are received or the related contract
modification is approved by the customer.
(b) cash and cash equivalents
Sealaska maintains its cash in bank accounts
with various financial institutions. At times, the
balances may exceed federally insured limits.
For purposes of the consolidated statements of
cash flows, Sealaska considers all highly liquid
debt instruments with original maturities of three
months or less from the date of purchase to be
cash equivalents.
(c) investments
Sealaska’s investments in marketable debt and
equity securities (note 4) are classified as trading
securities and are recorded at fair value. Fair
value is based upon quoted market prices. The
increase or decrease in fair value from period to
period relating to marketable securities included
in Sealaska’s investment portfolio is included
in the determination of income. Interest and
dividend income is recognized as earned. Gains
or losses on the sale of marketable securities
are determined on a specific identification
basis. Certain investments are valued at the net
asset value (NAV) per share/unit reported at the
close of each business day. NAV is used by the
Company as a practical expedient to estimating
fair value as these funds do not have readily
determinable fair values. Sealaska accounts for
certain noncontrolling interests, less than 50
percent ownership and control, in privately held
corporations, LLCs and partnerships (the investee)
using the equity method of accounting. Under the
equity method, Sealaska’s original investment in
the investee is recorded at cost and subsequently
45
adjusted for changes in the net assets of the
investee. The carrying amount of the investment
is periodically increased (decreased) by the
proportionate share in the earnings (losses)
of the investee.
During 2011, Sealaska Corporation acquired Series
B Preferred Stock of Green Earth Greens, Inc.
representing a 7.75 percent ownership interest
on a fully diluted basis, for a purchase price of
$1.0 million. Green Earth Greens, Inc. is engaged
in the development of proprietary technology
and a multitiered “Vegetable Factory” providing
optimum growing conditions of vegetables, zero
environmental pollutants and year-round local
production of premium produce. The purchase
price grants Sealaska Corporation an exclusive
right to develop the Alaska market.
(d) inventories
Inventories are stated at the lower of cost
(determined on a first in, first out basis) or
estimated net realizable value. Inventories consist
primarily of sorted/scaled timber, manufacturing
materials and finished goods.
(e) property and equipment
Property and equipment are stated at cost.
Depreciation and amortization of property,
equipment and leasehold improvements are
provided primarily on the straight line method
over the shorter of the expected useful lives of the
assets or the lease term as follows:
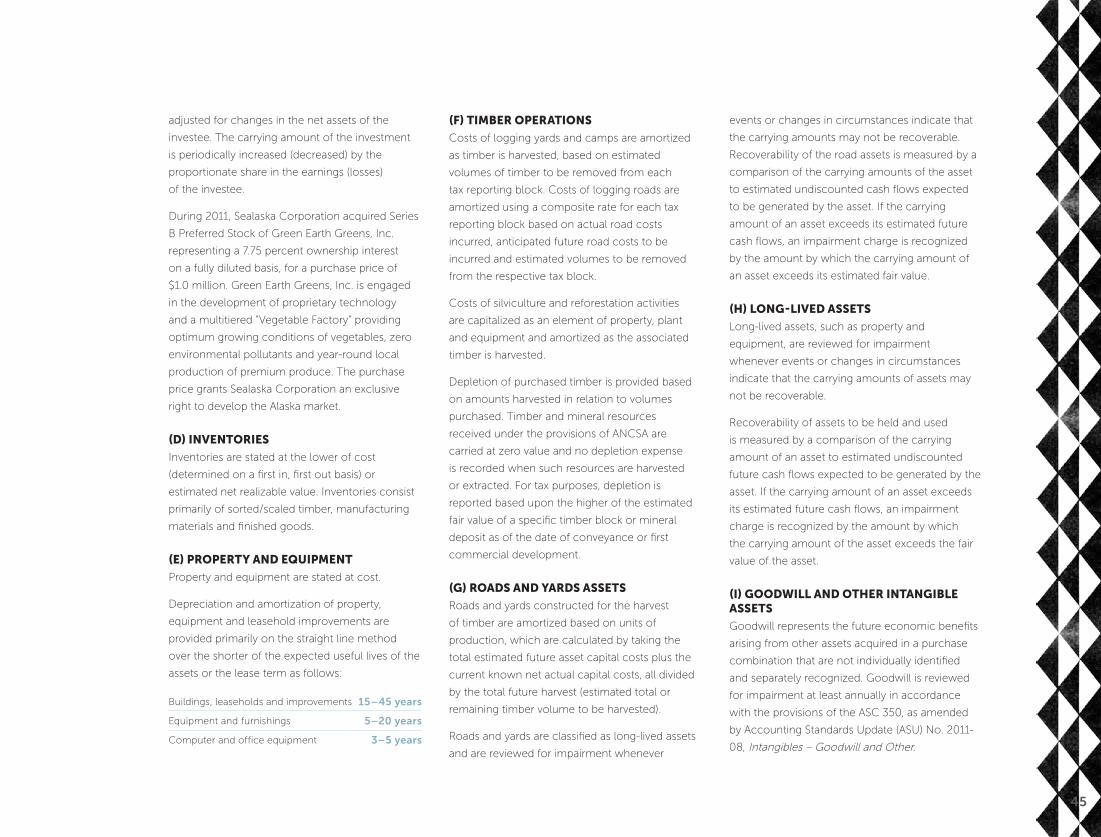
Buildings, leaseholds and improvements 15–45 years
Equipment and furnishings 5–20 years
Computer and office equipment 3–5 years
(F) timber operations
Costs of logging yards and camps are amortized
as timber is harvested, based on estimated
volumes of timber to be removed from each
tax reporting block. Costs of logging roads are
amortized using a composite rate for each tax
reporting block based on actual road costs
incurred, anticipated future road costs to be
incurred and estimated volumes to be removed
from the respective tax block.
Costs of silviculture and reforestation activities
are capitalized as an element of property, plant
and equipment and amortized as the associated
timber is harvested.
Depletion of purchased timber is provided based
on amounts harvested in relation to volumes
purchased. Timber and mineral resources
received under the provisions of ANCSA are
carried at zero value and no depletion expense
is recorded when such resources are harvested
or extracted. For tax purposes, depletion is
reported based upon the higher of the estimated
fair value of a specific timber block or mineral
deposit as of the date of conveyance or first
commercial development.
(g) roads and yards assets
Roads and yards constructed for the harvest
of timber are amortized based on units of
production, which are calculated by taking the
total estimated future asset capital costs plus the
current known net actual capital costs, all divided
by the total future harvest (estimated total or
remaining timber volume to be harvested).
Roads and yards are classified as long-lived assets
and are reviewed for impairment whenever
events or changes in circumstances indicate that
the carrying amounts may not be recoverable.
Recoverability of the road assets is measured by a
comparison of the carrying amounts of the asset
to estimated undiscounted cash flows expected
to be generated by the asset. If the carrying
amount of an asset exceeds its estimated future
cash flows, an impairment charge is recognized
by the amount by which the carrying amount of
an asset exceeds its estimated fair value.
(h) long-lived assets
Long-lived assets, such as property and
equipment, are reviewed for impairment
whenever events or changes in circumstances
indicate that the carrying amounts of assets may
not be recoverable.
Recoverability of assets to be held and used
is measured by a comparison of the carrying
amount of an asset to estimated undiscounted
future cash flows expected to be generated by the
asset. If the carrying amount of an asset exceeds
its estimated future cash flows, an impairment
charge is recognized by the amount by which
the carrying amount of the asset exceeds the fair
value of the asset.
(i) goodwill and other intangible assets
Goodwill represents the future economic benefits
arising from other assets acquired in a purchase
combination that are not individually identified
and separately recognized. Goodwill is reviewed
for impairment at least annually in accordance
with the provisions of the ASC 350, as amended
by Accounting Standards Update (ASU) No. 2011-
08, Intangibles – Goodwill and Other.
46
The amended goodwill impairment test provides
the option to first assess certain qualitative factors
to ascertain whether it is more likely than not that
the fair value of a reporting unit is less than its
carrying amount to determine whether the two-
step impairment test is necessary. If certain events
or circumstances demonstrate that it is more
likely than not that the fair value of a reporting unit
is less than its carrying amount, the company is
required to proceed to step one of the two-step
goodwill impairment test. Under the first step, the
fair value of the reporting unit is compared with
its carrying value (including goodwill). If the fair
value of the reporting unit is less than its carrying
value, an indication of goodwill impairment
exists for the reporting unit and the enterprise
must perform step two of the impairment test
(measurement). Under step two, an impairment
loss is recognized for any excess of the carrying
amount of the reporting unit’s goodwill over the
implied fair value of that goodwill. The implied fair
value of goodwill is determined by allocating the
fair value of the reporting unit in a manner similar
to a purchase price allocation, in accordance with
ASC 805, Business Combinations. The residual fair
value after this allocation is the implied fair value
of the reporting unit goodwill. Fair value of the
reporting unit is determined using a discounted
cash flow analysis. If the fair value of the reporting
unit exceeds its carrying value, step two does not
need to be performed.
Other intangible assets consist of customer
relationships. Customer relationships are
amortized over their estimated useful lives,
typically between seven to eight years using the
straight line method.
(j) alasKa native claims settlement assets
Sealaska has received substantial natural resource
assets under the provisions of ANCSA as described
in note 8. These assets are carried in the
accompanying consolidated financial statements
at zero value. For tax reporting purposes, these
assets have a tax basis determined as the higher
of their estimated fair value at the date of
conveyance or first commercial development.
As a result, a substantial difference between the
book and tax basis exists, which is considered a
temporary difference for purposes of reporting
income tax expense under U.S. generally
accepted accounting principles.
(K) ancsa section 7(i) accounting
Fixed Assets: In Section 7(i) accounting, ANCSA
fixed assets are expensed in the year they are
purchased. For book accounting, all fixed assets
are depreciated using the straight-line method
based on their useful life.
Roads and Yards: In Section 7(i) accounting,
ANCSA roads are segregated into three
categories: mainline, secondary and spur. Mainline
and secondary roads are amortized based on
units of production and the useful life of 10 and
three years, respectively. Spur roads are expensed
in the year they are placed into service. The book
treatment is addressed in the fixed assets note
above. Yards are treated consistently for Section
7(i) and book accounting.
Inventories: Section 7(i) accounting allows for
the deduction of the cost of inventories from
revenues in determining Section 7(i) sharable
income. For book purposes, inventories are
reported at lower of cost or estimated net
realizable value under current assets on the
balance sheet.
Accounts Receivable: Section 7(i) accounting
allows for the deduction of outstanding accounts
receivable from revenues in determining Section
7(i) sharable income. For book purposes, accounts
receivable are reported under current assets on
the balance sheets and the associated revenues
are recognized as described in note 1A.
(l) income taxes
Income taxes are accounted for under the
asset and liability method. Deferred tax assets
and liabilities are recognized for the future tax
consequences attributable to differences between
the financial statement carrying amounts of
existing assets and liabilities and their respective
tax bases and operating loss and tax credit
carryforwards. Deferred tax assets and liabilities
are measured using enacted tax rates expected
to apply to taxable income in the years in which
those temporary differences are expected to be
recovered or settled. The effect on deferred tax
assets and liabilities of a change in tax rates is
recognized in income in the period that includes
the enactment date. Uncertain tax positions are
recorded when they are determined to be more
likely than not of being sustained on Sealaska’s
tax return. See note 11 for further discussion of
income taxes.
Funds and properties received from the U.S.
government under ANCSA are not subject to
income taxes.
47
(m) net income per share
Net income per share information in the
consolidated financial statements is based on
weighted average shares outstanding. Sealaska
has no agreements or securities outstanding that
represent dilutive potential common shares.
The number of common stock shares outstanding
at December 31, 2012 and 2011 is 2,254,376 and
2,222,176, respectively. The stock, dividends paid
and other stock rights are restricted; the stock
may not be sold, pledged, assigned or otherwise
alienated except in certain circumstances by gift,
court order or death; the stock carries voting
rights only if the holder thereof is an eligible
Native. On June 23, 2007, Sealaska’s tribal
member shareholders authorized the issuance
of two additional classes of common stock
without consideration. Class D stock is issuable
to Alaska Natives born after December 18, 1971,
who are 18 years of age or older and are lineal
descendants of an original Sealaska shareholder
and meet certain other requirements. Class L
stock is issuable to Alaska Natives born before
December 18, 1971, who were eligible to enroll
in Sealaska Corporation in 1971 (pursuant to
ANCSA) but were not so enrolled and who meet
certain other requirements. On June 27, 2009,
Sealaska’s shareholders authorized the issuance
of an additional class of common stock without
consideration. Class E stock is issuable to Alaska
Natives born before December 18, 1971, who are
original tribal member shareholders of Sealaska
who have reached the age of 65 years or older,
and meet certain other requirements. 9,700
shares of Class E stock, 22,500 shares of Class D
stock and 300 shares of Class L stock were issued
in 2012. 8,900 shares of Class E stock, 28,900
shares of Class D stock and 400 shares of Class L
stock were issued in 2011. 10,000 shares of Class
E stock, 40,400 shares of Class D stock and 200
shares of Class L stock were issued in 2010. All
shares have the same economic rights.
(n) Fair value
ASC 820, Fair Value Measurements,
establishes a framework for fair value
measurements in the financial statements by
providing a definition of fair value, provides
guidance on the methods used to estimate
fair value and expands disclosures about fair
value measurements.
Fair Value Measurements
ASC 820 defines fair value as the price that would
be received to sell an asset or the amount paid
to transfer a liability in an orderly transaction
between market participants (an exit price) at the
measurement date. Fair value is a market-based
measurement considered from the perspective of
a market participant. Sealaska uses market data or
assumptions that market participants would use in
pricing the asset or liability, including assumptions
about risk and the risks inherent in the inputs
to the valuation. These inputs can be readily
observable, market corroborated, or unobservable.
Sealaska applies both market and income
approaches for recurring fair value measurements,
using the best available information while utilizing
valuation techniques that maximize the use
of observable inputs and minimize the use of
unobservable inputs.
Fair Value Hierarchy
ASC 820 establishes a fair value hierarchy that
prioritizes the inputs to valuation techniques
used to measure fair value. The hierarchy gives
the highest priority to unadjusted quoted prices
in active markets for identical assets or liabilities
(Level 1 measurements) and the lowest priority to
measurements involving significant unobservable
inputs (Level 3 measurements). The three levels of
the fair value hierarchy are as follows:
› Level 1 inputs are quoted prices (unadjusted) in
active markets for identical assets or liabilities
that Sealaska has the ability to access at the
measurement date.
› Level 2 inputs are inputs other than quoted
prices included within Level 1 that are
observable for the asset or liability, either
directly or indirectly.
› Level 3 inputs are unobservable inputs for the
asset or liability.
The level in the fair value hierarchy within which
a fair measurement in its entirety falls is based on
the lowest level input that is significant to the fair
value measurement in its entirety.
Fair Value Measurements on a
Nonrecurring Basis
Sealaska follows the fair value measurement
requirements related to nonfinancial assets
and nonfinancial liabilities that are not required
or permitted to be measured at fair value on a
recurring basis. Those include assets measured
at fair value in goodwill impairment testing and
nonfinancial long-lived assets measured at fair
value for impairment assessment. During 2012,
48
2011 and 2010, using level three inputs and an
income valuation technique, Sealaska performed
an impairment assessment of certain long-lived
assets and goodwill.
Financial Instruments
The carrying amounts of cash and cash
equivalents, accounts receivable, notes receivable
and accounts payable approximate fair value
because of the short term nature of these
instruments. The carrying amounts of investment
securities are stated at market value. The carrying
value of debt approximates fair value as the debt
bears interest that adjusts based upon market
interest rates.
(o) Foreign currency translation
The financial statements of Sealaska’s foreign
operations have been translated into U.S. dollars
in accordance with ASC 830, Foreign Currency
Matters. As the U.S. dollar is the functional
currency of Sealaska’s subsidiary operations, there
are no foreign currency translation adjustments
and all gains and losses from remeasuring foreign
currency transactions into the functional currency
are included in income.
(p) reclassiFications
Certain reclassifications have been made to
the 2010 and 2011 balances to conform to the
2012 presentation.
(q) use oF estimates
The preparation of financial statements in
conformity with U.S. generally accepted
accounting principles requires management
to make estimates and assumptions that affect
reported amounts of assets and liabilities and
disclosures of contingent assets and liabilities
at the date of the financial statements and the
reported amounts of revenues and expenses
during the reporting period. Actual results could
differ from those estimates. Significant estimates
include provisions relating to uncollectible
receivables, useful lives of capitalized timber
costs, property and equipment, the related
depreciation and valuation of certain underlying
assets of limited partnership investments and
amortization, realization of deferred income taxes
and impairment of long-lived assets and goodwill.
The recorded amounts are currently believed
by management to be sufficient. However,
such estimates could significantly change in
future periods to reflect new laws, regulations
or information. It is not possible to determine
whether changes in amounts recorded, due to
such changed circumstances, will occur or to
reasonably estimate the amount or range of any
potential additional loss.
2. acquisitions and divestitures oF subsidiaries
(a) security alliance oF Florida, llc
During 2010, Sealaska Corporation created
Sealaska Security Holdings, LLC. In October
2010 Sealaska Security Holdings, LLC purchased
70 percent of Security Alliance of Florida, LLC
(Security Alliance), for $5.7 million. Sealaska
Security Holdings, LLC acquired tangible assets of
$3.3 million, intangible assets of $2.1 million and
total liabilities of $6.6 million. The purchase price
allocation resulted in $3.6 million of goodwill,
which primarily represents the implied value of
Security Alliance’s organized workforce, which
cannot be separately recognized under generally
accepted accounting principles. The fair value
of noncontrolling interest was $2.4 million at the
date of acquisition by Sealaska Security Holdings,
LLC. Determination of the fair value of the assets
and liabilities used to allocate the purchase price
was based on the discounted cash flow method
using estimated future earnings. Security Alliance
is headquartered in Miami, Florida, and provides
an array of guard and private investigation
services in Florida, Georgia and Texas, as well
as outside the United States. The purchase
agreement includes a conditional noncontrolling
interest redemption feature of a nine to 10
percent additional purchase of Security Alliance
in 2013 as a result of revenue and gross margin
targets achieved during 2012. The goodwill
is attributed to the services segment, and is
deductible for tax purposes.
(b) olympic Fabrication, llc
In December 2010, the Sealaska Board of
Directors voted to discontinue Olympic
Fabrication, LLC. Manufacturing revenues and
income (loss) from continuing operations of $1.7
million and $87,000, respectively, in 2011 and $4.4
million and ($2.0) million respectively, in 2010
have been reclassified to discontinued operations.
49
3. alasKa native claims settlement act
Sealaska was incorporated in 1972 as a Regional
Alaska Native Corporation pursuant to the
provisions of ANCSA. Sections 7(i) and 7(j)
are significant to the consolidated financial
statements and are further described herein.
Under the provisions of ANCSA, Sealaska has
received, or expects to receive, conveyance
of approximately 362,000 acres of land in the
Tongass National Forest in Southeast Alaska,
of which it owns or will own the surface and
subsurface estate. At December 31, 2012, Sealaska
has received conveyance of approximately
290,800 acres. Sealaska has received its
proportionate share of the monetary entitlement
under the act in the amount of $93.2 million,
which is recorded as contributed capital.
ANCSA also provides for selection of land in
Alaska by the Village and Urban corporations
formed thereunder, the subsurface estate
of which accrues to the related Regional
Corporations. It is anticipated that the Village
and Urban corporations in Sealaska’s region will
receive conveyance of 286,400 acres of land
formerly part of the Tongass National Forest of
which Sealaska will own the subsurface estate. Of
the approximate 286,400 acres, conveyance has
been received of approximately 278,100 acres. As
described in note 8, the land and related surface
and subsurface resources received under ANCSA
are carried at zero value in the accompanying
consolidated financial statements.
Section 7(i) of ANCSA requires that each Alaska
Native Regional Corporation that received
revenue or value from certain resources
conveyed pursuant to ANCSA distribute 70
percent of the related net revenues to 12 of the 13
Regional Corporations, including the distributing
Corporation. Sealaska and the other Regional
Corporations have entered into a Section 7(i)
Settlement Agreement, which establishes specific
definitions and methods for calculating shareable
revenues. Revenues received by Sealaska from the
timber resources and subsurface estate obtained
through ANCSA are subject to the revenue sharing
provisions of Section 7(i), except that subsurface
resources commonly known as sand, rock and
gravel, are excluded from Section 7(i) revenue
sharing. Distributions to Sealaska from other
Regional Corporations under the provisions of
Section 7(i), after reductions for distributions
required by Section 7(j) of ANCSA, are recorded
as income in the fiscal year the amounts become
determinable and collection is reasonably assured.
Section 7(j) of ANCSA requires that not less than
50 percent of monies received by Sealaska from
other Regional Corporations under Section 7(i)
must be distributed to Village corporations, tribal
member shareholders of Urban corporations,
and At-Large shareholders. Required distributions
to other Regional Corporations are due 90 days
following the end of the fiscal year and unpaid
distributions incur interest at the prime rate plus
five percent. Required distributions to Village
corporations, shareholders of Urban corporations,
and At-Large shareholders are based on the ratio
of the total number of Sealaska shares owned
by shareholders of Village corporations, by
shareholders of Urban corporations and by At-
Large shareholders.
Sealaska accrues and expenses an amount
determined by applying the provisions of
Section 7(i) to applicable active revenue and
expense transactions as they are recognized in
the consolidated financial statements. Sealaska
recorded a noncurrent liability representing the
estimated distribution payable for near-term
timing differences between the recognition of
revenue and expenses for financial reporting and
Section 7(i) reporting purposes.
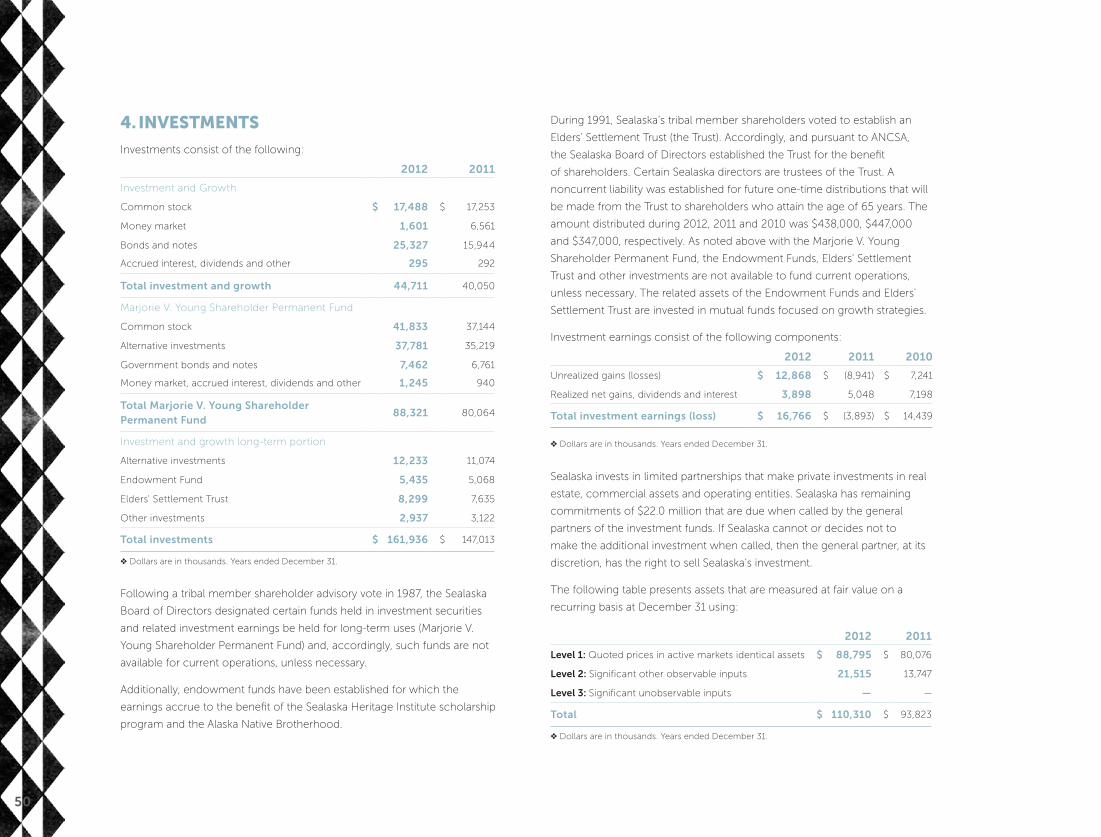
50
4. investments
Investments consist of the following:
2012 2011
Investment and Growth
Common stock $ 17,488 $ 17,253
Money market 1,601 6,561
Bonds and notes 25,327 15,944
Accrued interest, dividends and other 295 292
Total investment and growth 44,711 40,050
Marjorie V. Young Shareholder Permanent Fund
Common stock 41,833 37,144
Alternative investments 37,781 35,219
Government bonds and notes 7,462 6,761
Money market, accrued interest, dividends and other 1,245 940
Total Marjorie V. Young Shareholder Permanent Fund
88,321 80,064
Investment and growth long-term portion
Alternative investments 12,233 11,074
Endowment Fund 5,435 5,068
Elders' Settlement Trust 8,299 7,635
Other investments 2,937 3,122
Total investments $ 161,936 $ 147,013
❖ Dollars are in thousands. Years ended December 31.
Following a tribal member shareholder advisory vote in 1987, the Sealaska
Board of Directors designated certain funds held in investment securities
and related investment earnings be held for long-term uses (Marjorie V.
Young Shareholder Permanent Fund) and, accordingly, such funds are not
available for current operations, unless necessary.
Additionally, endowment funds have been established for which the
earnings accrue to the benefit of the Sealaska Heritage Institute scholarship
program and the Alaska Native Brotherhood.
During 1991, Sealaska’s tribal member shareholders voted to establish an
Elders' Settlement Trust (the Trust). Accordingly, and pursuant to ANCSA,
the Sealaska Board of Directors established the Trust for the benefit
of shareholders. Certain Sealaska directors are trustees of the Trust. A
noncurrent liability was established for future one-time distributions that will
be made from the Trust to shareholders who attain the age of 65 years. The
amount distributed during 2012, 2011 and 2010 was $438,000, $447,000
and $347,000, respectively. As noted above with the Marjorie V. Young
Shareholder Permanent Fund, the Endowment Funds, Elders' Settlement
Trust and other investments are not available to fund current operations,
unless necessary. The related assets of the Endowment Funds and Elders'
Settlement Trust are invested in mutual funds focused on growth strategies.
Investment earnings consist of the following components:
2012 2011 2010
Unrealized gains (losses) $ 12,868 $ (8,941) $ 7,241
Realized net gains, dividends and interest 3,898 5,048 7,198
Total investment earnings (loss) $ 16,766 $ (3,893) $ 14,439
❖ Dollars are in thousands. Years ended December 31.
Sealaska invests in limited partnerships that make private investments in real
estate, commercial assets and operating entities. Sealaska has remaining
commitments of $22.0 million that are due when called by the general
partners of the investment funds. If Sealaska cannot or decides not to
make the additional investment when called, then the general partner, at its
discretion, has the right to sell Sealaska’s investment.
The following table presents assets that are measured at fair value on a
recurring basis at December 31 using:
2012 2011
Level 1: Quoted prices in active markets identical assets $ 88,795 $ 80,076
Level 2: Significant other observable inputs 21,515 13,747
Level 3: Significant unobservable inputs — —
Total $ 110,310 $ 93,823
❖ Dollars are in thousands. Years ended December 31.

51
Sealaska has no financial instruments that are recorded at fair value on a
nonrecurring basis at December 31, 2012 and 2011.
The following table presents quantitative disclosure about the fair value
measurements for each class of assets:
Fair value at reporting date using
Description Totals
Quoted prices in active
markets for identical assets
(Level 1)
Significant other
observable inputs
(Level 2)
Equity securities
Equity securities—domestic $ 37,797 $ 37,797 $ —
Equity securities—international
(developed)16,557 16,557 —
Equity securities—emerging markets 7,114 7,114 —
Equity securities—Vanguard
LifeStrategy Moderate Growth Fund15,525 15,525 —
Total equity securities 76,993 76,993 —
Debt securities
Government securities 11,066 3,751 7,315
Corporate securities 13,629 — 13,629
Mortgage-backed securities 571 — 571
PIMCO Total Return Fund 8,051 8,051 —
Total debt securities 33,317 11,802 21,515
Total $ 110,310 $ 88,795 $ 21,515
❖ Dollars are in thousands. Years ended December 31.
5. receivables
Receivables consist of:
2012 2011
Trade accounts receivable, less allowance for doubtful
accounts of $1,205 and $956 at December 31, 2012 and
2011, respectively
$ 43,171 $ 38,110
ANCSA Section 7(i) revenue sharing 931 23,371
Other 4,186 4,645
Total receivables $ 48,288 $ 66,126
❖ Dollars are in thousands. Years ended December 31.
6. inventories
Inventories consist of:
2012 2011
Timber—finished goods $ 1,614 $ 3,671
Plastics
Raw materials 3,649 3,336
Work-in-process 544 43
Finished goods 1,321 1,056
Other 605 75
Total inventories $ 7,733 $ 8,181
❖ Dollars are in thousands. Years ended December 31.
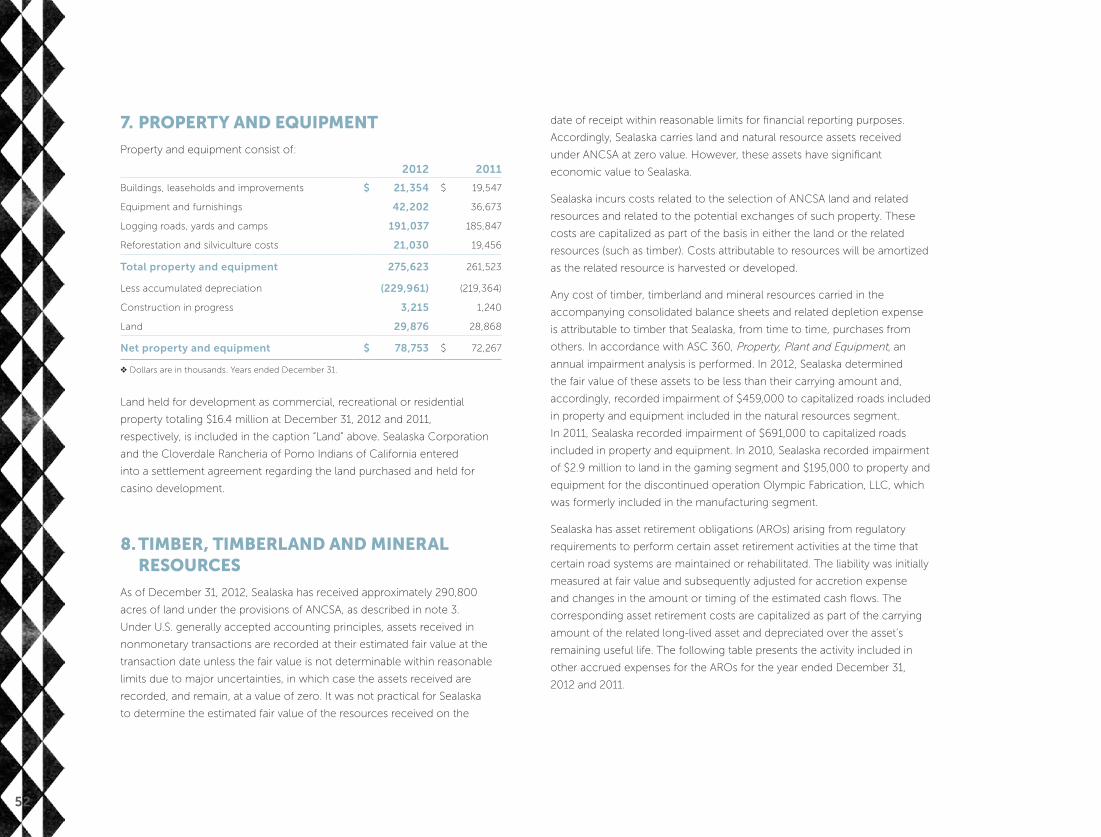
52
7. property and equipment
Property and equipment consist of:
2012 2011
Buildings, leaseholds and improvements $ 21,354 $ 19,547
Equipment and furnishings 42,202 36,673
Logging roads, yards and camps 191,037 185,847
Reforestation and silviculture costs 21,030 19,456
Total property and equipment 275,623 261,523
Less accumulated depreciation (229,961) (219,364)
Construction in progress 3,215 1,240
Land 29,876 28,868
Net property and equipment $ 78,753 $ 72,267
❖ Dollars are in thousands. Years ended December 31.
Land held for development as commercial, recreational or residential
property totaling $16.4 million at December 31, 2012 and 2011,
respectively, is included in the caption “Land” above. Sealaska Corporation
and the Cloverdale Rancheria of Pomo Indians of California entered
into a settlement agreement regarding the land purchased and held for
casino development.
8. timber, timberland and mineral resources
As of December 31, 2012, Sealaska has received approximately 290,800
acres of land under the provisions of ANCSA, as described in note 3.
Under U.S. generally accepted accounting principles, assets received in
nonmonetary transactions are recorded at their estimated fair value at the
transaction date unless the fair value is not determinable within reasonable
limits due to major uncertainties, in which case the assets received are
recorded, and remain, at a value of zero. It was not practical for Sealaska
to determine the estimated fair value of the resources received on the
date of receipt within reasonable limits for financial reporting purposes.
Accordingly, Sealaska carries land and natural resource assets received
under ANCSA at zero value. However, these assets have significant
economic value to Sealaska.
Sealaska incurs costs related to the selection of ANCSA land and related
resources and related to the potential exchanges of such property. These
costs are capitalized as part of the basis in either the land or the related
resources (such as timber). Costs attributable to resources will be amortized
as the related resource is harvested or developed.
Any cost of timber, timberland and mineral resources carried in the
accompanying consolidated balance sheets and related depletion expense
is attributable to timber that Sealaska, from time to time, purchases from
others. In accordance with ASC 360, Property, Plant and Equipment, an
annual impairment analysis is performed. In 2012, Sealaska determined
the fair value of these assets to be less than their carrying amount and,
accordingly, recorded impairment of $459,000 to capitalized roads included
in property and equipment included in the natural resources segment.
In 2011, Sealaska recorded impairment of $691,000 to capitalized roads
included in property and equipment. In 2010, Sealaska recorded impairment
of $2.9 million to land in the gaming segment and $195,000 to property and
equipment for the discontinued operation Olympic Fabrication, LLC, which
was formerly included in the manufacturing segment.
Sealaska has asset retirement obligations (AROs) arising from regulatory
requirements to perform certain asset retirement activities at the time that
certain road systems are maintained or rehabilitated. The liability was initially
measured at fair value and subsequently adjusted for accretion expense
and changes in the amount or timing of the estimated cash flows. The
corresponding asset retirement costs are capitalized as part of the carrying
amount of the related long-lived asset and depreciated over the asset’s
remaining useful life. The following table presents the activity included in
other accrued expenses for the AROs for the year ended December 31,
2012 and 2011.

53
2012 2011
Balance at beginning of the year $ 1,268 $ 896
Additional obligations incurred 98 691
Obligations settled in current period (610) (370)
Changes in estimates, including timing — —
Accretion expense 53 51
Balance at end of year 809 1,268
❖ Dollars are in thousands. Years ended December 31.
9. goodwill and intangible assets
The following table provides the gross carrying value for each major class of
intangible asset by segment as of December 31, 2012 and 2011.
Goodwill Services Manufacturing Total
Balance, January 1, 2011 $ 14,891 $ 1,605 $ 16,496
Impairment expense — — —
Balance, December 31, 2011 14,891 1,605 16,496
Additions to goodwill 498 — 498
Impairment expense (363) — (363)
Balance, December 31, 2012 $ 15,026 $ 1,605 $ 16,631
❖ Dollars are in thousands.
Aggregate other intangible assets consist of:
Amortizing intangible assets—customer relationships within services segment total
Balance, January 1, 2011 $ 3,179
Amortization (818)
Balance, December 31, 2011 2,361
Amortization (597)
Balance, December 31, 2012 $ 1,764
❖ Dollars are in thousands.
Customer relationships are amortized over 7-8 years from the date of acquisition.
Estimated amortization expense for the next five years (dollars in thousands):
2013 $ 438
2014 438
2015 353
2016 291
2017 244
❖ Dollars are in thousands. Years ended December 31.
In accordance with the provisions of ASC 350, Intangibles – Goodwill and
Other, goodwill is reviewed for impairment at least annually. In 2012 and
2010, the estimated undiscounted future cash flows generated by the
services and manufacturing segments, respectively, were less than the
carrying amount of equity within those segments, resulting in impairment
charges of $363,000 and $1.2 million, respectively. There was no
impairment charge recorded in 2011.

54
10. long-term debt
Long-term debt consists of:
2012 2011
Note payable to a bank under an unsecured
revolving term loan with variable interest rate
pricing that was 1.46 percent at December 31,
2012, with the note expiring October 2014
$ 13,502 $ 11,302
Note payable to a bank under an unsecured
revolving term loan with a fixed interest rate,
and variable credit spread that was 2.35 percent at
December 31, 2012, with the note expiring
October 2014
15,000 15,000
Note payable by Amonos, LLC to Pacific Gulf, LLC;
collateralized by land; interest at three percent;
principal paid July 2012
— 1,000
Note payable by Kánaak Alabama to Nypro, Inc.,
an affiliated partner with Sealaska Corporation with
interest at five percent
792 882
Other debt 1,552 1,379
Total long-term debt 30,846 29,563
Less current portion (386) (1,275)
Total long-term debt less current portion 30,460 28,288
❖ Dollars are in thousands. Years ended December 31.
Scheduled principal maturities of long-term debt are:
2013 386
2014 28,843
2015 480
2016 200
2017 —
Thereafter 937
Total $ 30,846
❖ Dollars are in thousands. Years ended December 31.
Sealaska’s $60.0 million unsecured revolving term loan has various
affirmative and negative covenants that are typical within loan agreements.
Sealaska was in compliance with all covenants at December 31, 2012.
Interest expense totaled $1.1 million in 2012, $1.1 million in 2011 and $1.5
million in 2010.
Sealaska has the following lines of credit available at December 31, 2012:
AmountAmount Outstanding
Interest Rate Collateral
$1,500,000 — 3.75 percentLimited parental
guarantee
$750,000 $630,0001-month LIBOR
+ 3.75 percent
Business assets of the
borrower
$3,000,000 — Variable No collateral
$4,000,000 $3,000,000 3.25 percentBusiness assets of the
borrower
The lines of credit are as follows: NKA $1.5 million at CB&T Bank, Security
Alliance $750,000 at BankUnited, MBS $3.0 million at Colorado State Bank
and Trust and NKI $4.0 million at Wells Fargo.
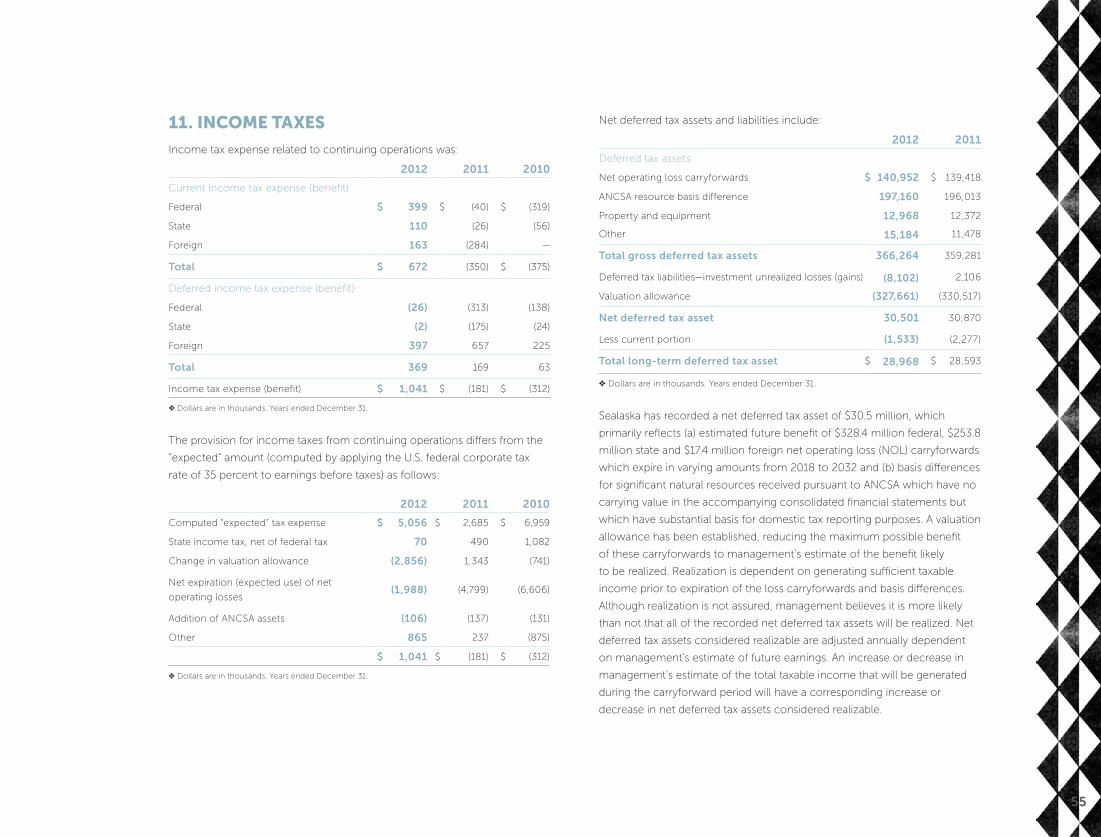
55
11. income taxes
Income tax expense related to continuing operations was:
2012 2011 2010
Current income tax expense (benefit)
Federal $ 399 $ (40) $ (319)
State 110 (26) (56)
Foreign 163 (284) —
Total $ 672 (350) $ (375)
Deferred income tax expense (benefit)
Federal (26) (313) (138)
State (2) (175) (24)
Foreign 397 657 225
Total 369 169 63
Income tax expense (benefit) $ 1,041 $ (181) $ (312)
❖ Dollars are in thousands. Years ended December 31.
The provision for income taxes from continuing operations differs from the
“expected” amount (computed by applying the U.S. federal corporate tax
rate of 35 percent to earnings before taxes) as follows:
2012 2011 2010
Computed “expected” tax expense $ 5,056 $ 2,685 $ 6,959
State income tax, net of federal tax 70 490 1,082
Change in valuation allowance (2,856) 1,343 (741)
Net expiration (expected use) of net
operating losses(1,988) (4,799) (6,606)
Addition of ANCSA assets (106) (137) (131)
Other 865 237 (875)
$ 1,041 $ (181) $ (312)
❖ Dollars are in thousands. Years ended December 31.
Net deferred tax assets and liabilities include:
2012 2011
Deferred tax assets
Net operating loss carryforwards $ 140,952 $ 139,418
ANCSA resource basis difference 197,160 196,013
Property and equipment 12,968 12,372
Other 15,184 11,478
Total gross deferred tax assets 366,264 359,281
Deferred tax liabilities—investment unrealized losses (gains) (8,102) 2,106
Valuation allowance (327,661) (330,517)
Net deferred tax asset 30,501 30,870
Less current portion (1,533) (2,277)
Total long-term deferred tax asset $ 28,968 $ 28,593
❖ Dollars are in thousands. Years ended December 31.
Sealaska has recorded a net deferred tax asset of $30.5 million, which
primarily reflects (a) estimated future benefit of $328.4 million federal, $253.8
million state and $17.4 million foreign net operating loss (NOL) carryforwards
which expire in varying amounts from 2018 to 2032 and (b) basis differences
for significant natural resources received pursuant to ANCSA which have no
carrying value in the accompanying consolidated financial statements but
which have substantial basis for domestic tax reporting purposes. A valuation
allowance has been established, reducing the maximum possible benefit
of these carryforwards to management’s estimate of the benefit likely
to be realized. Realization is dependent on generating sufficient taxable
income prior to expiration of the loss carryforwards and basis differences.
Although realization is not assured, management believes it is more likely
than not that all of the recorded net deferred tax assets will be realized. Net
deferred tax assets considered realizable are adjusted annually dependent
on management’s estimate of future earnings. An increase or decrease in
management’s estimate of the total taxable income that will be generated
during the carryforward period will have a corresponding increase or
decrease in net deferred tax assets considered realizable.
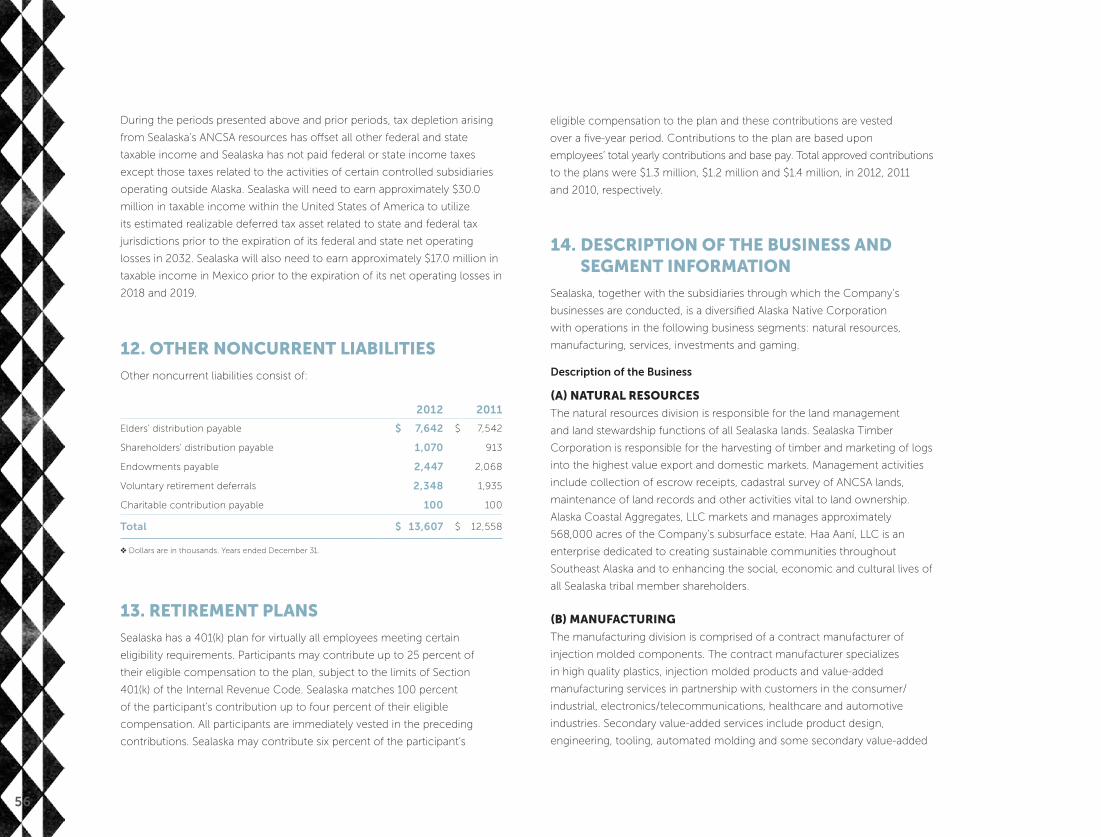
56
During the periods presented above and prior periods, tax depletion arising
from Sealaska’s ANCSA resources has offset all other federal and state
taxable income and Sealaska has not paid federal or state income taxes
except those taxes related to the activities of certain controlled subsidiaries
operating outside Alaska. Sealaska will need to earn approximately $30.0
million in taxable income within the United States of America to utilize
its estimated realizable deferred tax asset related to state and federal tax
jurisdictions prior to the expiration of its federal and state net operating
losses in 2032. Sealaska will also need to earn approximately $17.0 million in
taxable income in Mexico prior to the expiration of its net operating losses in
2018 and 2019.
12. other noncurrent liabilities
Other noncurrent liabilities consist of:
2012 2011
Elders’ distribution payable $ 7,642 $ 7,542
Shareholders' distribution payable 1,070 913
Endowments payable 2,447 2,068
Voluntary retirement deferrals 2,348 1,935
Charitable contribution payable 100 100
Total $ 13,607 $ 12,558
❖ Dollars are in thousands. Years ended December 31.
13. retirement plans
Sealaska has a 401(k) plan for virtually all employees meeting certain
eligibility requirements. Participants may contribute up to 25 percent of
their eligible compensation to the plan, subject to the limits of Section
401(k) of the Internal Revenue Code. Sealaska matches 100 percent
of the participant’s contribution up to four percent of their eligible
compensation. All participants are immediately vested in the preceding
contributions. Sealaska may contribute six percent of the participant’s
eligible compensation to the plan and these contributions are vested over
a five–year period. Contributions to the plan are based upon employees’
total yearly contributions and base pay. Total approved contributions to the
plans were $1.3 million, $1.2 million and $1.4 million, in 2012, 2011 and 2010,
respectively.
14. description oF the business and segment inFormation
Sealaska, together with the subsidiaries through which the Company’s
businesses are conducted, is a diversified Alaska Native Corporation
with operations in the following business segments: natural resources,
manufacturing, services, investments and gaming.
Description of the Business
(a) natural resources
The natural resources division is responsible for the land management
and land stewardship functions of all Sealaska lands. Sealaska Timber
Corporation is responsible for the harvesting of timber and marketing of logs
into the highest value export and domestic markets. Management activities
include collection of escrow receipts, cadastral survey of ANCSA lands,
maintenance of land records and other activities vital to land ownership.
Alaska Coastal Aggregates, LLC markets and manages approximately
568,000 acres of the Company’s subsurface estate. Haa Aaní, LLC is an
enterprise dedicated to creating sustainable communities throughout
Southeast Alaska and to enhancing the social, economic and cultural lives of
all Sealaska tribal member shareholders.
(b) manuFacturing
The manufacturing division is comprised of a contract manufacturer of
injection molded components. The contract manufacturer specializes
in high quality plastics, injection molded products and value-added
manufacturing services in partnership with customers in the consumer/
industrial, electronics/telecommunications, healthcare and automotive
industries. Secondary value-added services include product design,
engineering, tooling, automated molding and some secondary value-added
eligible compensation to the plan and these contributions are vested
over a five-year period. Contributions to the plan are based upon
employees’ total yearly contributions and base pay. Total approved contributions
to the plans were $1.3 million, $1.2 million and $1.4 million, in 2012, 2011
and 2010, respectively.

57
services including shielding, painting, decorating, graphics and assembly.
Substantially all of the manufacturing division’s revenue is derived from
activities and customers in the United States of America, with the exception
of the operation of a facility in Mexico.
(c) services
The services division provides environmental construction and remediation,
environmental assessments, consulting and engineering services, custom
build construction, construction management services, and security
services to federal government agencies, private and commercial clients
through wholly owned subsidiaries: Sealaska Environmental Services, LLC,
Kingston Environmental Services, Inc., Synergy Systems, Inc. and Security
Alliance, LLC. The services division provides services in the disciplines of
information technology (IT) strategy and consulting, business intelligence,
application services, infrastructure management, managed services, and
data processing through the subsidiary Managed Business Solutions, LLC.
The services division expanded in 2010 with the controlling acquisition of
Security Alliance, LLC. Through Security Alliance, LLC, the services division
provides an array of guard and private investigation services.
(d) investments
Sealaska’s securities portfolio consists of two separate investment accounts
that are managed to achieve different objectives. The Marjorie V. Young
Shareholder Permanent Fund is managed long-term with the objective of
shareholder dividends, and the Investment and Growth Fund is managed
shorter term and is used for operational needs and new investments.
Sealaska investments follow a disciplined investment philosophy by
building off existing strengths, exercising patience and selectivity in making
investments, adding investments that will achieve consistency in growth and
earnings, and being prepared to exit investments or potential investments if
upside opportunities arise or if problems change expected returns, and by
seeking strong and strategic partnerships, distributing risk and benefit, and
establishing a new platform for companies for future growth.
(e) gaming
The gaming segment consists of an investment in a gaming venture with the
Cloverdale Rancheria of Pomo Indians in Cloverdale, California. Through its
wholly owned subsidiary End-to-End Enterprises, Sealaska owns land for a
new casino and resort facility.
2012 2011 2010
Net income (loss) from continuing operations before income taxes
Natural resources $ 725 $ 2,244 $ 4,495
Manufacturing 4,512 1,316 728
Investments 16,155 (4,503) 13,923
Services (4,093) 3,498 3,063
Gaming (353) (843) (4,675)
Corporate and other (2,033) (2,177) (1,825)
Total segment net earnings (loss) 14,913 (465) 15,709
Net revenue (expense) not allocable to
a segment
Natural resource revenue sharing under
ANCSA Sections 7(i) and 7(j)16,870 24,067 16,537
Selling, general and administrative
expense(15,849) (14,953) (14,494)
Other, net (1,489) (752) 1,820
Income before taxes 14,445 7,897 19,572
Income tax benefit (1,041) 181 312
Income from continuing operations 13,404 8,078 19,884
Discontinued operations, net of tax — 134 (2,436)
Net income 13,404 8,212 17,448
Less: Net income attributable to
noncontrolling interest2,086 1,421 2,294
Net income attributable to Sealaska
$ 11,318 $ 6,791 $ 15,154
❖ Dollars are in thousands. Years ended December 31.
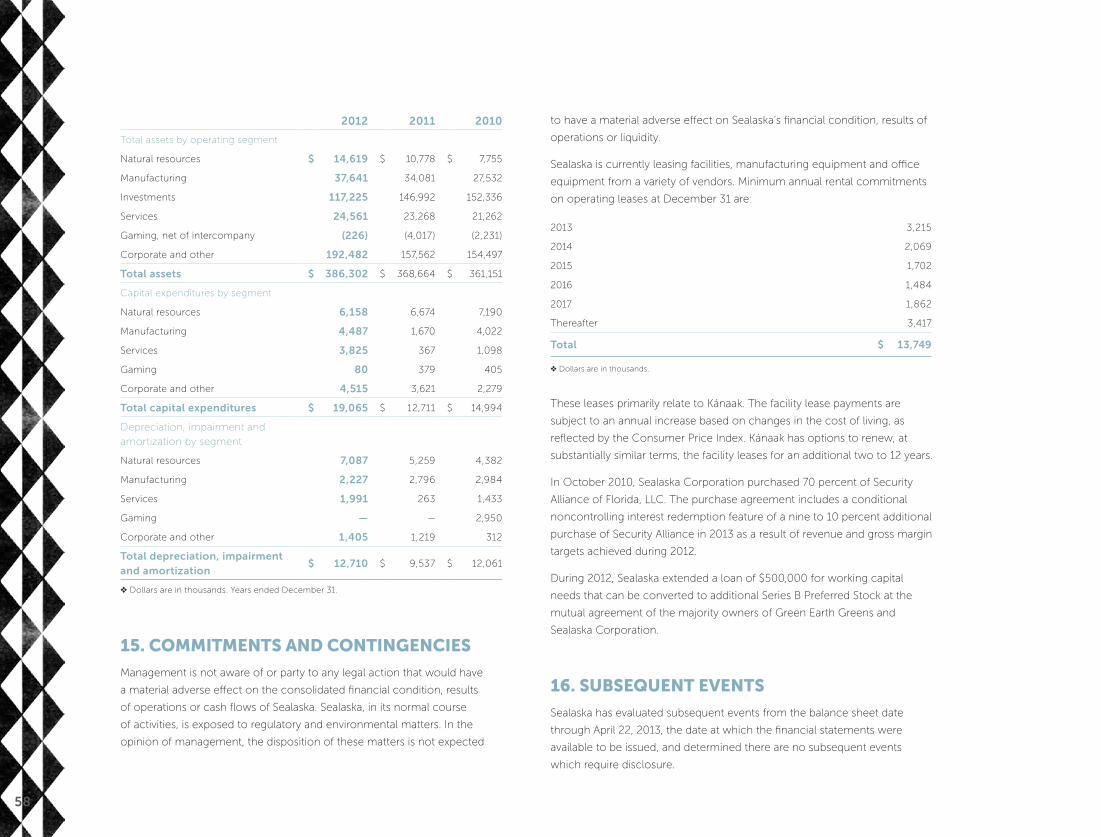
58
2012 2011 2010
Total assets by operating segment
Natural resources $ 14,619 $ 10,778 $ 7,755
Manufacturing 37,641 34,081 27,532
Investments 117,225 146,992 152,336
Services 24,561 23,268 21,262
Gaming, net of intercompany (226) (4,017) (2,231)
Corporate and other 192,482 157,562 154,497
Total assets $ 386,302 $ 368,664 $ 361,151
Capital expenditures by segment
Natural resources 6,158 6,674 7,190
Manufacturing 4,487 1,670 4,022
Services 3,825 367 1,098
Gaming 80 379 405
Corporate and other 4,515 3,621 2,279
Total capital expenditures $ 19,065 $ 12,711 $ 14,994
Depreciation, impairment and
amortization by segment
Natural resources 7,087 5,259 4,382
Manufacturing 2,227 2,796 2,984
Services 1,991 263 1,433
Gaming — — 2,950
Corporate and other 1,405 1,219 312
Total depreciation, impairment and amortization
$ 12,710 $ 9,537 $ 12,061
❖ Dollars are in thousands. Years ended December 31.
15. commitments and contingencies
Management is not aware of or party to any legal action that would have
a material adverse effect on the consolidated financial condition, results
of operations or cash flows of Sealaska. Sealaska, in its normal course
of activities, is exposed to regulatory and environmental matters. In the
opinion of management, the disposition of these matters is not expected
to have a material adverse effect on Sealaska’s financial condition, results of
operations or liquidity.
Sealaska is currently leasing facilities, manufacturing equipment and office
equipment from a variety of vendors. Minimum annual rental commitments
on operating leases at December 31 are:
2013 3,215
2014 2,069
2015 1,702
2016 1,484
2017 1,862
Thereafter 3,417
Total $ 13,749
❖ Dollars are in thousands.
These leases primarily relate to Kánaak. The facility lease payments are
subject to an annual increase based on changes in the cost of living, as
reflected by the Consumer Price Index. Kánaak has options to renew, at
substantially similar terms, the facility leases for an additional two to 12 years.
In October 2010, Sealaska Corporation purchased 70 percent of Security
Alliance of Florida, LLC. The purchase agreement includes a conditional
noncontrolling interest redemption feature of a nine to 10 percent additional
purchase of Security Alliance in 2013 as a result of revenue and gross margin
targets achieved during 2012.
During 2012, Sealaska extended a loan of $500,000 for working capital
needs that can be converted to additional Series B Preferred Stock at the
mutual agreement of the majority owners of Green Earth Greens and
Sealaska Corporation.
16. subsequent events
Sealaska has evaluated subsequent events from the balance sheet date
through April 22, 2013, the date at which the financial statements were
available to be issued, and determined there are no subsequent events
which require disclosure.

ThE CLAN hOUSE hAS ALwAyS bEEN ThE
CENTER Of NATIVE LIfE. It is where our
ancestors gathered, where decisions were made,
where stories were given voice, where sacred
objects were stored and where ceremonies were
held. The Hits’aati of the clan—the house leader—
settled claims, represented the house to other
houses or clans and held the clan’s property in
trust. The four decorated posts holding up the
planked and gabled roof functioned as living
narratives for the clan and depicted the clan’s
history. Each intricately carved and painted post
was unique in form and story, and all of the posts
were a visual representation of both the natural
and spiritual world in which our people lived.
Cover image: Front painting of Totem Bight Clan House in Ketchikan,
created by Charles Brown, Tlingit of the Nexadi Clan.
SEALASKA CORPORATION
Corporate HeadquartersOne Sealaska Plaza, Suite 400
Juneau, AK 99801
TEL: 907.586.1512
FAX: 907.586.2304
Shareholder toll-free line:
800.848.5921
www.sealaska.com
Seattle Office13810 S.E. Eastgate Way, Suite 420
Bellevue, WA 98005
TEL: 425.283.0600
FAX: 425.283.0650
Sealaska Heritage InstituteOne Sealaska Plaza, Suite 301
Juneau, AK 99801
TEL: 907.463.4844
FAX: 907.586.9293
www.sealaskaheritage.org
www.alaskanativeartists.com
OUTSIDE COUNSELSimpson, Tillinghast & Sorensen, P.C.
One Sealaska Plaza, Suite 300
Juneau, AK 99801
INDEPENDENT AUDITORSKPMG
1918 8th Avenue, Suite 2900
Seattle, WA 98101
SEALASKA SUbSIDIARIES
Alaska Coastal AggregatesGeneral Manager: Bill Bennett
One Sealaska Plaza, Suite 400
Juneau, AK 99801
www.sealaska.com/page/aggregates
Haa Aaní, LLC President and CEO: Russell Dick
One Sealaska Plaza, Suite 400
Juneau, AK 99801
www.sealaska.com/page/haa-aani-llc
Nypro KánaakManaging Director: Julio Oropeza
www.nyprokanaak.com
Nypro Kánaak AlabamaGeneral Manager: Kevin Bokros
208 Nypro Lane
Dothan, AL 36305
www.nyprokanaak.com
Nypro Kánaak GuadalajaraGeneral Manager: Alejandro Hernandez
Ignacio Jacobo #23
Parquel Industrial Belenes
45101, Zapopan Jalisco, MX
Nypro Kánaak IowaGeneral Manager: Dennie Heckman
400 North Harvey Road
Mt. Pleasant, IA 52641
www.nyprokanaak.com
Managed Business SolutionsPresident and CEO: Jon Duncan
12325 Oracle Blvd., Suite 200
Colorado Springs, CO 80921
www.mbshome.com
Sealaska Environmental ServicesPresident and CEO: Derik Frederiksen
One Sealaska Plaza, Suite 400
Juneau, AK 99801
www.sealaskaenvironmental.com
Sealaska Timber CorporationPresident and CEO: Wade Zammit
1900 1st Avenue, Suite 315
Ketchikan, AK 99901
www.sealaskatimber.com
Security AlliancePresident and CEO: Bill Murphy
8323 NW 12th St., Suite 218
Doral, FL 33126-1840
www.securityalliancegroup.com
Synergy Systems General Manager: Bob Wysocki
13810 S.E. Eastgate Way, Suite 420
Bellevue, WA 98005
www.sealaska.com/page/synergy_systems
DIRECTORy
www.sealaska.com
Repeated graphics: Killer Whale Teeth by Larry McNeil and
drawing of the house of Chief Son-I-Hat, Haida, courtesy of
Alaska State Library Historical Collection.
Photography: Todd Antioquia, Scott Areman and Ivan Simonek
Design: Pyramid Communications
Printing: Visions, Inc.
VALUES IN ACTION
Sealaska Annual Report 2012
SE
AL
AS
KA
AN
NU
AL R
EP
OR
T 2
012