search modeling and opt in sarops 3 may.ppt - ifremer · search modeling and optimization in...
TRANSCRIPT

Search Modeling and Optimization in USCG’s Search and Rescue Optimal
Planning System (SAROPS)
Lawrence D. Stone and Thomas M. Kratzke, Metron IncJohn R. Frost, U. S. Coast Guard
SaferSeas ConferenceBrest, France May 10, 2011
22
History and Background
As a result of air-sea rescue operations during the WWII, the US Coast Guard established the Air Sea Rescue Agency in 1944
Used “Methods of Locating Survivors at Sea on Rubber Rafts” US Navy Hydrographic office, 1944 for planning searches – influenced by Koopman’s work in ASWORG later reported in “Search and Screening” 1946.
In peace time this became Search And Rescue (SAR)• USCG published first Search and Rescue Manual in 1959 based on Koopman’s 1956 -7
articles on search theory in Operations Research
• Manual method given in this publication remained basic technique until 1967
SARP – Search And Rescue Planning program - 1970• Computer version of manual methods with some additions
Computer-Assisted Search Planning (CASP) developed in early ’70’s.Deployed in 1974 on a CDC 3300 in Washington, DC
Monte-Carlo simulation
Search Planning aid was primarily a display of cellular distributions.
In use until March 2007!

33
History and Background
SAROPS development began in October 2003. Designed to take advantage of better
Environmental data information – winds, currents, visibility, cloud cover
Models for • Drift and leeway of search objects
• Detection capability of search sensors
Theoretical developments in search planning• Search for moving objects, multiple search object types, survivor search
Computer capabilities and geographic displays
SAROPS became operational in March 2007.Developed by Metron, Applied Science Associates (ASA), and Northrop Grumman

4
Basic Components of SAROPS
Environmental Data Server (EDS) developed by ASAGathers and provides environmental products for SAROPS
Simulation (SIM) developed by MetronProduces and updates probability distributions for location of search object
Planner developed by MetronRecommends search patterns for ships and aircraft to maximize detection probability (probability of success).
Graphical User Interface (GUI) developed by Northrop GrummanUses ArcGIS as basis for GUI

55
Maritime Search Planning Challenges
Search object location is uncertain and moving
Motion is indeterminate due to uncertainty in Currents, winds, and leeway
Object type maybe uncertain • Boat? Raft? Person in Water? - differing motion and detection characteristics
Detection capability depends onPlatform, sensor, environment, and object type
Both searcher and search object are moving during search
Search platforms have operational constraintsSearch areas must be rectangular and can’t overlap
Search paths must be equally spaced and parallel

6
Approach - Bayesian
Use SAROPS Simulator (SIM) to compute probability distribution for search object location and type as a function of time
Output is weighted set of particles – possible paths for search object• An object type is assigned to each path - type may change over time
Use Planner to recommend “optimal” search plansRecommended plan maximizes increase in probability of success for
• Specified set of Search and Rescue Units (SRUs) and search times
Planner recommends set of non-overlapping search rectangles• Specifies search paths within rectangles
Planner accounts for• Previous unsuccessful searches – uses Bayesian posterior distribution from SIM
• Detection capability of each SRU for each object type – includes environment
• Motion of search object and searcher during search

77
Optimization Example
Single Scenario – Distress call at 01 0000Last Known Position (Circular Normal) at 01 0000
Two Search Object Types and Motion Models Search object in a raft (P=0.25) or in the water (P=0.75) (called PIW)
• Former case; position is more influenced by the winds (out of the north)
• Latter case: position is more influenced by the currents (flowing east)
Snapshots1. Distribution at 01 0120 – shortly after distress call
2. Distribution at 01 2140 - start of search• Raft particles went south - gibing effect causes 2 modes in the SE and SW
• PIW particles went east
3. Recommended plan for this search
4. Posterior distribution assuming recommended search fails

Distribution at 01 0120 After 1hr 20 minutes of Drift
8
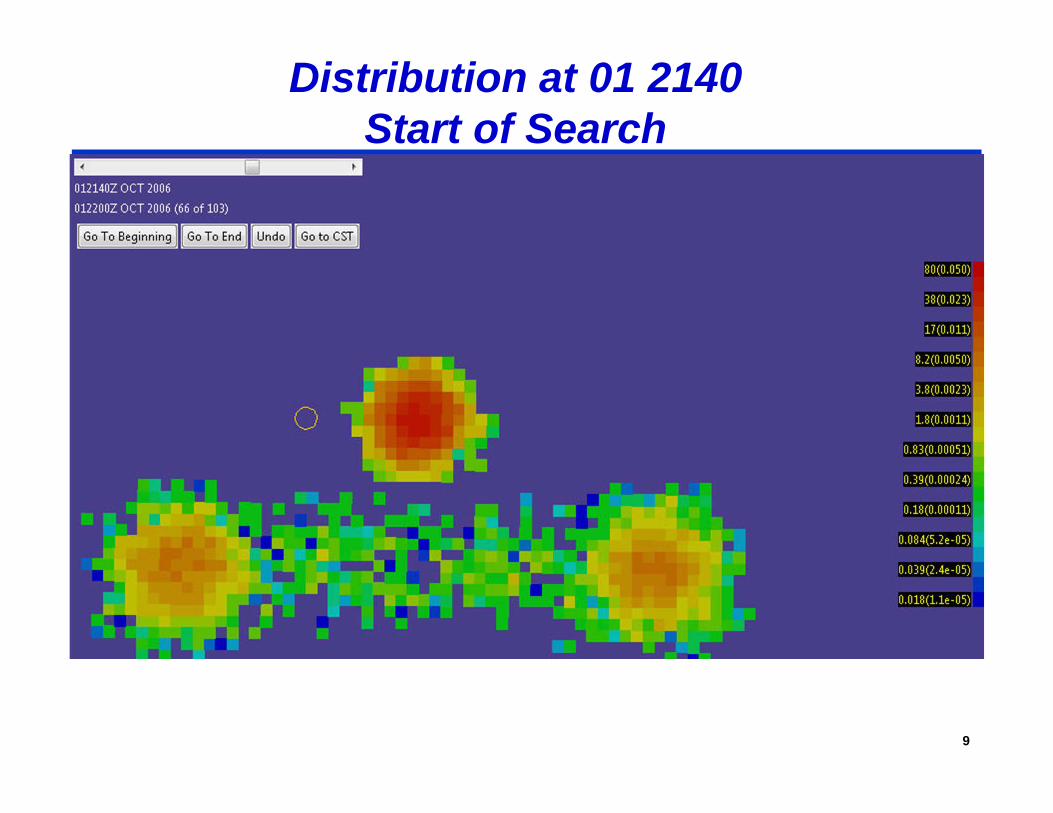
Distribution at 01 2140Start of Search
9

Planner Solution
10

Distribution at 01 2140Prior to Search
11
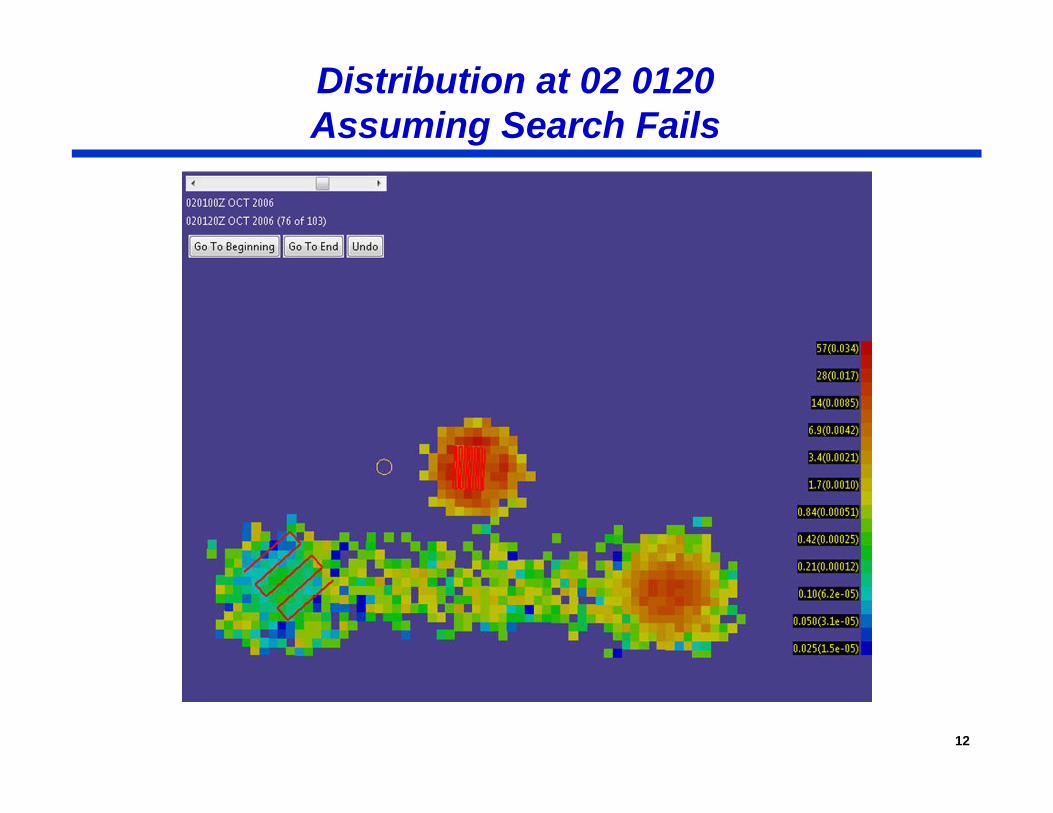
Distribution at 02 0120Assuming Search Fails
12

Distribution at 02 0120 without TracksAssuming Search Fails
13

1414
Planner
A set of SRUs is specified for the searchSRUs may have different detection characteristics for each object type
• These are characterized by lateral range curves as discussed below
Each SRU has a time on scene, endurance, speed
Planner assigns a rectangle to each SRUAn allowable rectangle induces a parallel path search plan for an SRU
Planner seeks to maximize Probability of Success (POS) by placing the rectangles intelligently

1515
Search Paths from Rectangles
A Rectangle is defined by 5 variables:Center (x, y), orientation θ, length l, and width w
Each SRU has a path-length L
The set of allowable rectangles is constrained as followsThe track spacing s, leg length t, and path length L must satisfy
where is the minimum allowable track spacing
Rectangles can not overlap
An allowable rectangle (almost) specifies a search path
min , , / where is an integer, and /s s t t s l l L n n w Ls l≤ ≤ + = = =
mins
l
w
θ

16
Calculating POS for a Search Plan
SRU Search paths consist of K straight-line legs Sensor on SRU (visual, radar, lidar) is characterized by a lateral range function λ
• λ gives probability of detection as a function of r, distance at point of closest approach
• Detection prob is function of object type, sensor (altitude), environment – clouds, sea state
Let dk be the distance a the point of closest approach of the k th leg to the path of particle p during the time of the leg . Then
is the probability that the SRU fails to detect the particle p during its search
Let w(p) be the probability on path p. Then
( ) ( )1
, 1 ( )Kkk
pfail p SRU dλ=
= −∏
search object
r
sensor path
( )( ) 1 ,SRU and ( ) ( )sru p
POS p pfail p POS w p POS p= − =∑∏

1717
Computing POS for Planner
Probability of Success (POS) is computed 3 ways:Method A: Exponential detection function
• Compute sweep width W of sensor by
• A = area of rectangle, s = speed, T = search time, PC = cont Prob
• POS =
Method B: Reduced Sample – compute POS the “correct” way but use a small subset of particles
Method C: “Exact – use full set of particles (Used to report the results)
( )W r drλ∞
−∞= ∫
1 expCsTWP
A⎛ ⎞⎛ ⎞⎟⎜ ⎟⎜− − ⎟⎟⎜ ⎜ ⎟⎟⎜ ⎟⎜ ⎝ ⎠⎝ ⎠

1818
Mathematical Formulation
Constrained Optimization problem with 5n variables, n is the number of SRUs.
Use iterative techniques for “solving” the problem
Need initial solution
Need algorithm for iterating to better solutions (higher POS)
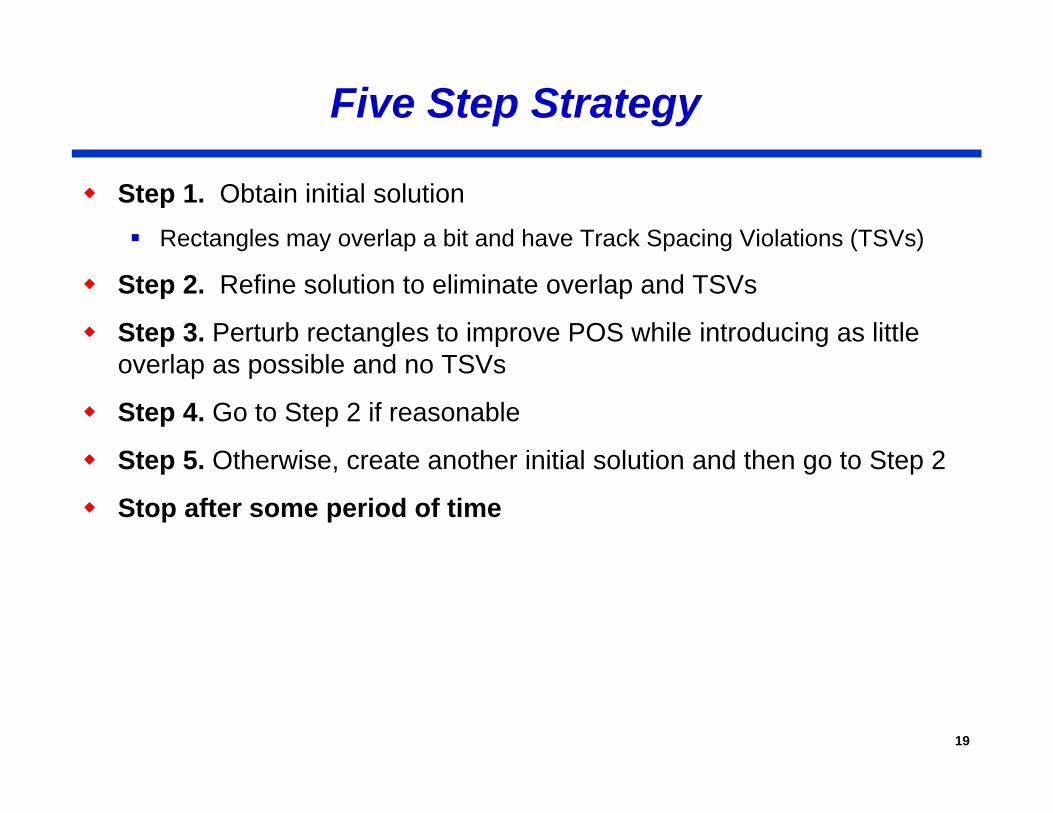
Five Step Strategy
Step 1. Obtain initial solutionRectangles may overlap a bit and have Track Spacing Violations (TSVs)
Step 2. Refine solution to eliminate overlap and TSVs
Step 3. Perturb rectangles to improve POS while introducing as little overlap as possible and no TSVs
Step 4. Go to Step 2 if reasonable
Step 5. Otherwise, create another initial solution and then go to Step 2
Stop after some period of time
19

2020
Step 1: Initial Placement
Greedily place the first SRU:• Align with the mean drift
• Look for a rectangular array of cells by starting with the highest prob cell and adding/subtracting rows and columns until we can’t improve the POS, using method “A” to approximate POS.
Update the probabilities of the particles.
Place the second SRU.• Allow overlap, but only some overlap.
– Goal is to have a fixable amount of overlap for step 2
Place third and remaining SRUs similarly.
At each step, maintain admissibility• Admissible sets can have their overlaps cleared with small adjustments.

2121
Step 2: Eliminate Overlap and TSV
Minor Moves - each SRU rectangle has 20 possible minor moves.• Examples: Move up ¼ NM; Expand to the right; Contract from the left
Overlap Elimination• For each SRU, check each congruent minor move.
– Make move if it decreases overlap, and doesn’t decrease POS (Method B)
– Otherwise make move with smallest decrease in POS
• Continue until overlap is eliminated
TSV Elimination• For each SRU, check for the best TSV-reducing minor move.
– Set of TSV minor moves depends on values of Minimum Track Spacing, Current Track Spacing, and Search Leg Length
• If any TSV-reducing minor moves are made, repeat Overlap Elimination step.
– Since Overlap Elimination uses congruent moves, TSV does not change
• Continue until TSV is eliminated

Steps 3 - 5: Improve POS
Step 3Discrete gradient with 20 possible minor moves as in Step 2
Use a move if it increases POS with “minimal” increase in overlap
Step 4Go back to step 2
Step 5: If stuck at a local maximum, “Jump” one of the rectangles to new location
22

Summary
SAROPS Planner provides an important new tool for SAR planning
Planner recommends search plans thatMaximize increase in POS for a given set of SRU assets
Are operational• Parallel path plans – no overlap in search areas
• Based on time on station, endurance, and speed of SRUs
Account for• Previous unsuccessful search
• Detection capability of SRU as a function of target type and environment
• Multiple target types
• Target and SRU motion during search
Developmental Version of Planner is Interactive
23

Backup Slides

2525
Simulator
Monte-Carlo simulator produces distribution for location and state of search object – weighted set of particles (paths).Pre-distress motion is described with scenarios.
Examples: Sequence of waypoints, Dead-Reckoning, Last-Known Position. SAROPS has these and other scenario-types.
Scenarios carry weights.
Each Scenario has its own collection of particles.
Transition to distressDraw for when the distress occurred - Influenced by hazard areas
Draw for the type of post-distress object
Post-distress motionMoves according to the winds and currents
These affect diverse object types differently

2626
Example of Scenario
Home Port
Fishing Area A
Fishing Area B
Probable Error of Turn Point Position
27
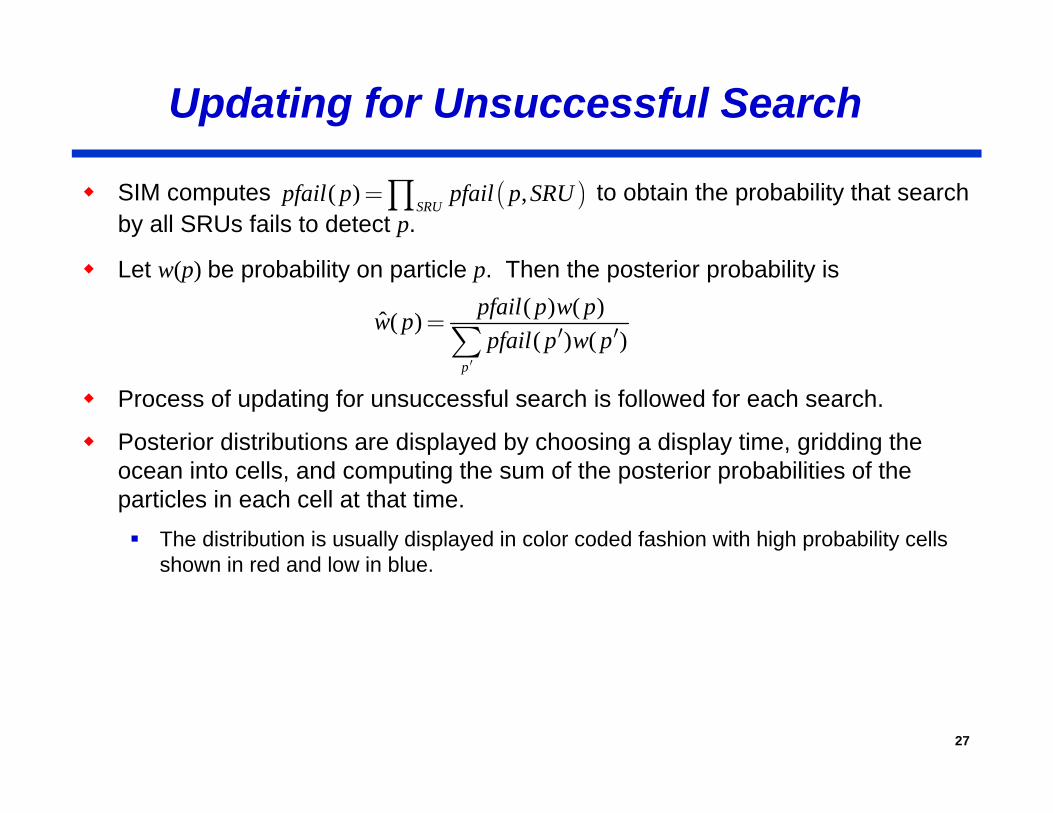
Updating for Unsuccessful Search
SIM computes to obtain the probability that search by all SRUs fails to detect p.
Let w(p) be probability on particle p. Then the posterior probability is
Process of updating for unsuccessful search is followed for each search.
Posterior distributions are displayed by choosing a display time, gridding the ocean into cells, and computing the sum of the posterior probabilities of the particles in each cell at that time.
The distribution is usually displayed in color coded fashion with high probability cells shown in red and low in blue.
( )( ) ,SRU
pfail p pfail p SRU=∏
( ) ( )ˆ ( )( ) ( )
p
pfail p w pw ppfail p w p
′
=′ ′∑
2828
Planner: Remaining Work
Better Initial Solutions
Better Choice of Minor MovesE.g, Some that are not the movement of a single SRU
Re-define what to MaximizeProbability of finding Object AND Object is Alive
Use Optimization LibrariesUse real gradient searches by introducing Path-Length as a sixth variable for each SRU, OR
Solve problems for a fixed value of length, and combine results

2929
History and Background (3)
Team and Roles:Northrop Grumman is the prime
Applied Science Associates: GUI and EDS
Metron: Simulator and Planning Algorithms
More Information on the Web:http://www.military.com/news/article/coast-guard-news/cg-assists-in-search-for-air-france.html?col=1186032366581
http://en.wikipedia.org/wiki/Search_and_Rescue_Optimal_Planning_System_(SAROPS)
http://www.scientificamerican.com/article.cfm?id=people-lost-at-sea-found

3030
Software Component:GUI, EDS, SIM
SAROPS is the overall Program
Computational Engine (called SIM) is a Service
WorkflowGUI collects information from user:
• Where, when, hypotheses on what happened
Information on winds and currents are gathered from EDS
Writes the information into an Xml file and environmental data files• 3 files; 1 model file (xml), 1 wind file (netcdf), and 1 currents file (netcdf)
SAROPS sends SIM the 3 files and SIM creates a file of distributions (one for each 20-minute time period)
SAROPS gathers more information about the search assets
SAROPS asks SIM for a suggested search plan

31
History and BackgroundEarly CASP Probability Map

32
Early SAROPS Success
Cruise Ship Passenger Goes Overboard; Is Rescued 8 Hours LaterBy Robert Nolin and Ihosvani Rodriguez; South Florida Sun-Sentinel March 17, 2007
Michael Mankamyer was 30 miles off Fort Lauderdale treading water in choppy seas.Eight hours earlier, the 35-year-old Orlando man had jumped from a cruise ship balconyRescue officials were at a loss to say why, though a witness said he was drunk.
Salvation came at 8:45 a.m., when a lookout on the Coast Guard cutter Chandeleur, Petty Officer Ryan Coon, saw Mankamyer in the fresh sunrise about 75 yards away.
He was shirtless, splashing and thrashing his arms. I knew that was our guy," Coon told reporters Friday evening.
"I hollered out, `Man overboard, portside!'“ The crew threw Mankamyer a life ring; he swam up and grabbed it.
Nancy Nelsen, a civilian search and rescue specialist in the Coast Guard's Miami officeCredited a new computer model, the Search and Rescue Optimal Planning System, or SAROPS, for helping locate Mankamyer. The system analyzes wind and currents and uses an animated grid model to project where a floating person could be.
33
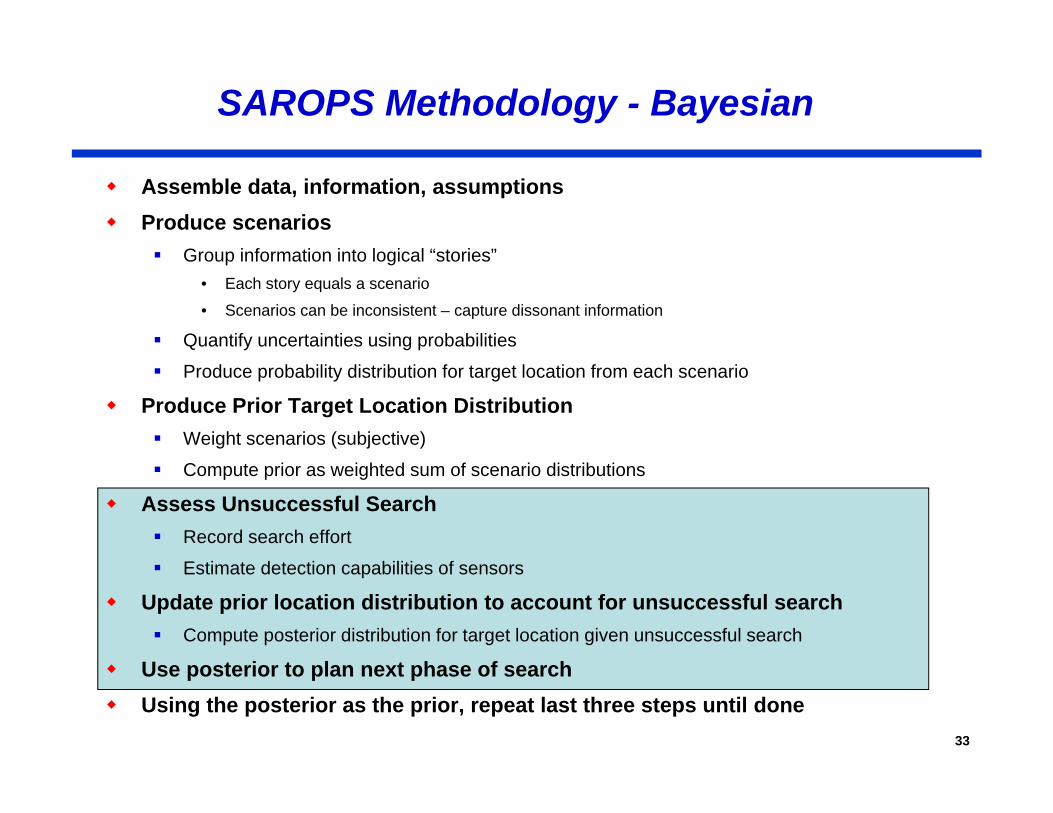
SAROPS Methodology - Bayesian
Assemble data, information, assumptionsProduce scenarios
Group information into logical “stories”• Each story equals a scenario
• Scenarios can be inconsistent – capture dissonant information
Quantify uncertainties using probabilities
Produce probability distribution for target location from each scenario
Produce Prior Target Location DistributionWeight scenarios (subjective)
Compute prior as weighted sum of scenario distributions
Assess Unsuccessful SearchRecord search effort
Estimate detection capabilities of sensors
Update prior location distribution to account for unsuccessful searchCompute posterior distribution for target location given unsuccessful search
Use posterior to plan next phase of searchUsing the posterior as the prior, repeat last three steps until done
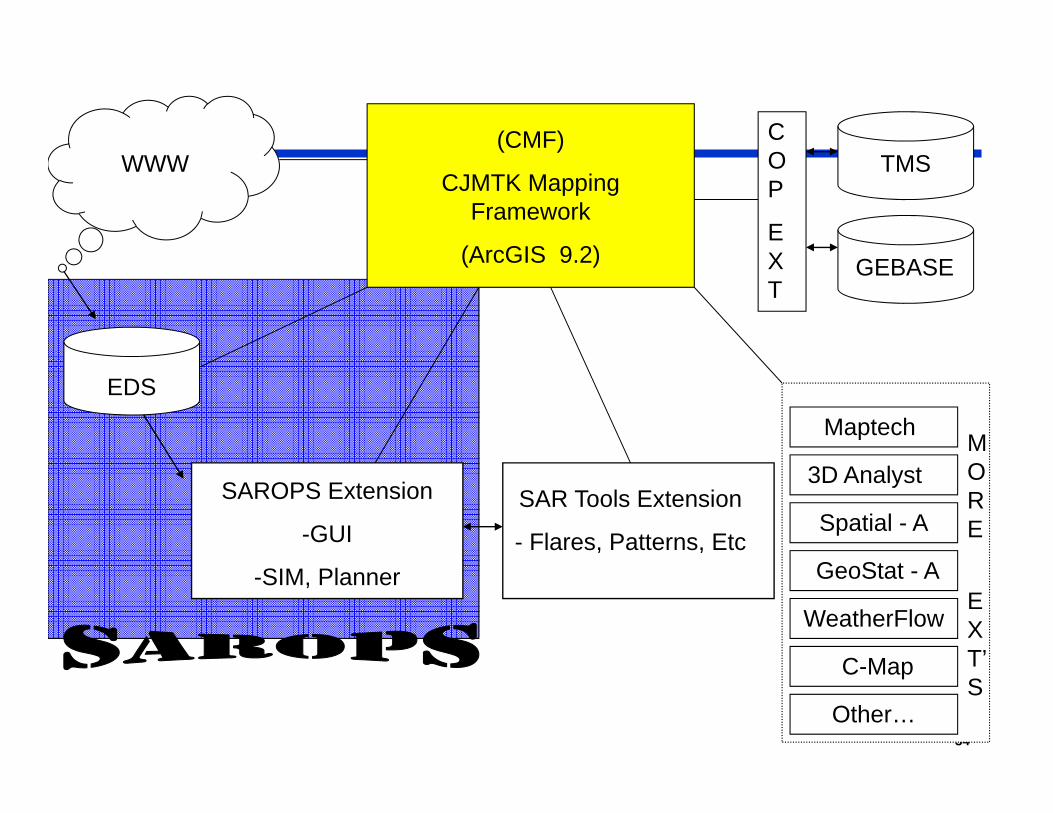
34
Maptech
Spatial - A
3D Analyst
GeoStat - A
WeatherFlow
C-Map
Other…
SAROPS Extension
-GUI
-SIM, Planner
EDS
WWW
SAR Tools Extension
- Flares, Patterns, Etc
(CMF)
CJMTK Mapping Framework
(ArcGIS 9.2)
TMS
GEBASE
COP
EXT
MORE
EXT’S

3535
Example of Scenarios and Object Types
Two Scenarios (Pre-Distress Motion)(P = 0.7) We think he went fishing in fishing area 1 and then on to fishing area 2. In this case, he went 12 kts, …
• For an individual particle, correlation between the position in fishing area 1 and fishing area 2.
(P = 0.3) But we also heard a mayday and it might have been him. In this case, he has been adrift from a roughly circular area, for the last 12 hours, …
Two Object Types (Post-Distress Motion)He got into a raft (P=0.4) or he is in the water (P=0.6)
• Former case; his position is more influenced by the winds
• Latter case: his position is more influenced by the currents
Post-Distress MotionUses environmental data and random fluctuations
Fluctuations are correlated over time for a single particle