sears holdings corporationsearsholdings.com/docs/investor/shc_2016_form_10-k.pdfsears holdings...
TRANSCRIPT

United States Securities and Exchange Commission
Washington, D.C. 20549
FORM 10-Kx Annual Report Pursuant to Section 13 or 15(d) of the Securities Exchange Act of 1934
For the Fiscal Year Ended January 28, 2017or
o Transition Report Pursuant to Section 13 or 15(d) of the Securities Exchange Act of 1934Commission file number 000-51217, 001-36693
SEARS HOLDINGS CORPORATION(Exact Name of Registrant as Specified in Its Charter)
Delaware 20-1920798(State of Incorporation) (I.R.S. Employer Identification No.)
3333 Beverly Road, Hoffman Estates, Illinois 60179(Address of principal executive offices) (Zip Code)
Registrant’s Telephone Number, Including Area Code: (847) 286-2500
Securities registered pursuant to Section 12(b) of the Act:
Title of each class Name of Each Exchange on Which RegisteredCommon Shares, par value $0.01 per share The NASDAQ Stock Market
Securities registered pursuant to Section 12(g) of the Act: None
Indicate by check mark if the registrant is a well-known seasoned issuer, as defined in Rule 405 of the Securities Act. Yes ¨ No x
Indicate by check mark if the registrant is not required to file reports pursuant to Section 13 or Section 15(d) of the Act. Yes ¨ No x
Indicate by check mark whether the registrant (1) has filed all reports required to be filed by Section 13 or 15(d) of the Securities Exchange Act of 1934 during the preceding 12months (or for such shorter period that the registrant was required to file such response) and (2) has been subject to such filing requirements for the past 90 days. Yes x No ¨
Indicate by check mark whether the registrant has submitted electronically and posted on its corporate Web site, if any, every Interactive Data File required to be submitted and postedpursuant to Rule 405 of Regulation S-T (§232.405 of this chapter) during the preceding 12 months (or for such shorter period that the registrant was required to submit and post suchfiles). Yes x No ¨
Indicate by check mark if disclosure of delinquent filers pursuant to Item 405 of Regulation S-K (§229.405) is not contained herein, and will not be contained, to the best of theRegistrant's knowledge, in definitive proxy or information statements incorporated by reference in Part III of this Form 10-K or any amendment to this Form 10-K. ¨
Indicate by check mark whether the registrant is a large accelerated filer, an accelerated filer, a non-accelerated filer, or a smaller reporting company. See the definitions of "largeaccelerated filer," "accelerated filer" and "smaller reporting company" in Rule 12b-2 of the Exchange Act.
Large accelerated filer ¨ Accelerated filer x Non-accelerated filer ¨ Smaller reporting company ¨
Indicate by check mark whether the registrant is a shell company (as defined in Rule 12b-2 of the Exchange Act). Yes ¨ No xOn March 16, 2017, the registrant had 107,151,038 common shares outstanding. The aggregate market value (based on the closing price of the Registrant's common shares for stocksquoted on the NASDAQ Global Select Market) of the Registrant's common shares owned by non-affiliates as of the last business day of the Registrant's most recently completedsecond fiscal quarter, was approximately $357 million.
Documents Incorporated By ReferencePart III of this Form 10-K incorporates by reference certain information from the Registrant’s definitive proxy statement relating to our Annual Meeting of Stockholders to be held onMay 10, 2017 (the "2016 Proxy Statement"), which will be filed with the Securities and Exchange Commission within 120 days after the end of the fiscal year to which this Form 10-K relates.

PART I
2
Item 1. Business
General
Sears Holdings Corporation ("Holdings") is the parent company of Kmart Holding Corporation ("Kmart") andSears, Roebuck and Co. ("Sears"). Holdings (together with its subsidiaries, "we," "us," "our," or the "Company")was formed as a Delaware corporation in 2004 in connection with the merger of Kmart and Sears (the "Merger") onMarch 24, 2005. We are an integrated retailer with significant physical and intangible assets, as well as virtualcapabilities enabled through technology. We operate a national network of stores with 1,430 full-line and specialtyretail stores in the United States operating through Kmart and Sears. Further, we operate a number of websites underthe sears.com and kmart.com banners which offer millions of products and provide the capability for our membersand customers to engage in cross-channel transactions such as free store pickup; buy in store/ship to home; and buyonline, return in store. We are also the home of Shop Your Way®, a free member-based social shopping platform thatoffers rewards, personalized services and a unique experience. Shop Your Way connects all of the ways membersshop - in store, at home, online and by phone. The Company is a leading home appliance retailer, as well as a leaderin tools, lawn and garden, fitness equipment, automotive repair and maintenance, and is a significant player in therapidly emerging Connected Solutions market. We offer key proprietary brands including Kenmore® and DieHard®,as well as Craftsman® branded product offerings. We also maintain a broad apparel and home offering includingsuch well-known labels as Jaclyn Smith®, Joe Boxer®, Route 66®, Cannon®, Adam Levine® and Levi's® and alsooffer Lands' End® merchandise in some of our Full-line stores. We are the nation's No. 1 provider of appliance andproduct repair services, with nearly seven million service calls made annually.
The retail industry is changing rapidly. The progression of the Internet, mobile technology, social networkingand social media is fundamentally reshaping the way we interact with our core customers and members. As a result,we are transitioning to a member-centric company. Our focus continues to be on our core customers, our members,and finding ways to provide them value and convenience through Integrated Retail and our Shop Your Waymembership platform. We have invested significantly in our online ecommerce platforms, our membership programand the technology needed to support these initiatives.
Business Segments
Through the third quarter of 2014, we operated three reportable segments: Kmart, Sears Domestic and SearsCanada. Since the de-consolidation of Sears Canada in October 2014, we have operated in two segments, Kmart andSears Domestic. Financial information, including revenues, operating loss, total assets and capital expenditures foreach of these business segments is contained in Note 17 of Notes to Consolidated Financial Statements. Informationregarding the components of revenue for Holdings is included in Item 7, Management's Discussion and Analysis ofFinancial Condition and Results of Operations as well as Note 17 of Notes to Consolidated Financial Statements.
Kmart
At January 28, 2017, the Company operated a total of 735 Kmart stores across 49 states, Guam, Puerto Ricoand the U.S. Virgin Islands. This store count consists of 734 discount stores, averaging 95,000 square feet, and oneSuper Center, approximately 185,000 square feet. Most Kmart stores are one-floor, free-standing units that carry awide array of products across many merchandise categories, including consumer electronics, seasonal merchandise,outdoor living, toys, lawn and garden equipment, food and consumables and apparel, including products sold undersuch well-known labels as Craftsman , Jaclyn Smith, Joe Boxer, and certain proprietary Sears branded products(such as Kenmore and DieHard) and services. We also offer an assortment of major appliances, including Kenmore-branded products, in all of our locations. There are 451 Kmart stores that also operate in-store pharmacies. TheSuper Center combines a full-service grocery along with the merchandise selection of a discount store. There arealso six Sears Auto Centers operating in Kmart stores, offering a variety of professional automotive repair andmaintenance services, as well as a full assortment of automotive accessories. Kmart offers a layaway program,which allows members and customers to cost-effectively finance their purchases both in-store and online. Inaddition, our members and customers have the ability to buy online and pick up in store. This service is now

available in over 700 Kmart stores via mygofer.com, kmart.com or shopyourway.com. Kmart also sells its productsthrough its kmart.com website and provides members and customers enhanced cross-channel options such as buyingthrough a mobile app or online and picking up merchandise in one of our Kmart or Sears Full-line stores.
Sears Domestic
At January 28, 2017, Sears Domestic operations consisted of the following:
• Full-line Stores—670 stores located across all 50 states and Puerto Rico, primarily mall-based locationsaveraging 139,000 square feet. Full-line stores offer a wide array of products and service offeringsacross many merchandise categories, including appliances, consumer electronics/connected solutions,tools, sporting goods, outdoor living, lawn and garden equipment, certain automotive services andproducts, such as tires and batteries, home fashion products, as well as apparel, footwear, jewelry andaccessories for the whole family. Our product offerings include our proprietary Kenmore, DieHard,Bongo, Covington, Simply Styled, Everlast, Metaphor, Roebuck & Co., Outdoor Life and Structurebrand merchandise, and other brand merchandise such as Craftsman, Roadhandler, Levi's andWallyHome. Lands' End, Inc. continues to operate 215 "store within a store" departments inside SearsDomestic Full-line locations. We also have 588 Sears Auto Centers operating in association with Full-line stores. In addition, there are 23 free-standing Sears Auto Centers that operate independently of Full-line stores. Sears extends the availability of its product selection through the use of its sears.com andshopyourway.com website, which offers an assortment of home, apparel and accessory merchandise andprovides members and customers the option of buying through a mobile app or online and picking uptheir merchandise in one of our Sears Full-line or Kmart stores.
• Specialty Stores—25 specialty stores (primarily consisting of the 23 free-standing Sears Auto Centersnoted above) located in free-standing, off-mall locations or high-traffic neighborhood shopping centers.Specialty stores also include a Sears Appliances store in Ft. Collins, Colorado.
• Commercial Sales—We sell Sears merchandise, parts and services to commercial customers through ourbusiness-to-business Sears Commercial Sales, which includes California Builder Appliances, Inc. (d/b/aMonark Premium Appliance Co. of California), Florida Builder Appliances, Inc. (d/b/a MonarkPremium Appliance Co.) and Starwest, LLC. (d/b/a Monark Premium Appliance Co. of Arizona).
• Home Services—Product Repair Services, the nation's No. 1 provider of appliance and product repairservices, is a key element in our active relationship with nearly 35 million households. Withapproximately 6,400 service technicians making nearly seven million service calls annually, thisbusiness delivers a broad range of retail-related residential and commercial services across all 50 states,Puerto Rico, Guam and the Virgin Islands under either the Sears Parts & Repair Services or A&EFactory Service trade names. Commercial and residential customers can obtain parts and repair servicesfor all major brands of products within the appliances, lawn and garden equipment, consumerelectronics, floor care products, and heating and cooling systems categories. We also provide repair partswith supporting instructions for "do-it-yourself" members and customers through oursearspartsdirect.com website. This business also offers protection agreements, home warranties andKenmore and Carrier brand residential heating and cooling systems. Home Services also includes homeimprovement services (primarily siding, windows, cabinet refacing, kitchen remodeling, roofing, carpetand upholstery cleaning, air duct cleaning, and garage door installation and repair) provided throughSears Home Improvement Services and Sears Home & Business Franchises.
• Delivery and Installation—Provides both home delivery and retail installation services for Holdings'retail operations with over four million deliveries and installation calls made annually. Also includesInnovel Solutions, which provides delivery services for third party customers.
Craftsman Brand Sale
On January 5, 2017, Holdings announced that it had entered into a definitive agreement under which StanleyBlack & Decker would purchase the Craftsman brand from Holdings (the "Craftsman Sale"). On March 8, 2017, theCompany closed its sale of the Craftsman brand to Stanley Black & Decker. The transaction provides Stanley Black& Decker with the right to develop, manufacture and sell Craftsman-branded products outside of Holdings and Sears
3

Hometown & Outlet Stores, Inc. distribution channels. As part of the agreement, Holdings will continue to offerCraftsman-branded products, sourced from existing suppliers, through its current retail channels via a perpetuallicense from Stanley Black & Decker, which will be royalty-free for the first 15 years after closing and royalty-bearing thereafter.
The Company received an initial upfront payment of $525 million, subject to closing costs and an adjustmentfor working capital changes, at closing. In addition, Stanley Black & Decker will pay a further $250 million in cashin three years and Holdings will receive payments of between 2.5% and 3.5% on new Stanley Black & Decker salesof Craftsman products for the 15 year period following the closing of the transaction. See Note 1 of Notes toConsolidated Financial Statements for further information.
Sears Canada Rights Offering
On October 2, 2014, the Company announced that its Board of Directors had approved a rights offering of upto 40 million shares of Sears Canada Inc. ("Sears Canada"). The operating results for Sears Canada through October16, 2014 are presented within the consolidated operations of Holdings and the Sears Canada segment in theaccompanying Consolidated Financial Statements. The Company de-consolidated Sears Canada on October 16,2014. See Note 2 of Notes to Consolidated Financial Statements for further information.
Separation of Lands' End, Inc.
On April 4, 2014, we completed the separation of our Lands' End business through a spin-off transaction. Theoperating results for Lands' End through the date of the spin-off are presented within the consolidated continuingoperations of Holdings and the Sears Domestic segment in the accompanying Consolidated Financial Statements.See Note 1 of Notes to Consolidated Financial Statements for further information.
Real Estate Transactions
In the normal course of business, we consider opportunities to purchase leased operating properties, as well asoffers to sell owned, or assign leased, operating and non-operating properties. These transactions may, individuallyor in the aggregate, result in material proceeds or outlays of cash. In addition, we review leases that will expire inthe short term in order to determine the appropriate action to take with respect to them.
Further information concerning our real estate transactions is contained in Note 11 of Notes to ConsolidatedFinancial Statements.
Trademarks and Trade Names
The KMART® and SEARS® trade names, service marks and trademarks, used by us both in the United Statesand internationally, are material to our retail and other related businesses.
We sell proprietary branded merchandise under a number of brand names that are important to our operations.Our KENMORE® and DIEHARD® brands are among the most recognized proprietary brands in retailing. Thesemarks are the subject of numerous United States and foreign trademark registrations. Other well recognizedCompany trademarks and service marks include BLUELIGHT®, CANYON RIVER BLUES®, COVINGTON®,SHOP YOUR WAY®, SMART SENSE®, STRUCTURE®, THOM MCAN®, TOUGHSKINS®, and WALLY®, whichalso are registered or are the subject of pending registration applications in the United States. Generally, our rights inour trade names and marks continue so long as we use them.
Seasonality
The retail business is seasonal in nature, and we generate a high proportion of our revenues, operating incomeand operating cash flows during the fourth quarter of our year, which includes the holiday season. As a result, ouroverall profitability is heavily impacted by our fourth quarter operating results. Additionally, in preparation for thefourth quarter holiday season, we significantly increase our merchandise inventory levels, which are financed fromoperating cash flows, credit terms received from vendors and borrowings under our domestic credit agreement(described in the "Uses and Sources of Liquidity" section below). Fourth quarter reported revenues accounted forapproximately 27% of total reported revenues in 2016, 29% of total reported revenues in 2015 and 28% of total
4

reported revenues in 2014, excluding the impact of transactions related to Sears Canada and Lands' End. See Note19 of Notes to Consolidated Financial Statements for further information on revenues earned by quarter in 2016 and2015.
Competition
Our business is subject to highly competitive conditions. We compete with a wide variety of retailers,including other department stores, discounters, home improvement stores, consumer electronics dealers, auto serviceproviders, specialty retailers, wholesale clubs, as well as many other retailers operating on a national, regional orlocal level in the U.S. and Canada. Online and catalog businesses, which handle similar lines of merchandise, alsocompete with us. Walmart, Target, Kohl's, J.C. Penney, Macy's, The Home Depot, Lowe's, Best Buy and Amazon aresome of the national retailers and businesses with which we compete. The Home Depot and Lowe's are majorcompetitors in relation to our home appliance business, which accounted for approximately 15% of our 2016, 15%of our 2015 and 15% of our 2014 reported revenues. Success in these competitive marketplaces is based on factorssuch as price, product assortment and quality, service and convenience, including availability of retail-relatedservices such as access to credit, product delivery, repair and installation. Additionally, we are influenced by anumber of factors, including, but not limited to, the cost of goods, consumer debt availability and buying patterns,economic conditions, customer preferences, inflation, currency exchange fluctuations, weather patterns, andcatastrophic events. Item 1A in this Annual Report on Form 10-K contains further information regarding risks to ourbusiness.
Employees
At January 28, 2017, subsidiaries of Holdings had approximately 140,000 employees in the United States andU.S. territories. This employee count includes part-time employees.
Our Website; Availability of SEC Reports and Other Information
Our corporate website is located at searsholdings.com. Our Annual Reports on Form 10-K, Quarterly Reportson Form 10-Q, Current Reports on Form 8-K and any amendments to these reports are available, free of charge,through the "SEC Filings" portion of the Investor Information section of our website as soon as reasonablypracticable after they are electronically filed with, or furnished to, the Securities and Exchange Commission("SEC").
The Corporate Governance Guidelines of our Board of Directors, the charters of the Audit, Compensation,Finance and Nominating and Corporate Governance Committees of the Board of Directors, our Code of Conductand the Board of Directors Code of Conduct are available in the Corporate Governance section ofsearsholdings.com. References to our website address do not constitute incorporation by reference of theinformation contained on such website, and the information contained on the website is not part of this document.
5

Item 1A. Risk Factors
Our operations and financial results are subject to various risks and uncertainties, including those describedbelow, which could adversely affect our business, results of operations and financial condition.
If we are unable to compete effectively in the highly competitive retail industry, our business and results ofoperations could be materially adversely affected.
The retail industry is highly competitive with few barriers to entry. We compete with a wide variety ofretailers, including other department stores, discounters, home improvement stores, appliances and consumerelectronics retailers, auto service providers, specialty retailers, wholesale clubs, online and catalog retailers andmany other competitors operating on a national, regional or local level. Some of our competitors are activelyengaged in new store expansion. Online and catalog businesses, which handle similar lines of merchandise, andsome of which are not required to collect sales taxes on purchases made by their customers, also compete with us.Competition may intensify as competitors enter into business combinations or alliances. We also experiencesignificant competition from promotional activities of our competitors, and some competitors may be able to devotegreater resources to sourcing, promoting and selling their products. In this competitive marketplace, success is basedon factors such as price, advertising, product assortment, quality, service, reputation and convenience.
Our success depends on our ability to differentiate ourselves from our competitors with respect to shoppingconvenience, a quality assortment of available merchandise, functionality of digital channels, and superior customerservice and experience. We must also successfully respond to our members' and customers' changing tastes andexpectations. The performance of our competitors, as well as changes in their pricing policies, marketing activities,new store openings and other business strategies, could have a material adverse effect on our business, financialcondition and results of operations.
If we fail to offer merchandise and services that our members and customers want, our sales may be limited,which would reduce our revenues and profits.
In order for our business to be successful, we must identify, obtain supplies of, and offer to our members andcustomers, attractive, innovative and high-quality merchandise. Our products and services must satisfy the desires ofour members and customers, whose preferences may change in the future. Our sales and operating results depend inpart on our ability to predict consumer demand for products and services we sell, availability of merchandise,product trends, and our members' and customers' purchasing habits, tastes and preferences. If we misjudge thesepredictions, our relationship with our members and customers may be negatively impacted, and we may be facedwith excess inventories of some products, which may impact our sales or require us to sell the merchandise we haveobtained at lower prices, and missed opportunities for products and services we chose not to offer. In addition,merchandise misjudgments may adversely impact the perception or reputation of our company, which could result indeclines in member and customer loyalty and vendor relationships. These factors could have a negative effect on ourbusiness, financial condition and results of operations.
If our integrated retail strategy to transform into a member-centric retailer is not successful, our business andresults of operations could be adversely affected.
We are seeking to transform into a member-centric retailer through our integrated retail strategy, which isbased on a number of initiatives, including our Shop Your Way program, that depend on, among other things, on ourability to respond quickly to ongoing technology developments and implement new ways to understand and rely onthe data to interact with our members and customers and our ability to provide attractive, convenient and consistentonline and mobile experiences for our members. We must anticipate and meet our members' and customers' evolvingexpectations, while counteracting developments by our competitors and striving to deliver a seamless experienceacross all of our sales channels. We may need to adjust our strategic initiatives depending on our members' andcustomers' reactions to and level of engagement with our initiatives. Failure to execute these initiatives or provideour members with positive experiences may result in a loss of active members, failure to attract new members andlower than anticipated sales. There is no assurance that our initiatives and strategies will improve our operatingresults.
6

If we do not successfully manage our inventory levels, our operating results will be adversely affected.
We must maintain sufficient inventory levels to operate our business successfully. However, we also mustguard against accumulating excess inventory as we seek to minimize out-of-stock levels across all productcategories and to maintain in-stock levels. We obtain a significant portion of our inventory from vendors locatedoutside the United States. Some of these vendors require lengthy advance notice of our requirements in order to beable to supply products in the quantities we request. This usually requires us to order merchandise, and enter intopurchase order contracts for the purchase and manufacture of such merchandise, well in advance of the time theseproducts will be offered for sale. As a result, we may experience difficulty in responding quickly to a changing retailenvironment, which makes us vulnerable to changes in price and demand. If we do not accurately anticipate thefuture demand for a particular product or the time it will take to obtain new inventory, our inventory levels will notbe appropriate and our results of operations may be negatively impacted.
Our business has been and will continue to be affected by worldwide economic conditions; an economicdownturn, a renewed decline in consumer-spending levels and other conditions, including inflation andchanging prices of energy, could lead to reduced revenues and gross margins, and negatively impact ourliquidity.
Many economic and other factors are outside of our control, including consumer and commercial creditavailability, consumer confidence and spending levels, as well as the impact of payroll tax and medical costincreases on U.S. consumers, recession, inflation, deflation, employment levels, housing sales and remodels, interestrates, tax rates, rates of economic growth, fiscal and monetary government policies, consumer debt levels, consumerdebt payment behaviors, fuel costs and other challenges currently affecting the global economy, the full impact ofwhich on our business, results of operations and financial condition cannot be predicted with certainty. Theseeconomic conditions adversely affect the disposable income levels of, and the credit available to, our members andcustomers, which could lead to reduced demand for our merchandise. Although fuel and energy costs have decreasedin recent months, future increases may have a significant impact on our operations. We require significant quantitiesof fuel for the vehicles used by technicians in our home services business, and we are exposed to the risk associatedwith variations in the market price for petroleum products. We could experience a disruption in energy supplies,including our supply of gasoline, as a result of factors that are beyond our control, which could have an adverseeffect on our business. Certain of our vendors also could experience increases in the cost of various raw materials,such as cotton, oil-related materials, steel and rubber, which could result in increases in the prices that we pay formerchandise, particularly apparel, appliances and tires. Domestic and international political events also affectconsumer confidence. The threat, outbreak or escalation of terrorism, civil unrest, military conflicts or otherhostilities could lead to a decrease in consumer spending. Any of these events and conditions could inhibit sales orcause us to increase inventory markdowns and promotional expenses, thereby reducing our gross margins.
The lack of willingness of our vendors to do business with us or to provide acceptable payment terms couldnegatively impact our liquidity and/or reduce the availability of products or services we seek to procure.
We depend on our vendors to provide us with financing on our purchases of inventory and services. Ourvendors could seek to limit the availability of vendor credit to us or modify the other terms under which they sell tous, or both, which could negatively impact our liquidity. In addition, the inability of vendors to access liquidity, orthe insolvency of vendors, could lead to their failure to deliver inventory or other services. Certain of our vendorsfinance their operations and/or reduce the risk associated with collecting accounts receivable from us by selling or"factoring" the receivables or by purchasing credit insurance or other forms of protection from loss associated withour credit risks. The ability of our vendors to do so is subject to the perceived credit quality of the Company. Suchvendors could be limited in their ability to factor receivables or obtain credit protection in the future because of ourperceived financial position and creditworthiness, which could reduce the availability of products or services weseek to procure, increase the cost to us of those products and services, or both.
7

We have ongoing discussions concerning our liquidity and financial position with the vendor community andthird parties that offer various credit protection services to our vendors. The topics discussed have included suchareas as pricing, payment terms and ongoing business arrangements. As of the date of this report, we have notexperienced any significant disruption in our access to merchandise or our operations; however, there can be noassurance that one or more of our vendors may not slow or cease merchandise shipments or require or condition thesale or shipment of merchandise on new payment terms or other assurances. Such circumstances could have anegative effect on our business, financial condition and results of operations.
Certain factors, including changes in market conditions and our credit ratings, may limit our access to capitalmarkets and other financing sources and materially increase our borrowing costs.
In addition to credit terms from vendors, our liquidity needs are funded by our operating cash flows and, to theextent necessary, borrowings under our credit agreements and commercial paper program, asset sales and access tocapital markets. The availability of financing depends on numerous factors, including economic and marketconditions, our operating performance, our credit ratings, and lenders' assessments of our prospects and theprospects of the retail industry in general. Changes in these factors may affect our cost of financing, liquidity andour ability to access financing sources, including our commercial paper program and possible second lienindebtedness that is permitted under the domestic revolving credit facility, with respect to each of which we have nolender commitments. Rating agencies revise their ratings for the companies that they follow from time to time.Several ratings agencies have downgraded the credit rating on certain of our outstanding debt instruments during thesix months preceding the date of this report, and our ratings may be further revised or withdrawn in their entirety atany time.
The Company's domestic credit facility currently provides up to $2.8 billion of lender commitments, $1.5billion of which are revolving commitments. Our ability to borrow funds under this facility is limited by a borrowingbase determined by the value, from time to time, of eligible inventory, accounts receivable and certain other assets.If, through asset sales or other means, the value of these eligible assets is not sufficient to support borrowings of upto the full amount of the commitments under this facility, we will not have full access to the facility, but rather willhave access to a lesser amount determined by the borrowing base. A decline in the value of eligible assets also couldresult in our inability to borrow up to the full amount of second lien indebtedness permitted by the domestic creditfacility as our second-lien borrowings are limited by a borrowing base requirement under the indenture that governsour senior secured notes due 2018. The domestic revolving credit facility imposes various other requirements, whichtake effect if availability falls below designated thresholds, including a cash dominion requirement. The domesticcredit facility also effectively limits full access to the facility if our fixed charge ratio at the last day of any quarter isless than 1.0 to 1.0. As of January 28, 2017, our fixed charge ratio was less than 1.0 to 1.0. If availability under thedomestic revolving credit facility were to fall below 10%, the Company would be required to test the fixed chargecoverage ratio, and would not comply with the facility, and the lenders under the facility could demand immediatepayment in full of all amounts outstanding and terminate their obligations under the facility. In addition, thedomestic credit facility provides that in the event we make certain prepayments of indebtedness, for a period of oneyear thereafter we must maintain availability under the facility of at least 12.5%, and it prohibits certain otherprepayments of indebtedness.
The lenders under our various credit facilities may not be able to meet their commitments if they experienceshortages of capital and liquidity. Disruptions or turmoil in the financial markets could reduce our ability to meet ourcapital requirements. There can be no assurance that our ability to otherwise access the credit markets will not beadversely affected by changes in the financial markets and the global economy.
We cannot predict whether our plans to enhance our financial flexibility and liquidity to fund ourtransformation will be successful.
We are continuing to pursue a transformation strategy and to explore potential initiatives to enhance ourfinancial flexibility and liquidity. We have incurred significant losses and experienced negative operating cash flowsfor the past several years, and accordingly we have taken a number of actions to fund our continued transformationand meet our obligations, including the amendment and extension of our revolving credit facility, the first lien termloan facility due 2018, the entrance into the first lien term loan facility due 2020, the second lien term loan facilitydue 2020, the amendment of the senior secured letter of credit facility, the real estate term loan facility due July
8
2017 and the real estate term loan facility due 2020, the sale of the Craftsman brand, the rights offering and sale-leaseback transaction with Seritage Growth Properties, the separation of our Lands' End subsidiary, the SearsCanada rights offering, the rights offering for senior unsecured notes with warrants, and various real estatetransactions. We also expect to pursue other near-term actions to bolster liquidity. If we continue to incur losses,additional actions may be required to further enhance our financial flexibility and liquidity. The success of ourinitiatives is subject to risks and uncertainties with respect to market conditions and other factors that may cause ouractual results, performance or achievements to differ materially from our plans. We cannot assure that cash flowsand other internal and external sources of liquidity will at all times be sufficient for our cash requirements. Ifnecessary, we may need to consider actions and steps to improve our cash position, mitigate any potential liquidityshortfall, pursue additional sources of liquidity, and reduce costs. There can be no assurance that these actions wouldbe successful. In addition, there can be no assurance that the evaluation and/or completion of any potentialtransactions will not have a negative impact on our other businesses.
We cannot predict the outcome of any actions to generate liquidity, whether such actions would generate theexpected liquidity as currently planned, or the availability of additional debt financing. The specific actions taken orassets involved, the timing, and the overall amount will depend on a variety of factors, including market conditions,interest in specific assets, valuations of those assets and our underlying operating performance.
If we continue to experience operating losses and we are not able to generate additional liquidity through themechanisms described above or through some combination of other actions, we may not be able to access additionalfunds under our domestic credit facility and we might need to secure additional sources of funds, which may or maynot be available to us. Additionally, a failure to generate additional liquidity could negatively impact our access toinventory or services that are important to the operation of our business. Moreover, if the borrowing base (ascalculated pursuant to the indenture) falls below the principal amount of the notes plus the principal amount of anyother indebtedness for borrowed money that is secured by liens on the collateral for the notes on the last day of anytwo consecutive quarters, it could trigger an obligation to repurchase notes in an amount equal to such deficiency.
Our business results and ability to fund our transformation depend on our ability to achieve cost savingsinitiatives and complete our previously announced restructuring program.
In February 2017, we initiated a restructuring program targeted to deliver at least $1.0 billion in annualizedcost savings. Under the restructuring program, we plan to reduce our corporate overhead, more closely integrate ourSears and Kmart operations and improve our merchandising, supply chain and inventory management. Theanticipated savings also include cost reductions from the previously announced closure of 108 Kmart and 42 Searsstores. If we are unable to deliver the expected cost reductions or complete the restructuring program as planned,while continuing to invest in business growth, our financial results could be adversely impacted. Our ability tosuccessfully manage and execute these initiatives and realize expected savings and benefits in the amounts and at thetimes anticipated is important to our business success, and any failure to do so, which could result from our inabilityto successfully execute plans, changes in global or regional economic conditions, competition, changes in theindustries in which we compete, unanticipated costs or charges and other factors described herein, could adverselyaffect our business, financial condition and results of operations. As part of our overhead reduction, we have reducedour corporate and operations headcount, including management level, distribution and field employees. Thesereductions, as well as attrition could result in the potential loss of specific knowledge relating to our company,operations and industry that could be difficult to replace. Also, we now operate with fewer employees, who haveassumed additional duties and responsibilities. The restructuring program and workforce changes may negativelyimpact communication, morale, management cohesiveness and effective decision-making, which could have anadverse impact on our business operations, customer experience, sales and results of operations.
9

Our business results may be negatively impacted as a result of the recapture rights included in the MasterLeases in connection with the Seritage transaction and JV transactions.
In 2015, we entered into various sale-lease back transactions with respect to certain of our real properties withSeritage Growth Properties ("Seritage") and certain joint ventures we formed with affiliates of Simon PropertyGroup, Inc., General Growth Properties, Inc. and the Macerich Company (collectively, the "JVs"). In connectionwith the Seritage transaction and JV transactions, Holdings entered into agreements with Seritage and the JVspursuant to which Holdings leased 255 of the properties (the "Master Leases"). The Master Leases include recaptureprovisions that allow Seritage or the JVs, as applicable, to reclaim approximately 50% of the space within theseproperties (subject to certain exceptions, including reclamation rights as to 100% of the space at 21 properties, andfurther subject to a lease termination payment by Seritage), in addition to all of the automotive care centers whichare free-standing or attached as "appendages," and all outparcels or outlots, as well as certain portions of parkingareas and common areas. While we believe these provisions are generally beneficial for Holdings as they facilitatethe transformation of our physical stores, potentially enable us to rationalize our footprint by reducing the space weoccupy in a given location, and provide us with substantial flexibility in how we manage our store network movingforward, if we are unable to successfully manage and execute our plans to operate our stores in the smaller footprint,our business, financial condition and results of operations could be adversely impacted. Additionally, the recapturerights are within the control of Seritage and the JVs and we cannot predict the timing on which the recapture rightsmay be exercised, if at all, or whether the timing of any such exercise of these rights will align well with the timingof our transformation, which could create disruptions in our operations.
Potential liabilities in connection with the separation of Lands' End or other asset transactions may ariseunder fraudulent conveyance and transfer laws and legal capital requirements.
With respect to the separation of our Lands' End, Inc. subsidiary, the sale of real estate assets to real estateinvestment trusts and other third parties, the sale of the Craftsman brand, and any future dispositions of other similarassets, if the Company, Lands' End, or any asset purchaser subsequently fails to pay its creditors or enters insolvencyproceedings, the transaction may be challenged under U.S. federal, U.S. state and foreign fraudulent conveyance andtransfer laws, as well as legal capital requirements governing distributions and similar transactions. If a court were todetermine under these laws that, (a) at the time of the transaction, the entity in question: (1) was insolvent; (2) wasrendered insolvent by reason of the transaction; (3) had remaining assets constituting unreasonably small capital;(4) intended to incur, or believed it would incur, debts beyond its ability to pay these debts as they matured; or(b) the transaction in question failed to satisfy applicable legal capital requirements, the court could determine thatthe transaction was voidable, in whole or in part. Subject to various defenses, the court could then require theCompany, Lands' End, the respective purchaser, or other recipients of value in connection with any such transaction,as the case may be, to turn over value to other entities involved in the transaction and contemplated transactions forthe benefit of unpaid creditors. The measure of insolvency and applicable legal capital requirements will varydepending upon the jurisdiction whose law is being applied.
We rely extensively on computer systems to implement our integrated retail strategy, process transactions,summarize results and otherwise manage our business. Disruptions in these systems could harm our ability torun our business.
Given the significance of our online and mobile capabilities, our collection and use of data to createpersonalized experiences, and the number of individual transactions we have each year, including in our stores, it iscritical that we maintain uninterrupted operation of our computer and communications hardware and softwaresystems, some of which are based on end-of-life or legacy technology, operate with minimal or no vendor supportand are otherwise difficult to maintain. Our systems are subject to damage or interruption from power outages,computer and telecommunications failures, computer viruses, worms, other malicious computer programs, denial-of-service attacks, security breaches, catastrophic events such as fires, tornadoes, hurricanes, acts of terrorism andusage errors by our employees. If our systems are damaged, breached or cease to function properly, we may have tomake a significant investment to repair or replace them, and we may suffer loss of critical data and interruptions ordelays in our operations. Operating legacy systems subjects us to inherent costs and risks associated withmaintaining, upgrading and replacing these systems and retaining sufficiently skilled personnel to maintain andoperate the systems, demands on management time, and other risks and costs. Any material interruption in our
10

computer operations may have a material adverse effect on our business or results of operations, including on ourShop Your Way program and participation in or engagement with that program. We are pursuing initiatives totransform our information technology processes and systems. These initiatives are highly complex and includereplacing legacy systems, upgrading existing systems, and acquiring new systems and hardware with updatedfunctionality. The risk of disruption is increased in periods when such complex and significant systems changes areundertaken.
If we do not maintain the security of our member and customer, associate or company information, we coulddamage our reputation, incur substantial additional costs and become subject to litigation.
The protection of member, customer, employee, and company data is critical to the Company. We havesystems and processes in place that are designed to protect information and protect against security and databreaches as well as fraudulent transactions and other activities. Nevertheless, cyber-security risks such as malicioussoftware and attempts to gain unauthorized access to data are rapidly evolving and becoming increasinglysophisticated. Techniques or software used to gain unauthorized access, and/or disable, degrade or harm our systemsmay be difficult to detect or scope for prolonged periods of time, and we may be unable to anticipate thesetechniques or put in place protective or preventive measures. These attempts to gain unauthorized access could leadto disruptions in our systems, unauthorized release of confidential or otherwise protected information or corruptionof data. If individuals are successful in infiltrating, breaking into, disrupting, damaging or otherwise stealing fromthe computer systems of the Company or its third-party providers we may have to make a significant investment tofix or replace them, we may suffer interruptions in our operations in the interim, we may face costly litigation,government investigations, government enforcement actions, fines and/or lawsuits, the ability for our members toearn or redeem points in our Shop Your Way program may be impacted or halted, and our reputation with ourmembers and customers may be significantly harmed. There is no guarantee that the procedures that we haveimplemented to protect against unauthorized access to secured data are adequate to safeguard against all datasecurity breaches. A data security breach or any failure by us to comply with applicable privacy and informationsecurity laws and regulations could result in a loss of customer or member confidence and negatively impact ourbusiness, including our Shop Your Way program, and our results of operations. Moreover, a data security breachcould require us to devote significant management resources to address the problems created by the breach and toexpend significant additional resources to upgrade further the security measures that we employ to guard againstsuch breaches, which could disrupt our business, operations and financial condition. As publicly announced onOctober 10, 2014, Kmart’s information technology team detected on October 9, 2014 that the Kmart store paymentdata system had been criminally breached beginning in early September 2014, that the payment data systems atKmart stores were purposely infected with a new form of malware, and that debit and credit card numbers werepotentially compromised. The Company has settled a class-action lawsuit in the Northern District of Illinois allegingviolations relating to, and harm resulting from this incident and is awaiting final court approval of the settlement.
We are subject to payment-related risks that could increase our operating costs, expose us to fraud or theft,subject us to potential liability and potentially disrupt our business operations.
As a retailer who accepts payments using a variety of methods, including credit and debit cards, PayPal, andgift cards, the Company is subject to rules, regulations, contractual obligations and compliance requirements,including payment network rules and operating guidelines, data security standards and certification requirements,and rules governing electronic funds transfers. The regulatory environment related to information security andprivacy is increasingly rigorous, with new and constantly changing requirements applicable to our business, andcompliance with those requirements could result in additional costs or accelerate these costs. For certain paymentmethods, including credit and debit cards, we pay interchange and other fees, which could increase over time andraise our operating costs. We rely on third parties to provide payment processing services, including the processingof credit cards, debit cards, and other forms of electronic payment. If these companies become unable to providethese services to us, or if their systems are compromised, it could disrupt our business.
The Payment Card Industry (PCI) has established standards for securing payment card data through the PCIData Security Standards (DSS). The Company is required to conduct an annual assessment with a PCI QualifiedSecurity Assessor to assess compliance with the PCI DSS. Based on the 2016 assessment, the Company wasdetermined to be non-compliant with PCI DSS. The Company presently expects to address areas of non-compliance
11

prior to the deadline for the 2017 annual assessment in September 2017. A failure to achieve compliance with PCIDSS could result in the incurrence of fines, penalties or other liabilities by the Company.
Due to the seasonality of our business, our annual operating results would be adversely affected if ourbusiness performs poorly in the fourth quarter.
Due to the seasonality of our business, our operating results vary considerably from quarter to quarter. Wegenerate a high proportion of revenues, operating income and operating cash flows during the fourth quarter of ouryear, which includes the holiday season. In addition, our Company incurs significant additional expenses forinventory, advertising and employees in the period leading up to the months of November and December inanticipation of higher sales volume in the fourth quarter. As a result, our fourth quarter operating results significantlyimpact our annual operating results. Our fourth quarter operating results may fluctuate significantly, based on manyfactors, including holiday spending patterns and weather conditions.
Our sales may fluctuate for a variety of reasons, which could adversely affect our results of operations.
Our business is sensitive to customers' spending patterns, which in turn are subject to prevailing economicconditions. Our sales and results of operations have fluctuated in the past, and we expect them to continue tofluctuate in the future. A variety of other factors affect our sales and financial performance, including:
• actions by our competitors, including opening of new stores in our existing markets or changes to theway these competitors go to market online;
• seasonal fluctuations due to weather conditions; • changes in our merchandise strategy and mix; • changes in population and other demographics; and • timing of our promotional events.
Accordingly, our results for any one quarter are not necessarily indicative of the results to be expected for anyother quarter, and comparable store sales for any particular future period may increase or decrease. For moreinformation on our results of operations, see Management's Discussion and Analysis of Financial Condition andResults of Operations in Item 7 of this Annual Report on Form 10-K.
We rely on foreign sources for significant amounts of our merchandise, and our business may therefore benegatively affected by the risks associated with international trade.
We depend on a large number of products produced in foreign markets. We face risks, including reputationalrisks, associated with sourcing, purchasing, and the delivery of merchandise originating outside the United States,including:
• potential economic and political instability in countries where our suppliers are located; • increases in shipping costs; • manufacturing and transportation delays and interruptions, including without limitation, delays and
interruptions resulting from labor slowdowns, strikes, or other disruptions at any port wheremerchandise we purchase enters the U.S.;
• the availability of raw materials to suppliers;• supplier financial instability;• supplier compliance with applicable laws, including labor and environmental laws, and with our global
compliance program for suppliers and factories;• merchandise safety and quality issues, adverse fluctuations in currency exchange rates; and• changes in U.S. and foreign laws affecting the importation and taxation of goods, including duties,
tariffs and quotas, or changes in the enforcement of those laws.
U.S. foreign trade policies, trade restrictions, other impositions on imported goods, trade sanctions imposedon certain countries, the limitation on the importation of certain types of goods or of goods containing certainmaterials from other countries, and other factors relating to foreign trade are beyond our control. These and otherfactors affecting our suppliers and our access to products could adversely affect our results of operations.
12

We rely on third parties to provide us with services in connection with the administration of certain aspects ofour business.
We have entered into agreements with third-party service providers (both domestic and overseas) to provideprocessing and administrative functions over a broad range of areas, and we may continue to do so in the future.These areas include finance and accounting, information technology, including IT development, call center, humanresources and procurement functions. Services provided by third parties could be interrupted as a result of manyfactors, such as acts of God or contract disputes, and any failure by third parties to provide us with these services ona timely basis or within our service level expectations and performance standards could result in a disruption of ourbusiness. In addition, to the extent we are unable to maintain our outsourcing arrangements, we could incursubstantial costs, including costs associated with hiring new employees or finding an alternative outsourced solution.Moreover, the Company cannot make any assurances that it would be able to arrange for alternate or replacementoutsourcing arrangements on terms as favorable as the Company’s existing agreements, if at all. Any inability on thepart of the Company to do so could negatively affect our results of operations. These outsourcing arrangements alsocarry the risk that the Company will fail to adequately retain the significant internal historical knowledge of ourbusiness and systems that is transferred to the service providers as the employment of the Company's personnel whopossess such knowledge ends.
We could incur charges due to impairment of goodwill, intangible and long-lived assets.
At January 28, 2017, we had goodwill and intangible asset balances of $1.8 billion, which are subject toperiodic testing for impairment. Our long-lived assets, primarily stores, also are subject to periodic testing forimpairment. A significant amount of judgment is involved in the periodic testing. Failure to achieve sufficient levelsof cash flow within our reporting unit, or sales of our branded products or cash flow generated from operations atindividual store locations could result in impairment charges for goodwill and intangible assets or fixed assetimpairment for long-lived assets, which could have a material adverse effect on our reported results of operations.Impairment charges, if any, resulting from the periodic testing are non-cash. A significant decline in the property fairvalues could result in long-lived asset impairment charges. A significant and sustained decline in our stock pricecould result in goodwill and intangible asset impairment charges. During times of financial market volatility,significant judgment is used to determine the underlying cause of the decline and whether stock price declines areshort-term in nature or indicative of an event or change in circumstances. See Notes 12 and 13 of Notes toConsolidated Financial Statements for further information.
Our failure to attract or retain employees, including key personnel, may disrupt our business and adverselyaffect our financial results.
Our business is dependent on our ability to attract, develop, and retain qualified employees, many of whom areentry-level or part-time positions with historically high turnover rates. Our ability to meet our labor needs andcontrol labor costs is subject to external factors such as unemployment levels, prevailing wage rates, collectivebargaining efforts, health care and other benefit costs, changing demographics, and our reputation within the labormarket. If we are unable to attract and retain adequate numbers and an appropriate mix of qualified employees, thequality of service we provide to our customers may decrease and our financial performance may be adverselyaffected. Further, we depend on the contributions of key personnel, including Edward S. Lampert, our Chairman andChief Executive Officer, and other key employees, for our future success. Although certain executives haveemployment agreements with us, changes in our senior management and any future departures of key employeesmay disrupt our business and materially adversely affect our results of operations.
Affiliates of our Chairman and Chief Executive Officer, whose interests may be different than your interests,exert substantial influence over our Company.
Affiliates of Edward S. Lampert, our Chairman and Chief Executive Officer, collectively own approximately48% of the outstanding shares of our common stock at January 28, 2017. These affiliates are controlled, directly orindirectly, by Mr. Lampert. Accordingly, these affiliates, and thus Mr. Lampert, have substantial influence overmany, if not all, actions to be taken or approved by our stockholders, including the election of directors and anytransactions involving a change of control.
13

The interests of these affiliates, which have investments in other companies, including Seritage and our formersubsidiaries, Sears Hometown and Outlet Stores, Inc., Lands' End, Inc. and Sears Canada, may from time to timediverge from the interests of our other stockholders, particularly with regard to new investment opportunities. Thissubstantial influence may also have the effect of discouraging offers to acquire our Company because theconsummation of any such acquisition would likely require the consent of these affiliates.
We may be unable to protect or preserve the image of our brands and our intellectual property rights, whichcould have a negative impact on our business.
We regard our copyrights, service marks, trademarks, trade dress, trade secrets, patents and similar intellectualproperty as critical to our success, particularly those that relate to our private branded merchandise. As such, we relyon trademark and copyright law, patent law, trade secret protection and confidentiality agreements with ourassociates, consultants, vendors, and others to protect our proprietary rights. Nevertheless, the steps we take toprotect our proprietary rights may be inadequate. If we are unable to protect or preserve the value of our trademarks,copyrights, trade secrets, patents or other proprietary rights for any reason, or if we fail to maintain the image of ourbrands due to merchandise and service quality issues, actual or perceived, adverse publicity, governmentalinvestigations or litigation, or other reasons, our brands and reputation could be damaged and we could losemembers and customers.
Our sales and operating results could be adversely affected by product safety concerns or claims concerningthe services we offer.
If our merchandise offerings do not meet applicable safety standards or consumer expectations regardingsafety, we could experience decreased sales, increased costs, and exposure to reputational risk and personal injury,death, or property damage claims related to such merchandise. Such matters may require us to take actions such asproduct recalls and could give rise to government enforcement actions. We also provide various services to ourmembers and customers, which could also give rise to such claims and government actions. Although we maintainliability insurance, we cannot be certain that our coverage will be adequate for liabilities actually incurred or thatinsurance will continue to be available to us on economically reasonable terms, or at all. Reputational damagecaused by and claims arising from real or perceived product safety concerns or from the services we offer couldnegatively affect our business and results of operations.
We may be subject to periodic litigation and other regulatory proceedings. These proceedings may be affectedby changes in laws and government regulations or changes in the enforcement thereof.
From time to time, we may be involved in lawsuits and regulatory actions relating to our business, certain ofwhich may be in jurisdictions with reputations for aggressive application of laws and procedures against corporatedefendants. Some of these actions have the potential for significant statutory penalties, and compensatory, treble orpunitive damages. Our pharmacy, home services and grocery businesses, in particular, are subject to numerousfederal, state and local regulations, and a significant change in, or noncompliance with, these regulations could havea material adverse effect on our compliance costs and results of operations. We are impacted by trends in litigation,including class-action allegations brought under various consumer protection and employment laws, including wageand hour laws, patent infringement claims, and investigations and actions that are based on allegations of untimelycompliance or noncompliance with applicable regulations or statutes. Due to the inherent uncertainties of litigationand regulatory proceedings, we cannot accurately predict the ultimate outcome of any such proceedings. Anunfavorable outcome could have a material adverse impact on our business, financial condition, and results ofoperations. In addition, regardless of the outcome of any litigation or regulatory proceedings, these proceedingscould result in substantial costs and may require that we devote substantial resources to defend our Company.Further, changes in governmental regulations both in the United States and in the other countries where we operatecould have adverse effects on our business and subject us to additional regulatory actions. For a description ofcurrent legal proceedings, see Item 3, Legal Proceedings, as well as Note 18 of Notes to Consolidated FinancialStatements in this Annual Report on Form 10-K.
14

Our pension and postretirement benefit plan obligations are currently underfunded, and we may have tomake significant cash payments to some or all of these plans, which would reduce the cash available for ourbusinesses.
We have unfunded obligations under our domestic pension and postretirement benefit plans. The funded statusof our pension plans is dependent upon many factors, including returns on invested assets, the level of certainmarket interest rates and the discount rate used to determine pension obligations. Unfavorable returns on the planassets or unfavorable changes in applicable laws or regulations could materially change the timing and amount ofrequired plan funding, which would reduce the cash available for our businesses. In addition, a decrease in thediscount rate used to determine pension obligations could result in an increase in the valuation of pensionobligations, which could affect the reported funding status of our pension plans and future contributions, as well asthe periodic pension cost in subsequent years. Moreover, unfavorable regulatory action could materially change thetiming and amount of required plan funding and negatively impact our business operations and impair our businessstrategy.
On March 18, 2016, we entered into a five-year pension plan protection and forbearance agreement with thePension Benefit Guaranty Corporation ("PBGC"), pursuant to which the Company has agreed to continue to protect,or "ring-fence," pursuant to customary covenants, the assets of certain special purpose subsidiaries (the "RelevantSubsidiaries") holding real estate and/or intellectual property assets. Also under the agreement, the RelevantSubsidiaries granted PBGC a springing lien on the ring-fenced assets, which lien will be triggered only by (a) failureto make required contributions to the Company's pension plans (the "Plans"), (b) prohibited transfers of ownershipinterests in the Relevant Subsidiaries, (c) termination events with respect to the Plans, or (d) bankruptcy events withrespect to the Company or certain of its material subsidiaries.
The Company will continue to make required contributions to the Plans, the scheduled amounts of which arenot affected by the arrangement. Under the agreement, the PBGC has agreed to forbear from initiating aninvoluntary termination of the Plans, except upon the occurrence of specified conditions, one of which is based onthe aggregate market value of the Company’s issued and outstanding stock. As of the date of this report, theCompany’s stock price is such that the PBGC would be permitted to cease forbearance. The PBGC has been givennotice in accordance with the terms of the agreement and has not communicated any intention to cease itsforbearance; however, if the PBGC were to initiate an involuntary termination of the Plans, our financial conditioncould be materially and adversely affected.
We may not realize the full anticipated benefits of the recently closed Craftsman Sale transaction.
We may not realize the full anticipated benefits of the recently closed Craftsman Sale transaction (the"Craftsman Sale"), in which case our business, financial results or operations could be adversely affected. Under thePurchase Agreement, during the 15-year period following the closing of the Craftsman Sale, Holdings is entitled toreceive additional contingent payments based on a specified percentage of aggregate worldwide net sales (as definedin the Purchase Agreement) of Stanley Black & Decker and its affiliates of Craftsman-branded products. Thesecontingent payments are dependent upon Stanley successfully maintaining and increasing market demand for, andsales of, Craftsman-branded products, and there can be no assurance regarding the amount or timing of any suchcontingent payments. In addition, following the closing of the Craftsman Sale, we will have the right to continue touse the Licensed IP and sell Craftsman-branded products in certain distribution channels pursuant to a licenseagreement with Stanley. If the license is terminated, or if the terms of the license agreement are otherwise modified,we may not be able to continue to market, procure or sell Craftsman-branded products on favorable terms or at all,and our business may be adversely affected.
Our failure to comply with federal, state, local and international laws, or changes in these laws couldadversely affect our results of operations.
Our business is subject to a wide array of laws and regulations. If we fail to comply with applicable laws andregulations, we could be subject to legal risk, including government enforcement action and class action civillitigation that could increase our cost of doing business. Changes in the regulatory environment regarding topicssuch as privacy and information security, product safety, environmental protection, payment methods and relatedfees, responsible sourcing, supply chain transparency, wage and hour laws, health care mandates and other
15

applicable laws and regulations could also cause our compliance costs to increase and adversely affect our results ofoperations.
Our performance could further be impacted by changes in legislation, trade policies and agreements, energyand environmental standards, and tax laws and regulations. The current U.S. Administration has signaled that it mayalter trade agreements and terms with foreign countries, including limiting trade and/or imposing a tariff on importsfrom certain foreign countries. If any such restrictions or tariffs are imposed on products that we import, we may berequired to raise our prices, which could result in decreased sales. Further, changes in environmental and energyefficiency standards and regulations applicable to products that we develop and/or sell, and potential changes in thesize and availability of tax incentives applicable to such products, may impact the types, characteristics, andconsumer interest in such products, which may negatively impact our results of operations. Moreover, futurelegislation or regulations, including environmental matters, product certification, product liability, tariffs, duties,taxes, tax incentives and other matters, may impact our results. Major developments in tax policy or trade relations,such as the disallowance of tax deductions for imported merchandise or the imposition of unilateral tariffs onimported products, could have a material adverse effect on our business, results of operations and liquidity. Inaddition, various corporate tax reform proposals being discussed on Capitol Hill and in the U.S. Administrationcould impact our Company. A reduction in corporate income tax rates at the Federal level could be favorable to ourfinancial position, while other ideas such as a border tax could dramatically increase our tax burden and raise thecosts of goods for our consumers.
Weather conditions and natural disasters may impact consumer shopping patterns and could adversely affectour results of operations.
Significant weather conditions where our stores are located could negatively affect the Company's businessand results of operations. Heavy snowfall, ice storms, rainstorms or other extreme weather conditions over aprolonged period could make it difficult for our members and customers to travel to our stores, thus leading todecreased sales. Our business is also susceptible to unseasonable weather conditions, such as unseasonably warmtemperatures during the winter season or cool weather during the summer season, which could reduce demand forcertain inventory and compromise our efforts to predict and manage inventory levels effectively. In addition,extreme weather conditions could result in disruption or delay of production and delivery of materials and productsin our supply chain. In addition, natural disasters such as hurricanes, tornadoes and earthquakes, or a combination ofthese or other factors, could damage or destroy our facilities or make it difficult for members and customers to travelto our stores, thereby negatively affecting our business and results of operations as well as causing us to incursignificant expenses to repair or replace such facilities.
Our stock price has been and may continue to be volatile.
The market price of our common stock has fluctuated substantially and may continue to fluctuate significantly.Future announcements or disclosures concerning us or any of our competitors, our strategic initiatives, our sales andprofitability, any quarterly variations in actual or anticipated operating results or comparable sales, any failure tomeet analysts' expectations and sales of large blocks of our common stock, among other factors, could cause themarket price of our common stock to fluctuate substantially.
Increases in the cost of employee benefits could impact our financial results and cash flow.
Our expenses relating to employee health benefits are significant. Unfavorable changes in the cost of suchbenefits could negatively affect our financial results and cash flow. Healthcare costs have risen significantly inrecent years, and recent legislative and private sector initiatives regarding healthcare reform have resulted, and couldcontinue to result in significant changes to the U.S. healthcare system. Due to the breadth and complexity of thehealthcare reform legislation, and the potential for change in this regard under the current U.S. Administration, weare unable at this time to fully determine the impact that further healthcare reform will have on our employee healthbenefit plans.
16
Item 1B. Unresolved Staff Comments
Not applicable.

Item 2. Properties
The following table summarizes the locations of our Kmart and Sears Domestic stores at January 28, 2017:
Sears Domestic
State / Territory Kmart Full-line StoresSpecialty
StoresAlabama . . . . . . . . . . . . . . . . . . . . . . . . . . . . . . . . . . . . . . . . . . . . . 8 5 —Alaska . . . . . . . . . . . . . . . . . . . . . . . . . . . . . . . . . . . . . . . . . . . . . . . — 3 —Arizona . . . . . . . . . . . . . . . . . . . . . . . . . . . . . . . . . . . . . . . . . . . . . . 9 13 —Arkansas . . . . . . . . . . . . . . . . . . . . . . . . . . . . . . . . . . . . . . . . . . . . . 3 5 —California. . . . . . . . . . . . . . . . . . . . . . . . . . . . . . . . . . . . . . . . . . . . . 72 75 4Colorado . . . . . . . . . . . . . . . . . . . . . . . . . . . . . . . . . . . . . . . . . . . . . 8 10 1Connecticut . . . . . . . . . . . . . . . . . . . . . . . . . . . . . . . . . . . . . . . . . . . 5 7 —Delaware . . . . . . . . . . . . . . . . . . . . . . . . . . . . . . . . . . . . . . . . . . . . . 4 3 —Florida . . . . . . . . . . . . . . . . . . . . . . . . . . . . . . . . . . . . . . . . . . . . . . . 39 48 1Georgia . . . . . . . . . . . . . . . . . . . . . . . . . . . . . . . . . . . . . . . . . . . . . . 18 18 —Hawaii . . . . . . . . . . . . . . . . . . . . . . . . . . . . . . . . . . . . . . . . . . . . . . . 5 4 —Idaho . . . . . . . . . . . . . . . . . . . . . . . . . . . . . . . . . . . . . . . . . . . . . . . . 5 4 —Illinois . . . . . . . . . . . . . . . . . . . . . . . . . . . . . . . . . . . . . . . . . . . . . . . 19 24 5Indiana. . . . . . . . . . . . . . . . . . . . . . . . . . . . . . . . . . . . . . . . . . . . . . . 17 13 1Iowa. . . . . . . . . . . . . . . . . . . . . . . . . . . . . . . . . . . . . . . . . . . . . . . . . 15 5 1Kansas . . . . . . . . . . . . . . . . . . . . . . . . . . . . . . . . . . . . . . . . . . . . . . . 6 5 1Kentucky . . . . . . . . . . . . . . . . . . . . . . . . . . . . . . . . . . . . . . . . . . . . . 18 6 —Louisiana . . . . . . . . . . . . . . . . . . . . . . . . . . . . . . . . . . . . . . . . . . . . . 6 11 1Maine. . . . . . . . . . . . . . . . . . . . . . . . . . . . . . . . . . . . . . . . . . . . . . . . 5 4 —Maryland . . . . . . . . . . . . . . . . . . . . . . . . . . . . . . . . . . . . . . . . . . . . . 16 18 —Massachusetts . . . . . . . . . . . . . . . . . . . . . . . . . . . . . . . . . . . . . . . . . 14 20 —Michigan . . . . . . . . . . . . . . . . . . . . . . . . . . . . . . . . . . . . . . . . . . . . . 38 19 —Minnesota . . . . . . . . . . . . . . . . . . . . . . . . . . . . . . . . . . . . . . . . . . . . 7 10 —Mississippi. . . . . . . . . . . . . . . . . . . . . . . . . . . . . . . . . . . . . . . . . . . . 2 4 —Missouri. . . . . . . . . . . . . . . . . . . . . . . . . . . . . . . . . . . . . . . . . . . . . . 15 11 —Montana. . . . . . . . . . . . . . . . . . . . . . . . . . . . . . . . . . . . . . . . . . . . . . 7 1 —Nebraska . . . . . . . . . . . . . . . . . . . . . . . . . . . . . . . . . . . . . . . . . . . . . 2 4 —Nevada. . . . . . . . . . . . . . . . . . . . . . . . . . . . . . . . . . . . . . . . . . . . . . . 10 5 1New Hampshire. . . . . . . . . . . . . . . . . . . . . . . . . . . . . . . . . . . . . . . . 4 6 —New Jersey . . . . . . . . . . . . . . . . . . . . . . . . . . . . . . . . . . . . . . . . . . . 25 20 1New Mexico . . . . . . . . . . . . . . . . . . . . . . . . . . . . . . . . . . . . . . . . . . 9 7 —New York. . . . . . . . . . . . . . . . . . . . . . . . . . . . . . . . . . . . . . . . . . . . . 42 35 4North Carolina. . . . . . . . . . . . . . . . . . . . . . . . . . . . . . . . . . . . . . . . . 21 18 —North Dakota . . . . . . . . . . . . . . . . . . . . . . . . . . . . . . . . . . . . . . . . . . 5 4 —Ohio. . . . . . . . . . . . . . . . . . . . . . . . . . . . . . . . . . . . . . . . . . . . . . . . . 33 30 —Oklahoma . . . . . . . . . . . . . . . . . . . . . . . . . . . . . . . . . . . . . . . . . . . . 6 6 —Oregon. . . . . . . . . . . . . . . . . . . . . . . . . . . . . . . . . . . . . . . . . . . . . . . 7 6 1Pennsylvania . . . . . . . . . . . . . . . . . . . . . . . . . . . . . . . . . . . . . . . . . . 72 31 —Rhode Island . . . . . . . . . . . . . . . . . . . . . . . . . . . . . . . . . . . . . . . . . . 1 2 —South Carolina. . . . . . . . . . . . . . . . . . . . . . . . . . . . . . . . . . . . . . . . . 14 9 —South Dakota . . . . . . . . . . . . . . . . . . . . . . . . . . . . . . . . . . . . . . . . . . 3 2 —Tennessee . . . . . . . . . . . . . . . . . . . . . . . . . . . . . . . . . . . . . . . . . . . . 14 14 —Texas . . . . . . . . . . . . . . . . . . . . . . . . . . . . . . . . . . . . . . . . . . . . . . . . 11 56 1Utah . . . . . . . . . . . . . . . . . . . . . . . . . . . . . . . . . . . . . . . . . . . . . . . . . 5 5 1Vermont . . . . . . . . . . . . . . . . . . . . . . . . . . . . . . . . . . . . . . . . . . . . . . 2 1 —Virginia . . . . . . . . . . . . . . . . . . . . . . . . . . . . . . . . . . . . . . . . . . . . . . 19 19 —Washington . . . . . . . . . . . . . . . . . . . . . . . . . . . . . . . . . . . . . . . . . . . 9 17 1West Virginia . . . . . . . . . . . . . . . . . . . . . . . . . . . . . . . . . . . . . . . . . . 14 6 —Wisconsin . . . . . . . . . . . . . . . . . . . . . . . . . . . . . . . . . . . . . . . . . . . . 13 10 —Wyoming . . . . . . . . . . . . . . . . . . . . . . . . . . . . . . . . . . . . . . . . . . . . . 7 2 —Puerto Rico . . . . . . . . . . . . . . . . . . . . . . . . . . . . . . . . . . . . . . . . . . . 21 9 —U.S. Virgin Islands . . . . . . . . . . . . . . . . . . . . . . . . . . . . . . . . . . . . . 4 — —Guam . . . . . . . . . . . . . . . . . . . . . . . . . . . . . . . . . . . . . . . . . . . . . . . . 1 — —Totals . . . . . . . . . . . . . . . . . . . . . . . . . . . . . . . . . . . . . . . . . . . . . . . . 735 670 25
17
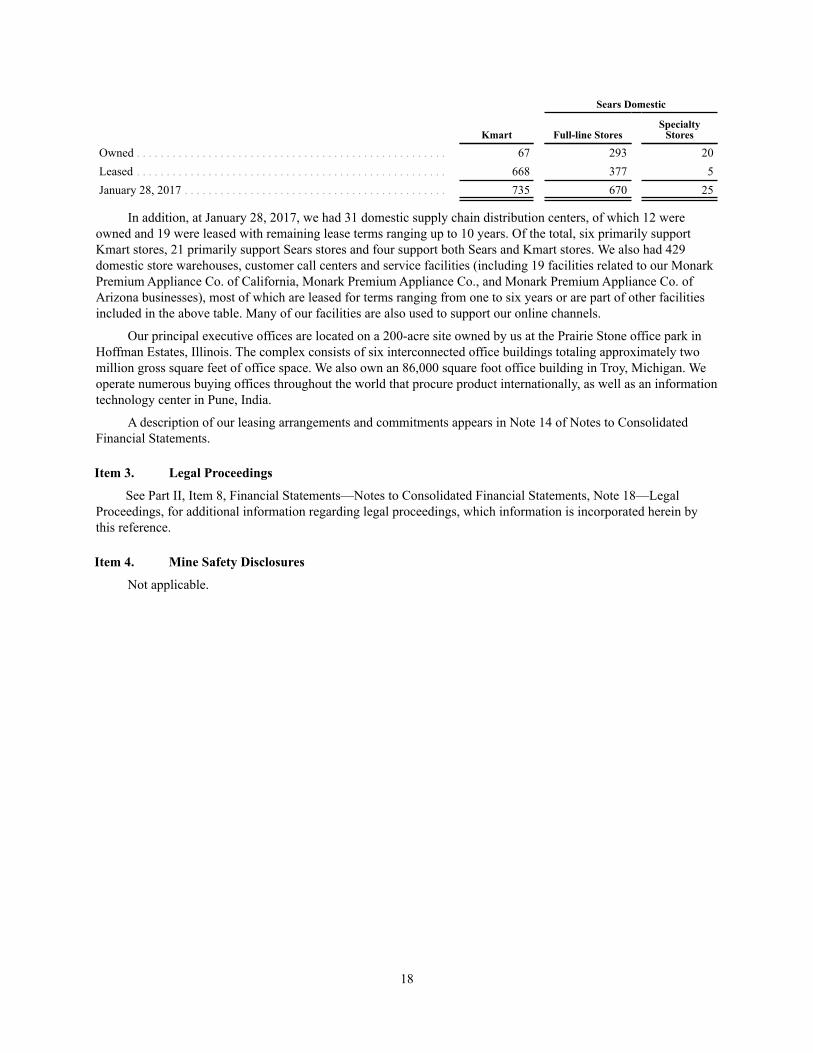
Sears Domestic
Kmart Full-line StoresSpecialty
Stores
Owned . . . . . . . . . . . . . . . . . . . . . . . . . . . . . . . . . . . . . . . . . . . . . . . . . . . . 67 293 20Leased . . . . . . . . . . . . . . . . . . . . . . . . . . . . . . . . . . . . . . . . . . . . . . . . . . . . 668 377 5January 28, 2017 . . . . . . . . . . . . . . . . . . . . . . . . . . . . . . . . . . . . . . . . . . . . 735 670 25
In addition, at January 28, 2017, we had 31 domestic supply chain distribution centers, of which 12 wereowned and 19 were leased with remaining lease terms ranging up to 10 years. Of the total, six primarily supportKmart stores, 21 primarily support Sears stores and four support both Sears and Kmart stores. We also had 429domestic store warehouses, customer call centers and service facilities (including 19 facilities related to our MonarkPremium Appliance Co. of California, Monark Premium Appliance Co., and Monark Premium Appliance Co. ofArizona businesses), most of which are leased for terms ranging from one to six years or are part of other facilitiesincluded in the above table. Many of our facilities are also used to support our online channels.
Our principal executive offices are located on a 200-acre site owned by us at the Prairie Stone office park inHoffman Estates, Illinois. The complex consists of six interconnected office buildings totaling approximately twomillion gross square feet of office space. We also own an 86,000 square foot office building in Troy, Michigan. Weoperate numerous buying offices throughout the world that procure product internationally, as well as an informationtechnology center in Pune, India.
A description of our leasing arrangements and commitments appears in Note 14 of Notes to ConsolidatedFinancial Statements.
18
Item 3. Legal Proceedings
See Part II, Item 8, Financial Statements—Notes to Consolidated Financial Statements, Note 18—LegalProceedings, for additional information regarding legal proceedings, which information is incorporated herein bythis reference.
Item 4. Mine Safety Disclosures
Not applicable.

EXECUTIVE OFFICERS OF THE REGISTRANT
The following table and information sets forth the names of our executive officers, their current positions andoffices with the Company, the date they first became executive officers of the Company, their current ages, and theirprincipal employment during the past five years.
Name Position
Date FirstBecame anExecutive
Officer Age
Edward S. Lampert Chairman of the Board and Chief Executive Officer 2013 54Jason M. Hollar Chief Financial Officer 2016 43Eric D. Jaffe Senior Vice President, Shop Your Way 2016 29Girish Lakshman President, Fulfillment - Supply Chain and Sourcing 2015 52Leena Munjal Senior Vice President, Customer Experience and Integrated Retail 2013 40David Pastrana President, Apparel 2016 40James Politeski President, Home Appliances and Consumer Electronics 2016 49Robert A. Riecker Controller and Head of Capital Markets Activities 2012 52Sean Skelley President, Home Services 2016 50Stephan Zoll President, Online 2016 46__________________
Mr. Lampert has served as Chairman of the Company's Board of Directors since 2004 and as our ChiefExecutive Officer since February 2013. He also is the Chairman and Chief Executive Officer of ESLInvestments, Inc., which he founded in April 1988.
Mr. Hollar was appointed to his current position in October 2016, and had served as Senior Vice President,Finance of the Company since October 2014. Prior to joining the Company, he worked for Delphi Automotive PLC,serving from December 2013 to September 2014 as Vice President and Corporate Controller and from April 2011 toNovember 2013 as CFO, Powertrain Systems and Delphi Europe, Middle East and Africa.
Mr. Jaffe has served in his current position, as Senior Vice President, Shop Your Way, since January 2013.Prior to joining the Company, he served as an Investment Analyst at Rand Group from 2012-2013, and as anInvestment Analyst at ESL Investments from 2010-2012.
Mr. Lakshman joined the Company as President, Fulfillment - Supply Chain and Sourcing in September 2015.Prior to joining the Company, he served in a variety of roles with Amazon.com, Inc. since July 1999, most recentlyas Vice President of Worldwide Transportation Strategy, Technology and Customer Returns. Mr. Lakshman serves asa director of Grubhub, Inc.
Ms. Munjal was appointed to her current position in October 2012. She was appointed as Divisional VicePresident, Integrated Retail and Member Experience, in July 2011 and was promoted to Vice President in June 2012.From October 2009 to June 2011, she served as Divisional Vice President, and Chief of Staff, Office of theChairman, and served as Chief of Staff, Office of the CEO, from November 2007 to November 2009. Ms. Munjaljoined Sears as Director, Information Technology, in March 2003.
Mr. Pastrana was appointed to his current position in May 2015. He joined the Company as Chief of Staff inFebruary 2014. Prior to joining the Company, he served as President, North America Region at Topshop USA from2013-2014, and as Managing Director at Inditex USA from 2010-2013.
Mr. Politeski joined the Company as President, Home Appliances and Consumer Electronics in September2016. Prior to joining the Company, he served as President of Samsung Electronics Canada from 2011-2015, andSenior Vice President of Samsung USA from 2009-2011.
Mr. Riecker was appointed to his current position in October 2016. He joined the Company as AssistantController in October 2005 and served as Vice President and Assistant Controller from May 2007 to October 2011.From October 2011 until his election as Vice President, Controller and Chief Accounting Officer in January 2012, heserved as the Company's Vice President, Internal Audit.
19

Mr. Skelley joined the Company in October 2015 in his current role as President, Home Services. Prior tojoining the Company, he served as Senior Vice President of Service Solutions at Asurion from 2011-2013.
Dr. Zoll joined the Company as President, Online in June 2016. Prior to joining the Company he held severalpositions at Ebay Germany, including Vice President from 2013-2016, and Senior Director prior to 2013.
20

PART II
21
Item 5. Market for Registrant's Common Equity, Related Stockholder Matters and Issuer Purchases ofEquity Securities
Holdings' common stock is quoted on The NASDAQ Stock Market under the ticker symbol SHLD. Therewere 10,361 shareholders of record at March 16, 2017. The quarterly high and low sales prices for Holdings'common stock are set forth below.
Fiscal Year 2016
Sears HoldingsFirst
QuarterSecondQuarter
ThirdQuarter
FourthQuarter
Common stock price High . . . . . . . . . . . . . . . . . . . . . . . . . . . . . . . . . . . . . . . . . . . . . . . $ 19.12 $ 16.55 $ 18.18 $ 13.84 Low . . . . . . . . . . . . . . . . . . . . . . . . . . . . . . . . . . . . . . . . . . . . . . . $ 14.05 $ 10.52 $ 10.50 $ 7.08
Fiscal Year 2015
Sears HoldingsFirst
QuarterSecondQuarter
ThirdQuarter
FourthQuarter
Common stock price High . . . . . . . . . . . . . . . . . . . . . . . . . . . . . . . . . . . . . . . . . . . . . . . $ 46.23 $ 44.72 $ 28.31 $ 25.24 Low . . . . . . . . . . . . . . . . . . . . . . . . . . . . . . . . . . . . . . . . . . . . . . . $ 31.35 $ 20.86 $ 19.08 $ 16.27
Holdings has not paid cash dividends over the two most recent fiscal years and does not expect to pay cashdividends in the foreseeable future.
Equity Compensation Plan Information
The following table reflects information about securities authorized for issuance under our equitycompensation plans at January 28, 2017.
Plan Category
Number of securitiesto be issued upon
exercise ofoutstanding options,
warrants andrights
Weighted-averageexercise price of
outstandingoptions,
warrants andrights
Number of securitiesremaining available for
future issuanceunder equity
compensation plans*
Equity compensation plans approved by security holders . . — — 4,375,623Equity compensation plans not approved by security
holders. . . . . . . . . . . . . . . . . . . . . . . . . . . . . . . . . . . . . . . — — —Total . . . . . . . . . . . . . . . . . . . . . . . . . . . . . . . . . . . . . . . . . . . — — 4,375,623
__________________
* Represents shares of common stock that may be issued pursuant to our 2013 Stock Plan (our 2006 Stock Plan has been closed).Awards under the 2013 Stock Plan may be restricted stock, stock unit awards, incentive stock options, nonqualified stock options,stock appreciation rights, or certain other stock-based awards. The 2013 Stock Plan also allows common stock of Holdings to beawarded in settlement of an incentive award under the Sears Holdings Corporation Umbrella Incentive Program (and anyincentive program established thereunder). The shares shown exclude shares covered by an outstanding plan award that,subsequent to January 28, 2017, ultimately are not delivered on an unrestricted basis (for example, because the award is forfeited,canceled, settled in cash or used to satisfy tax withholding obligations).

Stock Performance Graph
Comparison of Five-Year Cumulative Stockholder Return
The following graph compares the cumulative total return to stockholders on Holdings' common stock fromJanuary 27, 2012 through January 27, 2017, the last trading day before the end of fiscal year 2016, based on themarket prices at the last trading day before the end of each fiscal year through and including fiscal year 2016, withthe return on the S&P 500 Index, the S&P 500 Retailing Index and the S&P 500 Department Stores Index for thesame period. The graph assumes an initial investment of $100 on January 27, 2012 in each of our common stock, theS&P 500 Index, the S&P Retailing Index and the S&P 500 Department Stores Index. The graph further assumesreinvestment of the value of: (i) subscription rights to purchase shares of common stock of Sears Hometown andOutlet Stores, Inc. on September 13, 2012, the ex-distribution date of the distribution of such rights to Holdings’shareholders; (ii) common shares of Sears Canada on November 13, 2012, the distribution date of such shares toHoldings’ shareholders; (iii) shares of Lands' End on April 7, 2014, the ex-distribution date of the distribution ofsuch shares to Holdings' shareholders; (iv) subscription rights to purchase shares of common stock of Sears Canadaon October 17, 2014, the ex-distribution date of the distribution of such rights to Holdings' shareholders; (v)subscription rights to purchase up to $625 million in aggregate principal amount of 8% senior unsecured notes due2019 and warrants to purchase shares of Holdings' common stock on November 3, 2014, the ex-distribution date ofthe distribution of such rights to Holdings' shareholders; and (vi) subscription rights to purchase shares of commonstock of Seritage Growth Properties on June 12, 2015, the distribution date of such rights to Holdings’ shareholders.
The S&P 500 Retailing Index consists of companies included in the S&P 500 Index in the broadly definedretail sector, which includes competing retailers of softlines (apparel and domestics) and hardlines (appliances,electronics and home improvement products), as well as food and drug retailers. The S&P 500 Department StoresIndex consists primarily of department stores that compete with our full-line stores.
Sears Holdings S&P 500 Index
S&P 500 Retailing Index S&P 500 Department Stores Index
$350.00
$300.00
$250.00
$200.00
$150.00
$100.00
$50.00
$0.00
01/27/12 2/1/13 1/31/14 1/30/15 1/29/16 1/27/17
Jan 27,2012
Feb 1,2013
Jan 31,2014
Jan 30,2015
Jan 29,2016
Jan 27,2017
Sears Holdings . . . . . . . . . . . . . . . . . . . . . . . $100.00 $121.49 $ 92.93 $107.82 $ 68.95 $ 30.18S&P 500 Index . . . . . . . . . . . . . . . . . . . . . . . $100.00 $117.59 $141.45 $161.56 $160.47 $193.94S&P 500 Retailing Index. . . . . . . . . . . . . . . . $100.00 $127.09 $159.26 $191.26 $223.38 $264.82S&P 500 Department Stores Index . . . . . . . . $100.00 $103.09 $119.64 $149.27 $107.64 $ 86.82
22

Purchase of Equity Securities
During the quarter ended January 28, 2017, we did not repurchase any shares of our common stock under ourcommon share repurchase program. At January 28, 2017, we had approximately $504 million of remainingauthorization under the program.
TotalNumber of
SharesPurchased(1)
AveragePrice Paidper Share
Total Number ofShares Purchased
as Part ofPublicly
AnnouncedProgram(2)
AveragePrice Paidper Share
forPublicly
AnnouncedProgram
ApproximateDollar Value of
Shares that MayYet Be Purchased
Underthe Program
October 30, 2016 to November 26,2016 . . . . . . . . . . . . . . . . . . . . . . . . . . — $ — — $ —
November 27, 2016 to December 31,2016 . . . . . . . . . . . . . . . . . . . . . . . . . . — — — —
January 1, 2017 to January 28, 2017 . . . — — — —Total . . . . . . . . . . . . . . . . . . . . . . . . . . . . — $ — — $ — $ 503,907,832__________________
(1) Consists entirely of 0 shares acquired from associates to meet withholding tax requirements from the vestingof restricted stock.
(2) Our common share repurchase program was initially announced on September 14, 2005 and has a totalauthorization since inception of the program of $6.5 billion, including the authorizations to purchase up to anadditional $500 million of common stock on each of December 17, 2009 and May 2, 2011. The program hasno stated expiration date.
The Amended Domestic Credit Agreement (described in Management's Discussion and Analysis of FinancialCondition and Results of Operations - Uses and Sources of Liquidity section below) limits our ability to makerestricted payments, including dividends and share repurchases, subject to specified exceptions that are available if,in each case, no event of default under the credit facility exists immediately before or after giving effect to therestricted payment. These include exceptions that require that projected availability under the credit facility, asdefined, is at least 15%, exceptions that may be subject to certain maximum amounts and an exception that requiresthat the restricted payment is funded from cash on hand and not from borrowings under the credit facility. Further,the Amended Domestic Credit Agreement includes customary covenants that restrict our ability to makedispositions, prepay debt and make investments, subject, in each case, to various exceptions. The AmendedDomestic Credit Agreement also imposes various other requirements, which take effect if availability falls belowdesignated thresholds, including a cash dominion requirement and a requirement that the fixed charge ratio at thelast day of any quarter be not less than 1.0 to 1.0.
23
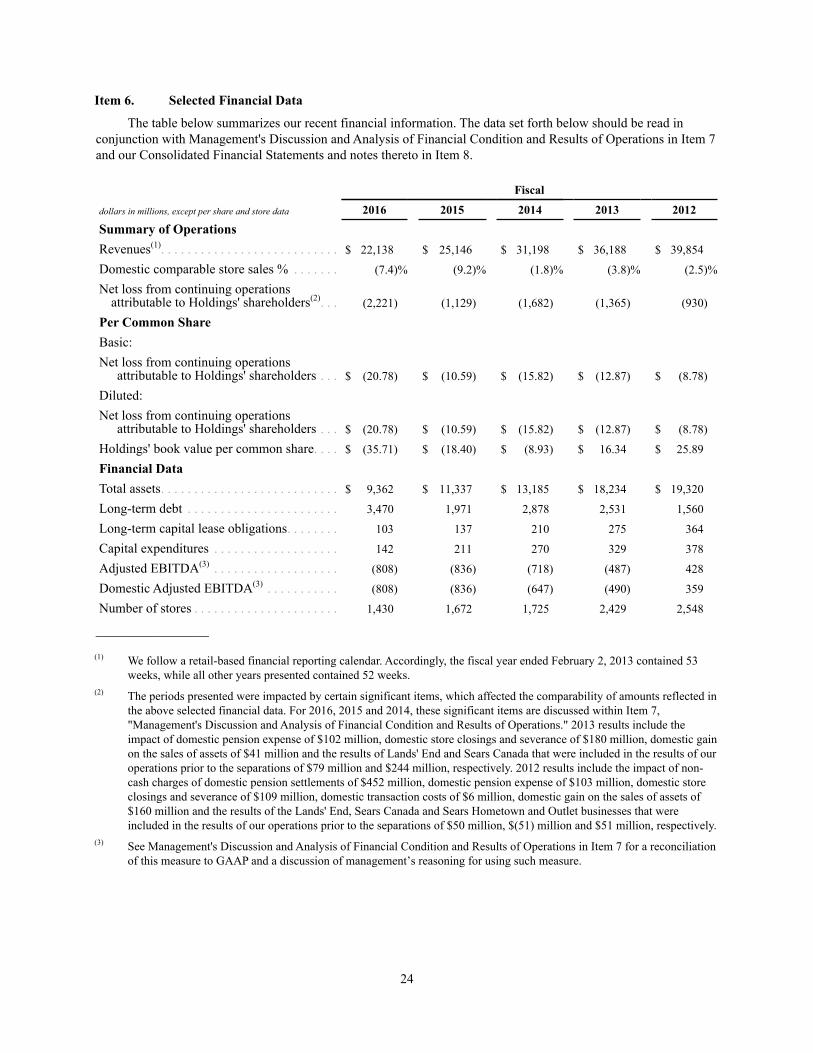
Item 6. Selected Financial Data
The table below summarizes our recent financial information. The data set forth below should be read inconjunction with Management's Discussion and Analysis of Financial Condition and Results of Operations in Item 7and our Consolidated Financial Statements and notes thereto in Item 8.
Fiscal
dollars in millions, except per share and store data 2016 2015 2014 2013 2012Summary of OperationsRevenues(1). . . . . . . . . . . . . . . . . . . . . . . . . . . $ 22,138 $ 25,146 $ 31,198 $ 36,188 $ 39,854
Domestic comparable store sales % . . . . . . . (7.4)% (9.2)% (1.8)% (3.8)% (2.5)%Net loss from continuing operations
attributable to Holdings' shareholders(2). . . (2,221) (1,129) (1,682) (1,365) (930)
Per Common ShareBasic:Net loss from continuing operations
attributable to Holdings' shareholders . . . $ (20.78) $ (10.59) $ (15.82) $ (12.87) $ (8.78)Diluted:Net loss from continuing operations
attributable to Holdings' shareholders . . . $ (20.78) $ (10.59) $ (15.82) $ (12.87) $ (8.78)Holdings' book value per common share. . . . $ (35.71) $ (18.40) $ (8.93) $ 16.34 $ 25.89
Financial DataTotal assets. . . . . . . . . . . . . . . . . . . . . . . . . . . $ 9,362 $ 11,337 $ 13,185 $ 18,234 $ 19,320
Long-term debt . . . . . . . . . . . . . . . . . . . . . . . 3,470 1,971 2,878 2,531 1,560
Long-term capital lease obligations. . . . . . . . 103 137 210 275 364
Capital expenditures . . . . . . . . . . . . . . . . . . . 142 211 270 329 378
Adjusted EBITDA(3) . . . . . . . . . . . . . . . . . . . (808) (836) (718) (487) 428
Domestic Adjusted EBITDA(3) . . . . . . . . . . . (808) (836) (647) (490) 359
Number of stores . . . . . . . . . . . . . . . . . . . . . . 1,430 1,672 1,725 2,429 2,548
_________________
(1) We follow a retail-based financial reporting calendar. Accordingly, the fiscal year ended February 2, 2013 contained 53weeks, while all other years presented contained 52 weeks.
(2) The periods presented were impacted by certain significant items, which affected the comparability of amounts reflected inthe above selected financial data. For 2016, 2015 and 2014, these significant items are discussed within Item 7,"Management's Discussion and Analysis of Financial Condition and Results of Operations." 2013 results include theimpact of domestic pension expense of $102 million, domestic store closings and severance of $180 million, domestic gainon the sales of assets of $41 million and the results of Lands' End and Sears Canada that were included in the results of ouroperations prior to the separations of $79 million and $244 million, respectively. 2012 results include the impact of non-cash charges of domestic pension settlements of $452 million, domestic pension expense of $103 million, domestic storeclosings and severance of $109 million, domestic transaction costs of $6 million, domestic gain on the sales of assets of$160 million and the results of the Lands' End, Sears Canada and Sears Hometown and Outlet businesses that wereincluded in the results of our operations prior to the separations of $50 million, $(51) million and $51 million, respectively.
(3) See Management's Discussion and Analysis of Financial Condition and Results of Operations in Item 7 for a reconciliationof this measure to GAAP and a discussion of management’s reasoning for using such measure.
24
Item 7. Management's Discussion and Analysis of Financial Condition and Results of Operations
We have divided our Management's Discussion and Analysis of Financial Condition and Results of Operationsinto the following six sections:
• Overview of Holdings
• Results of Operations:
Fiscal Year
Holdings' Consolidated Results
Business Segment Results
• Analysis of Consolidated Financial Condition
• Contractual Obligations and Off-Balance Sheet Arrangements
• Application of Critical Accounting Policies and Estimates
• Cautionary Statement Regarding Forward-Looking Information
The discussion that follows should be read in conjunction with the Consolidated Financial Statements andnotes thereto included in Item 8.
25
OVERVIEW OF HOLDINGS
Holdings, the parent company of Kmart and Sears, was formed in connection with the March 24, 2005 Mergerof these two companies. We are an integrated retailer with significant physical and intangible assets, as well asvirtual capabilities enabled through technology. We operate a national network of stores, with 1,430 full-line andspecialty retail stores in the United States, operating as Kmart and Sears. Further, we operate a number of websitesunder the Sears.com and Kmart.com banners which offer millions of products and provide the capability for ourmembers and customers to engage in cross-channel transactions such as free store pickup; buy in store/ship to home;and buy online, return in store. We are also the home of Shop Your Way, a free member-based social shoppingplatform that offers rewards, personalized services and a unique experience. Shop Your Way connects all of the waysmembers shop - in store, at home, online and by phone.
Through the third quarter of 2014, we conducted our operations in three business segments: Kmart, SearsDomestic and Sears Canada. As a result of the de-consolidation of Sears Canada as described in Note 2 of Notes tothe Consolidated Financial Statements, Sears Canada is no longer an operating or reportable segment. We nowconduct our operations in two business segments: Kmart and Sears Domestic. The nature of operations conductedwithin each of these segments is discussed within the Business Segments section of Item 1 in this Annual Report onForm 10-K. Our business segments have been determined in accordance with accounting standards regarding thedetermination, and reporting, of business segments.
RESULTS OF OPERATIONS
Fiscal Year
Our fiscal year end is the Saturday closest to January 31 each year. Fiscal years 2016, 2015 and 2014 consistedof 52 weeks. Unless otherwise stated, references to years in this report relate to fiscal years rather than to calendaryears.

Holdings' Consolidated Results
Holdings' consolidated results of operations for 2016, 2015 and 2014 are summarized as follows:
millions, except per share data 2016 2015 2014
REVENUESMerchandise sales and services . . . . . . . . . . . . . . . . . . . . . . . . . . . . . . . $ 22,138 $ 25,146 $ 31,198
COSTS AND EXPENSESCost of sales, buying and occupancy . . . . . . . . . . . . . . . . . . . . . . . . . . . 17,452 19,336 24,049Gross margin dollars. . . . . . . . . . . . . . . . . . . . . . . . . . . . . . . . . . . . . . . . 4,686 5,810 7,149Gross margin rate . . . . . . . . . . . . . . . . . . . . . . . . . . . . . . . . . . . . . . . . . . 21.2% 23.1% 22.9%Selling and administrative . . . . . . . . . . . . . . . . . . . . . . . . . . . . . . . . . . . 6,109 6,857 8,220Selling and administrative expense as a percentage of revenues . . . . . . 27.6% 27.3% 26.3%Depreciation and amortization . . . . . . . . . . . . . . . . . . . . . . . . . . . . . . . . 375 422 581Impairment charges . . . . . . . . . . . . . . . . . . . . . . . . . . . . . . . . . . . . . . . . 427 274 63Gain on sales of assets . . . . . . . . . . . . . . . . . . . . . . . . . . . . . . . . . . . . . . (247) (743) (207)
Total costs and expenses . . . . . . . . . . . . . . . . . . . . . . . . . . . . . . . . . 24,116 26,146 32,706Operating loss . . . . . . . . . . . . . . . . . . . . . . . . . . . . . . . . . . . . . . . . . . . . . (1,978) (1,000) (1,508)Interest expense . . . . . . . . . . . . . . . . . . . . . . . . . . . . . . . . . . . . . . . . . . . (404) (323) (313)Interest and investment income (loss) . . . . . . . . . . . . . . . . . . . . . . . . . . (26) (62) 132Other income . . . . . . . . . . . . . . . . . . . . . . . . . . . . . . . . . . . . . . . . . . . . . 13 — 4Loss before income taxes . . . . . . . . . . . . . . . . . . . . . . . . . . . . . . . . . . . . (2,395) (1,385) (1,685)Income tax (expense) benefit . . . . . . . . . . . . . . . . . . . . . . . . . . . . . . . . . 174 257 (125)Net loss . . . . . . . . . . . . . . . . . . . . . . . . . . . . . . . . . . . . . . . . . . . . . . . . . . (2,221) (1,128) (1,810)(Income) loss attributable to noncontrolling interests . . . . . . . . . . . . . . — (1) 128NET LOSS ATTRIBUTABLE TO HOLDINGS’
SHAREHOLDERS . . . . . . . . . . . . . . . . . . . . . . . . . . . . . . . . . . . . $ (2,221) $ (1,129) $ (1,682)NET LOSS PER COMMON SHARE ATTRIBUTABLE TO
HOLDINGS’ SHAREHOLDERSDiluted loss per share . . . . . . . . . . . . . . . . . . . . . . . . . . . . . . . . . . . . . . . $ (20.78) $ (10.59) $ (15.82)Diluted weighted average common shares outstanding . . . . . . . . . . . . . 106.9 106.6 106.3
26

References to comparable store sales amounts within the following discussion include sales for all storesoperating for a period of at least 12 full months, including remodeled and expanded stores, but excluding storerelocations and stores that have undergone format changes. Comparable store sales amounts include sales fromsears.com and kmart.com shipped directly to customers. These online sales resulted in a negative impact to ourcomparable store sales results of approximately 20 basis points and 10 basis points for 2016 and 2015, respectively.In addition, comparable store sales have been adjusted for the change in the unshipped sales reserves recorded at theend of each reporting period, which did not have any impact in 2016 and resulted in a negative impact of 10 basispoints for 2015.
Comparable store sales results for 2016 were calculated based on the 52-week period ended January 28, 2017as compared to the comparable 52-week period in the prior year, while comparable store sales results for 2015 werecalculated based on the 52-week period ended January 30, 2016 as compared to the comparable 52-week period inthe prior year.
27
2016 Compared to 2015
Net Loss Attributable to Holdings' Shareholders
We recorded a net loss attributable to Holdings' shareholders of $2.2 billion ($20.78 loss per diluted share) and$1.1 billion ($10.59 loss per diluted share) for 2016 and 2015, respectively. Our results for 2016 and 2015 wereaffected by a number of significant items. Our net loss as adjusted for these significant items, which are furtherdiscussed below, was $887 million ($8.30 loss per diluted share) for 2016 and $953 million ($8.94 loss per dilutedshare) for 2015. The decrease in adjusted net loss for the year primarily reflected a decrease in selling andadministrative expenses, partially offset by a decline in gross margin, which was driven by the decline in revenuesand a decline in gross margin rate.
In addition to our net loss attributable to Holdings' shareholders determined in accordance with GenerallyAccepted Accounting Principles ("GAAP"), for purposes of evaluating operating performance, we use AdjustedEarnings Before Interest, Taxes, Depreciation and Amortization ("Adjusted EBITDA") and Domestic AdjustedEBITDA, as well as Adjusted Earnings per Share ("Adjusted EPS").

Adjusted EBITDA and Domestic Adjusted EBITDA were determined as follows:
millions 2016 2015 2014
Net loss attributable to Holdings per statement of operations. . . . $ (2,221) $ (1,129) $ (1,682)Income (loss) attributable to noncontrolling interests . . . . . . . . . . — 1 (128)Income tax expense (benefit). . . . . . . . . . . . . . . . . . . . . . . . . . . . . (174) (257) 125Interest expense . . . . . . . . . . . . . . . . . . . . . . . . . . . . . . . . . . . . . . . 404 323 313Interest and investment (income) loss . . . . . . . . . . . . . . . . . . . . . . 26 62 (132)Other income . . . . . . . . . . . . . . . . . . . . . . . . . . . . . . . . . . . . . . . . . (13) — (4)Operating loss . . . . . . . . . . . . . . . . . . . . . . . . . . . . . . . . . . . . . . . . (1,978) (1,000) (1,508)Depreciation and amortization . . . . . . . . . . . . . . . . . . . . . . . . . . . 375 422 581Gain on sales of assets . . . . . . . . . . . . . . . . . . . . . . . . . . . . . . . . . . (247) (743) (207)Before excluded items . . . . . . . . . . . . . . . . . . . . . . . . . . . . . . . . . . (1,850) (1,321) (1,134)
Closed store reserve and severance . . . . . . . . . . . . . . . . . . . . . . . . 384 98 224Domestic pension expense . . . . . . . . . . . . . . . . . . . . . . . . . . . . . . 288 229 89Other(1) . . . . . . . . . . . . . . . . . . . . . . . . . . . . . . . . . . . . . . . . . . . . . . 31 (64) 50Amortization of deferred Seritage gain . . . . . . . . . . . . . . . . . . . . . (88) (52) —Impairment charges . . . . . . . . . . . . . . . . . . . . . . . . . . . . . . . . . . . . 427 274 63Adjusted EBITDA. . . . . . . . . . . . . . . . . . . . . . . . . . . . . . . . . . . . . (808) (836) (708)
Lands' End . . . . . . . . . . . . . . . . . . . . . . . . . . . . . . . . . . . . . . . . . . . — — (10)Adjusted EBITDA as defined(2) . . . . . . . . . . . . . . . . . . . . . . . . . . . $ (808) $ (836) $ (718)
Sears Canada . . . . . . . . . . . . . . . . . . . . . . . . . . . . . . . . . . . . . . . . . — — 71Domestic Adjusted EBITDA as defined(2). . . . . . . . . . . . . . . . . . . $ (808) $ (836) $ (647)
(1) Consists of one-time credits from vendors, expenses associated with legal matters, transaction costs associated with strategicinitiatives and other expenses.
(2) Adjusted to reflect the results of the Lands' End and Sears Canada businesses that were included in our results of operationsprior to the separation/disposition.
28

Adjusted EBITDA for our segments was as follows:
2016 2015 2014
millions KmartSears
DomesticSears
Holdings KmartSears
DomesticSears
Holdings KmartSears
DomesticSears
CanadaSears
Holdings
Operating loss per statement ofoperations . . . . . . . . . . . . . . . . . $ (530) $(1,448) $(1,978) $ (292) $ (708) $(1,000) $ (422) $ (920) $(166) $(1,508)
Depreciation and amortization . . . 71 304 375 72 350 422 95 437 49 581
(Gain) loss on sales of assets . . . . . (181) (66) (247) (185) (558) (743) (103) (105) 1 (207)
Before excluded items . . . . . . . . . . (640) (1,210) (1,850) (405) (916) (1,321) (430) (588) (116) (1,134)
Closed store reserve, severanceand other . . . . . . . . . . . . . . . . . . 318 66 384 86 12 98 142 55 27 224
Domestic pension expense . . . . . . — 288 288 — 229 229 — 89 — 89Other(1) . . . . . . . . . . . . . . . . . . . . . . 15 16 31 43 (107) (64) 43 4 3 50Amortization of deferred Seritage
gain . . . . . . . . . . . . . . . . . . . . . . (17) (71) (88) (11) (41) (52) — — — —Impairment charges . . . . . . . . . . . . 22 405 427 14 260 274 29 19 15 63Adjusted EBITDA. . . . . . . . . . . . . (302) (506) (808) (273) (563) (836) (216) (421) (71) (708)
Lands' End separation . . . . . . . . . . — — — — — — — (10) — (10)
Adjusted EBITDA as defined(2). . . $ (302) $ (506) $ (808) $ (273) $ (563) $ (836) $ (216) $ (431) $ (71) $ (718)
% to revenues(3) . . . . . . . . . . . . . . . (3.5)% (3.8)% (3.6)% (2.7)% (3.8)% (3.3)% (1.8)% (2.6)% (3.4)% (2.3)%
(1) Consists of one-time credits from vendors, expenses associated with legal matters, transaction costs associated with strategicinitiatives and other expenses.
(2) Adjusted to reflect the results of the Lands' End business that were included in our results of operations prior to the separation.(3) Excludes revenues of the Lands' End business that were included in our results of operations prior to the separation.
29

The following tables set forth results of operations on a GAAP and "As Adjusted" basis, as well as the impact eachsignificant item used in calculating Adjusted EBITDA had on specific income and expense amounts reported in ourConsolidated Statements of Operations during the years 2016, 2015 and 2014.
Year Ended January 28, 2017Adjustments
millions, except per sharedata GAAP
DomesticPensionExpense
Closed StoreReserve,
StoreImpairments
andSeverance
Trade nameImpairment
Gain onSales ofAssets
Mark-to-Market
Adjustments
Amortizationof Deferred
Seritage Gain Other(1)Tax
MattersAs
Adjusted
Gross margin impact . . . $ 4,686 $ — $ 226 $ — $ — $ — $ (88) $ (33) $ — $ 4,791Selling and
administrative impact 6,109 (288) (158) — — — — (64) — 5,599Depreciation and
amortization impact . 375 — (20) — — — — — — 355Impairment charges
impact . . . . . . . . . . . . 427 — (46) (381) — — — — — —Gain on sales of assets
impact . . . . . . . . . . . . (247) — — — 109 — — — — (138)Operating loss impact . . (1,978) 288 450 381 (109) — (88) 31 — (1,025)Interest and investment
loss impact . . . . . . . . (26) — — — — 35 — — — 9
Other income impact . . . 13 — — — — — — (13) — —Income tax benefit
impact . . . . . . . . . . . . 174 (108) (169) (143) 41 (13) 33 (7) 725 533After tax and
noncontrollinginterests impact . . . . . (2,221) 180 281 238 (68) 22 (55) 11 725 (887)
Diluted loss per shareimpact . . . . . . . . . . . . $(20.78) $ 1.68 $ 2.63 $ 2.23 $ (0.64) $ 0.21 $ (0.51) $ 0.10 $ 6.78 $ (8.30)
Year Ended January 30, 2016Adjustments
millions, except per sharedata GAAP
DomesticPensionExpense
Closed StoreReserve,
StoreImpairments
andSeverance
Trade nameImpairment
Gain onSales ofAssets
Mark-to-Market
Adjustments
Amortizationof Deferred
SeritageGain Other(2)
TaxMatters
AsAdjusted
Gross margin impact . . . $ 5,810 $ — $ 44 $ — $ — $ — $ (52) $ (146) $ — $ 5,656Selling and
administrative impact 6,857 (229) (54) — — — — (82) — 6,492Depreciation and
amortization impact . 422 — (3) — — — — — — 419Impairment charges
impact . . . . . . . . . . . . 274 — (94) (180) — — — — — —Gain on sales of assets
impact . . . . . . . . . . . . (743) — — — 687 — — — — (56)Operating loss impact . . (1,000) 229 195 180 (687) — (52) (64) — (1,199)Interest and investment
loss impact . . . . . . . . (62) — — — — 59 — — — (3)Income tax benefit
impact . . . . . . . . . . . . 257 (86) (73) (68) 258 (22) 20 24 263 573After tax and
noncontrollinginterests impact . . . . . (1,129) 143 122 112 (429) 37 (32) (40) 263 (953)
Diluted loss per shareimpact . . . . . . . . . . . . $ (10.59) $ 1.34 $ 1.14 $ 1.05 $ (4.02) $ 0.35 $ (0.30) $ (0.38) $ 2.47 $ (8.94)
(1) Consists of one-time credits from vendors, expenses associated with legal matters, transaction costs associated with strategicinitiatives, other expenses and other income.(2) Consists of one-time credits from vendors, expenses associated with legal matters, transaction costs associated with strategicinitiatives and other expenses.
30

Year Ended January 31, 2015
Adjustments
millions, except per share data GAAP
DomesticPensionExpense
Closed StoreReserve,
StoreImpairments
andSeverance
DomesticGain onSales ofAssets
OtherExpenses
Gain onSears
CanadaDisposition
DomesticTax
Matters
SearsCanadaSegment
Lands'End
SeparationAs
Adjusted(1)
Gross margin impact . . . . . $ 7,149 $ — $ 68 $ — $ — $ — $ — $ (502) $ (87) $ 6,628Selling and administrative
impact . . . . . . . . . . . . . . 8,220 (89) (129) — (47) — — (603) (77) 7,275Depreciation and
amortization impact . . . . 581 — (8) — — — — (49) (3) 521Impairment charges impact 63 — (48) — — — — (15) — —Gain on sales of assets
impact . . . . . . . . . . . . . . (207) — — 87 — — — (1) — (121)Operating loss impact . . . . (1,508) 89 253 (87) 47 — — 166 (7) (1,047)Interest expense impact . . . (313) — — — — — — 5 — (308)Interest and investment
income impact . . . . . . . . 132 — — — — (70) — (38) — 24
Other income impact . . . . . 4 — — — — — — (4) — —
Income tax expense impact (125) (33) (95) 33 (18) 26 574 136 3 501Income attributable to
noncontrolling interestsimpact . . . . . . . . . . . . . . 128 — — — — — — (128) — —
After tax andnoncontrolling interestsimpact . . . . . . . . . . . . . . (1,682) 56 158 (54) 29 (44) 574 137 (4) (830)
Diluted loss per shareimpact . . . . . . . . . . . . . . $ (15.82) $ 0.53 $ 1.48 $ (0.51) $ 0.27 $ (0.41) $ 5.40 $ 1.29 $ (0.04) $ (7.81)
(1) Adjusted to reflect the results of the Lands' End and Sears Canada businesses that were included in our results of operationsprior to the separation/disposition.
Adjusted EBITDA is computed as net loss attributable to Sears Holdings Corporation appearing on theStatements of Operations excluding income (loss) attributable to noncontrolling interests, income tax (expense)benefit, interest expense, interest and investment income (loss), other income, depreciation and amortization andgain on sales of assets. In addition, it is adjusted to exclude certain significant items as set forth below. Ourmanagement uses Adjusted EBITDA to evaluate the operating performance of our businesses, as well as executivecompensation metrics, for comparable periods. Adjusted EBITDA should not be used by investors or other thirdparties as the sole basis for formulating investment decisions as it excludes a number of important cash and non-cashrecurring items.
While Adjusted EBITDA and Domestic Adjusted EBITDA are non-GAAP measurements, managementbelieves that they are important indicators of ongoing operating performance, and useful to investors, because:
• EBITDA excludes the effects of financings and investing activities by eliminating the effects of interest anddepreciation costs;
• Management considers gains/(losses) on the sale of assets to result from investing decisions rather thanongoing operations; and
• Other significant items, while periodically affecting our results, may vary significantly from period toperiod and have a disproportionate effect in a given period, which affects comparability of results. We haveadjusted our results for these items to make our statements more comparable and therefore more useful toinvestors as the items are not representative of our ongoing operations and reflect past investmentdecisions.
We also believe that our use of Adjusted EPS provides an appropriate measure for investors to use in assessingour performance across periods, given that this measure provides an adjustment for certain significant items whichmay vary significantly from period to period, improving the comparability of year-to-year results and is therefore
31

representative of our ongoing performance. Therefore, we have adjusted our results for significant items to make ourstatements more useful and comparable. However, we do not, and do not recommend that you, solely use AdjustedEPS to assess our financial and earnings performance. We also use, and recommend that you use, diluted earningsper share in addition to Adjusted EPS in assessing our earnings performance.
These other significant items included in Adjusted EBITDA, Domestic Adjusted EBITDA and Adjusted EPSare further explained as follows:
• Domestic pension expense – Contributions to our pension plans remain a significant use of our cash on anannual basis. Cash contributions to our pension and postretirement plans are separately disclosed on thecash flow statement. While the Company's pension plan is frozen, and thus associates do not currently earnpension benefits, we have a legacy pension obligation for past service performed by Kmart and Searsassociates. The annual pension expense included in our statement of operations related to these legacydomestic pension plans was relatively minimal in years prior to 2009. However, due to the severe decline inthe capital markets that occurred in the latter part of 2008, and the resulting abnormally low interest rates,which continue to persist, our domestic pension expense was $288 million in 2016, $229 million in 2015and $89 million in 2014. Pension expense is comprised of interest cost, expected return on plan assets andrecognized net loss and other. This adjustment eliminates the entire pension expense from the statement ofoperations to improve comparability. Pension expense is included in the determination of net loss.
The components of the adjustments to EBITDA related to domestic pension expense were as follows:
millions 2016 2015 2014
Components of net periodic expense:Interest cost . . . . . . . . . . . . . . . . . . . . . . . . . . . . . . . . . . . . . . . . . . . $ 227 $ 210 $ 221Expected return on plan assets . . . . . . . . . . . . . . . . . . . . . . . . . . . . (202) (249) (247)Recognized net loss and other . . . . . . . . . . . . . . . . . . . . . . . . . . . . 263 268 115Net periodic expense. . . . . . . . . . . . . . . . . . . . . . . . . . . . . . . . . . . . $ 288 $ 229 $ 89
In accordance with GAAP, we recognize on the balance sheet actuarial gains and losses for definedbenefit pension plans annually in the fourth quarter of each fiscal year and whenever a plan is determinedto qualify for a remeasurement during a fiscal year. For income statement purposes, these actuarial gainsand losses are recognized throughout the year through an amortization process. The Company recognizes inits results of operations, as a corridor adjustment, any unrecognized actuarial net gains or losses that exceed10% of the larger of projected benefit obligations or plan assets. Accumulated gains/losses that are insidethe 10% corridor are not recognized, while accumulated actuarial gains/losses that are outside the 10%corridor are amortized over the "average future service" of the population and are included in theamortization of experience losses line item above.
Actuarial gains and losses occur when actual experience differs from the estimates used to allocatethe change in value of pension plans to expense throughout the year or when assumptions change, as theymay each year. Significant factors that can contribute to the recognition of actuarial gains and lossesinclude changes in discount rates used to remeasure pension obligations on an annual basis or upon aqualifying remeasurement, differences between actual and expected returns on plan assets and otherchanges in actuarial assumptions. Management believes these actuarial gains and losses are primarilyfinancing activities that are more reflective of changes in current conditions in global financial markets(and in particular interest rates) that are not directly related to the underlying business and that do not havean immediate, corresponding impact on the benefits provided to eligible retirees. For further information onthe actuarial assumptions and plan assets referenced above, see Management's Discussion and Analysis ofFinancial Condition and Results of Operations - Application of Critical Accounting Policies and Estimates -Defined Benefit Pension Plans, and Note 7 of Notes to Consolidated Financial Statements.
• Closed store reserve and severance – We are transforming our Company to a less asset-intensive businessmodel. Throughout this transformation, we continue to make choices related to our stores, which couldresult in sales, closures, lease terminations or a variety of other decisions.
32

• Impairment charges – Accounting standards require the Company to evaluate the carrying value of fixedassets, goodwill and intangible assets for impairment. As a result of the Company's analysis, we haverecorded impairment charges related to certain fixed asset and indefinite-lived intangible asset balances.
• Domestic gains on sales of assets – We have recorded significant gains on sales of assets, as well as gainson sales of joint venture interests, which were primarily attributable to several real estate transactions.Management considers these gains on sales of assets to result from investing decisions rather than ongoingoperations.
• Mark-to-market adjustments – We elected the fair value option for the equity method investment in SearsCanada, and the change in fair value is recorded in interest and investment income in the ConsolidatedStatements of Operations. Management considers activity related to our retained investment in SearsCanada to result from investing decisions rather than ongoing operations. Furthermore, we do not considerthe short term fluctuations in Sears Canada's stock price useful in assessing our operating performance.
• Amortization of deferred Seritage gain – A portion of the gain on the Seritage transaction was deferred andwill be recognized in proportion to the related rent expense, which is a component of cost of sales, buyingand occupancy in the Consolidated Statements of Operations, over the lease term. Management considersthe amortization of the deferred Seritage gain to result from investing decisions rather than ongoingoperations.
• Other – Consists of one-time credits from vendors, transaction costs associated with strategic initiatives,expenses associated with legal matters, other expenses and other income.
• Domestic tax matters – In 2011, we recorded a non-cash charge to establish a valuation allowance againstsubstantially all of our domestic deferred tax assets. Accounting rules generally require that a valuationreserve be established when income has not been generated over a three-year cumulative period to supportthe deferred tax asset. While an accounting loss was recorded, we believe no economic loss has occurred asthese net operating losses and tax benefits remain available to reduce future taxes as income is generated insubsequent periods. As this valuation allowance has a significant impact on the effective tax rate, we haveadjusted our results to reflect a standard effective tax rate for the Company beginning in fiscal 2011 whenthe valuation allowance was first established.
• Gain on Sears Canada disposition – We recognized a gain upon de-consolidation of Sears Canada.Management considers the gain to result from investing decisions rather than ongoing operations.
• Sears Canada segment – Reflects the results of the Sears Canada business that were included in our resultsof operations prior to the disposition. The adjustment also includes the valuation allowance that wasrecorded in the third quarter of 2014 prior to the de-consolidation of Sears Canada.
• Lands' End separation – Reflects the results of the Lands' End business that were included in our results ofoperations prior to the separation.
Revenues and Comparable Store Sales
Revenues decreased $3.0 billion, or 12.0%, to $22.1 billion in 2016, as compared to revenues of $25.1 billionin 2015. The decline in revenues included a decrease of $1.3 billion as a result of having fewer Kmart and SearsFull-line stores in operation. For the full year, comparable store sales declined 7.4%, which contributed to $1.4billion of the revenue decline relative to the prior year. In addition, we also experienced a decline in revenues fromSears Hometown and Outlet Stores, Inc. ("SHO") of approximately $238 million during 2016 as compared to 2015.
Kmart comparable store sales declined 5.3% for the full year primarily driven by declines in the grocery &household, consumer electronics and pharmacy categories. Sears Domestic comparable store sales for the yeardeclined 9.3% primarily driven by decreases in the home appliances, apparel and consumer electronics categories.
Gross Margin
Gross margin declined $1.1 billion to $4.7 billion in 2016 from $5.8 billion in 2015 as a result of the abovenoted decline in sales, as well as a decline in gross margin rate. Gross margin for 2016 included one-time vendorcredits of $33 million, as well as a credit of $88 million related to the amortization of the deferred gain on sale of
33

assets associated with the Seritage transaction, while 2015 included one-time vendor credits of $146 million, as wellas a credit of $52 million related to the amortization of the deferred gain on sale of assets associated with theSeritage transaction. Gross margin for 2016 and 2015 also included charges of $226 million and $44 million,respectively, related to store closures.
As compared to the prior year, Kmart's gross margin rate for 2016 declined 310 basis points. Excluding theimpact of significant items primarily related to store closures as noted in our Adjusted Earnings Per Share tables,Kmart's gross margin rate would have declined 130 basis points with margin rate declines experienced across mostcategories, most notably in the apparel, grocery & household, drugstore, home and pharmacy categories. SearsDomestic's gross margin rate for 2016 decreased 130 basis points. Excluding the impact of significant items in bothyears primarily related to the amortization of the deferred gain on sale of assets associated with the Seritagetransaction, one-time vendor credits and store closures, Sears Domestic's gross margin rate declined 60 basis points,with the most notable decreases experienced in the apparel, home appliances and footwear categories. The decline inmargin rate experienced in both Kmart and Sears Domestic is primarily attributable to increased markdowns,including an increase in Shop Your Way points expense.
In addition, as a result of the Seritage and JV transactions, 2016 and 2015 included additional rent expense andassigned sub-tenant rental income of approximately $197 million and $133 million, respectively. Due to thestructure of the leases, we expect that our cash rent obligations to Seritage and the joint venture partners will decline,over time, as space in these stores is recaptured. From the inception of the Seritage transaction to date, we havereceived recapture notices on 25 properties, which is estimated to reduce the rent expense by approximately $14million on an annual basis. We have also exercised our right to terminate the lease on 36 properties, which isestimated to reduce rent expense by approximately $12 million on an annual basis.
Selling and Administrative Expenses
Selling and administrative expenses decreased $748 million to $6.1 billion in 2016 from $6.9 billion in 2015and included significant items which aggregated to an expense of $510 million and $365 million for 2016 and 2015,respectively. Excluding these items, selling and administrative expenses declined $893 million, primarily due to adecrease in payroll expense. In addition, advertising expense also declined as we continued to shift away fromtraditional advertising to use of Shop Your Way points expense, which is included within gross margin.
Selling and administrative expenses as a percentage of revenues ("selling and administrative expense rate")were 27.6% and 27.3% for 2016 and 2015, respectively, as the decreases in overall selling and administrativeexpenses were more than offset by the above noted decline in revenues.
Depreciation and Amortization
Depreciation and amortization expense decreased by $47 million during 2016 to $375 million, as compared to2015, primarily due to having fewer assets to depreciate.
Impairment Charges
We recorded impairment charges of $427 million in 2016, which consisted of impairment of $381 millionrelated to the Sears trade name, as well as $46 million related to the impairment of long-lived assets. We recordedimpairment charges of $274 million in 2015, which consisted of impairment of $180 million related to the Searstrade name, as well as $94 million related to the impairment of long-lived assets. Impairment charges recorded inboth years are described further in Notes 1 and 13 of Notes to Consolidated Financial Statements.
Gain on Sales of Assets
We recorded total gains on sales of assets of $247 million in 2016 and $743 million in 2015, which wereprimarily attributable to several significant real estate transactions. The gains recorded in 2015 included $508million recognized in connection with the joint venture transactions and the sale-leaseback transaction with Seritage.Gains on sales of assets recorded in both years are described further in Note 11 of Notes to Consolidated FinancialStatements.
34

Operating Loss
We recorded an operating loss of $2.0 billion and $1.0 billion in 2016 and 2015, respectively. The operatingloss for 2016 included significant items which aggregated to operating expense of $953 million, while operating lossfor 2015 included significant items which aggregated to operating income of $199 million. Excluding these items,we would have reported an adjusted operating loss of $1.0 billion and $1.2 billion in 2016 and 2015, respectively.The decrease in adjusted operating loss in 2016 was primarily driven by the decrease in selling and administrativeexpenses, partially offset by the decline in gross margin noted above.
Interest Expense
We incurred $404 million and $323 million in interest expense during 2016 and 2015, respectively. Theincrease is due to an increase in average outstanding borrowings in 2016.
Interest and Investment Loss
We recorded interest and investment loss of $26 million during 2016 compared to interest and investment lossof $62 million during 2015. Interest and investment income loss is described further in Note 6 of Notes toConsolidated Financial Statements.
Income Taxes
We recorded an income tax benefit of $174 million in 2016 compared with an income tax benefit of $257million in 2015. Our effective tax rate for 2016 was a benefit of 7.3% compared to a benefit of 18.6% for 2015.During 2016, the Company realized a significant tax benefit on the deferred taxes related to the partial impairmentof the Sears trade name. In addition, the Company recorded a tax benefit related to the net gain on pension and otherpostretirement benefits in continuing operations and a corresponding tax expense of the same amount in othercomprehensive income. Also, the application of the requirements for accounting for income taxes, afterconsideration of our valuation allowance, causes a significant variation in the typical relationship between incometax expense and pretax income. Our tax rate in 2016 continues to reflect the effect of not recognizing the benefit ofcurrent period losses in certain domestic and foreign jurisdictions where it is not more likely than not that suchbenefits would be realized. In addition, 2016 was negatively impacted by foreign branch taxes and state incometaxes.
The 2015 rate was favorably impacted by the significant tax benefit realized on the deferred taxes related toindefinite-life assets associated with the property sold in the transaction with Seritage and the tax benefit realized onthe deferred taxes related to the partial impairment of the Sears trade name. These items were partially offset byforeign branch taxes and state income taxes.
35
2015 Compared to 2014
Net Loss Attributable to Holdings' Shareholders
We recorded a net loss attributable to Holdings' shareholders of $1.1 billion ($10.59 loss per diluted share) and$1.7 billion ($15.82 loss per diluted share) for 2015 and 2014, respectively. Our results for 2015 and 2014 wereaffected by a number of significant items. Our net loss as adjusted for these significant items, which are furtherdiscussed below, was $953 million ($8.94 loss per diluted share) for 2015 and $830 million ($7.81 loss per dilutedshare) for 2014. The increase in net loss as adjusted for the year primarily reflected a decline in gross margin, whichwas driven by the decline in revenues, partially offset by a decrease in selling and administrative expenses.

Revenues and Comparable Store Sales
Revenues decreased $6.1 billion, or 19.4%, to $25.1 billion in 2015, as compared to revenues of $31.2 billionin 2014. Much of the decline related to actions we took during 2014 to streamline our operations and focus on ourtransformation into a member-centric retailer. The decrease in revenue included a decrease of $2.1 billion associatedwith Sears Canada, which was de-consolidated in October 2014, $222 million from the separation of the Lands’ Endbusiness, which was completed on April 4, 2014, and $1.5 billion from fewer Kmart and Sears Full-line stores. Inaddition, domestic comparable store sales declined 9.2%, which contributed to $2.0 billion of the decline. Thedecline in comparable store sales was driven by reduced, but more highly targeted promotional and marketing spendto better align with member needs and a shift away from low margin categories, such as consumer electronics.Comparable store sales in the latter part of the year, particularly in the apparel and softlines businesses, werenegatively impacted by unseasonably warm weather and a highly promotional environment.
Kmart comparable store sales declined 7.3% with increases in the home appliances, mattresses and seasonalcategories, which were more than offset by declines in the consumer electronics, apparel, grocery & household anddrugstore categories. Excluding the impact of the consumer electronics business, which is a business we continue toalter to meet our members' needs, Kmart comparable store sales would have decreased 5.5%. Sears Domesticcomparable store sales decreased 11.1%, and were also negatively impacted by consumer electronics. Excluding theimpact of consumer electronics, Sears Domestic comparable store sales would have decreased 9.5%, primarilydriven by decreases in apparel, home appliances, lawn & garden and Sears Auto Centers, which were partially offsetby an increase in the mattresses category.
Gross Margin
Gross margin declined $1.3 billion to $5.8 billion in 2015 from $7.1 billion in 2014 as the above noted declinein sales was partially offset by an improvement in gross margin rate. Gross margin for 2015 included one-timevendor credits of $146 million, as well as a credit of $52 million related to the amortization of the deferred gain onsale of assets associated with the Seritage transaction, while 2014 included gross margin of $502 million from SearsCanada and $87 million from the Lands' End business. Gross margin for 2015 and 2014 also included charges of$44 million and $68 million, respectively, related to store closures.
As compared to the prior year, Kmart's gross margin rate for 2015 declined 10 basis points, as increasesexperienced in a majority of categories, most notably consumer electronics, grocery & household, drugstore andtoys, were more than offset by decreases in the apparel and pharmacy categories. Sears Domestic's gross margin ratefor 2015 improved 50 basis points. Excluding the impact of significant items, Sears Domestic's gross margin ratedeclined 60 basis points, with the most notable decreases experienced in the apparel and home appliances categoriesdriven by an increase in promotional activities, particularly during the fourth quarter of 2015 as a result of the highlycompetitive promotional environment.
In addition, as a result of the Seritage and JV transactions, 2015 included additional rent expense and assignedsub-tenant income of approximately $133 million.
Selling and Administrative Expenses
Selling and administrative expenses decreased $1.4 billion to $6.9 billion in 2015 from $8.2 billion in 2014and included significant items which aggregated to expense of $365 million and $945 million for 2015 and 2014,respectively, with 2014 including expenses of $603 million from Sears Canada and $77 million from the Lands' Endbusiness. Excluding these items, selling and administrative expenses declined $783 million, primarily due todecreases in payroll and advertising expenses.
Selling and administrative expenses as a percentage of revenues ("selling and administrative expense rate")were 27.3% and 26.3% for 2015 and 2014, respectively, as the decreases in overall selling and administrativeexpenses were more than offset by the above noted decline in revenues.
36

Depreciation and Amortization
Depreciation and amortization expense decreased by $159 million during 2015 to $422 million, primarily dueto having fewer assets to depreciate. Depreciation and amortization expense during 2014 included expense of $52million related to Sears Canada and the Lands' End business.
Impairment Charges
We recorded impairment charges of $274 million in 2015, which consisted of impairment of $180 millionrelated to the Sears trade name, as well as $94 million related to the impairment of long-lived assets. We recordedimpairment charges of $63 million in 2014, which were related to the impairment of long-lived assets. Impairmentcharges recorded in both years are described further in Notes 1 and 13 of Notes to Consolidated FinancialStatements.
Gain on Sales of Assets
We recorded total gains on sales of assets of $743 million in 2015 and $207 million in 2014, which wereprimarily attributable to several significant real estate transactions. The gains recorded in 2015 included $508million recognized in connection with the joint venture transactions and the sale-leaseback transaction with Seritage.Gains on sales of assets recorded in both years are described further in Note 11 of Notes to Consolidated FinancialStatements.
Operating Loss
We recorded an operating loss of $1.0 billion and $1.5 billion in 2015 and 2014, respectively. The operatingloss for 2015 included significant items which aggregated to operating income of $199 million, while operating lossfor 2014 included significant items which aggregated to operating expense of $461 million. Excluding these items,we would have reported an adjusted operating loss of $1.2 billion and $1.0 billion in 2015 and 2014, respectively.The increase in adjusted operating loss in 2015 was primarily driven by the decrease in gross margin, partially offsetby the decline in selling and administrative expenses.
Interest Expense
We incurred $323 million and $313 million in interest expense during 2015 and 2014, respectively. Theincrease is due to an increase in average outstanding borrowings in 2015.
Interest and Investment Income (Loss)
We recorded interest and investment loss of $62 million during 2015 compared to interest and investmentincome of $132 million during 2014. Interest and investment income (loss) is described further in Note 6 of Notes toConsolidated Financial Statements.
Income Taxes
We recorded an income tax benefit of $257 million in 2015 compared with income tax expense of $125million in 2014. During 2015, the Company realized a significant tax benefit on the deferred taxes related toindefinite-life assets associated with the property sold in the transaction with Seritage. As a result, our effective taxrate for 2015 was a benefit of 18.6% compared to expense of 7.4% for 2014. Also, the application of therequirements for accounting for income taxes, after consideration of our valuation allowance, causes a significantvariation in the typical relationship between income tax expense and pretax income. Our tax rate in 2015 continuedto reflect the effect of not recognizing the benefit of current period losses in certain domestic and foreignjurisdictions where it is not more likely than not that such benefits would be realized. In addition, 2015 wasnegatively impacted by foreign branch taxes and state income taxes.
The 2014 rate was negatively impacted by a valuation allowance established on Sears Canada’s deferred taxassets in the third quarter, prior to de-consolidation, and increased foreign taxes in Puerto Rico resulting from a newtax law change, which became effective during the second quarter of 2014. These items were partially offset by state
37

audit settlements and statute expirations. In addition, the 2014 rate was favorably impacted by the book to taxdifference for the original issue discount relating to the $625 million 8% senior unsecured notes issued in November2014, which resulted in the creation of a deferred tax liability through additional paid-in capital and a valuationallowance reversal through continuing operations.
38
Business Segment Results
Kmart
Kmart results and key statistics were as follows:
millions, except number of stores 2016 2015 2014
Merchandise sales and services . . . . . . . . . . . . . . . . . . . . . . . . . . . . . . . . $ 8,650 $ 10,188 $ 12,074Comparable store sales % . . . . . . . . . . . . . . . . . . . . . . . . . . . . . . . . . . . . (5.3)% (7.3)% (1.4)%Cost of sales, buying and occupancy . . . . . . . . . . . . . . . . . . . . . . . . . . . . 7,093 8,042 9,513Gross margin dollars . . . . . . . . . . . . . . . . . . . . . . . . . . . . . . . . . . . . . . . . 1,557 2,146 2,561Gross margin rate . . . . . . . . . . . . . . . . . . . . . . . . . . . . . . . . . . . . . . . . . . 18.0 % 21.1 % 21.2 %Selling and administrative . . . . . . . . . . . . . . . . . . . . . . . . . . . . . . . . . . . . 2,175 2,537 2,962Selling and administrative expense as a percentage of total revenues . . 25.1 % 24.9 % 24.5 %Depreciation and amortization. . . . . . . . . . . . . . . . . . . . . . . . . . . . . . . . . 71 72 95Impairment charges . . . . . . . . . . . . . . . . . . . . . . . . . . . . . . . . . . . . . . . . . 22 14 29Gain on sales of assets . . . . . . . . . . . . . . . . . . . . . . . . . . . . . . . . . . . . . . . (181) (185) (103)
Total costs and expenses . . . . . . . . . . . . . . . . . . . . . . . . . . . . . . . . . . 9,180 10,480 12,496Operating loss . . . . . . . . . . . . . . . . . . . . . . . . . . . . . . . . . . . . . . . . . . . . . $ (530) $ (292) $ (422)Adjusted EBITDA . . . . . . . . . . . . . . . . . . . . . . . . . . . . . . . . . . . . . . . . . . $ (302) $ (273) $ (216)Total Kmart stores . . . . . . . . . . . . . . . . . . . . . . . . . . . . . . . . . . . . . . . . . . 735 941 979
2016 Compared to 2015
Revenues and Comparable Store Sales
Kmart’s revenues decreased by $1.5 billion to $8.7 billion in 2016, primarily due to the effect of having fewerstores in operation, which accounted for approximately $1.0 billion of the decline. Revenues were also impacted bya decrease in comparable store sales of 5.3%, which accounted for approximately $477 million of the decline. Thedecline in comparable store sales was primarily driven by declines in the grocery & household, consumer electronicsand pharmacy categories.
Gross Margin
Kmart generated $1.6 billion in gross margin in 2016 compared to $2.1 billion in 2015. The decrease inKmart’s gross margin is due to the above noted decrease in sales, as well as a decline in gross margin rate. Grossmargin included significant items which aggregated to expense of $170 million and $28 million for 2016 and 2015,respectively.
Kmart's gross margin rate declined 310 basis points to 18.0% in 2016 from 21.1% in 2015. Excluding theimpact of significant items primarily related to store closures as noted in our Adjusted Earnings Per Share tables,Kmart's gross margin rate would have declined 130 basis points due to margin rate declines experienced across mostcategories, most notably in the apparel, grocery & household, drugstore, home and pharmacy categories driven byincreased markdowns, including an increase in Shop Your Way points expense.
In addition, as a result of the Seritage and JV transactions, 2016 and 2015 included additional rent expense andassigned sub-tenant rental income of approximately $35 million and $25 million, respectively.

Selling and Administrative Expenses
Kmart's selling and administrative expenses decreased $362 million in 2016. Selling and administrativeexpenses included significant items which aggregated to expense of $146 million and $90 million for 2016 and2015, respectively. Excluding these items, selling and administrative expenses decreased $418 million primarily dueto decreases in payroll and advertising expenses.
Kmart's selling and administrative expense rate was 25.1% in 2016 and 24.9% in 2015 and increased primarilyas a result of lower expense leverage due to the sales decline noted above.
Impairment charges
Kmart recorded impairment charges of $22 million and $14 million in 2016 and 2015, respectively, related tothe impairment of long-lived assets. Impairment charges recorded during 2016 and 2015 are further described inNote 13 of Notes to Consolidated Financial Statements.
Gain on Sales of Assets
Kmart recorded total gains on sales of assets of $181 million and $185 million in 2016 and 2015, respectively.Gains on sales of assets recorded in both years are described further in Note 11 of Notes to Consolidated FinancialStatements.
Operating Loss
Kmart recorded an operating loss of $530 million in 2016 as compared to $292 million in 2015. Operating lossfor 2016 included significant items which aggregated to operating expense of $280 million, while operating loss for2015 included significant items which aggregated to operating income of $14 million. Excluding these items, Kmartwould have reported an adjusted operating loss of $250 million and $306 million for 2016 and 2015, respectively.The decrease in Kmart's adjusted operating loss was primarily driven by the decrease in selling and administrativeexpenses, partially offset by a decline in gross margin.
39
2015 Compared to 2014
Revenues and Comparable Store Sales
Kmart’s revenues decreased by $1.9 billion to $10.2 billion in 2015, primarily due to the effect of having fewerstores in operation, which accounted for approximately $1.1 billion of the decline. Revenues were also impacted bya decrease in comparable store sales of 7.3%, which accounted for approximately $787 million of the decline.
The decline in comparable store sales was primarily driven by declines in the consumer electronics, apparel,grocery & household and drugstore categories, partially offset by increases in the home appliances, mattresses andseasonal categories. Excluding the impact of the consumer electronics business, which is a business we continue toalter to meet our members' needs, Kmart comparable store sales would have decreased 5.5%.
Gross Margin
Kmart generated $2.1 billion in gross margin in 2015 compared to $2.6 billion in 2014. The decrease inKmart’s gross margin is due to the above noted decrease in sales, as well as a slight decrease in gross margin rate.Gross margin included significant items which aggregated to $28 million and $54 million for 2015 and 2014,respectively. Excluding these items, gross margin decreased $441 million.
Kmart's gross margin rate declined 10 basis points to 21.1% in 2015 from 21.2% in 2014, as increasesexperienced in a majority of categories, most notably grocery & household, consumer electronics, drugstore andtoys, were more than offset by decreases in the apparel and pharmacy categories.
In addition, as a result of the Seritage and JV transactions, 2015 included additional rent expense and assignedsub-tenant rental income of approximately $25 million.

Selling and Administrative Expenses
Kmart's selling and administrative expenses decreased $425 million in 2015. Selling and administrativeexpenses included significant items which aggregated to expense of $90 million and $131 million for 2015 and2014, respectively. Excluding these items, selling and administrative expenses decreased $384 million primarily dueto decreases in payroll and advertising expenses.
Kmart's selling and administrative expense rate was 24.9% in 2015 and 24.5% in 2014 and increased primarilyas a result of lower expense leverage due to the sales decline noted above.
Depreciation and Amortization
Depreciation and amortization expense decreased by $23 million during 2015 to $72 million, as compared to2014, primarily due to having fewer assets to depreciate.
Impairment charges
Kmart recorded impairment charges of $14 million and $29 million in 2015 and 2014, respectively, related tothe impairment of long-lived assets. Impairment charges recorded during 2015 and 2014 are further described inNote 13 of Notes to Consolidated Financial Statements.
Gain on Sales of Assets
Kmart recorded total gains on sales of assets of $185 million and $103 million in 2015 and 2014, respectively.Gains recorded in 2015 included gains of $137 million recognized in connection with the sale-leaseback transactionwith Seritage. Gains on sales of assets recorded in both years are described further in Note 11 of Notes toConsolidated Financial Statements.
Operating Loss
Kmart recorded an operating loss of $292 million in 2015 as compared to $422 million in 2014. Operating lossfor 2015 included significant items which aggregated to operating income of $14 million, while operating loss for2014 included significant items which aggregated to operating expense of $208 million. Excluding these items,Kmart would have reported an adjusted operating loss of $306 million and $214 million for 2015 and 2014,respectively. The increase in Kmart's adjusted operating loss was primarily driven by the decrease in gross margin,partially offset by the decrease in selling and administrative expenses.
40

Sears Domestic
Sears Domestic results and key statistics were as follows:
millions, except number of stores 2016 2015 2014
Merchandise sales and services . . . . . . . . . . . . . . . . . . . . . . . . . . . . . . . . $ 13,488 $ 14,958 $ 17,036Comparable store sales % . . . . . . . . . . . . . . . . . . . . . . . . . . . . . . . . . . . . (9.3)% (11.1)% (2.1)%Cost of sales, buying and occupancy . . . . . . . . . . . . . . . . . . . . . . . . . . . . 10,359 11,294 12,950Gross margin dollars . . . . . . . . . . . . . . . . . . . . . . . . . . . . . . . . . . . . . . . . 3,129 3,664 4,086Gross margin rate . . . . . . . . . . . . . . . . . . . . . . . . . . . . . . . . . . . . . . . . . . 23.2 % 24.5 % 24.0 %Selling and administrative . . . . . . . . . . . . . . . . . . . . . . . . . . . . . . . . . . . . 3,934 4,320 4,655Selling and administrative expense as a percentage of total revenues . . 29.2 % 28.9 % 27.3 %Depreciation and amortization. . . . . . . . . . . . . . . . . . . . . . . . . . . . . . . . . 304 350 437Impairment charges . . . . . . . . . . . . . . . . . . . . . . . . . . . . . . . . . . . . . . . . . 405 260 19Gain on sales of assets . . . . . . . . . . . . . . . . . . . . . . . . . . . . . . . . . . . . . . . (66) (558) (105)
Total costs and expenses . . . . . . . . . . . . . . . . . . . . . . . . . . . . . . . . . . 14,936 15,666 17,956Operating loss . . . . . . . . . . . . . . . . . . . . . . . . . . . . . . . . . . . . . . . . . . . . . $ (1,448) $ (708) $ (920)
Adjusted EBITDA . . . . . . . . . . . . . . . . . . . . . . . . . . . . . . . . . . . . . . . . . . $ (506) $ (563) $ (421)Lands' End separation . . . . . . . . . . . . . . . . . . . . . . . . . . . . . . . . . . . . . . . — — (10)Adjusted EBITDA as defined(1) . . . . . . . . . . . . . . . . . . . . . . . . . . . . . . . . $ (506) $ (563) $ (431)Number of:
Full-line stores . . . . . . . . . . . . . . . . . . . . . . . . . . . . . . . . . . . . . . 670 705 717Specialty stores . . . . . . . . . . . . . . . . . . . . . . . . . . . . . . . . . . . . . 25 26 29Total Sears Stores . . . . . . . . . . . . . . . . . . . . . . . . . . . . . . . . . . . 695 731 746
__________________(1) Adjusted to reflect the results of the Lands' End business that were included in our results of operations prior
to the separation.
41
2016 Compared to 2015
Revenues and Comparable Store Sales
Sears Domestic's revenues decreased by $1.5 billion to $13.5 billion in 2016 as compared to 2015. This declinein revenues was primarily driven by a decrease in comparable store sales of 9.3%, which accounted for $890 millionof the decline, and the effect of having fewer Full-line stores in operation, which accounted for $241 million of thedecline. The decline in Sears Domestic comparable store sales was primarily driven by decreases in the homeappliances, apparel and consumer electronics categories. In addition, we also experienced a decline in revenues fromSHO of approximately $238 million during 2016 as compared to 2015.
Gross Margin
Sears Domestic generated gross margin of $3.1 billion and $3.7 billion in 2016 and 2015, respectively, andincluded significant items which aggregated to additional gross margin of $65 million and $182 million for 2016 and2015, respectively.
Sears Domestic's gross margin rate for the year declined 130 basis points to 23.2% in 2016 from 24.5% in2015. Excluding the impact of significant items in both years primarily related to the amortization of the deferredgain on sales of assets associated with the Seritage transaction, one-time vendor credits and store closures, SearsDomestic's gross margin rate declined 60 basis points, with the most notable decreases experienced in the apparel,home appliances and footwear categories driven by increased markdowns, including an increase in Shop Your Waypoints expense.

In addition, as a result of the Seritage and JV transactions, 2016 and 2015 included additional rent expense andassigned sub-tenant rental income of approximately $162 million and $108 million, respectively.
Selling and Administrative Expenses
Sears Domestic’s selling and administrative expenses decreased $386 million in 2016 as compared to 2015 andincluded significant items which aggregated to $364 million and $275 million for 2016 and 2015, respectively.Excluding these items, selling and administrative expenses decreased $475 million, primarily due to decreases inpayroll and advertising expenses.
Sears Domestic's selling and administrative expense rate was 29.2% in 2016 and 28.9% in 2015 and increasedas the above noted expense reduction was more than offset by the decline in sales noted above.
Depreciation and Amortization
Depreciation and amortization expense decreased by $46 million during 2016 to $304 million, as compared to2015, primarily due to having fewer assets to depreciate.
Impairment Charges
Sears Domestic recorded impairment charges of $405 million in 2016 which consisted of impairment of $381million related to the Sears trade name, as well as $24 million related to the impairment of long-lived assets. Werecorded impairment charges of $260 million in 2015 which consisted of impairment of $180 million related to theSears trade name, as well as $80 million related to the impairment of long-lived assets. Impairment charges recordedin both years are described further in Notes 1 and 13 of Notes to Consolidated Financial Statements.
Gain on Sales of Assets
Sears Domestic recorded total gains on sales of assets of $66 million and $558 million in 2016 and 2015,respectively. The gains recorded in 2015 included $371 million recognized in connection with the joint venturetransactions and the sale-leaseback transaction with Seritage. Gains on sales of assets recorded in both years aredescribed further in Note 11 of Notes to Consolidated Financial Statements.
Operating Loss
Sears Domestic reported an operating loss of $1.4 billion in 2016 compared to $708 million in 2015. SearsDomestic's operating loss in 2016 included significant items which aggregated to expense of $673 million, whileSears Domestic's operating loss for 2015 included significant items which aggregated to operating income of $185million. Excluding these items, we would have reported an adjusted operating loss of $775 million and $893 millionfor 2016 and 2015, respectively. The decrease in adjusted operating loss in 2016 was driven by the decrease inselling and administrative expenses, partially offset by the above noted decline in gross margin.
42
2015 Compared to 2014
Revenues and Comparable Store Sales
Sears Domestic's revenues decreased by $2.1 billion to $15.0 billion in 2015 as compared to 2014. This declinein revenues was primarily driven by a decrease in comparable store sales of 11.1%, which accounted for $1.2 billionof the decline, and the effect of having fewer Full-line stores in operation, which accounted for $433 million of thedecline. The revenue decline also included $222 million lower revenue as a result of the separation of the Lands'End business, which occurred in the first quarter of 2014, as well as lower revenues from our Home Servicesbusiness of approximately $110 million. The decline in comparable store sales was driven by reduced, but morehighly targeted promotional and marketing spend to better align with member needs and a shift away from lowmargin categories, such as consumer electronics. Comparable store sales in the latter part of the year, particularly inthe apparel and softlines businesses, were negatively impacted by unseasonably warm weather and a highlypromotional environment.
Sears Domestic comparable store sales were also negatively impacted by consumer electronics. Excluding theimpact of consumer electronics, Sears Domestic comparable store sales would have decreased 9.5%, primarilydriven by decreases in apparel, home appliances, lawn & garden and Sears Auto Centers, which were partially offsetby an increase in the mattresses category.
Gross Margin
Sears Domestic generated gross margin of $3.7 billion and $4.1 billion in 2015 and 2014, respectively, andincluded significant items which aggregated to additional gross margin of $182 million and $73 million for 2015 and2014, respectively. Excluding these items, gross margin decreased $531 million.
Sears Domestic's gross margin rate for the year improved 50 basis points to 24.5% in 2015 from 24.0% in2014. Excluding the impact of significant items recorded in gross margin during the year, Sears Domestic's grossmargin rate declined 60 basis points, with the most notable decreases experienced in the apparel and homeappliances categories, primarily driven by increased promotional activities, particularly during the fourth quarter of2015 as a result of the highly competitive promotional environment.
In addition, as a result of the Seritage and JV transactions, 2015 includes additional rent expense and assignedsub-tenant rental income of approximately $108 million.
Selling and Administrative Expenses
Sears Domestic’s selling and administrative expenses decreased $335 million in 2015 as compared to 2014 andincluded significant items which aggregated to $275 million and $211 million for 2015 and 2014, respectively.Excluding these items, selling and administrative expenses decreased $399 million, primarily due to a decrease inpayroll expense.
Sears Domestic’s selling and administrative expense rate was 28.9% in 2015 and 27.3% in 2014 and increasedas the above noted expense reduction was more than offset by the decline in sales noted above.
Depreciation and Amortization
Depreciation and amortization expense decreased by $87 million during 2015 to $350 million, primarily dueto having fewer assets to depreciate.
Impairment Charges
Sears Domestic recorded impairment charges of $260 million which consisted of impairment of $180 millionrelated to the Sears trade name, as well as $80 million related to the impairment of long-lived assets. We recordedimpairment charges of $19 million in 2014 related to the impairment of long-lived assets. Impairment chargesrecorded in both years are described further in Notes 1 and 13 of Notes to Consolidated Financial Statements.
Gain on Sales of Assets
Sears Domestic recorded total gains on sales of assets of $558 million and $105 million in 2015 and 2014,respectively. The gains recorded in 2015 included $371 million recognized in connection with the joint venturetransactions and the sale-leaseback transaction with Seritage. Gains on sales of assets recorded in both years aredescribed further in Note 11 of Notes to Consolidated Financial Statements.
Operating Loss
Sears Domestic reported an operating loss of $708 million in 2015 compared to $920 million in 2014. SearsDomestic’s operating loss in 2015 included significant items which aggregated to operating income of $185 million,while Sears Domestic's operating loss for 2014 included significant items which aggregated to operating expense of$87 million. Excluding these items, we would have reported an adjusted operating loss of $893 million and $833million for 2015 and 2014, respectively. The increase in adjusted operating loss in 2015 was driven by the abovenoted decrease in gross margin, partially offset by the decline in selling and administrative expenses.
43

Sears Canada
Sears Canada conducts similar retail operations as Sears Domestic. As previously noted, the Companycompleted a rights offering for a portion of its interest in Sears Canada in the third quarter of 2014. As such, theCompany no longer maintained control of Sears Canada resulting in the de-consolidation of Sears Canada onOctober 16, 2014.
Sears Canada results and key statistics through the date of de-consolidation were as follows:
millions 2014
Merchandise sales and services . . . . . . . . . . . . . . . . . . . . . . . . . . . . . . . . . . . . . . . . . . . . . . . . . . . . . . $ 2,088Comparable sales % . . . . . . . . . . . . . . . . . . . . . . . . . . . . . . . . . . . . . . . . . . . . . . . . . . . . . . . . . . . . . . . (8.0)%Cost of sales, buying and occupancy . . . . . . . . . . . . . . . . . . . . . . . . . . . . . . . . . . . . . . . . . . . . . . . . . . 1,586Gross margin dollars. . . . . . . . . . . . . . . . . . . . . . . . . . . . . . . . . . . . . . . . . . . . . . . . . . . . . . . . . . . . . . . 502Gross margin rate . . . . . . . . . . . . . . . . . . . . . . . . . . . . . . . . . . . . . . . . . . . . . . . . . . . . . . . . . . . . . . . . . 24.0 %Selling and administrative . . . . . . . . . . . . . . . . . . . . . . . . . . . . . . . . . . . . . . . . . . . . . . . . . . . . . . . . . . 603Selling and administrative expense as a percentage of total revenues. . . . . . . . . . . . . . . . . . . . . . . . . 28.9 %Depreciation and amortization . . . . . . . . . . . . . . . . . . . . . . . . . . . . . . . . . . . . . . . . . . . . . . . . . . . . . . . 49Impairment charges . . . . . . . . . . . . . . . . . . . . . . . . . . . . . . . . . . . . . . . . . . . . . . . . . . . . . . . . . . . . . . . 15Loss on sales of assets . . . . . . . . . . . . . . . . . . . . . . . . . . . . . . . . . . . . . . . . . . . . . . . . . . . . . . . . . . . . . 1
Total costs and expenses . . . . . . . . . . . . . . . . . . . . . . . . . . . . . . . . . . . . . . . . . . . . . . . . . . . . . . . . 2,254Operating loss . . . . . . . . . . . . . . . . . . . . . . . . . . . . . . . . . . . . . . . . . . . . . . . . . . . . . . . . . . . . . . . . . . . . $ (166)
Adjusted EBITDA . . . . . . . . . . . . . . . . . . . . . . . . . . . . . . . . . . . . . . . . . . . . . . . . . . . . . . . . . . . . . . . . $ (71)
44
ANALYSIS OF CONSOLIDATED FINANCIAL CONDITION
Cash Balances
Our cash and cash equivalents include all highly liquid investments with original maturities of three months orless at the date of purchase. Our cash balances as of January 28, 2017 and January 30, 2016 are detailed in thefollowing table.
millionsJanuary 28,
2017January 30,
2016
Cash and equivalents . . . . . . . . . . . . . . . . . . . . . . . . . . . . . . . . . . . . . . . . . . . . . . . . . . . . $ 196 $ 141Cash posted as collateral . . . . . . . . . . . . . . . . . . . . . . . . . . . . . . . . . . . . . . . . . . . . . . . . . 3 2Credit card deposits in transit . . . . . . . . . . . . . . . . . . . . . . . . . . . . . . . . . . . . . . . . . . . . . 87 95Total cash balances . . . . . . . . . . . . . . . . . . . . . . . . . . . . . . . . . . . . . . . . . . . . . . . . . . . . . $ 286 $ 238
We had total cash balances of $286 million and $238 million at January 28, 2017 and January 30, 2016,respectively. During 2016, the Company received net proceeds from various financing transactions of $2.0 billion,which included approximately $722 million from the 2016 Term Loan, approximately $485 million from the 2016Secured Loan Facility, approximately $291 million from the Second Lien Term Loan and approximately $486million from the 2017 Secured Loan Facility. In addition, the Company generated approximately $386 million fromthe sale of properties and investments. These proceeds were primarily used for general corporate purposes and toreduce outstanding borrowings under the Company's asset-based revolving credit facility.
At various times, we have posted cash collateral for certain outstanding letters of credit and self-insuranceprograms. Such cash collateral is classified within cash and cash equivalents given we have the ability to substituteletters of credit at any time for this cash collateral and it is therefore readily available to us.

Our invested cash may include, from time to time, investments in, but not limited to, commercial paper,federal, state and municipal government securities, floating-rate notes, repurchase agreements and money marketfunds. Cash amounts held in these short-term investments are readily available to us.
Credit card deposits in transit include deposits in transit from banks for payments related to third-party creditcard and debit card transactions.
We classify outstanding checks in excess of funds on deposit within other current liabilities and reduce cashbalances when these checks clear the bank on which they were drawn. Outstanding checks in excess of funds ondeposit were $29 million and $59 million as of January 28, 2017 and January 30, 2016, respectively.
Operating Activities
The Company used $1.4 billion of cash in its operations during 2016, $2.2 billion during 2015 and $1.4 billionduring 2014. Our primary source of operating cash flows is the sale of goods and services to customers, while theprimary use of cash in operations is the purchase of merchandise inventories and the payment of operating expenses.We used less cash in operations in 2016 compared to the prior year primarily due to a decrease in our net inventory.We used more cash in operations in 2015 compared to 2014 primarily driven by the increase in inventory balancesexperienced in 2015 as compared to the significant decrease in inventory balances experienced during 2014.
Merchandise inventories were $4.0 billion and $5.2 billion, respectively, at January 28, 2017 and January 30,2016, while merchandise payables were approximately $1.0 billion and $1.6 billion, respectively, at January 28,2017 and January 30, 2016. Our inventory balances decreased approximately $1.2 billion primarily due to bothimproved productivity and store closures. Sears Domestic inventory decreased in virtually all categories, with themost notable decreases in the home appliances, apparel and consumer electronics. Kmart inventory also decreased invirtually all categories with the most notable decreases in the apparel, grocery & household goods, drugstore andhome categories.
Investing Activities
We generated net cash flows from investing activities of $244 million in 2016, $2.5 billion in 2015 and $327million in 2014.
For 2016, net cash flows from investing activities primarily consisted of cash proceeds from the sale ofproperties and investments of $386 million, partially offset by cash used for capital expenditures of $142 million.For 2015, net cash flows from investing activities primarily consisted of cash proceeds from the sale of propertiesand investments of $2.7 billion, partially offset by cash used for capital expenditures of $211 million. Proceeds fromthe sales of properties and investments included approximately $2.6 billion of net proceeds from the Seritagetransaction. For 2014, net cash flows generated from investing activities primarily consisted of cash proceeds fromthe sale of properties and investments of $424 million, partially offset by cash used for capital expenditures of $270million. Additionally, 2014 included proceeds from the Sears Canada rights offering of $380 million, partially offsetby $207 million resulting from the de-consolidation of Sears Canada cash.
We spent $142 million, $211 million and $270 million during 2016, 2015 and 2014, respectively, for capitalexpenditures. Capital expenditures during 2014 included expenditures by Sears Canada of $32 million. Capitalexpenditures during all three years primarily included investments in online and mobile shopping capabilities,enhancements to the Shop Your Way platform, information technology infrastructure and store maintenance.
We anticipate 2017 capital expenditure levels to be similar to 2016 levels. In the normal course of business,we consider opportunities to purchase leased operating properties, as well as offers to sell owned, or assign leased,operating and non-operating properties. These transactions may, individually or in the aggregate, result in materialproceeds or outlays of cash and cause our capital expenditure levels to vary from period to period. In addition, wereview leases that will expire in the short term in order to determine the appropriate action to take with respect tothem.
Financing Activities
During 2016, we generated net cash flows from financing activities of $1.2 billion, which consisted ofproceeds from debt issuances of $2.0 billion and $71 million of net cash proceeds received during the fourth quarter
45

of 2016 from a sale-leaseback financing transaction for five Sears Full-line stores and two Sears Auto Centers thathave continuing involvement, partially offset by a decrease in short-term borrowings of $797 million, debtrepayments of $66 million and the payment of debt issuance costs of $51 million.
During 2015, the Company used net cash flows in financing activities of $364 million, which consisted of debtrepayments of $1.4 billion, of which $927 million was the purchase of Senior Secured Notes pursuant to the tenderoffer and $400 million was the repayment of the secured short-term loan, the payment of debt issuance costs of $50million related to the amendment and extension of our Domestic Credit Facility and fees related to the tender offerrelated to our Senior Secured Notes. These uses of cash were partially offset by an increase in short-term borrowingsof $583 million and $508 million of net cash proceeds from sale-leaseback financing, which consisted of $426million of proceeds from the JV transactions received during 2015 and $82 million of proceeds received in 2015related to four joint venture properties that have continuing involvement.
During 2014, the Company generated net cash from financing activities of $285 million, which primarilyconsisted of Lands' End pre-separation funding of $515 million and proceeds from debt issuances of $1.0 billion,consisting of $400 million from the secured short-term loan entered into in September 2014 and $625 million fromthe 8% senior unsecured notes due 2019 issued in November 2014. For further information, see Note 3 of Notes toConsolidated Financial Statements. The cash generated from financing activities was primarily used to pay downexisting revolver borrowings.
During 2016, 2015 and 2014, we did not repurchase any of our common shares under our share repurchaseprogram. The common share repurchase program was initially announced in 2005 and had a total authorization sinceinception of the program of $6.5 billion. At January 28, 2017, we had approximately $504 million of remainingauthorization under the program. The common share repurchase program has no stated expiration date and sharerepurchases may be implemented using a variety of methods, which may include open market purchases, privatelynegotiated transactions, block trades, accelerated share repurchase transactions, the purchase of call options, the saleof put options or otherwise, or by any combination of such methods.
Uses and Sources of Liquidity
Our primary need for liquidity is to fund working capital requirements of our businesses, capital expendituresand for general corporate purposes, including debt repayment and pension plan contributions. We have incurredlosses and experienced negative operating cash flows for the past several years, and accordingly, the Company hastaken a number of actions to continue to support its operations and meet its obligations.
During 2015, we undertook actions to monetize the value of certain of our real estate assets, which includedentering into three different real estate joint ventures with General Growth Properties, Inc., Simon Property Group,Inc. and The Macerich Company, in which we contributed a total of 31 properties to the joint ventures in exchangefor a 50% interest in each of the joint ventures and $429 million in gross cash proceeds, as well as the completion ofthe rights offering and sale-leaseback transaction with Seritage in which we received aggregate gross proceeds of$2.7 billion. Also during 2015, the Company completed an amendment and extension of the $3.275 billion revolvingportion of our domestic credit facility, with approximately $2.0 billion maturing in 2020 and the remainingapproximately $1.3 billion of the existing domestic credit facility expiring on the original maturity date in April2016. Finally, during 2015, the Company completed a tender offer (the "Tender Offer") to purchase for cash up to$1.0 billion principal amount of its outstanding 6 5/8% Senior Secured Notes Due 2018 (the "Senior SecuredNotes"). Approximately $936 million principal amount of the Senior Secured Notes were validly tendered in theTender Offer.
During 2016, the Company completed various financing transactions, including the closing of the $750 millionSenior Secured Term Loan under its domestic credit facility (the "2016 Term Loan") maturing in July 2020, whichgenerated net proceeds of approximately $722 million, the completion of a $500 million real estate loan facility inApril 2016 (the "2016 Secured Loan Facility") maturing in July 2017 which generated net proceeds ofapproximately $485 million, the completion of an additional $500 million real estate loan facility in January 2017(the "2017 Secured Loan Facility") maturing in July 2020 which generated net proceeds of approximately $486million, and also entering into a $300 million Second Lien Credit Agreement in September 2016 (the “Second LienTerm Loan”) maturing in 2020 which generated net proceeds of approximately $291 million. Additionally, the
46

Company generated nearly $460 million in cash proceeds from the sale of real estate and other asset sales, including$71 million from a sale-leaseback transaction for five Sears Full-line stores and two Sears Auto Centers.
Other actions announced during the fourth quarter of 2016 included a new Letter of Credit and ReimbursementAgreement (the "LC Facility Agreement") providing for up to a $500 million (of which $200 million is presentlycommitted) secured standby letter of credit facility (the "LC Facility") from certain affiliates of ESL Investments,Inc., and the establishment of a Special Committee of the Board of Directors to market certain real estate propertiestargeting at least $1.0 billion of asset sales. The specific assets involved, the timing and the overall amount willdepend on a variety of factors, including market conditions, interest in specific assets, valuations of those assets andour underlying operating performance. A portion of the cash proceeds generated from these asset sales will beutilized to repay amounts outstanding under both the 2016 Secured Loan Facility and 2017 Secured Loan Facility.
In addition, in February 2017, the Company entered into an amendment to our existing domestic credit facility.The amendment reduced the aggregate revolver commitments from $1.971 billion to $1.5 billion, but alsoimplemented other modifications to covenants and reserves against the domestic credit facility borrowing base thatimproved net liquidity. The amended credit facility is smaller in size, reflecting the Company's reduced needsconsistent with lower inventory levels associated with our transforming business model, which has fewer physicalstores and a greater online presence. The amendment also provides additional flexibility in the form of a $250million increase in the general debt basket from $750 million to $1.0 billion. Our domestic credit facility permits usup to $500 million of FILO loan capacity under the credit agreement and up to $2.0 billion of second lien loancapacity (of which $604 million is currently utilized) outside the credit agreement, all depending on the applicableand available borrowing base as defined in our applicable debt agreements, as well as our ability to securecommitments from lenders. We also have the ability to obtain longer-term secured financing maturing outside of thedomestic credit facility maturity date which would not be subject to borrowing base limitations (see Note 3 of Notesto Consolidated Financial Statements). The options available to us include securitizing assets and real estate loans,which we have successfully executed in the past. Further, in February and March 2017, the Company issuedcommercial paper to meet short-term liquidity needs, with the maximum amount outstanding during this time of$100 million, of which all has been repaid.
Also in February 2017, the Company initiated a restructuring program targeted to deliver at least $1.0 billionin annualized cost savings in 2017, which includes cost reductions from the previously announced store closures.Under the restructuring program, we intend to simplify Holdings' organizational structure, including greaterconsolidation of the Sears and Kmart corporate and support functions, as well as implement a streamlined operatingmodel to drive greater accountability and profitability. We also intend to transition to an integrated value chainmodel to drive efficiencies in pricing, sourcing, supply chain and inventory management, optimize productassortment at Sears and Kmart stores to better align with preferences of our Best Members focusing on profitable,high-return Best Categories and actively manage our real estate portfolio to identify additional opportunities forreconfiguration and reduction of capital obligations. We are primarily focusing on profitability instead of revenues,market share and other metrics each of which relate to, but do not necessarily drive profit. This approach maynegatively impact our sales, however, it is aimed at returning the Company to profitability.
Finally, in March 2017, the Company closed its previously-announced sale of the Craftsman brand to StanleyBlack & Decker. The Company received an initial upfront payment of $525 million, subject to closing costs and anadjustment for working capital changes, at closing. A portion of these proceeds were used to reduce outstandingborrowings under both the Company's domestic credit facility and term loans outstanding, as well as for generalcorporate purposes. In addition, Stanley Black & Decker will pay a further $250 million in cash in three years andHoldings will receive payments of between 2.5% and 3.5% on new Stanley Black & Decker sales of Craftsmanproducts for the next 15 years. As described in Note 1 of Notes to Consolidated Financial Statements, the PensionBenefit Guaranty Corporation ("PBGC") consented to the sale of the Craftsman-related assets that had been "ring-fenced" under the pension plan protection and forbearance agreement (the "PPPFA") with the PBGC.
We acknowledge that we continue to face a challenging competitive environment and while we continue tofocus on our overall profitability, including managing expenses, we reported a loss in 2016 and were required tofund cash used in operating activities with cash from investing and financing activities. We expect that the actionstaken in 2016 and early 2017 will enhance our liquidity and financial flexibility. In addition, as previously discussed,we expect to generate additional liquidity through the monetization of our real estate and additional debt financingactions. We expect that these actions will be executed in alignment with the anticipated timing of our liquidity needs.
47

We also continue to explore ways to unlock value across a range of assets, including exploring ways to maximize thevalue of our Home Services and Sears Auto Centers businesses, as well as our Kenmore and DieHard brandsthrough partnerships or other means of externalization that could expand distribution of our brands and serviceofferings to realize significant growth. We expect to continue to right-size, redeploy and highlight the value of ourassets, including our real estate portfolio, in our transition from an asset intensive, historically "store-only" basedretailer to a more asset light, integrated membership-focused company.
Our historical operating results indicate substantial doubt exists related to the Company's ability to continue asa going concern. We believe that the actions discussed above are probable of occurring and mitigating the substantialdoubt raised by our historical operating results and satisfying our estimated liquidity needs 12 months from theissuance of the financial statements. However, we cannot predict, with certainty, the outcome of our actions togenerate liquidity, including the availability of additional debt financing, or whether such actions would generate theexpected liquidity as currently planned. In addition, the PPPFA, contains certain limitations on our ability to sellassets, which could impact our ability to complete asset sale transactions or our ability to use proceeds from thosetransactions to fund our operations. Therefore, the planned actions take into account the applicable restrictions underthe PPPFA.
If we continue to experience operating losses, and we are not able to generate additional liquidity through themechanisms described above or through some combination of other actions, while not expected, we may not be ableto access additional funds under our amended Domestic Credit Agreement and we might need to secure additionalsources of funds, which may or may not be available to us. Additionally, a failure to generate additional liquiditycould negatively impact our access to inventory or services that are important to the operation of our business.Moreover, if the borrowing base (as calculated pursuant to the indenture) falls below the principal amount of thenotes plus the principal amount of any other indebtedness for borrowed money that is secured by liens on thecollateral for the notes on the last day of any two consecutive quarters, it could trigger an obligation to repurchasenotes in an amount equal to such deficiency.
Our outstanding borrowings at January 28, 2017 and January 30, 2016 were as follows:
millionsJanuary 28,
2017January 30,
2016
Short-term borrowings:Secured borrowings . . . . . . . . . . . . . . . . . . . . . . . . . . . . . . . . . . . . . . . . . . . . . . . . $ — $ 797
Long-term debt, including current portion:Notes, term loan and debentures outstanding . . . . . . . . . . . . . . . . . . . . . . . . . . . . 4,018 1,984Capitalized lease obligations . . . . . . . . . . . . . . . . . . . . . . . . . . . . . . . . . . . . . . . . . 145 195
Total borrowings . . . . . . . . . . . . . . . . . . . . . . . . . . . . . . . . . . . . . . . . . . . . . . . . . . . . . . $ 4,163 $ 2,976
48

We fund our peak sales season working capital needs through our domestic revolving credit facility andcommercial paper markets and secured short-term debt.
millions 2016 2015
Secured borrowings:Maximum daily amount outstanding during the period . . . . . . . . . . . . . . . . . . . . . $ 1,150 $ 876Average amount outstanding during the period. . . . . . . . . . . . . . . . . . . . . . . . . . . . 334 416Amount outstanding at period-end . . . . . . . . . . . . . . . . . . . . . . . . . . . . . . . . . . . . . — 797Weighted average interest rate. . . . . . . . . . . . . . . . . . . . . . . . . . . . . . . . . . . . . . . . . 4.6% 3.2%
Unsecured commercial paper:Maximum daily amount outstanding during the period . . . . . . . . . . . . . . . . . . . . . $ 250 $ 104Average amount outstanding during the period. . . . . . . . . . . . . . . . . . . . . . . . . . . . 106 15Amount outstanding at period-end . . . . . . . . . . . . . . . . . . . . . . . . . . . . . . . . . . . . . — —Weighted average interest rate. . . . . . . . . . . . . . . . . . . . . . . . . . . . . . . . . . . . . . . . . 7.9% 4.1%
Secured short-term loan:Maximum daily amount outstanding during the period . . . . . . . . . . . . . . . . . . . . . $ — $ 400Average amount outstanding during the period. . . . . . . . . . . . . . . . . . . . . . . . . . . . — 84Amount outstanding at period-end . . . . . . . . . . . . . . . . . . . . . . . . . . . . . . . . . . . . . — —Weighted average interest rate. . . . . . . . . . . . . . . . . . . . . . . . . . . . . . . . . . . . . . . . . —% 5.0%
Information about our Domestic Credit Agreement, Senior Secured Notes, Senior Unsecured Notes, DebtRepurchase Authorization, Unsecured Commercial Paper, Secured Short-Term Loan, and Wholly-owned InsuranceSubsidiary and Intercompany Securities is included in Note 3 of Notes to Consolidated Financial Statements.
Domestic Pension Plans Funding
Contributions to our pension plans remain a significant use of our cash on an annual basis. While theCompany's pension plans are frozen, and thus associates do not currently earn pension benefits, the Company has alegacy pension obligation for past service performed by Kmart and Sears associates. During 2016, we contributed$314 million to our domestic pension plans. We estimate that the domestic pension contributions will beapproximately $312 million in 2017 and approximately $297 million in 2018. As previously noted, the Companyagreed to grant the PBGC a lien on, and subsequently contribute to the Company's pension plans, the value of the$250 million cash payment payable to the Company on the third anniversary of the Craftsman closing with the valueof such payment being fully credited against the Company's minimum pension funding obligations in 2017, 2018and 2019. The Company also agreed to grant a lien to the PBGC on the 15-year income stream relating to newStanley Black & Decker sales of Craftsman products, and agreed to contribute the payments from Stanley Black &Decker under such income stream to the Company's pension plans, with such payments to be credited against theCompany's minimum pension funding obligations starting no later than five years from the closing date. TheCompany also agreed to grant the PBGC a lien on $100 million of real estate assets to secure the Company'sminimum pension obligations through the end of 2019. The ultimate amount of pension contributions could beaffected by changes in applicable regulations, as well as financial market and investment performance.
49
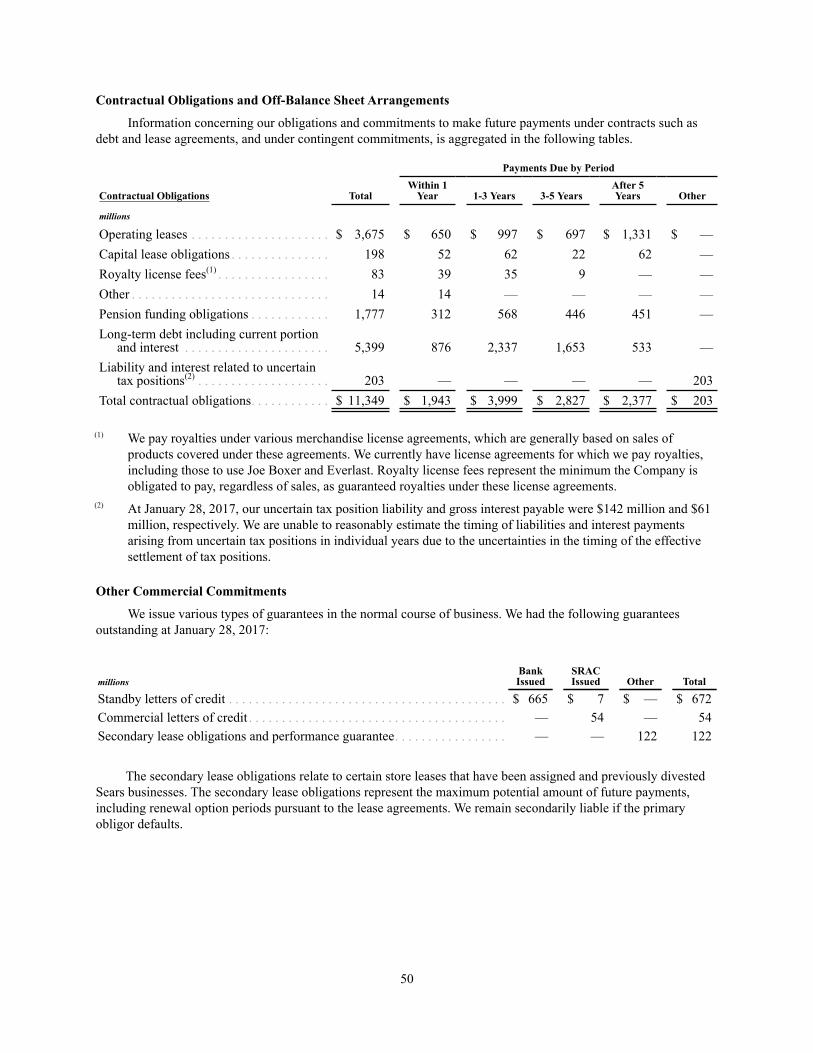
Contractual Obligations and Off-Balance Sheet Arrangements
Information concerning our obligations and commitments to make future payments under contracts such asdebt and lease agreements, and under contingent commitments, is aggregated in the following tables.
Total
Payments Due by Period
Contractual ObligationsWithin 1
Year 1-3 Years 3-5 YearsAfter 5Years Other
millions
Operating leases . . . . . . . . . . . . . . . . . . . . . $ 3,675 $ 650 $ 997 $ 697 $ 1,331 $ —Capital lease obligations . . . . . . . . . . . . . . . 198 52 62 22 62 —Royalty license fees(1) . . . . . . . . . . . . . . . . . 83 39 35 9 — —Other . . . . . . . . . . . . . . . . . . . . . . . . . . . . . . 14 14 — — — —Pension funding obligations . . . . . . . . . . . . 1,777 312 568 446 451 —Long-term debt including current portion
and interest . . . . . . . . . . . . . . . . . . . . . . 5,399 876 2,337 1,653 533 —Liability and interest related to uncertain
tax positions(2) . . . . . . . . . . . . . . . . . . . . 203 — — — — 203Total contractual obligations. . . . . . . . . . . . $ 11,349 $ 1,943 $ 3,999 $ 2,827 $ 2,377 $ 203
(1) We pay royalties under various merchandise license agreements, which are generally based on sales ofproducts covered under these agreements. We currently have license agreements for which we pay royalties,including those to use Joe Boxer and Everlast. Royalty license fees represent the minimum the Company isobligated to pay, regardless of sales, as guaranteed royalties under these license agreements.
(2) At January 28, 2017, our uncertain tax position liability and gross interest payable were $142 million and $61million, respectively. We are unable to reasonably estimate the timing of liabilities and interest paymentsarising from uncertain tax positions in individual years due to the uncertainties in the timing of the effectivesettlement of tax positions.
Other Commercial Commitments
We issue various types of guarantees in the normal course of business. We had the following guaranteesoutstanding at January 28, 2017:
millionsBankIssued
SRACIssued Other Total
Standby letters of credit . . . . . . . . . . . . . . . . . . . . . . . . . . . . . . . . . . . . . . . . . . $ 665 $ 7 $ — $ 672Commercial letters of credit . . . . . . . . . . . . . . . . . . . . . . . . . . . . . . . . . . . . . . . — 54 — 54Secondary lease obligations and performance guarantee. . . . . . . . . . . . . . . . . — — 122 122
The secondary lease obligations relate to certain store leases that have been assigned and previously divestedSears businesses. The secondary lease obligations represent the maximum potential amount of future payments,including renewal option periods pursuant to the lease agreements. We remain secondarily liable if the primaryobligor defaults.
50

Application of Critical Accounting Policies and Estimates
In preparing the financial statements, certain accounting policies require considerable judgment to select theappropriate assumptions to calculate financial estimates. These estimates are complex and subject to an inherentdegree of uncertainty. We base our estimates on historical experience, terms of existing contracts, evaluation oftrends and other assumptions that we believe to be reasonable under the circumstances. We continually evaluate theinformation used to make these estimates as our business and the economic environment change. Although the useof estimates is pervasive throughout the financial statements, we consider an accounting estimate to be critical if:
• it requires assumptions to be made about matters that were highly uncertain at the time the estimate wasmade; and
• changes in the estimate that are reasonably likely to occur from period to period or different estimatesthat could have been selected would have a material effect on our financial condition, cash flows orresults of operations.
Management believes the current assumptions and other considerations used to estimate amounts reflected inthe financial statements are appropriate. However, if actual experience differs from the assumptions and theconsiderations used in estimating amounts, the resulting changes could have a material adverse effect on ourconsolidated results of operations, and in certain situations, could have a material adverse effect on our financialcondition.
Management has discussed the development and selection of these critical accounting estimates with the AuditCommittee of our Board of Directors and the Audit Committee has reviewed the disclosure presented below relatingto the selection of these estimates.
The following is a summary of our most critical policies and estimates. See Note 1 of Notes to ConsolidatedFinancial Statements for a listing of our other significant accounting policies.
Valuation of Inventory
Our inventory is valued at the lower of cost or market determined primarily using the retail inventory method("RIM"). RIM is an averaging method that is commonly used in the retail industry. To determine inventory costunder RIM, inventory at its retail selling value is segregated into groupings of merchandise having similarcharacteristics, which are then converted to a cost basis by applying specific average cost factors for each groupingof merchandise. Cost factors represent the average cost-to-retail ratio for each merchandise group based upon theyear purchasing activity for each store location. Accordingly, a significant assumption under the retail method is thatinventory in each group is similar in terms of its cost-to-retail relationship and has similar turnover rates.Management monitors the content of merchandise in these groupings to prevent distortions that would have amaterial effect on inventory valuation.
RIM inherently requires management judgment and certain estimates that may significantly affect the endinginventory valuation, as well as gross margin. Among others, two significant estimates used in inventory valuationare the level and timing of permanent markdowns (clearance markdowns used to clear unproductive or slow-movinginventory) and shrinkage. Amounts are charged to cost of sales, buying and occupancy at the time the retail value ofinventory is reduced through the use of permanent markdowns.
Factors considered in the determination of permanent markdowns include current and anticipated demand,customer preferences, age of the merchandise, fashion trends and weather conditions. In addition, inventory is alsoevaluated against corporate pre-determined historical markdown cadences. When a decision is made to permanentlymarkdown merchandise, the resulting gross margin reduction is recognized in the period the markdown is recorded.The timing of the decision, particularly surrounding the balance sheet date, can have a significant effect on theresults of operations.
Shrinkage is estimated as a percentage of sales for the period from the date of the last physical inventory to theend of the year. Physical inventories are taken annually for all stores and inventory records are adjusted accordingly.The shrinkage rate from the most recent physical inventory, in combination with historical experience, is used as thebasis for the shrinkage accrual following the physical inventory.
51

Self-insurance Reserves
We use a combination of third-party insurance and/or self-insurance for a number of risks including workers'compensation, asbestos, environmental, automobile, warranty, product and general liability claims. General liabilitycosts relate primarily to litigation that arises from store operations. Self-insurance reserves include actuarialestimates of both claims filed and carried at their expected ultimate settlement value and claims incurred but not yetreported. Our estimated claim amounts are discounted using a rate with a duration that approximates the duration ofour self-insurance reserve portfolio. Our liability reflected in the Consolidated Balance Sheets represents an estimateof the ultimate cost of claims incurred at the balance sheet date. In estimating this liability, we utilize lossdevelopment factors based on Company-specific data to project the future development of incurred losses. Lossestimates are adjusted based upon actual claims settlements and reported claims. These projections are subject to ahigh degree of variability based upon future inflation rates, litigation trends, legal interpretations, benefit levelchanges and claim settlement patterns. Although we do not expect the amounts ultimately paid to differ significantlyfrom our estimates, self-insurance reserves could be affected if future claim experience differs significantly from thehistorical trends and the actuarial assumptions. A 10% change in our self-insurance reserves would have impactednet loss by approximately $72 million.
Defined Benefit Pension Plans
The fundamental components of accounting for defined benefit pension plans consist of the compensation costof the benefits earned, the interest cost from deferring payment of those benefits into the future and the results ofinvesting any assets set aside to fund the obligation. Such retirement benefits were earned by associates ratably overtheir service careers. Therefore, the amounts reported in the income statement for these retirement plans havehistorically followed the same pattern. Accordingly, changes in the obligations or the value of assets to fund themhave been recognized systematically and gradually over the associate's estimated period of service. The largestdrivers of losses or charges in recent years have been the discount rate used to determine the present value of theobligation and the actual return on pension assets. We recognize the changes by amortizing experience gains/lossesin excess of the 10% corridor into expense over the associated service period.
The Company's actuarial valuations utilize key assumptions including discount rates and expected returns onplan assets. We are required to consider current market conditions, including changes in interest rates and plan assetinvestment returns, in determining these assumptions. The determination of our obligations and expense for pensionbenefits is dependent upon certain assumptions used in calculating such amounts. Key assumptions used in theactuarial valuations include the discount rate, expected long-term rate of return on plan assets and mortality rateassumptions. To determine the discount rate used in the development of the benefit obligation and net periodicbenefit cost, a cash flow matching analysis of the expected future benefit payments is performed. In addition toconsidering the results that cash flow matching produces, the Company gives consideration to changes in industrybenchmark yield curve rates. Actuarial assumptions may differ materially from actual results due to changing marketand economic conditions, changes in investment strategies, higher or lower withdrawal rates, and longer or shorterlife spans of participants. For further information, see Note 7 of Notes to Consolidated Financial Statements.
The actual and expected return on plan assets for 2016, 2015 and 2014 were as follows:
2016 2015 2014
Actual return on plan assets . . . . . . . . . . . . . . . . . . . . . . . . . . . . . . . . . . . . . . . . 16.08% (7.35)% 1.49%Expected return on plan assets. . . . . . . . . . . . . . . . . . . . . . . . . . . . . . . . . . . . . . 6.50% 7.00 % 7.00%
The Sears Holdings Corporation Investment Committee is responsible for the investment of the assets ofHoldings' domestic pension plans. The Investment Committee, made up primarily of select members of seniormanagement, has appointed a non-affiliated third party professional to advise the Investment Committee withrespect to the assets of Holdings' domestic pension plans. The plans' overall investment objective is to provide along-term return that, along with Company contributions, is expected to meet future benefit payment requirements.A long-term horizon has been adopted in establishing investment policy such that the likelihood and duration ofinvestment losses are carefully weighed against the long-term potential for appreciation of assets. The plans'investment policies require investments to be diversified across individual securities, industries, market
52

capitalization and valuation characteristics. In addition, various techniques are utilized to monitor, measure andmanage risk.
For purposes of determining the periodic expense of our defined benefit plans, we use the fair value of planassets as the market related value. A one-percentage-point change in the assumed discount rate would have thefollowing effects on the pension liabilities:
millions1 percentage-point
Increase1 percentage-point
Decrease
Effect on interest cost component . . . . . . . . . . . . . . . . . . . . . . . . . . . . . . . . . . . . $ 24 $ (31)Effect on pension benefit obligation . . . . . . . . . . . . . . . . . . . . . . . . . . . . . . . . . . $ (487) $ 583
Income Taxes
We account for income taxes according to accounting standards for such taxes. Deferred tax assets andliabilities are recognized for the future tax consequences attributable to differences between the book basis and taxbasis of assets and liabilities. Deferred tax assets and liabilities are measured using enacted tax rates expected toapply to taxable income in the years in which those temporary differences are expected to be recovered or settled. Iffuture utilization of deferred tax assets is uncertain, the Company may record a valuation allowance against itsdeferred tax assets. Our accounting policies related to the valuation allowance are further described in Note 1 ofNotes to Consolidated Financial Statements. After consideration of evidence regarding the ability to realize ourdeferred tax assets, we established a valuation allowance against deferred income tax assets in 2016, 2015 and 2014.For the year ended January 28, 2017, the valuation allowance increased by $762 million of which a decrease of $3million was recorded through other comprehensive income. The Company continues to monitor its operatingperformance and evaluate the likelihood of the future realization of these deferred tax assets.
Significant management judgment is required in determining our provision for income taxes, deferred taxassets and liabilities and the valuation allowance recorded against our net deferred tax assets, if any. Managementconsiders estimates of the amount and character of future taxable income in assessing the likelihood of realization ofdeferred tax assets. Our actual effective tax rate and income tax expense could vary from estimated amounts due tothe future impacts of various items, including changes in income tax laws, tax planning and the Company'sforecasted financial condition and results of operations in future periods. Although management believes currentestimates are reasonable, actual results could differ from these estimates.
Domestic and foreign tax authorities periodically audit our income tax returns. These audits include questionsregarding our tax filing positions, including the timing and amount of deductions and the allocation of incomeamong various tax jurisdictions. In evaluating the exposures associated with our various tax filing positions, werecord reserves in accordance with accounting standards for uncertain tax positions. A number of years may elapsebefore a particular matter, for which we have established a reserve, is audited and fully resolved. Management'sestimates at the date of the financial statements reflect our best judgment, giving consideration to all currentlyavailable facts and circumstances. As such, these estimates may require adjustment in the future, as additional factsbecome known or as circumstances change. For further information, see Note 10 of Notes to Consolidated FinancialStatements.
Goodwill and Intangible Asset Impairment Assessments
At both January 28, 2017 and January 30, 2016, we had goodwill balances of $269 million, and intangibleasset balances of $1.5 billion and $1.9 billion, respectively. The Company evaluates the carrying value of goodwilland intangible assets for possible impairment under accounting standards governing goodwill and other intangibleassets. Our accounting policies related to goodwill and intangible asset impairment assessments are further describedin Note 1 of Notes to Consolidated Financial Statements.
Goodwill Impairment Assessments
Our goodwill balance relates to our Home Services business. We did not record any goodwill impairmentcharges in 2016, 2015 or 2014.
53

The use of different assumptions, estimates or judgments in either step of the goodwill impairment testingprocess, such as the estimated future cash flows of the reporting unit, the discount rate used to discount such cashflows, or the estimated fair value of the reporting unit's tangible and intangible assets and liabilities, couldsignificantly increase or decrease the estimated fair value of the reporting unit or its net assets. At the 2016 annualimpairment test date, the conclusion that no indication of goodwill impairment existed for the reporting unit wouldnot have changed had the test been conducted assuming: (1) a 100 basis point increase in the discount rate used todiscount the aggregate estimated cash flows of the reporting unit to its net present value in determining theirestimated fair values; and/or (2) a 100 basis point decrease in the estimated sales growth rate and/or terminal periodgrowth rate.
Based on our sensitivity analysis, we do not believe that the remaining recorded goodwill balance is at risk ofimpairment at the reporting unit at the end of the year because the fair value is in excess of the carrying value andnot at risk of failing step one. However, goodwill impairment charges may be recognized in future periods in thereporting unit to the extent changes in factors or circumstances occur, including deterioration in the macroeconomicenvironment, retail industry or in the equity markets, which includes the market value of our common shares,deterioration in our performance or our future projections, or changes in our plans for the reporting unit.
Intangible Asset Impairment Assessments
The majority of our indefinite-lived intangible assets relate to the Sears, Kenmore, Craftsman and DieHardtrade names. In 2016 and 2015, we recorded impairment related to the Sears trade name of $381 million and $180million, respectively, which reduced the carrying value to $431 million at January 28, 2017. We did not record anyintangible asset impairment charges in 2014.
The use of different assumptions, estimates or judgments in our intangible asset impairment testing process,such as the estimated future cash flows of assets and the discount rate used to discount such cash flows, couldsignificantly increase or decrease the estimated fair value of an asset, and therefore, impact the related impairmentcharge. At the 2016 annual impairment test date, the above-noted conclusion that no indication of intangible assetimpairment existed at the test date for the Kenmore, Craftsman and DieHard trade names would have changed hadthe test been conducted assuming: (1) a 100 basis point increase in the discount rate used to discount the aggregateestimated cash flows of our assets to their net present value in determining their estimated fair values (without anychange in the aggregate estimated cash flows of our intangibles); (2) a 100 basis point decrease in the terminalperiod growth rate; (3) a 10% decrease in the revenue growth rate for fiscal year 2017; or (4) a 10 basis pointdecrease in the royalty rate applied to the forecasted net sales stream of our assets and would have resulted in apotential impairment of up to $163 million under any combination of those scenarios. Also, the above-notedimpairment related to the Sears trade name would have changed under any combination of those scenarios andwould have resulted in potential incremental impairment of up to $125 million.
We believe the impairment charges of $381 million and $180 million in 2016 and 2015, respectively, areappropriate based on the judgments and estimates used in our analysis. We do not believe that the other indefinite-lived intangible balances are impaired at the end of the year because the fair values are in excess of the carryingvalues based on our analysis. However, further indefinite-lived intangible impairment charges may be recognized infuture periods to the extent changes in factors or circumstances occur, including deterioration in the macroeconomicenvironment, retail industry, deterioration in our performance or our future projections, if actual results are notconsistent with our estimates and assumptions used in the analysis, or changes in our plans for one or moreindefinite-lived intangible assets. We will continue to monitor for such changes in facts or circumstances, which maybe indicators of potential impairment triggers, and may result in impairment charges in the future, which could bematerial to our results of operations.
Impairment of Long-Lived Assets
In accordance with accounting standards governing the impairment or disposal of long-lived assets, thecarrying value of long-lived assets, including property and equipment and definite-lived intangible assets, isevaluated whenever events or changes in circumstances indicate that a potential impairment has occurred relative toa given asset or assets. Our accounting policies related to long-lived asset impairment assessments are furtherdescribed in Note 1 of Notes to Consolidated Financial Statements. As a result of this impairment testing, the
54

Company recorded impairment charges of $46 million, $94 million and $34 million during 2016, 2015 and 2014,respectively. Our impairment testing includes uncertainty because it requires management to make assumptions andto apply judgment to estimate future cash flows and asset fair values. If actual results are not consistent with ourestimates and assumptions used in estimating future cash flows and asset fair values, we may be exposed toadditional impairment charges in the future, which could be material to our results of operations.
New Accounting Pronouncements
See Note 1 of Notes to Consolidated Financial Statements for information regarding new accountingpronouncements.
55
CAUTIONARY STATEMENT REGARDING FORWARD-LOOKING INFORMATION
Certain statements made in this Annual Report on Form 10-K and in other public announcements by uscontain forward-looking statements within the meaning of the Section 27A of the Securities Act of 1933, asamended, Section 21E of the Securities Act of 1934, as amended, and the Private Securities Litigation Reform Act of1995. Forward-looking statements include information concerning our future financial performance, businessstrategy, plans, goals and objectives. Statements preceded or followed by, or that otherwise include, the words"believes," "expects," "anticipates," "intends," "estimates," "plans," "forecast," "is likely to" and similar expressionsor future or conditional verbs such as "will," "may" and "could" are generally forward-looking in nature and nothistorical facts. Such statements are based upon the current beliefs and expectations of the Company's managementand are subject to significant risks and uncertainties, many of which are beyond the Company's control, that maycause our actual results, performance or achievements to be materially different from any future results, performanceor achievements expressed or implied by these forward-looking statements. Actual results may differ materiallyfrom those set forth in the forward-looking statements.
The following factors, among others, could cause actual results to differ from those set forth in the forward-looking statements: our ability to successfully implement our integrated retail strategy to transform our business; ourability to successfully manage our inventory levels; initiatives to improve our liquidity through inventorymanagement and other actions; vendors’ lack of willingness to provide acceptable payment terms or otherwiserestricting financing to purchase inventory or services; possible limits on our access to our domestic credit facility,which is subject to a borrowing base limitation and a springing fixed charge coverage ratio covenant, capital marketsand other financing sources, including additional second lien financings, with respect to which we do not havecommitments from lenders; our ability to successfully achieve our plans to generate liquidity through potentialtransactions or otherwise; our ability to achieve cost savings initiatives; potential liabilities in connection with theseparation of Lands’ End and disposition of a portion of our ownership interest in Sears Canada or othertransactions; payment-related risks that could increase our operating costs, expose us to fraud or theft, subject us topotential liability and potentially disrupt our business operations; the impact of seasonal buying patterns, includingseasonal fluctuations due to weather conditions, which are difficult to forecast with certainty; fluctuations in oursales due to changes in customers’ spending patterns and prevailing economic conditions; risks and uncertaintiesrelated to the Seritage transaction and the amendment and extension of our credit facility, such as the impact of theevaluation of any such transaction on our other businesses; our dependence on sources outside the United States forsignificant amounts of our merchandise; our reliance on third parties to provide us with services in connection withthe administration of certain aspects of our business and the transfer of significant internal historical knowledge tosuch parties; impairment charges for goodwill and intangible assets or fixed-asset impairment for long-lived assets;our ability to attract, motivate and retain key executives and other associates; the substantial influence exerted overthe Company by affiliates of our Chairman and Chief Executive Officer, whose interests may diverge from otherstockholders’ interests; our ability to protect or preserve the image of our brands; the outcome of pending and/orfuture legal proceedings, including shareholder litigation, product liability, patent infringement and qui tam claimsand proceedings with respect to which the parties have reached a preliminary settlement; our failure to comply withfederal, state, local and international laws, or changes in these laws; and the timing, amount and other risks related torequired pension plan funding.
Certain of these and other factors are discussed in more detail in Part I, Item 1A of this Annual Report onForm 10-K. While we believe that our forecasts and assumptions are reasonable, we caution that actual results may

differ materially. We intend the forward-looking statements to speak only as of the time made and do not undertaketo update or revise them as more information becomes available, except as required by law.
56
Item 7A. Quantitative and Qualitative Disclosures about Market Risk
We face market risk exposure in the form of interest rate risk. This market risk arises from our debt obligations.
Interest Rate Risk
We manage interest rate risk through the use of fixed and variable-rate funding. All debt securities areconsidered non-trading. At January 28, 2017, 49% of our debt portfolio was variable rate. Based on the size of thisvariable rate debt portfolio at January 28, 2017, which totaled approximately $2.0 billion, an immediate 100 basispoint change in interest rates would have affected annual pretax funding costs by $20 million. These estimates donot take into account the effect on income resulting from invested cash or the returns on assets being funded. Theseestimates also assume that the variable rate funding portfolio remains constant for an annual period and that theinterest rate change occurs at the beginning of the period.
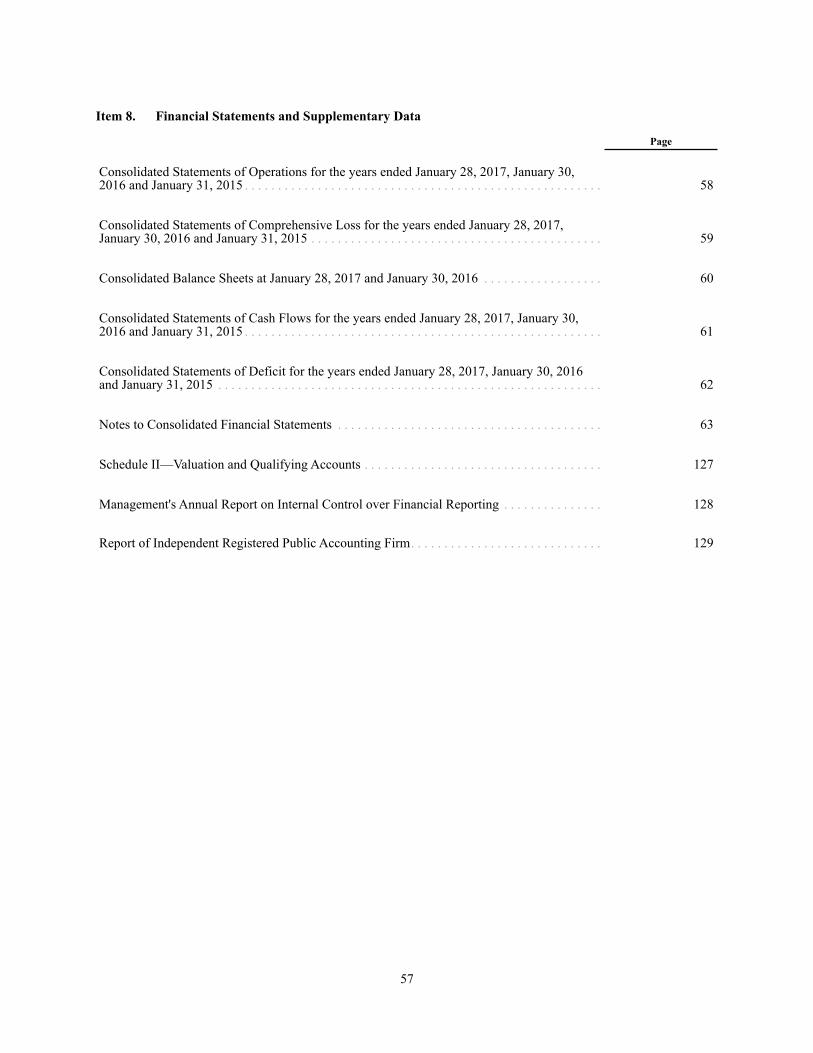
57
Item 8. Financial Statements and Supplementary Data
Page
Consolidated Statements of Operations for the years ended January 28, 2017, January 30,2016 and January 31, 2015 . . . . . . . . . . . . . . . . . . . . . . . . . . . . . . . . . . . . . . . . . . . . . . . . . . . . . . 58
Consolidated Statements of Comprehensive Loss for the years ended January 28, 2017,January 30, 2016 and January 31, 2015 . . . . . . . . . . . . . . . . . . . . . . . . . . . . . . . . . . . . . . . . . . . . 59
Consolidated Balance Sheets at January 28, 2017 and January 30, 2016 . . . . . . . . . . . . . . . . . . 60
Consolidated Statements of Cash Flows for the years ended January 28, 2017, January 30,2016 and January 31, 2015 . . . . . . . . . . . . . . . . . . . . . . . . . . . . . . . . . . . . . . . . . . . . . . . . . . . . . . 61
Consolidated Statements of Deficit for the years ended January 28, 2017, January 30, 2016and January 31, 2015 . . . . . . . . . . . . . . . . . . . . . . . . . . . . . . . . . . . . . . . . . . . . . . . . . . . . . . . . . . 62
Notes to Consolidated Financial Statements . . . . . . . . . . . . . . . . . . . . . . . . . . . . . . . . . . . . . . . . 63
Schedule II—Valuation and Qualifying Accounts . . . . . . . . . . . . . . . . . . . . . . . . . . . . . . . . . . . . 127
Management's Annual Report on Internal Control over Financial Reporting . . . . . . . . . . . . . . . 128
Report of Independent Registered Public Accounting Firm. . . . . . . . . . . . . . . . . . . . . . . . . . . . . 129

SEARS HOLDINGS CORPORATIONConsolidated Statements of Operations
millions, except per share data 2016 2015 2014
REVENUESMerchandise sales and services(1)(2) . . . . . . . . . . . . . . . . . . . . . . . . . . $ 22,138 $ 25,146 $ 31,198COSTS AND EXPENSESCost of sales, buying and occupancy(1)(3) . . . . . . . . . . . . . . . . . . . . . . 17,452 19,336 24,049Selling and administrative . . . . . . . . . . . . . . . . . . . . . . . . . . . . . . . . . 6,109 6,857 8,220Depreciation and amortization . . . . . . . . . . . . . . . . . . . . . . . . . . . . . . 375 422 581Impairment charges . . . . . . . . . . . . . . . . . . . . . . . . . . . . . . . . . . . . . . 427 274 63Gain on sales of assets . . . . . . . . . . . . . . . . . . . . . . . . . . . . . . . . . . . . (247) (743) (207)
Total costs and expenses . . . . . . . . . . . . . . . . . . . . . . . . . . . . . . . 24,116 26,146 32,706Operating loss . . . . . . . . . . . . . . . . . . . . . . . . . . . . . . . . . . . . . . . . . . . (1,978) (1,000) (1,508)Interest expense . . . . . . . . . . . . . . . . . . . . . . . . . . . . . . . . . . . . . . . . . (404) (323) (313)Interest and investment income (loss) . . . . . . . . . . . . . . . . . . . . . . . . (26) (62) 132Other income . . . . . . . . . . . . . . . . . . . . . . . . . . . . . . . . . . . . . . . . . . . 13 — 4Loss before income taxes . . . . . . . . . . . . . . . . . . . . . . . . . . . . . . . . . . (2,395) (1,385) (1,685)Income tax (expense) benefit . . . . . . . . . . . . . . . . . . . . . . . . . . . . . . . 174 257 (125)Net loss . . . . . . . . . . . . . . . . . . . . . . . . . . . . . . . . . . . . . . . . . . . . . . . . (2,221) (1,128) (1,810)(Income) loss attributable to noncontrolling interests . . . . . . . . . . . . — (1) 128NET LOSS ATTRIBUTABLE TO HOLDINGS’SHAREHOLDERS . . . . . . . . . . . . . . . . . . . . . . . . . . . . . . . . . . . . . $ (2,221) $ (1,129) $ (1,682)
NET LOSS PER COMMON SHARE ATTRIBUTABLE TOHOLDINGS’ SHAREHOLDERS
Basic loss per share. . . . . . . . . . . . . . . . . . . . . . . . . . . . . . . . . . . . . . . $ (20.78) $ (10.59) $ (15.82)Diluted loss per share . . . . . . . . . . . . . . . . . . . . . . . . . . . . . . . . . . . . . $ (20.78) $ (10.59) $ (15.82)Basic weighted average common shares outstanding. . . . . . . . . . . . . 106.9 106.6 106.3Diluted weighted average common shares outstanding . . . . . . . . . . . 106.9 106.6 106.3
(1) Includes merchandise sales to Sears Hometown and Outlet Stores, Inc. ("SHO") of $1.1 billion, $1.3 billion and $1.4 billion in 2016, 2015 and2014, respectively. Pursuant to the terms of the separation, merchandise is sold to SHO at cost.
(2) Includes revenue from Lands' End, Inc. ("Lands' End") for retail services and rent for Lands' End Shops at Sears, participation in the ShopYour Way program and corporate shared services of $52 million, $59 million and $59 million in 2016, 2015 and 2014, respectively.
(3) Includes rent expense (consisting of straight-line rent expense offset by amortization of a deferred gain on sale-leaseback) of $83 million and$49 million in 2016 and 2015, respectively, and installment expenses of $64 million and $40 million in 2016 and 2015, respectively, pursuantto the master lease with Seritage Growth Properties ("Seritage"). There were no such rent or installment expenses paid to Seritage in 2014.
See accompanying Notes to Consolidated Financial Statements.
58

SEARS HOLDINGS CORPORATIONConsolidated Statements of Comprehensive Loss
millions 2016 2015 2014
Net loss. . . . . . . . . . . . . . . . . . . . . . . . . . . . . . . . . . . . . . . . . . . . . . . . . . . . $ (2,221) $ (1,128) $ (1,810)Other comprehensive income (loss)
Pension and postretirement adjustments, net of tax . . . . . . . . . . . . . . 366 113 (1,040)Deferred loss on derivatives, net of tax . . . . . . . . . . . . . . . . . . . . . . . — — (2)Currency translation adjustments, net of tax . . . . . . . . . . . . . . . . . . . — (1) 3Sears Canada de-consolidation . . . . . . . . . . . . . . . . . . . . . . . . . . . . . . — — (186)Dissolution of noncontrolling interest . . . . . . . . . . . . . . . . . . . . . . . . (7) — —
Total other comprehensive income (loss) . . . . . . . . . . . . . . . . . . . . . . . . . 359 112 (1,225)Comprehensive loss . . . . . . . . . . . . . . . . . . . . . . . . . . . . . . . . . . . . . . . . . . (1,862) (1,016) (3,035)Comprehensive (income) loss attributable to noncontrolling interests . . . 7 (1) 438Comprehensive loss attributable to Holdings' shareholders . . . . . . . . . . . $ (1,855) $ (1,017) $ (2,597)
See accompanying Notes to Consolidated Financial Statements.
59

SEARS HOLDINGS CORPORATIONConsolidated Balance Sheets
millionsJanuary 28,
2017January 30,
2016
ASSETSCurrent assets
Cash and cash equivalents . . . . . . . . . . . . . . . . . . . . . . . . . . . . . . . . . . . . . . . . . . . . . . . . . . . . . . . . . . . . . . . $ 286 $ 238Accounts receivable(1) . . . . . . . . . . . . . . . . . . . . . . . . . . . . . . . . . . . . . . . . . . . . . . . . . . . . . . . . . . . . . . . . . . 466 419Merchandise inventories . . . . . . . . . . . . . . . . . . . . . . . . . . . . . . . . . . . . . . . . . . . . . . . . . . . . . . . . . . . . . . . . 3,959 5,172Prepaid expenses and other current assets(2) . . . . . . . . . . . . . . . . . . . . . . . . . . . . . . . . . . . . . . . . . . . . . . . . . 285 216Total current assets. . . . . . . . . . . . . . . . . . . . . . . . . . . . . . . . . . . . . . . . . . . . . . . . . . . . . . . . . . . . . . . . . . . . . 4,996 6,045
Property and equipmentLand . . . . . . . . . . . . . . . . . . . . . . . . . . . . . . . . . . . . . . . . . . . . . . . . . . . . . . . . . . . . . . . . . . . . . . . . . . . . . . . . . . . . 770 827Buildings and improvements . . . . . . . . . . . . . . . . . . . . . . . . . . . . . . . . . . . . . . . . . . . . . . . . . . . . . . . . . . . . . . . . . 2,954 3,140Furniture, fixtures and equipment. . . . . . . . . . . . . . . . . . . . . . . . . . . . . . . . . . . . . . . . . . . . . . . . . . . . . . . . . . . . . . 1,133 1,352Capital leases . . . . . . . . . . . . . . . . . . . . . . . . . . . . . . . . . . . . . . . . . . . . . . . . . . . . . . . . . . . . . . . . . . . . . . . . . . . . . 224 272
Gross property and equipment . . . . . . . . . . . . . . . . . . . . . . . . . . . . . . . . . . . . . . . . . . . . . . . . . . . . . . . . . . . . 5,081 5,591Less accumulated depreciation and amortization . . . . . . . . . . . . . . . . . . . . . . . . . . . . . . . . . . . . . . . . . . . . . (2,841) (2,960)Total property and equipment, net . . . . . . . . . . . . . . . . . . . . . . . . . . . . . . . . . . . . . . . . . . . . . . . . . . . . . . . . . 2,240 2,631
Goodwill . . . . . . . . . . . . . . . . . . . . . . . . . . . . . . . . . . . . . . . . . . . . . . . . . . . . . . . . . . . . . . . . . . . . . . . . . . . . . . . . . 269 269Trade names and other intangible assets. . . . . . . . . . . . . . . . . . . . . . . . . . . . . . . . . . . . . . . . . . . . . . . . . . . . . . . . . 1,521 1,909Other assets . . . . . . . . . . . . . . . . . . . . . . . . . . . . . . . . . . . . . . . . . . . . . . . . . . . . . . . . . . . . . . . . . . . . . . . . . . . . . . . 336 483
TOTAL ASSETS . . . . . . . . . . . . . . . . . . . . . . . . . . . . . . . . . . . . . . . . . . . . . . . . . . . . . . . . . . . . . . . . . . . . . $ 9,362 $ 11,337
LIABILITIESCurrent liabilities
Short-term borrowings . . . . . . . . . . . . . . . . . . . . . . . . . . . . . . . . . . . . . . . . . . . . . . . . . . . . . . . . . . . . . . . . . . $ — $ 797Current portion of long-term debt and capitalized lease obligations(3) . . . . . . . . . . . . . . . . . . . . . . . . . . . . . 590 71Merchandise payables . . . . . . . . . . . . . . . . . . . . . . . . . . . . . . . . . . . . . . . . . . . . . . . . . . . . . . . . . . . . . . . . . . 1,048 1,574Other current liabilities(4) . . . . . . . . . . . . . . . . . . . . . . . . . . . . . . . . . . . . . . . . . . . . . . . . . . . . . . . . . . . . . . . . 1,956 1,925Unearned revenues. . . . . . . . . . . . . . . . . . . . . . . . . . . . . . . . . . . . . . . . . . . . . . . . . . . . . . . . . . . . . . . . . . . . . 748 787Other taxes . . . . . . . . . . . . . . . . . . . . . . . . . . . . . . . . . . . . . . . . . . . . . . . . . . . . . . . . . . . . . . . . . . . . . . . . . . . 339 284Total current liabilities . . . . . . . . . . . . . . . . . . . . . . . . . . . . . . . . . . . . . . . . . . . . . . . . . . . . . . . . . . . . . . . . . . 4,681 5,438
Long-term debt and capitalized lease obligations(5) . . . . . . . . . . . . . . . . . . . . . . . . . . . . . . . . . . . . . . . . . . . . . . . . 3,573 2,108Pension and postretirement benefits . . . . . . . . . . . . . . . . . . . . . . . . . . . . . . . . . . . . . . . . . . . . . . . . . . . . . . . . . . . . 1,750 2,206Deferred gain on sale-leaseback . . . . . . . . . . . . . . . . . . . . . . . . . . . . . . . . . . . . . . . . . . . . . . . . . . . . . . . . . . . . . . . 563 753Sale-leaseback financing obligation . . . . . . . . . . . . . . . . . . . . . . . . . . . . . . . . . . . . . . . . . . . . . . . . . . . . . . . . . . . . 235 164Other long-term liabilities. . . . . . . . . . . . . . . . . . . . . . . . . . . . . . . . . . . . . . . . . . . . . . . . . . . . . . . . . . . . . . . . . . . . 1,641 1,731Long-term deferred tax liabilities . . . . . . . . . . . . . . . . . . . . . . . . . . . . . . . . . . . . . . . . . . . . . . . . . . . . . . . . . . . . . . 743 893
Total Liabilities . . . . . . . . . . . . . . . . . . . . . . . . . . . . . . . . . . . . . . . . . . . . . . . . . . . . . . . . . . . . . . . . . . . . . . . 13,186 13,293Commitments and contingenciesDEFICITSears Holdings Corporation deficit
Preferred stock, 20 shares authorized; no shares outstanding . . . . . . . . . . . . . . . . . . . . . . . . . . . . . . . . . . . . — —Common stock $0.01 par value; 500 shares authorized; 107 and 107 shares outstanding, respectively. . . . 1 1Treasury stock—at cost . . . . . . . . . . . . . . . . . . . . . . . . . . . . . . . . . . . . . . . . . . . . . . . . . . . . . . . . . . . . . . . . . (5,891) (5,928)Capital in excess of par value . . . . . . . . . . . . . . . . . . . . . . . . . . . . . . . . . . . . . . . . . . . . . . . . . . . . . . . . . . . . 9,130 9,173Retained deficit . . . . . . . . . . . . . . . . . . . . . . . . . . . . . . . . . . . . . . . . . . . . . . . . . . . . . . . . . . . . . . . . . . . . . . . (5,512) (3,291)Accumulated other comprehensive loss. . . . . . . . . . . . . . . . . . . . . . . . . . . . . . . . . . . . . . . . . . . . . . . . . . . . . (1,552) (1,918)Total Sears Holdings Corporation deficit . . . . . . . . . . . . . . . . . . . . . . . . . . . . . . . . . . . . . . . . . . . . . . . . . . . (3,824) (1,963)
Noncontrolling interest . . . . . . . . . . . . . . . . . . . . . . . . . . . . . . . . . . . . . . . . . . . . . . . . . . . . . . . . . . . . . . . . . . . . . . — 7Total Deficit . . . . . . . . . . . . . . . . . . . . . . . . . . . . . . . . . . . . . . . . . . . . . . . . . . . . . . . . . . . . . . . . . . . . . (3,824) (1,956)
TOTAL LIABILITIES AND DEFICIT . . . . . . . . . . . . . . . . . . . . . . . . . . . . . . . . . . . . . . . . . . . . . . . . . . . $ 9,362 $ 11,337(1) Includes $81 million and $51 million at January 28, 2017 and January 30, 2016, respectively, of net amounts receivable from SHO, and $14 million and $7 million of
amounts receivable from Seritage at January 28, 2017 and January 30, 2016, respectively.(2) Includes $9 million of prepaid rent to Seritage at January 30, 2016.(3) Includes balances held by related parties of $216 million at January 28, 2017 related to our 2016 Secured Loan Facility.(4) Includes $1 million and $1 million of net amounts payable to Lands' End at January 28, 2017 and January 30, 2016, respectively, and $11 million of amounts payable to
Seritage at January 28, 2017.(5) Includes balances held by related parties of $1.7 billion and $603 million at January 28, 2017 and January 30, 2016, respectively, related to our Senior Secured Notes,
Subsidiary Notes, Senior Unsecured Notes, Second Lien Term Loan, 2016 Term Loan and 2017 Secured Loan Facility. See Note 15 for further information.
See accompanying Notes to Consolidated Financial Statements.
60

SEARS HOLDINGS CORPORATIONConsolidated Statements of Cash Flows
millions 2016 2015 2014CASH FLOWS FROM OPERATING ACTIVITIESNet loss. . . . . . . . . . . . . . . . . . . . . . . . . . . . . . . . . . . . . . . . . . . . . . . . . . . . . . . . . . . . . . . . . . . . . . . . . . . . . . (2,221) (1,128) (1,810)Adjustments to reconcile net loss to net cash used in operating activities:
Deferred tax valuation allowance . . . . . . . . . . . . . . . . . . . . . . . . . . . . . . . . . . . . . . . . . . . . . . . . . . . . . 836 217 835Tax benefit resulting from Other Comprehensive Income allocation. . . . . . . . . . . . . . . . . . . . . . . . . . (71) — —Depreciation and amortization . . . . . . . . . . . . . . . . . . . . . . . . . . . . . . . . . . . . . . . . . . . . . . . . . . . . . . . 375 422 581Impairment charges. . . . . . . . . . . . . . . . . . . . . . . . . . . . . . . . . . . . . . . . . . . . . . . . . . . . . . . . . . . . . . . . 427 274 63Gain on sales of assets . . . . . . . . . . . . . . . . . . . . . . . . . . . . . . . . . . . . . . . . . . . . . . . . . . . . . . . . . . . . . (247) (743) (207)Gain on sales of investments. . . . . . . . . . . . . . . . . . . . . . . . . . . . . . . . . . . . . . . . . . . . . . . . . . . . . . . . . — — (105)Pension and postretirement plan contributions . . . . . . . . . . . . . . . . . . . . . . . . . . . . . . . . . . . . . . . . . . . (334) (311) (450)Mark-to-market adjustments of financial instruments . . . . . . . . . . . . . . . . . . . . . . . . . . . . . . . . . . . . . 15 66 (3)Amortization of deferred gain on sale-leaseback . . . . . . . . . . . . . . . . . . . . . . . . . . . . . . . . . . . . . . . . . (88) (52) —Amortization of debt issuance costs and accretion of debt discount . . . . . . . . . . . . . . . . . . . . . . . . . . 81 60 38Settlement of Canadian dollar hedges. . . . . . . . . . . . . . . . . . . . . . . . . . . . . . . . . . . . . . . . . . . . . . . . . . — — 8Change in operating assets and liabilities (net of acquisitions and dispositions):
Deferred income taxes . . . . . . . . . . . . . . . . . . . . . . . . . . . . . . . . . . . . . . . . . . . . . . . . . . . . . . . . . (987) (519) (719)Merchandise inventories . . . . . . . . . . . . . . . . . . . . . . . . . . . . . . . . . . . . . . . . . . . . . . . . . . . . . . . 1,213 (229) 1,091Merchandise payables . . . . . . . . . . . . . . . . . . . . . . . . . . . . . . . . . . . . . . . . . . . . . . . . . . . . . . . . . (526) (47) (528)Income and other taxes . . . . . . . . . . . . . . . . . . . . . . . . . . . . . . . . . . . . . . . . . . . . . . . . . . . . . . . . 80 (95) (110)Other operating assets . . . . . . . . . . . . . . . . . . . . . . . . . . . . . . . . . . . . . . . . . . . . . . . . . . . . . . . . . (52) 54 (66)Other operating liabilities . . . . . . . . . . . . . . . . . . . . . . . . . . . . . . . . . . . . . . . . . . . . . . . . . . . . . . 118 (136) (5)
Net cash used in operating activities . . . . . . . . . . . . . . . . . . . . . . . . . . . . . . . . . . . . . . . . . . . . . . . . . (1,381) (2,167) (1,387)
CASH FLOWS FROM INVESTING ACTIVITIESProceeds from sales of property and investments(1) . . . . . . . . . . . . . . . . . . . . . . . . . . . . . . . . . . . . . . . 386 2,730 424Purchases of property and equipment . . . . . . . . . . . . . . . . . . . . . . . . . . . . . . . . . . . . . . . . . . . . . . . . . . (142) (211) (270)De-consolidation of Sears Canada cash . . . . . . . . . . . . . . . . . . . . . . . . . . . . . . . . . . . . . . . . . . . . . . . . — — (207)Proceeds from Sears Canada rights offering(2) . . . . . . . . . . . . . . . . . . . . . . . . . . . . . . . . . . . . . . . . . . . — — 380Net cash provided by investing activities . . . . . . . . . . . . . . . . . . . . . . . . . . . . . . . . . . . . . . . . . . . . . . . 244 2,519 327
CASH FLOWS FROM FINANCING ACTIVITIESProceeds from debt issuances(3) . . . . . . . . . . . . . . . . . . . . . . . . . . . . . . . . . . . . . . . . . . . . . . . . . . . . . . 2,028 — 1,025Repayments of debt(4) . . . . . . . . . . . . . . . . . . . . . . . . . . . . . . . . . . . . . . . . . . . . . . . . . . . . . . . . . . . . . . (66) (1,405) (80)Increase (decrease) in short-term borrowings, primarily 90 days or less . . . . . . . . . . . . . . . . . . . . . . . (797) 583 (1,117)Proceeds from sale-leaseback financing(1) . . . . . . . . . . . . . . . . . . . . . . . . . . . . . . . . . . . . . . . . . . . . . . 71 508 —Lands' End, Inc. pre-separation funding . . . . . . . . . . . . . . . . . . . . . . . . . . . . . . . . . . . . . . . . . . . . . . . . — — 515Separation of Lands' End, Inc. . . . . . . . . . . . . . . . . . . . . . . . . . . . . . . . . . . . . . . . . . . . . . . . . . . . . . . . — — (31)Debt issuance costs . . . . . . . . . . . . . . . . . . . . . . . . . . . . . . . . . . . . . . . . . . . . . . . . . . . . . . . . . . . . . . . . (51) (50) (27)Net cash provided by (used in) financing activities . . . . . . . . . . . . . . . . . . . . . . . . . . . . . . . . . . . . . . . 1,185 (364) 285
Effect of exchange rate changes on cash and cash equivalents . . . . . . . . . . . . . . . . . . . . . . . . . . . . . . . . . . . — — (3)NET INCREASE (DECREASE) IN CASH AND CASH EQUIVALENTS. . . . . . . . . . . . . . . . . . . . . . . . . 48 (12) (778)CASH AND CASH EQUIVALENTS, BEGINNING OF YEAR . . . . . . . . . . . . . . . . . . . . . . . . . . . . . . . 238 250 1,028CASH AND CASH EQUIVALENTS, END OF YEAR . . . . . . . . . . . . . . . . . . . . . . . . . . . . . . . . . . . . . . $ 286 $ 238 $ 250
SUPPLEMENTAL INFORMATION:Capital lease obligation incurred . . . . . . . . . . . . . . . . . . . . . . . . . . . . . . . . . . . . . . . . . . . . . . . . . . . . . . . . . . $ 25 $ 6 $ 45Supplemental Cash Flow Data:
Income taxes paid, net of refunds . . . . . . . . . . . . . . . . . . . . . . . . . . . . . . . . . . . . . . . . . . . . . . . . . . . . . $ 23 $ 45 $ 119Cash interest paid(5) . . . . . . . . . . . . . . . . . . . . . . . . . . . . . . . . . . . . . . . . . . . . . . . . . . . . . . . . . . . . . . . . 275 252 230Unpaid liability to acquire equipment and software . . . . . . . . . . . . . . . . . . . . . . . . . . . . . . . . . . . . . . . 18 27 25
(1) Holdings received cash proceeds of $2.7 billion ($2.6 billion, net of closing costs) from the Seritage transaction (including $745 million and $297million, respectively, received from ESL Investments, Inc. and its affiliates ("ESL") and Fairholme Capital Management, LLC and its affiliates("Fairholme")), and $429 million ($426 million, net of closing costs) from the JV transactions. Proceeds from the Seritage transaction are included inproceeds from sales of property and investments ($2.6 billion), and proceeds from sale-leaseback financing ($82 million) for 2015. Proceeds from theJV transactions are included in proceeds from sale-leaseback financing ($426 million) for 2015. See Note 11 for further information and defined terms.
(2) Includes proceeds of $212 million received from ESL and its affiliates and $93 million received from Fairholme and its affiliates.(3) Proceeds in 2016 and 2014, respectively, include amounts from related parties of $1.3 billion received from the 2017 Secured Loan Facility, 2016
Secured Loan Facility, 2016 Term Loan and Second Lien Term Loan, and $878 million received from the Secured Short-Term Loan and SeniorUnsecured Notes. See Notes 3 and 15 for further information and defined terms.
(4) Repayments in 2015 include $400 million of the Secured Short-Term Loan with related parties and $482 million of Senior Secured Notes tendered byrelated parties, respectively. See Notes 3 and 15 for further information and defined terms.
(5) Cash interest paid includes $94 million, $83 million and $30 million interest paid to related parties related to our borrowings in 2016, 2015 and 2014,respectively. See Notes 3 and 15 for further information.
See accompanying Notes to Consolidated Financial Statements.
61

SEARS HOLDINGS CORPORATIONConsolidated Statements of Deficit
Deficit Attributable to Holdings’ Shareholders
dollars and shares in millions
Numberof
SharesCommon
StockTreasury
Stock
Capital inExcess ofPar Value
RetainedDeficit
AccumulatedOther
ComprehensiveIncome (Loss)
NoncontrollingInterests Total
Balance at February 1, 2014 . . . . . . 106 $ 1 $ (5,963) $ 9,298 $ (480) $ (1,117) $ 444 $ 2,183
Comprehensive loss
Net loss. . . . . . . . . . . . . . . . . . — — — — (1,682) — (128) (1,810)Pension and postretirement
adjustments, net of tax. . . . — — — — — (1,045) 5 (1,040)Deferred loss on derivatives,
net of tax . . . . . . . . . . . . . . — — — — — (2) — (2)Currency translation
adjustments, net of tax. . . . — — — — — 4 (1) 3Sears Canada de-
consolidation . . . . . . . . . . . — — — — — 128 (314) (186)
Total Comprehensive Loss . . . . . . . (3,035)
Stock awards . . . . . . . . . . . . . . . . . . 1 — 9 (5) — — — 4
Separation of Lands' End, Inc. . . . . — — — (323) — 2 — (321)
Issuance of warrants . . . . . . . . . . . . — — — 219 — — — 219
Associate stock purchase . . . . . . . . — — 5 — — — — 5
Balance at January 31, 2015 . . . . . . 107 $ 1 $ (5,949) $ 9,189 $ (2,162) $ (2,030) $ 6 $ (945)
Comprehensive loss
Net loss. . . . . . . . . . . . . . . . . . — — — — (1,129) — 1 (1,128)Pension and postretirement
adjustments, net of tax. . . . — — — — — 113 — 113Currency translation
adjustments, net of tax. . . . — — — — — (1) — (1)
Total Comprehensive Loss . . . . . . . (1,016)
Stock awards . . . . . . . . . . . . . . . . . . — — 16 (16) — — — —
Associate stock purchase . . . . . . . . — — 5 — — — — 5Balance at January 30, 2016 . . . . . . 107 $ 1 $ (5,928) $ 9,173 $ (3,291) $ (1,918) $ 7 $ (1,956)
Comprehensive loss
Net loss. . . . . . . . . . . . . . . . . . — — — — (2,221) — — (2,221)Pension and postretirement
adjustments, net of tax. . . . — — — — — 366 — 366Dissolution of noncontrolling
interest . . . . . . . . . . . . . . . . — — — — — — (7) (7)
Total Comprehensive Loss . . . . . . . (1,862)
Stock awards . . . . . . . . . . . . . . . . . . — — 29 (30) — — — (1)
Reclassification of warrants . . . . . . — — — (13) — — — (13)
Associate stock purchase . . . . . . . . — — 8 — — — — 8
Balance at January 28, 2017 . . . . . . 107 $ 1 $ (5,891) $ 9,130 $ (5,512) $ (1,552) $ — $ (3,824)
See accompanying Notes to Consolidated Financial Statements.
62

SEARS HOLDINGS CORPORATIONNotes to Consolidated Financial Statements
63
NOTE 1—SUMMARY OF SIGNIFICANT ACCOUNTING POLICIES
Nature of Operations, Consolidation and Basis of Presentation
Sears Holdings Corporation ("Holdings") is the parent company of Kmart Holding Corporation ("Kmart") andSears, Roebuck and Co. ("Sears"). Holdings (together with its subsidiaries, "we," "us," "our," or the "Company")was formed as a Delaware corporation in 2004 in connection with the merger of Kmart and Sears (the "Merger"), onMarch 24, 2005. We are an integrated retailer with 1,430 full-line and specialty retail stores in the United States,operating through Kmart and Sears. Through the third quarter of 2014, we conducted our operations under threereportable segments: Kmart, Sears Domestic and Sears Canada. Following the de-consolidation of Sears Canadadiscussed in Note 2, we have operated under two reportable segments: Kmart and Sears Domestic.
The consolidated financial statements include all majority-owned subsidiaries in which Holdings exercisescontrol. Investments in companies in which Holdings exercises significant influence, but which we do not control(generally 20% to 50% ownership interest), are accounted for under the equity method of accounting. Investments incompanies in which we have less than a 20% ownership interest and do not exercise significant influence areaccounted for at cost. All intercompany transactions and balances have been eliminated.
Fiscal Year
Our fiscal year ends on the Saturday closest to January 31 each year. Fiscal years 2016, 2015 and 2014consisted of 52 weeks. Unless otherwise stated, references to years in this report relate to fiscal years rather than tocalendar years.
Separation of Lands' End, Inc.
On April 4, 2014, we completed the separation of our Lands' End business through a spin-off transaction. Theseparation was structured to be tax free to our U.S. shareholders for U.S. federal income tax purposes. Prior to theseparation, Lands' End, Inc. ("Lands' End") entered into an asset-based senior secured revolving credit facility,which provided for maximum borrowings of approximately $175 million with a letter of credit sub-limit, and asenior secured term loan facility of approximately $515 million. The proceeds of the term loan facility were used tofund a $500 million dividend to Holdings and pay fees and expenses associated with the foregoing facilities. Weaccounted for this spin-off in accordance with accounting standards applicable to spin-off transactions. Accordingly,we classified the carrying value of net assets of $323 million contributed to Lands' End as a reduction of capital inexcess of par value in the Consolidated Statement of Equity (Deficit) for the year ended January 31, 2015.
Additionally, as a result of Mr. Lampert's role as our Chairman and Chief Executive Officer, and Chairman andChief Executive Officer of ESL Investments, Inc. (together with its affiliated fund, "ESL"), and the continuingarrangements between Holdings and Lands' End (as further described in Note 15), Holdings has determined that ithas significant influence over Lands' End. Accordingly, the operating results for Lands' End through the date of thespin-off are presented within the consolidated continuing operations of Holdings and the Sears Domestic segment inthe accompanying Consolidated Financial Statements.
In connection with the separation, Holdings and certain of its subsidiaries entered into various agreements withLands' End under the terms described in Note 15.
Pension Benefit Guaranty Corporation Agreement
On March 18, 2016, we entered into a five-year pension plan protection and forbearance agreement with thePension Benefit Guaranty Corporation ("PBGC") (the "PPPFA"), pursuant to which the Company has agreed tocontinue to protect, or "ring-fence," pursuant to customary covenants, the assets of certain special purposesubsidiaries (the "Relevant Subsidiaries") holding real estate and/or intellectual property assets. Also under theagreement, the Relevant Subsidiaries granted the PBGC a springing lien on the ring-fenced assets, which lien will betriggered only by (a) failure to make required contributions to the Company's pension plans (the "Plans"), (b)prohibited transfers of ownership interests in the Relevant Subsidiaries, (c) termination events with respect to thePlans, or (d) bankruptcy events with respect to the Company or certain of its material subsidiaries. Under the
agreement, the PBGC has agreed to forbear from initiating an involuntary termination of the Plans, except upon theoccurrence of specified conditions, one of which is based on the aggregate market value of the Company’s issuedand outstanding stock. As of the date of this report, the Company's stock price is such that the PBGC would bepermitted to cease forbearance. The PBGC has been given notice in accordance with the terms of the agreement andhas not communicated any intention to cease its forbearance.
Craftsman Brand Sale
On January 5, 2017, Holdings announced that it had entered into a definitive agreement under which StanleyBlack & Decker would purchase the Craftsman brand from Holdings (the "Craftsman Sale"). On March 8, 2017, theCompany closed its sale of the Craftsman brand to Stanley Black & Decker. The transaction provides Stanley Black& Decker with the right to develop, manufacture and sell Craftsman-branded products outside of Holdings and SearsHometown & Outlet Stores, Inc. distribution channels. As part of the agreement, Holdings will continue to offerCraftsman-branded products, sourced from existing suppliers, through its current retail channels via a perpetuallicense from Stanley Black & Decker, which will be royalty-free for the first 15 years after closing and royalty-bearing thereafter.
The Company received an initial upfront payment of $525 million, subject to closing costs and an adjustmentfor working capital changes, at closing. In addition, Stanley Black & Decker will pay a further $250 million in cashin three years and Holdings will receive payments of between 2.5% and 3.5% on new Stanley Black & Decker salesof Craftsman products for the 15 years following the closing.
In connection with the closing of the Craftsman transaction, Holdings reached an agreement with the PBGCpursuant to which the PBGC has consented to the sale of the Craftsman-related assets that had been "ring-fenced"under the PPPFA and certain related transactions. As a condition to obtaining this consent, the Company agreed togrant the PBGC a lien on, and subsequently contribute to the Company's pension plans, the value of the $250million cash payment payable to the Company on the third anniversary of the Craftsman closing with the value ofsuch payment being fully credited against certain of the Company's minimum pension funding obligations in 2017,2018 and 2019. The Company also granted a lien to the PBGC on the 15-year income stream relating to new StanleyBlack & Decker sales of Craftsman products, and agreed to contribute the payments from Stanley Black & Deckerunder such income stream to the Company's pension plans, with such payments to be credited against the Company'sminimum pension funding obligations starting no later than five years from the closing date. The Company alsoagreed to grant the PBGC a lien on $100 million of real estate assets to secure the Company's minimum pensionfunding obligations through the end of 2019, and agreed to certain other amendments to the PPPFA.
Uses and Sources of Liquidity
Our primary need for liquidity is to fund working capital requirements of our businesses, capital expendituresand for general corporate purposes, including debt repayment and pension plan contributions. We have incurredlosses and experienced negative operating cash flows for the past several years, and accordingly, the Company hastaken a number of actions to continue to support its operations and meet its obligations.
During 2015, the Company completed its previously announced rights offering and sale-leaseback transactionwith Seritage Growth Properties and received aggregate gross proceeds from the transaction of $2.7 billion. Inaddition, as discussed in Note 3, the Company completed an amendment and extension of its existing domesticcredit facility in which the maturity date for $1.971 billion of the revolving tranche of our domestic credit facilityhas been extended to July 2020, while $1.304 billion retained the existing maturity date of April 2016. Finally, asalso discussed in Note 3, the Company completed a tender offer for $936 million principal amount of its outstanding6 5/8% Senior Secured Notes Due 2018.
During 2016, the Company completed various financing transactions, including the closing of the $750 millionSenior Secured Term Loan under its domestic credit facility (the "2016 Term Loan") maturing in July 2020, whichgenerated net proceeds of approximately $722 million, the completion of a $500 million real estate loan facility inApril 2016 (the "2016 Secured Loan Facility") maturing in July 2017 which generated net proceeds ofapproximately $485 million, the completion of an additional $500 million real estate loan facility in January 2017(the "2017 Secured Loan Facility") maturing in July 2020 which generated net proceeds of approximately $486million, and also entering into a $300 million Second Lien Credit Agreement in September 2016 (the “Second Lien
SEARS HOLDINGS CORPORATIONNotes to Consolidated Financial Statements—(Continued)
64

Term Loan”) maturing in 2020 which generated net proceeds of approximately $291 million. Additionally, theCompany generated nearly $460 million in cash proceeds from the sale of real estate and other asset sales, including$71 million from a sale-leaseback transaction for five Sears Full-line stores and two Sears Auto Centers. The fundsreceived from these actions were used to reduce outstanding borrowings under the Company's domestic creditfacility and for general corporate purposes.
Other actions announced in 2016 included a new Letter of Credit and Reimbursement Agreement (the "LCFacility Agreement") providing for up to a $500 million secured standby letter of credit facility (the "LC Facility")from certain affiliates of ESL Investments, Inc., and the establishment of a Special Committee of the Board ofDirectors to market certain real estate properties targeting at least $1.0 billion of asset sales. The specific assetsinvolved, the timing and the overall amount will depend on a variety of factors, including market conditions, interestin specific assets, valuations of those assets and our underlying operating performance. A portion of the cashproceeds generated from these asset sales will be utilized to repay amounts outstanding under both the 2016 SecuredLoan Facility and 2017 Secured Loan Facility.
In addition, in February 2017, the Company entered into an amendment to our existing domestic credit facility.The amendment reduced the aggregate revolver commitments from $1.971 billion to $1.5 billion, but alsoimplemented other modifications to covenants and reserves against the domestic credit facility borrowing base thatimproved net liquidity. The amendment also provides additional flexibility in the form of a $250 million increase inthe general debt basket from $750 million to $1.0 billion. Our domestic credit facility permits us up to $500 millionof FILO loan capacity under the credit agreement and up to $2.0 billion of second lien loan capacity (of which $604million is currently utilized) outside the credit agreement, all depending on the applicable and available borrowingbase as defined in our applicable debt agreements, as well as our ability to secure commitments from lenders. Wealso have the ability to obtain longer-term secured financing maturing outside of the domestic credit facility maturitydate which would not be subject to borrowing base limitations (see Note 3). The options available to us includesecuritizing assets and real estate loans, which we have successfully executed in the past. Further, in February andMarch 2017, the Company issued commercial paper to meet short-term liquidity needs, with the maximum amountoutstanding during this time of $100 million, of which all has been repaid.
Also in February 2017, the Company initiated a restructuring program targeted to deliver cost savings in 2017and beyond. Under the restructuring program, the Company intends to simplify its organizational structure,including greater consolidation of the Sears and Kmart corporate and support functions, as well as transition to anintegrated value chain model to drive efficiencies in pricing, sourcing, supply chain and inventory management,optimize product assortment at Sears and Kmart stores to better align with preferences of our Best Membersfocusing on profitable, high-return Best Categories and actively manage our real estate portfolio to identifyadditional opportunities for reconfiguration and reduction of capital obligations. We are primarily focusing onprofitability instead of revenues, market share and other metrics each of which relate to, but do not necessarily driveprofit. This approach may negatively impact our sales, however, it is aimed at returning the Company toprofitability.
Finally, in March 2017, the Company closed its previously-announced sale of the Craftsman brand to StanleyBlack & Decker. The Company received an initial upfront payment of $525 million, subject to closing costs and anadjustment for working capital changes, at closing. A portion of these proceeds were used to reduce outstandingborrowings under both the Company's domestic credit facility and term loans outstanding, as well as for generalcorporate purposes. In addition, Stanley Black & Decker will pay a further $250 million in cash on the thirdanniversary of the closing of the transaction and Holdings will receive payments of between 2.5% and 3.5% on newStanley Black & Decker sales of Craftsman products for the 15 years following the closing.
As described above, the PBGC consented to the sale of the Craftsman-related assets that had been "ring-fenced" under the PPPFA. As a condition to obtaining this consent, the Company agreed to grant the PBGC a lienon, and subsequently contribute to the Company's pension plans, the value of the $250 million cash paymentpayable to the Company on the third anniversary of the Craftsman closing, with the value of such payment beingfully credited against certain of the Company's minimum pension funding obligations in 2017, 2018 and 2019. TheCompany also granted a lien to the PBGC on the 15-year income stream relating to new Stanley Black & Deckersales of Craftsman products, and agreed to contribute such payments from Stanley Black & Decker under suchincome stream to the Company's pension plans, with such payments being credited against the Company's minimumpension funding obligations starting no later than five years from the closing of the transaction. The Company also
SEARS HOLDINGS CORPORATIONNotes to Consolidated Financial Statements—(Continued)
65

agreed to grant the PBGC a lien on $100 million of real estate assets to secure the Company's minimum pensionfunding obligations through the end of 2019.
We acknowledge that we continue to face a challenging competitive environment and while we continue tofocus on our overall profitability, including managing expenses, we reported a loss in 2016 and were required tofund cash used in operating activities with cash from investing and financing activities. We expect that the actionstaken in 2016 and early 2017 will enhance our liquidity and financial flexibility. In addition, as previously discussed,we expect to generate additional liquidity through the monetization of our real estate and additional debt financingactions. We expect that these actions will be executed in alignment with the anticipated timing of our liquidity needs.We also continue to explore ways to unlock value across a range of assets, including exploring ways to maximize thevalue of our Home Services and Sears Auto Centers businesses, as well as our Kenmore and DieHard brandsthrough partnerships or other means of externalization that could expand distribution of our brands and serviceofferings to realize significant growth. We expect to continue to right-size, redeploy and highlight the value of ourassets, including our real estate portfolio, in our transition from an asset intensive, historically "store-only" basedretailer to a more asset light, integrated membership-focused company.
Our historical operating results indicate substantial doubt exists related to the Company's ability to continue asa going concern. We believe that the actions discussed above are probable of occurring and mitigating the substantialdoubt raised by our historical operating results and satisfying our estimated liquidity needs 12 months from theissuance of the financial statements. However, we cannot predict, with certainty, the outcome of our actions togenerate liquidity, including the availability of additional debt financing, or whether such actions would generate theexpected liquidity as currently planned. In addition, the PPPFA contains certain limitations on our ability to sellassets, which could impact our ability to complete asset sale transactions or our ability to use proceeds from thosetransactions to fund our operations. Therefore, the planned actions take into account the applicable restrictions underthe PPPFA.
If we continue to experience operating losses, and we are not able to generate additional liquidity through themechanisms described above or through some combination of other actions, while not expected, we may not be ableto access additional funds under our amended Domestic Credit Agreement and we might need to secure additionalsources of funds, which may or may not be available to us. Additionally, a failure to generate additional liquiditycould negatively impact our access to inventory or services that are important to the operation of our business.Moreover, if the borrowing base (as calculated pursuant to the indenture) falls below the principal amount of thenotes plus the principal amount of any other indebtedness for borrowed money that is secured by liens on thecollateral for the notes on the last day of any two consecutive quarters, it could trigger an obligation to repurchasenotes in an amount equal to such deficiency.
Use of Estimates
The preparation of financial statements in conformity with accounting principles generally accepted in theUnited States of America requires management to make estimates and assumptions about future events. Theestimates and assumptions affect the reported amounts of assets and liabilities and disclosure of contingent assetsand liabilities at the date of the financial statements, as well as reported amounts of revenues and expenses duringthe reporting period. We evaluate our estimates and assumptions on an ongoing basis using historical experience andother factors that management believes to be reasonable under the circumstances. Adjustments to estimates andassumptions are made when facts and circumstances dictate. As future events and their effects cannot be determinedwith absolute certainty, actual results may differ from the estimates used in preparing the accompanyingconsolidated financial statements. Significant estimates and assumptions are required as part of determininginventory and accounts receivable valuation, estimating depreciation, amortization and recoverability of long-livedassets, establishing self-insurance, warranty, legal and other reserves, performing goodwill and intangibleimpairment analyses, and in establishing valuation allowances on deferred income tax assets and reserves for taxexamination exposures, and calculating retirement benefits.
Cash and Cash Equivalents
Cash equivalents include all highly liquid investments with original maturities of three months or less at thedate of purchase. We also include deposits in-transit from banks for payments related to third-party credit card and
SEARS HOLDINGS CORPORATIONNotes to Consolidated Financial Statements—(Continued)
66

debit card transactions within cash equivalents. The deposits in-transit balances included within cash equivalentswere $87 million and $95 million at January 28, 2017 and January 30, 2016, respectively.
We classify outstanding checks in excess of funds on deposit within other current liabilities and reduce cashand cash equivalents when these checks clear the bank on which they were drawn. Outstanding checks in excess offunds on deposit included in other current liabilities were $29 million and $59 million at January 28, 2017 andJanuary 30, 2016, respectively.
Allowance for Doubtful Accounts
We provide an allowance for doubtful accounts based on both historical experience and a specificidentification basis. Allowances for doubtful accounts on accounts receivable balances were $37 million and $34million at January 28, 2017 and January 30, 2016, respectively. Our accounts receivable balance on ourConsolidated Balance Sheet is presented net of our allowance for doubtful accounts and is comprised of variousvendor-related and customer-related accounts receivable, including receivables related to our pharmacy operations.
Merchandise Inventories
Merchandise inventories are valued at the lower of cost or market. For Kmart and Sears Domestic, cost isprimarily determined using the retail inventory method ("RIM"). Kmart merchandise inventories are valued underthe RIM using primarily a first-in, first-out ("FIFO") cost flow assumption. Sears Domestic merchandise inventoriesare valued under the RIM using primarily a last-in, first-out ("LIFO") cost flow assumption.
Inherent in the RIM calculation are certain significant management judgments and estimates including, amongothers, merchandise markons, markups, markdowns and shrinkage, which significantly impact the ending inventoryvaluation at cost, as well as resulting gross margins. The methodologies utilized by us in our application of the RIMare consistent for all periods presented. Such methodologies include the development of the cost-to-retail ratios, thegroupings of homogenous classes of merchandise, the development of shrinkage and obsolescence reserves, theaccounting for price changes and the computations inherent in the LIFO adjustment (where applicable).Management believes that the RIM provides an inventory valuation that reasonably approximates cost and results incarrying inventory at the lower of cost or market.
Approximately 54% of consolidated merchandise inventories are valued using LIFO. To estimate the effects ofinflation on inventories, we utilize external price indices determined by an outside source, the Bureau of LaborStatistics. If the FIFO method of inventory valuation had been used instead of the LIFO method, merchandiseinventories would have been $33 million higher at January 28, 2017 and $35 million higher at January 30, 2016.During 2016 and 2015, a reduction in inventory quantities resulted in a liquidation of applicable LIFO inventoryquantities carried at lower costs in prior years. This LIFO liquidation resulted in a decrease in cost of sales ofapproximately $12 million and $2 million in 2016 and 2015, respectively.
Vendor Rebates and Allowances
We receive rebates and allowances from certain vendors through a variety of programs and arrangementsintended to offset our costs of promoting and selling certain vendor products. These vendor payments are recognizedand recorded as a reduction to the cost of merchandise inventories when earned and, thereafter, as a reduction of costof sales, buying and occupancy as the merchandise is sold. Upfront consideration received from vendors linked topurchases or other commitments is initially deferred and amortized ratably to cost of sales, buying and occupancyover the life of the contract or as performance of the activities specified by the vendor to earn the fee is completed.
Property and Equipment
Property and equipment are recorded at cost, less accumulated depreciation. Additions and substantialimprovements are capitalized and include expenditures that materially extend the useful lives of existing facilitiesand equipment. Maintenance and repairs that do not materially improve or extend the lives of the respective assetsare expensed as incurred.
Depreciation expense, which includes depreciation on assets under capital leases, is recorded over theestimated useful lives of the respective assets using the straight-line method for financial statement purposes, and
SEARS HOLDINGS CORPORATIONNotes to Consolidated Financial Statements—(Continued)
67

accelerated methods for tax purposes. The range of lives are generally 20 to 50 years for buildings, 3 to 10 years forfurniture, fixtures and equipment, and 3 to 5 years for computer systems and computer equipment. Leaseholdimprovements are depreciated over the shorter of the associated lease term or the estimated useful life of the asset.Depreciation expense included within depreciation and amortization expense reported in the ConsolidatedStatements of Operations was $370 million, $415 million and $563 million for the years ended January 28, 2017,January 30, 2016 and January 31, 2015, respectively.
Primarily as a result of store closing actions, certain property and equipment are considered held for sale. Thevalue of assets held for sale was $96 million and $31 million at January 28, 2017 and January 30, 2016, respectively.These assets were included in prepaid expenses and other current assets in the Consolidated Balance Sheets atJanuary 28, 2017 and January 30, 2016 at the lower of their historical net book value or their estimated fair value,less estimated costs to sell. We expect to sell the properties within a year and we continually remarket them. Themajority of assets held for sale are held within the Sears Domestic segment.
Impairment of Long-Lived Assets and Costs Associated with Exit Activities
In accordance with accounting standards governing the impairment or disposal of long-lived assets, thecarrying value of long-lived assets, including property and equipment and definite-lived intangible assets, isevaluated whenever events or changes in circumstances indicate that a potential impairment has occurred relative toa given asset or assets. Factors that could result in an impairment review include, but are not limited to, a currentperiod cash flow loss combined with a history of cash flow losses, current cash flows that may be insufficient torecover the investment in the property over the remaining useful life, or a projection that demonstrates continuinglosses associated with the use of a long-lived asset, significant changes in the manner of use of the asset orsignificant changes in business strategies. An impairment loss is recognized when the estimated undiscounted cashflows expected to result from the use of the asset plus net proceeds expected from disposition of the asset (if any) areless than the carrying value of the asset. When an impairment loss is recognized, the carrying amount of the asset isreduced to its estimated fair value as determined based on quoted market prices or through the use of other valuationtechniques. See Note 13 for further information regarding long-lived asset impairment charges recorded.
We account for costs associated with location closings in accordance with accounting standards pertaining toaccounting for costs associated with exit or disposal activities. As such, we record a liability for costs associatedwith location closings, which includes employee severance, inventory markdowns and other liquidation fees whenmanagement makes the decision to exit a location. We record a liability for future lease costs (net of estimatedsublease income) when we cease to use the location.
Goodwill, Trade Names and Related Impairments
Trade names acquired as part of the Merger account for the majority of our intangible assets recognized in theConsolidated Balance Sheet. The majority of these trade name assets, such as Sears, Kenmore and Craftsman, areexpected to generate cash flows indefinitely, do not have estimable or finite useful lives and, therefore, areaccounted for as indefinite-lived assets not subject to amortization. Certain intangible assets, including favorablelease rights, contractual arrangements and customer lists, have estimable, finite useful lives, which are used as thebasis for their amortization. The estimated useful lives of such assets are determined using a number of factors,including the demand for the asset, competition and the level of expenditure required to maintain the cash flowsassociated with the asset.
Our goodwill results from the Merger. We perform annual goodwill and indefinite-lived intangible assetimpairment tests at the last day of our November accounting period each year and assess the need to update the testsbetween annual tests if events or circumstances occur that would more likely than not reduce the fair value of thereporting unit or an indefinite-lived intangible asset below its carrying amount. A significant amount of judgment isinvolved in determining if an indicator of impairment has occurred. Such indicators may include, among others: asignificant decline in our expected future cash flows; a sustained, significant decline in our stock price and marketcapitalization; a significant adverse change in legal factors or in the business climate; unanticipated competition; andthe testing for recoverability of a significant asset group within the reporting unit. Any adverse change in thesefactors could have a significant impact on the recoverability of these assets and could have a material impact on ourconsolidated financial statements.
SEARS HOLDINGS CORPORATIONNotes to Consolidated Financial Statements—(Continued)
68

Goodwill Impairment Assessments
Our goodwill balance relates to our Home Services business. The goodwill impairment test involves a two-step process. The first step is a comparison of the reporting unit's fair value to its carrying value. We estimate fairvalue using the best information available, using a discounted cash flow model, commonly referred to as the incomeapproach. The income approach uses the reporting unit's projection of estimated operating results and cash flowsthat is discounted using a weighted-average cost of capital that reflects current market conditions appropriate for thereporting unit. The projection uses management's best estimates of economic and market conditions over theprojected period, including growth rates in sales, costs, estimates of future expected changes in operating marginsand cash expenditures. Other significant estimates and assumptions include terminal value growth rates, futureestimates of capital expenditures and changes in future working capital requirements. We were unable to use amarket approach due to there being no market comparables.
If the carrying value of the reporting unit is higher than its fair value, there is an indication that impairmentmay exist and the second step must be performed to measure the amount of impairment loss, if any. The amount ofimpairment is determined by comparing the implied fair value of reporting unit goodwill to the carrying value of thegoodwill in the same manner as if the reporting unit was being acquired in a business combination. See Note 12 forfurther information.
Intangible Asset Impairment Assessments
We consider the income approach when testing intangible assets with indefinite lives for impairment on anannual basis. We utilize the income approach, specifically the relief from royalty method, for analyzing ourindefinite-lived assets. This method is based on the assumption that, in lieu of ownership, a firm would be willing topay a royalty in order to exploit the related benefits of this asset class. The relief from royalty method involves twosteps: (1) estimation of reasonable royalty rates for the assets; and (2) the application of these royalty rates to a netsales stream and discounting the resulting cash flows to determine a value. We multiplied the selected royalty rate bythe forecasted net sales stream to calculate the cost savings (relief from royalty payment) associated with the assets.The cash flows are then discounted to present value by the selected discount rate and compared to the carrying valueof the assets.
In our quarterly reports on Form 10-Q filed during 2016, the Company disclosed that if its results continued todecline it could result in revisions in management's estimates of the fair value of the Company's trade names andmay result in impairment charges. As a result of recently announced store closures and the further decline in revenueexperienced in the fourth quarter at Sears Domestic, our analysis indicated that the fair value of the Sears trade namewas less than its carrying value. Accordingly, we recorded impairment related to the Sears trade name during 2016of $381 million, which reduced the carrying value to $431 million at January 28, 2017. During 2015, we recordedimpairment related to the Sears trade name of $180 million, which reduced the carrying value to $812 million atJanuary 30, 2016. See Note 12 for further information.
Fair Value of Financial Instruments
We determine the fair value of financial instruments in accordance with standards pertaining to fair valuemeasurements. Such standards define fair value and establish a framework for measuring fair value in GAAP. Underfair value measurement accounting standards, fair value is considered to be the exchange price in an orderlytransaction between market participants to sell an asset or transfer a liability at the measurement date. We report thefair value of financial assets and liabilities based on the fair value hierarchy prescribed by accounting standards forfair value measurements, which prioritizes the inputs to valuation techniques used to measure fair value into threelevels.
Financial instruments that potentially subject the Company to concentration of credit risk consist principally oftemporary cash investments and accounts receivable. We place our cash and cash equivalents in investment-grade,short-term instruments with high quality financial institutions and, by policy, limit the amount of credit exposure inany one financial instrument.
SEARS HOLDINGS CORPORATIONNotes to Consolidated Financial Statements—(Continued)
69

Self-insurance Reserves
We are self-insured for certain costs related to workers' compensation, asbestos, environmental, automobile,warranty, product and general liability claims. We obtain third-party insurance coverage to limit our exposure tocertain of these self-insured risks. A portion of these self-insured risks is managed through a wholly-ownedinsurance subsidiary. Our liability reflected in the Consolidated Balance Sheet, classified within other liabilities(current and long-term), represents an estimate of the ultimate cost of claims incurred at the balance sheet date. Inestimating this liability, we utilize loss development factors based on Company-specific data to project the futuredevelopment of incurred losses. Loss estimates are adjusted based upon actual claims settlements and reportedclaims. The liabilities for self-insured risks are discounted to their net present values using an interest rate which isbased upon the expected duration of the liabilities. Expected payments as of January 28, 2017 were as follows:
millions
2017 . . . . . . . . . . . . . . . . . . . . . . . . . . . . . . . . . . . . . . . . . . . . . . . . . . . . . . . . . . . . . . . . . . . . . . . . . . . . . . . . $ 1752018 . . . . . . . . . . . . . . . . . . . . . . . . . . . . . . . . . . . . . . . . . . . . . . . . . . . . . . . . . . . . . . . . . . . . . . . . . . . . . . . . 1132019 . . . . . . . . . . . . . . . . . . . . . . . . . . . . . . . . . . . . . . . . . . . . . . . . . . . . . . . . . . . . . . . . . . . . . . . . . . . . . . . . 832020 . . . . . . . . . . . . . . . . . . . . . . . . . . . . . . . . . . . . . . . . . . . . . . . . . . . . . . . . . . . . . . . . . . . . . . . . . . . . . . . . 602021 . . . . . . . . . . . . . . . . . . . . . . . . . . . . . . . . . . . . . . . . . . . . . . . . . . . . . . . . . . . . . . . . . . . . . . . . . . . . . . . . 47Later years . . . . . . . . . . . . . . . . . . . . . . . . . . . . . . . . . . . . . . . . . . . . . . . . . . . . . . . . . . . . . . . . . . . . . . . . . . . 326Total undiscounted obligation . . . . . . . . . . . . . . . . . . . . . . . . . . . . . . . . . . . . . . . . . . . . . . . . . . . . . . . . . . . . 804Less—discount. . . . . . . . . . . . . . . . . . . . . . . . . . . . . . . . . . . . . . . . . . . . . . . . . . . . . . . . . . . . . . . . . . . . . . . . (89)Net obligation. . . . . . . . . . . . . . . . . . . . . . . . . . . . . . . . . . . . . . . . . . . . . . . . . . . . . . . . . . . . . . . . . . . . . . . . . $ 715
Loss Contingencies
Under accounting standards, loss contingency provisions are recorded for probable losses at management'sbest estimate of a loss, or when a best estimate cannot be made, the minimum amount in the estimated range isrecorded. These estimates are often initially developed substantially earlier than the ultimate loss is known, and theestimates are refined each accounting period, as additional information is known.
Revenue Recognition
Revenues include sales of merchandise, services and extended service contracts, net commissions earned fromleased departments in retail stores, delivery and handling revenues related to merchandise sold, and fees earned fromco-branded credit card programs. We recognize revenues from retail operations at the later of the point of sale or thedelivery of goods to the customer. Direct to customer revenues are recognized when the merchandise is delivered tothe customer. Revenues from product installation and repair services are recognized at the time the services areprovided. Revenues from the sale of service contracts and the related direct acquisition costs are deferred andamortized over the lives of the associated contracts, while the associated service costs are expensed as incurred.
We earn revenues through arrangements with third-party financial institutions that manage and directly extendcredit relative to our co-branded credit card programs. The third-party financial institutions pay us for generatingnew accounts and sales activity on co-branded cards, as well as for selling other financial products to cardholders.We recognize these revenues in the period earned, which is when our related performance obligations have beenmet. We sell gift cards to customers at our retail stores and through our direct to customer operations. The gift cardsgenerally do not have expiration dates. Revenues from gift cards are recognized when (i) the gift card is redeemedby the customer, or (ii) the likelihood of the gift card being redeemed by the customer is remote (gift card breakage)based on historical redemption patterns and we determine that we do not have a legal obligation to remit the value ofthe unredeemed gift cards to the relevant jurisdictions.
Revenues from merchandise sales and services are reported net of estimated returns and allowances andexclude sales taxes. The reserve for returns and allowances is calculated as a percentage of sales based on historicalreturn percentages. Estimated returns are recorded as a reduction of sales and cost of sales. We defer the recognitionof layaway sales and profit until the period in which the customer takes possession of the merchandise.
SEARS HOLDINGS CORPORATIONNotes to Consolidated Financial Statements—(Continued)
70

Cost of Sales, Buying and Occupancy
Cost of sales, buying and occupancy are comprised principally of the costs of merchandise, buying,warehousing and distribution (including receiving and store delivery costs), retail store occupancy costs, productrepair, and home service and installation costs, customer shipping and handling costs, vendor allowances,markdowns and physical inventory losses.
The Company has a Shop Your Way program in which customers earn points on purchases which may beredeemed to pay for future purchases. The expense for customer points earned is recognized as customers earn themand recorded in cost of sales.
During 2016 and 2015, respectively, the Company received $33 million and $146 million related to one-timecredits from vendors associated with prior supply arrangements, which have been reflected as credits within cost ofsales, buying and occupancy in the Consolidated Statements of Operations.
Selling and Administrative Expenses
Selling and administrative expenses are comprised principally of payroll and benefits costs for retail andcorporate employees, occupancy costs of corporate facilities, advertising, pre-opening costs and other administrativeexpenses.
Pre-Opening Costs
Pre-opening and start-up activity costs are expensed in the period in which they occur.
Advertising Costs
Advertising costs are expensed as incurred, generally the first time the advertising occurs, and amounted to$684 million, $850 million and $1.1 billion for 2016, 2015 and 2014, respectively. These costs are included withinselling and administrative expenses in the Consolidated Statements of Operations.
Income Taxes
We provide deferred income tax assets and liabilities based on the estimated future tax effects of differencesbetween the financial and tax basis of assets and liabilities based on currently enacted tax laws in effect for the yearin which the differences are expected to reverse. The tax balances and income tax expense recognized by us arebased on management's interpretation of the tax laws of multiple jurisdictions. Income tax expense also reflects ourbest estimates and assumptions regarding, among other things, the level of future taxable income, tax planning, andany valuation allowance. Future changes in tax laws, changes in projected levels of taxable income, tax planning,and adoption and implementation of new accounting standards could impact the effective tax rate and tax balancesrecorded by us. In evaluating our ability to recover our deferred tax assets within the jurisdiction from which theyarise, we consider all available positive and negative evidence, including scheduled reversals of deferred taxliabilities, projected future taxable income, tax planning strategies, and results of recent operations. In projectingfuture taxable income, we begin with historical results adjusted for the results of discontinued operations andchanges in accounting policies and incorporate assumptions including the amount of future state, federal and foreignpre-tax operating income, the reversal of temporary differences, and the implementation of feasible and prudent taxplanning strategies. In evaluating the objective evidence that historical results provide, we consider cumulativeoperating income (loss) over the past three years. These assumptions require significant judgment about theforecasts of future taxable income.
Income tax expense or benefit from continuing operations is generally determined without regard to othercategories of earnings, such as discontinued operations and other comprehensive income ("OCI"). An exception isprovided in the authoritative accounting guidance when there is income from categories other than continuingoperations and a loss from continuing operations in the current year. In this case, the tax benefit allocated tocontinuing operations is the amount by which the loss from continuing operations reduces the tax expense recordedwith respect to the other categories of earnings, even when a valuation allowance has been established against thedeferred tax assets. In instances where a valuation allowance is established against current year losses, income fromother sources, including gain from pension and other postretirement benefits recorded as a component of OCI or the
SEARS HOLDINGS CORPORATIONNotes to Consolidated Financial Statements—(Continued)
71

creation of a deferred tax liability through additional paid-in capital for the book to tax difference for the originalissue discount relating to the $625 million 8% senior unsecured notes due 2019, is considered when determiningwhether sufficient future taxable income exists to realize the deferred tax assets.
Stock-based Compensation
We account for stock-based compensation arrangements in accordance with accounting standards pertaining toshare-based payment transactions, which requires us to both recognize as expense the fair value of all stock-basedcompensation awards (which includes stock options, although there were no options outstanding in 2016) and toclassify excess tax benefits associated with share-based compensation deductions as cash from financing activitiesrather than cash from operating activities. We recognize compensation expense as awards vest on a straight-linebasis over the requisite service period of the award.
Earnings Per Common Share
Basic earnings per common share is calculated by dividing net income attributable to Holdings' shareholdersby the weighted average number of common shares outstanding for each period. Diluted earnings per common sharealso includes the dilutive effect of potential common shares, exercise of stock options, warrants and the effect ofrestricted stock when dilutive.
New Accounting Pronouncements
Goodwill
In January 2017, the Financial Accounting Standards Board ("FASB") issued an accounting standards updatewhich simplifies the test for goodwill impairment. To address concerns over the cost and complexity of the two-stepgoodwill impairment test, the amendments in this update remove the second step of the test. An entity will apply aone-step quantitative test and record the amount of goodwill impairment as the excess of a reporting unit's carryingamount over its fair value, not to exceed the total amount of goodwill allocated to the reporting unit. The newguidance does not amend the optional qualitative assessment of goodwill impairment. This update is effective forannual or any interim goodwill impairment tests in fiscal years beginning after December 15, 2019. Early adoptionis permitted for interim or annual goodwill impairment tests performed on testing dates after January 1, 2017. Weare currently evaluating the effect the updates will have on our consolidated financial statements.
Business Combinations
In January 2017, the FASB issued an accounting standards update which clarifies the definition of a businesswith the objective of adding guidance to assist entities with evaluating whether transactions should be accounted foras acquisitions (or disposals) of businesses. The amendments in this update provide a screen to determine when a setis not a business. The screen requires that when substantially all of the fair value of the gross assets acquired (ordisposed of) is concentrated in a single identifiable asset or a group of similar identifiable assets, the set is not abusiness. This screen reduces the number of transactions that need to be further evaluated. If the screen is not met,the amendments in this update require that to be considered a business, a set must include, at a minimum, an inputand a substantive process that together significantly contribute to the ability to create outputs. This update iseffective for fiscal years beginning after December 15, 2017, and interim periods within those fiscal years, withearly adoption permitted. The amendments in the update must be applied prospectively. We are currently evaluatingthe effect the updates will have on our consolidated financial statements.
Statement of Cash Flows
In November 2016 and August 2016, respectively, the FASB issued accounting standards updates whichaddress diversity in practice in the classification and presentation of changes in restricted cash in the statement ofcash flows and in how certain cash receipts and cash payments are presented and classified in the statement of cashflows. These updates are effective for fiscal years beginning after December 15, 2017, and interim periods withinthose fiscal years, with early adoption permitted. The amendments in the updates must be applied using aretrospective transition method to each period presented. If an entity early adopts the amendments in an interim
SEARS HOLDINGS CORPORATIONNotes to Consolidated Financial Statements—(Continued)
72

period, any adjustments should be reflected as of the beginning of the fiscal year that includes that interim period.We are currently evaluating the effect the updates will have on our consolidated financial statements.
Consolidation - Interests held through related parties that are under common control
In October 2016, the FASB issued an accounting standards update to amend the accounting standards on how areporting entity that is the single decision maker of a variable interest entity ("VIE") should treat indirect interests inthe entity held through related parties that are under common control with the reporting entity when determiningwhether it is the primary beneficiary of that VIE. The primary beneficiary of a VIE is the reporting entity that has acontrolling financial interest in a VIE and, therefore, consolidates the VIE. A reporting entity has an indirect interestin a VIE if it has a direct interest in a related party that, in turn, has a direct interest in the VIE. Under theamendments, a single decision maker is not required to consider indirect interests held through related parties thatare under common control with the single decision maker to be the equivalent of direct interests in their entirety.Instead, a single decision maker is required to include those interests on a proportionate basis consistent withindirect interests held through other related parties. The update is effective for fiscal years beginning after December15, 2016, and interim periods within those fiscal years, with early adoption permitted. We are currently evaluatingthe effect the update will have on our consolidated financial statements.
Income Taxes - Intra-entity transfers of assets other than inventory
In October 2016, the FASB issued an accounting standards update to improve the accounting for the incometax consequences of intra-entity transfers of assets other than inventory. Current accounting standards prohibit therecognition of current and deferred income taxes for an intra-entity asset transfer until the asset has been sold to anoutside party. In addition, interpretations of this guidance have developed in practice for transfers of certainintangible and tangible assets. This prohibition on recognition is an exception to the principle of comprehensiverecognition of current and deferred income taxes in accounting standards. To more faithfully represent theeconomics of intra-entity asset transfers, the amendments in this update require that entities recognize the incometax consequences of an intra-entity transfer of an asset other than inventory when the transfer occurs. Theamendments in this update do not change accounting standards for the pre-tax effects of an intra-entity asset transferunder accounting standards applicable to consolidation, or for an intra-entity transfer of inventory. The update iseffective for fiscal years beginning after December 15, 2017, and interim periods within those fiscal years, withearly adoption permitted as of the beginning of an annual reporting period. The amendments in this update should beapplied on a modified retrospective basis through a cumulative-effect adjustment directly to retained earnings as ofthe beginning of the period of adoption. We are currently evaluating the effect the update will have on ourconsolidated financial statements.
Leases
In February 2016, the FASB issued an accounting standards update which replaces the current lease accountingstandard. The update will require, among other items, lessees to recognize a right-of-use asset and a lease liabilityfor most leases. Extensive quantitative and qualitative disclosures, including significant judgments made bymanagement, will be required to provide greater insight into the extent of revenue and expense recognized andexpected to be recognized from existing contracts. The update is effective for fiscal years beginning after December15, 2018, and interim periods within those fiscal years, with early adoption permitted. The new standard must beadopted using a modified retrospective transition, and provides for certain practical expedients. Transition willrequire application of the new guidance at the beginning of the earliest comparative period presented. We arecurrently evaluating the effect the update will have on our consolidated financial statements, and expect the updatewill have a material impact on our consolidated financial statements.
Fair Value Measurements
In May 2015, the FASB issued an accounting standards update which requires certain investments measured atnet asset value to be removed from the fair value hierarchy categorization and presented as a single reconciling lineitem between the fair value of the pension plans assets and the amounts reported in the fair value hierarchy table.
SEARS HOLDINGS CORPORATIONNotes to Consolidated Financial Statements—(Continued)
73

The Company adopted the update in fiscal 2016. The adoption of the new standard did not have an impact on theCompany’s consolidated financial position, results of operations, or cash flows.
Presentation of Financial Statements - Going Concern
In August 2014, the FASB issued an accounting standards update which requires management to assesswhether there are conditions or events, considered in the aggregate, that raise substantial doubt about the entity’sability to continue as a going concern within one year after the financial statements are issued. If substantial doubtexists, additional disclosures are required. This update was effective for the Company's annual period ended January28, 2017. The Company's assessment of our ability to continue as a going concern is further discussed in the "Usesand Sources of Liquidity" paragraph above. The adoption of the new standard did not have a material impact on theCompany’s consolidated financial position, results of operations, cash flows or disclosures.
Revenue from Contracts with Customers
In May 2014, the FASB issued an accounting standards update which replaces the current revenue recognitionstandards. Subsequently, the FASB has also issued accounting standards updates which clarify the guidance. Thenew revenue recognition standard provides a five-step analysis of transactions to determine when and how revenueis recognized. The core principle is that a company should recognize revenue to depict the transfer of promisedgoods or services to customers in an amount that reflects the consideration to which the entity expects to be entitledin exchange for those goods or services. This standard was initially released as effective for fiscal years beginningafter December 15, 2016, however, the FASB has decided to defer the effective date of this accounting standardupdate for one year. Early adoption of the update is permitted, but not before the original date for fiscal yearsbeginning after December 15, 2016. The update may be applied retrospectively for each period presented or as acumulative-effect adjustment at the date of adoption. The Company continues to evaluate the adoption of thisstandard. Based on our preliminary assessment, we determined the adoption will impact the accounting for our ShopYour Way program and revenues from gift cards. The expense for Shop Your Way points is currently recognized ascustomers earn them and recorded in cost of sales. The new guidance will require the Company to allocate thetransaction price to products and points on a relative standalone selling price basis, deferring the portion of revenueallocated to the points and recognizing a contract liability for unredeemed points. The new guidance will also changethe timing of recognition of the unredeemed portion of our gift cards, which is currently recognized using the remotemethod. The new guidance will require application of the proportional method. We continue to evaluate the impactof this standard on revenues from other sources, including: sales of services; extended service contracts; netcommissions earned from leased departments in retail stores and co-branded credit card programs.
SEARS HOLDINGS CORPORATIONNotes to Consolidated Financial Statements—(Continued)
74
NOTE 2—SEARS CANADA
Sears Canada Rights Offering
On October 2, 2014, the Company announced that its Board of Directors had approved a rights offering of upto 40 million shares of Sears Canada Inc. ("Sears Canada"). The subscription rights were distributed to allstockholders of Holdings, and every stockholder had the right to participate on the same terms in accordance with itspro rata ownership of the Company's common stock. In connection with the rights offering, each holder of Holdings'common stock received one subscription right for each share of common stock held at the close of business onOctober 16, 2014, the record date for the rights offering. Each subscription right entitled the holder thereof topurchase their pro rata portion of the Sears Canada common shares being sold by Holdings in the rights offering at acash subscription price of Canadian $10.60 per whole Sears Canada share, which was the closing price of SearsCanada's common shares on September 26, 2014, the last trading day before the Company requested Sears Canada'scooperation with the filing of a prospectus regarding the rights offering.
On October 16, 2014, ESL Partners, L.P. and Edward S. Lampert, our Chairman and Chief Executive Officerand Chairman and Chief Executive Officer of ESL exercised a portion of its pro rata portion of the basicsubscription rights to the offering. Accordingly, we sold a total of approximately 18 million common shares of SearsCanada to ESL, for which we received approximately $169 million in proceeds. After the sale of Sears Canadashares to ESL on October 16, 2014, the Company was the beneficial holder of approximately 34 million shares, or

34%, of the common shares of Sears Canada. As such, the Company no longer maintained control of Sears Canadaresulting in the de-consolidation of Sears Canada.
The Sears Canada rights offering closed on November 7, 2014 and was oversubscribed. Accordingly, theCompany sold a total of 40 million common shares of Sears Canada and received total aggregate proceeds of $380million for the rights offering by the closing date, including $212 million received from ESL and $93 millionreceived from Fairholme and its affiliates. Proceeds from the rights offering provided additional liquidity toHoldings during the 2014 holiday period and were used for general corporate purposes.
We accounted for the de-consolidation of Sears Canada in accordance with accounting standards applicable toconsolidation and de-recognized the assets, liabilities, accumulated other comprehensive income and non-controllinginterest related to Sears Canada and recognized a gain of approximately $70 million recorded within interest andinvestment income in the Consolidated Statements of Operations and within gain on sales of investments in theConsolidated Statements of Cash Flows for the year ended January 31, 2015, of which $42 million relates to theremeasurement of our retained equity interest to its fair value.
Also, we determined that we have the ability to exercise significant influence over Sears Canada as a result ofour ownership interest in Sears Canada and as a result of Mr. Lampert's role as our Chairman and Chief ExecutiveOfficer, and Chairman and Chief Executive Officer of ESL. Accordingly, we accounted for our retained investmentin the common shares of Sears Canada as an equity method investment in accordance with accounting standardsapplicable to investments. We elected the fair value option for the equity method investment in Sears Canada inaccordance with accounting standards applicable to financial instruments. The fair value of our equity methodinvestment is recorded in other assets in the Consolidated Balance Sheet, and the change in fair value is recorded ininterest and investment income in the Consolidated Statements of Operations, and is disclosed in Note 6.
In addition, since the Company has retained an equity interest in Sears Canada, the operating results for SearsCanada through October 16, 2014 are presented within the consolidated operations of Holdings and the SearsCanada segment in the accompanying Consolidated Financial Statements in accordance with accounting standardsapplicable to presentation of financial statements.
At both January 28, 2017 and January 30, 2016, the Company was the beneficial holder of approximately 12million, or 12%, of the common shares of Sears Canada. Our equity method investment in Sears Canada was $17million and $52 million at January 28, 2017 and January 30, 2016, respectively, and is included within other assetsin the Consolidated Balance Sheets. The fair value of our equity method investment in Sears Canada was determinedbased on quoted market prices for its common stock. Our equity method investment in Sears Canada is valued usingLevel 1 measurements as defined in Note 5.
SEARS HOLDINGS CORPORATIONNotes to Consolidated Financial Statements—(Continued)
75

NOTE 3—BORROWINGS
Total borrowings outstanding at January 28, 2017 and January 30, 2016 were $4.2 billion and $3.0 billion,respectively. At January 28, 2017, we had no short-term borrowings outstanding. At January 30, 2016, total short-term borrowings were $797 million, consisting of secured borrowings. The weighted-average annual interest ratepaid on short-term debt was 5.4% in 2016 and 3.5% in 2015.
Long-term debt was as follows:
ISSUE
January 28, 2017
January 30, 2016
millions
SEARS ROEBUCK ACCEPTANCE CORP.6.50% to 7.50% Notes, due 2017 to 2043 . . . . . . . . . . . . . . . . . . . . . . . . . . . . . . . $ 327 $ 327Term Loan (Credit Facility), $1.0B due 2018 . . . . . . . . . . . . . . . . . . . . . . . . . . . . 963 968Term Loan (Credit Facility), $750M due 2020 . . . . . . . . . . . . . . . . . . . . . . . . . . . 726 —Term Loan (Credit Facility), $300M due 2020 . . . . . . . . . . . . . . . . . . . . . . . . . . . 292 —
SEARS HOLDINGS CORP.8% Secured Loan Facility, due 2017 . . . . . . . . . . . . . . . . . . . . . . . . . . . . . . . . . . . 494 —6.625% Senior Secured Notes, due 2018 . . . . . . . . . . . . . . . . . . . . . . . . . . . . . . . . 303 3028% Senior Unsecured Notes, due 2019 . . . . . . . . . . . . . . . . . . . . . . . . . . . . . . . . . 428 3838% Secured Loan Facility, due 2020 . . . . . . . . . . . . . . . . . . . . . . . . . . . . . . . . . . . 485 —
CAPITALIZED LEASE OBLIGATIONS. . . . . . . . . . . . . . . . . . . . . . . . . . . . . . . . . . . 145 195OTHER NOTES AND MORTGAGES . . . . . . . . . . . . . . . . . . . . . . . . . . . . . . . . . . . . . — 4Total long-term borrowings . . . . . . . . . . . . . . . . . . . . . . . . . . . . . . . . . . . . . . . . . . . . . . 4,163 2,179Current maturities . . . . . . . . . . . . . . . . . . . . . . . . . . . . . . . . . . . . . . . . . . . . . . . . . . . . . (590) (71)Long-term debt and capitalized lease obligations . . . . . . . . . . . . . . . . . . . . . . . . . . . . . $ 3,573 $ 2,108
Weighted-average annual interest rate on long-term debt . . . . . . . . . . . . . . . . . . . . . . . 7.2% 6.6%
The fair value of long-term debt, excluding capitalized lease obligations, was $4.0 billion at January 28, 2017and $1.9 billion at January 30, 2016. The fair value of our debt was estimated based on quoted market prices for thesame or similar issues or on current rates offered to us for debt of the same remaining maturities. Our long-term debtinstruments are valued using Level 2 measurements as defined in Note 5.
At January 28, 2017, long-term debt maturities for the next five years and thereafter were as follows:
millions
2017 . . . . . . . . . . . . . . . . . . . . . . . . . . . . . . . . . . . . . . . . . . . . . . . . . . . . . . . . . . . . . . . . . . . . . . . . . . . . . . . . $ 5962018 . . . . . . . . . . . . . . . . . . . . . . . . . . . . . . . . . . . . . . . . . . . . . . . . . . . . . . . . . . . . . . . . . . . . . . . . . . . . . . . . 1,2942019 . . . . . . . . . . . . . . . . . . . . . . . . . . . . . . . . . . . . . . . . . . . . . . . . . . . . . . . . . . . . . . . . . . . . . . . . . . . . . . . . 6442020 . . . . . . . . . . . . . . . . . . . . . . . . . . . . . . . . . . . . . . . . . . . . . . . . . . . . . . . . . . . . . . . . . . . . . . . . . . . . . . . . 1,5632021 . . . . . . . . . . . . . . . . . . . . . . . . . . . . . . . . . . . . . . . . . . . . . . . . . . . . . . . . . . . . . . . . . . . . . . . . . . . . . . . . 5Thereafter. . . . . . . . . . . . . . . . . . . . . . . . . . . . . . . . . . . . . . . . . . . . . . . . . . . . . . . . . . . . . . . . . . . . . . . . . . . . 320Total maturities . . . . . . . . . . . . . . . . . . . . . . . . . . . . . . . . . . . . . . . . . . . . . . . . . . . . . . . . . . . . . . . . . . . . . . . 4,422Unamortized debt discount . . . . . . . . . . . . . . . . . . . . . . . . . . . . . . . . . . . . . . . . . . . . . . . . . . . . . . . . . . . . . . (217)Unamortized debt issuance costs . . . . . . . . . . . . . . . . . . . . . . . . . . . . . . . . . . . . . . . . . . . . . . . . . . . . . . . . . . (42)Long-term debt, net of discount & debt issuance costs . . . . . . . . . . . . . . . . . . . . . . . . . . . . . . . . . . . . . . . . . $ 4,163
SEARS HOLDINGS CORPORATIONNotes to Consolidated Financial Statements—(Continued)
76

Interest
Interest expense for years 2016, 2015 and 2014 was as follows:
millions 2016 2015 2014
COMPONENTS OF INTEREST EXPENSEInterest expense . . . . . . . . . . . . . . . . . . . . . . . . . . . . . . . . . . . . . . . . . . . . . . . . . . . . . . . . $ 288 $ 223 $ 238Amortization of debt issuance costs . . . . . . . . . . . . . . . . . . . . . . . . . . . . . . . . . . . . . . . . 31 25 33Accretion of debt discount . . . . . . . . . . . . . . . . . . . . . . . . . . . . . . . . . . . . . . . . . . . . . . . . 50 35 5Accretion of self-insurance obligations at net present value . . . . . . . . . . . . . . . . . . . . . . 16 19 22Accretion of lease obligations at net present value . . . . . . . . . . . . . . . . . . . . . . . . . . . . . 19 21 15Interest expense . . . . . . . . . . . . . . . . . . . . . . . . . . . . . . . . . . . . . . . . . . . . . . . . . . . . . . . . $ 404 $ 323 $ 313
Debt Repurchase Authorization
During the second quarter of 2015, the Board of Directors authorized the repurchase, subject to marketconditions and other factors, of up to $1.0 billion of our outstanding indebtedness in open market or privatelynegotiated transactions, superseding the previously disclosed debt repurchase authorization from 2005. TheCompany completed the Tender Offer discussed below pursuant to the debt repurchase authorization.
Unsecured Commercial Paper
We borrow through the commercial paper markets. At both January 28, 2017 and January 30, 2016, we had nocommercial paper borrowings outstanding.
Secured Short-Term Loan
On September 15, 2014, the Company, through Sears, Sears Development Co. and Kmart Corporation ("Short-Term Borrowers"), entities wholly-owned and controlled, directly or indirectly by the Company, entered into a $400million secured short-term loan (the "Short-Term Loan'") with JPP II, LLC and JPP, LLC (together, the "Short-TermLender"), entities affiliated with ESL and Fairholme. The first $200 million of the Short-Term Loan was funded atthe closing on September 15, 2014 and the remaining $200 million was funded on September 30, 2014. Proceeds ofthe Short-Term Loan were used for general corporate purposes.
The Short-Term Loan was originally scheduled to mature on December 31, 2014. As permitted by the Short-Term Loan agreement, the Company paid an extension fee equal to 0.5% of the principal amount to extend thematurity date to February 28, 2015. The Short-Term Loan had an annual base interest rate of 5%. The Short-TermBorrowers paid an upfront fee of 1.75% of the full principal amount. The Short-Term Loan was guaranteed by theCompany and was secured by a first priority lien on certain real properties owned by the Short-Term Borrowers.
On February 25, 2015, we entered into an agreement effective February 28, 2015, to amend and extend the$400 million secured short-term loan. Under the terms of the amendment, we repaid $200 million of the $400million on March 2, 2015 and the remaining $200 million on June 1, 2015, resulting in no balance outstanding atJanuary 30, 2016 or January 28, 2017. During 2015, the Short-Term Borrowers paid interest of $6 million to theShort-Term Lender. During 2014, the Short-Term Borrowers paid an upfront fee of $7 million, an extension fee of$2 million and interest of $6 million to the Short-Term Lender.
Letter of Credit Facility
On December 28, 2016, the Company, through Sears Roebuck Acceptance Corp. ("SRAC") and KmartCorporation (together with SRAC, the "Borrowers"), entities wholly-owned and controlled, directly or indirectly bythe Company, entered into a Letter of Credit and Reimbursement Agreement (the "LC Facility Agreement")providing for a $500 million secured standby letter of credit facility (the "LC Facility") from JPP, LLC and JPP II,LLC, entities affiliated with ESL (collectively, the "Lenders"), with Citibank, N.A., serving as administrative agentand issuing bank. On December 28, 2016, $200 million of commitments were made available under the LC Facility,
SEARS HOLDINGS CORPORATIONNotes to Consolidated Financial Statements—(Continued)
77

and, subject to approval of the Lenders, up to an additional $300 million in commitments may be obtained by theCompany from the Lenders (or other lenders) prior to December 28, 2017, the maturity date of the LC Facility.
The LC Facility is guaranteed by the same subsidiaries of the Company that guarantee the obligations underthe Amended Domestic Credit Agreement, as defined below, as well as by certain other subsidiaries that own realestate collateral. The LC Facility is secured by the same collateral as the Amended Domestic Credit Agreement, aswell as by certain real estate.
The Borrowers are required to reduce commitments under the LC Facility upon the occurrence of certainevents, including certain asset sales and other financing transactions. To secure their obligation to participate inletters of credit issued under the LC Facility, the Lenders are required to maintain cash collateral on deposit with theIssuing Bank in an amount equal to 102% of the commitments under the LC Facility (the "Lender Deposit").
The Borrowers were required to pay the Lenders an upfront fee equal to 1.50% of the amount of commitmentsprovided under the LC Facility. In addition, the Borrowers are required to pay a commitment fee of 5.75% perannum on the amount of the Lender Deposit (as such amount may be increased from time to time in connection withestablishing additional commitments), as well as certain other fees.
The LC Facility Agreement includes certain representations and warranties, affirmative and negative covenantsand other undertakings, which are subject to important qualifications and limitations set forth in the LC FacilityAgreement. The LC Facility Agreement also contains certain events of default, including (subject to certainmateriality thresholds and grace periods) payment default, failure to comply with covenants, material inaccuracy ofrepresentation or warranty, and bankruptcy or insolvency proceedings. If an event of default occurs, the Lendersmay terminate all or any portion of the commitments under the LC Facility, require the Borrowers to cashcollateralize the LC Facility and/or exercise any rights they might have under any of the related facility documents(including against the collateral), subject to certain limitations. At January 28, 2017, we had $200 million of lettersof credit outstanding under the LC Facility.
2017 Secured Loan Facility
On January 3, 2017, the Company, through Sears, Kmart Stores of Illinois LLC, Kmart of Washington LLCand Kmart Corporation (collectively, "2017 Secured Loan Borrowers"), entities wholly-owned and controlled,directly or indirectly by the Company, obtained a $500 million real estate loan facility (the "2017 Secured LoanFacility") from the Lenders, entities affiliated with ESL. On January 3, 2017, $321 million was funded under the2017 Secured Loan Facility, and an additional $179 million was drawn by the Company prior to January 28, 2017.The 2017 Secured Loan Facility matures on July 20, 2020. The Company expects to use the proceeds of the 2017Secured Loan Facility for general corporate purposes.
The 2017 Secured Loan Facility will have an annual base interest rate of 8%, with accrued interest payablemonthly during the term of the 2017 Secured Loan Facility. The Borrowers paid an upfront commitment fee equal to1.0% of the full principal amount of the 2017 Secured Loan Facility and paid a funding fee equal to 1.0% of theamounts drawn under the 2017 Secured Loan Facility at the time such amounts were drawn.
The 2017 Secured Loan Facility is guaranteed by the Company and certain of its subsidiaries, was secured by afirst priority lien on 69 real properties owned by the 2017 Secured Loan Borrowers and guarantors at inception. Incertain circumstances, the Lenders and the 2017 Secured Loan Borrowers may elect to substitute one or moreproperties as collateral. To the extent permitted under other debt of the Company or its affiliates, the 2017 SecuredLoan Facility may be prepaid at any time in whole or in part, without penalty or premium. The 2017 Secured LoanBorrowers are required to apply the net proceeds of the sale of any real property collateral for the 2017 SecuredLoan Facility to repay the loan.
The 2017 Secured Loan Facility includes certain representations and warranties, indemnities and covenants,including with respect to the condition and maintenance of the real property collateral. The 2017 Secured LoanFacility has certain events of default, including (subject to certain materiality thresholds and grace periods) paymentdefault, failure to comply with covenants, material inaccuracy of representation or warranty, and bankruptcy orinsolvency proceedings. If there is an event of default, the Lenders may declare all or any portion of the outstandingindebtedness to be immediately due and payable, exercise any rights they might have under any of the 2017 Secured
SEARS HOLDINGS CORPORATIONNotes to Consolidated Financial Statements—(Continued)
78
Loan Facility documents (including against the collateral), and require the 2017 Secured Loan Borrowers to pay adefault interest rate equal to the greater of (i) 2.5% in excess of the base interest rate and (ii) the prime rate plus 1%.
The carrying value of the 2017 Secured Loan Facility, net of the remaining debt issuance costs, was $485million at January 28, 2017.
2016 Secured Loan Facility
On April 8, 2016, the Company, through Sears, Sears Development Co., Innovel Solutions, Inc., Big Beaver ofFlorida Development, LLC and Kmart Corporation (collectively, "2016 Secured Loan Borrowers"), entities wholly-owned and controlled, directly or indirectly by the Company, obtained a $500 million real estate loan facility (the"2016 Secured Loan Facility") from JPP, LLC, JPP II, LLC, and Cascade Investment, LLC (collectively, the "2016Secured Loan Lenders"). JPP, LLC and JPP II, LLC are entities affiliated with ESL. The first $250 million of theSecured Loan Facility was funded on April 8, 2016 and the remaining $250 million was funded on April 22, 2016.The 2016 Secured Loan Facility has a maturity date of July 7, 2017, and is included within current portion of long-term debt on the Condensed Consolidated Balance Sheets at January 28, 2017. The Company used the proceeds ofthe 2016 Secured Loan Facility to reduce outstanding borrowings under the Company's asset-based revolving creditfacility and for general corporate purposes. The carrying value of the 2016 Secured Loan Facility, net of theremaining debt issuance costs, was $494 million at January 28, 2017.
The 2016 Secured Loan Facility has an annual base interest rate of 8%, with accrued interest payable monthlyduring the term of the 2016 Secured Loan Facility. The 2016 Secured Loan Borrowers paid an upfront commitmentfee equal to 1.0% of the full principal amount of the 2016 Secured Loan Facility and also are required to pay afunding fee equal to 1.0% of the amounts drawn under the 2016 Secured Loan Facility at the time such amounts aredrawn. If amounts remain outstanding or committed under the 2016 Secured Loan Facility after nine months, adelayed origination fee equal to 0.5% of such amounts becomes payable, and if amounts remain outstanding orcommitted under the Secured Loan Facility after 12 months, an additional delayed origination fee equal to 0.5% ofsuch amounts becomes payable.
The 2016 Secured Loan Facility is guaranteed by the Company and is secured by a first priority lien on 21 realproperties owned by the 2016 Secured Loan Borrowers. The 2016 Secured Loan Facility includes customaryrepresentations and warranties, indemnities and covenants, including with respect to the condition and maintenanceof the real property collateral.
The 2016 Secured Loan Facility has customary events of default, including (subject to certain materialitythresholds and grace periods) payment default, failure to comply with covenants, material inaccuracy ofrepresentation or warranty, and bankruptcy or insolvency proceedings. If there is an event of default, the 2016Secured Loan Lenders may declare all or any portion of the outstanding indebtedness to be immediately due andpayable, exercise any rights they might have under any of the 2016 Secured Loan Facility documents (includingagainst the collateral), and require the 2016 Secured Loan Borrowers to pay a default interest rate equal to thegreater of (i) 2.5% in excess of the base interest rate and (ii) the prime rate plus 1%. The Loan Facility may beprepaid at any time in whole or in part, without penalty or premium. The funds were used to reduce outstandingborrowings under the Company's asset-based revolving credit facility and for general corporate purposes.
Domestic Credit Agreement
During the first quarter of 2011, the Borrowers and Holdings entered into an amended credit agreement (the"Domestic Credit Agreement"). On October 2, 2013, Holdings and the Borrowers entered into a First Amendment(the "Amendment") to the Domestic Credit Agreement with a syndicate of lenders. Pursuant to the Amendment, theBorrowers borrowed $1.0 billion under a new senior secured term loan facility (the "Term Loan"). On July 21, 2015,the Borrowers and Holdings entered into an amended and restated credit agreement (the "Amended Domestic CreditAgreement") with a syndicate of lenders that amended and restated the then-existing Domestic Credit Agreement,and on April 8, 2016, the Amended Domestic Credit Agreement was further amended in connection with the 2016Term Loan as described below. The Amended Domestic Credit Agreement provided for a $3.275 billion asset-basedrevolving credit facility (the "Revolving Facility") with a $1.0 billion letter of credit sub-facility. The maturity datefor $1.971 billion of the Revolving Facility was extended to July 20, 2020, while $1.304 billion expired on April 8,2016. The Amended Domestic Credit Agreement also governs the Term Loan, which retains its maturity date of
SEARS HOLDINGS CORPORATIONNotes to Consolidated Financial Statements—(Continued)
79

June 30, 2018. The Amended Domestic Credit Agreement includes an accordion feature that allows the Borrowers touse, subject to borrowing base requirements, existing collateral for the facility to obtain up to $1.0 billion ofadditional borrowing capacity, of which $750 million was utilized for the 2016 Term Loan (described below). TheAmended Domestic Credit Agreement also includes a "FILO" ("first in last out") tranche feature that allows up to anadditional $500 million of borrowing capacity, and increased Holdings' ability to undertake short-term borrowingsfrom $750 million to $1 billion.
Revolving advances under the Amended Domestic Credit Agreement bear interest at a rate equal to, at theelection of the Borrowers, either the London Interbank Offered Rate ("LIBOR") or a base rate, in either case plus anapplicable margin dependent on Holdings' consolidated leverage ratio (as measured under the Amended DomesticCredit Agreement). The margin with respect to borrowings under the extended commitments ranges from 3.25% to3.75% for LIBOR loans and from 2.25% to 2.75% for base rate loans. The margin with respect to borrowings underthe non-extended commitments remains 2.00% to 2.50% for LIBOR loans and 1.00% to 1.50% for base rate loans.The Amended Domestic Credit Agreement also provides for the payment of fees with respect to issued and undrawnletters of credit at a rate equal to the margin applicable to LIBOR loans and a commitment fee with respect tounused amounts of the Revolving Facility at a rate, depending on facility usage, between 0.375% to 0.625%, perannum, with a minimum of 0.50% applicable to commitments under the extended tranche. From and after April 8,2016, such commitment fees with respect to the extended tranche are a flat 0.50%. As a result of the February 2017amendment to the Amended Domestic Credit Agreement, interest rate on loans under the revolving tranche of thedomestic credit facility increased by 25 basis points per annum (with the interest rate varying based on theCompany's consolidated leverage ratio) and increased the commitment fee on undrawn amounts under the revolvingtranche of the domestic credit facility increased by 12.5 basis points. From and after February 10, 2017, suchcommitment fees with respect to the extended tranche are a flat 0.625%.
The Revolving Facility is in place as a funding source for general corporate purposes and is secured by a firstlien on substantially all of our domestic inventory and credit card and pharmacy receivables, and is subject to aborrowing base formula to determine availability. The Revolving Facility is guaranteed by all domestic subsidiariesof Holdings that own inventory or credit card or pharmacy receivables. The Revolving Facility also permitsaggregate second lien indebtedness of up to $2.0 billion, of which $604 million in second lien notes wereoutstanding at January 28, 2017, resulting in $1.4 billion of permitted second lien indebtedness, subject tolimitations imposed by a borrowing base requirement under the indenture that governs our 6 5/8% senior securednotes due 2018. If, through asset sales or other means, the value of the above eligible assets is not sufficient tosupport borrowings of up to the full amount of the commitments under this facility, we will not have full access tothe facility, but rather could have access to a lesser amount determined by the borrowing base. Such a decline in thevalue of eligible assets also could result in our inability to borrow up to the full amount of second lien indebtednesspermitted by the domestic credit facility, but rather we could be limited to borrowing a lesser amount determined bythe borrowing base as calculated pursuant to the terms of such indenture.
The Term Loan bears interest at a rate equal to, at the election of the Borrowers, either (1) LIBOR (subject to a1.00% LIBOR floor) or (2) the highest of (x) the prime rate of the bank acting as agent of the syndicate of lenders,(y) the federal funds rate plus 0.50% and (z) the one-month LIBOR rate plus 1.00% (the highest of (x), (y) and (z),the "Base Rate"), plus an applicable margin for LIBOR loans of 4.50% and for Base Rate loans of 3.50%. Currently,the Borrowers are required to repay the Term Loan in quarterly installments of $2.5 million, with the remainder ofthe Term Loan maturing June 30, 2018. Additionally, the Borrowers are required to make certain mandatoryrepayments of the Term Loan from excess cash flow (as defined in the Amended Domestic Credit Agreement). TheTerm Loan may be prepaid in whole or part without penalty. The Term Loan is secured by the same collateral as theRevolving Facility on a pari passu basis with the Revolving Facility, and is guaranteed by the same subsidiaries ofthe Company that guarantee the Revolving Facility. At January 28, 2017 and January 30, 2016, respectively, we hadborrowings of $970 million and $980 million under the Term Loan, and carrying value, net of the remainingdiscount and debt issuance costs, of $963 million and $968 million. As disclosed in Note 1, a portion of the proceedsreceived from the Craftsman Sale were used to reduce outstanding borrowings under the Term Loan, reducing thecarrying value, net of the remaining discount and debt issuance costs, to $724 million at March 8, 2017.
The Amended Domestic Credit Agreement limits our ability to make restricted payments, including dividendsand share repurchases, subject to specified exceptions that are available if, in each case, no event of default underthe credit facility exists immediately before or after giving effect to the restricted payment. These include exceptions
SEARS HOLDINGS CORPORATIONNotes to Consolidated Financial Statements—(Continued)
80
that require that projected availability under the credit facility, as defined, is at least 15%, exceptions that may besubject to certain maximum amounts and an exception that requires that the restricted payment is funded from cashon hand and not from borrowings under the credit facility. Further, the Amended Domestic Credit Agreementincludes customary covenants that restrict our ability to make dispositions, prepay debt, and make investments,subject, in each case, to various exceptions. The Amended Domestic Credit Agreement also imposes various otherrequirements, which take effect if availability falls below designated thresholds, including a cash dominionrequirement and a requirement that the fixed charge ratio at the last day of any quarter be not less than 1.0 to 1.0. Asof January 28, 2017, our fixed charge ratio was less than 1.0 to 1.0. If availability under the domestic revolvingcredit facility were to fall below 10%, the Company would be required to test the fixed charge coverage ratio, andwould not comply with the facility, and the lenders under the facility could demand immediate payment in full of allamounts outstanding and terminate their obligations under the facility. In addition, the domestic credit facilityprovides that in the event we make certain prepayments of indebtedness, for a period of one year thereafter we mustmaintain availability under the facility of at least 12.5%, and it prohibits certain other prepayments of indebtedness.
At January 28, 2017, we had no borrowings outstanding under the Revolving Facility. At January 30, 2016, wehad $797 million of Revolving Facility borrowings outstanding under the Revolving Facility. At January 28, 2017and January 30, 2016, we had $464 million and $652 million of letters of credit outstanding under the RevolvingFacility, respectively. At January 28, 2017 and January 30, 2016, the amount available to borrow under theRevolving Facility was $165 million and $316 million, respectively, which reflects the effect of the springing fixedcharge coverage ratio covenant and the borrowing base limitation. The majority of the letters of credit outstandingare used to provide collateral for our insurance programs.
2016 Term Loan
On April 8, 2016, the Company, SRAC, and Kmart Corporation (together with SRAC, the "ABL Borrowers")entered into an amendment to the Amended Domestic Credit Agreement, with a syndicate of lenders, including Bankof America, N.A., as agent. The amendment to the Amended Domestic Credit Agreement was executed inconnection with the closing of a new $750 million senior secured term loan under the Amended Domestic CreditAgreement (the "2016 Term Loan").
Amounts borrowed pursuant to the 2016 Term Loan bears interest at a rate equal to the London InterbankOffered Rate ("LIBOR") plus 750 basis points, subject to a 1.00% LIBOR floor. The Company receivedapproximately $722 million in net proceeds from the 2016 Term Loan, which proceeds were used to reduceoutstanding borrowings under its asset-based revolving credit facility. The 2016 Term Loan has a maturity date ofJuly 20, 2020, which is the same maturity date as the Company’s $1.971 billion revolving credit facilitycommitments, and does not amortize. The 2016 Term Loan is subject to a prepayment premium of 2% of theaggregate principal amount of the 2016 Term Loan prepaid on or prior to April 8, 2017 and 1% of the aggregateprincipal amount of the 2016 Term Loan prepaid after April 8, 2017 and on or prior to April 8, 2018. The obligationsunder the Amended Domestic Credit Agreement, including the 2016 Term Loan, are secured by a first lien onsubstantially all of the domestic inventory and credit card and pharmacy receivables of the Company and itssubsidiaries and aggregate advances under the Amended Domestic Credit Agreement are subject to a borrowing baseformula. The Amended Domestic Credit Agreement is guaranteed by all domestic subsidiaries of the Company thatown inventory or credit card or pharmacy receivables. The other material terms of the Amended Domestic CreditAgreement were not modified by the amendment. The carrying value of the 2016 Term Loan, net of the remainingdiscount and debt issuance costs, was $726 million at January 28, 2017. As disclosed in Note 1, a portion of theproceeds received from the Craftsman Sale were used to reduce outstanding borrowings under the 2016 Term Loan,reducing the carrying value, net of the remaining discount and debt issuance costs, to $553 million at March 8, 2017.
Second Lien Term Loan
On September 1, 2016, the ABL Borrowers entered into a Second Lien Credit Agreement (the "Second LienCredit Agreement") with the Lenders thereunder, entities affiliated with ESL, pursuant to which the ABL Borrowersborrowed $300 million under a term loan (the "Second Lien Term Loan"). The Company received net proceeds of$291 million, which were used for general corporate purposes.
SEARS HOLDINGS CORPORATIONNotes to Consolidated Financial Statements—(Continued)
81

The maturity date for the Second Lien Term Loan is July 20, 2020 and the Second Lien Term Loan will notamortize. The Second Lien Credit Agreement includes an accordion feature that allows the ABL Borrowers to seekto obtain from third parties up to $200 million of additional loans under the Second Lien Credit Agreement on thesame terms as the Second Lien Term Loan. The Second Lien Term Loan bears interest at a rate equal to, at theelection of the ABL Borrowers, either LIBOR (subject to a 1.00% floor) or a specified prime rate ("Base Rate"), ineither case plus an applicable margin. The margin with respect to the Second Lien Term Loan is 7.50% for LIBORloans and 6.50% for Base Rate loans.
The Company’s obligations under the Second Lien Credit Agreement are secured on a pari passu basis with theCompany’s obligations under that certain Indenture, dated as of October 12, 2010, pursuant to which the Companyissued its Senior Secured Notes (defined below). The collateral includes inventory, receivables and other relatedassets of the Company and its subsidiaries which are obligated on the Second Lien Term Loan and the SeniorSecured Notes. The Second Lien Credit Agreement is guaranteed by all domestic subsidiaries of the Company thatguarantee the Company’s obligations under its existing Revolving Facility.
The Second Lien Credit Agreement includes representations and warranties, covenants and other undertakings,which representations and warranties, covenants and other undertakings and events of default that are substantiallysimilar to those contained in the Amended Domestic Credit Agreement. The carrying value of the Second Lien TermLoan, net of the remaining debt issuance costs, was $292 million at January 28, 2017.
Senior Secured Notes
In October 2010, we sold $1.0 billion aggregate principal amount of senior secured notes (the "Senior SecuredNotes"), which bear interest at 6 5/8% per annum and mature on October 15, 2018. Concurrent with the closing ofthe sale of the Senior Secured Notes, the Company sold $250 million aggregate principal amount of Senior SecuredNotes to the Company's domestic pension plan in a private placement, none of which remain in the domesticpension plan as a result of the Tender Offer discussed below. The Senior Secured Notes are guaranteed by certainsubsidiaries of the Company and are secured by a security interest in certain assets consisting primarily of domesticinventory and credit card receivables (the "Collateral"). The lien that secures the Senior Secured Notes is junior inpriority to the lien on such assets that secures obligations under the Amended Domestic Credit Agreement, as well ascertain other first priority lien obligations. The Company used the net proceeds of this offering to repay borrowingsoutstanding under a previous domestic credit agreement on the settlement date and to fund the working capitalrequirements of our retail businesses, capital expenditures and for general corporate purposes. The indenture underwhich the Senior Secured Notes were issued contains restrictive covenants that, among other things, (1) limit theability of the Company and certain of its domestic subsidiaries to create liens and enter into sale and leasebacktransactions and (2) limit the ability of the Company to consolidate with or merge into, or sell other than for cash orlease all or substantially all of its assets to, another person. The indenture also provides for certain events of default,which, if any were to occur, would permit or require the principal and accrued and unpaid interest on all the thenoutstanding Senior Secured Notes to be due and payable immediately. Generally, the Company is required to offer torepurchase all outstanding Senior Secured Notes at a purchase price equal to 101% of the principal amount if theborrowing base (as calculated pursuant to the indenture) falls below the principal value of the Senior Secured Notesplus any other indebtedness for borrowed money that is secured by liens on the Collateral for two consecutivequarters or upon the occurrence of certain change of control triggering events. The Company may call the SeniorSecured Notes at a premium based on the "Treasury Rate" as defined in the indenture, plus 50 basis points. OnSeptember 6, 2011, we completed our offer to exchange the Senior Secured Notes held by nonaffiliates for a newissue of substantially identical notes registered under the Securities Act of 1933, as amended.
On August 3, 2015, the Company commenced a tender offer (the "Tender Offer") to purchase for cash up to$1.0 billion principal amount of its Senior Secured Notes, which expired on August 28, 2015. Approximately $936million principal amount of the Senior Secured Notes were validly tendered and not validly withdrawn in the TenderOffer. Holders who validly tendered and did not validly withdraw Senior Secured Notes at or prior to the earlytender date of August 14, 2015 received total consideration of $990 per $1,000 principal amount of Senior SecuredNotes that were accepted for purchase, which included an early tender payment of $30 per $1,000 principal amountof Senior Secured Notes accepted for purchase, plus accrued and unpaid interest up to, but excluding, the settlementdate. Holders who validly tendered and did not validly withdraw Senior Secured Notes after the early tender date butat or prior to the expiration date of August 28, 2015 received total consideration of $960 per $1,000 principal
SEARS HOLDINGS CORPORATIONNotes to Consolidated Financial Statements—(Continued)
82
amount of Senior Secured Notes accepted for purchase, plus accrued and unpaid interest up to, but excluding, thesettlement date.
We accounted for the Tender Offer in accordance with accounting standards applicable to extinguishment ofliabilities and debt modifications and extinguishments. Accordingly, we de-recognized the net carrying amount ofSenior Secured Notes of $929 million (comprised of the principal amount of $936 million, offset by unamortizeddebt issuance costs and discount of $7 million), and the reacquisition cost was $929 million.
The carrying value of Senior Secured Notes, net of the remaining discount and debt issuance costs, was $303million and $302 million at January 28, 2017 and January 30, 2016, respectively.
Senior Unsecured Notes
On October 20, 2014, the Company announced its Board of Directors had approved a rights offering allowingits stockholders to purchase up to $625 million in aggregate principal amount of 8% senior unsecured notes due2019 and warrants to purchase shares of its common stock. The subscription rights were distributed to allstockholders of the Company as of October 30, 2014, the record date for this rights offering, and every stockholderhad the right to participate on the same terms in accordance with its pro rata ownership of the Company's commonstock, except that holders of the Company's restricted stock that was unvested as of the record date received cashawards in lieu of subscription rights. This rights offering closed on November 18, 2014 and was oversubscribed.
Accordingly, on November 21, 2014, the Company issued $625 million aggregate original principal amount of8% senior unsecured notes due 2019 (the "Senior Unsecured Notes") and received proceeds of $625 million whichwere used for general corporate purposes. The Senior Unsecured Notes are the unsecured and unsubordinatedobligations of the Company and rank equal in right of payment with the existing and future unsecured andunsubordinated indebtedness of the Company. The Senior Unsecured Notes bear interest at a rate of 8% per annumand the Company will pay interest semi-annually on June 15 and December 15 of each year. The Senior UnsecuredNotes are not guaranteed.
We accounted for the Senior Unsecured Notes in accordance with accounting standards applicable todistinguishing liabilities from equity and debt with conversion and other options. Accordingly, we allocated theproceeds received for the Senior Unsecured Notes based on the relative fair values of the Senior Unsecured Notesand warrants, which resulted in a discount to the notes of approximately $278 million. The fair value of the SeniorUnsecured Notes and warrants was estimated based on quoted market prices for the same issues using Level 1measurements as defined in Note 5. The discount is being amortized over the life of the Senior Unsecured Notesusing the effective interest method with an effective interest rate of 11.55%. Approximately $44 million and $35million of the discount was amortized during 2016 and 2015, respectively. The remaining discount wasapproximately $195 million and $238 million at January 28, 2017 and January 30, 2016, respectively. The carryingvalue of the Senior Unsecured Notes net of the remaining discount and debt issuance costs was approximately $428million and $383 million at January 28, 2017 and January 30, 2016, respectively.
Cash Collateral
We post cash collateral for certain self-insurance programs. We continue to classify the cash collateral postedfor self-insurance programs as cash and cash equivalents due to our ability to substitute letters of credit for the cashat any time at our discretion. At January 28, 2017 and January 30, 2016, $3 million and $2 million of cash,respectively, was posted as collateral for self-insurance programs.
Wholly-owned Insurance Subsidiary and Intercompany Securities
We have numerous types of insurable risks, including workers’ compensation, product and general liability,automobile, warranty, asbestos and environmental claims and the extended service contracts we sell to ourcustomers. In addition, we provide credit insurance to third party creditors of the Company to mitigate their creditrisk with the Company. The majority of the associated risks are managed through Holdings’ wholly-owned insurancesubsidiary, Sears Reinsurance Company Ltd. ("Sears Re"), a Bermuda Class 3 insurer.
In accordance with applicable insurance regulations, Sears Re holds marketable securities to support theinsurance coverage it provides. Sears has utilized two securitization structures to issue specific securities in which
SEARS HOLDINGS CORPORATIONNotes to Consolidated Financial Statements—(Continued)
83
Sears Re has invested its capital to fund its insurance obligations. In November 2003, Sears formed a Real EstateMortgage Investment Conduit, or REMIC. The real estate associated with 125 Full-line stores was contributed toindirect wholly-owned subsidiaries of Sears, and then leased back to Sears. The contributed stores were mortgagedand the REMIC issued to wholly-owned subsidiaries of Sears (including Sears Re) $1.3 billion (par value) ofsecurities (the "REMIC Securities") that are secured by the mortgages and collateral assignments of the store leases.Payments to the holders on the REMIC Securities are funded by the lease payments. In May 2006, a subsidiary ofHoldings contributed the rights to use the Kenmore, Craftsman and DieHard trademarks in the U.S. and itspossessions and territories to KCD IP, LLC, an indirect wholly-owned subsidiary of Holdings. KCD IP, LLC haslicensed the use of the trademarks to subsidiaries of Holdings, including Sears and Kmart. Asset-backed securitieswith a par value of $1.8 billion (the "KCD Securities") were issued by KCD IP, LLC and subsequently purchased bySears Re, the collateral for which includes the trademark rights and royalty income. Payments to the holders on theKCD Securities are funded by the royalty payments. In connection with the Craftsman transaction, KCD Securitieswith par value of $900 million were redeemed in March 2017. The issuers of the REMIC Securities and KCDSecurities and the owners of these real estate and trademark assets are bankruptcy remote, special purpose entitiesthat are indirect wholly-owned subsidiaries of Holdings. Cash flows received from rental streams and licensing feestreams paid by Sears, Kmart, other affiliates and third parties, are used for the payment of fees and interest on thesesecurities. In the fourth quarter of fiscal 2013, Holdings contributed all of the outstanding capital stock of Sears Reto SRe Holding Corporation, a direct wholly-owned subsidiary of Holdings. Sears Re thereafter reduced its excessstatutory capital through the distribution of all REMIC Securities held by it to SRe Holding Corporation. Since theinception of the REMIC and KCD IP, LLC, the REMIC Securities and the KCD Securities have been entirely heldby our wholly-owned consolidated subsidiaries. At both January 28, 2017 and January 30, 2016, the net book valueof the securitized trademark rights was approximately $1.0 billion. The net book value of the securitized real estateassets was approximately $0.6 billion at both January 28, 2017 and January 30, 2016.
Trade Creditor Matters
We have ongoing discussions concerning our liquidity and financial position with the vendor community andthird parties that offer various credit protection services to our vendors. The topics discussed have included suchareas as pricing, payment terms and ongoing business arrangements. As of the date of this report, we have notexperienced any significant disruption in our access to merchandise or our operations.
SEARS HOLDINGS CORPORATIONNotes to Consolidated Financial Statements—(Continued)
84
NOTE 4—FINANCIAL GUARANTEES
Financial Guarantees
We issue various types of guarantees in the normal course of business. We had the following guaranteesoutstanding at January 28, 2017:
millionsBankIssued
SRACIssued Other Total
Standby letters of credit . . . . . . . . . . . . . . . . . . . . . . . . . . . . . $ 665 $ 7 $ — $ 672Commercial letters of credit . . . . . . . . . . . . . . . . . . . . . . . . . . — 54 — 54Secondary lease obligations . . . . . . . . . . . . . . . . . . . . . . . . . . — — 122 122
The secondary lease obligations related to certain store leases that have been assigned and previously divestedSears businesses. The secondary lease obligations represent the maximum potential amount of future payments,including renewal option periods pursuant to the lease agreements. We remain secondarily liable if the primaryobligor defaults.
NOTE 5—FAIR VALUE OF FINANCIAL ASSETS AND LIABILITIES
We determine fair value of financial assets and liabilities based on the following fair value hierarchy, whichprioritizes the inputs to valuation techniques used to measure fair value into three levels:

Level 1 inputs – unadjusted quoted prices in active markets for identical assets or liabilities that we have theability to access. An active market for the asset or liability is one in which transactions for the asset or liabilityoccur with sufficient frequency and volume to provide ongoing pricing information.
Level 2 inputs – inputs other than quoted market prices included in Level 1 that are observable, either directlyor indirectly, for the asset or liability. Level 2 inputs include, but are not limited to, quoted prices for similarassets or liabilities in an active market, quoted prices for identical or similar assets or liabilities in markets thatare not active and inputs other than quoted market prices that are observable for the asset or liability, such asinterest rate curves and yield curves observable at commonly quoted intervals, volatilities, credit risk anddefault rates.
Level 3 inputs – unobservable inputs for the asset or liability.
Cash and cash equivalents, accounts receivable, merchandise payables, short-term borrowings and accruedliabilities are reflected in the Consolidated Balance Sheets at cost, which approximates fair value due to the short-term nature of these instruments. The fair value of our equity method investment in Sears Canada is disclosed inNote 2. The fair value of our long-term debt is disclosed in Note 3. The fair value of pension and otherpostretirement benefit plan assets is disclosed in Note 7.
Assets and Liabilities that are Measured at Fair Value on a Nonrecurring Basis
Assets and liabilities that are measured at fair value on a nonrecurring basis relate primarily to our tangiblefixed assets, goodwill and other intangible assets, which are remeasured when the derived fair value is belowcarrying value on our Consolidated Balance Sheets. For these assets, we do not periodically adjust carrying value tofair value except in the event of impairment. When we determine that impairment has occurred, we measure theimpairment and adjust the carrying value as discussed in Note 1. With the exception of the indefinite-livedintangible asset impairments and fixed asset impairments described in Note 12 and Note 13, respectively, we had nosignificant remeasurements of such assets or liabilities to fair value during 2016 and 2015.
All of the fair value remeasurements were based on significant unobservable inputs (Level 3). Fixed asset fairvalues were derived based on discussions with real estate brokers, review of comparable properties, if available, andinternal expertise related to the current marketplace conditions. Inputs for the goodwill and intangible asset analysesincluded discounted cash flow analyses, comparable marketplace fair value data, as well as management'sassumptions in valuing significant tangible and intangible assets, as described in Note 1, Summary of SignificantAccounting Policies.
SEARS HOLDINGS CORPORATIONNotes to Consolidated Financial Statements—(Continued)
85
NOTE 6—INTEREST AND INVESTMENT INCOME (LOSS)
The following table sets forth the components of interest and investment income (loss) as reported in ourConsolidated Statements of Operations:
millions 2016 2015 2014
Interest income on cash and cash equivalents . . . . . . . . . . . . . . . . . . . . . . . . . . . . . . . . . $ 1 $ 1 $ 3Gain on de-consolidation of Sears Canada . . . . . . . . . . . . . . . . . . . . . . . . . . . . . . . . . . . — — 70Other investment income (loss) . . . . . . . . . . . . . . . . . . . . . . . . . . . . . . . . . . . . . . . . . . . . (27) (63) 59Total . . . . . . . . . . . . . . . . . . . . . . . . . . . . . . . . . . . . . . . . . . . . . . . . . . . . . . . . . . . . . . . . . $ (26) $ (62) $ 132
Interest Income on Cash and Cash Equivalents
We recorded interest income of $1 million, $1 million and $3 million in 2016, 2015 and 2014, respectively,primarily related to interest earned on cash and cash equivalents. These cash and cash equivalents consist of highlyliquid investments with original maturities of three months or less at the date of purchase. Our invested cash mayinclude, from time to time, investments in, but not limited to, commercial paper, federal, state and municipalgovernment securities, floating-rate notes, repurchase agreements and money market funds. All invested cashamounts are readily available to us.

Gain on de-consolidation of Sears Canada
During 2014, as further described in Note 2, interest and investment income included a gain of $70 million onthe de-consolidation of Sears Canada as a result of the rights offering.
Other Investment Income (Loss)
Other investment income (loss) primarily includes income or loss generated by (and sales of investments in)certain real estate joint ventures and other equity investments in which we do not have a controlling interest. During2016 and 2015, respectively, the investment loss from equity investments included a loss of $35 million and $59million related to our equity investment in Sears Canada. Investment income from equity investments was $37million in 2014.
During 2014, the investment income from equity investments included gains of $35 million related to the saleof joint venture interests for which Sears Canada received $65 million ($71 million Canadian) in cash proceeds.
SEARS HOLDINGS CORPORATIONNotes to Consolidated Financial Statements—(Continued)
86
NOTE 7—BENEFIT PLANS
We sponsor a number of pension and postretirement benefit plans. We account for our retirement programs inaccordance with employers' accounting for defined benefit pension and other postretirement plans under GenerallyAccepted Accounting Principles ("GAAP"). GAAP requires that amounts recognized in financial statements bedetermined using an actuarial basis. As a result, our pension benefit programs are based on a number of statisticaland judgmental assumptions that attempt to anticipate future events and are used in calculating the expense andliability related to our plans each year at January 31. These assumptions include, but are not limited to, discountrates used to value liabilities, assumed rates of return on plan assets, actuarial assumptions relating to retirement ageand participant turnover, and mortality rates. The actuarial assumptions we use may differ significantly from actualresults. These differences may result in a material impact to the amount of net periodic benefit cost to be recorded inour consolidated financial statements in the future.
Assumed mortality rates of plan participants are a critical estimate in measuring the expected payments aparticipant will receive over their lifetime and the amount of liability and expense we recognize. On October 27,2014, the Society of Actuaries ("SOA") published updated mortality tables and an updated mortality improvementscale, which both reflect improved longevity. In determining the appropriate mortality assumptions as of January 31,2015, we considered the SOA’s updated mortality tables, as well as other mortality information available from theSocial Security Administration to develop assumptions aligned with our expectation of future improvement rates.The change to the mortality rate assumptions resulted in an increase in the 2014 year-end pension obligation ofapproximately $300 million.
Expenses for retirement and savings-related benefit plans were as follows:
millions 2016 2015 2014
Retirement/401(k) savings plans. . . . . . . . . . . . . . . . . . . . . . . . . . . . . . . . . . . . . $ — $ — $ 4Pension plans. . . . . . . . . . . . . . . . . . . . . . . . . . . . . . . . . . . . . . . . . . . . . . . . . . . . 289 230 82Postretirement benefits . . . . . . . . . . . . . . . . . . . . . . . . . . . . . . . . . . . . . . . . . . . . 28 (2) 9Total. . . . . . . . . . . . . . . . . . . . . . . . . . . . . . . . . . . . . . . . . . . . . . . . . . . . . . . . . . . $ 317 $ 228 $ 95
Retirement Savings Plans
Holdings sponsors retirement savings plans for employees meeting service eligibility requirements. TheCompany does not match employee contributions.
Other Benefit Plans
Certain full-time and part-time employees of Kmart and Sears are eligible to participate in noncontributorydefined benefit plans after meeting age and service requirements. Effective January 31, 1996 and January 1, 2006,respectively, the Kmart tax-qualified defined benefit pension plan and the Sears domestic pension plan were frozen

and associates no longer earn additional benefits under the plan. The Kmart tax-qualified defined benefit pensionplan was merged with and into the Sears domestic pension plan effective as of January 30, 2008. The merged planwas renamed as the Sears Holdings Pension Plan ("SHC Domestic plan") and Holdings accepted sponsorship of theSHC Domestic plan effective as of that date.
Pension benefits are based on length of service, compensation and, in certain plans, social security or otherbenefits. Funding for the various plans is determined using various actuarial cost methods.
In addition to providing pension benefits, Sears provides employees and retirees certain medical benefits.These benefits provide access to medical plans. Certain Sears retirees are also provided life insurance benefits. Tothe extent we share the cost of the retiree medical benefits with retirees, such cost sharing is based on years ofservice and year of retirement. Sears' postretirement benefit plans are not funded. We have the right to modify orterminate these plans.
Effective December 31, 2014, the Company amended its retiree medical plan to eliminate Company subsidiesto the plan. This resulted in a reduction to the postretirement benefit obligation of $48 million.
Pension Plan Amendment
Effective December 1, 2016, the SHC Domestic plan was amended to change its plan year from a calendaryear end to a November 30th year end, to spin off a new SHC Pension Plan No. 2 ("Plan No. 2") and to rename theSears Holdings Pension Plan as Sears Holdings Pension Plan 1 (“Plan No. 1). In conjunction with theseamendments, the Company requested that the Internal Revenue Service ("IRS") approve the foregoing change inplan year and to approve a change in actuarial funding method in connection with the spin-off and change in planyear. The Company has received IRS approval of the change in plan year and the request for approval of the changein actuarial funding method remains pending with IRS.
Pension Plans
2016 2015
millionsSHC
DomesticSHC
Domestic
Change in projected benefit obligation:Beginning balance . . . . . . . . . . . . . . . . . . . . . . . . . . . . . . . . . . . . . . . . . . . . . . . . . . . . . . . . $ 5,265 $ 5,874Interest cost . . . . . . . . . . . . . . . . . . . . . . . . . . . . . . . . . . . . . . . . . . . . . . . . . . . . . . . . . . . . . 227 211Actuarial (gain) loss . . . . . . . . . . . . . . . . . . . . . . . . . . . . . . . . . . . . . . . . . . . . . . . . . . . . . . . 108 (354)Benefits paid. . . . . . . . . . . . . . . . . . . . . . . . . . . . . . . . . . . . . . . . . . . . . . . . . . . . . . . . . . . . . (435) (468)Other. . . . . . . . . . . . . . . . . . . . . . . . . . . . . . . . . . . . . . . . . . . . . . . . . . . . . . . . . . . . . . . . . . . — 2
Balance at the measurement date . . . . . . . . . . . . . . . . . . . . . . . . . . . . . . . . . . . . . . . . . . . . . . . . $ 5,165 $ 5,265
Change in assets at fair value:Beginning balance . . . . . . . . . . . . . . . . . . . . . . . . . . . . . . . . . . . . . . . . . . . . . . . . . . . . . . . . $ 3,189 $ 3,616Actual return on plan assets . . . . . . . . . . . . . . . . . . . . . . . . . . . . . . . . . . . . . . . . . . . . . . . . . 499 (258)Company contributions . . . . . . . . . . . . . . . . . . . . . . . . . . . . . . . . . . . . . . . . . . . . . . . . . . . . 314 299Benefits paid. . . . . . . . . . . . . . . . . . . . . . . . . . . . . . . . . . . . . . . . . . . . . . . . . . . . . . . . . . . . . (435) (468)
Balance at the measurement date . . . . . . . . . . . . . . . . . . . . . . . . . . . . . . . . . . . . . . . . . . . . . . . . $ 3,567 $ 3,189Net amount recognized . . . . . . . . . . . . . . . . . . . . . . . . . . . . . . . . . . . . . . . . . . . . . . . . . . . . . . . . $ (1,598) $ (2,076)
The accumulated benefit obligation for the SHC Domestic pension plan was $5.2 billion at January 28, 2017and $5.3 billion at January 30, 2016.
SEARS HOLDINGS CORPORATIONNotes to Consolidated Financial Statements—(Continued)
87

Postretirement Benefit Obligations
2016 2015
millionsSHC
DomesticSHC
Domestic
Change in accumulated postretirement benefit obligation:Beginning balance. . . . . . . . . . . . . . . . . . . . . . . . . . . . . . . . . . . . . . . . . . . . . . . . . . . . . . . . . $ 143 $ 156Interest cost . . . . . . . . . . . . . . . . . . . . . . . . . . . . . . . . . . . . . . . . . . . . . . . . . . . . . . . . . . . . . . 5 5Plan participants' contributions . . . . . . . . . . . . . . . . . . . . . . . . . . . . . . . . . . . . . . . . . . . . . . . — 1Benefits paid . . . . . . . . . . . . . . . . . . . . . . . . . . . . . . . . . . . . . . . . . . . . . . . . . . . . . . . . . . . . . (19) (13)Actuarial (gain) loss . . . . . . . . . . . . . . . . . . . . . . . . . . . . . . . . . . . . . . . . . . . . . . . . . . . . . . . 9 (6)Other . . . . . . . . . . . . . . . . . . . . . . . . . . . . . . . . . . . . . . . . . . . . . . . . . . . . . . . . . . . . . . . . . . . 30 —
Balance at the measurement date . . . . . . . . . . . . . . . . . . . . . . . . . . . . . . . . . . . . . . . . . . . . . . . . . $ 168 $ 143
Change in plan assets at fair value:Beginning of year balance. . . . . . . . . . . . . . . . . . . . . . . . . . . . . . . . . . . . . . . . . . . . . . . . . . . $ — $ —Company contributions . . . . . . . . . . . . . . . . . . . . . . . . . . . . . . . . . . . . . . . . . . . . . . . . . . . . . 19 12Plan participants' contributions . . . . . . . . . . . . . . . . . . . . . . . . . . . . . . . . . . . . . . . . . . . . . . . — 1Benefits paid . . . . . . . . . . . . . . . . . . . . . . . . . . . . . . . . . . . . . . . . . . . . . . . . . . . . . . . . . . . . . (19) (13)
Balance at the measurement date . . . . . . . . . . . . . . . . . . . . . . . . . . . . . . . . . . . . . . . . . . . . . . . . . $ — $ —Funded status . . . . . . . . . . . . . . . . . . . . . . . . . . . . . . . . . . . . . . . . . . . . . . . . . . . . . . . . . . . . . . . . $ (168) $ (143)
The current portion of our liability for postretirement benefit obligations is $18 million, which we expect topay during fiscal 2017.
Weighted-average assumptions used to determine plan obligations were as follows:
2016 2015 2014SHC
DomesticSHC
DomesticSHC
Domestic
Pension benefits:Discount Rate . . . . . . . . . . . . . . . . . . . . . . . . . . . . . . . . . . . . . . . . . . . . . . . . . 4.15% 4.50% 3.70%
Postretirement benefits:Discount Rate . . . . . . . . . . . . . . . . . . . . . . . . . . . . . . . . . . . . . . . . . . . . . . . . . 3.85% 4.00% 3.30%
The decrease in the discount rate in 2016 resulted in an increase in the 2016 year-end pension obligation ofapproximately $181 million.
SEARS HOLDINGS CORPORATIONNotes to Consolidated Financial Statements—(Continued)
88
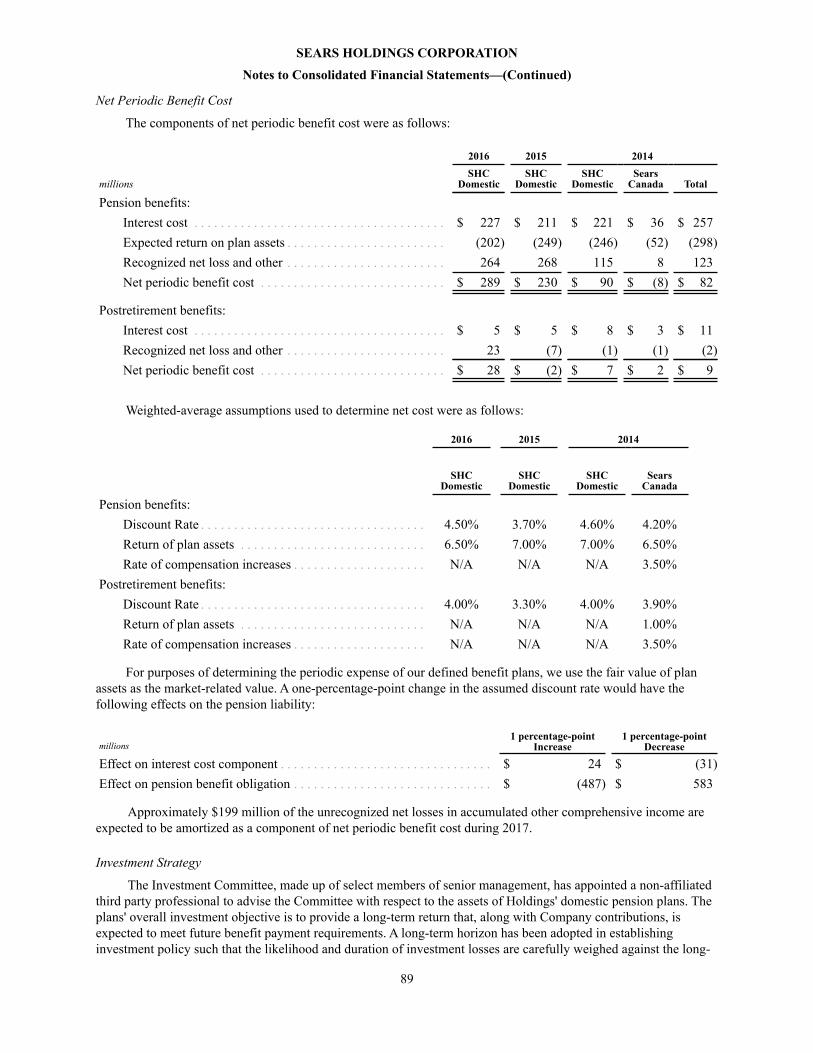
Net Periodic Benefit Cost
The components of net periodic benefit cost were as follows:
2016 2015 2014
millionsSHC
DomesticSHC
DomesticSHC
DomesticSears
Canada Total
Pension benefits:Interest cost . . . . . . . . . . . . . . . . . . . . . . . . . . . . . . . . . . . . . . $ 227 $ 211 $ 221 $ 36 $ 257Expected return on plan assets . . . . . . . . . . . . . . . . . . . . . . . . (202) (249) (246) (52) (298)Recognized net loss and other . . . . . . . . . . . . . . . . . . . . . . . . 264 268 115 8 123Net periodic benefit cost . . . . . . . . . . . . . . . . . . . . . . . . . . . . $ 289 $ 230 $ 90 $ (8) $ 82
Postretirement benefits:Interest cost . . . . . . . . . . . . . . . . . . . . . . . . . . . . . . . . . . . . . . $ 5 $ 5 $ 8 $ 3 $ 11Recognized net loss and other . . . . . . . . . . . . . . . . . . . . . . . . 23 (7) (1) (1) (2)Net periodic benefit cost . . . . . . . . . . . . . . . . . . . . . . . . . . . . $ 28 $ (2) $ 7 $ 2 $ 9
Weighted-average assumptions used to determine net cost were as follows:
2016 2015 2014
SHCDomestic
SHCDomestic
SHCDomestic
SearsCanada
Pension benefits:Discount Rate . . . . . . . . . . . . . . . . . . . . . . . . . . . . . . . . . . 4.50% 3.70% 4.60% 4.20%Return of plan assets . . . . . . . . . . . . . . . . . . . . . . . . . . . . 6.50% 7.00% 7.00% 6.50%Rate of compensation increases . . . . . . . . . . . . . . . . . . . . N/A N/A N/A 3.50%
Postretirement benefits:Discount Rate . . . . . . . . . . . . . . . . . . . . . . . . . . . . . . . . . . 4.00% 3.30% 4.00% 3.90%Return of plan assets . . . . . . . . . . . . . . . . . . . . . . . . . . . . N/A N/A N/A 1.00%Rate of compensation increases . . . . . . . . . . . . . . . . . . . . N/A N/A N/A 3.50%
For purposes of determining the periodic expense of our defined benefit plans, we use the fair value of planassets as the market-related value. A one-percentage-point change in the assumed discount rate would have thefollowing effects on the pension liability:
millions1 percentage-point
Increase1 percentage-point
Decrease
Effect on interest cost component . . . . . . . . . . . . . . . . . . . . . . . . . . . . . . . . $ 24 $ (31)Effect on pension benefit obligation . . . . . . . . . . . . . . . . . . . . . . . . . . . . . . $ (487) $ 583
Approximately $199 million of the unrecognized net losses in accumulated other comprehensive income areexpected to be amortized as a component of net periodic benefit cost during 2017.
Investment Strategy
The Investment Committee, made up of select members of senior management, has appointed a non-affiliatedthird party professional to advise the Committee with respect to the assets of Holdings' domestic pension plans. Theplans' overall investment objective is to provide a long-term return that, along with Company contributions, isexpected to meet future benefit payment requirements. A long-term horizon has been adopted in establishinginvestment policy such that the likelihood and duration of investment losses are carefully weighed against the long-
SEARS HOLDINGS CORPORATIONNotes to Consolidated Financial Statements—(Continued)
89

term potential for appreciation of assets. The plans' investment policy requires investments to be diversified acrossindividual securities, industries, market capitalization and valuation characteristics. In addition, various techniquesare utilized to monitor, measure and manage risk.
Domestic plan assets were invested in the following classes of securities:
Plan Assets atJanuary 28,
2017January 30,
2016
Equity securities . . . . . . . . . . . . . . . . . . . . . . . . . . . . . . . . . . . . . . . . . . . . . . . . . . . . . . . 35% 34%Fixed income and other debt securities . . . . . . . . . . . . . . . . . . . . . . . . . . . . . . . . . . . . . 63 63Other . . . . . . . . . . . . . . . . . . . . . . . . . . . . . . . . . . . . . . . . . . . . . . . . . . . . . . . . . . . . . . . . 2 3Total . . . . . . . . . . . . . . . . . . . . . . . . . . . . . . . . . . . . . . . . . . . . . . . . . . . . . . . . . . . . . . . . 100% 100%
The domestic plans' target allocation is determined by taking into consideration the amounts and timing ofprojected liabilities, our funding policies and expected returns on various asset classes. At January 28, 2017, theplans' target asset allocation was 35% equity and 65% fixed income. To develop the expected long-term rate ofreturn on assets assumption, we considered the historical returns and the future expectations for returns for eachasset class, as well as the target asset allocation of the pension portfolio.
Future Cash Flows of Benefit Plans
Information regarding expected future cash flows for the SHC Domestic benefit plan is as follows:
millionsSHC
Domestic
Pension benefits:Employer contributions:
2017 (expected). . . . . . . . . . . . . . . . . . . . . . . . . . . . . . . . . . . . . . . . . . . . . . . . . . . . . . . . . . . . . . $ 312Expected benefit payments:
2017 . . . . . . . . . . . . . . . . . . . . . . . . . . . . . . . . . . . . . . . . . . . . . . . . . . . . . . . . . . . . . . . . . . . . . . . . . . $ 4002018 . . . . . . . . . . . . . . . . . . . . . . . . . . . . . . . . . . . . . . . . . . . . . . . . . . . . . . . . . . . . . . . . . . . . . . . . . . 3812019 . . . . . . . . . . . . . . . . . . . . . . . . . . . . . . . . . . . . . . . . . . . . . . . . . . . . . . . . . . . . . . . . . . . . . . . . . . 3822020 . . . . . . . . . . . . . . . . . . . . . . . . . . . . . . . . . . . . . . . . . . . . . . . . . . . . . . . . . . . . . . . . . . . . . . . . . . 3982021 . . . . . . . . . . . . . . . . . . . . . . . . . . . . . . . . . . . . . . . . . . . . . . . . . . . . . . . . . . . . . . . . . . . . . . . . . . 3852022-2026. . . . . . . . . . . . . . . . . . . . . . . . . . . . . . . . . . . . . . . . . . . . . . . . . . . . . . . . . . . . . . . . . . . . . . 1,750
Postretirement benefits:Employer contributions:
2017 (expected). . . . . . . . . . . . . . . . . . . . . . . . . . . . . . . . . . . . . . . . . . . . . . . . . . . . . . . . . . . . . . $ 18Expected employer contribution for benefit payments:
2017 . . . . . . . . . . . . . . . . . . . . . . . . . . . . . . . . . . . . . . . . . . . . . . . . . . . . . . . . . . . . . . . . . . . . . . . . . . $ 182018 . . . . . . . . . . . . . . . . . . . . . . . . . . . . . . . . . . . . . . . . . . . . . . . . . . . . . . . . . . . . . . . . . . . . . . . . . . 182019 . . . . . . . . . . . . . . . . . . . . . . . . . . . . . . . . . . . . . . . . . . . . . . . . . . . . . . . . . . . . . . . . . . . . . . . . . . 172020 . . . . . . . . . . . . . . . . . . . . . . . . . . . . . . . . . . . . . . . . . . . . . . . . . . . . . . . . . . . . . . . . . . . . . . . . . . 162021 . . . . . . . . . . . . . . . . . . . . . . . . . . . . . . . . . . . . . . . . . . . . . . . . . . . . . . . . . . . . . . . . . . . . . . . . . . 152022-2026. . . . . . . . . . . . . . . . . . . . . . . . . . . . . . . . . . . . . . . . . . . . . . . . . . . . . . . . . . . . . . . . . . . . . . 63
SEARS HOLDINGS CORPORATIONNotes to Consolidated Financial Statements—(Continued)
90

Domestic Pension Plans Funding
Contributions to our pension plans remain a significant use of our cash on an annual basis. While theCompany's pension plan is frozen, and thus associates do not currently earn pension benefits, the Company has alegacy pension obligation for past service performed by Kmart and Sears associates. During 2016, we contributed$314 million to our domestic pension plans. We estimate that the domestic pension contribution will be $312 millionin 2017 and approximately $297 million in 2018. As discussed in Note 1, the Company agreed to grant the PBGC alien on, and subsequently contribute to the Company's pension plans, the value of the $250 million cash paymentpayable to the Company on the third anniversary of the Craftsman closing with the value of such payment beingfully credited against the Company's minimum pension funding obligations in 2017, 2018 and 2019. The Companyalso agreed to grant a lien to the PBGC on the 15-year income stream relating to new Stanley Black & Decker salesof Craftsman products, and agreed to contribute the payments from Stanley Black & Decker under such incomestream to the Company's pension plans, with such payments to be credited against the Company's minimum pensionfunding obligations starting no later than five years from the closing date. The Company also agreed to grant thePBGC a lien on $100 million of real estate assets to secure the Company's minimum pension obligations through theend of 2019. The ultimate amount of pension contributions could be affected by changes in applicable regulations,as well as financial market and investment performance.
Fair Value of Pension Plan Assets
The following table presents our plan assets using the fair value hierarchy at January 28, 2017 and January 30,2016:
Investment Assets at Fair Value atSHC Domestic January 28, 2017
millions Total Level 1 Level 2 Level 3
Equity securities:U.S. companies . . . . . . . . . . . . . . . . . . . . . . . . . . . . . . . . . . . . . . . . . . . . . . $ 980 $ 978 $ — $ 2International companies . . . . . . . . . . . . . . . . . . . . . . . . . . . . . . . . . . . . . . . . 224 224 — —U.S. registered investment companies . . . . . . . . . . . . . . . . . . . . . . . . . . . . . 3 3 — —
Fixed income securities:Corporate bonds and notes. . . . . . . . . . . . . . . . . . . . . . . . . . . . . . . . . . . . . . 1,994 — 1,994 —Sears Holdings Corporation 2016 Term Loan . . . . . . . . . . . . . . . . . . . . . . . 100 — 100 —Mortgage-backed and asset-backed . . . . . . . . . . . . . . . . . . . . . . . . . . . . . . . 3 — 1 2Other . . . . . . . . . . . . . . . . . . . . . . . . . . . . . . . . . . . . . . . . . . . . . . . . . . . . . . 1 — 1 —
Ventures and partnerships. . . . . . . . . . . . . . . . . . . . . . . . . . . . . . . . . . . . . . . . 1 — — 1Total investment assets at fair value. . . . . . . . . . . . . . . . . . . . . . . . . . . . . . . . $ 3,306 $1,205 $ 2,096 $ 5Cash . . . . . . . . . . . . . . . . . . . . . . . . . . . . . . . . . . . . . . . . . . . . . . . . . . . . . . . . 8Accounts receivable . . . . . . . . . . . . . . . . . . . . . . . . . . . . . . . . . . . . . . . . . . . . 65Accounts payable . . . . . . . . . . . . . . . . . . . . . . . . . . . . . . . . . . . . . . . . . . . . . . (69)Investments measured at NAV: . . . . . . . . . . . . . . . . . . . . . . . . . . . . . . . . . . .
Cash equivalents and short-term investments . . . . . . . . . . . . . . . . . . . . . . . 257Net assets available for plan benefits . . . . . . . . . . . . . . . . . . . . . . . . . . . . . . . $ 3,567
SEARS HOLDINGS CORPORATIONNotes to Consolidated Financial Statements—(Continued)
91

Investment Assets at Fair Value atSHC Domestic January 30, 2016
millions Total Level 1 Level 2 Level 3
Equity securities:U.S. companies . . . . . . . . . . . . . . . . . . . . . . . . . . . . . . . . . . . . . . . . . . . . . $ 861 $ 861 $ — $ —International companies. . . . . . . . . . . . . . . . . . . . . . . . . . . . . . . . . . . . . . . 140 140 — —U.S. registered investment companies. . . . . . . . . . . . . . . . . . . . . . . . . . . . 5 5 — —
Fixed income securities:Corporate bonds and notes . . . . . . . . . . . . . . . . . . . . . . . . . . . . . . . . . . . . 1,848 — 1,848 —Mortgage-backed and asset-backed. . . . . . . . . . . . . . . . . . . . . . . . . . . . . . 4 — 1 3Other . . . . . . . . . . . . . . . . . . . . . . . . . . . . . . . . . . . . . . . . . . . . . . . . . . . . . 1 — 1 —
Ventures and partnerships . . . . . . . . . . . . . . . . . . . . . . . . . . . . . . . . . . . . . . 4 — — 4Total investment assets at fair value . . . . . . . . . . . . . . . . . . . . . . . . . . . . . . $ 2,863 $ 1,006 $ 1,850 $ 7Cash . . . . . . . . . . . . . . . . . . . . . . . . . . . . . . . . . . . . . . . . . . . . . . . . . . . . . . . 1Accounts receivable . . . . . . . . . . . . . . . . . . . . . . . . . . . . . . . . . . . . . . . . . . . 63Accounts payable . . . . . . . . . . . . . . . . . . . . . . . . . . . . . . . . . . . . . . . . . . . . . (45)Investments measured at NAV: . . . . . . . . . . . . . . . . . . . . . . . . . . . . . . . . . .
Cash equivalents and short-term investments . . . . . . . . . . . . . . . . . . . . . . 307Net assets available for plan benefits. . . . . . . . . . . . . . . . . . . . . . . . . . . . . . $ 3,189
Equity securities, which include common and preferred stocks, are actively traded and valued at the closingprice reported in the active market in which the security is traded and are assigned to Level 1.
Fixed income securities are assigned to Level 2 as they are primarily valued by institutional bid evaluation,which determines the estimated price a dealer would pay for a security and which is developed using proprietarymodels established by the pricing vendors for this purpose.
Certain mortgage-backed and other asset-backed debt securities are assigned to Level 3 based on the relativelylow position in the preferred hierarchy of the pricing source. Valuation of the Plan's non-public limited partnershipsrequires significant judgment by the general partners due to the absence of quoted market value, inherent lack ofliquidity, and the long-term nature of the assets, and may result in fair value measurements that are not indicative ofultimate realizable value. Our Level 3 assets, including activity related to our Level 3 assets, are immaterial.
Common collective trusts are portfolios of underlying investments held by investment managers and arevalued at the unit value reported by the investment managers as of the end of each period presented. Collectiveshort-term investment funds are stated at net asset value (NAV) as determined by the investment managers and havenot been classified in the fair value hierarchy. Investment managers value the underlying investments of the funds atamortized cost, which approximates fair value.
SEARS HOLDINGS CORPORATIONNotes to Consolidated Financial Statements—(Continued)
92

NOTE 8—EARNINGS PER SHARE
The following table sets forth the components used to calculate basic and diluted loss per share attributable toHoldings' shareholders. Warrants, restricted stock awards and restricted stock units, totaling 2 thousand shares in2016 and 5 million shares in each of 2015 and 2014 were not included in the computation of diluted loss per shareattributable to Holdings' shareholders because the effect of their inclusion would have been anti-dilutive.
millions, except earnings per share 2016 2015 2014
Basic weighted average shares. . . . . . . . . . . . . . . . . . . . . . . . . . . . . . . . . . . . . . . 106.9 106.6 106.3Dilutive effect of restricted stock awards, restricted stock units and warrants . . — — —Diluted weighted average shares . . . . . . . . . . . . . . . . . . . . . . . . . . . . . . . . . . . . . 106.9 106.6 106.3
Net loss attributable to Holdings' shareholders . . . . . . . . . . . . . . . . . . . . . . . . . . $ (2,221) $ (1,129) $ (1,682)
Loss per share attributable to Holdings' shareholders:Basic . . . . . . . . . . . . . . . . . . . . . . . . . . . . . . . . . . . . . . . . . . . . . . . . . . . . . . . $ (20.78) $ (10.59) $ (15.82)Diluted . . . . . . . . . . . . . . . . . . . . . . . . . . . . . . . . . . . . . . . . . . . . . . . . . . . . . $ (20.78) $ (10.59) $ (15.82)
SEARS HOLDINGS CORPORATIONNotes to Consolidated Financial Statements—(Continued)
93
NOTE 9—EQUITY
Stock-based Compensation
We account for stock-based compensation using the fair value method in accordance with accountingstandards regarding share-based payment transactions. We do not currently have an employee stock option plan andat January 28, 2017, there are no outstanding options. Compensation expense related to stock-based compensationarrangements was immaterial during 2016, 2015 and 2014.
We granted restricted stock awards and restricted stock units to certain associates. These restricted stockawards and restricted stock units typically vest in zero to three years from the date of grant, provided the granteeremains employed by us at the vesting date. The fair value of these awards and units is equal to the market price ofour common stock on the date of grant. We do not currently have a broad-based program that provides for restrictedstock awards or restricted stock units on an annual basis. Changes in restricted stock awards and restricted stockunits for 2016, 2015 and 2014 were as follows:
2016 2015 2014
(Shares in thousands) Shares
Weighted-Average
Fair Valueon Dateof Grant Shares
Weighted-Average
Fair Valueon Dateof Grant Shares
Weighted-Average
Fair Valueon Dateof Grant
Beginning of year balance. . . . . . . . . . . . . . 60 $ 42.88 73 $ 45.82 205 $ 48.24Granted . . . . . . . . . . . . . . . . . . . . . . . . . . . . 384 16.87 198 31.26 168 38.35Vested . . . . . . . . . . . . . . . . . . . . . . . . . . . . . (293) 16.00 (200) 32.01 (248) 41.17Forfeited . . . . . . . . . . . . . . . . . . . . . . . . . . . — — (11) 51.39 (52) 53.44
End of year balance . . . . . . . . . . . . . . . 151 $ 28.89 60 $ 42.88 73 $ 45.82
millions 2016 2015 2014
Aggregate fair value of shares granted based on weighted average fair value at date ofgrant . . . . . . . . . . . . . . . . . . . . . . . . . . . . . . . . . . . . . . . . . . . . . . . . . . . . . . . . . . . . . . . . . . $ 6 $ 6 $ 6
Aggregate fair value of shares vesting during period . . . . . . . . . . . . . . . . . . . . . . . . . . . . . . 4 6 9Aggregate fair value of shares forfeited during period . . . . . . . . . . . . . . . . . . . . . . . . . . . . . — — 2

Approximately 76,000 shares of the 151,000 shares of unvested restricted stock and restricted stock unitsoutstanding at January 28, 2017 are scheduled to vest during 2017, subject to satisfaction of applicable vestingconditions.
Common Share Repurchase Program
From time to time, we repurchase shares of our common stock under a common share repurchase programauthorized by our Board of Directors. The common share repurchase program was initially announced in 2005 witha total authorization since inception of the program of $6.5 billion. During 2016, 2015 and 2014, we repurchased noshares of our common stock under our common share repurchase program. At January 28, 2017, we hadapproximately $504 million of remaining authorization under our common share repurchase program.
The share repurchase program has no stated expiration date and share repurchases may be implemented using avariety of methods, which may include open market purchases, privately negotiated transactions, block trades,accelerated share repurchase transactions, the purchase of call options, the sale of put options or otherwise, or by anycombination of such methods.
Accumulated Other Comprehensive Loss
The following table displays the components of accumulated other comprehensive loss:
millionsJanuary 28,
2017January 30,
2016January 31,
2015
Pension and postretirement adjustments (net of tax of $(225), $(296)and $(296), respectively) . . . . . . . . . . . . . . . . . . . . . . . . . . . . . . . . . . . . $ (1,549) $ (1,915) $ (2,028)
Currency translation adjustments (net of tax of $0 for all periodspresented) . . . . . . . . . . . . . . . . . . . . . . . . . . . . . . . . . . . . . . . . . . . . . . . . (3) (3) (2)
Accumulated other comprehensive loss . . . . . . . . . . . . . . . . . . . . . . . . . . . $ (1,552) $ (1,918) $ (2,030)
Pension and postretirement adjustments relate to the net actuarial loss on our pension and postretirement plansrecognized as a component of accumulated other comprehensive loss.
Income Tax Expense Allocated to Each Component of Other Comprehensive Income (Loss)
Income tax expense allocated to each component of other comprehensive income (loss) was as follows:
2016
millions
BeforeTax
AmountTax
Expense
Net ofTax
Amount
Other comprehensive incomePension and postretirement adjustments
Experience gain . . . . . . . . . . . . . . . . . . . . . . . . . . . . . . . . . . . . . . . . . . . . . . . . $ 181 $ (71) $ 110Less: recognized net loss and other included in net periodic benefit cost(1) . . 256 — 256
Pension and postretirement adjustments, net of tax . . . . . . . . . . . . . . . . . . . . . . . 437 (71) 366Dissolution of noncontrolling interest . . . . . . . . . . . . . . . . . . . . . . . . . . . . . . . . . (7) — (7)
Total other comprehensive income . . . . . . . . . . . . . . . . . . . . . . . . . . . . . . . . . . . . . . . $ 430 $ (71) $ 359
SEARS HOLDINGS CORPORATIONNotes to Consolidated Financial Statements—(Continued)
94

2015
millions
BeforeTax
AmountTax
Expense
Net ofTax
Amount
Other comprehensive incomePension and postretirement adjustments
Experience loss . . . . . . . . . . . . . . . . . . . . . . . . . . . . . . . . . . . . . . . . . . . . . . . . $ (148) $ — $ (148)Less: recognized net loss and other included in net periodic benefit cost(1) . . 261 — 261
Pension and postretirement adjustments, net of tax . . . . . . . . . . . . . . . . . . . . . . . 113 — 113Currency translation adjustments . . . . . . . . . . . . . . . . . . . . . . . . . . . . . . . . . . . . . (1) — (1)
Total other comprehensive income . . . . . . . . . . . . . . . . . . . . . . . . . . . . . . . . . . . . . . . $ 112 $ — $ 112
2014
millions
BeforeTax
AmountTax
Expense
Net ofTax
Amount
Other comprehensive lossPension and postretirement adjustments
Experience loss . . . . . . . . . . . . . . . . . . . . . . . . . . . . . . . . . . . . . . . . . . . . . . . . $ (1,163) $ — $(1,163)Less: recognized net loss and other included in net periodic benefit cost(1) . . 126 (3) 123
Pension and postretirement adjustments, net of tax . . . . . . . . . . . . . . . . . . . . . . . (1,037) (3) (1,040)Deferred loss on derivatives . . . . . . . . . . . . . . . . . . . . . . . . . . . . . . . . . . . . . . . . . (2) — (2)Currency translation adjustments . . . . . . . . . . . . . . . . . . . . . . . . . . . . . . . . . . . . . 4 (1) 3Sears Canada de-consolidation . . . . . . . . . . . . . . . . . . . . . . . . . . . . . . . . . . . . . . . (186) — (186)
Total other comprehensive loss . . . . . . . . . . . . . . . . . . . . . . . . . . . . . . . . . . . . . . . . . . $ (1,221) $ (4) $(1,225)(1) Included in the computation of net periodic benefit expense. See Note 7 to the Consolidated Financial Statements.
Issuance of Warrants to Purchase Common Stock
On November 21, 2014, the Company issued an aggregate of approximately 22 million warrants pursuant to theexercise of rights in the rights offering for $625 million in aggregate principal amount of 8% Senior UnsecuredNotes due 2019 and warrants to purchase shares of its common stock. The exercise price and the number of sharesof common stock issuable upon exercise of a warrant are both subject to adjustment in certain circumstances. As ofOctober 31, 2015, each warrant, when exercised, will entitle the holder thereof to purchase 1.11 shares of theCompany's common stock at an exercise price of $25.686 per share under the terms of the warrant agreement,adjusted from the previously disclosed one share of the Company's common stock at an exercise price of $28.41 pershare. The exercise price is payable in cash or by surrendering 8% senior unsecured notes due 2019 with a principalamount at least equal to the exercise price. The warrants may be exercised at any time after November 24, 2014.Unless earlier exercised, the warrants will expire on December 15, 2019.
We accounted for the warrants in accordance with accounting standards applicable to distinguishing liabilitiesfrom equity and debt with conversion and other options. Accordingly, the warrants have been classified as additionalpaid-in capital in the Consolidated Balance Sheets based on the relative fair value of the warrants and the related 8%Senior Unsecured Notes due 2019 at the time of issuance. We monitor changes in circumstances that could cause theclassification of the warrants to change. The fair value of the warrants and the related 8% Senior Unsecured Notesdue 2019 was estimated based on quoted market prices for the same issues using Level 1 measurements as definedin Note 5.
SEARS HOLDINGS CORPORATIONNotes to Consolidated Financial Statements—(Continued)
95

NOTE 10—INCOME TAXES
millions 2016 2015 2014
Loss before income taxes:U.S. . . . . . . . . . . . . . . . . . . . . . . . . . . . . . . . . . . . . . . . . . . . . . . . . . . . . . . . . $ (2,429) $ (1,420) $ (1,560)Foreign . . . . . . . . . . . . . . . . . . . . . . . . . . . . . . . . . . . . . . . . . . . . . . . . . . . . . . 34 35 (125)
Total . . . . . . . . . . . . . . . . . . . . . . . . . . . . . . . . . . . . . . . . . . . . . . . . . . . . $ (2,395) $ (1,385) $ (1,685)
Income tax expense (benefit):Current:
Federal . . . . . . . . . . . . . . . . . . . . . . . . . . . . . . . . . . . . . . . . . . . . . . . . . . $ 13 $ 11 $ 19State and local. . . . . . . . . . . . . . . . . . . . . . . . . . . . . . . . . . . . . . . . . . . . . 16 20 19Foreign . . . . . . . . . . . . . . . . . . . . . . . . . . . . . . . . . . . . . . . . . . . . . . . . . . 18 17 21
Total current. . . . . . . . . . . . . . . . . . . . . . . . . . . . . . . . . . . . . . . . . . . 47 48 59
Deferred:Federal . . . . . . . . . . . . . . . . . . . . . . . . . . . . . . . . . . . . . . . . . . . . . . . . . . (87) (239) 70State and local. . . . . . . . . . . . . . . . . . . . . . . . . . . . . . . . . . . . . . . . . . . . . (134) (66) (139)Foreign . . . . . . . . . . . . . . . . . . . . . . . . . . . . . . . . . . . . . . . . . . . . . . . . . . — — 135
Total deferred. . . . . . . . . . . . . . . . . . . . . . . . . . . . . . . . . . . . . . . . . . (221) (305) 66Total . . . . . . . . . . . . . . . . . . . . . . . . . . . . . . . . . . . . . . . . . . . . . . . . . . . . . . . . $ (174) $ (257) $ 125
2016 2015 2014
Effective tax rate reconciliation:Federal income tax rate (benefit rate) . . . . . . . . . . . . . . . . . . . . . . . . . . . . . . (35.0)% (35.0)% (35.0)%State and local tax (benefit) net of federal tax benefit . . . . . . . . . . . . . . . . . . (3.0) (1.8) (4.6)Federal and state valuation allowance . . . . . . . . . . . . . . . . . . . . . . . . . . . . . . 41.1 37.4 44.1Long-lived land and intangibles. . . . . . . . . . . . . . . . . . . . . . . . . . . . . . . . . . . (0.2) (16.9) (0.4)Impairment of indefinite-lived trade names. . . . . . . . . . . . . . . . . . . . . . . . . . (6.0) (4.9) —Loss disallowance . . . . . . . . . . . . . . . . . . . . . . . . . . . . . . . . . . . . . . . . . . . . . — 3.5 —Tax credits . . . . . . . . . . . . . . . . . . . . . . . . . . . . . . . . . . . . . . . . . . . . . . . . . . . (0.3) (0.7) (0.9)Resolution of income tax matters . . . . . . . . . . . . . . . . . . . . . . . . . . . . . . . . . — (0.3) (2.7)Adjust foreign statutory rates. . . . . . . . . . . . . . . . . . . . . . . . . . . . . . . . . . . . . 0.1 (0.3) 0.5Sears Canada valuation allowance. . . . . . . . . . . . . . . . . . . . . . . . . . . . . . . . . — — 9.0Sears Canada rights offering . . . . . . . . . . . . . . . . . . . . . . . . . . . . . . . . . . . . . — — 1.4Tax benefit resulting from additional paid-in capital income allocation . . . . — — (3.5)Tax benefit resulting from other comprehensive income allocation . . . . . . . (2.9) — —Canadian repatriation cost on Sears Canada dividend received . . . . . . . . . . — — (0.7)Other . . . . . . . . . . . . . . . . . . . . . . . . . . . . . . . . . . . . . . . . . . . . . . . . . . . . . . . (1.1) 0.4 0.2
(7.3)% (18.6)% 7.4 %
SEARS HOLDINGS CORPORATIONNotes to Consolidated Financial Statements—(Continued)
96

millionsJanuary 28,
2017January 30,
2016
Deferred tax assets and liabilities:Deferred tax assets:
Federal benefit for state and foreign taxes . . . . . . . . . . . . . . . . . . . . . . . . . . . . . . . . . . $ 148 $ 147Accruals and other liabilities . . . . . . . . . . . . . . . . . . . . . . . . . . . . . . . . . . . . . . . . . . . . 135 180Capital leases . . . . . . . . . . . . . . . . . . . . . . . . . . . . . . . . . . . . . . . . . . . . . . . . . . . . . . . . 25 54Net operating loss carryforwards . . . . . . . . . . . . . . . . . . . . . . . . . . . . . . . . . . . . . . . . . 2,255 1,583Postretirement benefit plans . . . . . . . . . . . . . . . . . . . . . . . . . . . . . . . . . . . . . . . . . . . . . 89 86Pension . . . . . . . . . . . . . . . . . . . . . . . . . . . . . . . . . . . . . . . . . . . . . . . . . . . . . . . . . . . . . 1,155 1,241Property and equipment . . . . . . . . . . . . . . . . . . . . . . . . . . . . . . . . . . . . . . . . . . . . . . . . 231 226Deferred income. . . . . . . . . . . . . . . . . . . . . . . . . . . . . . . . . . . . . . . . . . . . . . . . . . . . . . 479 514Credit carryforwards . . . . . . . . . . . . . . . . . . . . . . . . . . . . . . . . . . . . . . . . . . . . . . . . . . 875 832Other. . . . . . . . . . . . . . . . . . . . . . . . . . . . . . . . . . . . . . . . . . . . . . . . . . . . . . . . . . . . . . . 193 164
Total deferred tax assets . . . . . . . . . . . . . . . . . . . . . . . . . . . . . . . . . . . . . . . . . . . . . . . . . . . 5,585 5,027Valuation allowance. . . . . . . . . . . . . . . . . . . . . . . . . . . . . . . . . . . . . . . . . . . . . . . . . . . . . . . (5,519) (4,757)
Net deferred tax assets . . . . . . . . . . . . . . . . . . . . . . . . . . . . . . . . . . . . . . . . . . . . . . . . . 66 270
Deferred tax liabilities:Trade names/Intangibles. . . . . . . . . . . . . . . . . . . . . . . . . . . . . . . . . . . . . . . . . . . . . . . . 573 722Inventory . . . . . . . . . . . . . . . . . . . . . . . . . . . . . . . . . . . . . . . . . . . . . . . . . . . . . . . . . . . 193 338Other. . . . . . . . . . . . . . . . . . . . . . . . . . . . . . . . . . . . . . . . . . . . . . . . . . . . . . . . . . . . . . . 43 103
Total deferred tax liabilities. . . . . . . . . . . . . . . . . . . . . . . . . . . . . . . . . . . . . . . . . . . . . . . . . 809 1,163Net deferred tax liability . . . . . . . . . . . . . . . . . . . . . . . . . . . . . . . . . . . . . . . . . . . . . . . . . . . $ (743) $ (893)
Income tax expense or benefit from continuing operations is generally determined without regard to othercategories of earnings, such as discontinued operations and other comprehensive income ("OCI"). An exception isprovided in the authoritative accounting guidance when there is income from categories other than continuingoperations and a loss from continuing operations in the current year. In this case, the tax benefit allocated tocontinuing operations is the amount by which the loss from continuing operations reduces the tax expense recordedwith respect to the other categories of earnings, even when a valuation allowance has been established against thedeferred tax assets. In instances where a valuation allowance is established against current year losses, income fromother sources, including gain from pension and other postretirement benefits recorded as a component of OCI andcreation of a deferred tax liability through additional paid in capital, is considered when determining whethersufficient future taxable income exists to realize the deferred tax assets. As a result, for the year ended January 28,2017, the Company recorded a tax expense of $71 million in OCI related to the net gain on pension and otherpostretirement benefits, and recorded a corresponding tax benefit of $71 million in continuing operations. For theyear ended January 31, 2015, the Company recorded a charge of $59 million through additional paid in capitalrelating to the book to tax difference for the original issue discount ("OID") relating to the Senior Unsecured Notes,and recorded a valuation allowance reversal of $59 million in continuing operations.
We account for income taxes in accordance with accounting standards for income taxes, which requires thatdeferred tax assets and liabilities be recognized using enacted tax rates for the effect of temporary differencesbetween the financial reporting and tax bases of recorded assets and liabilities. Accounting standards also requirethat deferred tax assets be reduced by a valuation allowance if it is more likely than not that some portion of or all ofthe deferred tax asset will not be realized.
Management assesses the available positive and negative evidence to estimate if sufficient future taxableincome will be generated to use the existing deferred tax assets. A significant piece of objective negative evidenceevaluated was the cumulative loss incurred over the three-year periods ended January 28, 2017, January 30, 2016,
SEARS HOLDINGS CORPORATIONNotes to Consolidated Financial Statements—(Continued)
97

and January 31, 2015. Such objective evidence limits the ability to consider other subjective evidence such as ourprojections for future income.
On the basis of this analysis and the significant negative objective evidence, for the year ended January 28,2012, a valuation allowance of $2.1 billion was added to record only the portion of the deferred tax asset that morelikely than not will be realized. Of the total valuation allowance recorded, $317 million was recorded through othercomprehensive income. For the year ended January 31, 2015, the valuation allowance increased by $1.1 billion ofwhich $454 million was recorded through other comprehensive income. For the year ended January 30, 2016, thevaluation allowance increased by $279 million of which $63 million was recorded through other comprehensiveincome and paid in capital. For the year ended January 28, 2017, the valuation allowance increased by $762 millionof which a decrease of $3 million was recorded through other comprehensive income.
During the quarterly assessment of deferred tax assets for the year ended January 31, 2015, managementdetermined that it was no longer probable that sufficient future taxable income would be available to allow thedeferred tax assets of Sears Canada to be realized. A significant piece of negative evidence evaluated was that therecent and anticipated profitability were lower than previously projected. The Company also considered the impacton the timing of the implementation of strategic initiatives at Sears Canada to improve profitability due to theirrecent senior management changes and realization that certain strategies would not achieve previously expectedtargets. In assessing the realizability of Sears Canada's deferred tax assets, management considered the four sourcesof taxable income included in the accounting standards applicable for income taxes. Of these four sources of taxableincome, Sears Canada was only able to avail itself of future reversals of existing taxable differences and taxableincome in prior carryback years to realize a tax benefit of an existing deductible temporary difference. Therefore, avaluation allowance of $152 million was added to record only the portion of the deferred tax asset that more likelythan not will be realized. We recognized the $152 million valuation allowance charge during the third quarter of2014 in continuing operations. This $152 million valuation allowance was de-recognized in the third quarter of 2014as part of the Sears Canada de-consolidation.
At January 28, 2017 and January 30, 2016, we had a valuation allowance of $5.5 billion and $4.8 billion,respectively, to record only the portion of the deferred tax asset that more likely than not will be realized. Theamount of the deferred tax asset considered realizable, however, could be adjusted in the future if estimates of futuretaxable income during the carryforward period are reduced or increased, or if the objective negative evidence in theform of cumulative losses is no longer present and additional weight may be given to subjective evidence such asour projections for growth. We will continue to evaluate our valuation allowance in future years for any change incircumstances that causes a change in judgment about the realizability of the deferred tax asset.
At the end of 2016 and 2015, respectively, we had a federal and state net operating loss ("NOL") deferred taxasset of $2.3 billion and $1.6 billion, which will expire predominately between 2019 and 2036. We have creditcarryforwards of $875 million, which will expire between 2017 and 2036.
In July, 2016, the Company sold shares of an investment for $106 million. The sale resulted in a U.S. taxablegain of $105 million, but no current income tax is payable due to the utilization of NOL attributes of $37 millionwith a valuation allowance release of the same amount.
On July 7, 2015, Holdings completed the Seritage transaction. As part of the transaction, Holdings sold 235properties to Seritage along with Holdings' 50% interests in the JVs, which hold an additional 31 properties (SeeNote 11 for additional information and defined terms).
In connection with the Seritage transaction and the JV transactions, the Company realized a tax benefit of$229 million on the deferred taxes related to the indefinite-life assets associated with the property sold. In addition,the Company incurred a taxable gain of approximately $2.2 billion, taking into account any related party lossdisallowance, on these transactions. There was no federal income tax payable resulting from the taxable gain due tothe utilization of NOL tax attributes of approximately $856 million with a valuation allowance release of the sameamount. However, there was a minor amount of state and city income tax payable of $4 million after the utilizationof state and city tax attributes. As a result of all the effects from the Seritage transaction and the JV transactions in2015, the impact to the net valuation allowance was a release of approximately $500 million.
On April 4, 2014, Holdings and Lands' End entered into a tax sharing agreement in connection with the spin-off. Pursuant to this agreement, Holdings is responsible for all pre-separation U.S. federal, state and local income
SEARS HOLDINGS CORPORATIONNotes to Consolidated Financial Statements—(Continued)
98

taxes attributable to the Lands’ End business, and Lands’ End is responsible for all other income taxes attributable toits business, including all foreign taxes.
In connection with the Sears Canada Rights Offering in 2014, the Company incurred a taxable gain ofapproximately $107 million on the subscription rights exercised and common shares sold during the fiscal year.There was no income tax payable balance resulting from the taxable gain due to the utilization of NOL attributes ofapproximately $38 million and a valuation allowance release of the same amount. In addition, a foreign tax creditcarryover of $15 million was generated and the valuation allowance increased by the same amount.
Accounting for Uncertainties in Income Taxes
We are present in a large number of taxable jurisdictions, and at any point in time, can have audits underway atvarious stages of completion in any of these jurisdictions. We evaluate our tax positions and establish liabilities foruncertain tax positions that may be challenged by federal, foreign and/or local authorities and may not be fullysustained, despite our belief that the underlying tax positions are fully supportable. Unrecognized tax benefits arereviewed on an ongoing basis and are adjusted in light of changing facts and circumstances, including progress oftax audits, developments in case law, and closing of statute of limitations. Such adjustments are reflected in the taxprovision as appropriate. While we do not expect material changes, it is possible that the amount of unrecognizedbenefit with respect to our uncertain tax positions will significantly increase or decrease within the next 12 monthsrelated to the audits described above. At this time, our estimated range of impact on the balance of unrecognized taxbenefits for 2017 is a change of $2 million to $15 million, which would impact the effective tax rate by $1 million to$10 million. A reconciliation of the beginning and ending amount of gross unrecognized tax benefits ("UTB") is asfollows:
Federal, State and Foreign Tax
millionsJanuary 28,
2017January 30,
2016January 31,
2015
Gross UTB Balance at Beginning of Period . . . . . . . . . . . . . . . . . . . . . . . . . $ 137 $ 131 $ 150Tax positions related to the current period:
Gross increases . . . . . . . . . . . . . . . . . . . . . . . . . . . . . . . . . . . . . . . . . . . . 12 14 15Gross decreases. . . . . . . . . . . . . . . . . . . . . . . . . . . . . . . . . . . . . . . . . . . . — — —
Tax positions related to prior periods:Gross increases . . . . . . . . . . . . . . . . . . . . . . . . . . . . . . . . . . . . . . . . . . . . — — —Gross decreases. . . . . . . . . . . . . . . . . . . . . . . . . . . . . . . . . . . . . . . . . . . . — — (27)
Settlements. . . . . . . . . . . . . . . . . . . . . . . . . . . . . . . . . . . . . . . . . . . . . . . . . . . — — (5)Lapse of statute of limitations . . . . . . . . . . . . . . . . . . . . . . . . . . . . . . . . . . . . (7) (8) (4)Exchange rate fluctuations. . . . . . . . . . . . . . . . . . . . . . . . . . . . . . . . . . . . . . . — — 2Gross UTB Balance at End of Period . . . . . . . . . . . . . . . . . . . . . . . . . . . . . . $ 142 $ 137 $ 131
At the end of 2016, we had gross unrecognized tax benefits of $142 million. Of this amount, $92 millionwould, if recognized, impact our effective tax rate, with the remaining amount being comprised of unrecognized taxbenefits related to indirect tax benefits. During 2016, the gross unrecognized tax benefits increased by $12 milliondue to current year accruals for existing tax positions. During 2015, the gross unrecognized tax benefits increased by$14 million due to current year accruals for existing tax positions. We expect that our unrecognized tax benefitscould decrease up to $6 million over the next 12 months for tax audit settlements and the expiration of the statute oflimitations for certain jurisdictions.
We classify interest expense and penalties related to unrecognized tax benefits and interest income on taxoverpayments as components of income tax expense. At January 28, 2017 and January 30, 2016, the total amount ofinterest and penalties recognized within the related tax liability in our Consolidated Balance Sheet was $61 million($40 million net of federal benefit) and $56 million ($36 million net of federal benefit), respectively. The totalamount of net interest expense recognized in our Consolidated Statements of Operations for 2016, 2015 and 2014was $3 million, $4 million and $4 million, respectively.
SEARS HOLDINGS CORPORATIONNotes to Consolidated Financial Statements—(Continued)
99

We file income tax returns in both the United States and various foreign jurisdictions. The U.S. InternalRevenue Service ("IRS") has completed its examination of all federal tax returns of Holdings through the 2009return, and all matters arising from such examinations have been resolved. In addition, Holdings and Sears are underexamination by various state, local and foreign income tax jurisdictions for the years 2003 through 2014, and Kmartis under examination by such jurisdictions for the years 2006 through 2014.
SEARS HOLDINGS CORPORATIONNotes to Consolidated Financial Statements—(Continued)
100
NOTE 11—REAL ESTATE TRANSACTIONS
Gain on Sales of Assets
We recognized $247 million, $743 million and $207 million in gains on sales of assets during 2016, 2015 and2014, respectively. These gains were primarily a result of several large real estate transactions.
On April 1, 2015, April 13, 2015, and April 30, 2015, Holdings and General Growth Properties, Inc. ("GGP"),Simon Property Group, Inc. ("Simon") and The Macerich Company ("Macerich"), respectively, announced that theyentered into three distinct real estate joint ventures (collectively, the "JVs"). Holdings contributed 31 properties tothe JVs where Holdings currently operates stores (the "JV properties"), in exchange for a 50% interest in the JVs and$429 million in cash ($426 million, net of closing costs) (the "JV transactions"). The JV transactions valued the JVproperties at $858 million in the aggregate.
On July 7, 2015, Holdings completed its rights offering and sale-leaseback transaction (the "Seritagetransaction") with Seritage Growth Properties ("Seritage"), a recently formed, independent publicly traded real estateinvestment trust ("REIT"). As part of the Seritage transaction, Holdings sold 235 properties to Seritage (the "REITproperties") along with Holdings' 50% interest in the JVs. Holdings received aggregate gross proceeds from theSeritage transaction of $2.7 billion ($2.6 billion, net of closing costs). The Seritage transaction was partiallyfinanced through the sale of common shares and limited partnership units, totaling $1.6 billion, including $745million received from ESL and its affiliates and $297 million received from Fairholme and its affiliates as furtherdescribed in Note 15. The Seritage transaction valued the REIT properties at $2.3 billion in the aggregate.
In connection with the Seritage transaction and JV transactions, Holdings has entered into agreements withSeritage and the JVs under which Holdings leases 255 of the properties (the "Master Leases"), with the remainingproperties being leased by Seritage to third parties. Holdings has closed six stores pursuant to recapture notices fromSeritage and 17 stores pursuant to lease terminations.
Holdings recorded rent expense of $96 million and $68 million in 2016 and 2015, respectively, in cost of sales,buying and occupancy in the Consolidated Statements of Operations. Rent expense consisted of straight-line rentexpense offset by amortization of a deferred gain on sale-leaseback, as shown in the table below.
2016 2015
millions KmartSears
DomesticSears
Holdings KmartSears
DomesticSears
Holdings
Straight-line rent expense . . . . . . . . . . . . . . . . . $ 32 $ 152 $ 184 $ 20 $ 100 $ 120Amortization of deferred gain on sale-leaseback . . . . . . . . . . . . . . . . . . . . . . . . . . . . . . (17) (71) (88) (11) (41) (52)Rent expense . . . . . . . . . . . . . . . . . . . . . . . . . . . $ 15 $ 81 $ 96 $ 9 $ 59 $ 68
We accounted for the Seritage transaction and JV transactions in accordance with accounting standardsapplicable to real estate sales and sale-leaseback transactions. We determined that the Seritage transaction qualifiesfor sales recognition and sale-leaseback accounting. Because of our initial ownership interest in the JVs andcontinuing involvement in the properties, we determined that the JV transactions, which occurred in the first quarterof 2015, did not initially qualify for sale-leaseback accounting and, therefore, accounted for the JV transactions asfinancing transactions and, accordingly, recorded a sale-leaseback financing obligation of $426 million andcontinued to report the real property assets on our Condensed Consolidated Balance Sheets at May 2, 2015. Uponthe sale of our 50% interest in the JVs to Seritage, the continuing involvement through an ownership interest in thebuyer-lessor no longer existed, and Holdings determined that the JV transactions then qualified for sales recognitionand sale-leaseback accounting, with the exception of four properties for which we still have continuing involvement

as a result of an obligation to redevelop the stores for a third-party tenant and pay rent on behalf of the third-partytenant until it commences rent payments to the JVs.
With the exception of the four properties that have continuing involvement, in accordance with accountingstandards related to sale-leaseback transactions, Holdings recognized any loss on sale immediately, any gain on salein excess of the present value of minimum lease payments immediately, and any remaining gain was deferred andwill be recognized in proportion to the related rent expense over the lease term. Holdings received aggregate netproceeds of $3.1 billion for the Seritage transaction and JV transactions. The carrying amount of property andequipment, net and lease balances related to third-party leases that were assigned to Seritage and the JVs was $1.5billion at July 7, 2015, of which $1.3 billion was recorded in our Sears Domestic segment and $175 million in ourKmart segment. Accordingly, during the second quarter of 2015, Holdings recognized an immediate net gain of $508million within gain on sales of assets in the Consolidated Statements of Operations for 2015, comprised of a gain forthe amount of gain on sale in excess of the present value of minimum lease payments, offset by a loss for propertieswhere the fair value was less than the carrying value and the write-off of lease balances related to third-party leasesthat were assigned to Seritage and the JVs, as shown in the table below.
2015
millions KmartSears
DomesticSears
Holdings
Gain . . . . . . . . . . . . . . . . . . . . . . . . . . . . . . . . . . . . . . . . . . . . . . . . . . . . . . . . . . $ 154 $ 471 $ 625Loss . . . . . . . . . . . . . . . . . . . . . . . . . . . . . . . . . . . . . . . . . . . . . . . . . . . . . . . . . . (17) (100) (117)Immediate Net Gain. . . . . . . . . . . . . . . . . . . . . . . . . . . . . . . . . . . . . . . . . . . . . . $ 137 $ 371 $ 508
The remaining gain of $894 million was deferred and will be recognized in proportion to the related rentexpense, which is a component of cost of sales, buying and occupancy, in the Consolidated Statements ofOperations, over the lease term. At January 28, 2017 and January 30, 2016, respectively, $132 million and $89million of the deferred gain on sale-leaseback is classified as current within other current liabilities and $563 millionand $753 million is classified as long-term as deferred gain on sale-leaseback in the Consolidated Balance Sheets.
During 2016, Holdings recorded gains of $29 million related to the 100% recapture of four stores that closedpursuant to recapture notices from Seritage, of which $16 million related to the gain that had previously beendeferred as we no longer have continuing involvement in those properties, and $13 million related to leasetermination proceeds. In addition, the Master Leases provide Seritage and the JVs a recapture right with respect toapproximately 50% of the space within the stores at the REIT properties and JV properties (subject to certainexceptions), in addition to all of the automotive care centers, and all outparcels or outlots, as well as certain portionsof parking areas and common areas, except as set forth in the Master Leases, for no additional consideration. Asspace is recaptured pursuant to the recapture right, Holdings' obligation to pay rent is reduced proportionately.Accordingly, Holdings recognizes gains equal to the unamortized portion of the gain that had previously beendeferred which exceeds the present value of minimum lease payments, as reduced due to recapture activity. During2016, Holdings recorded gains as a result of recapture activity of $16 million that had previously been deferred. TheMaster Leases also provide Holdings certain rights to terminate the Master Leases with respect to REIT properties orJV properties that cease to be profitable for operation by Holdings. In order to terminate the Master Lease withrespect to a certain property, Holdings must make a payment to Seritage or the JV of an amount equal to one year ofrent (together with taxes and other expenses) with respect to such property. Holdings recorded gains related to storesthat closed pursuant to lease terminations of $27 million that had previously been deferred. Holdings also recordedexpenses of $21 million for termination payments to Seritage, of which $11 million is reported as an amount payableto Seritage at January 28, 2017.
Holdings accounted for the four properties that have continuing involvement as a financing transaction inaccordance with accounting standards related to sale-leaseback transactions. Accordingly, Holdings recorded a sale-leaseback financing obligation of $164 million, which is classified as sale-leaseback financing obligation on theConsolidated Balance Sheets at both January 28, 2017 and January 30, 2016. The decrease in the sale-leasebackfinancing obligation from $426 million at May 2, 2015 to $164 million at January 30, 2016 represents a noncashchange. We continued to report the real property assets of $62 million and $56 million at January 28, 2017 and
SEARS HOLDINGS CORPORATIONNotes to Consolidated Financial Statements—(Continued)
101

January 30, 2016, respectively, on our Consolidated Balance Sheets, which are included in our Sears Domesticsegment.
The obligation for future minimum lease payments at January 28, 2017 for the four properties that havecontinuing involvement is $69 million over the remaining lease term, and is $8 million for each of 2017, 2018, 2019,2020 and 2021, and $29 million thereafter. This obligation for future minimum lease payments includes $29 millionof rent on behalf of a third-party tenant over the remaining lease term. We will no longer have the obligation to payrent on behalf of the third-party tenant when it commences rent payments to the JVs, which we expect to occurwithin one year.
On January 27, 2017, Holdings and CBL and Associates Properties, Inc. ("CBL") completed a sale-leasebacktransaction pursuant to which Holdings sold five Sears Full-line stores and two Sears Auto Centers located at CBLmalls for net proceeds of $71 million (the "CBL transaction"). In connection with the CBL transaction, Holdingsentered into 10-year leaseback agreements. The agreements provide both CBL and Holdings the right to terminateeach lease, and provide Holdings the option to relocate its operations at each mall to a location of up to 15,000square feet. The agreement also contains an earn-out provision pursuant to which Holdings would receive amaximum amount of $14.5 million additional consideration if CBL redevelops any of the properties within aspecified time period and achieves more than a specified return on investment. We accounted for the CBLtransaction as a financing transaction in accordance with accounting standards applicable to sale-leasebacktransactions as a result of continuing involvement through the earn-out provision. Accordingly, Holdings recorded asale-leaseback financing obligation of $71 million, which is classified as sale-leaseback financing obligation on theConsolidated Balance Sheet at January 28, 2017. We continued to report real property assets of $34 million atJanuary 28, 2017 on our Consolidated Balance Sheet, which are included in our Sears Domestic segment. Theobligation for future minimum lease payments at January 28, 2017, is $44 million over the 10-year lease term, and is$5 million for each of 2017, 2018, 2019, 2020 and 2021, and $19 million thereafter.
In addition to the Seritage transaction and JV transactions, we recorded gains on the sales of assets for othersignificant items described as follows. During 2016, we recorded gains on the sales of assets of $15 millionrecognized on the sale of two Sears Full-line stores for which we received $27 million of cash proceeds, $12 millionrecognized on the sale of one distribution center for which we received $23 million of cash proceeds and $10 millionon the sale of one Kmart store for which we received $10 million of cash proceeds.
During 2015, we recorded gains on the sales of assets of $83 million recognized on the sale of one Sears Full-line store for which we received $102 million of cash proceeds, $90 million of which was received during the thirdquarter of 2014. As the leaseback ended and the remaining cash proceeds of $12 million were received during 2015,we recognized the gain that had previously been deferred. We also recorded gains on the sales of assets of $86million recognized on the sale of two Sears Full-line stores for which we received $96 million of cash proceeds, and$10 million recognized on the surrender and early termination of one Kmart store lease.
During 2014, we recorded gains on the sales of assets of $64 million recognized on the sale of three SearsFull-line stores for which we received $106 million of cash proceeds, $13 million recognized on the sale of adistribution facility in our Sears Domestic segment for which we received $16 million of cash proceeds and a gain of$10 million recognized on the sale of a Kmart store for which we received $10 million of cash proceeds.
In connection with the other transactions, we surrendered substantially all of our rights and obligations underour preexisting lease agreements and agreed to surrender each of the premises in periods ranging up to 23 monthsfrom the date of closing to facilitate an orderly wind down of operations, and, therefore, immediate gain recognitionis appropriate on these transactions.
SEARS HOLDINGS CORPORATIONNotes to Consolidated Financial Statements—(Continued)
102

NOTE 12—GOODWILL AND INTANGIBLE ASSETS
The following summarizes our intangible assets at January 28, 2017 and January 30, 2016, respectively, theamortization expenses recorded for the years then ended, as well as our estimated amortization expense for the nextfive years and thereafter.
January 28, 2017 January 30, 2016
millions
GrossCarryingAmount
AccumulatedAmortization
GrossCarryingAmount
AccumulatedAmortization
Amortizing intangible assets:Favorable lease rights. . . . . . . . . . . . . . . . . . . . . . . . . . . $ 143 $ 52 $ 155 $ 57Contractual arrangements and customer lists. . . . . . . . . — — 96 96
143 52 251 153Non-amortizing intangible assets:
Trade names . . . . . . . . . . . . . . . . . . . . . . . . . . . . . . . . . . 1,430 — 1,811 —Total . . . . . . . . . . . . . . . . . . . . . . . . . . . . . . . . . . . . . . . . . . . . $ 1,573 $ 52 $ 2,062 $ 153
Annual Amortization Expense
2016 . . . . . . . . . . . . . . . . . . . . . . . . . . . . . . . . . . . . . . . . . . . . . . . . . . . . . . . . . . . . . . . . . . . . . . . . . . . . . . . $ 52015 . . . . . . . . . . . . . . . . . . . . . . . . . . . . . . . . . . . . . . . . . . . . . . . . . . . . . . . . . . . . . . . . . . . . . . . . . . . . . . . 72014 . . . . . . . . . . . . . . . . . . . . . . . . . . . . . . . . . . . . . . . . . . . . . . . . . . . . . . . . . . . . . . . . . . . . . . . . . . . . . . . 18
Estimated Amortization
2017 . . . . . . . . . . . . . . . . . . . . . . . . . . . . . . . . . . . . . . . . . . . . . . . . . . . . . . . . . . . . . . . . . . . . . . . . . . . . . . . $ 42018 . . . . . . . . . . . . . . . . . . . . . . . . . . . . . . . . . . . . . . . . . . . . . . . . . . . . . . . . . . . . . . . . . . . . . . . . . . . . . . . 42019 . . . . . . . . . . . . . . . . . . . . . . . . . . . . . . . . . . . . . . . . . . . . . . . . . . . . . . . . . . . . . . . . . . . . . . . . . . . . . . . 42020 . . . . . . . . . . . . . . . . . . . . . . . . . . . . . . . . . . . . . . . . . . . . . . . . . . . . . . . . . . . . . . . . . . . . . . . . . . . . . . . 42021 . . . . . . . . . . . . . . . . . . . . . . . . . . . . . . . . . . . . . . . . . . . . . . . . . . . . . . . . . . . . . . . . . . . . . . . . . . . . . . . 3Thereafter . . . . . . . . . . . . . . . . . . . . . . . . . . . . . . . . . . . . . . . . . . . . . . . . . . . . . . . . . . . . . . . . . . . . . . . . . . 72
Goodwill is the excess of the purchase price over the fair value of the net assets acquired in businesscombinations accounted for under the purchase method. Goodwill is recorded at Sears Domestic and had a balanceof $269 million at both January 28, 2017 and January 30, 2016.
As described in Summary of Significant Accounting Policies in Note 1, goodwill and indefinite-livedintangible assets are not amortized but require testing for potential impairment, at a minimum on an annual basis, orwhen indications of potential impairment exist. As a result of our annual testing of indefinite-lived intangible assets,we recorded impairment related to the Sears trade name of $381 million and $180 million in 2016 and 2015,respectively, which reduced the carrying value to $431 million at January 28, 2017 and $812 million at January 30,2016. The impairment is recorded at Sears Domestic and included within impairment charges on our ConsolidatedStatements of Operations. We did not record any goodwill or indefinite-lived intangible asset impairment in 2014.
SEARS HOLDINGS CORPORATIONNotes to Consolidated Financial Statements—(Continued)
103
NOTE 13—STORE CLOSING CHARGES, SEVERANCE COSTS AND IMPAIRMENTS
Store Closings and SeveranceDuring 2016, 2015 and 2014, respectively, we closed 206, 38 and 173 stores in our Kmart segment and 37, 12
and 61 stores in our Sears Domestic segment that we previously announced would close. We made the decision toclose 271, 78 and 118 stores in our Kmart segment and 76, 14 and 47 stores in our Sears Domestic segment during2016, 2015 and 2014, respectively; and we also made the decision to close 6 domestic supply chain distribution

centers in our Kmart segment during 2014 and 1 domestic supply chain distribution center in our Sears Domesticsegment during both 2016 and 2014.
In accordance with accounting standards governing costs associated with exit or disposal activities, expensesrelated to future rent payments for which we no longer intend to receive any economic benefit are accrued for whenwe cease to use the leased space and have been reduced for any estimated sublease income.
We expect to record additional charges of approximately $44 million during 2017 related to stores anddistribution centers we had previously made the decision to close.
Store closing costs and severance recorded for 2016, 2015 and 2014 were as follows:
millions Markdowns(1)Severance
Costs(2)
LeaseTermination
Costs(2)Other
Charges(2)
Impairmentand
AcceleratedDepreciation(3)
TotalStore
ClosingCosts
Kmart . . . . . . . . . . . . . . . . . . . . . . . . . . . $ 187 $ 28 $ 71 $ 32 $ 13 $ 331Sears Domestic . . . . . . . . . . . . . . . . . . . 39 13 5 9 7 73Total 2016 costs . . . . . . . . . . . . . . . . . . . $ 226 $ 41 $ 76 $ 41 $ 20 $ 404
Kmart . . . . . . . . . . . . . . . . . . . . . . . . . . . $ 39 $ 16 $ 21 $ 10 $ 1 $ 87Sears Domestic . . . . . . . . . . . . . . . . . . . 5 21 (15) 1 2 14Total 2015 costs . . . . . . . . . . . . . . . . . . . $ 44 $ 37 $ 6 $ 11 $ 3 $ 101
Kmart . . . . . . . . . . . . . . . . . . . . . . . . . . . $ 54 $ 32 $ 42 $ 14 $ 23 $ 165Sears Domestic . . . . . . . . . . . . . . . . . . . 14 14 21 6 14 69Sears Canada . . . . . . . . . . . . . . . . . . . . . 1 10 5 — — 16Total 2014 costs . . . . . . . . . . . . . . . . . . . $ 69 $ 56 $ 68 $ 20 $ 37 $ 250 _____________
(1) Recorded within cost of sales, buying and occupancy in the Consolidated Statements of Operations.(2) Recorded within selling and administrative in the Consolidated Statements of Operations. Lease termination
costs are net of estimated sublease income, and include the reversal of closed store reserves for which thelease agreement has been terminated and the reversal of deferred rent balances related to closed stores.
(3) 2016 and 2015 costs are recorded within depreciation and amortization on the Consolidated Statements ofOperations. 2014 costs include $29 million recorded within impairment charges and $8 million recordedwithin depreciation and amortization on the Consolidated Statements of Operations.
Store closing cost accruals of $216 million, $180 million and $207 million at January 28, 2017, January 30,
2016 and January 31, 2015, respectively, were as shown in the table below. Store closing accruals included $122million, $81 million and $99 million within other current liabilities and $94 million, $99 million and $108 millionwithin other long-term liabilities in the Consolidated Balance Sheets at January 28, 2017, January 30, 2016 andJanuary 31, 2015, respectively.
millionsSeverance
Costs
LeaseTermination
CostsOther
Charges Total
Balance at January 31, 2015. . . . . . . . . . . . . . . $ 43 $ 156 $ 8 $ 207Store closing costs . . . . . . . . . . . . . . . . . . . . . . 37 8 11 56Payments/utilizations/other . . . . . . . . . . . . . . . (22) (50) (11) (83)Balance at January 30, 2016. . . . . . . . . . . . . . . 58 114 8 180Store closing costs . . . . . . . . . . . . . . . . . . . . . . 41 85 41 167Payments/utilizations/other . . . . . . . . . . . . . . . (45) (55) (31) (131)Balance at January 28, 2017. . . . . . . . . . . . . . . $ 54 $ 144 $ 18 $ 216
SEARS HOLDINGS CORPORATIONNotes to Consolidated Financial Statements—(Continued)
104

Impairment of Long-Lived AssetsAs described in the Summary of Significant Accounting Policies in Note 1, we performed impairment tests of
certain of our long-lived assets during 2016, 2015 and 2014 (principally the value of land, buildings and other fixedassets associated with our stores). As a result of this impairment testing, the Company recorded impairment chargesas shown in the table below.
millions 2016 2015 2014
Kmart . . . . . . . . . . . . . . . . . . . . . . . . . . . . . . . . . . . $ 22 $ 14 $ 10Sears Domestic. . . . . . . . . . . . . . . . . . . . . . . . . . . . 24 80 9Sears Canada . . . . . . . . . . . . . . . . . . . . . . . . . . . . . — — 15Sears Holdings . . . . . . . . . . . . . . . . . . . . . . . . . . . . $ 46 $ 94 $ 34
SEARS HOLDINGS CORPORATIONNotes to Consolidated Financial Statements—(Continued)
105
NOTE 14—LEASES
We lease certain stores, office facilities, warehouses, computers and transportation equipment.
Operating and capital lease obligations are based upon contractual minimum rents and, for certain stores,amounts in excess of these minimum rents are payable based upon specified percentages of sales. Contingent rent isaccrued over the lease term, provided that the achievement of the specified sales level that triggers the contingentrental is probable. Certain leases include renewal or purchase options.
Rental expense for operating leases was as follows:
millions 2016 2015 2014
Minimum rentals . . . . . . . . . . . . . . . . . . . . . . . . . . . . . . . . . . . . . . . . . . . . . . . . . . . . . . . . . . . . $739 $713 $ 710Percentage rentals . . . . . . . . . . . . . . . . . . . . . . . . . . . . . . . . . . . . . . . . . . . . . . . . . . . . . . . . . . . 7 8 12Less-Sublease rentals. . . . . . . . . . . . . . . . . . . . . . . . . . . . . . . . . . . . . . . . . . . . . . . . . . . . . . . . . (51) (46) (45)Less-Amortization of deferred gain on sale-leaseback . . . . . . . . . . . . . . . . . . . . . . . . . . . . . . . (88) (52) —Total . . . . . . . . . . . . . . . . . . . . . . . . . . . . . . . . . . . . . . . . . . . . . . . . . . . . . . . . . . . . . . . . . . . . . . $607 $623 $ 677

Minimum lease obligations, excluding taxes, insurance and other expenses payable directly by us, for leases ineffect at January 28, 2017, were as follows:
Minimum LeaseCommitments
millions Capital Operating
2017 . . . . . . . . . . . . . . . . . . . . . . . . . . . . . . . . . . . . . . . . . . . . . . . . . . . . . . . . . . . . . . . . . . . . . . . $ 52 $ 6502018 . . . . . . . . . . . . . . . . . . . . . . . . . . . . . . . . . . . . . . . . . . . . . . . . . . . . . . . . . . . . . . . . . . . . . . . 38 5482019 . . . . . . . . . . . . . . . . . . . . . . . . . . . . . . . . . . . . . . . . . . . . . . . . . . . . . . . . . . . . . . . . . . . . . . . 24 4492020 . . . . . . . . . . . . . . . . . . . . . . . . . . . . . . . . . . . . . . . . . . . . . . . . . . . . . . . . . . . . . . . . . . . . . . . 16 3792021 . . . . . . . . . . . . . . . . . . . . . . . . . . . . . . . . . . . . . . . . . . . . . . . . . . . . . . . . . . . . . . . . . . . . . . . 6 318Later years . . . . . . . . . . . . . . . . . . . . . . . . . . . . . . . . . . . . . . . . . . . . . . . . . . . . . . . . . . . . . . . . . . 62 1,331Total minimum lease payments . . . . . . . . . . . . . . . . . . . . . . . . . . . . . . . . . . . . . . . . . . . . . . . . . . 198 3,675Less-minimum sublease income. . . . . . . . . . . . . . . . . . . . . . . . . . . . . . . . . . . . . . . . . . . . . . . . . . (126)Net minimum lease payments. . . . . . . . . . . . . . . . . . . . . . . . . . . . . . . . . . . . . . . . . . . . . . . . . . . . $ 3,549Less:Estimated executory costs. . . . . . . . . . . . . . . . . . . . . . . . . . . . . . . . . . . . . . . . . . . . . . . . . . . . . . . (6)Interest at a weighted average rate of 5.3% . . . . . . . . . . . . . . . . . . . . . . . . . . . . . . . . . . . . . . . . . (47)Capital lease obligations . . . . . . . . . . . . . . . . . . . . . . . . . . . . . . . . . . . . . . . . . . . . . . . . . . . . . . . . 145Less current portion of capital lease obligations . . . . . . . . . . . . . . . . . . . . . . . . . . . . . . . . . . . . . (42)Long-term capital lease obligations . . . . . . . . . . . . . . . . . . . . . . . . . . . . . . . . . . . . . . . . . . . . . . . $ 103
SEARS HOLDINGS CORPORATIONNotes to Consolidated Financial Statements—(Continued)
106
NOTE 15—RELATED PARTY DISCLOSURE
Mr. Lampert is Chairman of our Board of Directors and its Finance Committee and is the Chairman and ChiefExecutive Officer of ESL. Additionally, on February 1, 2013, Mr. Lampert became our Chief Executive Officer, inaddition to his role as Chairman of the Board. ESL owned approximately 48% of our outstanding common stock atJanuary 28, 2017 (excluding shares of common stock that ESL may acquire within 60 days upon the exercise ofwarrants to purchase shares of our common stock).
On February 25, 2016, Holdings announced the election of Bruce R. Berkowitz to membership on our Boardof Directors. Mr. Berkowitz serves as the Chief Investment Officer of Fairholme Capital Management, LLC, aninvestment adviser registered with the U.S. Securities and Exchange Commission ("SEC"), and is the President anda Director of Fairholme Funds, Inc., a SEC-registered investment company providing investment managementservices to three mutual funds (together with Fairholme Capital Management, LLC and other affiliates,"Fairholme"). Fairholme owned approximately 26% of our outstanding common stock at January 28, 2017(excluding shares of common stock that Fairholme may acquire within 60 days upon the exercise of warrants topurchase shares of our common stock).
Unsecured Commercial Paper
During 2016 and 2015, ESL and its affiliates held unsecured commercial paper issued by SRAC, an indirectwholly-owned subsidiary of Holdings. For the commercial paper outstanding to ESL, the weighted average of eachmaturity, annual interest rate, and principal amount outstanding for this commercial paper was 21 days, 7.87% and$100 million and 32 days, 4.55% and $8.8 million, respectively, in 2016 and 2015. The largest aggregate amount ofprincipal outstanding to ESL at any time since the beginning of 2016 was $245 million and the aggregate amount ofinterest paid by SRAC to ESL during 2016 was $8 million.

During 2016 and 2015, Fairholme and its affiliates held unsecured commercial paper issued by SRAC. For thecommercial paper outstanding to Fairholme, the weighted average of each maturity, annual interest rate, andprincipal amount outstanding for this commercial paper was 63 days, 7.42% and $1.3 million and 7 days, 3.70% and$4.5 million, respectively, in 2016 and 2015. The largest aggregate amount of principal outstanding to Fairholme atany time since the beginning of 2016 was $5 million and the aggregate amount of interest paid by SRAC toFairholme during 2016 was $109 thousand.
The commercial paper purchases were made in the ordinary course of business on substantially the sameterms, including interest rates, as terms prevailing for comparable transactions with other persons, and did notpresent features unfavorable to the Company.
Secured Short-Term Loan
In September 2014, the Company, through the Short-Term Borrowers, entities wholly-owned and controlled,directly or indirectly by the Company, entered into the $400 million Short-Term Loan with the Short-Term Lender,entities affiliated with ESL and Fairholme. The Company repaid the Short-Term Loan during 2015, resulting in nobalance outstanding at January 28, 2017 or January 30, 2016. See Note 3 for additional information regarding theShort-Term Loan.
LC Facility
On December 28, 2016, the Company, through the Borrowers, entered into the LC Facility Agreementproviding for the $500 million LC Facility with the Lenders, entities affiliated with ESL. On December 28, 2016,$200 million of commitments were made available under the LC Facility, and, subject to approval of the Lenders, upto an additional $300 million in commitments may be obtained by the Company from the Lenders (or other lenders)prior to December 28, 2017, the maturity date of the LC Facility. At January 28, 2017, we had $200 million of lettersof credit outstanding under the LC Facility, and the Lenders maintain cash collateral on deposit with the IssuingBank of $204 million. See Note 3 for additional information regarding the LC Facility.
2017 Secured Loan Facility
On January 3, 2017, the Company, through the 2017 Secured Loan Borrowers, obtained a $500 million realestate loan facility from the Lenders, entities affiliated with ESL. At January 28, 2017, JPP LLC and JPP II, LLC,entities affiliated with ESL, held $500 million of principal amount of the 2017 Secured Loan Facility. See Note 3 foradditional information regarding the 2017 Secured Loan Facility.
2016 Secured Loan Facility
In April 2016, the Company, through the 2016 Secured Loan Borrowers, obtained a $500 million real estateloan facility from the 2016 Secured Loan Lenders, some of which are entities affiliated with ESL. At January 28,2017, entities affiliated with ESL held $216 million of principal amount of the 2016 Secured Loan Facility. See Note3 for additional information regarding the 2016 Secured Loan Facility.
2016 Term Loan
In April 2016, the Company, through the ABL Borrowers, obtained a $750 million senior secured term loanunder the Amended Domestic Credit Agreement with a syndicate of lenders, including $146 million (net of originalissue discount) from JPP, LLC and JPP II, LLC, entities affiliated with ESL, and $100 million from the Company'sdomestic pension plan. At January 28, 2017, JPP LLC and JPP II, LLC, and the Company's domestic pension plansheld $150 million and $100 million, respectively, of principal amount of the 2016 Term Loan. See Note 3 foradditional information regarding the 2016 Term Loan.
Second Lien Term Loan
In September 2016, the Company, through the ABL Borrowers, obtained a $300 million Second Lien TermLoan from the Lenders, entities affiliated with ESL. At January 28, 2017, JPP LLC and JPP II, LLC, entities
SEARS HOLDINGS CORPORATIONNotes to Consolidated Financial Statements—(Continued)
107

affiliated with ESL, held $300 million of principal amount of the Second Lien Term Loan. See Note 3 for additionalinformation regarding the Second Lien Term Loan.
Senior Secured Notes
At both January 28, 2017 and January 30, 2016, Mr. Lampert and ESL held an aggregate of approximately $11million of principal amount of the Company's Senior Secured Notes. Mr. Lampert and ESL tendered approximately$165 million of the Company's Senior Secured Notes in the Offer, which is further discussed in Note 3.
At January 28, 2017 and January 30, 2016, Fairholme held an aggregate of approximately $46 million and $22million of principal amount of the Company's Senior Secured Notes, respectively. Fairholme tendered approximately$207 million of the Company's Senior Secured Notes in the Tender Offer, which is further discussed in Note 3.
Subsidiary Notes
At both January 28, 2017 and January 30, 2016, Mr. Lampert and ESL held an aggregate of $3 million ofprincipal amount of unsecured notes issued by SRAC (the "Subsidiary Notes").
At both January 28, 2017 and January 30, 2016, Fairholme held an aggregate of $14 million of principalamount of the Subsidiary Notes.
Senior Unsecured Notes and Warrants
At January 28, 2017 and January 30, 2016, respectively, Mr. Lampert and ESL held an aggregate ofapproximately $188 million and $193 million of principal amount of the Company's Senior Unsecured Notes, and10,033,472 warrants to purchase shares of Holdings' common stock at both January 28, 2017 and January 30, 2016.
At January 28, 2017 and January 30, 2016, respectively, Fairholme held an aggregate of approximately $357million and $360 million of principal amount of the Company's Senior Unsecured Notes, and 6,713,725 and6,839,379 warrants to purchase shares of Holdings' common stock.
Sears Canada
ESL owns approximately 45% of the outstanding common shares of Sears Canada (based on publicly availableinformation as of January 4, 2016). Fairholme owns approximately 20% of the outstanding common shares of SearsCanada (based on publicly available information as of November 29, 2016).
Lands' End
ESL owns approximately 59% of the outstanding common stock of Lands' End (based on publicly availableinformation as of January 5, 2017). Fairholme owns approximately 11% of the outstanding common shares ofLands' End (based on publicly available information as of October 11, 2016). Holdings and certain of its subsidiariesentered into a transition services agreement in connection with the spin-off pursuant to which Lands' End andHoldings agreed to provide, on an interim, transitional basis, various services, including but not limited to, taxservices, logistics services, auditing and compliance services, inventory management services, informationtechnology services and continued participation in certain contracts shared with Holdings and its subsidiaries, aswell as agreements related to Lands' End Shops at Sears and participation in the Shop Your Way program. Themajority of the services under the transition services agreement with Lands' End have expired or been terminated.
Amounts due to or from Lands’ End are non-interest bearing, and generally settled on a net basis. Holdingsinvoices Lands' End on at least a monthly basis. At both January 28, 2017 and January 30, 2016, Holdings reported anet amount payable to Lands' End of $1 million in other current liabilities in the Consolidated Balance Sheets.Amounts related to revenue from retail services and rent for Lands' End Shops at Sears, participation in the ShopYour Way program and corporate shared services were $65 million, $69 million and $63 million, respectively,during 2016, 2015 and 2014. The amounts Lands' End earned related to call center services and commissions were$10 million, $10 million and $9 million, respectively, during 2016, 2015 and 2014.
SEARS HOLDINGS CORPORATIONNotes to Consolidated Financial Statements—(Continued)
108

SHO
ESL owns approximately 57% of the outstanding common stock of SHO (based on publicly availableinformation as of December 1, 2016). Holdings and certain of its subsidiaries engage in transactions with SHOpursuant to various agreements with SHO which, among other things: (1) govern the principal transactions relatingto the rights offering and certain aspects of our relationship with SHO following the separation; (2) establish termsunder which Holdings and certain of its subsidiaries will provide SHO with services; and (3) establish termspursuant to which Holdings and certain of its subsidiaries will obtain merchandise for SHO.
These agreements were made in the context of a parent-subsidiary relationship and were negotiated in theoverall context of the separation. A summary of the nature of related party transactions involving SHO is as follows:
• SHO obtains a significant amount of its merchandise from the Company at cost. We have also entered intocertain agreements with SHO to provide logistics, handling, warehouse and transportation services. SHOalso pays a royalty related to the sale of Kenmore, Craftsman and DieHard products and fees forparticipation in the Shop Your Way program.
• SHO receives amounts from the Company for the sale of merchandise made through www.sears.com,extended service agreements, delivery and handling services and credit revenues.
• The Company provides SHO with shared corporate services. These services include accounting andfinance, human resources, information technology and real estate.
Amounts due to or from SHO are non-interest bearing, settled on a net basis, and have payment terms of 10days after the invoice date. The Company invoices SHO on a weekly basis. At January 28, 2017 and January 30,2016, Holdings reported a net amount receivable from SHO of $81 million and $51 million, respectively, withinaccounts receivable in the Consolidated Balance Sheets. Amounts related to the sale of inventory and relatedservices, royalties, and corporate shared services were $1.2 billion, $1.5 billion and $1.6 billion, respectively, during2016, 2015 and 2014. The net amounts SHO earned related to commissions were $82 million, $91 million and $99million, respectively, during 2016, 2015 and 2014. Additionally, the Company has guaranteed lease obligations forcertain SHO store leases that were assigned as a result of the separation. See Note 4 for further information relatedto these guarantees.
Also in connection with the separation, the Company entered into an agreement with SHO and the agent underSHO's secured credit facility, whereby the Company committed to continue to provide services to SHO inconnection with a realization on the lender's collateral after default under the secured credit facility, notwithstandingSHO's default under the underlying agreement with us, and to provide certain notices and services to the agent, forso long as any obligations remain outstanding under the secured credit facility.
Seritage
ESL owns approximately 7.9% of the total voting power of Seritage, and approximately 43.5% of the limitedpartnership units of Seritage Growth Properties, L.P. (the “Operating Partnership”), the entity that now owns theproperties sold by the Company in the Seritage transaction and through which Seritage conducts its operations(based on publicly available information as of August 14, 2015). Mr. Lampert is also currently the Chairman of theBoard of Trustees of Seritage. Fairholme owns approximately 14% of the outstanding Class A common shares ofSeritage and 100% of the outstanding Class C non-voting common shares of Seritage (based on publicly availableinformation as of February 16, 2016).
In connection with the Seritage transaction as described in Note 11, Holdings entered into a Master Leaseagreement with Seritage. The initial amount of aggregate annual base rent under the Master Lease is $134 millionfor the REIT properties, with increases of 2% per year beginning in the second lease year. At January 30, 2016,Holdings reported prepaid rent of $9 million in prepaid expenses and other current assets in the ConsolidatedBalance Sheet. Holdings recorded rent expense of $83 million and $49 million in cost of sales, buying andoccupancy for 2016 and 2015, respectively. Rent expense consists of straight-line rent expense of $142 million and$84 million, offset by amortization of a deferred gain recognized pursuant to the sale and leaseback of propertiesfrom Seritage of $59 million and $35 million for 2016 and 2015, respectively.
SEARS HOLDINGS CORPORATIONNotes to Consolidated Financial Statements—(Continued)
109

In addition to base rent under the Master Lease, Holdings pays monthly installment expenses for propertytaxes and insurance at all REIT properties where Holdings is a tenant and installment expenses for common areamaintenance, utilities and other operating expenses at REIT properties that are multi-tenant locations whereHoldings and other third parties are tenants. The initial amount of aggregate installment expenses under the MasterLease was $70 million, based on estimated installment expenses, and currently is $52 million as a result ofreconciling actual installment expenses and recapture activity. Holdings paid $64 million and $40 million for 2016and 2015, respectively, recorded in cost of sales, buying and occupancy.
At January 28, 2017 and January 30, 2016, Holdings reported an amount receivable from Seritage of $14million and $7 million, respectively, in accounts receivable in the Consolidated Balance Sheets. Holdings reportedan amount payable to Seritage of $11 million in other current liabilities in the Consolidated Balance Sheets atJanuary 28, 2017.
Holdings and Seritage entered into a transition services agreement pursuant to which Holdings will providecertain limited services to Seritage for up to 18 months. The services include specified facilities management,accounting, treasury, tax, information technology, risk management, human resources, and related support services.Under the terms of the transition services agreement, the scope and level of the facilities management services willbe substantially consistent with the scope and level of the services provided in connection with the operation of thetransferred properties held by Holdings prior to the closing of the Seritage transaction. The majority of the servicesunder the transition services agreement with Seritage have expired or have been terminated. Amounts due fromSeritage are generally settled on a net basis. Holdings invoices Seritage on at least a monthly basis. Revenuesrecognized related to the transition services agreement were not material for 2016 or 2015.
SEARS HOLDINGS CORPORATIONNotes to Consolidated Financial Statements—(Continued)
110
NOTE 16—SUPPLEMENTAL FINANCIAL INFORMATION
Other long-term liabilities at January 28, 2017 and January 30, 2016 consisted of the following:
millionsJanuary 28,
2017January 30,
2016
Unearned revenues. . . . . . . . . . . . . . . . . . . . . . . . . . . . . . . . . . . . . . . . . . . . . . . . . . . . . . . $ 639 $ 694Self-insurance reserves . . . . . . . . . . . . . . . . . . . . . . . . . . . . . . . . . . . . . . . . . . . . . . . . . . . 535 567Other . . . . . . . . . . . . . . . . . . . . . . . . . . . . . . . . . . . . . . . . . . . . . . . . . . . . . . . . . . . . . . . . . 467 470
Total . . . . . . . . . . . . . . . . . . . . . . . . . . . . . . . . . . . . . . . . . . . . . . . . . . . . . . . . . . . . . . $ 1,641 $ 1,731

NOTE 17—SUMMARY OF SEGMENT DATA
These reportable segment classifications are based on our business formats, as described in Note 1. The Kmartand Sears Canada formats each represent both an operating and reportable segment. As a result of the de-consolidation of Sears Canada as described in Note 2, Sears Canada is no longer an operating or reportable segment,and the segment results presented below reflect the operating results for Sears Canada through October 16, 2014.The Sears Domestic reportable segment consists of the aggregation of several business formats. These formats areevaluated by our Chief Operating Decision Maker ("CODM") to make decisions about resource allocation and toassess performance.
Each of these segments derives its revenues from the sale of merchandise and related services to customers,primarily in the United States and Canada. The merchandise and service categories are as follows:
(i) Hardlines—consists of home appliances, consumer electronics, lawn & garden, tools & hardware,automotive parts, household goods, toys, housewares and sporting goods;
(ii) Apparel and Soft Home—includes women's, men's, kids', footwear, jewelry, accessories and soft home;
(iii) Food and Drug—consists of grocery & household, pharmacy and drugstore;
(iv) Service—includes repair, installation and automotive service and extended contract revenue; and
(v) Other—includes revenues earned in connection with our agreements with SHO and Lands' End, as well ascredit revenues and licensed business revenues.
2016
millions KmartSears
DomesticSears
Holdings
Merchandise sales and services:Hardlines . . . . . . . . . . . . . . . . . . . . . . . . . . . . . . . . . . . . . . . . . . . . . . . . . . . . $ 2,445 $ 7,126 $ 9,571Apparel and Soft Home . . . . . . . . . . . . . . . . . . . . . . . . . . . . . . . . . . . . . . . . . 3,044 2,522 5,566Food and Drug . . . . . . . . . . . . . . . . . . . . . . . . . . . . . . . . . . . . . . . . . . . . . . . . 3,088 11 3,099Service . . . . . . . . . . . . . . . . . . . . . . . . . . . . . . . . . . . . . . . . . . . . . . . . . . . . . . 9 2,101 2,110Other . . . . . . . . . . . . . . . . . . . . . . . . . . . . . . . . . . . . . . . . . . . . . . . . . . . . . . . 64 1,728 1,792
Total merchandise sales and services . . . . . . . . . . . . . . . . . . . . . . . . . . . 8,650 13,488 22,138Costs and expenses:
Cost of sales, buying and occupancy . . . . . . . . . . . . . . . . . . . . . . . . . . . . . . . 7,093 10,359 17,452Selling and administrative . . . . . . . . . . . . . . . . . . . . . . . . . . . . . . . . . . . . . . . 2,175 3,934 6,109Depreciation and amortization. . . . . . . . . . . . . . . . . . . . . . . . . . . . . . . . . . . . 71 304 375Impairment charges . . . . . . . . . . . . . . . . . . . . . . . . . . . . . . . . . . . . . . . . . . . . 22 405 427Gain on sales of assets . . . . . . . . . . . . . . . . . . . . . . . . . . . . . . . . . . . . . . . . . . (181) (66) (247)
Total costs and expenses . . . . . . . . . . . . . . . . . . . . . . . . . . . . . . . . . . . . . 9,180 14,936 24,116Operating loss . . . . . . . . . . . . . . . . . . . . . . . . . . . . . . . . . . . . . . . . . . . . . . . . . . . . $ (530) $ (1,448) $ (1,978)Total assets . . . . . . . . . . . . . . . . . . . . . . . . . . . . . . . . . . . . . . . . . . . . . . . . . . . . . . $ 2,134 $ 7,228 $ 9,362Capital expenditures . . . . . . . . . . . . . . . . . . . . . . . . . . . . . . . . . . . . . . . . . . . . . . . $ 43 $ 99 $ 142
SEARS HOLDINGS CORPORATIONNotes to Consolidated Financial Statements—(Continued)
111

2015
millions KmartSears
DomesticSears
Holdings
Merchandise sales and services:Hardlines . . . . . . . . . . . . . . . . . . . . . . . . . . . . . . . . . . . . . . . . . . . . . . . . . . . . $ 2,936 $ 7,915 $ 10,851Apparel and Soft Home . . . . . . . . . . . . . . . . . . . . . . . . . . . . . . . . . . . . . . . . . 3,434 2,907 6,341Food and Drug . . . . . . . . . . . . . . . . . . . . . . . . . . . . . . . . . . . . . . . . . . . . . . . . 3,735 9 3,744Service . . . . . . . . . . . . . . . . . . . . . . . . . . . . . . . . . . . . . . . . . . . . . . . . . . . . . . 13 2,127 2,140Other . . . . . . . . . . . . . . . . . . . . . . . . . . . . . . . . . . . . . . . . . . . . . . . . . . . . . . . 70 2,000 2,070
Total merchandise sales and services . . . . . . . . . . . . . . . . . . . . . . . . . . . 10,188 14,958 25,146Costs and expenses:
Cost of sales, buying and occupancy . . . . . . . . . . . . . . . . . . . . . . . . . . . . . . . 8,042 11,294 19,336Selling and administrative . . . . . . . . . . . . . . . . . . . . . . . . . . . . . . . . . . . . . . . 2,537 4,320 6,857Depreciation and amortization. . . . . . . . . . . . . . . . . . . . . . . . . . . . . . . . . . . . 72 350 422Impairment charges . . . . . . . . . . . . . . . . . . . . . . . . . . . . . . . . . . . . . . . . . . . . 14 260 274Gain on sales of assets . . . . . . . . . . . . . . . . . . . . . . . . . . . . . . . . . . . . . . . . . . (185) (558) (743)
Total costs and expenses . . . . . . . . . . . . . . . . . . . . . . . . . . . . . . . . . . . . . 10,480 15,666 26,146Operating loss . . . . . . . . . . . . . . . . . . . . . . . . . . . . . . . . . . . . . . . . . . . . . . . . . . . . $ (292) $ (708) $ (1,000)Total assets . . . . . . . . . . . . . . . . . . . . . . . . . . . . . . . . . . . . . . . . . . . . . . . . . . . . . . $ 3,059 $ 8,278 $ 11,337Capital expenditures . . . . . . . . . . . . . . . . . . . . . . . . . . . . . . . . . . . . . . . . . . . . . . . $ 42 $ 169 $ 211
2014
millions KmartSears
DomesticSears
CanadaSears
Holdings
Merchandise sales and services:Hardlines. . . . . . . . . . . . . . . . . . . . . . . . . . . . . . . . . . . . . . . . . . . $ 3,605 $ 8,903 $ 1,100 $ 13,608Apparel and Soft Home . . . . . . . . . . . . . . . . . . . . . . . . . . . . . . . 4,049 3,673 880 8,602Food and Drug . . . . . . . . . . . . . . . . . . . . . . . . . . . . . . . . . . . . . . 4,326 12 — 4,338Service . . . . . . . . . . . . . . . . . . . . . . . . . . . . . . . . . . . . . . . . . . . . 17 2,318 77 2,412Other . . . . . . . . . . . . . . . . . . . . . . . . . . . . . . . . . . . . . . . . . . . . . . 77 2,130 31 2,238
Total merchandise sales and services . . . . . . . . . . . . . . . . . 12,074 17,036 2,088 31,198Costs and expenses:
Cost of sales, buying and occupancy . . . . . . . . . . . . . . . . . . . . . 9,513 12,950 1,586 24,049Selling and administrative . . . . . . . . . . . . . . . . . . . . . . . . . . . . . 2,962 4,655 603 8,220Depreciation and amortization . . . . . . . . . . . . . . . . . . . . . . . . . . 95 437 49 581Impairment charges . . . . . . . . . . . . . . . . . . . . . . . . . . . . . . . . . . 29 19 15 63(Gain) loss on sales of assets . . . . . . . . . . . . . . . . . . . . . . . . . . . (103) (105) 1 (207)
Total costs and expenses . . . . . . . . . . . . . . . . . . . . . . . . . . . 12,496 17,956 2,254 32,706Operating loss . . . . . . . . . . . . . . . . . . . . . . . . . . . . . . . . . . . . . . . . . . $ (422) $ (920) $ (166) $ (1,508)Total assets . . . . . . . . . . . . . . . . . . . . . . . . . . . . . . . . . . . . . . . . . . . . . $ 3,142 $ 10,043 $ — $ 13,185Capital expenditures. . . . . . . . . . . . . . . . . . . . . . . . . . . . . . . . . . . . . . $ 45 $ 193 $ 32 $ 270
SEARS HOLDINGS CORPORATIONNotes to Consolidated Financial Statements—(Continued)
112

NOTE 18—LEGAL PROCEEDINGS
We are a defendant in several lawsuits containing class or collective action allegations in which the plaintiffsare current and former hourly and salaried associates who allege violations of various wage and hour laws, rules andregulations pertaining to alleged misclassification of certain of our employees, the failure to pay overtime, and/or thefailure to pay for missed meal and rest periods, and other payroll violations. The complaints generally seekunspecified monetary damages, injunctive relief, or both. Further, certain of these proceedings are in jurisdictionswith reputations for aggressive application of laws and procedures against corporate defendants. We also are adefendant in several putative or certified class action lawsuits in California relating to alleged failure to comply withCalifornia laws pertaining to certain operational, marketing, and pricing practices. The California laws alleged tohave been violated in each of these lawsuits provide the potential for significant statutory penalties. At this time, theCompany is not able to either predict the outcome of these lawsuits or reasonably estimate a potential range of losswith respect to the lawsuits.
We are subject to various other legal and governmental proceedings and investigations, including someinvolving the practices and procedures in our more highly regulated businesses. Some matters contain class actionallegations, environmental and asbestos exposure allegations and other consumer-based, regulatory or qui tamclaims, each of which may seek compensatory, punitive or treble damage claims (potentially in large amounts), aswell as other types of relief. Additionally, some of these claims or actions, such as the qui tam claims, have thepotential for significant statutory penalties. At this time, the Company is not able to either predict the outcome ofthese lawsuits or reasonably estimate a potential range of loss with respect to these lawsuits.
In May and June of 2015, four shareholder lawsuits were filed in the Delaware Chancery Court, which havesince been consolidated into a single action. A consolidated complaint then was filed, naming Holdings, themembers of our Board of Directors, ESL Investments, Inc., Seritage, our CEO, and Fairholme, alleging, amongother things, breaches of fiduciary duties in connection with the Seritage transaction. Among other forms of relief,the plaintiffs are seeking damages in unspecified amounts. As the plaintiffs are suing derivatively, Holdings is only anominal defendant in the complaint. The Company believes that the Seritage transaction has provided substantialbenefits to Holdings and its shareholders and believes further that the plaintiffs' claims are legally without merit. InOctober 2016, a settlement in principle was reached with plaintiffs, subject to court approval. Given Holdings wasonly a nominal defendant in the complaint, Holdings will not be obligated to fund any portion of the settlement, andmay receive some portion of any settlement achieved.
In accordance with accounting standards regarding loss contingencies, we accrue an undiscounted liability forthose contingencies where the incurrence of a loss is probable and the amount can be reasonably estimated, and wedisclose the amount accrued and the amount of a reasonably possible loss in excess of the amount accrued, if suchdisclosure is necessary for our financial statements to not be misleading. We do not record liabilities when thelikelihood that the liability has been incurred is probable but the amount cannot be reasonably estimated, or whenthe liability is believed to be only reasonably possible or remote.
Because litigation outcomes are inherently unpredictable, our evaluation of legal proceedings often involves aseries of complex assessments by management about future events and can rely heavily on estimates andassumptions. If the assessments indicate that loss contingencies that could be material to any one of our financialstatements are not probable, but are reasonably possible, or are probable, but cannot be estimated, then we disclosethe nature of the loss contingencies, together with an estimate of the range of possible loss or a statement that suchloss is not reasonably estimable. While the consequences of certain unresolved proceedings are not presentlydeterminable, and an estimate of the probable and reasonably possible loss or range of loss in excess of amountsaccrued for such proceedings cannot be reasonably made, an adverse outcome from such proceedings could have amaterial effect on our earnings in any given reporting period. However, in the opinion of our management, afterconsulting with legal counsel, and taking into account insurance and reserves, the ultimate liability related to currentoutstanding matters is not expected to have a material effect on our financial position, liquidity or capital resources.
SEARS HOLDINGS CORPORATIONNotes to Consolidated Financial Statements—(Continued)
113

NOTE 19—QUARTERLY FINANCIAL INFORMATION (UNAUDITED)
2016
millions, except per share dataFirst
QuarterSecondQuarter
ThirdQuarter
FourthQuarter
Revenues. . . . . . . . . . . . . . . . . . . . . . . . . . . . . . . . . . . . . . . . $ 5,394 $ 5,663 $ 5,029 $ 6,052Cost of sales, buying and occupancy . . . . . . . . . . . . . . . . . . 4,217 4,403 4,067 4,765Selling and administrative . . . . . . . . . . . . . . . . . . . . . . . . . . 1,503 1,484 1,543 1,579Net loss attributable to Holdings' shareholders . . . . . . . . . . (471) (395) (748) (607)Basic net loss per share attributable to Holdings'
shareholders. . . . . . . . . . . . . . . . . . . . . . . . . . . . . . . . . . . (4.41) (3.70) (6.99) (5.67)Diluted net loss per share attributable to Holdings'
shareholders. . . . . . . . . . . . . . . . . . . . . . . . . . . . . . . . . . . (4.41) (3.70) (6.99) (5.67)
2015
millions, except per share dataFirst
QuarterSecondQuarter
ThirdQuarter
FourthQuarter
Revenues. . . . . . . . . . . . . . . . . . . . . . . . . . . . . . . . . . . . . . . . $ 5,882 $ 6,211 $ 5,750 $ 7,303Cost of sales, buying and occupancy . . . . . . . . . . . . . . . . . . 4,364 4,776 4,488 5,708Selling and administrative . . . . . . . . . . . . . . . . . . . . . . . . . . 1,681 1,694 1,630 1,852Net income (loss) attributable to Holdings' shareholders . . . (303) 208 (454) (580)Basic net income (loss) per share attributable to Holdings'
shareholders. . . . . . . . . . . . . . . . . . . . . . . . . . . . . . . . . . . (2.85) 1.95 (4.26) (5.44)Diluted net income (loss) per share attributable to
Holdings' shareholders . . . . . . . . . . . . . . . . . . . . . . . . . . (2.85) 1.84 (4.26) (5.44)
Per share amounts for each quarter are required to be computed independently and may not equal the amountcomputed for the total year. In the fourth quarter of 2016 and 2015, we recorded impairment related to the Searstrade name of $381 million and $180 million, respectively. Refer to Note 12 for more information related to ourimpairment charges. In the second quarter of 2015, we recorded an immediate net gain of $508 million related to theSeritage and JVs transactions. Refer to Note 11 for more information related to our real estate transactions.
SEARS HOLDINGS CORPORATIONNotes to Consolidated Financial Statements—(Continued)
114
NOTE 20—GUARANTOR/NON-GUARANTOR SUBSIDIARY FINANCIAL INFORMATION
At January 28, 2017, the principal amount outstanding of the Company’s 6 5/8% senior secured notes due 2018was $303 million. These notes were issued in 2010 by Sears Holdings Corporation ("Parent"). The Senior SecuredNotes are guaranteed by certain of our 100% owned domestic subsidiaries that own the collateral for the SeniorSecured Notes, as well as by Sears Holdings Management Corporation and SRAC (the "guarantor subsidiaries").The following condensed consolidated financial information presents the Condensed Consolidating Balance Sheetsat January 28, 2017 and January 30, 2016, and the Condensed Consolidating Statements of Operations, theConsolidating Statements of Comprehensive Income (Loss) and the Condensed Consolidating Statements of Cashflows for 2016, 2015 and 2014 of (i) Parent; (ii) the guarantor subsidiaries; (iii) the non-guarantor subsidiaries;(iv) eliminations and (v) the Company on a consolidated basis.
On April 4, 2014, we completed the separation of our Lands' End business through a spin-off transaction.Merchandise sales and services included revenues of approximately $183 million from the Lands' End domesticbusiness in 2014. Net loss attributable to Holdings' shareholders included net income of approximately $2 millionfrom the Lands' End domestic business in 2014. The financial information for the domestic portion of Lands' Endbusiness is reflected within the guarantor subsidiaries balances for these periods, while the international portion isreflected within the non-guarantor subsidiaries balances for these periods.

On October 16, 2014, we de-consolidated Sears Canada pursuant to a rights offering transaction. Merchandisesales and services included revenues of approximately $2.1 billion in 2014. Net loss attributable to Holdings'shareholders included net loss of approximately $137 million in 2014. The financial information for Sears Canada isreflected within the non-guarantor subsidiaries balances for these periods.
The principal elimination entries relate to investments in subsidiaries and intercompany balances andtransactions including transactions with our wholly-owned non-guarantor insurance subsidiary. The Company hasaccounted for investments in subsidiaries under the equity method. The guarantor subsidiaries are 100% owneddirectly or indirectly by the Parent and all guarantees are joint, several and unconditional. Additionally, the notes aresecured by a security interest in certain assets consisting primarily of domestic inventory and credit card receivablesof the guarantor subsidiaries, and consequently may not be available to satisfy the claims of the Company’s generalcreditors. Certain investments primarily held by non-guarantor subsidiaries are recorded by the issuers at historicalcost and are recorded at fair value by the holder.
SEARS HOLDINGS CORPORATIONNotes to Consolidated Financial Statements—(Continued)
115

Condensed Consolidating Balance SheetJanuary 28, 2017
millions ParentGuarantor
Subsidiaries
Non-Guarantor
Subsidiaries Eliminations Consolidated
Current assetsCash and cash equivalents . . . . . . . . . . $ — $ 260 $ 26 $ — $ 286Intercompany receivables . . . . . . . . . . . — — 27,415 (27,415) —Accounts receivable . . . . . . . . . . . . . . . — 441 25 466Merchandise inventories. . . . . . . . . . . . — 3,959 — — 3,959Prepaid expenses and other current
assets . . . . . . . . . . . . . . . . . . . . . . . . . 23 692 856 (1,286) 285Total current assets . . . . . . . . . . . . . . . . 23 5,352 28,322 (28,701) 4,996
Total property and equipment, net . . . . . . . . — 1,504 736 — 2,240Goodwill and intangible assets . . . . . . . . . . — 360 1,528 (98) 1,790Other assets . . . . . . . . . . . . . . . . . . . . . . . . . 4 285 931 (884) 336Investment in subsidiaries . . . . . . . . . . . . . . 9,110 26,703 — (35,813) —
TOTAL ASSETS . . . . . . . . . . . . . . $ 9,137 $ 34,204 $ 31,517 $ (65,496) $ 9,362Current liabilities
Short-term borrowings . . . . . . . . . . . . . $ — $ 108 $ — $ (108) $ —Current portion of long-term debt and
capitalized lease obligations . . . . . . . — 1,189 — (599) 590Merchandise payables. . . . . . . . . . . . . . — 1,048 — — 1,048Intercompany payables . . . . . . . . . . . . . 11,830 15,585 — (27,415) —Other current liabilities . . . . . . . . . . . . . 17 2,479 1,219 (672) 3,043Total current liabilities . . . . . . . . . . . . . 11,847 20,409 1,219 (28,794) 4,681
Long-term debt and capitalized leaseobligations . . . . . . . . . . . . . . . . . . . . . . . . 1,215 3,160 — (802) 3,573
Pension and postretirement benefits . . . . . . — 1,746 4 — 1,750Deferred gain on sale-leaseback . . . . . . . . . — 563 — — 563Sale-leaseback financing obligation . . . . . . — 235 — — 235Long-term deferred tax liabilities . . . . . . . . 48 — 724 (29) 743Other long-term liabilities . . . . . . . . . . . . . . — 808 1,038 (205) 1,641
Total Liabilities . . . . . . . . . . . . . . . . . . . 13,110 26,921 2,985 (29,830) 13,186EQUITY (DEFICIT)Shareholder's equity (deficit) . . . . . . . . . . . . (3,973) 7,283 28,532 (35,666) (3,824)Noncontrolling interest . . . . . . . . . . . . . . . . — — — — —
Total Equity (Deficit) . . . . . . . . . . . . . . (3,973) 7,283 28,532 (35,666) (3,824)TOTAL LIABILITIES AND EQUITY
(DEFICIT). . . . . . . . . . . . . . . . . . . . . $ 9,137 $ 34,204 $ 31,517 $ (65,496) $ 9,362
SEARS HOLDINGS CORPORATIONNotes to Consolidated Financial Statements—(Continued)
116

Condensed Consolidating Balance SheetJanuary 30, 2016
millions ParentGuarantor
Subsidiaries
Non-Guarantor
Subsidiaries Eliminations Consolidated
Current assetsCash and cash equivalents . . . . . . . . . . $ — $ 200 $ 38 $ — $ 238Intercompany receivables . . . . . . . . . . . — — 26,935 (26,935) —Accounts receivable . . . . . . . . . . . . . . . 7 383 29 — 419Merchandise inventories. . . . . . . . . . . . — 5,172 — — 5,172Prepaid expenses and other current
assets . . . . . . . . . . . . . . . . . . . . . . . . . 114 453 257 (608) 216Total current assets . . . . . . . . . . . . . . . . 121 6,208 27,259 (27,543) 6,045
Total property and equipment, net . . . . . . . . — 1,829 802 — 2,631Goodwill and intangible assets . . . . . . . . . . — 269 1,909 — 2,178Other assets . . . . . . . . . . . . . . . . . . . . . . . . . — 265 1,910 (1,692) 483Investment in subsidiaries . . . . . . . . . . . . . . 10,419 26,616 — (37,035) —
TOTAL ASSETS . . . . . . . . . . . . . . $ 10,540 $ 35,187 $ 31,880 $ (66,270) $ 11,337Current liabilities
Short-term borrowings . . . . . . . . . . . . . $ — $ 797 $ — $ — $ 797Current portion of long-term debt and
capitalized lease obligations . . . . . . . — 70 1 — 71Merchandise payables. . . . . . . . . . . . . . — 1,574 — — 1,574Intercompany payables . . . . . . . . . . . . . 11,892 15,043 — (26,935) —Other current liabilities . . . . . . . . . . . . . 20 2,273 1,311 (608) 2,996Total current liabilities . . . . . . . . . . . . . 11,912 19,757 1,312 (27,543) 5,438
Long-term debt and capitalized leaseobligations . . . . . . . . . . . . . . . . . . . . . . . . 685 2,998 1 (1,576) 2,108
Pension and postretirement benefits . . . . . . — 2,201 5 — 2,206Deferred gain on sale-leaseback . . . . . . . . . — 753 — — 753Sale-leaseback financing obligation . . . . . . — 164 — — 164Long-term deferred tax liabilities . . . . . . . . 58 — 873 (38) 893Other long-term liabilities . . . . . . . . . . . . . . — 832 1,128 (229) 1,731
Total Liabilities . . . . . . . . . . . . . . . . . . . 12,655 26,705 3,319 (29,386) 13,293EQUITY (DEFICIT)Shareholder's equity (deficit) . . . . . . . . . . . . (2,115) 8,482 28,561 (36,891) (1,963)Noncontrolling interest . . . . . . . . . . . . . . . . — — — 7 7
Total Equity (Deficit) . . . . . . . . . . . . . . (2,115) 8,482 28,561 (36,884) (1,956)TOTAL LIABILITIES AND EQUITY
(DEFICIT). . . . . . . . . . . . . . . . . . . . . $ 10,540 $ 35,187 $ 31,880 $ (66,270) $ 11,337
SEARS HOLDINGS CORPORATIONNotes to Consolidated Financial Statements—(Continued)
117

Condensed Consolidating Statement of OperationsFor the Year Ended January 28, 2017
millions ParentGuarantor
Subsidiaries
Non-Guarantor
Subsidiaries Eliminations Consolidated
Merchandise sales and services . . . . . . . . . . . $ — $ 22,203 $ 2,796 $ (2,861) $ 22,138Cost of sales, buying and occupancy . . . . . . . — 17,928 1,056 (1,532) 17,452Selling and administrative . . . . . . . . . . . . . . . 6 6,506 926 (1,329) 6,109Depreciation and amortization. . . . . . . . . . . . — 303 72 — 375Impairment charges . . . . . . . . . . . . . . . . . . . . — 46 381 — 427Gain on sales of assets . . . . . . . . . . . . . . . . . . — (343) (2) 98 (247)
Total costs and expenses . . . . . . . . . . . . . 6 24,440 2,433 (2,763) 24,116Operating income (loss). . . . . . . . . . . . . . . . . (6) (2,237) 363 (98) (1,978)Interest expense . . . . . . . . . . . . . . . . . . . . . . . (385) (645) (13) 639 (404)Interest and investment income (loss) . . . . . . 20 152 441 (639) (26)Other income (loss) . . . . . . . . . . . . . . . . . . . . 13 — (217) 217 13Income (loss) before income taxes . . . . . . . . (358) (2,730) 574 119 (2,395)Income tax (expense) benefit . . . . . . . . . . . . . 28 529 (383) — 174Equity (deficit) in earnings in subsidiaries . . (2,010) 5 — 2,005 —NET INCOME (LOSS) ATTRIBUTABLE
TO HOLDINGS' SHAREHOLDERS . . $ (2,340) $ (2,196) $ 191 $ 2,124 $ (2,221)
SEARS HOLDINGS CORPORATIONNotes to Consolidated Financial Statements—(Continued)
118

Condensed Consolidating Statement of OperationsFor the Year Ended January 30, 2016
millions ParentGuarantor
Subsidiaries
Non-Guarantor
Subsidiaries Eliminations Consolidated
Merchandise sales and services . . . . . . . . . . . $ — $ 25,264 $ 2,861 $ (2,979) $ 25,146Cost of sales, buying and occupancy . . . . . . . — 19,819 1,131 (1,614) 19,336Selling and administrative . . . . . . . . . . . . . . . 3 7,322 897 (1,365) 6,857Depreciation and amortization. . . . . . . . . . . . — 350 72 — 422Impairment charges . . . . . . . . . . . . . . . . . . . . — 94 180 — 274Gain on sales of assets . . . . . . . . . . . . . . . . . . — (735) (8) — (743)
Total costs and expenses . . . . . . . . . . . . . 3 26,850 2,272 (2,979) 26,146Operating income (loss). . . . . . . . . . . . . . . . . (3) (1,586) 589 — (1,000)Interest expense . . . . . . . . . . . . . . . . . . . . . . . (265) (481) (83) 506 (323)Interest and investment income (loss) . . . . . . (19) 44 419 (506) (62)Income (loss) before income taxes . . . . . . . . (287) (2,023) 925 — (1,385)Income tax (expense) benefit . . . . . . . . . . . . . 115 480 (338) — 257Equity (deficit) in earnings in subsidiaries . . (956) 158 — 798 —Net income (loss) . . . . . . . . . . . . . . . . . . . . . . (1,128) (1,385) 587 798 (1,128)Income attributable to noncontrolling
interests. . . . . . . . . . . . . . . . . . . . . . . . . . . . — — — (1) (1)NET INCOME (LOSS) ATTRIBUTABLE
TO HOLDINGS' SHAREHOLDERS . . $ (1,128) $ (1,385) $ 587 $ 797 $ (1,129)
SEARS HOLDINGS CORPORATIONNotes to Consolidated Financial Statements—(Continued)
119

Condensed Consolidating Statement of OperationsFor the Year Ended January 31, 2015
millions ParentGuarantor
Subsidiaries
Non-Guarantor
Subsidiaries Eliminations Consolidated
Merchandise sales and services. . . . . . . . . . . . $ — $ 29,277 $ 5,187 $ (3,266) $ 31,198Cost of sales, buying and occupancy . . . . . . . — 22,917 2,820 (1,688) 24,049Selling and administrative. . . . . . . . . . . . . . . . 2 8,283 1,513 (1,578) 8,220Depreciation and amortization . . . . . . . . . . . . — 454 127 — 581Impairment charges. . . . . . . . . . . . . . . . . . . . . — 48 15 — 63Gain on sales of assets . . . . . . . . . . . . . . . . . . — (180) (27) — (207)
Total costs and expenses . . . . . . . . . . . . . 2 31,522 4,448 (3,266) 32,706Operating income (loss) . . . . . . . . . . . . . . . . . (2) (2,245) 739 — (1,508)Interest expense. . . . . . . . . . . . . . . . . . . . . . . . (223) (469) (92) 471 (313)Interest and investment income. . . . . . . . . . . . 92 28 483 (471) 132Other income. . . . . . . . . . . . . . . . . . . . . . . . . . — — 4 — 4Income (loss) before income taxes . . . . . . . . . (133) (2,686) 1,134 — (1,685)Income tax (expense) benefit . . . . . . . . . . . . . 40 489 (654) — (125)Deficit in earnings in subsidiaries . . . . . . . . . . (1,717) (53) — 1,770 —Net income (loss) . . . . . . . . . . . . . . . . . . . . . . (1,810) (2,250) 480 1,770 (1,810)Loss attributable to noncontrolling interests . . — — — 128 128NET INCOME (LOSS) ATTRIBUTABLE
TO HOLDINGS' SHAREHOLDERS . . . $ (1,810) $ (2,250) $ 480 $ 1,898 $ (1,682)
SEARS HOLDINGS CORPORATIONNotes to Consolidated Financial Statements—(Continued)
120

Consolidating Statement of Comprehensive Income (Loss)For the Year Ended January 28, 2017
millions ParentGuarantor
Subsidiaries
Non-Guarantor
Subsidiaries Eliminations Consolidated
Net income (loss) . . . . . . . . . . . . . . . . . . . . . . . . $ (2,340) $ (2,196) $ 191 $ 2,124 $ (2,221)Other comprehensive income:Pension and postretirement adjustments,
net of tax . . . . . . . . . . . . . . . . . . . . . . . . . — 366 — — 366Unrealized net gain, net of tax. . . . . . . . . . . — — 122 (122) —Dissolution of noncontrolling interest . . . . . — — (7) — (7)
Total other comprehensive income. . . . . . . . . . . — 366 115 (122) 359Comprehensive income (loss). . . . . . . . . . . . . . . (2,340) (1,830) 306 2,002 (1,862)Comprehensive loss attributable to
noncontrolling interest . . . . . . . . . . . . . . . . . . — — — 7 7Comprehensive income (loss) attributable to
Holdings' shareholders . . . . . . . . . . . . . . . . . . $ (2,340) $ (1,830) $ 306 $ 2,009 $ (1,855)
SEARS HOLDINGS CORPORATIONNotes to Consolidated Financial Statements—(Continued)
121

Consolidating Statement of Comprehensive Income (Loss)For the Year Ended January 30, 2016
millions ParentGuarantor
Subsidiaries
Non-Guarantor
Subsidiaries Eliminations Consolidated
Net income (loss). . . . . . . . . . . . . . . . . . . . . . . . . $ (1,128) $ (1,385) $ 587 $ 798 $ (1,128)Other comprehensive income (loss):Pension and postretirement adjustments,
net of tax . . . . . . . . . . . . . . . . . . . . . . . . . . — 113 — — 113Currency translation adjustments, net of tax — — (1) — (1)Unrealized net loss, net of tax . . . . . . . . . . . — (3) (65) 68 —
Total other comprehensive income (loss) . . . . . . — 110 (66) 68 112Comprehensive income (loss) . . . . . . . . . . . . . . . (1,128) (1,275) 521 866 (1,016)Comprehensive loss attributable to
noncontrolling interest . . . . . . . . . . . . . . . . . . . — — — (1) (1)Comprehensive income (loss) attributable to
Holdings' shareholders . . . . . . . . . . . . . . . . . . . $ (1,128) $ (1,275) $ 521 $ 865 $ (1,017)
SEARS HOLDINGS CORPORATIONNotes to Consolidated Financial Statements—(Continued)
122

Consolidating Statement of Comprehensive Income (Loss)For the Year Ended January 31, 2015
millions ParentGuarantor
Subsidiaries
Non-Guarantor
Subsidiaries Eliminations Consolidated
Net income (loss) . . . . . . . . . . . . . . . . . . . . . . . . $ (1,810) $ (2,250) $ 480 $ 1,770 $ (1,810)Other comprehensive income (loss):Pension and postretirement adjustments,
net of tax . . . . . . . . . . . . . . . . . . . . . . . . . — (1,050) 10 — (1,040)Deferred gain on derivatives, net of tax . . . (2) — — — (2)Currency translation adjustments, net of
tax. . . . . . . . . . . . . . . . . . . . . . . . . . . . . . . 5 — (2) — 3Sears Canada de-consolidation . . . . . . . . . . 54 10 (250) (186)Unrealized net gain, net of tax. . . . . . . . . . . — 2 222 (224) —
Total other comprehensive income (loss) . . . . . . 57 (1,038) (20) (224) (1,225)Comprehensive income (loss). . . . . . . . . . . . . . . (1,753) (3,288) 460 1,546 (3,035)Comprehensive loss attributable to
noncontrolling interest . . . . . . . . . . . . . . . . . . — — — 438 438Comprehensive income (loss) attributable to
Holdings' shareholders . . . . . . . . . . . . . . . . . . $ (1,753) $ (3,288) $ 460 $ 1,984 $ (2,597)
SEARS HOLDINGS CORPORATIONNotes to Consolidated Financial Statements—(Continued)
123

Condensed Consolidating Statement of Cash FlowsFor the Year Ended January 28, 2017
millions ParentGuarantor
Subsidiaries
Non-Guarantor
Subsidiaries Eliminations Consolidated
Net cash provided by (used in) operatingactivities . . . . . . . . . . . . . . . . . . . . . . . . . . . . . . $ 244 $ (2,137) $ 820 $ (308) $ (1,381)
Proceeds from sales of property and investments — 273 113 — 386Purchases of property and equipment . . . . . . . . . — (133) (9) — (142)Net investing with Affiliates . . . . . . . . . . . . . . . . (239) — (627) 866 —Net cash provided by (used in) investing
activities . . . . . . . . . . . . . . . . . . . . . . . . . . . . . . (239) 140 (523) 866 244Proceeds from debt issuances. . . . . . . . . . . . . . . . — 2,028 — — 2,028Repayments of long-term debt . . . . . . . . . . . . . . . — (65) (1) — (66)Decrease in short-term borrowings, primarily 90
days or less . . . . . . . . . . . . . . . . . . . . . . . . . . . . — (797) — — (797)Proceeds from sale-leaseback financing . . . . . . . — 71 — — 71Debt issuance costs . . . . . . . . . . . . . . . . . . . . . . . (5) (46) — — (51)Intercompany dividend. . . . . . . . . . . . . . . . . . . . . — — (308) 308 —Net borrowing with Affiliates . . . . . . . . . . . . . . . — 866 — (866) —Net cash provided by (used in) financing
activities . . . . . . . . . . . . . . . . . . . . . . . . . . . . . . (5) 2,057 (309) (558) 1,185
NET INCREASE (DECREASE) IN CASH ANDCASH EQUIVALENTS. . . . . . . . . . . . . . . . . . . . . . — 60 (12) — 48
CASH AND CASH EQUIVALENTS, BEGINNINGOF YEAR. . . . . . . . . . . . . . . . . . . . . . . . . . . . . . . . . — 200 38 — 238
CASH AND CASH EQUIVALENTS, END OFYEAR. . . . . . . . . . . . . . . . . . . . . . . . . . . . . . . . . . . . $ — $ 260 $ 26 $ — $ 286
SEARS HOLDINGS CORPORATIONNotes to Consolidated Financial Statements—(Continued)
124

Condensed Consolidating Statement of Cash FlowsFor the Year Ended January 30, 2016
millions ParentGuarantor
Subsidiaries
Non-Guarantor
Subsidiaries Eliminations Consolidated
Net cash provided by (used in) operatingactivities. . . . . . . . . . . . . . . . . . . . . . . . . . . . . . . $ 395 $ (3,021) $ 938 $ (479) $ (2,167)
Proceeds from sales of property and investments . — 2,725 5 — 2,730Purchases of property and equipment . . . . . . . . . . — (202) (9) — (211)Net investing with Affiliates . . . . . . . . . . . . . . . . . (395) — (446) 841 —Net cash provided by (used in) investing
activities. . . . . . . . . . . . . . . . . . . . . . . . . . . . . . . (395) 2,523 (450) 841 2,519Repayments of long-term debt . . . . . . . . . . . . . . . — (1,403) (2) — (1,405)Increase in short-term borrowings, primarily 90
days or less . . . . . . . . . . . . . . . . . . . . . . . . . . . . — 583 — — 583Proceeds from sale-leaseback financing . . . . . . . . — 508 — — 508Debt issuance costs . . . . . . . . . . . . . . . . . . . . . . . . — (50) — — (50)Intercompany dividend . . . . . . . . . . . . . . . . . . . . . — (479) 479 —Net borrowing with Affiliates . . . . . . . . . . . . . . . . — 841 — (841) —Net cash provided by (used in) financing
activities. . . . . . . . . . . . . . . . . . . . . . . . . . . . . . . — 479 (481) (362) (364)
NET INCREASE (DECREASE) IN CASH ANDCASH EQUIVALENTS . . . . . . . . . . . . . . . . . . . . . . — (19) 7 — (12)
CASH AND CASH EQUIVALENTS, BEGINNINGOF YEAR . . . . . . . . . . . . . . . . . . . . . . . . . . . . . . . . . — 219 31 — 250
CASH AND CASH EQUIVALENTS, END OFYEAR . . . . . . . . . . . . . . . . . . . . . . . . . . . . . . . . . . . . $ — $ 200 $ 38 $ — $ 238
SEARS HOLDINGS CORPORATIONNotes to Consolidated Financial Statements—(Continued)
125

Condensed Consolidating Statement of Cash FlowsFor the Year Ended January 31, 2015
millions ParentGuarantor
Subsidiaries
Non-Guarantor
Subsidiaries Eliminations Consolidated
Net cash provided by (used in) operating activities $ 386 $ (2,229) $ 897 $ (441) $ (1,387)Proceeds from sales of property and investments . . — 358 66 — 424Purchases of property and equipment . . . . . . . . . . . — (229) (41) — (270)Sears Canada de-consolidation . . . . . . . . . . . . . . . . — — (207) — (207)Proceeds from Sears Canada rights offering . . . . . . 380 — — — 380Net investing with Affiliates . . . . . . . . . . . . . . . . . . (1,391) — (720) 2,111 —Net cash provided by (used in) investing activities. (1,011) 129 (902) 2,111 327Proceeds from debt issuances . . . . . . . . . . . . . . . . . 625 400 — — 1,025Repayments of long-term debt . . . . . . . . . . . . . . . . — (69) (11) — (80)Decrease in short-term borrowings, primarily 90days or less . . . . . . . . . . . . . . . . . . . . . . . . . . . . . . . — (1,117) — — (1,117)
Lands' End pre-separation funding . . . . . . . . . . . . . — 515 — — 515Separation of Lands' End, Inc. . . . . . . . . . . . . . . . . — (31) — (31)Debt issuance costs . . . . . . . . . . . . . . . . . . . . . . . . . — (27) — — (27)Intercompany dividend . . . . . . . . . . . . . . . . . . . . . . — — (441) 441 —
Net borrowing with Affiliates . . . . . . . . . . . . . . . . . — 2,111 — (2,111) —
Net cash provided by (used in) financing activities 625 1,782 (452) (1,670) 285Effect of exchange rate changes on cash and cash
equivalents. . . . . . . . . . . . . . . . . . . . . . . . . . . . . . — — (3) — (3)
NET DECREASE IN CASH AND CASHEQUIVALENTS . . . . . . . . . . . . . . . . . . . . . . . . . . . . . — (318) (460) — (778)
CASH AND CASH EQUIVALENTS, BEGINNINGOF YEAR . . . . . . . . . . . . . . . . . . . . . . . . . . . . . . . . . . — 537 491 — 1,028
CASH AND CASH EQUIVALENTS, END OF YEAR. $ — $ 219 $ 31 $ — $ 250
SEARS HOLDINGS CORPORATIONNotes to Consolidated Financial Statements—(Continued)
126

Sears Holdings Corporation Schedule II-Valuation and Qualifying Accounts Years 2016, 2015 and 2014
millions
Balance atbeginningof period
Additionscharged tocosts andexpenses (Deductions)
Balance atend of period
Allowance for Doubtful Accounts(1):2016 . . . . . . . . . . . . . . . . . . . . . . . . . . . . . . . . . . . . . . . . . $ 34 $ 9 $ (6) $ 372015 . . . . . . . . . . . . . . . . . . . . . . . . . . . . . . . . . . . . . . . . . 25 10 (1) 342014 . . . . . . . . . . . . . . . . . . . . . . . . . . . . . . . . . . . . . . . . . 32 2 (9) 25
Allowance for Deferred Tax Assets(2):2016 . . . . . . . . . . . . . . . . . . . . . . . . . . . . . . . . . . . . . . . . . 4,757 1,000 (238) 5,5192015 . . . . . . . . . . . . . . . . . . . . . . . . . . . . . . . . . . . . . . . . . 4,478 603 (324) 4,7572014 . . . . . . . . . . . . . . . . . . . . . . . . . . . . . . . . . . . . . . . . . 3,366 1,392 (280) 4,478__________________
(1) Charges to the account are for the purposes for which the reserves were created. (2) The valuation allowance increased primarily due to federal and state net operating losses incurred in 2016 and
decreased primarily due to pension liability and other federal and state deferred tax assets.
127
MANAGEMENT'S ANNUAL REPORT ON INTERNAL CONTROL OVER FINANCIAL REPORTING
The management of Sears Holdings Corporation is responsible for establishing and maintaining adequateinternal control over financial reporting. Internal control over financial reporting is a process designed by, or underthe supervision of, the Company's principal executive and principal financial officers and effected by the Company'sBoard of Directors, management and other personnel to provide reasonable assurance regarding the reliability offinancial reporting and the preparation of financial statements for external purposes in accordance with generallyaccepted accounting principles and includes those policies and procedures that:
• pertain to the maintenance of records that in reasonable detail accurately and fairly reflect thetransactions and dispositions of the assets of the Company;
• provide reasonable assurance that transactions are recorded as necessary to permit preparation offinancial statements in accordance with generally accepted accounting principles, and that receipts andexpenditures of the Company are being made only in accordance with authorizations of managementand directors of the Company; and
• provide reasonable assurance regarding prevention or timely detection of unauthorized acquisition, useor disposition of the Company's assets that could have a material effect on the financial statements.
Because of inherent limitations, internal control over financial reporting may not prevent or detectmisstatements. Projections of any evaluation of effectiveness to future periods are subject to the risks that controlsmay become inadequate because of changes in conditions, or that the degree of compliance with the policies orprocedures may deteriorate.
Management assessed the effectiveness of the Company's internal control over financial reporting atJanuary 28, 2017. In making its assessment, management used the criteria set forth in the Internal Control -Integrated Framework (2013) issued by the Committee of Sponsoring Organizations of the Treadway Commission("COSO"). The assessment included the documentation and understanding of the Company's internal control overfinancial reporting. Management evaluated the design effectiveness and tested the operating effectiveness of internalcontrols over financial reporting to form its conclusion.
Based on this evaluation, management concluded that, at January 28, 2017, the Company's internal controlover financial reporting is effective to provide reasonable assurance that the Company's financial statements arefairly presented in conformity with generally accepted accounting principles.
Deloitte & Touche LLP, independent registered public accounting firm, has reported on the effectiveness of theCompany's internal control over financial reporting at January 28, 2017, as stated in their report included herein.
128

REPORT OF INDEPENDENT REGISTERED PUBLIC ACCOUNTING FIRM
To the Board of Directors and Shareholders of Sears Holdings CorporationHoffman Estates, Illinois
We have audited the accompanying consolidated balance sheets of Sears Holdings Corporation andsubsidiaries (the "Company") as of January 28, 2017 and January 30, 2016, and the related consolidated statementsof operations, comprehensive loss, equity (deficit), and cash flows for each of the three fiscal years in the periodended January 28, 2017. Our audits also included the financial statement schedule listed in the Index at Item 8. Wealso have audited the Company's internal control over financial reporting as of January 28, 2017, based on criteriaestablished in Internal Control - Integrated Framework (2013) issued by the Committee of Sponsoring Organizationsof the Treadway Commission. The Company's management is responsible for these financial statements andfinancial statement schedule, for maintaining effective internal control over financial reporting, and for itsassessment of the effectiveness of internal control over financial reporting, included in the accompanyingManagement’s Annual Report on Internal Control over Financial Reporting. Our responsibility is to express anopinion on these financial statements and financial statement schedule and an opinion on the Company's internalcontrol over financial reporting based on our audits.
We conducted our audits in accordance with the standards of the Public Company Accounting OversightBoard (United States). Those standards require that we plan and perform the audit to obtain reasonable assuranceabout whether the financial statements are free of material misstatement and whether effective internal control overfinancial reporting was maintained in all material respects. Our audits of the financial statements includedexamining, on a test basis, evidence supporting the amounts and disclosures in the financial statements, assessing theaccounting principles used and significant estimates made by management, and evaluating the overall financialstatement presentation. Our audit of internal control over financial reporting included obtaining an understanding ofinternal control over financial reporting, assessing the risk that a material weakness exists, and testing andevaluating the design and operating effectiveness of internal control based on the assessed risk. Our audits alsoincluded performing such other procedures as we considered necessary in the circumstances. We believe that ouraudits provide a reasonable basis for our opinions.
A company's internal control over financial reporting is a process designed by, or under the supervision of,the company's principal executive and principal financial officers, or persons performing similar functions, andeffected by the company's board of directors, management, and other personnel to provide reasonable assuranceregarding the reliability of financial reporting and the preparation of financial statements for external purposes inaccordance with generally accepted accounting principles. A company's internal control over financial reportingincludes those policies and procedures that (1) pertain to the maintenance of records that, in reasonable detail,accurately and fairly reflect the transactions and dispositions of the assets of the company; (2) provide reasonableassurance that transactions are recorded as necessary to permit preparation of financial statements in accordancewith generally accepted accounting principles and that receipts and expenditures of the company are being madeonly in accordance with authorizations of management and directors of the company; and (3) provide reasonableassurance regarding prevention or timely detection of unauthorized acquisition, use, or disposition of the company'sassets that could have a material effect on the financial statements.
Because of the inherent limitations of internal control over financial reporting, including the possibility ofcollusion or improper management override of controls, material misstatements due to error or fraud may not beprevented or detected on a timely basis. Also, projections of any evaluation of the effectiveness of the internalcontrol over financial reporting to future periods are subject to the risk that the controls may become inadequatebecause of changes in conditions, or that the degree of compliance with the policies or procedures may deteriorate.
In our opinion, the consolidated financial statements referred to above present fairly, in all materialrespects, the financial position of Sears Holdings Corporation and subsidiaries as of January 28, 2017 and January30, 2016, and the results of their operations and their cash flows for each of the three fiscal years in the period endedJanuary 28, 2017, in conformity with accounting principles generally accepted in the United States of America.Also, in our opinion, such financial statement schedule, when considered in relation to the basic consolidated
129

financial statements taken as a whole, present fairly, in all material respects, the information set forth therein. Also,in our opinion, the Company maintained, in all material respects, effective internal control over financial reportingas of January 28, 2017, based on the criteria established in Internal Control - Integrated Framework (2013) issued bythe Committee of Sponsoring Organizations of the Treadway Commission.
/s/ DELOITTE & TOUCHE LLP
Deloitte & Touche LLPChicago, IllinoisMarch 21, 2017
130

Item 9. Changes in and Disagreements with Accountants on Accounting and Financial Disclosure None.
SEARS HOLDINGS CORPORATION
131
Item 9A. Controls and Procedures
Our management, with the participation of our principal executive and financial officers, conducted anevaluation of the effectiveness of the design and operation of our disclosure controls and procedures, as defined inRule 13a-15(e) under the Securities Exchange Act of 1934, as amended (the "Exchange Act"), as of the end of theperiod covered by this report (the "Evaluation Date"). Based on this evaluation, the principal executive and financialofficers concluded that, as of the Evaluation Date, our disclosure controls and procedures were effective in ensuringthat information required to be disclosed by us in the reports that we file or submit under the Exchange Act (i) isrecorded, processed, summarized and reported within the time periods specified in the SEC’s rules and forms and(ii) is accumulated and communicated to our management, including our principal executive and financial officers,as appropriate to allow timely decisions regarding required disclosure.
In addition, based on that evaluation, no changes in our internal control over financial reporting have occurredduring our last quarter that have materially affected, or are reasonably likely to materially affect, our internal controlover financial reporting.
Management's annual report on internal control over financial reporting and the report of our independentregistered public accounting firm appears in Part II, Item 8. Financial Statements and Supplementary Data of thisAnnual Report on Form 10-K.
Item 9B. Other Information
Not applicable.

PART III
132
Item 10. Directors, Executive Officers and Corporate Governance Information required by this Item 10 with respect to members of our Board of Directors and our Audit
Committee will be included under the headings "Election of Directors," "Election of Directors - Committees of theBoard of Directors," and "Corporate Governance - Director Independence" of our definitive proxy statement for ourannual meeting of stockholders to be held on May 10, 2017 (the "2017 Proxy Statement") and is incorporated hereinby reference. Information required by this Item 10 with respect to Section 16(a) beneficial ownership reportingcompliance will be included under the heading "Other Information - Section 16(a) Beneficial Ownership ReportingCompliance" of the 2017 Proxy Statement and is incorporated herein by reference.
The information required by this Item 10 regarding the Company's executive officers is set forth under theheading Executive Officers of the Registrant in Part I of this Annual Report on Form 10-K and is incorporatedherein by reference.
Holdings has adopted a Code of Conduct, which applies to all employees, including our principal executiveofficer, principal financial officer and principal accounting officer, and a Code of Conduct for its Board of Directors.Directors who are also officers of Holdings are subject to both codes of conduct. Each code of conduct is a code ofethics as defined in Item 406 of SEC Regulation S-K. The codes of conduct are available in the "Investors -Corporate Governance" section of our website at www.searsholdings.com. Any amendment to, or waiver from, aprovision of the codes of conduct will be posted to the above-referenced website.
There were no material changes to the process by which stockholders may recommend nominees to the Boardof Directors during the last year.
Item 11. Executive Compensation Information regarding executive and director compensation will be included under the headings "Executive
Compensation," "Compensation of Directors," and "Compensation Committee Report" of the 2017 Proxy Statementand is incorporated herein by reference.
Item 12. Security Ownership of Certain Beneficial Owners and Management and Related StockholderMatters
Information regarding security ownership of certain beneficial owners and management will be included underthe heading "Amount and Nature of Beneficial Ownership" of the 2017 Proxy Statement and is incorporated hereinby reference.
See also Equity Compensation Plan Information in Item 5 of this Report for a discussion of securitiesauthorized for issuance under equity compensation plans.
Item 13. Certain Relationships and Related Transactions, and Director Independence Information regarding certain relationships and related transactions and director independence will be included
under the headings "Certain Relationships and Transactions," "Review and Approval of Transactions with RelatedPersons" and "Corporate Governance" of the 2017 Proxy Statement and is incorporated herein by reference.
Item 14. Principal Accounting Fees and Services Information regarding principal accountant fees and services will be included under the heading "Independent
Registered Public Accounting Firm Fees" of the 2017 Proxy Statement and is incorporated herein by reference.

PART IV
133
Item 15. Exhibits, Financial Statement Schedules (a) The following documents are filed as part of this report:
1. Financial Statements
Financial statements filed as part of this Annual Report on Form 10-K are listed under Item 8.
2. Financial Statement Schedule
The financial statement schedule filed as part of this Annual Report on Form 10-K is listed under Item 8.
The separate financial statements and summarized financial information of majority-owned subsidiaries notconsolidated and of 50% or less owned persons have been omitted because they are not required pursuant toconditions set forth in Rules 3-09 and 1-02(w) of Regulation S-X.
All other schedules have been omitted because they are not required under the instructions contained inRegulation S-X because the information called for is contained in the financial statements and notes thereto.
(b) Exhibits An "Exhibit Index" has been filed as part of this Report beginning on Page E-1 and is incorporated herein by
this reference.
Certain of the agreements incorporated by reference into this report contain representations and warranties andother agreements and undertakings by us and third parties. These representations and warranties, agreements andundertakings have been made as of specific dates, may be subject to important qualifications and limitations agreedto by the parties to the agreement in connection with negotiating the terms of the agreement, and have been includedin the agreement for the purpose of allocating risk between the parties to the agreement rather than to establishmatters as facts. Any such representations and warranties, agreements, and undertakings have been made solely forthe benefit of the parties to the agreement and should not be relied upon by any other person.
Item 16. Form 10-K Summary
None.

SIGNATURES
Pursuant to the requirements of Section 13 or 15(d) of the Securities Exchange Act of 1934, the registrant hasduly caused this report to be signed on its behalf by the undersigned, thereunto duly authorized.
SEARS HOLDINGS CORPORATION
By: /S/ ROBERT A. RIECKER Name: Robert A. Riecker
Title: Controller and Head of Capital Market Activities
Date: March 21, 2017
Pursuant to the requirements of the Securities Exchange Act of 1934, this report has been signed below by thefollowing persons on behalf of the registrant and in the capacities stated and on the dates indicated.
/S/ EDWARD S. LAMPERT Director, Chairman of the Board ofDirectors, and Chief Executive Officer(principal executive officer)
March 21, 2017Edward S. Lampert
/S/ JASON M. HOLLAR Chief Financial Officer (principal financialofficer)
March 21, 2017Jason M. Hollar
/S/ ROBERT A. RIECKER Controller and Head of Capital MarketActivities (principal accounting officer)
March 21, 2017Robert A. Riecker
/S/ CESAR L. ALVAREZ Director March 21, 2017Cesar L. Alvarez
/S/ BRUCE R. BERKOWITZ Director March 21, 2017Bruce R. Berkowitz
/S/ PAUL G. DEPODESTA Director March 21, 2017Paul G. DePodesta
/S/ KUNAL S. KAMLANI Director March 21, 2017Kunal S. Kamlani
/S/ WILLIAM C. KUNKLER, III Director March 21, 2017William C. Kunkler, III
/S/ ANN N. REESE Director March 21, 2017Ann N. Reese
/S/ THOMAS J. TISCH Director March 21, 2017Thomas J. Tisch
134

EXHIBIT INDEX
2.1 Purchase and Sale Agreement, dated as of January 5, 2017, by and between Sears HoldingsCorporation and Stanley Black & Decker, Inc. (incorporated by reference to Exhibit 2.1 to Registrant’sCurrent Report on Form 8-K, dated January 5, 2017, filed on January 10, 2017 (File No. 001-36693)).
3.1 Restated Certificate of Incorporation (incorporated by reference to Exhibit 3.1 to Registrant's CurrentReport on Form 8-K, dated March 24, 2005, filed on March 24, 2005 (File No. 000-51217)).
3.2 Amended and Restated By-Laws (incorporated by reference to Exhibit 3.2 to Registrant's CurrentReport on Form 8-K, dated January 22, 2014, filed on January 24, 2014 (File No. 000-51217)).
4.1 Registrant hereby agrees to furnish to the Commission, upon request, the instruments defining therights of holders of each issue of long-term debt of Registrant and its consolidated subsidiaries.
4.2 Indenture, dated as of October 12, 2010, among Sears Holdings Corporation, the guarantors partythereto and Wells Fargo Bank, National Association, as Trustee and Collateral Agent (incorporated byreference to Exhibit 4.1 to Registrant's Current Report on Form 8-K, dated October 12, 2010, filed onOctober 15, 2010 (File No. 000-51217)).
4.3 Security Agreement, dated as of October 12, 2010, among Sears Holdings Corporation, the guarantorsparty thereto and Wells Fargo Bank, National Association, as Collateral Agent (incorporated byreference to Exhibit 4.2 to Registrant's Current Report on Form 8-K, dated October 12, 2010, filed onOctober 15, 2010 (File No. 000-51217)).
4.4 First Amendment to Security Agreement, dated as of September 1, 2016, between Sears HoldingsCorporation, the other Grantors party thereto and Wilmington Trust, National Association, as collateralagent (incorporated by reference to Exhibit 10.2 to Registrant's Current Report on Form 8-K, datedSeptember 1, 2016, filed on September 2, 2016 (File No. 001-36693)).
4.5 Amended and Restated Intercreditor Agreement, dated as of September 1, 2016, by and among Bank ofAmerica, N.A. and Wells Fargo Bank, National Association as ABL Agents, and Wilmington Trust,National Association, as trustee (incorporated by reference to Exhibit 10.3 to Registrant’s CurrentReport on Form 8-K, dated September 1, 2016, filed on September 2, 2016 (File No. 001-36693)).
4.6 Registration Rights Agreement, dated as of October 12, 2010, by and among Sears HoldingsCorporation and the guarantors party thereto and Banc of America Securities LLC (incorporated byreference to Exhibit 4.4 to Registrant's Current Report on Form 8-K, dated October 12, 2010, filed onOctober 15, 2010 (File No. 000-51217)).
4.7 Registration Rights Agreement, dated as of October 12, 2010, by and among Sears HoldingsCorporation and the guarantors party thereto, Sears Holdings Corporation Investment Committee onbehalf of the Sears Holdings Pension Plan and Sears Holdings Pension Trust (incorporated byreference to Exhibit 4.5 to Registrant's Current Report on Form 8-K, dated October 12, 2010, filed onOctober 15, 2010 (File No. 000-51217)).
4.8 Indenture, dated as of November 21, 2014, by and between Sears Holdings Corporation andComputershare Trust Company, N.A., as Trustee (incorporated by reference to Exhibit 4.1 toRegistrant’s Current Report on Form 8-K, dated November 21, 2014, filed on November 21, 2014 (FileNo. 001-36693)).
4.9 First Supplemental Indenture, dated as of November 21, 2014, by and between Sears HoldingsCorporation and Computershare Trust Company, N.A., as Trustee (including form of note)(incorporated by reference to Exhibit 4.2 to Registrant’s Current Report on Form 8-K, dated November21, 2014, filed on November 21, 2014 (File No. 001-36693)).
4.10 Warrant Agreement, dated as of November 21, 2014, by and between Sears Holdings Corporation,Computershare Inc. and Computershare Trust Company, N.A., as Warrant Agent (including form ofwarrant certificate) (incorporated by reference to Exhibit 4.3 to Registrant’s Current Report on Form 8-K, dated November 21, 2014, filed on November 21, 2014 (File No. 001-36693)).
E-1

10.1 Guarantee executed by Sears, Roebuck and Co. under the Indenture, dated as of May 15, 1995,between Sears Roebuck Acceptance Corp. and JP Morgan Chase Bank (successor to The ChaseManhattan Bank, N.A.), as supplemented by the First Supplemental Indenture, dated as ofNovember 3, 2003 (incorporated by reference to Exhibit 4(g) to Sears Roebuck Acceptance Corp.'sQuarterly Report on Form 10-Q for the fiscal quarter ended September 27, 2003 (File No.001-04040)).
10.2 Guarantee executed by Sears, Roebuck and Co. under the Indenture, dated as of October 1, 2002,between Sears Roebuck Acceptance Corp. and BNY Midwest Trust Company, as supplemented by theFirst Supplemental Indenture, dated as of November 3, 2003 (incorporated by reference to Exhibit 4(h)to Sears Roebuck Acceptance Corp.'s Quarterly Report on Form 10-Q for the fiscal quarter endedSeptember 27, 2003 (File No. 001-04040)).
10.3 Guarantee, dated as of November 3, 2003, by Sears, Roebuck and Co. of the commercial paper masternotes of Sears Roebuck Acceptance Corp. (incorporated by reference to Exhibit 10.38 to Sears,Roebuck and Co.'s Annual Report on Form 10-K for the fiscal year ended January 3, 2004 (FileNo. 001-00416)).
10.4 Third Amended and Restated Credit Agreement, dated as of July 21, 2015, between Sears HoldingsCorporation, Sears Roebuck Acceptance Corp. and Kmart Corporation, the lenders party thereto, andBank of America, N.A., as agent (incorporated by reference to Exhibit 10.2 to Registrant’s QuarterlyReport on Form 10-Q for the fiscal quarter ended August 1, 2015 (File No. 001-36693)) (1)
10.5 First Amendment to Third Amended and Restated Credit Agreement, dated April 8, 2016, by andamong Sears Holdings Corporation, Sears Roebuck Acceptance Corp., Kmart Corporation, the lendersparty thereto and Bank of America, N.A., as agent (incorporated by reference to Exhibit 10.2 toRegistrant’s Current Report on Form 8-K, dated April 8, 2016, filed on April 12, 2016 (File No.001-36693)).
*10.6 Second Amendment to Third Amended and Restated Credit Agreement, dated February 10, 2017, byand among Sears Holdings Corporation, Sears Roebuck Acceptance Corp., Kmart Corporation, thelenders party thereto and Bank of America, N.A., as agent.
10.7 Confirmation, Ratification and Amendment of Ancillary Loan Documents, dated April 8, 2016, by andamong Sears Holdings Corporation, Sears Roebuck Acceptance Corp., Kmart Corporation, certain oftheir respective subsidiaries and Bank of America, N.A., as administrative agent for its own benefit andthe benefit of the other Credit Parties (as defined in the amendment to the Credit Agreement)(incorporated by reference to Exhibit 10.3 to Registrant’s Current Report on Form 8-K, dated April 8,2016, filed on April 12, 2016 (File No. 001-36693)).
10.8 Third Amended and Restated Guarantee and Collateral Agreement, dated as of July 21, 2015, amongSears Holdings Corporation, Sears, Roebuck and Co., Sears Roebuck Acceptance Corp., KmartHolding Corporation, Kmart Corporation and certain of their respective subsidiaries, as Grantors, andBank of America, N.A., Wells Fargo Bank, National Association and General Electric CapitalCorporation, as Co-Collateral Agents (incorporated by reference to Exhibit 10.3 to Registrant’sQuarterly Report on Form 10-Q for the fiscal quarter ended August 1, 2015 (File No. 001-36693)).
10.9 Loan Agreement, dated as of September 15, 2014, by and between Sears, Roebuck and Co., SearsDevelopment Co., Kmart Corporation, JPP II, LLC and JPP, LLC (incorporated by reference to Exhibit10.1 to Registrant’s Quarterly Report on Form 10-Q for the fiscal quarter ended November 1, 2014(File No. 001-36693)).
10.10 Guaranty, dated as of September 15, 2014, by and between Sears Holdings Corporation, JPP II, LLCand JPP, LLC (incorporated by reference to Exhibit 10.2 to Registrant’s Quarterly Report on Form 10-Q for the fiscal quarter ended November 1, 2014 (File No. 001-36693)).
10.11 Amendment to Loan Agreement, dated as of February 25, 2015, by and between JPP II, LLC, JPP,LLC, Sears Roebuck and Co., Sears Development Co. and Kmart Corporation (incorporated byreference to Exhibit 10.1 to Registrant’s Current Report on Form 8-K, dated February 26, 2015, filedon February 26, 2015 (File No. 001-36693)).
E-2

10.12 Purchase, Sale and Servicing Transfer Agreement, dated as of July 15, 2003, by and among Sears,Roebuck and Co., Sears Financial Holding Corporation, Sears National Bank, Sears Roebuck dePuerto Rico, Inc., Sears Life Holding Corp., SRFG, Inc., Sears Intellectual Property ManagementCompany and Citicorp (incorporated by reference to Exhibit 10.1 to Sears, Roebuck and Co.'s CurrentReport on Form 8-K, dated July 15, 2003, filed on July 17, 2003 (File No. 001-00416)).
10.13 Amendment No. 1, dated as of November 3, 2003, to the Purchase, Sale and Servicing TransferAgreement, by and among Sears, Roebuck and Co., certain subsidiaries of Sears, Roebuck and Co. andCiticorp (incorporated by reference to Exhibit 2(b) to Sears, Roebuck and Co.'s Quarterly Report onForm 10-Q for the fiscal quarter ended September 27, 2003 (File No. 001-00416)).
10.14 Sears Holdings Corporation Director Compensation Program, as amended (incorporated by referenceto Exhibit 10.5 to Registrant's Quarterly Report on Form 10-Q for the fiscal quarter ended May 1, 2010(File No. 000-51217)).**
10.15 Sears Holdings Corporation 2006 Stock Plan, as amended (incorporated by reference to Appendix C toRegistrant's Proxy Statement dated March 15, 2006 (File No. 000-51217)).**
10.16 Sears Holdings Corporation 2013 Stock Plan (incorporated by reference to Appendix A to Registrant'sProxy Statement dated March 28, 2013 (File No. 000-51217)).**
10.17 Sears Holdings Corporation Amended and Restated Umbrella Incentive Program (incorporated byreference to Appendix C to Registrant's Proxy Statement dated March 28, 2013 (File No.000-51217)).**
10.18 Amendment to the Performance Measures under the Amended and Restated Sears HoldingsCorporation Umbrella Incentive Program (incorporated by reference to Appendix B to Registrant'sProxy Statement dated March 28, 2013 (File No. 000-51217)).**
10.19 Form of Sears Holdings Corporation Restricted Stock Award Agreement (incorporated by reference toExhibit 10.1 to Registrant's Quarterly Report on Form 10-Q for the fiscal quarter ended July 30, 2011(File No. 000-51217)).**
10.20 Form of Sears Holdings Corporation Restricted Stock Award Agreement: Terms and Conditions(incorporated by reference to Exhibit 10.17 to Registrant’s Annual Report on Form 10-K for the fiscalyear ended February 1, 2014 (File No. 000-51217)).**
10.21 Form of Sears Holdings Corporation Restricted Stock Unit Award Agreement: Terms and Conditions(incorporated by reference to Exhibit 10.18 to Registrant’s Annual Report on Form 10-K for the fiscalyear ended February 1, 2014 (File No. 000-51217)).**
10.22 Form of Cash Right - Addendum to Restricted Stock Award Agreement (incorporated by reference toExhibit 10.17 to Registrant's Annual Report on Form 10-K for the fiscal year ended January 28, 2012(File No. 000-51217)).**
10.23 Form of Cash Award - Addendum to Restricted Stock Award Agreement (incorporated by reference toExhibit 10.1 to Registrant's Current Report on Form 8-K, dated September 28, 2012, filed onSeptember 28, 2012 (File No. 000-51217)).**
10.24 Form of Cash Award - Addendum to Restricted Stock Award Agreement (incorporated by reference toExhibit 10.1 to Registrant's Current Report on Form 8-K, dated November 30, 2012, filed onNovember 30, 2012 (File No. 000-51217)).**
10.25 Sears Holdings Corporation Long-Term Incentive Program, effective April 27, 2011 (incorporated byreference to Exhibit 10.2 to Registrant's Quarterly Report on Form 10-Q for the fiscal quarter endedApril 30, 2011 (File No. 000-51217)).**
10.26 Sears Holdings Corporation Cash Long-Term Incentive Plan (Amended and Restated Effective April10, 2015) (incorporated by reference to Exhibit 10.3 to Registrant's Quarterly Report on Form 10-Q forthe fiscal quarter ended May 2, 2015 (File No. 001-36693)).**
10.27 Sears Holdings Corporation Annual Incentive Plan (Amended and Restated Effective April 10, 2015)(incorporated by reference to Exhibit 10.1 to Registrant's Quarterly Report on Form 10-Q for the fiscalquarter ended May 2, 2015 (File No. 001-36693)).**
E-3

10.28 2015 Additional Definitions under Sears Holdings Corporation Annual Incentive Plan (incorporated byreference to Exhibit 10.2 to Registrant's Quarterly Report on Form 10-Q for the fiscal quarter endedMay 2, 2015 (File No. 001-36693)).**
10.29 2013 Additional Definitions under Sears Holdings Corporation Long-Term Incentive Program(incorporated by reference to Exhibit 10.3 to Registrant's Current Report on Form 8-K, dated February12, 2013, filed on February 19, 2013 (File No. 000-51217)).**
10.30 2014 Additional Definitions under Sears Holdings Corporation Long-Term Incentive Program(incorporated by reference to Exhibit 10.3 to Registrant’s Quarterly Report on Form 10-Q for the fiscalquarter ended May 3, 2014 (File No. 000-51217)).**
10.31 2015 Additional Definitions under Sears Holdings Corporation Long-Term Incentive Program(incorporated by reference to Exhibit 10.4 to Registrant’s Quarterly Report on Form 10-Q for the fiscalquarter ended May 2, 2015 (File No. 001-36693)).**
10.32 Form of LTIP Award Agreement (incorporated by reference to Exhibit 10.32 to Registrant's AnnualReport on Form 10-K for the fiscal year ended January 31, 2015 (File No. 001-36693).**
10.33 Form of Cash Award - Addendum to Restricted Stock Award(s) (Lands’ End Make-Whole)(incorporated by reference to Exhibit 10.4 to Registrant’s Quarterly Report on Form 10-Q for the fiscalquarter ended May 3, 2014 (File No. 000-51217)).**
10.34 Form of Cash Award - Addendum to Restricted Stock Unit Award(s) (Lands’ End Make-Whole)(incorporated by reference to Exhibit 10.5 to Registrant’s Quarterly Report on Form 10-Q for the fiscalquarter ended May 3, 2014 (File No. 000-51217)).**
10.35 Form of Cash Award - Addendum to Restricted Stock Award Agreement (incorporated by reference toExhibit 10.1 to Registrant’s Current Report on Form 8-K, dated October 22, 2014, filed on October 22,2014 (File No. 001-36693)).**
10.36 Form of Cash Right - Addendum to Restricted Stock Award Agreement (incorporated by reference toExhibit 10.1 to Registrant’s Current Report on Form 8-K, dated November 7, 2014, filed on November7, 2014 (File No. 001-36693)).**
10.37 Form of Cash Right - Addendum to Restricted Stock Award(s) and Restricted Stock Unit Awards(Seritage Make-Whole).**
10.38 Form of Executive Severance Agreement (incorporated by reference to Exhibit 10.29 to Registrant’sAnnual Report on Form 10-K for the fiscal year ended February 1, 2014 (File No. 000-51217)).**
10.39 Form of letter from Registrant to Edward S. Lampert relating to employment dated March 18, 2013(incorporated by reference to Exhibit 10.30 to Registrant's Annual Report on Form 10-K for the fiscalyear ended February 2, 2013 (File No. 000-51217)).**
10.40 Addendum, dated as of April 21, 2014, to letter from Registrant to Edward S. Lampert relating toemployment dated March 18, 2013 (Lands’ End Make-Whole) (incorporated by reference to Exhibit10.6 to Registrant’s Quarterly Report on Form 10-Q for the fiscal quarter ended May 3, 2014 (File No.000-51217)).**
10.41 Letter Agreement, dated January 28, 2016, by and between the Company and Edward S. Lampert(incorporated by reference to Exhibit 10.1 to Registrant’s Current Report on Form 8-K, dated January28, 2016, filed on February 3, 2016 (File No. 001-36693)).**
10.42 Letter from Registrant to Jeffrey A. Balagna relating to employment dated April 26, 2013 (incorporatedby reference to Exhibit 10.31 to Registrant’s Annual Report on Form 10-K for the fiscal year endedFebruary 1, 2014 (File No. 000-51217)).**
10.43 Letter from Registrant to Girish Lakshman relating to employment dated June 11, 2015 (incorporatedby reference to Exhibit 10.42 to Registrant’s Annual Report on Form 10-K for the fiscal year endedJanuary 30, 2016 (File No. 001-36693)).**
E-4

10.44 Letter from Registrant to Leena Munjal relating to employment dated June 2, 2011, as supplementedOctober 17, 2012 and May 5, 2015 (incorporated by reference to Exhibit 10.43 to Registrant’s AnnualReport on Form 10-K for the fiscal year ended January 30, 2016 (File No. 001-36693)).**
*10.45 Letter from Registrant to Sean Skelley relating to employment dated September 24, 2015.**
*10.46 Letter from Registrant to Stephan Zoll relating to employment dated March 23, 2016.**
*10.47 Executive Severance Agreement, dated March 24, 2016, by and between the Company and StephanZoll.**
10.48 Letter from Registrant to Jason M. Hollar relating to employment dated as of September 18, 2014(incorporated by reference to Exhibit 10.4 to Registrant’s Quarterly Report on Form 10-Q for the fiscalquarter ended October 29, 2016 (File No. 001-36693)).**
10.49 Letter from Registrant to Jason M. Hollar relating to employment dated as of October 13, 2016(incorporated by reference to Exhibit 10.1 to Registrant’s Current Report on Form 8-K, dated October13, 2016, filed on October 14, 2016 (File No. 001-36693)).**
10.50 Letter from Registrant to Robert A. Schriesheim relating to employment dated August 15, 2011(incorporated by reference to Exhibit 10.2 to Registrant's Quarterly Report on Form 10-Q for the fiscalquarter ended July 30, 2011(File No. 000-51217)).**
10.51 Executive Severance Agreement, dated and effective as of August 16, 2011, between Sears HoldingsCorporation and its affiliates and subsidiaries and Robert A. Schriesheim (incorporated by reference toExhibit 10.3 to Registrant's Quarterly Report on Form 10-Q for the fiscal quarter ended July 30, 2011(File No. 000-51217)).**(1)
10.52 Master Lease by and among Seritage SRC Finance LLC, Seritage KMT Finance LLC, KmartOperations, LLC, and Sears Operations, LLC, dated as of July 7, 2015 (incorporated by reference toExhibit 10.1 to Registrant's Current Report on Form 8-K, dated July 7, 2015, filed on July 13, 2015(File No. 001-36693)).
10.53 Pension Plan Protection and Forbearance Agreement, dated as of March 18, 2016, by and betweenSears Holdings Corporation, certain of its subsidiaries and Pension Benefit Guaranty Corporation(incorporated by reference to Exhibit 10.1 to Registrant’s Current Report on Form 8-K, dated March18, 2016, filed on March 24, 2016).
10.54 Consent, Waiver and Amendment, dated as of March 8, 2017, by and between Sears HoldingsCorporation, certain of its subsidiaries and Pension Benefit Guaranty Corporation (incorporated byreference to Exhibit 10.2 to Registrant’s Current Report on Form 8-K, dated March 8, 2017, filedMarch 9, 2017 (File No. 001-36693)).
10.55 Loan Agreement, dated April 8, 2016, by and among JPP, LLC, JPP II, LLC, Cascade Investment,L.L.C., Sears, Roebuck and Co., Sears Development Co., Innovel Solutions, Inc., Big Beaver ofFlorida Development, LLC and Kmart Corporation (incorporated by reference to Exhibit 10.1 toRegistrant’s Current Report on Form 8-K, dated April 8, 2016, filed on April 12, 2016 (File No.001-36693)).
10.56 Second Lien Credit Agreement, dated as of September 1, 2016, between Sears Holdings Corporation,Sears Roebuck Acceptance Corp. and Kmart Corporation, the lenders party thereto, and JPP, LLC, asadministrative agent and collateral administrator (incorporated by reference to Exhibit 10.1 toRegistrant's Current Report on Form 8-K, dated September 1, 2016, filed on September 2, 2016 (FileNo. 001-36693)).
10.57 Letter of Credit and Reimbursement Agreement, dated as of December 28, 2016, among SearsHoldings Corporation, Sears Roebuck Acceptance Corp., Kmart Corporation, the financial institutionsparty thereto from time to time as L/C Lenders, and Citibank, N.A., as Administrative Agent andIssuing Bank (incorporated by reference to Exhibit 10.1 to Registrant’s Current Report on Form 8-K,dated December 28, 2016, filed on December 30, 2016 (File No. 001-36693)).
E-5
__________________ * Filed herewith
** A management contract or compensatory plan or arrangement required to be filed as an exhibit to this reportpursuant to Item 15(b) of Form 10-K.
(1) Confidential treatment was granted as to omitted portions of this Exhibit. The omitted material has been filedseparately with the Securities and Exchange Commission.
(2) Portions omitted pursuant to a request for confidential treatment. The omitted material has been filedseparately with the Securities and Exchange Commission.
10.58 Loan Agreement, dated as of January 3, 2017, among Sears Roebuck and Co., Kmart Stores of IllinoisLLC, Kmart of Washington LLC and Kmart Corporation, collectively as borrower, and JPP, LLC andJPP II, LLC, collectively as initial lender (incorporated by reference to Exhibit 10.1 to Registrant’sCurrent Report on Form 8-K, dated January 3, 2017, filed on January 4, 2017 (File No. 001-36693)).
*10.59 Omnibus Amendment to Loan Documents and Request for Advance to Loan Agreement, dated as ofJanuary 3, 2017 among Sears Roebuck and Co., Kmart Stores of Illinois LLC, Kmart of WashingtonLLC and Kmart Corporation, collectively as borrower, and JPP, LLC and JPP II, LLC, collectively asinitial lender.
*10.60 First Amendment dated March 2, 2017, to Letter of Credit and Reimbursement Agreement, dated as ofDecember 28, 2016, among Sears Holdings Corporation, Sears Roebuck Acceptance Corp., KmartCorporation, the financial institutions party thereto from time to time as L/C Lenders, and Citibank,N.A., as Administrative Agent and Issuing Bank.
10.61 Acquired IP License Agreement, dated as of March 8, 2017, by and between Sears HoldingsCorporation and Stanley Black & Decker, Inc. (incorporated by reference to Exhibit 10.1 toRegistrant’s Current Report on Form 8-K, dated March 8, 2017, filed March 9, 2017 (File No.001-36693)).
*12 Computation of ratio of earnings to fixed charges for Registrant and consolidated subsidiaries.
*21 Subsidiaries of the Registrant.
*23 Consent of Deloitte & Touche LLP.
*31.1 Certifications of Chief Executive Officer Pursuant to Section 302 of the Sarbanes-Oxley Act of 2002.
*31.2 Certifications of Chief Financial Officer Pursuant to Section 302 of the Sarbanes-Oxley Act of 2002.
*32.1 Certification of Chief Executive Officer Pursuant to 18 U.S.C. Section 1350, as adopted pursuant toSection 906 of the Sarbanes-Oxley Act of 2002.
*32.2 Certification of Chief Financial Officer Pursuant to 18 U.S.C. Section 1350, as adopted pursuant toSection 906 of the Sarbanes-Oxley Act of 2002.
101 The following financial information from the Annual Report on Form 10-K for the fiscal year endedJanuary 28, 2017, formatted in XBRL (eXtensible Business Reporting Language) and furnishedelectronically herewith: (i) the Consolidated Statements of Operations for the fiscal years endedJanuary 28, 2017, January 30, 2016 and January 31, 2015; (ii) the Consolidated Statements ofComprehensive Loss for the fiscal years ended January 28, 2017, January 30, 2016 and January 31,2015; (iii) the Consolidated Balance Sheets at January 28, 2017 and January 30, 2016; (iv) theConsolidated Statements of Cash Flows for the fiscal years ended January 28, 2017, January 30, 2016and January 31, 2015; (v) the Consolidated Statements of Equity (Deficit) for the fiscal years endedJanuary 28, 2017, January 30, 2016 and January 31, 2015; and (vi) the Notes to Consolidated FinancialStatements, tagged as blocks of text and including detailed tags.
E-6