seasonal variations of titan's brightness
TRANSCRIPT

Seasonal Variations of Titan's BrightnessEllen C. Creecy1, L. Li2 , X. Jiang1 , C.A. Nixon3, R.A. West4 , and M.E. Kenyon4
1Department of Earth and Atmospheric Sciences, University of Houston, Houston, TX, USA, 2Department of Physics,University of Houston, Houston, TX, USA, 3NASA Goddard Space Flight Center, Greenbelt, MD, USA, 4Jet PropulsionLaboratory, California Institute of Technology, Pasadena, CA, USA
Abstract The absolute brightness of astronomical bodies can be represented by the emitted power,which plays important roles in their radiated energy budgets. The Cassini observations include threeseasons of Titan, which provides an unprecedented opportunity to examine the seasonal variationsof Titan's emitted power. Our analyses show that Titan's emitted power displays different seasonalbehaviors between the Northern Hemisphere and the Southern Hemisphere. The global‐average emittedpower decreased by 6.8 ± 0.4% during the Cassini period (2004–2017). Such a temporal variationrepresents the magnitude of the seasonal cycle of Titan's emitted power, which is at least one order ofmagnitude stronger than the seasonal variation of Earth's emitted power (<0.5%). More importantly,the ~6.8% decrease of the emitted power is much smaller than the ~18.6% decrease of the solar flux fromthe change of Sun‐Titan distance, implying a significantly dynamical energy budget on Titan.
1. Introduction
The absolute brightness of astronomical bodies is referred to as luminosity, which is further defined as thetotal emitted power. For planets and satellites, the emitted power can be combined with the absorbed solarenergy to determine the radiated energy budgets for these bodies (Conrath et al., 1989; Hanel et al., 2003).The radiant energy budget is one important factor determining weather and climate for planets and satelliteswith atmospheres (Peixoto &Oort, 1992). Gas giant planets have a large imbalance of the emitted energy ver-sus the absorbed energy (Conrath et al., 1989; Ingersoll, 1990), which is due to internal heat left over fromformation (Guillot et al., 2004; Hubbard, 1968, 1980; Stevenson & Salpeter, 1977). For terrestrial bodies, suchas Earth, the emitted energy and the absorbed energy are roughly balanced (Kiehl & Trenberth, 1997;Trenberth et al., 2009), but a small energy imbalance is possible (Hansen et al., 2005, 2011; Li et al., 2011;Trenberth et al., 2014; Trenberth & Fasullo, 2010). Such a small imbalance has large impacts on weatherand climate of terrestrial bodies (Hansen et al., 2005, 2011; Trenberth et al., 2014; Trenberth & Fasullo,2010). Earth's energy budget has been extensively researched, but the energy budgets of other terrestrialbodies are not as well known.
Titan, the only satellite with a significant atmosphere in our solar system, shares many atmospheric andsurface characteristics with Earth. Here, we examine the seasonal variations of Titan's emitted power andsuggest a possible energy imbalance on the satellite. One factor affecting Titan's emitted power is the solarflux. The solar flux at Titan varies with time as the satellite accompanies Saturn along its orbital path aroundthe Sun. Titan has an elliptical orbit around the Sun with an eccentricity ~0.057. Such a large eccentricitymeans that the solar flux at the distance of Titan decreases ~20% from the perihelion to the aphelion onits orbital path. The varying solar flux will modify the thermal structure of Titan's atmosphere via radiativeprocesses (Achterberg et al., 2011; Mitchell, 2012), which in turn affects the emitted power from Titan.
Based on the observations recorded by the composite infrared spectrometer (CIRS) onboard the Cassinispacecraft, we have already explored Titan's emitted power (Li, 2015; Li et al., 2011). Our recent study(Li, 2015), which is based on the CIRS data in 3 years (i.e., 2007, 2009, 2012/13), cannot resolve the seasonalvariations. Here, we measure Titan's emitted power in the complete period of the Cassini mission(2004–2017). The long‐term continuous observations from the Cassini spacecraft provide an unprecedentedopportunity to examine the seasonal variations of Titan's emitted power over half a Titan year. Moreimportantly, the comparison of seasonal variations between the emitted power and the solar flux suggestsa possible energy imbalance on Titan.
©2019. American Geophysical Union.All Rights Reserved.
RESEARCH LETTER10.1029/2019GL084833
Key Points:• The seasonal variations of Titan's
emitted power are examined for thefirst time.
• The seasonal cycle of theglobal‐average emitted power is atleast one order of magnitudestronger on Titan than on Earth.
• The comparison of seasonal cyclebetween emitted power and solarflux suggests a significantlydynamical energy budget on Titan.
Supporting Information:• Supporting Information S1
Correspondence to:L. Li,[email protected]
Citation:Creecy, E. C., Li, L., Jiang, X., Nixon,C. A., West, R. A., & Kenyon, M. E.(2019). Seasonal variations of titan'sbrightness. Geophysical ResearchLetters, 46,https://doi.org/10.1029/2019GL084833
Received 1 AUG 2019Accepted 1 NOV 2019Accepted article online 9 NOV 2019
CREECY ET AL. 13,649
13,649–13,657.
Published online 2 DEC 2019

2. Data and Method
The thermal spectra, which were acquired by Cassini/CIRS (Flasar et al., 2004), are used to compute theemitted power of Titan. We examine all CIRS data from 2004 to 2017, which are available on thePlanetary Data System. The average time of the CIRS data in each year and the corresponding solarlongitude, subsolar latitude, and Sun‐Titan distance are summarized in supporting information, Table S1.The data from 2004 and 2005 are grouped together because the Cassini recorded high‐quality data in 3months (October–December) only in 2004. From 2004–05 to 2017 the solar longitude changed from 304.4°to 90.4°, and the subsolar latitude changed from 21.5°S to 26.7°N. Table S1 shows that the Cassini period cov-ers almost one half Saturnian year, which includes one complete season (spring in the Northern Hemisphere[NH]) and parts of two seasons (winter and summer in the NH). Therefore, the Cassini observations make itpossible to examine the seasonal variations of Titan's emitted power over a half Titan year.
Table S1 also shows that the distance between the Sun and Titan increased from 9.07 AU in 2004–05 to 10.05AU in 2017. During the Cassini period of 2004–2017, Titan moved from a position close to the perihelion(July, 2003) to a position close to the aphelion (March, 2018) on its orbit around the Sun. The variationsof Sun‐Titan distance cause the solar flux to vary from the maximum to the minimum roughly during theCassini period. Therefore, we can examine the response of Titan's emitted power to the extremes ofsolar flux.
The processing of the CIRS data and the corresponding methodology of computing the emitted power havealready been described in our previous studies (Li, 2015; Li et al., 2010, 2011, 2012), which are brieflyintroduced here. The CIRS raw data, which are referred to the solid surface of Titan, are first projected ontoa reference altitude of 500 km to include all effective thermal emission from Titan's thick atmosphere(Li et al., 2011). Then the projected data are averaged in the directions of latitude and emission angle, whichare shown in supporting information, Figure S1.
Figure S1 shows that there are observational gaps in the data, particularly towards the poles. In addition, theobservational gaps vary with time. In our previous study (Li, 2015), only the CIRS data in the 3 years withgood coverage (e.g., 2007, 2009, and 2012/13) are analyzed. In this study, we first increase the coverage forthese years with the relatively poor coverage (e.g., the year 2011 in Figure S1) by linearinterpolation/extrapolation in space and time from the neighboring data. Then we apply the least‐squaresmethod to fill the remaining observational gaps, as we did in our previous study (Li, 2015).
The resulting distribution of radiance in the domain of latitude and emission angle is shown in supportinginformation, Figure S2. Integrating the data in the direction of emission angle, we get the meridionaldistribution of Titan's emitted power. In addition, the hemispheric and global averages of Titan's emittedpower are computed. Regarding the uncertainties of our measurements, we basically follow the uncertaintyanalysis conducted in one of our previous studies (Li et al., 2010). There are mainly two uncertainty sourcesas follows: (1) the uncertainty related to the Cassini/CIRS data calibration and (2) the uncertainty related tofilling the observational gaps by the least‐squares fitting. For the first uncertainty source, we use the CIRSspectra of deep space to estimate its magnitude (Li et al., 2010). For the second uncertainty source, the mainidea is to use the statistical characteristics of fitting residuals at these observed points to estimate the possibleuncertainty of unobserved points (i.e., observational gaps; Li et al., 2010, 2011, 2012, 2015). In this study,before the least‐squares fitting, we use the linear interpolation/extrapolate to increase the data coveragefor these years with the relatively poor coverage. When computing the second uncertainty, the fittingresiduals in these interpolated/extrapolated points are also counted for these years with the relatively poorcoverage. It should be mentioned that the selected CIRS wavenumber range (10–1,430 cm‐1), which is usedfor the computation of Titan's emitted power, does not cover the complete wavenumber range for Titan'sthermal emission. But the thermal radiance outside of the selected wavenumber range contributes to~0.025% of Titan's total emitted power, which is approximately one order of magnitude smaller than theuncertainties discussed above. Therefore, such an uncertainty is not discussed in this study.
3. Results
We first discuss the temporal variations of the meridional distribution of Titan's emitted power. Panel A ofFigure 1 shows the emitted power at each latitude from 2004 to 2017. In the tropical region (30°N–30°S),
10.1029/2019GL084833Geophysical Research Letters
CREECY ET AL. 13,650
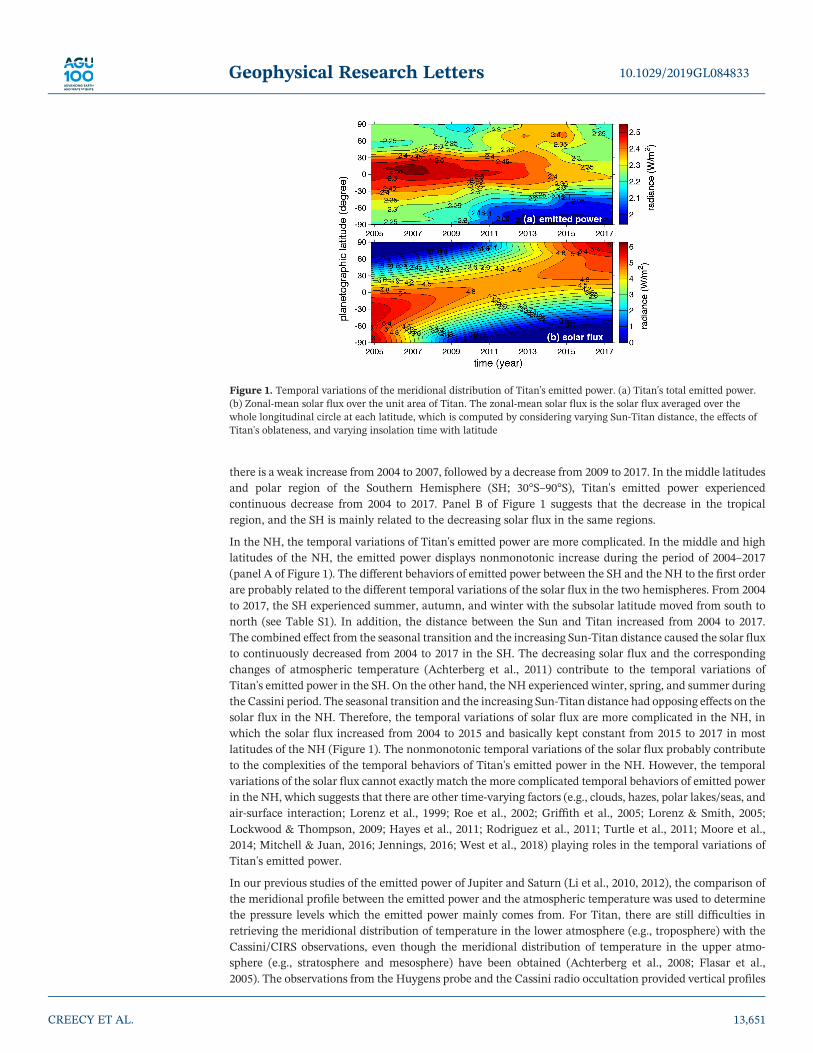
there is a weak increase from 2004 to 2007, followed by a decrease from 2009 to 2017. In the middle latitudesand polar region of the Southern Hemisphere (SH; 30°S–90°S), Titan's emitted power experiencedcontinuous decrease from 2004 to 2017. Panel B of Figure 1 suggests that the decrease in the tropicalregion, and the SH is mainly related to the decreasing solar flux in the same regions.
In the NH, the temporal variations of Titan's emitted power are more complicated. In the middle and highlatitudes of the NH, the emitted power displays nonmonotonic increase during the period of 2004–2017(panel A of Figure 1). The different behaviors of emitted power between the SH and the NH to the first orderare probably related to the different temporal variations of the solar flux in the two hemispheres. From 2004to 2017, the SH experienced summer, autumn, and winter with the subsolar latitude moved from south tonorth (see Table S1). In addition, the distance between the Sun and Titan increased from 2004 to 2017.The combined effect from the seasonal transition and the increasing Sun‐Titan distance caused the solar fluxto continuously decreased from 2004 to 2017 in the SH. The decreasing solar flux and the correspondingchanges of atmospheric temperature (Achterberg et al., 2011) contribute to the temporal variations ofTitan's emitted power in the SH. On the other hand, the NH experienced winter, spring, and summer duringthe Cassini period. The seasonal transition and the increasing Sun‐Titan distance had opposing effects on thesolar flux in the NH. Therefore, the temporal variations of solar flux are more complicated in the NH, inwhich the solar flux increased from 2004 to 2015 and basically kept constant from 2015 to 2017 in mostlatitudes of the NH (Figure 1). The nonmonotonic temporal variations of the solar flux probably contributeto the complexities of the temporal behaviors of Titan's emitted power in the NH. However, the temporalvariations of the solar flux cannot exactly match the more complicated temporal behaviors of emitted powerin the NH, which suggests that there are other time‐varying factors (e.g., clouds, hazes, polar lakes/seas, andair‐surface interaction; Lorenz et al., 1999; Roe et al., 2002; Griffith et al., 2005; Lorenz & Smith, 2005;Lockwood & Thompson, 2009; Hayes et al., 2011; Rodriguez et al., 2011; Turtle et al., 2011; Moore et al.,2014; Mitchell & Juan, 2016; Jennings, 2016; West et al., 2018) playing roles in the temporal variations ofTitan's emitted power.
In our previous studies of the emitted power of Jupiter and Saturn (Li et al., 2010, 2012), the comparison ofthe meridional profile between the emitted power and the atmospheric temperature was used to determinethe pressure levels which the emitted power mainly comes from. For Titan, there are still difficulties inretrieving the meridional distribution of temperature in the lower atmosphere (e.g., troposphere) with theCassini/CIRS observations, even though the meridional distribution of temperature in the upper atmo-sphere (e.g., stratosphere and mesosphere) have been obtained (Achterberg et al., 2008; Flasar et al.,2005). The observations from the Huygens probe and the Cassini radio occultation provided vertical profiles
Figure 1. Temporal variations of the meridional distribution of Titan's emitted power. (a) Titan's total emitted power.(b) Zonal‐mean solar flux over the unit area of Titan. The zonal‐mean solar flux is the solar flux averaged over thewhole longitudinal circle at each latitude, which is computed by considering varying Sun‐Titan distance, the effects ofTitan's oblateness, and varying insolation time with latitude
10.1029/2019GL084833Geophysical Research Letters
CREECY ET AL. 13,651

of temperature in Titan's troposphere (Fulchignoni et al., 2005; Schinder et al., 2012), but these observationshave a limited coverage of latitude. Therefore, the method of determining the effective pressure levels for theemitted power by the meridional comparison between the emitted power and the atmospheric temperature,which works for Jupiter and Saturn (Li et al., 2010, 2012), does not work for Titan because of the lack of themeridional profiles of tropospheric temperature.
Here, we separate Titan's total emitted power into three ranges of wavenumber, which are recorded by theCIRS three focal planes, to examine the atmospheric layers contributing to the emitted power. Thewavenum-bers of the CIRS focal planes are sensitive to specific pressure levels, which can help differentiate layers ofTitan's atmosphere (Flasar et al., 2004) for contributing to Titan's emitted power. The three CIRS focal planes(FPs) cover different wavenumbers: FP1 (10–6,95 cm−1), FP3 (570–1,125 cm−1), and FP4 (1,025–1,430 cm−1).There are overlaps of wavenumber among the three focal planes, so we select wavenumber ranges 10–600 cm−1
for FP1, 600–1,050 cm−1 for FP3, and 1,050–1,430 cm−1 for FP4 to avoid the overlaps. By looking at thesefocal planes, we can better understand how the thermal emission from different layers changes with time.Additionally, we can see how different atmospheric layers are affected by the solar flux. Based on theweighting functions and inversion kernels of the CIRS observations (Flasar et al., 2004), we know thewavenumbers of FP1, FP3, and FP4 are mostly sensitive to the upper troposphere/tropopause, the middlestratosphere, and the upper stratosphere/lower mesosphere, respectively. Titan's thermal spectra peakaround the wavenumbers ~160 cm−1, which are covered by the FP1. Therefore, the thermal radiancerecorded by the FP1 is dominant in the total emitted power of Titan. In addition, previous studies(Anderson & Samuelson, 2011; Flasar et al., 2004; Lellouch et al., 2014) suggest that the thermal radiancearound 160 cm−1 mainly comes from pressure levels between 50 mbar and 300 mbar in Titan's atmosphere.
Supporting information, Figure S3 shows Titan's emitted power recorded by the CIRS three focal planes,which suggests that FP3 and FP4 (panels B and C) have the similar patterns especially in the tropical regionand the SH. Titan's emitted power in the wavenumber ranges of FP3 and FP4 decreased from 2004 to 2017 inthe tropical region and the SH, but the temporal variations in the middle and high latitudes of the NH arecomplicated. The emitted power recorded by FP3 and FP4 mainly comes from stratosphere and lowermesosphere, and these high layers are more easily affected by the solar flux and have short radiative timeconstants. Therefore, the decreasing emitted power from 2004 to 2017 recorded by FP3 and FP4 in thetropical region and the SH is related to the decreasing solar flux in the same regions (panel B of Figure 1).The complicated behaviors of Titan's emitted power in the middle and high latitudes of the NH are probablyrelated to other activities in the high atmosphere (e.g., Coustenis, 2005; Coustenis et al., 2018; Teanby et al.,2008, 2012; West et al., 2018).
Compared to the relatively simple behaviors of Titan's emitted power recorded by FP3 and FP4, the temporalvariations of the emitted power recorded by FP1 have complicated patterns from 2004 to 2017, which areshown in panel A of Figure S3. There is a couple of factors that contribute to the complexities. First, thewavenumbers of FP1 are mainly sensitive to the upper troposphere and tropopause of Titan's atmosphere,where the radiative time constant is a few Earth years (Flasar et al., 1981). Therefore, we cannot expect directand clear correlation between the emitted power recorded by FP1 and the solar flux. Second, there are activeweather processes in Titan's troposphere (Griffith et al., 2005; Rodriguez et al., 2011; Roe et al., 2002), whichmodify the thermal structure of Titan's upper troposphere and hence affect the temporal variations of theemitted power recorded by FP1.
In addition to the investigations of the temporal variations of spatial structures of Titan's emitted power, wediscuss the seasonal variations of the global and hemispheric averages of Titan's emitted power. Panel A ofFigure 2 shows the temporal variations of the global‐average emitted power from 2004 to 2017, which is com-pared with the temporally varying solar flux at Titan. There is basically a decreasing trend for the global‐average emitted power during the Cassini period, which is consistent with the decreasing trend of solar flux(panel A of Figure 2). To investigate if there is a time lag between the emitted power and solar flux, we use asine function to fit the global‐average emitted power. Assuming the global‐average emitted power also has aseasonal cycle with a period ~29.4 years (i.e., Saturn's orbital period), we fit the global‐average emitted powerand then compare it with the global‐average solar flux. Supporting information, Figure S4 shows that there isa shift ~3 years between the global‐average solar flux and the fitting global‐average emitted power, whichsuggests that Titan's global‐average emitted power responds to the solar flux with a time lag ~3 years.
10.1029/2019GL084833Geophysical Research Letters
CREECY ET AL. 13,652

In addition to the time lag between the emitted power and the solar flux, there is another difference betweenthem. The global‐average solar flux at Titan monotonically decreased during the Cassini period, but Titan'sglobal‐average emitted power did not show such monotonic variations. The global‐average emitted powerdecreased in steps from 2004 to 2017. The global emitted power roughly kept constant from 2004 to 2007,then decreased from 2007 to 2011, then roughly kept constant again from 2011 to 2013, and finally decreasedfrom 2013 to 2017. The different behaviors between the monotonic variations of solar flux and thenonmonotonic variations of global‐average emitted power suggest that there are other factors affectingTitan's emitted power.
During the whole Cassini period, the global‐average solar flux at Titan monotonically decreased by 18.6%from 4.163 W/m2 in 2004–05 to 3.389 W/m2 in 2017. On the other hand, the global‐average emitted powerdecreased by 6.8 ± 0.4% from 2.410 ± 0.008 W/m2 in 2004 to 2.246 ± 0.007 W/m2 in 2017. Panel B ofFigure 2 shows the anomaly of global‐average emitted power and solar flux (i.e., the ratio between thedeviation from the time‐mean value and the time‐mean value), which also shows the temporal variationsare much stronger in the solar flux (18.6%) than in the emitted power (~6.6%) during the Cassini period.
Figure 3 shows the temporal variations of the hemispheric‐average emitted power and solar flux from 2004to 2017. Panel A suggests that the emitted power decreased at a more constant rate in the SH than in the NH.In the SH, the emitted power continuously decreased from 2004 to 2016. From 2016 to 2017, the SH‐averageemitted power stopped the decreasing from 2004 to 2016. During the whole Cassini period, the SH‐averageemitted power decreased by 9.0 ± 0.5% from 2.419 ± 0.009 W/m2 in 2004 to 2.202 ± 0.008 W/m2 in 2017. Inthe NH, the temporal variations of the hemispheric‐average emitted power are more complicated, whichcorresponds to the complicated behavior of the meridional profile in this hemisphere (Figure 1). TheNH‐average emitted power increased weakly from 2004 to 2008, then decreased from 2008 to 2010, thenincreased again from 2010 to 2013, and finally decreased from 2013 to 2017. From 2004 to 2017, theNH‐average emitted power decreased by 4.7 ± 0.4% from 2.401 ± 0.007 W/m2 to 2.289 ± 0.006 W/m2.The decrease of the NH‐average emitted power is about half of the decrease of the SH‐average emitted powerduring the period of 2004–2017. The different temporal variations of emitted power between the SH and theNH is related to the hemispheric‐average solar flux, which is shown in panel B of Figure 3. The strongdecrease of solar flux in the SH, which is due to the seasonal transit (from summer to winter in the SH)and the increasing Sun‐Titan distance, contributes to the strong decrease of emitted power in the SH. Inthe NH, the hemispheric‐average solar flux actually increased, because the seasonal transit (from winterto summer in the NH) increases the sunlight to the NH and overcomes the negative influence from the
Figure 2. Temporal variation of global‐average emitted power during the period of 2004–2017. (a) Global‐average emittedpower and the global‐average solar flux at Titan. The times of points are the average observational times over theselected years. The error bars are estimated by combining the uncertainty related to the CIRS data calibration and fillingobservational gaps. (b) Anomaly of the global‐average emitted power and solar flux. The anomaly is computed as theratio between the deviation from the time‐mean value and the time‐mean value
10.1029/2019GL084833Geophysical Research Letters
CREECY ET AL. 13,653

increasing Sun‐Titan distance. The increasing solar flux and other factors as we previously mentioned(e.g., clouds, hazes, polar lakes/seas, and air‐surface interaction) both act on the emitted power in theNH. The global and hemispheric averages of emitted powers and their uncertainties during the Cassiniperiod, which are displayed in Figures 2 and 3, are also listed in supporting information, Table S2.
In addition to the increasing and decreasing trends, Figures 2 and 3 also show some oscillation structures inthe global and hemispheric averages of emitted. Supporting information, Figure S5 shows the fast Fouriertransform analysis based on the time series shown in Figures 2 and 3. Figure S5 suggests that there is a per-iodic signal ~6.5 years in the global and hemispheric emitted power, which is marginally significant (aroundthe 90% confidence level). Currently, we do not have good explanations for such a signal, which needs longerobservations and more studies to further examine.
Figure S5 does not show any significantly long periodic signals close to the known 15‐year cycle in Titan'svisible brightness (e.g., Sromovsky et al., 1981). It is probably because the current Cassini observations arenot long enough to well revolve these long periodic signals. The other possibility is that Titan's emittedpower does not have the 15‐year periodic signal. The 15‐year signal was discovered in Titan's globalbrightness, which is mainly caused by the hemispheric asymmetry of clouds (Sromovsky et al., 1981). Onthe contrary, the emitted power is mainly determined by the atmospheric temperature, which is furtheraffected by more factors (e.g., radiative and dynamical processes). Therefore, it is possible that Titan'semitted power does not have the 15‐year cycle.
4. Conclusions and Implications
In this paper, the Cassini/CIRS long‐term (2004–2017) observations are used to examine the characteristicsof the seasonal cycle of Titan's emitted power. The observations recorded by the three focal planes of theCassini/CIRS are used to separate the emitted power from different vertical layers of Titan's atmosphere,which suggests that the emitted power is affected more strongly by the varying solar flux in the stratosphereand low mesosphere (recorded by FP3 and FP4) than in the upper troposphere (recorded by FP1).
The meridional profiles of Titans emitted power show different temporal behaviors between the NH and theSH. Complicated temporal behaviors of Titan's emitted power are revealed in the NH, which suggests thatthere are other factors beyond the solar flux driving Titan's emitted power. In the SH, Titan's emitted powerdisplays more constant and stronger variations, which are mainly driven by the decreasing solar flux from2004 to 2017. During the period of 2004–2017, the SH‐average emitted power decreased ~9.0 ± 0.5%, whichis roughly twice the decrease of the NH‐average emitted power ~4.7 ± 0.4%.
Figure 3. Hemispheric‐average emitted power and solar flux. (a) Hemispheric‐average emitted power. (b) Hemispheric‐average solar flux. NH, Northern Hemisphere; SH, Southern Hemisphere
10.1029/2019GL084833Geophysical Research Letters
CREECY ET AL. 13,654

At the global scale, Titan's emitted power decreased ~6.8% during the Cassini period (2004–2017). TheCassini period covers approximately one half of Titan's seasonal cycle. In addition, the global‐averageemitted power basically kept decreasing during the Cassini period (Figure 2). Therefore, the temporal varia-tion of Titan's global‐average emitted power during the Cassini period probably represents the magnitude ofthe seasonal cycle of Titan's global emitted power. The seasonal variations of Earth's global‐average emittedpower (Loeb et al., 2009) are less than 0.5%. Therefore, the seasonal variations of emitted power are at leastone order of magnitude larger on Titan than on Earth, which are mainly due to different orbit eccentricitiesbetween Titan and Earth.
In addition, the temporal variation of Titan's global‐average emitted power ~6.8% is much smaller than thedecrease of the solar flux ~18.6% during the Cassini period, which suggests significantly dynamical energybudget on Titan. It is also possible that there is a global energy imbalance exists on Titan if the time‐meanalbedo, and hence, time‐mean absorbed solar power cannot balance the time‐mean emitted power duringthe Cassini period. Earth's energy imbalances at the timescales of seasons and years (Hansen et al., 2005,2011; Loeb et al., 2009; Trenberth et al., 2014; Trenberth & Fasullo, 2010) are both in the magnitude of0.1%, but such small energy imbalances have a large impact on global warming (Hansen et al., 2005, 2011;Trenberth et al., 2014; Trenberth & Fasullo, 2010). Therefore, the possible radiant energy imbalance onTitan must be examined further in the future.
To precisely determine Titan's radiant energy budget and the possible energy imbalance, we have tomeasurethe temporal variations of Titan's albedo and hence absorbed solar power, the other component of Titan'sradiated energy budget. Titan's albedo was investigated in previous studies (Karkoschka, 1994, 1998;Lockwood & Thompson, 2009; Maltagliati et al., 2015; Muñoz et al., 2017; Neff et al., 1985; Sromovskyet al., 1981; Tomasko & Smith, 1982; Younkin, 1974), but it would be beneficial to calculate it with theCassini observations. The visual and infrared mapping spectrometer and the imaging science subsystemon Cassini both provide data that can help us get much more accurate measurements of the absorbed solarpower (Li et al., 2018). More importantly, the long‐term continuous Cassini observations make it possible tomeasure the temporal variations of Titan's albedo and the absorbed solar power for the first time. We are stillworking on these measurements related to Titan's albedo.
Even though Titan's radiant energy budget is probably imbalanced during the Cassini period (~one half ofSaturnian year), it is still possible that it is balanced at the relatively long timescales (e.g., ≥one Saturnianyear) because there are no significant energy sources other than the radiant energies (i.e., the emittedthermal energy and the absorbed solar energy) for the atmospheric system of Titan. The emitted power fromSaturn (Li et al., 2010) drops to a magnitude of 10−2 W/m2 at the distance of Titan, which is much smallerthan Titan's emitted power. Titan's surface heat flow (Sohl et al., 1995; Tobie et al., 2006) and tidal heat(Sohl et al., 1995) are both on the magnitude of 10−3 W/m2.
When discussing Titan's radiant energy budget and the possible energy imbalance, there is one moreconcern should be paid attention: a possible phase lag of the seasonal cycle between the global‐averageemitted power and the solar flux. Our analysis based on the current limited observations suggests that a3‐year time lag exists between Titan's global‐average emitted power and solar flux. The observations at therelatively long timescales (e.g., ≥one Saturnian year), which come from the ground‐based telescopes,the Hubble Space Telescope, and the future James Webb Space Telescope, will help us better understandthe time lag between the emitted power and solar flux and hence Titan's energy budget.
In addition, the theoretical studies can help us understand Titan's radiant energy budget at longertimescales. Numerical modeling is becoming more detailed and some experiments now are carried out withinclusion of quite elaborate mechanisms, such as methane thermodynamics, precipitation, and seasonalcycle (Dowling et al., 2006; Friedson et al., 2009; Lebonnois et al., 2012; Lora et al., 2015; Mitchell et al.,2009; Newman et al., 2011; Tokano et al., 1999). The combination of the observational analyses andtheoretical studies will help us better understand the radiant energy budget and the related climate on thisamazing satellite.
ReferencesAchterberg, R. K., Conrath, B. J., Gierasch, P. J., Flasar, F. M., & Nixon, C. A. (2008). Titan's middle‐atmospheric temperatures and
dynamics observed by the Cassini composite infrared spectrometer. Icarus, 194(1), 263–277. https://doi.org/10.1016/j.icarus.2007.09.029
10.1029/2019GL084833Geophysical Research Letters
CREECY ET AL.
AcknowledgmentsWe gratefully acknowledge the CassiniCIRS team for recording the raw dataset. L. L. acknowledges the supportfrom the NASA ROSES Cassini DataAnalysis Program and Planetary DataArchiving, Restoration, and ToolsProgram. The Cassini/CIRS raw dataused in this study are available from thePlanetary Data System Ring‐MoonSystems Node (https://pds‐rings.seti.org/cassini/cirs/). Further inquiriesabout the processed data and findingsof this study are available from thecorresponding author upon reasonablerequest.
13,655

Achterberg, R. K., Gierasch, P. J., Conrath, B. J., Michael Flasar, F., & Nixon, C. A. (2011). Temporal variations of Titan's middle‐atmospherictemperatures from 2004 to 2009 observed by Cassini/CIRS. Icarus, 211(1), 686–698. https://doi.org/10.1016/j.icarus.2010.08.009
Anderson, C. M., & Samuelson, R. E. (2011). Titan's aerosol and stratospheric ice opacities between 18 and 500 μm: Vertical and spectralcharacteristics from Cassini CIRS. Icarus, 212(2), 762–778. https://doi.org/10.1016/j.icarus.2011.01.024
Conrath, B. J., Hanel, R. A., & Samuelson, R. E. (1989). Thermal structure and heat balance of the outer planets. In S. K. Atreya, J. B.Pollack, & M. S. Matthews (Eds.), Origin and Evolution of Planetary and Satellite Atmospheres (pp. 513–538). Arizona: The University ofArizona Press.
Coustenis, A. (2005). Formation and evolution of Titan's atmosphere. Space Science Reviews, 116(1‐2), 171–184. https://doi.org/10.1007/s11214‐005‐1954‐2
Coustenis, A., Jennings, D. E., Achterberg, R. K., Bampasidis, G., Nixon, C. A., Lavvas, P., et al. (2018). Seasonal evolution of Titan'sstratosphere near the poles. The Astrophysical journal letters, 854(2), L30. https://doi.org/10.3847/2041‐8213/aaadbd
Dowling, T. E., Bradley, M. E., Colón, E., Kramer, J., LeBeau, R. P., Lee, G. C. H., et al. (2006). The EPIC atmospheric model with anisentropic/terrain‐following hybrid vertical coordinate. Icarus, 182(1), 259–273. https://doi.org/10.1016/j.icarus.2006.01.003
Flasar, F. M., Achterberg, R. K., Conrath, B. J., Gierasch, P. J., Kunde, V. G., Nixon, C. A., et al. (2005). Titan's atmospheric temperatures,winds, and composition. Science, 308(5724), 975–978. https://doi.org/10.1126/science.1111150
Flasar, F. M., Kunde, V. G., Abbas, M. M., Achterberg, R. K., Ade, P., Barucci, A., et al. (2004). Exploring the Saturn system in the thermalinfrared: The composite infrared spectrometer. Space Science Reviews, 115(1‐4), 169–297. https://doi.org/10.1007/s11214‐004‐1454‐9
Flasar, F. M., Samuelson, R. E., & Conrath, B. J. (1981). Titan's atmosphere: Temperature and dynamics. Nature, 292(5825), 693–698.https://doi.org/10.1038/292693a0
Friedson, A. J., West, R. A., Wilson, E. H., Oyafuso, F., & Orton, G. S. (2009). A global climate model of Titan's atmosphere and surface.Planetary and Space Science, 57(14‐15), 1931–1949. https://doi.org/10.1016/j.pss.2009.05.006
Fulchignoni, M., Ferri, F., Angrilli, F., Ball, A. J., Bar‐Nun, A., Barucci, M. A., et al. (2005). In situ measurements of the physical charac-teristics of Titan's environment. Nature, 438(7069), 785–791. https://doi.org/10.1038/nature04314
Griffith, C. A., Penteado, P., Baines, K., Drossart, P., Barnes, J., Bellucci, G., et al. (2005). The evolution of Titan's mid‐latitude clouds.Science, 310(5747), 474–477. https://doi.org/10.1126/science.1117702
Guillot, T., Stevenson, D. J., Hubbard, W. B., & Saumon, D. (2004). The interior of Jupiter. In F. Bagenal, T. Dowling, & W. Mckinnon(Eds.), Jupiter: The planet, Satellites, and Magnetosphere. (pp. 35–57). Cambridge: Cambridge University Press.
Hanel, R. A., Conrath, B. J., Jennings, D. E., & Samuelson, R. E. (2003). Exploration of the solar system by infrared remote sensing.Cambridge, Cambridge University Press.
Hansen, J., Nazarenko, L., Ruedy, R., Sato, M., Willis, J., del Genio, A., et al. (2005). Earth's energy imbalance: Confirmation and impli-cations. Science, 308(5727), 1431–1435. https://doi.org/10.1126/science.1110252
Hansen, J., Sato, M., Kharecha, P., & von Schuckmann, K. (2011). Earth's energy imbalance and implications. Atmospheric Chemistry andPhysics, 11(24), 13,421–13,449. https://doi.org/10.5194/acp‐11‐13421‐2011
Hayes, A. G., Aharonson, O., Lunine, J. I., Kirk, R. L., Zebker, H. A., Wye, L. C., et al. (2011). Transient surface liquid in Titan's polarregions from Cassini. Icarus, 211(1), 655–671. https://doi.org/10.1016/j.icarus.2010.08.017
Hubbard, W. B. (1968). Thermal structure of Jupiter. The Astrophysical Journal, 152, 745–754. https://doi.org/10.1086/149591Hubbard, W. B. (1980). Intrinsic luminosities of the Jovian planets. Reviews of Geophysics, 18(1), 1–9. https://doi.org/10.1029/
RG018i001p00001Ingersoll, A. P. (1990). Atmospheric dynamics of the outer planets. Science, 248(4953), 308–315. https://doi.org/10.1126/
science.248.4953.308Jennings, D. E. (2016). Surface temperatures on Titan during northern winter and spring. The Astrophysical Journal Letters, 816(1), L17.
https://doi.org/10.3847/2041‐8205/816/1/L17Karkoschka, E. (1994). Spectrophotometry of the jovian planets and Titan at 300‐to 1000‐nm wavelength: The methane spectrum. Icarus,
111(1), 174–192. https://doi.org/10.1006/icar.1994.1139Karkoschka, E. (1998). Methane, ammonia, and temperature measurements of the Jovian planets and Titan fromCCD–spectrophotometry.
Icarus, 133(1), 134–146. https://doi.org/10.1006/icar.1998.5913Kiehl, J. T., & Trenberth, K. E. (1997). Earth's annual global mean energy budget. Bulletin of the American Meteorological Society, 78(2),
197–208. https://doi.org/10.1175/1520‐0477(1997)078<0197:EAGMEB>2.0.CO;2Lebonnois, S., Burgalat, J., Rannou, P., & Charnay, B. (2012). Titan global climate model: A new 3‐dimensional version of the IPSL Titan
GCM. Icarus, 218(1), 707–722. https://doi.org/10.1016/j.icarus.2011.11.032Lellouch, E., Bézard, B., Flasar, F. M., Vinatier, S., Achterberg, R., Nixon, C. A., et al. (2014). The distribution of methane in Titan's stra-
tosphere from Cassini/CIRS observations. Icarus, 231, 323–337. https://doi.org/10.1016/j.icarus.2013.12.016Li, L. (2015). Dimming Titan revealed by the Cassini observations. Scientific Reports, 5, 8329.Li, L., Baines, K. H., Smith, M. A., West, R. A., Pérez‐Hoyos, S., Trammell, H. J., et al. (2012). Emitted power of Jupiter based on Cassini
CIRS and VIMS observations. Journal of Geophysical Research, 117, E11002. https://doi.org/10.1029/2012JE004191Li, L., Conrath, B. J., Gierasch, P. J., Achterberg, R. K., Nixon, C. A., Simon‐Miller, A. A., et al. (2010). Emitted power of Saturn. Journal of
Geophysical Research, 115, E11002. https://doi.org/10.1029/2010JE003631Li, L., Jiang, X., Trammell, H. J., Pan, Y., Hernandez, J., Conrath, B. J., et al. (2015). Saturn's giant storm and global radiantenergy.
Geophysical Research Letters, 42, 2144–2148. https://doi.org/10.1002/2015GL063763Li, L., Jiang, X., West, R. A., Gierasch, P. J., Perez‐Hoyos, S., Sanchez‐Lavega, A., et al. (2018). Less absorbed solar energy and more internal
heat for Jupiter. Nature Communications, 9(1), 3709. https://doi.org/10.1038/s41467‐018‐06107‐2Li, L., Nixon, C. A., Achterberg, R. K., Smith, M. A., Gorius, N. J. P., Jiang, X., et al. (2011). The global energy balance of Titan. Geophysical
Research Letters, 38, L23201. https://doi.org/10.1029/2011GL050053Lockwood, G. W., & Thompson, D. T. (2009). Seasonal photometric variability of Titan. 1972‐2006. Icarus, 200(2), 616–626. https://doi.org/
10.1016/j.icarus.2008.11.017Loeb, N. G., Wielicki, B. A., Doelling, D. R., Smith, G. L., Keyes, D. F., Kato, S., et al. (2009). Towards optimal closure of the Earth's top‐of‐
atmosphere radiation budget. Journal of Climate, 22(3), 748–766. https://doi.org/10.1175/2008JCLI2637.1Lora, J. M., Lunine, J. I., & Russell, J. L. (2015). GCM simulations of Titan's middle and lower atmosphere and comparison to observations.
Icarus, 250, 516–528. https://doi.org/10.1016/j.icarus.2014.12.030Lorenz, R. D., Lemmon, M. T., Smith, P. H., & Lockwood, G. W. (1999). Seasonal change on Titan observed with the Hubble Space
Telescope WFPC‐2. Icarus, 142(2), 391–401. https://doi.org/10.1006/icar.1999.6225
10.1029/2019GL084833Geophysical Research Letters
CREECY ET AL. 13,656

Lorenz, R. D., & Smith, P. H. (2005). Seasonal change in Titan's haze 1992‐2002 from Hubble Space Telescope observations. GeophysicalResearch Letters, 31, L10702. https://doi.org/10.1029/2004GL019864
Maltagliati, L., Rodriguez, S., Sotin, C., Cornet, T., Rannou, P., Le Mouélic, et al. (2015). Simultaneous mapping of Titan's surface albedoand aerosol opacity from Cassini/VIMS massive inversion. In the 10th European Planetary Science Congress.
Mitchell, J. L. (2012). Titan's transport‐driven methane cycle. The Astrophysical Journal Letters, 756(2), L26. https://doi.org/10.1088/2041‐8205/756/2/L26
Mitchell, J. L., & Juan, M. L. (2016). The climate of Titan. Annual Review of Earth and Planetary Sciences, 44(1), 353–380. https://doi.org/10.1146/annurev‐earth‐060115‐012428
Mitchell, J. L., Pierrehumbert, R. T., Frierson, D. M. W., & Caballero, R. (2009). The impact of methane thermodynamics on seasonalconvection and circulation in a model Titan atmosphere. Icarus, 203(1), 250–264. https://doi.org/10.1016/j.icarus.2009.03.043
Moore, J. M., Howard, A. D., & Morgan, A. M. (2014). The landscape of Titan as witness to its climate evolution. Journal of GeophysicalResearch: Planets, 119, 2060–2077. https://doi.org/10.1002/2014JE004608
Muñoz, A. G., Lavvas, P., & West, R. A. (2017). Titan brighter at twilight than in daylight. Nature Astronomy, 1.Neff, J. S., Ellis, T. A., Apt, J., & Bergstralh, J. T. (1985). Bolometric albedos of Titan, Uranus, and Neptune. Icarus, 62(3), 425–432.
https://doi.org/10.1016/0019‐1035(85)90185‐XNewman, C. E., Lee, C., Lian, Y., Richardson, M. I., & Toigo, A. D. (2011). Stratospheric superrotation in the Titan WRF model. Icarus,
213(2), 636–654. https://doi.org/10.1016/j.icarus.2011.03.025Peixoto, J. P., and Oort, A. H. (1992). Physics of climate, American Institute of Physics.Rodriguez, S., le Mouélic, S., Rannou, P., Sotin, C., Brown, R. H., Barnes, J. W., et al. (2011). Titan's cloud seasonal activity from winter to
spring with Cassini/VIMS. Icarus, 216(1), 89–110. https://doi.org/10.1016/j.icarus.2011.07.031Roe, H. G., De Pater, I., Macintosh, B. A., & McKay, C. P. (2002). Titan's clouds from Gemini and Keck adaptive optics imaging. The
Astrophysical Journal, 581(2), 1399–1406. https://doi.org/10.1086/344403Schinder, P. J., Flasar, F. M., Marouf, E. A., French, R. G., McGhee, C. A., Kliore, A. J., et al. (2012). The structure of Titan's atmosphere
from Cassini radio occultations: Occultations from the prime and equinox missions. Icarus, 221(2), 1020–1031. https://doi.org/10.1016/j.icarus.2012.10.021
Sohl, F., Sears, W. D., & Lorenz, R. D. (1995). Tidal dissipation on Titan. Icarus, 115(2), 278–294. https://doi.org/10.1006/icar.1995.1097Sromovsky, L. A., Suomi, V. E., Pollack, J. B., Krauss, R. J., Limaye, S. S., Owen, T., et al. (1981). Implications of Titan's north‐south
brightness asymmetry. Nature, 292(5825), 698–702. https://doi.org/10.1038/292698a0Stevenson, D. J., & Salpeter, E. E. (1977). The dynamics and helium distributions in hydrogen‐helium planets. The Astrophysical
Journal ‐ Supplement Series, 35, 239–261. https://doi.org/10.1086/190479Teanby, N. A., Irwin, P. G., de Kok, R., & Nixon, C. A. (2008). Dynamical implications of seasonal and spatial variations in Titan's strato-
spheric composition. Philosophical Transactions of the Royal Society A: Mathematical, Physical and Engineering Sciences, 367, 697–711.Teanby, N. A., Irwin, P. G., Nixon, C. A., de Kok, R., Vinatier, S., Coustenis, A., et al. (2012). Active upper‐atmosphere chemistry and
dynamics from polar circulation reversal on Titan. Nature, 491(7426), 732–735. https://doi.org/10.1038/nature11611Tobie, G., Lunine, J. I., & Sotin, C. (2006). Episodic outgassing as the origin of atmospheric methane on Titan. Nature, 440(7080), 61–64.
https://doi.org/10.1038/nature04497Tokano, T., Neubauer, F. M., Laube, M., & McKay, C. P. (1999). Seasonal variation of Titan's atmospheric structure simulated by a general
circulation model. Planetary and Space Science, 47(3‐4), 493–520. https://doi.org/10.1016/S0032‐0633(99)00011‐2Tomasko, M. G., & Smith, P. H. (1982). Photometry and polarimetry of Titan: Pioneer 11 observations and their implications for aerosol
properties. Icarus, 51(1), 65–95. https://doi.org/10.1016/0019‐1035(82)90030‐6Trenberth, K. E., & Fasullo, J. T. (2010). Tracking Earth's energy. Science, 328(5976), 316–317. https://doi.org/10.1126/science.1187272Trenberth, K. E., Fasullo, J. T., & Balmaseda, M. A. (2014). Earth's energy imbalance. Journal of Climate, 27(9), 3129–3144. https://doi.org/
10.1175/JCLI‐D‐13‐00294.1Trenberth, K. E., Fasullo, J. T., & Kiehl, J. (2009). Earth's global energy budget. Bulletin of the American Meteorological Society, 90(3),
311–324. https://doi.org/10.1175/2008BAMS2634.1Turtle, E. P., del Genio, A. D., Barbara, J. M., Perry, J. E., Schaller, E. L., McEwen, A. S., et al. (2011). Seasonal changes in Titan's
meteorology. Geophysical Research Letters, 38, L03203. https://doi.org/10.1029/2010GL046266West, R. A., Seignovert, B., Rannou, P., Dumont, P., Turtle, E. P., Perry, J., et al. (2018). The seasonal cycle of Titan's detached haze. Nature
Astronomy, 2(6), 495–500. https://doi.org/10.1038/s41550‐018‐0434‐zYounkin, R. L. (1974). The albedo of Titan. Icarus, 21(3), 219–229. https://doi.org/10.1016/0019‐1035(74)90036‐0
10.1029/2019GL084833Geophysical Research Letters
CREECY ET AL. 13,657