second-year student survey: experiences … student survey: experiences regarding rst-year ku leuven...
TRANSCRIPT

Second-year student survey:
experiences regarding �rst-year
KU Leuven 2016-2017
Written by
Tinne De Laet
KU Leuven, Belgium
STELA Erasmus+ project (562167-EPP-1-2015-1-BE-EPPKA3-PI-FORWARD)

"The European Commission support for the production of this publication does not constitute an
endorsement of the contents which re�ects the views only of the authors, and the Commission cannot
be held responsible for any use which may be made of the information contained therein."
2

Contents
Contents
1 Goal and methodology 4
1.1 Goal . . . . . . . . . . . . . . . . . . . . . . . . . . . . . . . . . . . . . . . . . . . . . . 4
1.2 Data collection . . . . . . . . . . . . . . . . . . . . . . . . . . . . . . . . . . . . . . . . 4
1.3 Survey . . . . . . . . . . . . . . . . . . . . . . . . . . . . . . . . . . . . . . . . . . . . . 4
1.4 Statistical analysis . . . . . . . . . . . . . . . . . . . . . . . . . . . . . . . . . . . . . . 5
2 Survey results 7
2.1 Elements important for �rst-year study success . . . . . . . . . . . . . . . . . . . . . . 7
2.2 Information during �rst year . . . . . . . . . . . . . . . . . . . . . . . . . . . . . . . . . 8
2.2.1 Information received . . . . . . . . . . . . . . . . . . . . . . . . . . . . . . . . . 8
2.2.2 Emphasis of program . . . . . . . . . . . . . . . . . . . . . . . . . . . . . . . . . 13
2.3 Activities in �rst year . . . . . . . . . . . . . . . . . . . . . . . . . . . . . . . . . . . . 14
2.4 Perception of information received . . . . . . . . . . . . . . . . . . . . . . . . . . . . . 16
2.4.1 Su�cient information . . . . . . . . . . . . . . . . . . . . . . . . . . . . . . . . 16
2.4.2 Feelings and actions on information . . . . . . . . . . . . . . . . . . . . . . . . 17
2.5 Satisfaction and general feelings . . . . . . . . . . . . . . . . . . . . . . . . . . . . . . 20
2.5.1 Satisfaction . . . . . . . . . . . . . . . . . . . . . . . . . . . . . . . . . . . . . . 20
2.5.2 General feelings �rst year . . . . . . . . . . . . . . . . . . . . . . . . . . . . . . 22
3 Conclusion 24
3

Chapter 1. Goal and methodology
Chapter 1
Goal and methodology
1.1 Goal
The goal is to learn more about students in the transition from secondary to higher education. This
particular report focuses on the experiences of �rst-year students in STEM programs at KU Leuven.
To this end second year students were asked during the �rst weeks of the second year regarding their
experiences in the �rst year.
This reports handles the following topics:
• the important elements for �rst-year student success,
• the information received during the �rst year,
• the behavior of students in their �rst year,
• the experiences of student in their �rst year.
Moreover, the report studies the di�erences between di�erent STEM programs.
1.2 Data collection
Data was collected using a paper-and-pencil questionnaire in the �rst weeks of the academic year
2016-2017 in three faculties of the Science and Technology group of KU Leuven. Table 1.1 introduces
the programs and the abbreviations used in this report to refer to the programs.
612 students �lled in the questionnaire. Figure 1.1 shows how the students are divided over the
di�erent programs.
1.3 Survey
The survey contained 10 main questions. The questions concern important the elements students
consider to be important for study success in the �rst year, the information they received during the
abbreviation short name o�cial program names
ir Burgerlijk ingenieur Bachelor in de ingenieurswetenschappen
wet Science Bachelor in de chemie, Bachelor in de biochemie en
biotechnologie, Bachelor in de biologie, Bachelor in
de geologie, Bachelor in de geogra�e, Bachelor in
de wiskunde, Bachelor in de informatica, Bachelor
in de fysica
ing Industrieel ingenieur Bachelor in de industriële ingenieurswetenschappen
Table 1.1: Participating programs and abbreviations.
4

Chapter 1. Goal and methodology
Figure 1.1: Number of students that �lled in questionnaire over di�erent programs.
�rst year, their behavior during the �rst year, and their experiences in their �rst year. A �ve-point
Likert scale ranging from `not at all typical', over `not typical', `somewhat typical', `typical', to `very
typical' was used.
The report uses diverging stacked bar charts to visualize the results (Richard Heiberger and Naomi
Robbins; Design of Diverging Stacked Bar Charts for Likert Scales and Other Applications; Journal
of Statistical Software; 57 (1), 2014). Figure 1.2 shows a sample of a diverging stacked bar chart.
1.4 Statistical analysis
This report summarizes the descriptive analysis of the survey results. The di�erence between programs
are analyzed.
To assess the signi�cance of the di�erences between the di�erent groups a two-step analysis was
performed. First, a Kruskal-Wallis rank sum test was used to test the overall signi�cance of di�erences
between groups. Second, a pairwise Wilcoxon test was used to test the signi�cance between di�erent
groups. For the pairwise Wilcoxon test the correction proposed by Benjamini, Hochberg, and Yekutieli
was used to accomodate for multiple testing (Benjamini, Y., and Hochberg, Y. (1995). Controlling
the false discovery rate: a practical and powerful approach to multiple testing. Journal of the Royal
Statistical Society Series B 57, 289�300).
5

Chapter 1. Goal and methodology
Figure 1.2: Example of diverging stacked bar chart as used in this report to visualize the survey
responses. To the left of the graph, the question text is shown. The di�erent colors represent the
percentage of students that used that particular answer category from the �ve-point Likert scale. The
`diverging' refers to the central position of the `neutral' (in this case `somewhat typical') answer, and
the percentage of `negative' answers shown left and of `positive' answers shown right of the `neutral'
answer. The graphs in this report add on the left side the sum of the percentages of the `negative'
answers (`not at all typical' or `not typical') and on the right side the sum of the percentages of the
`positive' answers (`typical' or `very typical').
6

Chapter 2. Survey results
Chapter 2
Survey results
2.1 Elements important for �rst-year study success
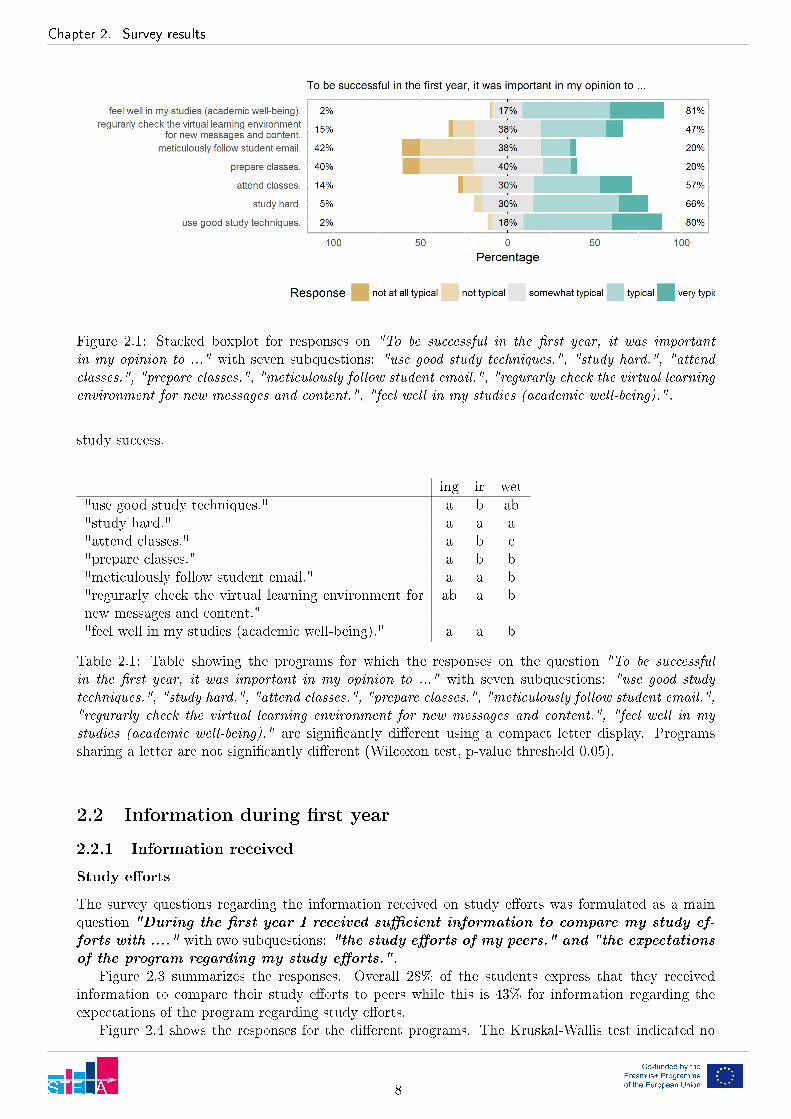
The survey questions regarding the elements important for �rst-year study success was formulated as a
main question "To be successful in the �rst year, it was important in my opinion to ..." with
seven subquestions: "use good study techniques.", "study hard.", "attend classes.", "pre-
pare classes.", "meticulously follow student email.", "regurarly check the virtual learning
environment for new messages and content.", "feel well in my studies (academic well-
being)." .
Figure 2.1 summarizes the responses. Overall 80% of the students express that using good study
techniques was important for �rst-year student success. 66% of the students considered studying hard
to be important. Attending classes is considered important by 57% of the students, while only 20%
considered preparing classes important. Similarly only 20% of the students think that meticulously
following student email was important for study success. Regularly checking the virtual learning envi-
ronment was considered important by more students (47%). Feeling well in the studies was considered
to be most important (81% if the students thought this was important for �rst-year student success).
Figure 2.2 shows the responses for the di�erent programs. For the di�erent questioned elements
for study success, the Kruskal-Wallis test indicated statistically signi�cant di�erences between the
responses on the survey question by the students in the di�erent programs except for studying hard
(chi-squared = 8.4324, df = 2, p-value = 0.01475; chi-squared = 1.1713, df = 2, p-value = 0.5567;
chi-squared = 45.711, df = 2, p-value = 1.186e-10; chi-squared = 21.799, df = 2, p-value = 1.847e-05;
chi-squared = 37.07, df = 2, p-value = 8.919e-09; chi-squared = 24.057, df = 2, p-value = 5.97e-06;
chi-squared = 11.553, df = 2, p-value = 0.003099).
Table 2.1 compactly presents the output of the pairwise Wilcoxon-test. For using good study
techniques, there are signi�cant di�erences between two programs: (ing) and (ir). The latter students
agree more that using good study techniques is important for �rst-year study success. There are no
signi�cant di�erences between wet and the other programs.
For studying hard there are no statistically signi�cant di�erences.
For attending classes, there are signi�cant di�erences between all programs: (ir), (wet), and (ing).
The latter group agrees most that attending classes is important for �rst-year study success and the
�rst group agrees less.
For preparing classes, there are signi�cant di�erences between two sets of programs: (ing) and (ir &
wet). The latter group agrees most that preparing classes is important for �rst-year study success.
For meticulously following student email, there are signi�cant di�erences between two sets of programs:
(ing & ir) and (wet). The latter group agrees most that following email is important for �rst-year
study success.
For regularly checking the virtual learning environment, there are signi�cant di�erences between two
programs: (ir) and (wet). The latter group agrees most that regularly checking the virtual learning
environment, is important for �rst-year study success.
For feeling well in the program, there are signi�cant di�erences between two sets of programs: (ing &ir)
and (wet). The latter group agrees most that feeling well in the programs is important for �rst-year
7
Chapter 2. Survey results
Figure 2.1: Stacked boxplot for responses on "To be successful in the �rst year, it was important
in my opinion to ..." with seven subquestions: "use good study techniques.", "study hard.", "attend
classes.", "prepare classes.", "meticulously follow student email.", "regurarly check the virtual learning
environment for new messages and content.", "feel well in my studies (academic well-being)." .
study success.
ing ir wet
"use good study techniques." a b ab
"study hard." a a a
"attend classes." a b c
"prepare classes." a b b
"meticulously follow student email." a a b
"regurarly check the virtual learning environment for
new messages and content."
ab a b
"feel well in my studies (academic well-being)." a a b
Table 2.1: Table showing the programs for which the responses on the question "To be successful
in the �rst year, it was important in my opinion to ..." with seven subquestions: "use good study
techniques.", "study hard.", "attend classes.", "prepare classes.", "meticulously follow student email.",
"regurarly check the virtual learning environment for new messages and content.", "feel well in my
studies (academic well-being)." are signi�cantly di�erent using a compact letter display. Programs
sharing a letter are not signi�cantly di�erent (Wilcoxon test, p-value threshold 0.05).
2.2 Information during �rst year
2.2.1 Information received
Study e�orts
The survey questions regarding the information received on study e�orts was formulated as a main
question "During the �rst year I received su�cient information to compare my study ef-
forts with ...." with two subquestions: "the study e�orts of my peers." and "the expectations
of the program regarding my study e�orts." .
Figure 2.3 summarizes the responses. Overall 28% of the students express that they received
information to compare their study e�orts to peers while this is 43% for information regarding the
expectations of the program regarding study e�orts.
Figure 2.4 shows the responses for the di�erent programs. The Kruskal-Wallis test indicated no
8

Chapter 2. Survey results
Figure 2.2: Stacked boxplot for responses on "To be successful in the �rst year, it was important
in my opinion to ..." with seven subquestions: "use good study techniques.", "study hard.", "attend
classes.", "prepare classes.", "meticulously follow student email.", "regurarly check the virtual learning
environment for new messages and content.", "feel well in my studies (academic well-being)." for
di�erent programs.
statistically signi�cant di�erences between the responses on the survey question by the students in the
di�erent programs for the information received on study e�orts (chi-squared = 4.7151, df = 2, p-value
= 0.09465; chi-squared = 0.39878, df = 2, p-value = 0.8192).
Table 2.2 compactly presents the output of the pairwise Wilcoxon-test. As highlighted above no
signi�cant di�erences between the programs can be shown related to the information received during
the �rst year regarding study e�orts.
Academic achievement
The survey questions regarding the information received on academic achievement was formulated
as a main question "During the �rst year I received su�cient information to compare my
9

Chapter 2. Survey results
Figure 2.3: Stacked boxplot for responses on "During the �rst year I received su�cient information to
compare my study e�orts with ...." with two subquestions: "the study e�orts of my peers." and "the
expectations of the program regarding my study e�orts." .
Figure 2.4: Stacked boxplot for responses on "During the �rst year I received su�cient information to
compare my study e�orts with ...." with two subquestions: "the study e�orts of my peers." and "the
expectations of the program regarding my study e�orts." for di�erent programs.
ing ir wet
"the study e�orts of my peers." a a a
"the expectations of the program regarding my study e�orts." a a a
Table 2.2: Table showing the programs for which the responses on the question "During the �rst
year I received su�cient information to compare my study e�orts with ...." with two subquestions:
"During the �rst year I received su�cient information to compare my study e�orts with ...." and "the
expectations of the program regarding my study e�orts." are signi�cantly di�erent using a compact
letter display. Programs sharing a letter are not signi�cantly di�erent (Wilcoxon test, p-value threshold
0.05).
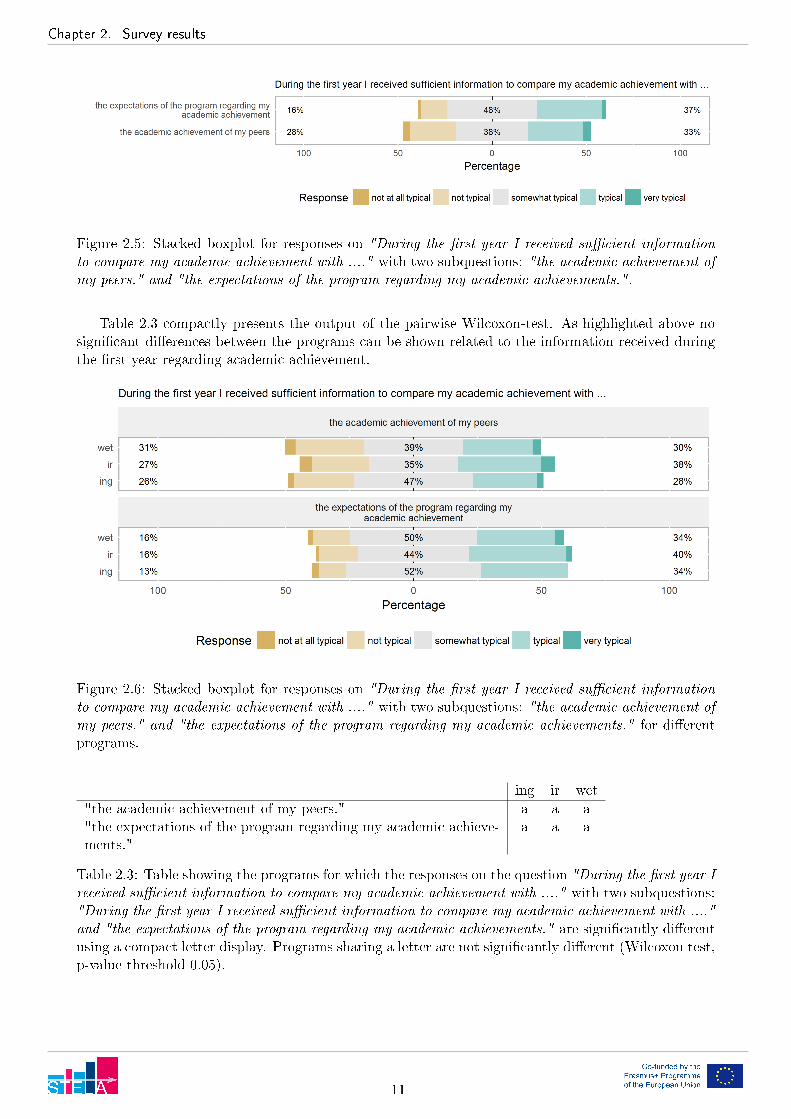
academic achievement with ...." with two subquestions: "the academic achievement of my
peers." and "the expectations of the program regarding my academic achievements." .
Figure 2.5 summarizes the responses. Overall 33% of the students express that they received
information to compare their academic achievement to peers while this is 37% for information regarding
the expectations of the program regarding academic achievement.
Figure 2.6 shows the responses for the di�erent programs. The Kruskal-Wallis test indicated no
statistically signi�cant di�erences between the responses on the survey question by the students in the
di�erent programs for the information received on academic achievement(chi-squared = 2.8229, df =
2, p-value = 0.2438; chi-squared = 1.127, df = 2, p-value = 0.5692).
10
Chapter 2. Survey results
Figure 2.5: Stacked boxplot for responses on "During the �rst year I received su�cient information
to compare my academic achievement with ...." with two subquestions: "the academic achievement of
my peers." and "the expectations of the program regarding my academic achievements." .
Table 2.3 compactly presents the output of the pairwise Wilcoxon-test. As highlighted above no
signi�cant di�erences between the programs can be shown related to the information received during
the �rst year regarding academic achievement.
Figure 2.6: Stacked boxplot for responses on "During the �rst year I received su�cient information
to compare my academic achievement with ...." with two subquestions: "the academic achievement of
my peers." and "the expectations of the program regarding my academic achievements." for di�erent
programs.
ing ir wet
"the academic achievement of my peers." a a a
"the expectations of the program regarding my academic achieve-
ments."
a a a
Table 2.3: Table showing the programs for which the responses on the question "During the �rst year I
received su�cient information to compare my academic achievement with ...." with two subquestions:
"During the �rst year I received su�cient information to compare my academic achievement with ...."
and "the expectations of the program regarding my academic achievements." are signi�cantly di�erent
using a compact letter display. Programs sharing a letter are not signi�cantly di�erent (Wilcoxon test,
p-value threshold 0.05).
11
Chapter 2. Survey results
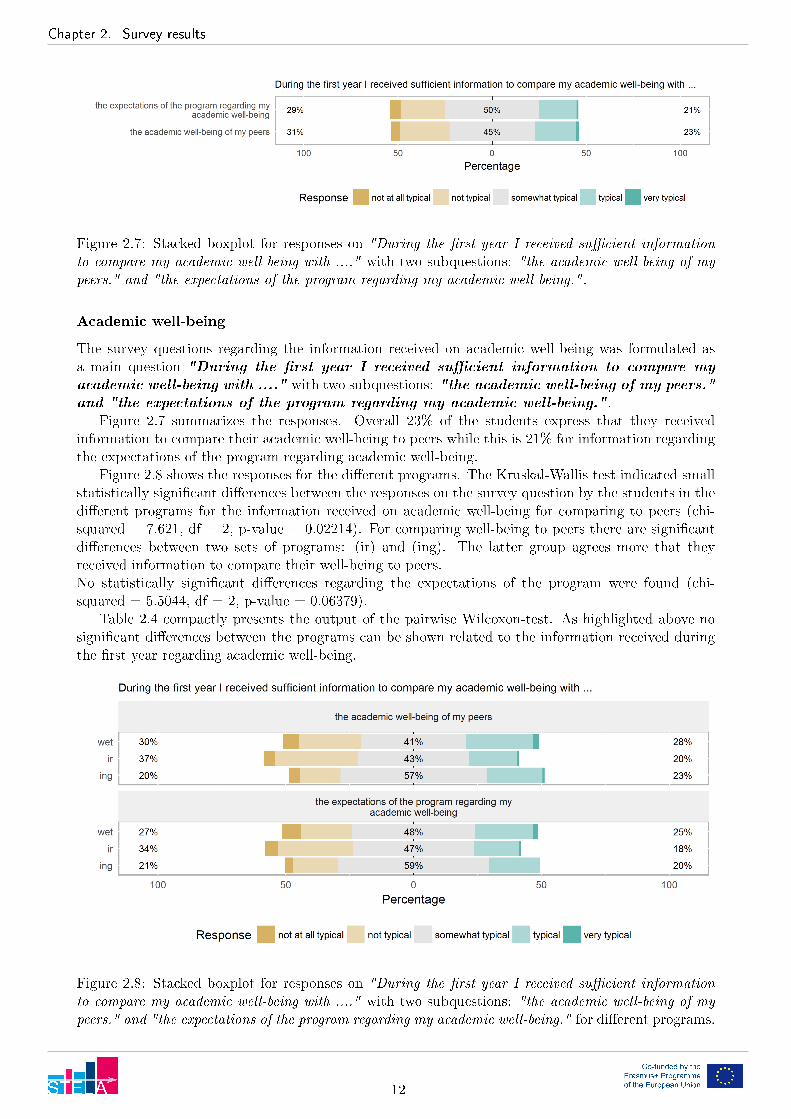
Figure 2.7: Stacked boxplot for responses on "During the �rst year I received su�cient information
to compare my academic well-being with ...." with two subquestions: "the academic well-being of my
peers." and "the expectations of the program regarding my academic well-being." .
Academic well-being
The survey questions regarding the information received on academic well-being was formulated as
a main question "During the �rst year I received su�cient information to compare my
academic well-being with ...." with two subquestions: "the academic well-being of my peers."
and "the expectations of the program regarding my academic well-being." .
Figure 2.7 summarizes the responses. Overall 23% of the students express that they received
information to compare their academic well-being to peers while this is 21% for information regarding
the expectations of the program regarding academic well-being.
Figure 2.8 shows the responses for the di�erent programs. The Kruskal-Wallis test indicated small
statistically signi�cant di�erences between the responses on the survey question by the students in the
di�erent programs for the information received on academic well-being for comparing to peers (chi-
squared = 7.621, df = 2, p-value = 0.02214). For comparing well-being to peers there are signi�cant
di�erences between two sets of programs: (ir) and (ing). The latter group agrees more that they
received information to compare their well-being to peers.
No statistically signi�cant di�erences regarding the expectations of the program were found (chi-
squared = 5.5044, df = 2, p-value = 0.06379).
Table 2.4 compactly presents the output of the pairwise Wilcoxon-test. As highlighted above no
signi�cant di�erences between the programs can be shown related to the information received during
the �rst year regarding academic well-being.
Figure 2.8: Stacked boxplot for responses on "During the �rst year I received su�cient information
to compare my academic well-being with ...." with two subquestions: "the academic well-being of my
peers." and "the expectations of the program regarding my academic well-being." for di�erent programs.
12

Chapter 2. Survey results
ing ir wet
"the academic well-being of my peers." a b ab
"the expectations of the program regarding my academic well-
being."
a a a
Table 2.4: Table showing the programs for which the responses on the question "During the �rst year
I received su�cient information to compare my academic well-being with ...." with two subquestions:
"During the �rst year I received su�cient information to compare my academic well-being with ...."
and "the expectations of the program regarding my academic well-being." are signi�cantly di�erent
using a compact letter display. Programs sharing a letter are not signi�cantly di�erent (Wilcoxon test,
p-value threshold 0.05).
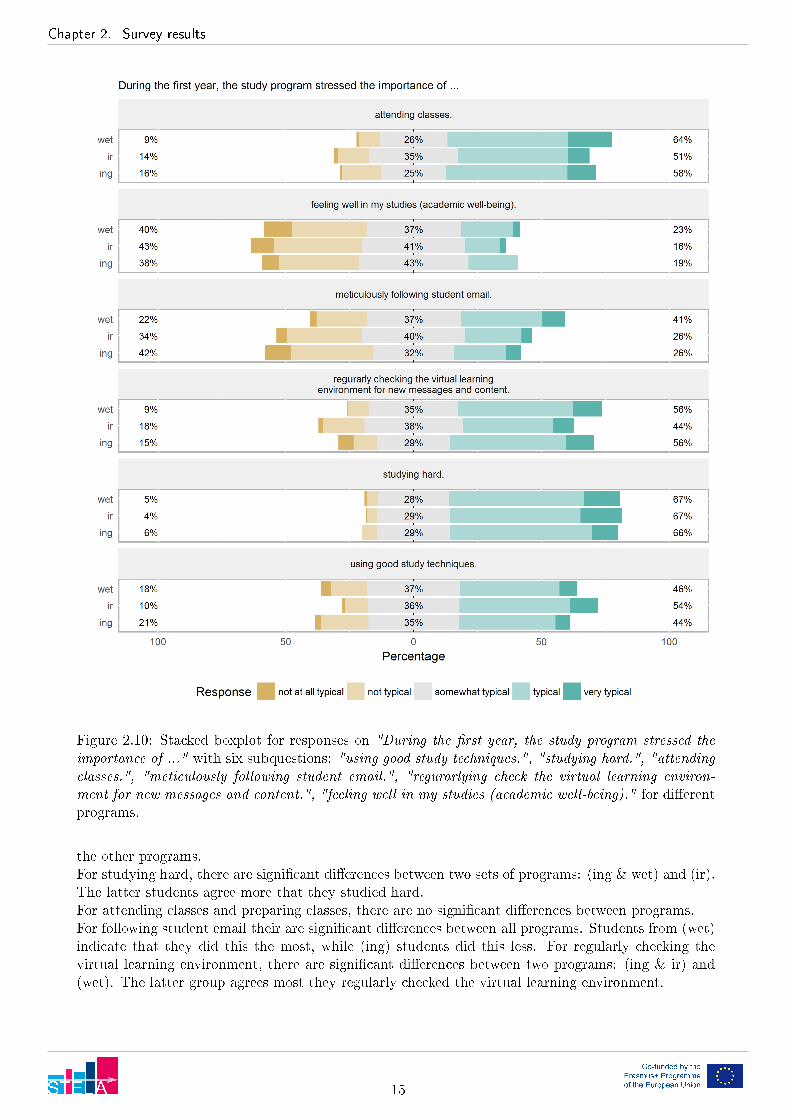
Figure 2.9: Stacked boxplot for responses on "During the �rst year, the study program stressed the
importance of ..." with six subquestions: "using good study techniques.", "studying hard.", "attending
classes.", "meticulously following student email.", "regurarlying check the virtual learning environment
for new messages and content.", "feeling well in my studies (academic well-being)." .
2.2.2 Emphasis of program
The survey questions regarding the elements emphasized by the program during the �rst year was for-
mulated as a main question "During the �rst year, the study program stressed the importance
of ..." with six subquestions: "using good study techniques.", "studying hard.", "attending
classes.", "meticulously following student email.", "regurarlying check the virtual learn-
ing environment for new messages and content.", "feeling well in my studies (academic
well-being)." .
Figure 2.9 summarizes the responses. Overall 49% of the students express that the program ex-
pressed the importance of using good study techniques. Even more students agree that the program
emphasized the importance of studying hard (67%), attending classes (57%), and regurarly checking
the virtual learning environment (51%). Fewer students agree that the program stressed the impor-
tance of meticulously following student email (32%) and feeling well in the study program (19%).
Figure 2.10 shows the responses for the di�erent programs. Regarding the emphasis of programs
on using good study techniques, attending classes, following student email, and regularly checking
the virtual learning environment signi�cant the Kruskal-Wallis test indicated signi�cant di�erences
between di�erent study programs (chi-squared = 10.306, df = 2, p-value = 0.005782; chi-squared =
11.893, df = 2, p-value = 0.002615; chi-squared = 20.592, df = 2, p-value = 3.377e-05; chi-squared
= 11.324, df = 2, p-value = 0.003476) The Kruskal-Wallis test indicated no signi�cant di�erences
between study program regarding the emphasis on studying hard and academic well-being (chi-squared
= 1.0756, df = 2, p-value = 0.584; chi-squared = 1.8888, df = 2, p-value = 0.3889)
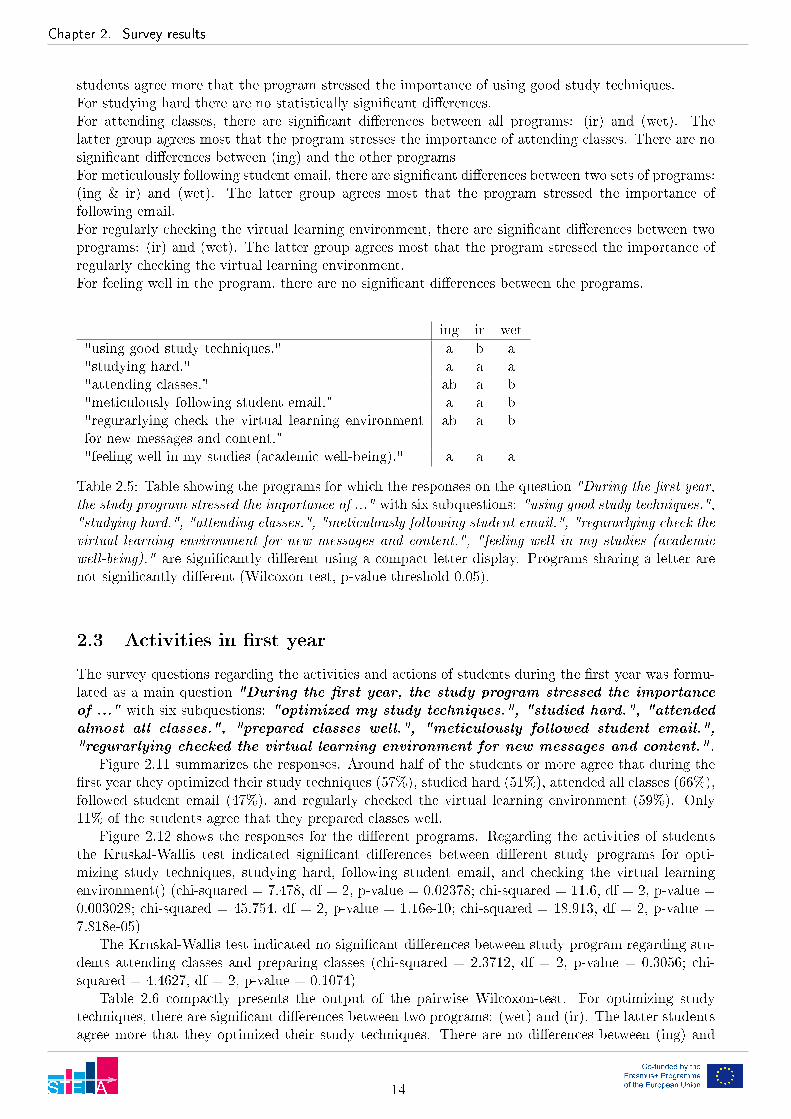
Table 2.5 compactly presents the output of the pairwise Wilcoxon-test. For using good study
techniques, there are signi�cant di�erences between two programs: (ing & wet) and (ir). The latter
13
Chapter 2. Survey results
students agree more that the program stressed the importance of using good study techniques.
For studying hard there are no statistically signi�cant di�erences.
For attending classes, there are signi�cant di�erences between all programs: (ir) and (wet). The
latter group agrees most that the program stresses the importance of attending classes. There are no
signi�cant di�erences between (ing) and the other programs
For meticulously following student email, there are signi�cant di�erences between two sets of programs:
(ing & ir) and (wet). The latter group agrees most that the program stressed the importance of
following email.
For regularly checking the virtual learning environment, there are signi�cant di�erences between two
programs: (ir) and (wet). The latter group agrees most that the program stressed the importance of
regularly checking the virtual learning environment.
For feeling well in the program, there are no signi�cant di�erences between the programs.
ing ir wet
"using good study techniques." a b a
"studying hard." a a a
"attending classes." ab a b
"meticulously following student email." a a b
"regurarlying check the virtual learning environment
for new messages and content."
ab a b
"feeling well in my studies (academic well-being)." a a a
Table 2.5: Table showing the programs for which the responses on the question "During the �rst year,
the study program stressed the importance of ..." with six subquestions: "using good study techniques.",
"studying hard.", "attending classes.", "meticulously following student email.", "regurarlying check the
virtual learning environment for new messages and content.", "feeling well in my studies (academic
well-being)." are signi�cantly di�erent using a compact letter display. Programs sharing a letter are
not signi�cantly di�erent (Wilcoxon test, p-value threshold 0.05).
2.3 Activities in �rst year
The survey questions regarding the activities and actions of students during the �rst year was formu-
lated as a main question "During the �rst year, the study program stressed the importance
of ..." with six subquestions: "optimized my study techniques.", "studied hard.", "attended
almost all classes.", "prepared classes well.", "meticulously followed student email.",
"regurarlying checked the virtual learning environment for new messages and content." .
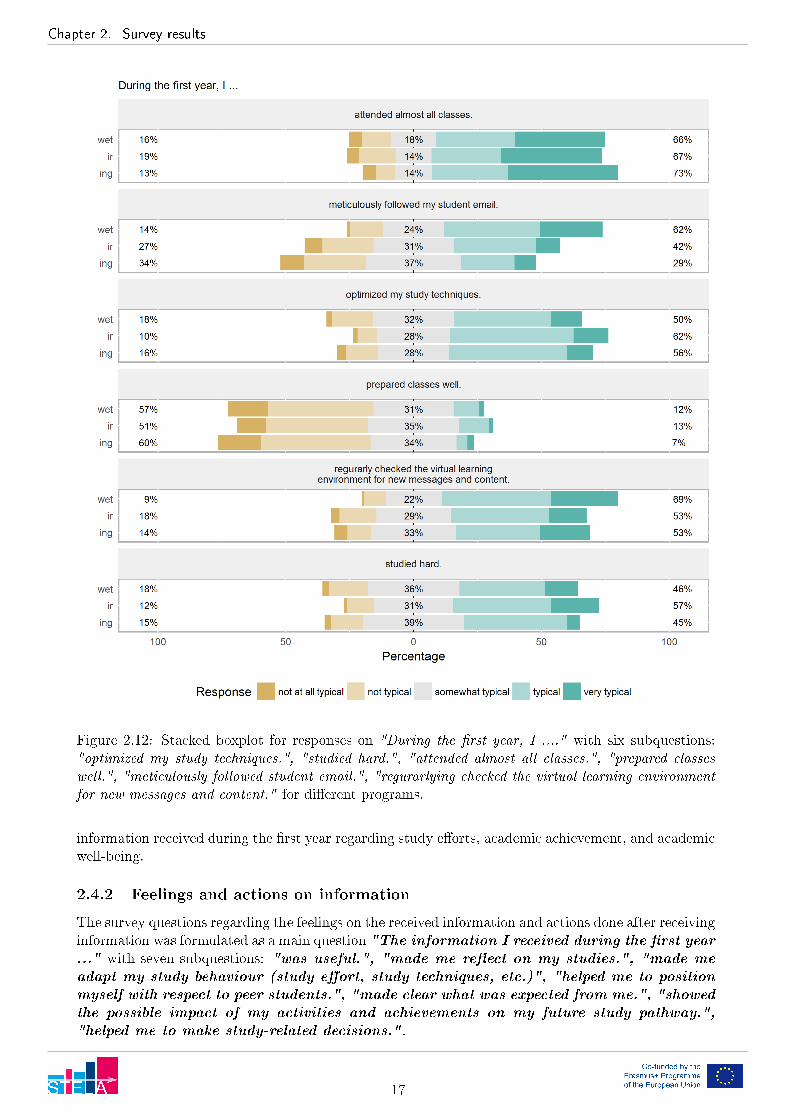
Figure 2.11 summarizes the responses. Around half of the students or more agree that during the
�rst year they optimized their study techniques (57%), studied hard (51%), attended all classes (66%),
followed student email (47%), and regularly checked the virtual learning environment (59%). Only
11% of the students agree that they prepared classes well.
Figure 2.12 shows the responses for the di�erent programs. Regarding the activities of students
the Kruskal-Wallis test indicated signi�cant di�erences between di�erent study programs for opti-
mizing study techniques, studying hard, following student email, and checking the virtual learning
environment() (chi-squared = 7.478, df = 2, p-value = 0.02378; chi-squared = 11.6, df = 2, p-value =
0.003028; chi-squared = 45.754, df = 2, p-value = 1.16e-10; chi-squared = 18.913, df = 2, p-value =
7.818e-05)
The Kruskal-Wallis test indicated no signi�cant di�erences between study program regarding stu-
dents attending classes and preparing classes (chi-squared = 2.3712, df = 2, p-value = 0.3056; chi-
squared = 4.4627, df = 2, p-value = 0.1074)
Table 2.6 compactly presents the output of the pairwise Wilcoxon-test. For optimizing study
techniques, there are signi�cant di�erences between two programs: (wet) and (ir). The latter students
agree more that they optimized their study techniques. There are no di�erences between (ing) and
14
Chapter 2. Survey results
Figure 2.10: Stacked boxplot for responses on "During the �rst year, the study program stressed the
importance of ..." with six subquestions: "using good study techniques.", "studying hard.", "attending
classes.", "meticulously following student email.", "regurarlying check the virtual learning environ-
ment for new messages and content.", "feeling well in my studies (academic well-being)." for di�erent
programs.
the other programs.
For studying hard, there are signi�cant di�erences between two sets of programs: (ing & wet) and (ir).
The latter students agree more that they studied hard.
For attending classes and preparing classes, there are no signi�cant di�erences between programs.
For following student email their are signi�cant di�erences between all programs. Students from (wet)
indicate that they did this the most, while (ing) students did this less. For regularly checking the
virtual learning environment, there are signi�cant di�erences between two programs: (ing & ir) and
(wet). The latter group agrees most they regularly checked the virtual learning environment.
15

Chapter 2. Survey results
Figure 2.11: Stacked boxplot for responses on "During the �rst year, I ...." with six subquestions:
"optimized my study techniques.", "studied hard.", "attended almost all classes.", "prepared classes
well.", "meticulously followed student email.", "regurarlying checked the virtual learning environment
for new messages and content." .
ing ir wet
"optimized my study techniques." ab a b
"studied hard." a b a
"attended almost all classes." a a a
"prepared classes well." a a a
"meticulously followed student email." a b c
"regurarlying checked the virtual learning environment
for new messages and content."
a a b
Table 2.6: Table showing the programs for which the responses on the question "During the �rst year,
I ...." with six subquestions: "optimized my study techniques.", "studied hard.", "attended almost all
classes.", "prepared classes well.", "meticulously followed student email.", "regurarlying checked the
virtual learning environment for new messages and content." are signi�cantly di�erent using a compact
letter display. Programs sharing a letter are not signi�cantly di�erent (Wilcoxon test, p-value threshold
0.05).
2.4 Perception of information received
2.4.1 Su�cient information
The survey questions regarding the perception of the received information was su�cient was formulated
as a main question "During the �rst year I received su�cient information regarding .."
with three subquestions: "my study e�orts (time studied, study material, study techniques,
etc.).", "my academic achievement (results on tests, exams, etc.)", and "my academic
well-being (how I feel in the program)." .
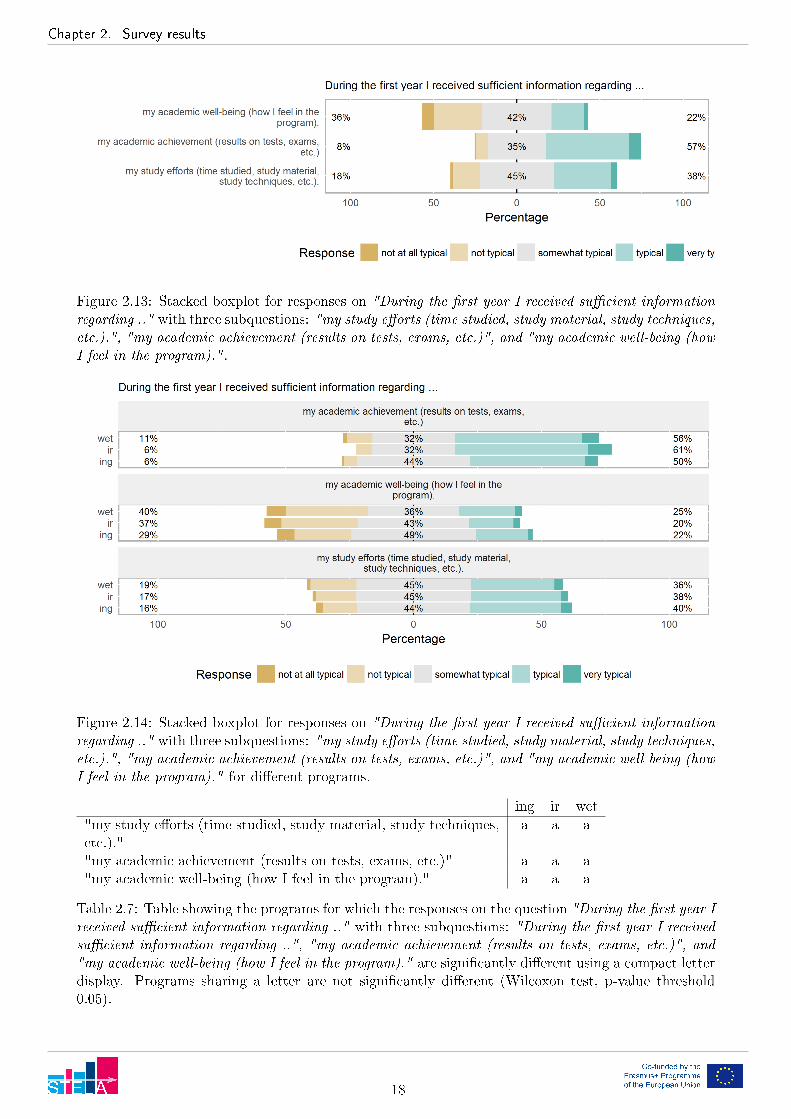
Figure 2.13 summarizes the responses. Overall 57% of the students express that they received
su�cient information regarding their academic achievement, while this is only 38% and 22% for study
e�orts and academic well-being respectively.
Figure 2.14 shows the responses for the di�erent programs. The Kruskal-Wallis test indicated
no statistically signi�cant di�erences regarding the perception of the su�ciency of the information
received on study e�orts, academic achievement, and academic well-being (chi-squared = 1.8251, df
= 2, p-value = 0.4015; chi-squared = 2.4702, df = 2, p-value = 0.2908; chi-squared = 1.7767, df = 2,
p-value = 0.4113).
Table 2.7 compactly presents the output of the pairwise Wilcoxon-test. As highlighted above no
signi�cant di�erences between the programs can be shown related to the perceived su�ciency of the
16
Chapter 2. Survey results
Figure 2.12: Stacked boxplot for responses on "During the �rst year, I ...." with six subquestions:
"optimized my study techniques.", "studied hard.", "attended almost all classes.", "prepared classes
well.", "meticulously followed student email.", "regurarlying checked the virtual learning environment
for new messages and content." for di�erent programs.
information received during the �rst year regarding study e�orts, academic achievement, and academic
well-being.
2.4.2 Feelings and actions on information
The survey questions regarding the feelings on the received information and actions done after receiving
information was formulated as a main question "The information I received during the �rst year
..." with seven subquestions: "was useful.", "made me re�ect on my studies.", "made me
adapt my study behaviour (study e�ort, study techniques, etc.)", "helped me to position
myself with respect to peer students.", "made clear what was expected from me.", "showed
the possible impact of my activities and achievements on my future study pathway.",
"helped me to make study-related decisions." .
17
Chapter 2. Survey results
Figure 2.13: Stacked boxplot for responses on "During the �rst year I received su�cient information
regarding .." with three subquestions: "my study e�orts (time studied, study material, study techniques,
etc.).", "my academic achievement (results on tests, exams, etc.)", and "my academic well-being (how
I feel in the program)." .
Figure 2.14: Stacked boxplot for responses on "During the �rst year I received su�cient information
regarding .." with three subquestions: "my study e�orts (time studied, study material, study techniques,
etc.).", "my academic achievement (results on tests, exams, etc.)", and "my academic well-being (how
I feel in the program)." for di�erent programs.
ing ir wet
"my study e�orts (time studied, study material, study techniques,
etc.)."
a a a
"my academic achievement (results on tests, exams, etc.)" a a a
"my academic well-being (how I feel in the program)." a a a
Table 2.7: Table showing the programs for which the responses on the question "During the �rst year I
received su�cient information regarding .." with three subquestions: "During the �rst year I received
su�cient information regarding ..", "my academic achievement (results on tests, exams, etc.)", and
"my academic well-being (how I feel in the program)." are signi�cantly di�erent using a compact letter
display. Programs sharing a letter are not signi�cantly di�erent (Wilcoxon test, p-value threshold
0.05).
18

Chapter 2. Survey results
Figure 2.15: Stacked boxplot for responses on "The information I received during the �rst year ..."
with seven subquestions: "was useful.", "made me re�ect on my studies.", "made me adapt my study
behaviour (study e�ort, study techniques, etc.)", "helped me to position myself with respect to peer
students.", "made clear what was expected from me.", "showed the possible impact of my activities and
achievements on my future study pathway.", "helped me to make study-related decisions." .
Figure 2.15 summarizes the responses. 55% of the students agree the information was useful, 44%
agrees it made them re�ect on their studies, 34% agrees it made them adapt their study behavior.
Only 19% agrees it helped them to position themselves with respect to their peers. 49% agrees it made
clear what was expected from them, 48% agrees that it showed the possible impact on their future
study pathway, and 41% agrees it helped them to make study-related choices.
Figure 2.16 shows the responses for the di�erent programs. The Kruskal-Wallis test indicated
statistically signi�cant di�erences regarding the positioning with respect to peers and regarding the
shown impact on the future study pathway (chi-squared = 8.5952, df = 2, p-value = 0.0136; chi-squared
= 14.616, df = 2, p-value = 0.0006701 ). For the other questioned elements, the Kruskal-Wallis test
indicated no statistically signi�cant di�erences between the responses on the survey question by the
students in the di�erent programs ( chi-squared = 1.8251, df = 2, p-value = 0.4015; chi-squared =
2.4702, df = 2, p-value = 0.2908; chi-squared = 1.7767, df = 2, p-value = 0.4113; chi-squared =
0.30251, df = 2, p-value = 0.8596; chi-squared = 4.7618, df = 2, p-value = 0.09247 ).
Table 2.8 compactly presents the output of the pairwise Wilcoxon-test. As indicated above signi�-
cant di�erences between programs only exist for comparison to peers and the expectations of pograms.
For the comparison to peers, there are signi�cant di�erences between two programs: (wet) and (ir).
The latter students agree more that they received information to compare themselves to peers. There
are no signi�cant di�erences between (ing) and the other programs.
For the impact on the future study pathway, there are signi�cant di�erences between two programs:
(ing & wet) and (ir). The latter students agree more that they received information that showed the
impact on their future study pathway.
19

Chapter 2. Survey results
Figure 2.16: Stacked boxplot for responses on "The information I received during the �rst year ..."
with seven subquestions: "was useful.", "made me re�ect on my studies.", "made me adapt my study
behaviour (study e�ort, study techniques, etc.)", "helped me to position myself with respect to peer
students.", "made clear what was expected from me.", "showed the possible impact of my activities and
achievements on my future study pathway.", "helped me to make study-related decisions." for di�erent
programs.
2.5 Satisfaction and general feelings
2.5.1 Satisfaction
The survey questions regarding the satisfaction on the information received and support o�ered was
formulated as a main question "In general I was satis�ed with ..." with two subquestions: "the
information I received that was o�ered during the �rst year." and "the support that was
o�ered during the �rst year."" .
Figure 2.17 summarizes the responses. Overall 56% of the students express that they are satis�ed
with the information they received during the �rst year. 65% of the students express that they are
20

Chapter 2. Survey results
ing ir wet
"was useful." a a a
"made me re�ect on my studies." a a a
"made me adapt my study behaviour (study e�ort,
study techniques, etc.)"
a a a
"helped me to position myself with respect to peer
students."
ab a b
"made clear what was expected from me." a a a
"showed the possible impact of my activities and
achievements on my future study pathway."
a b a
"helped me to make study-related decisions." a a a
Table 2.8: Table showing the programs for which the responses on the question "The information I
received during the �rst year ..." with seven subquestions: "was useful.", "made me re�ect on my
studies.", "made me adapt my study behaviour (study e�ort, study techniques, etc.)", "helped me to
position myself with respect to peer students.", "made clear what was expected from me.", "showed the
possible impact of my activities and achievements on my future study pathway.", "helped me to make
study-related decisions." are signi�cantly di�erent using a compact letter display. Programs sharing a
letter are not signi�cantly di�erent (Wilcoxon test, p-value threshold 0.05).
Figure 2.17: Stacked boxplot for responses on "In general I was satis�ed with ..." with two subques-
tions: "the information I received that was o�ered during the �rst year." and "the support that was
o�ered during the �rst year."" .
satis�ed with the support that was o�ered during the �rst year.
Figure 2.18 shows the responses for the di�erent programs. The Kruskal-Wallis test indicated no
statistically signi�cant di�erences between satisfaction on the information received and the support
o�ered of the students in the di�erent programs (chi-squared = 5.6823, df = 2, p-value = 0.05836;
chi-squared = 4.5921, df = 2, p-value = 0.1007).
Table 2.9 compactly presents the output of the pairwise Wilcoxon-test. As highlighted above no
signi�cant di�erences between the programs can be shown related to the satisfaction of the information
received and support o�ered during the �rst year.
ing ir wet
"the information I received that was o�ered during the �rst year." a a a
"the support that was o�ered during the �rst year."" a a a
Table 2.9: Table showing the programs for which the responses on the question "In general I was
satis�ed with ..." with two subquestions: "In general I was satis�ed with ..." and "the support that
was o�ered during the �rst year."" are signi�cantly di�erent using a compact letter display. Programs
sharing a letter are not signi�cantly di�erent (Wilcoxon test, p-value threshold 0.05).
21

Chapter 2. Survey results
Figure 2.18: Stacked boxplot for responses on "In general I was satis�ed with ..." with two subques-
tions: "the information I received that was o�ered during the �rst year." and "the support that was
o�ered during the �rst year."" for di�erent programs.
Figure 2.19: Stacked boxplot for responses on "During the �rst year ...." with four subquestions: "I
felt lost.", "I felt insecure about my study e�orts.", "I felt insecure about my academic achievements.",
and "I used the supporting services (tutorial service, workshops, infomoments, etc.)" .
2.5.2 General feelings �rst year
The survey questions regarding the elements emphasized by the program during the �rst year was
formulated as a main question "During the �rst year ...." with four subquestions: "I felt lost.",
"I felt insecure about my study e�orts.", "I felt insecure about my academic achieve-
ments.", and "I used the supporting services (tutorial service, workshops, infomoments,
etc.)" .
Figure 2.19 summarizes the responses. Only 9% of the students indicate they felt lost in the �rst
year. 34% and 36% indicate they felt insecure about their study e�orts and academic achievements.
36% agree that they used supporting services o�ered by the university.
Figure 2.20 shows the responses for the di�erent programs. The Kruskal-Wallis test indicated no
signi�cant di�erences between di�erent study programs for students feeling lost or insecure about their
study e�orts and academic achievements (chi-squared = 0.78244, df = 2, p-value = 0.6762; chi-squared
= 0.77751, df = 2, p-value = 0.6779; chi-squared = 2.0881, df = 2, p-value = 0.352). A small signi�cant
di�erence between di�erent study programs was found for students using support services (chi-squared
= 6.2638, df = 2, p-value = 0.04363;
Table 2.10 compactly presents the output of the pairwise Wilcoxon-test. As indicated above no
22

Chapter 2. Survey results
statistically signi�cant di�erences between study programs exist regarding students feeling lost or
insecure about their study e�orts and academic achievements.
For the use of support services, there are signi�cant di�erences between two programs: (ing) and
(ir). The latter students agree more that they used the support services.
Figure 2.20: Stacked boxplot for responses on "During the �rst year ...." with four subquestions: "I
felt lost.", "I felt insecure about my study e�orts.", "I felt insecure about my academic achievements.",
and "I used the supporting services (tutorial service, workshops, infomoments, etc.)" for di�erent
programs.
ing ir wet
"I felt lost." a a a
"I felt insecure about my study e�orts." a a a
"I felt insecure about my academic achievements." a a a
"I used the supporting services (tutorial service, work-
shops, infomoments, etc.)"
a b ab
Table 2.10: Table showing the programs for which the responses on the question "During the �rst year
...." with four subquestions: "I felt lost.", "I felt insecure about my study e�orts.", "I felt insecure
about my academic achievements.", and "I used the supporting services (tutorial service, workshops,
infomoments, etc.)" are signi�cantly di�erent using a compact letter display. Programs sharing a
letter are not signi�cantly di�erent (Wilcoxon test, p-value threshold 0.05).
23

Chapter 3. Conclusion
Chapter 3
Conclusion
This report focused on the experiences of �rst-year students in STEM programs at KU Leuven by
reporting on the survey administered in the �rst weeks of the academic year for second year students
regarding their experiences in the �rst year.
24