secondary care ecological analysis. bacteraemia variation
TRANSCRIPT

Page 1/12
Bacteraemia Variation During The COVID-19 Pandemic; A Multi-Centre UKSecondary Care Ecological Analysis.Sarah Denny
Chelsea and Westminster Hospital NHS Foundation TrustTimothy M Rawson
Imperial College Healthcare NHS TrustGiovanni Satta
Imperial College Healthcare NHS TrustScott JC Pallett
Royal Centre for Defence MedicineAhmed Abdulaal
Chelsea and Westminster Hospital NHS Foundation TrustStephen Hughes
Chelsea and Westminster Hospital NHS Foundation TrustMark Gilchrist
Imperial College Healthcare NHS TrustNabeela Mughal
Chelsea and Westminster Hospital NHS Foundation TrustLuke S P Moore ( [email protected] )
Imperial College London https://orcid.org/0000-0001-7095-7922
Research article
Keywords: Microbiology, Blood culture, Coronavirus, SARS-CoV-2
Posted Date: December 1st, 2020
DOI: https://doi.org/10.21203/rs.3.rs-113509/v1
License: This work is licensed under a Creative Commons Attribution 4.0 International License. Read Full License
Page 2/12
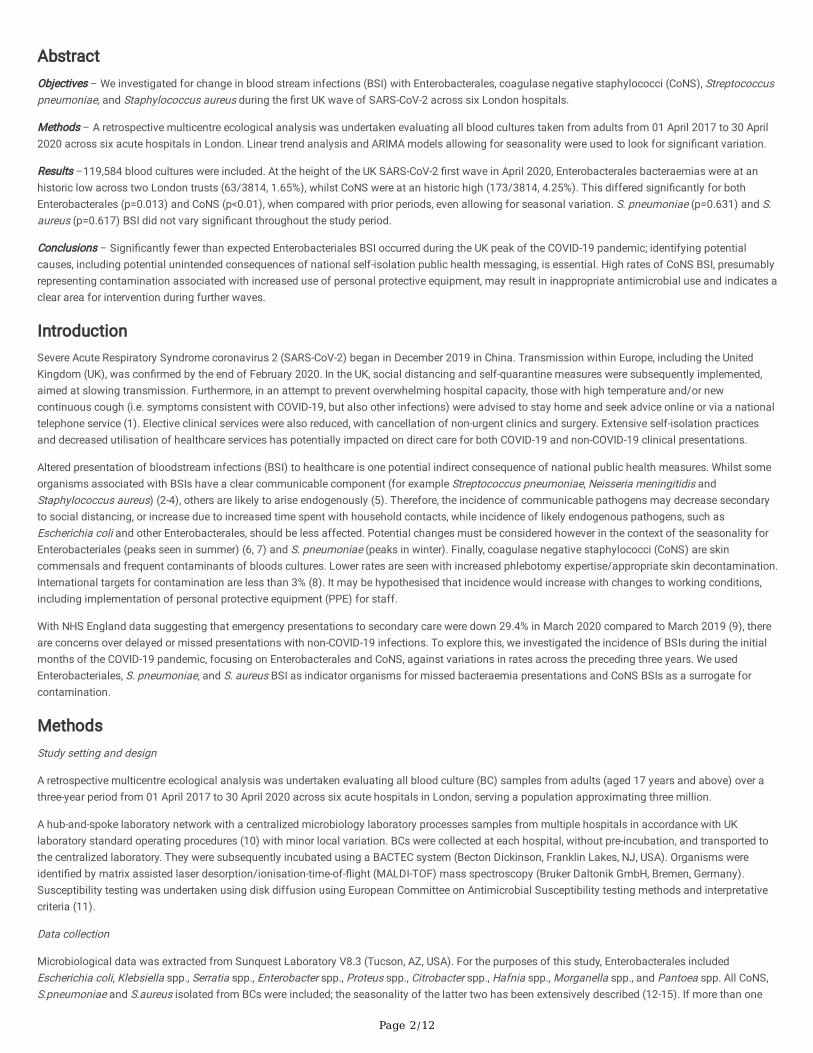
AbstractObjectives – We investigated for change in blood stream infections (BSI) with Enterobacterales, coagulase negative staphylococci (CoNS), Streptococcuspneumoniae, and Staphylococcus aureus during the �rst UK wave of SARS-CoV-2 across six London hospitals.
Methods – A retrospective multicentre ecological analysis was undertaken evaluating all blood cultures taken from adults from 01 April 2017 to 30 April2020 across six acute hospitals in London. Linear trend analysis and ARIMA models allowing for seasonality were used to look for signi�cant variation.
Results –119,584 blood cultures were included. At the height of the UK SARS-CoV-2 �rst wave in April 2020, Enterobacterales bacteraemias were at anhistoric low across two London trusts (63/3814, 1.65%), whilst CoNS were at an historic high (173/3814, 4.25%). This differed signi�cantly for bothEnterobacterales (p=0.013) and CoNS (p<0.01), when compared with prior periods, even allowing for seasonal variation. S. pneumoniae (p=0.631) and S.aureus (p=0.617) BSI did not vary signi�cant throughout the study period.
Conclusions – Signi�cantly fewer than expected Enterobacteriales BSI occurred during the UK peak of the COVID-19 pandemic; identifying potentialcauses, including potential unintended consequences of national self-isolation public health messaging, is essential. High rates of CoNS BSI, presumablyrepresenting contamination associated with increased use of personal protective equipment, may result in inappropriate antimicrobial use and indicates aclear area for intervention during further waves.
IntroductionSevere Acute Respiratory Syndrome coronavirus 2 (SARS-CoV-2) began in December 2019 in China. Transmission within Europe, including the UnitedKingdom (UK), was con�rmed by the end of February 2020. In the UK, social distancing and self-quarantine measures were subsequently implemented,aimed at slowing transmission. Furthermore, in an attempt to prevent overwhelming hospital capacity, those with high temperature and/or newcontinuous cough (i.e. symptoms consistent with COVID-19, but also other infections) were advised to stay home and seek advice online or via a nationaltelephone service (1). Elective clinical services were also reduced, with cancellation of non-urgent clinics and surgery. Extensive self-isolation practicesand decreased utilisation of healthcare services has potentially impacted on direct care for both COVID-19 and non-COVID-19 clinical presentations.
Altered presentation of bloodstream infections (BSI) to healthcare is one potential indirect consequence of national public health measures. Whilst someorganisms associated with BSIs have a clear communicable component (for example Streptococcus pneumoniae, Neisseria meningitidis andStaphylococcus aureus) (2-4), others are likely to arise endogenously (5). Therefore, the incidence of communicable pathogens may decrease secondaryto social distancing, or increase due to increased time spent with household contacts, while incidence of likely endogenous pathogens, such asEscherichia coli and other Enterobacterales, should be less affected. Potential changes must be considered however in the context of the seasonality forEnterobacteriales (peaks seen in summer) (6, 7) and S. pneumoniae (peaks in winter). Finally, coagulase negative staphylococci (CoNS) are skincommensals and frequent contaminants of bloods cultures. Lower rates are seen with increased phlebotomy expertise/appropriate skin decontamination.International targets for contamination are less than 3% (8). It may be hypothesised that incidence would increase with changes to working conditions,including implementation of personal protective equipment (PPE) for staff.
With NHS England data suggesting that emergency presentations to secondary care were down 29.4% in March 2020 compared to March 2019 (9), thereare concerns over delayed or missed presentations with non-COVID-19 infections. To explore this, we investigated the incidence of BSIs during the initialmonths of the COVID-19 pandemic, focusing on Enterobacterales and CoNS, against variations in rates across the preceding three years. We usedEnterobacteriales, S. pneumoniae, and S. aureus BSI as indicator organisms for missed bacteraemia presentations and CoNS BSIs as a surrogate forcontamination.
MethodsStudy setting and design
A retrospective multicentre ecological analysis was undertaken evaluating all blood culture (BC) samples from adults (aged 17 years and above) over athree-year period from 01 April 2017 to 30 April 2020 across six acute hospitals in London, serving a population approximating three million.
A hub-and-spoke laboratory network with a centralized microbiology laboratory processes samples from multiple hospitals in accordance with UKlaboratory standard operating procedures (10) with minor local variation. BCs were collected at each hospital, without pre-incubation, and transported tothe centralized laboratory. They were subsequently incubated using a BACTEC system (Becton Dickinson, Franklin Lakes, NJ, USA). Organisms wereidenti�ed by matrix assisted laser desorption/ionisation-time-of-�ight (MALDI-TOF) mass spectroscopy (Bruker Daltonik GmbH, Bremen, Germany).Susceptibility testing was undertaken using disk diffusion using European Committee on Antimicrobial Susceptibility testing methods and interpretativecriteria (11).
Data collection
Microbiological data was extracted from Sunquest Laboratory V8.3 (Tucson, AZ, USA). For the purposes of this study, Enterobacterales includedEscherichia coli, Klebsiella spp., Serratia spp., Enterobacter spp., Proteus spp., Citrobacter spp., Hafnia spp., Morganella spp., and Pantoea spp. All CoNS,S.pneumoniae and S.aureus isolated from BCs were included; the seasonality of the latter two has been extensively described (12-15). If more than one

Page 3/12
pathogen was isolated from a BC, each was recorded individually at either genus or species level. Samples with multiple Enterobacterales or CoNS wererecorded as a single positive BC. Repeated positives within a 14-day period were not de-duplicated and patient records were not assessed to determine ifCoNS BSIs represented true infection.
Data analysis
To explore seasonal variations in BSI rates, results were classi�ed as spring (March–May), summer (June–August), autumn (September–November) andwinter (December–February). For spring 2017, only April and May data were available. March and April 2020 were considered as the period when socialdistancing measures were in place, encompassing the UK COVID-19 peak (16). The same period in 2019 was analysed for comparison.
To explore changing trends in BCs results during COVID-19, two different statistical models were used; both (�rst) allowing for seasonality, and (second)then separately obviating any potential seasonality. The �rst method was a time-series analysis performed in R (R Core Team). After testing for theabsence of �rst-order autocorrelations with the Durbin-Watson statistic, univariable autoregressive integrated moving average (ARIMA) models were �ttedto data from CoNS, Enterobacterales, S.pneumoniae, and S.aureus from April 2017 to December 2019. These models were used to forecast estimated BSIrates for January to June 2020. To explore differences between observed and expected BSI rates during the COVID-19 peak, they were graphicallycompared.
The second method was a linear trend analysis of variations in observed rates of BSIs. Z-scores were calculated for Enterobacterales, CoNS,S.penumoniae and S.aureus using SPSS (IBM Corp, Armonk, NY, USA). Data were checked for normality using the Shapiro-Wilk test. Where non-normaldistribution was identi�ed, data were transformed prior to analysis. Z-scores were then calculated each month by applying the standard formula z = (x-μ)/σ (x = raw score, μ = mean, σ = standard deviation). Statistical signi�cance for z-scores were determined using R (R Core Team).
Study approval
This analysis was registered with North West London Pathology hosted by Imperial College Healthcare NHS Trust as a service evaluation (referencePAT_012) to investigate BC contamination rates. Individual consent was not indicated for this ecological level analysis reporting only aggregated data.
ResultsDuring April 2017 to April 2020, 133,856 BCs were identi�ed. Of those, 12,625 were from an external source (non-networked hospital), 2,002 unclassi�able,and 729 not processed, leaving 119,584 for analysis. The overall number of BC requests remained stable throughout the entire period in terms of absolutenumbers. From the 119,584 BCs, no pathogen/microorganism was detected in 109,144 (91.27%). Growth was demonstrated in 10,440 cultures (8.73%).Enterobacterales were the most commonly isolated pathogen (3,508 cultures, 2.93% of total), followed by CoNS (2,855 cultures, 2.39%). Full details ofcultured microorganisms and number of tests are provided (Table 1).
Seasonal trends
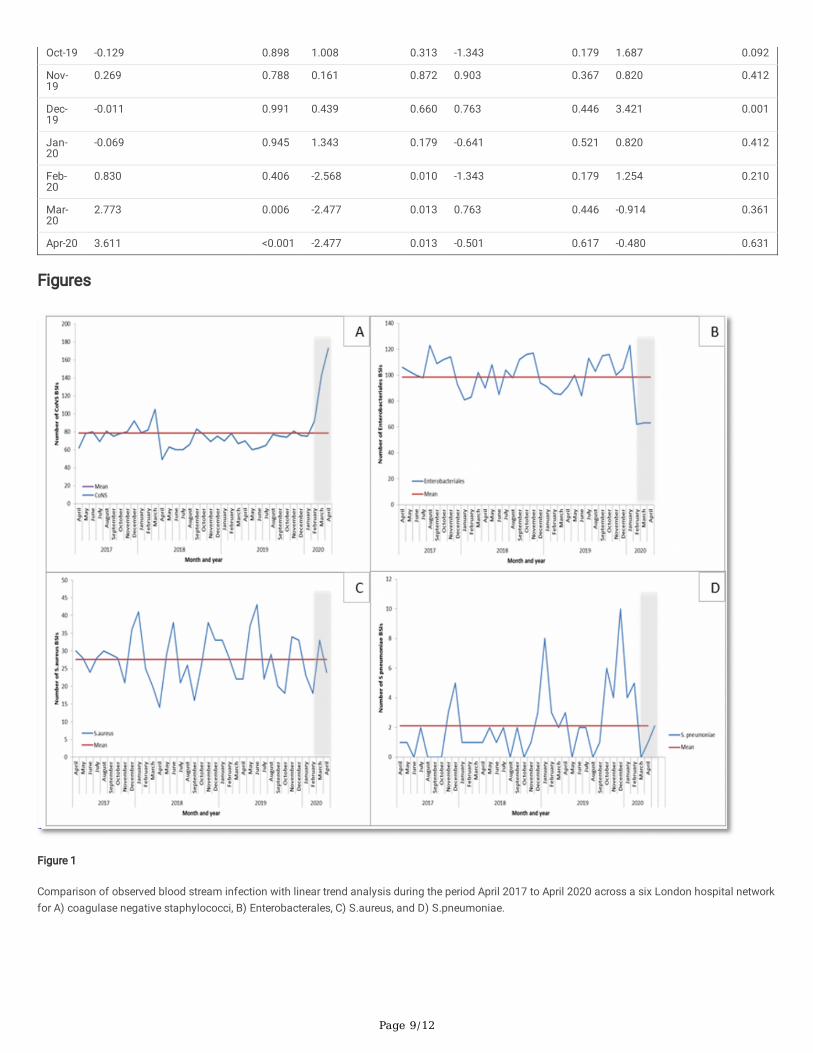
Seasonal trends were observed for S.pneumoniae and Enterobacterales. The seasonality of S.pneumoniae (preponderance towards winter months) isshown in Figure 1D, whilst the seasonality of Enterobacterales (peaks in summer months) is shown in Figure 1B. Across the cohort, Enterobacterales as apercentage of all BCs taken was lowest in the winter (2.49% 2017, 2.54% 2018 and 2.63% 2019), with a general trend towards sequentially risingthroughout spring and into summer before peaking in autumn (3.42 % 2017, 3.56% 2018 and 3.22% 2019) (Figure 2). For CoNS the mean percentage overthe study period is 2.39%. There was little seasonal variation prior to COVID-19 (Figure 2). For S. aureus the linear mean over the study period was 27.57,with signi�cant variation over time, but little evidence of recursive seasonality (Figure 1C).
Bacteraemia variation during the UK COVID-19 peak March and April 2020
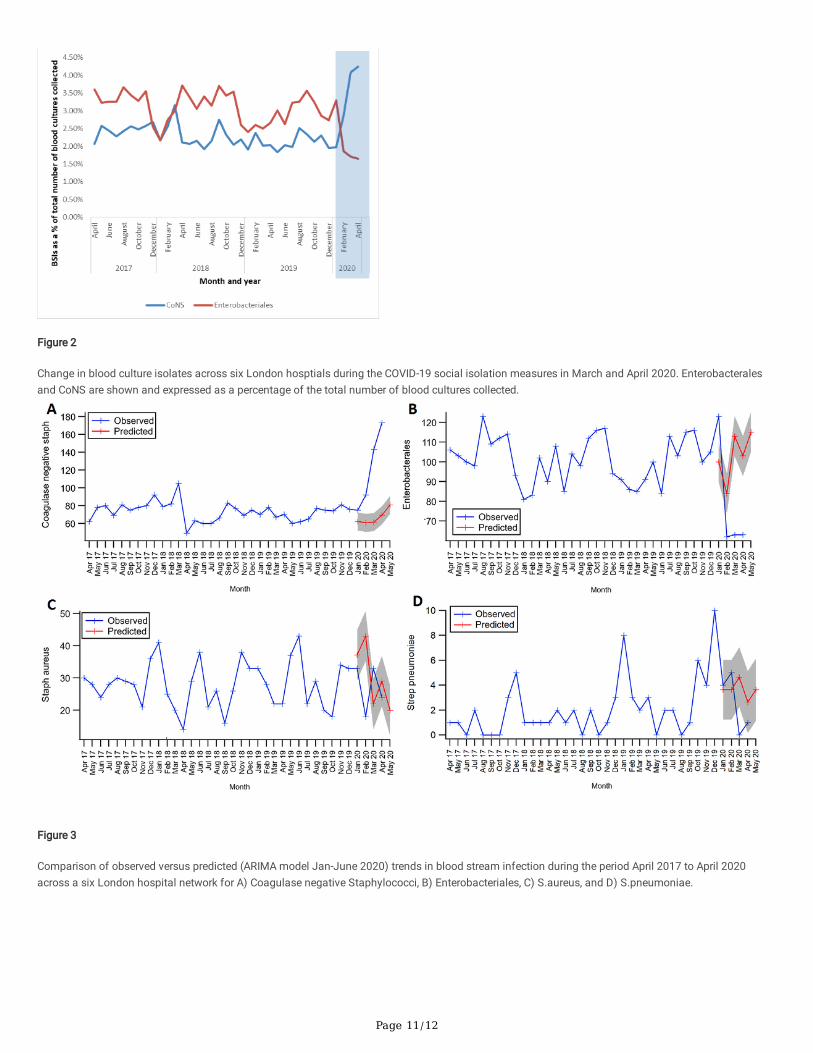
In April 2020, Enterobacterales as a percentage of all BCs taken were at their lowest during the study period at 1.65% (second lowest March 2020 at1.71%; Figure 2). In contrast, CoNS, as a percentage of all BCs taken, were at their highest during the study period at 4.25% (second highest in March 2020at 4.08%) (Figure 2).
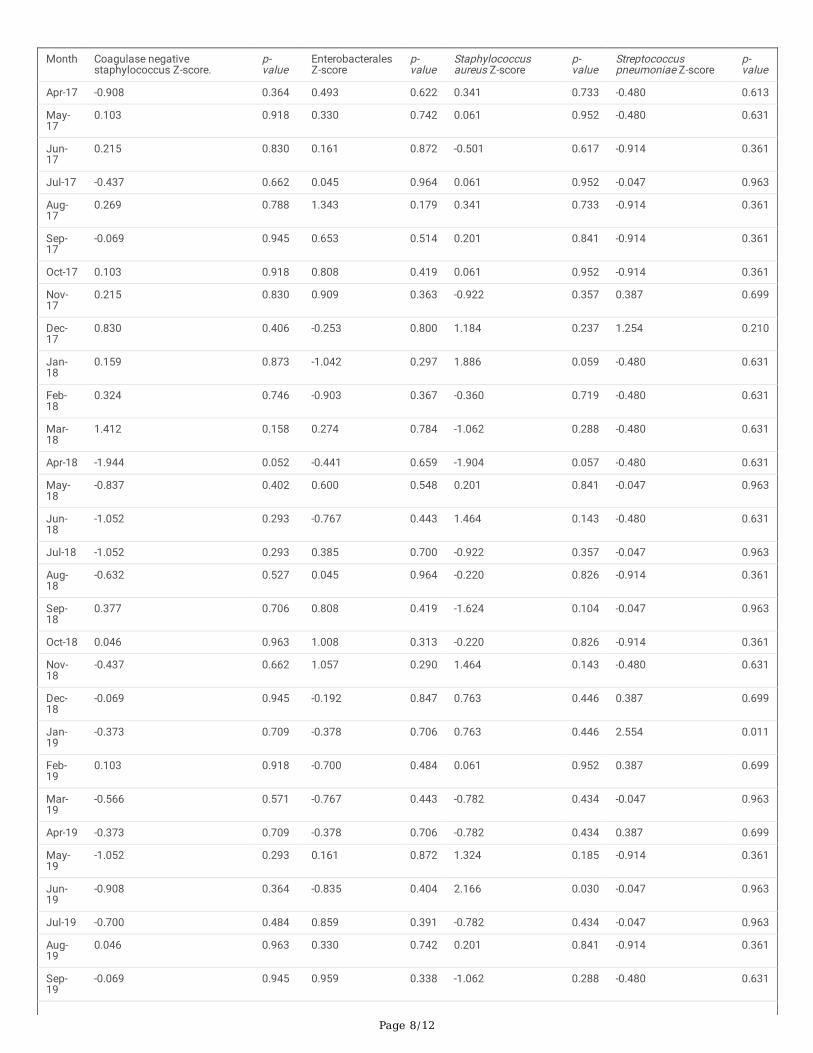
The linear trend analysis (Table 2) for Enterobacterales, CoNS, S.aureus and S.pneumoniae from April 2017 to April 2020 suggests signi�cant differencesin BSI rates, particularly during the COVID-19 period. Enterobacterales BSIs were signi�cantly lower than the mean in February, March, and April 2020 only(Z-scores; -2.57, -2.48, and 2.48, respectively; p < 0.05). In contrast, CoNS BSIs were signi�cantly above the mean for March and April 2020 (Z-scores; 2.77,3.61 respectively; p < 0.01). Numbers detected did not deviate signi�cantly from the mean from April 2017 until February and March 2020, respectively forthese organisms. S.aureus BSIs did not vary signi�cantly from mean throughout the period analysed. S.pneumoniae BSIs did not vary signi�cantly fromthe mean throughout the period analysed, except for in December 2019.
The ARIMA model, constructed to allow for any seasonality, is represented in Figure 3A-D and demonstrates historic observed BSI (April 2017-December2019) and then predicted versus observed BSI from January 2020 to June 2020. Once seasonality is allowed for, this also showed a signi�cantdivergence in observed versus predicted Enterobacterales and CoNS from February to April 2020. Fewer numbers of Enterobacteriales BSIs and highernumbers of CoNS BSIs were seen. Numbers of S.aureus and S.pneumoniae BSI remained within the limits of con�dence of predicted based on historicaltrends.
Page 4/12
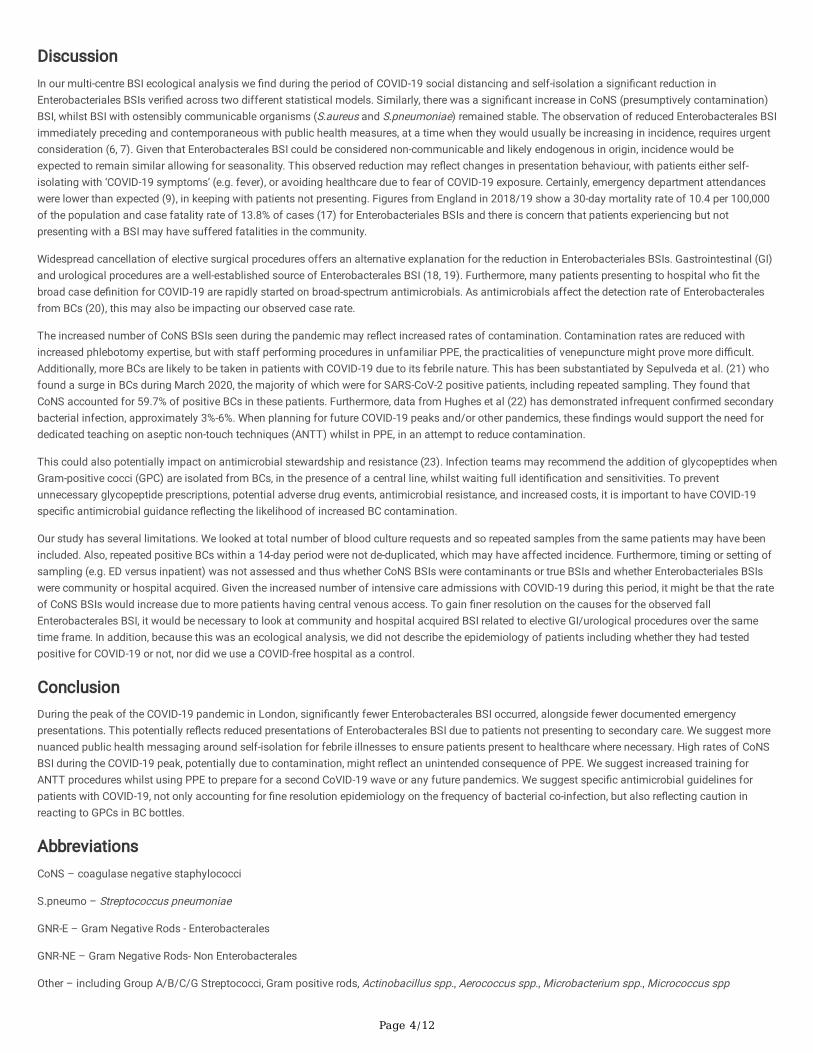
DiscussionIn our multi-centre BSI ecological analysis we �nd during the period of COVID-19 social distancing and self-isolation a signi�cant reduction inEnterobacteriales BSIs veri�ed across two different statistical models. Similarly, there was a signi�cant increase in CoNS (presumptively contamination)BSI, whilst BSI with ostensibly communicable organisms (S.aureus and S.pneumoniae) remained stable. The observation of reduced Enterobacterales BSIimmediately preceding and contemporaneous with public health measures, at a time when they would usually be increasing in incidence, requires urgentconsideration (6, 7). Given that Enterobacterales BSI could be considered non-communicable and likely endogenous in origin, incidence would beexpected to remain similar allowing for seasonality. This observed reduction may re�ect changes in presentation behaviour, with patients either self-isolating with ‘COVID-19 symptoms’ (e.g. fever), or avoiding healthcare due to fear of COVID-19 exposure. Certainly, emergency department attendanceswere lower than expected (9), in keeping with patients not presenting. Figures from England in 2018/19 show a 30-day mortality rate of 10.4 per 100,000of the population and case fatality rate of 13.8% of cases (17) for Enterobacteriales BSIs and there is concern that patients experiencing but notpresenting with a BSI may have suffered fatalities in the community.
Widespread cancellation of elective surgical procedures offers an alternative explanation for the reduction in Enterobacteriales BSIs. Gastrointestinal (GI)and urological procedures are a well-established source of Enterobacterales BSI (18, 19). Furthermore, many patients presenting to hospital who �t thebroad case de�nition for COVID-19 are rapidly started on broad-spectrum antimicrobials. As antimicrobials affect the detection rate of Enterobacteralesfrom BCs (20), this may also be impacting our observed case rate.
The increased number of CoNS BSIs seen during the pandemic may re�ect increased rates of contamination. Contamination rates are reduced withincreased phlebotomy expertise, but with staff performing procedures in unfamiliar PPE, the practicalities of venepuncture might prove more di�cult.Additionally, more BCs are likely to be taken in patients with COVID-19 due to its febrile nature. This has been substantiated by Sepulveda et al. (21) whofound a surge in BCs during March 2020, the majority of which were for SARS-CoV-2 positive patients, including repeated sampling. They found thatCoNS accounted for 59.7% of positive BCs in these patients. Furthermore, data from Hughes et al (22) has demonstrated infrequent con�rmed secondarybacterial infection, approximately 3%-6%. When planning for future COVID-19 peaks and/or other pandemics, these �ndings would support the need fordedicated teaching on aseptic non-touch techniques (ANTT) whilst in PPE, in an attempt to reduce contamination.
This could also potentially impact on antimicrobial stewardship and resistance (23). Infection teams may recommend the addition of glycopeptides whenGram-positive cocci (GPC) are isolated from BCs, in the presence of a central line, whilst waiting full identi�cation and sensitivities. To preventunnecessary glycopeptide prescriptions, potential adverse drug events, antimicrobial resistance, and increased costs, it is important to have COVID-19speci�c antimicrobial guidance re�ecting the likelihood of increased BC contamination.
Our study has several limitations. We looked at total number of blood culture requests and so repeated samples from the same patients may have beenincluded. Also, repeated positive BCs within a 14-day period were not de-duplicated, which may have affected incidence. Furthermore, timing or setting ofsampling (e.g. ED versus inpatient) was not assessed and thus whether CoNS BSIs were contaminants or true BSIs and whether Enterobacteriales BSIswere community or hospital acquired. Given the increased number of intensive care admissions with COVID-19 during this period, it might be that the rateof CoNS BSIs would increase due to more patients having central venous access. To gain �ner resolution on the causes for the observed fallEnterobacterales BSI, it would be necessary to look at community and hospital acquired BSI related to elective GI/urological procedures over the sametime frame. In addition, because this was an ecological analysis, we did not describe the epidemiology of patients including whether they had testedpositive for COVID-19 or not, nor did we use a COVID-free hospital as a control.
ConclusionDuring the peak of the COVID-19 pandemic in London, signi�cantly fewer Enterobacterales BSI occurred, alongside fewer documented emergencypresentations. This potentially re�ects reduced presentations of Enterobacterales BSI due to patients not presenting to secondary care. We suggest morenuanced public health messaging around self-isolation for febrile illnesses to ensure patients present to healthcare where necessary. High rates of CoNSBSI during the COVID-19 peak, potentially due to contamination, might re�ect an unintended consequence of PPE. We suggest increased training forANTT procedures whilst using PPE to prepare for a second CoVID-19 wave or any future pandemics. We suggest speci�c antimicrobial guidelines forpatients with COVID-19, not only accounting for �ne resolution epidemiology on the frequency of bacterial co-infection, but also re�ecting caution inreacting to GPCs in BC bottles.
AbbreviationsCoNS – coagulase negative staphylococci
S.pneumo – Streptococcus pneumoniae
GNR-E – Gram Negative Rods - Enterobacterales
GNR-NE – Gram Negative Rods- Non Enterobacterales
Other – including Group A/B/C/G Streptococci, Gram positive rods, Actinobacillus spp., Aerococcus spp., Microbacterium spp., Micrococcus spp

Page 5/12
S.aureus – Staphylococcus aureus (both meticillin susceptible and meticillin resistant) Yeasts
DeclarationsEthics approval
This analysis was registered with North West London Pathology hosted by Imperial College Healthcare NHS Trust as a service evaluation (referencePAT_012) to investigate BC contamination rates. Ethics approval and individual consent was not indicated for this ecological level analysis reporting onlyaggregated data.
Acknowledgements
LSPM and TMR acknowledge support from the National Institute of Health Research (NIHR) Imperial Biomedical Research Centre (BRC) and the NationalInstitute for Health Research Health Protection Research Unit (HPRU) in Healthcare Associated Infection and Antimicrobial Resistance at Imperial CollegeLondon in partnership with Public Health England.
Dr Pater Hart for helping to clean the data and perform statistical analyses.
The views expressed in this publication are those of the authors and not necessarily those of the NHS, the National Institute for Health Research, or the UKDepartment of Health.
Authors’ contributions
SD, GS and LSPM designed the study methodology. SD collated the data. All authors reviewed the results, SD, TMR and GS lead the data analysis, with allauthors reviewing the resulting themes and contributed comments. SD drafted the initial manuscript with all authors contributing signi�cantly to revisingthis for submission. All authors agreed on the �nal version for submission to the journal.
Funding
This research did not receive any grant from funding agencies in the public or commercial sectors.
Potential con�icts of interests
LSPM has consulted for DNAelectronics (2015-18), Dairy Crest (2017–2018), Umovis Lab (2020), bioMerieux (2013-2020), received speaker fees fromPro�le Pharma (2018) and P�zer (2018-2020), received research grants from the National Institute for Health Research (2013-2020), CW+ Charity (2018-2020), and Leo Pharma (2016), and received educational support from Eumedica (2016–2018).
GS is currently supported by a Clinical Academic Research Partnership awarded by the Medical Research Council. SJCP has received a research grantfrom the Scienti�c Exploration Society. NM has received speaker fees from Beyer (2016) and P�zer (2019) and received educational support fromEumedica (2016) and Baxter (2017).
All other authors have no con�icts of interest to declare.
Consent for publication
All authors consent to publication of this manuscript in this journal. This work has not been previously published in any other journal.
Availability of data and materials
The data analysed during the current study and further details on the assays are available from the corresponding author (SD; [email protected]) onreasonable request, as long as this meets local ethical and research governance criteria.
References1. website N. Check if you or your child has coronavirus symptoms 2020 [Available from: https://www.nhs.uk/conditions/coronavirus-covid-
19/symptoms/.
2. Weiser JN, Ferreira DM, Paton JC. Streptococcus pneumoniae: transmission, colonization and invasion. Nature reviews Microbiology. 2018;16(6):355-67.
3. Rouphael NG, Stephens DS. Neisseria meningitidis: biology, microbiology, and epidemiology. Methods in molecular biology (Clifton, NJ). 2012;799:1-20.
4. Knox J, Uhlemann A-C, Lowy FD. Staphylococcus aureus infections: transmission within households and the community. Trends in microbiology.2015;23(7):437-44.
5. Oliveira J, Reygaert WC. Gram Negative Bacteria. 2019.
Page 6/12
�. Al-Hasan MN, Lahr BD, Eckel-Passow JE, Baddour LM. Seasonal Variation in Escherichia coli Bloodstream Infection: A Population-Based Study. ClinMicrobiol Infect. 2009;15(10):947-50.
7. Wilson J, Elgohari S, Livermore DM, Cookson B, Johnson A, Lamagni T, et al. Trends among pathogens reported as causing bacteraemia in England,2004–2008. Clinical Microbiology and Infection. 2011;17(3):451-8.
�. Hall KK, Lyman JA. Updated review of blood culture contamination. Clinical microbiology reviews. 2006;19(4):788-802.
9. England N. A&E Attendances and Emergency Admissions 2020 [Available from: https://www.england.nhs.uk/statistics/statistical-work-areas/ae-waiting-times-and-activity/.
10. England PH. UK SMI B 37: investigation of blood cultures (for organisms other than Mycobacterium species) 2019 [Available from:https://www.gov.uk/government/publications/smi-b-37-investigation-of-blood-cultures-for-organisms-other-than-mycobacterium-species.
11. EUCAST. Clinical breakpoints - breakpoints and guidance 2020 [Available from: https://www.eucast.org/clinical_breakpoints/.
12. Dowell SF, Whitney CG, Wright C, Rose CE, Jr., Schuchat A. Seasonal patterns of invasive pneumococcal disease. Emerging infectious diseases.2003;9(5):573-9.
13. Numminen E, Chewapreecha C, Turner C, Goldblatt D, Nosten F, Bentley SD, et al. Climate induces seasonality in pneumococcal transmission.Scienti�c Reports. 2015;5(1):11344.
14. Weinberger DM, Harboe ZB, Viboud C, Krause TG, Miller M, Mølbak K, et al. Pneumococcal disease seasonality: incidence, severity and the role ofin�uenza activity. European Respiratory Journal. 2014;43(3):833.
15. Leekha S, Diekema DJ, Perencevich EN. Seasonality of staphylococcal infections. Clin Microbiol Infect. 2012;18(10):927-33.
1�. LSHTM. Peak in COVID-19 deaths occurring in English hospitals passed on 8 April 2020 [Available from:https://www.lshtm.ac.uk/newsevents/news/2020/peak-covid-19-deaths-occurring-english-hospitals-passed-8-april.
17. England PH. Thirty-day all-cause mortality following MRSA, MSSA and Gram-negative bacteraemia and C. di�cile infections 2019 [Availablefrom: https://assets.publishing.service.gov.uk/government/uploads/system/uploads/attachment_data/�le/850521/hcai_fatality_report_201819.pdf.
1�. Alqarni A, Kantor E, Grall N, Tanaka S, Zappella N, Godement M, et al. Clinical characteristics and prognosis of bacteraemia during postoperativeintra-abdominal infections. Crit Care. 2018;22(1):175.
19. Olson ES, Cookson BD. Do antimicrobials have a role in preventing septicaemia following instrumentation of the urinary tract? J Hosp Infect.2000;45(2):85-97.
20. Scheer CS, Fuchs C, Gründling M, Vollmer M, Bast J, Bohnert JA, et al. Impact of antibiotic administration on blood culture positivity at the beginningof sepsis: a prospective clinical cohort study. Clin Microbiol Infect. 2019;25(3):326-31.
21. Sepulveda J, Westblade LF, Whittier S, Satlin MJ, Greendyke WG, Aaron JG, et al. Bacteremia and Blood Culture Utilization During COVID-19 Surge inNew York City. Journal of Clinical Microbiology. 2020:JCM.00875-20.
22. Hughes S, Troise O, Donaldson H, Mughal N, Moore LSP. Bacterial and fungal coinfection among hospitalised patients with COVID-19: A retrospectivecohort study in a UK secondary care setting. Clin Microbiol Infect. 2020; S1198-743X(20)30369-4. doi: 10.1016/j.cmi.2020.06.025. Online ahead ofprint.
23. Rawson TM, Moore LSP, Castro-Sanchez E, Charani E, Davies F, Satta G, et al. COVID-19 and the potential long-term impact on antimicrobialresistance. Journal of Antimicrobial Chemotherapy. 2020;75(7):1681-4.
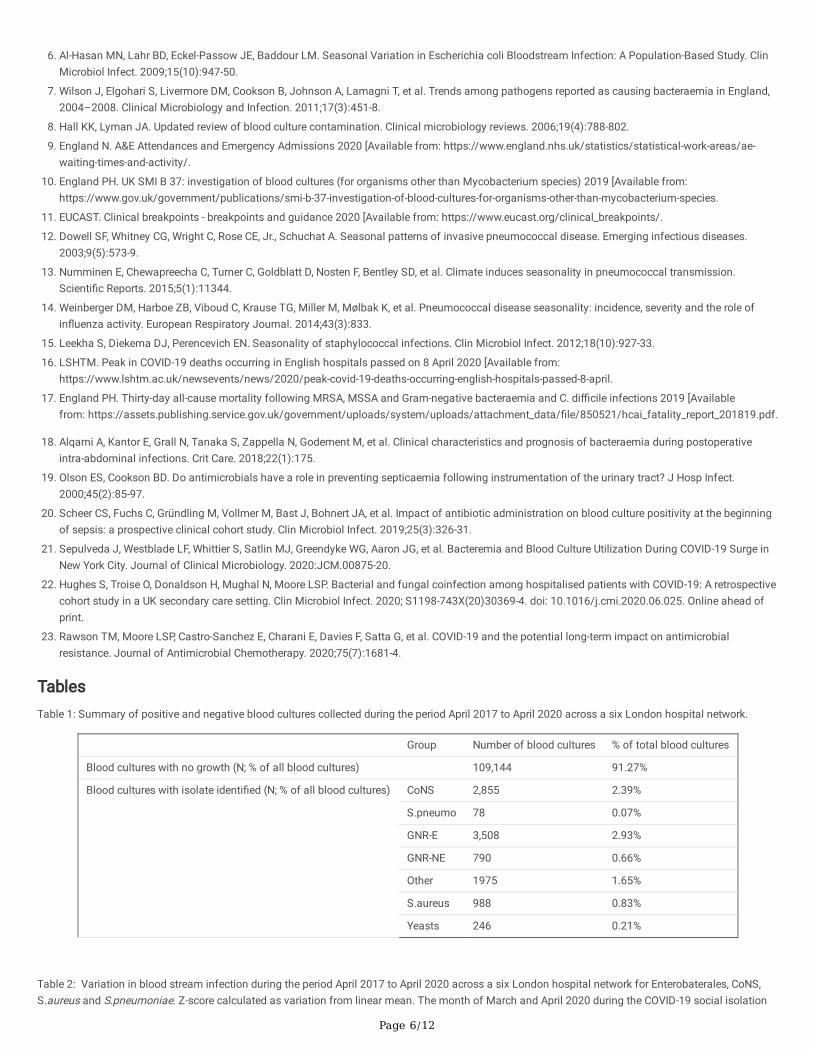
TablesTable 1: Summary of positive and negative blood cultures collected during the period April 2017 to April 2020 across a six London hospital network.
Group Number of blood cultures % of total blood cultures
Blood cultures with no growth (N; % of all blood cultures) 109,144 91.27%
Blood cultures with isolate identi�ed (N; % of all blood cultures) CoNS 2,855 2.39%
S.pneumo 78 0.07%
GNR-E 3,508 2.93%
GNR-NE 790 0.66%
Other 1975 1.65%
S.aureus 988 0.83%
Yeasts 246 0.21%
Table 2: Variation in blood stream infection during the period April 2017 to April 2020 across a six London hospital network for Enterobaterales, CoNS,S.aureus and S.pneumoniae. Z-score calculated as variation from linear mean. The month of March and April 2020 during the COVID-19 social isolation

Page 7/12
measures are highlighted in grey.
Page 8/12
Month Coagulase negativestaphylococcus Z-score.
p-value
EnterobacteralesZ-score
p-value
Staphylococcusaureus Z-score
p-value
Streptococcuspneumoniae Z-score
p-value
Apr-17 -0.908 0.364 0.493 0.622 0.341 0.733 -0.480 0.613
May-17
0.103 0.918 0.330 0.742 0.061 0.952 -0.480 0.631
Jun-17
0.215 0.830 0.161 0.872 -0.501 0.617 -0.914 0.361
Jul-17 -0.437 0.662 0.045 0.964 0.061 0.952 -0.047 0.963
Aug-17
0.269 0.788 1.343 0.179 0.341 0.733 -0.914 0.361
Sep-17
-0.069 0.945 0.653 0.514 0.201 0.841 -0.914 0.361
Oct-17 0.103 0.918 0.808 0.419 0.061 0.952 -0.914 0.361
Nov-17
0.215 0.830 0.909 0.363 -0.922 0.357 0.387 0.699
Dec-17
0.830 0.406 -0.253 0.800 1.184 0.237 1.254 0.210
Jan-18
0.159 0.873 -1.042 0.297 1.886 0.059 -0.480 0.631
Feb-18
0.324 0.746 -0.903 0.367 -0.360 0.719 -0.480 0.631
Mar-18
1.412 0.158 0.274 0.784 -1.062 0.288 -0.480 0.631
Apr-18 -1.944 0.052 -0.441 0.659 -1.904 0.057 -0.480 0.631
May-18
-0.837 0.402 0.600 0.548 0.201 0.841 -0.047 0.963
Jun-18
-1.052 0.293 -0.767 0.443 1.464 0.143 -0.480 0.631
Jul-18 -1.052 0.293 0.385 0.700 -0.922 0.357 -0.047 0.963
Aug-18
-0.632 0.527 0.045 0.964 -0.220 0.826 -0.914 0.361
Sep-18
0.377 0.706 0.808 0.419 -1.624 0.104 -0.047 0.963
Oct-18 0.046 0.963 1.008 0.313 -0.220 0.826 -0.914 0.361
Nov-18
-0.437 0.662 1.057 0.290 1.464 0.143 -0.480 0.631
Dec-18
-0.069 0.945 -0.192 0.847 0.763 0.446 0.387 0.699
Jan-19
-0.373 0.709 -0.378 0.706 0.763 0.446 2.554 0.011
Feb-19
0.103 0.918 -0.700 0.484 0.061 0.952 0.387 0.699
Mar-19
-0.566 0.571 -0.767 0.443 -0.782 0.434 -0.047 0.963
Apr-19 -0.373 0.709 -0.378 0.706 -0.782 0.434 0.387 0.699
May-19
-1.052 0.293 0.161 0.872 1.324 0.185 -0.914 0.361
Jun-19
-0.908 0.364 -0.835 0.404 2.166 0.030 -0.047 0.963
Jul-19 -0.700 0.484 0.859 0.391 -0.782 0.434 -0.047 0.963
Aug-19
0.046 0.963 0.330 0.742 0.201 0.841 -0.914 0.361
Sep-19
-0.069 0.945 0.959 0.338 -1.062 0.288 -0.480 0.631
Page 9/12
Oct-19 -0.129 0.898 1.008 0.313 -1.343 0.179 1.687 0.092
Nov-19
0.269 0.788 0.161 0.872 0.903 0.367 0.820 0.412
Dec-19
-0.011 0.991 0.439 0.660 0.763 0.446 3.421 0.001
Jan-20
-0.069 0.945 1.343 0.179 -0.641 0.521 0.820 0.412
Feb-20
0.830 0.406 -2.568 0.010 -1.343 0.179 1.254 0.210
Mar-20
2.773 0.006 -2.477 0.013 0.763 0.446 -0.914 0.361
Apr-20 3.611 <0.001 -2.477 0.013 -0.501 0.617 -0.480 0.631
Figures
Figure 1
Comparison of observed blood stream infection with linear trend analysis during the period April 2017 to April 2020 across a six London hospital networkfor A) coagulase negative staphylococci, B) Enterobacterales, C) S.aureus, and D) S.pneumoniae.

Page 10/12
Figure 1
Comparison of observed blood stream infection with linear trend analysis during the period April 2017 to April 2020 across a six London hospital networkfor A) coagulase negative staphylococci, B) Enterobacterales, C) S.aureus, and D) S.pneumoniae.
Figure 2
Change in blood culture isolates across six London hosptials during the COVID-19 social isolation measures in March and April 2020. Enterobacteralesand CoNS are shown and expressed as a percentage of the total number of blood cultures collected.
Page 11/12
Figure 2
Change in blood culture isolates across six London hosptials during the COVID-19 social isolation measures in March and April 2020. Enterobacteralesand CoNS are shown and expressed as a percentage of the total number of blood cultures collected.
Figure 3
Comparison of observed versus predicted (ARIMA model Jan-June 2020) trends in blood stream infection during the period April 2017 to April 2020across a six London hospital network for A) Coagulase negative Staphylococci, B) Enterobacteriales, C) S.aureus, and D) S.pneumoniae.

Page 12/12
Figure 3
Comparison of observed versus predicted (ARIMA model Jan-June 2020) trends in blood stream infection during the period April 2017 to April 2020across a six London hospital network for A) Coagulase negative Staphylococci, B) Enterobacteriales, C) S.aureus, and D) S.pneumoniae.