section 26 arts, recreation, and travel - census.gov · arts, recreation, and travel 757 ... 2011...
TRANSCRIPT
Arts, Recreation, and Travel 757U.S. Census Bureau, Statistical Abstract of the United States: 2011
Section 26 Arts, Recreation, and Travel
This section presents data on the arts, entertainment, and recreation economic sector of the economy, and personal recreational activities, the arts and humanities, and domestic and foreign travel.
Arts, Entertainment, and Recreation Industry—The U.S. Census Bureausurveys—County Business Patterns,Economic Census, Nonemployer Statis-tics and Service Annual Survey, provide data on the Arts, Entertainment, and Recreation Sector. The County Business Patterns annual data includes number of establishments, number of employees, first quarter and annual payrolls, and number of establishments by employment size class. The Economic Census, con-ducted every five years for the years ending ‘2’ and ‘7,’ provides informa-tion on the number of establishments, receipts, payroll, and paid employees for the United States and various geographic levels. Nonemployer statistics are an annual tabulation of economic data by industry for active businesses without paid employees that are subject to federal income tax. The Service Annual Survey provides estimates of operation rev-enue of taxable firms and revenues and expenses of firms exempt from federal taxes for industries in this sector of the economy. See Appendix III for more details.
Recreation and leisure activities— Data on the participation in various recreation and leisure time activities are based on several sample surveys. Data on the public’s involvement with arts events and activities are published by the National Endowment for Arts (NEA). The NEA’s Survey of Public Participation in the Arts remains the largest periodic study of arts participation in the United States. The most recent data are from the 2008 survey. Data on participation in
fishing, hunting, and other forms of wild-life associated recreation are published periodically by the U.S. Department of Interior, Fish and Wildlife Service. The most recent data are from the 2006 survey. Data on participation in various sports recreation activities are published by the National Sporting Goods Association. Mediamark, Inc. also con-ducts periodic surveys on sports and leisure activities, as well as other topics.
Parks and recreation—The Department of the Interior has responsibility for administering the national parks. The National Park Service publishes information on visits to national park areas in its annual report, National Park Statistical Abstract. The National Parks: Index (year) is an annual report which contains brief descriptions, with acreages and visits for each area adminis-tered by the service, plus certain ‘‘related’’ areas. This information can be found at: <http://www.nature .nps.gov/stats>. Statistics for state parks are compiled by the National Association of State Park Directors.
Travel—Statistics on arrivals and departures to the United States, cities and states visited by overseas travel-ers, and tourism sales and employment are reported by the International Trade Administration (ITA), Office of Travel & Tourism Industries (OTTI). Data on domestic travel and travel expenditures are published by the research department of the U.S. Travel Association. Other data on household transportation characteris-tics are in Section 23, Transportation.
Statistical reliability—For a discussion of statistical collection and estimation, sampling procedures, and measures of statistical reliability applicable to Census Bureau data, see Appendix III.

758 Arts, Recreation, and TravelU.S. Census Bureau, Statistical Abstract of the United States: 2011
Table 1227. Arts, Entertainment, and Recreation Services—Estimated Revenue: 2003 to 2008[In millions of dollars (149,360 represents $149,360,000,000). For taxable and tax-exempt employer firms. Except where indicated, estimates adjusted using the results of the 2002 Economic Census. Based on the Service Annual Survey, see Appendix III]
Industry2002
NAICS Code 1 2003 2004 2005 2006 2007 2008
Arts, entertainment, and recreation . . . . . . . . . . . . 71 149,360 158,557 165,964 179,808 190,759 195,980Performing arts, spectator sports, and related industries . . . . . . . . . . . . . . . . . . . . . . . . . . . . . . . . . . . 711 60,367 62,796 64,718 71,122 75,319 78,948 Spectator sports . . . . . . . . . . . . . . . . . . . . . . . . . . . . . 7111 11,070 11,554 12,211 12,249 12,405 12,919 Performing arts companies . . . . . . . . . . . . . . . . . . . . . 7112 22,445 23,659 24,471 26,948 29,277 31,302 Sports teams and clubs . . . . . . . . . . . . . . . . . . . . . . 711211 13,257 14,115 14,136 15,786 17,507 18,995 Racetracks . . . . . . . . . . . . . . . . . . . . . . . . . . . . . . . . 711212 6,582 7,022 7,358 7,957 8,273 8,444 Other spectator sports . . . . . . . . . . . . . . . . . . . . . . . 711219 2,606 2,522 2,977 3,205 3,497 3,863 Promoters of performing arts, sports, and similar events . . . . . . . . . . . . . . . . . . . . . . . . . . . . . . . . . . . . 7113 12,872 13,571 14,342 17,069 18,302 18,749 Agents and managers for artists, athletes, entertainers and other public figures . . . . . . . . . . . . 7114 3,604 3,819 3,795 3,978 4,188 4,454 Independent artists, writers, and performers . . . . . . . 7115 10,376 10,193 9,899 10,878 11,147 11,524Museums, historical sites, and similar institutions . . . . . 712 9,082 9,688 10,256 11,967 12,931 12,634Amusement, gambling, and recreation industries . . . . . 713 79,911 86,073 90,990 96,719 102,509 104,398 Amusement parks and arcades . . . . . . . . . . . . . . . . . 7131 9,930 10,561 11,182 11,368 12,146 12,624 Amusement and theme parks . . . . . . . . . . . . . . . . . . 71311 8,737 9,344 9,882 9,963 10,746 11,141 Amusement arcades . . . . . . . . . . . . . . . . . . . . . . . . . 71312 1,193 1,217 1,300 1,405 1,400 1,483 Gambling industries . . . . . . . . . . . . . . . . . . . . . . . . . . 7132 22,370 25,698 28,099 31,021 32,849 33,583 Casinos (except casino hotels) . . . . . . . . . . . . . . . . . 71321 14,601 16,664 17,931 19,596 20,505 20,890 Other gambling industries . . . . . . . . . . . . . . . . . . . . . 71329 7,769 9,034 10,168 11,425 12,344 12,693 Other amusement and recreation industries . . . . . . . 7139 47,611 49,814 51,709 54,330 57,514 58,191 Golf courses and country clubs . . . . . . . . . . . . . . . . 71391 16,987 17,880 18,467 18,906 19,147 19,053 Skiing facilities . . . . . . . . . . . . . . . . . . . . . . . . . . . . . 71392 1,839 1,980 2,054 2,239 2,399 2,559 Marinas . . . . . . . . . . . . . . . . . . . . . . . . . . . . . . . . . . . 71393 3,382 3,393 3,637 3,992 4,267 3,949 Fitness and recreational sports centers . . . . . . . . . . 71394 16,130 16,839 17,620 18,473 20,054 20,949 Bowling centers . . . . . . . . . . . . . . . . . . . . . . . . . . . . 71395 3,293 3,505 3,427 3,347 3,738 3,672 All other amusement and recreation . . . . . . . . . . . . . 71399 5,980 6,217 6,504 7,373 7,909 8,009
1 Data for 2003 are based on the 1997 North American Industry Classification System. Data 2004 through 2008 are based on 2002 NAICS; see text, this section and Section 15.
Source: U.S. Census Bureau, Service Annual Survey: 2008, January 2010, <http://www.census.gov/services/index.html>.
Table 1228. Arts, Entertainment, and Recreation—Establishments, Revenue, Payroll, and Employees by Kind of Business: 2002 and 2007[For establishments with payroll. (110,313 represents $110,313,000,000). These data are preliminary and are subject to change; they will be superseded by data released in later data files. Includes only establishments of firms with payroll. Definition of paid employees varies among NAICS sectors. Data are based on the 2002 and 2007 economic censuses which are subject to nonsampling error. For details on survey methodology, sampling and nonsampling errors, see Appendix III]
Kind of business2002
NAICS code
Number of establishments
Revenue (mil. dol.)
Annual payroll (mil. dol.)
Paid employees (1,000)
2002 2007 2002 2007 2002 2007 2002 2007
Arts, entertainment, and recreation, total . . . . . . . . . . . . . . . . . . . . . . . . . . . . . . 71 110,313 124,024 141,904 190,571 45,169 58,474 1,849 2,078Performing arts, spectator sports, and related industries 1 . . . . . . . . . . . . . . . . . . . . 711 37,735 43,791 58,286 77,696 21,231 27,784 423 442 Performing arts companies . . . . . . . . . . . . 7111 9,303 9,073 10,864 13,753 3,267 4,037 138 134 Spectator sports . . . . . . . . . . . . . . . . . . . . . 7112 4,072 4,338 22,313 300,009 10,206 1,402 108 120 Promoters of performing arts, sports and similar events . . . . . . . . . . . . . . . . . . . . . . . 7113 5,236 6,497 12,169 16,133 2,184 2,973 102 121 Agents and managers for artists, athletes, entertainers and others . . . . . . . . . . . . . . . 7114 3,262 3,545 3,602 5,075 1,251 1,743 17 19
Museums, historical sites, and similar institutions 1 . . . . . . . . . . . . . . . . . . . . . . . . . 712 6,663 7,120 8,608 13,043 2,935 3,653 123 130Amusement, gambling, and recreation industries 1 . . . . . . . . . . . . . . . . . . . . . . . . . . 713 65,915 73,113 75,010 99,832 21,002 27,037 1,303 1,506 Amusement parks and arcades . . . . . . . . . 7131 3,015 3,182 9,443 13,374 2,069 2,871 122 141 Gambling industries . . . . . . . . . . . . . . . . . . 7132 2,072 2,490 18,893 26,420 3,596 4,653 158 173 Other amusement and recreation services . . . . . . . . . . . . . . . . . . . . . . . . . . . 7139 60,828 67,441 46,674 60,038 15,337 19,513 1,023 1,192
1 Includes other industries, not shown separately. Source: U.S. Census Bureau, 2007 Economic Census, Core Business Statistics, Comparative Statistics 2007 and 2002, Arts,
Entertainment and Recreation, accessed January 2010, <http://www.census.gov/econ/census07/www/using_american_factfinder/index.html>.

Arts, Recreation, and Travel 759U.S. Census Bureau, Statistical Abstract of the United States: 2011
Table 1229. Arts, Entertainment, and Recreation—Nonemployer Establishments and Receipts by Kind of Business (NAICS Basis): 2005 to 2007[(972.5 represents 972,500). Includes only firms subject to federal income tax. Nonemployers are businesses with no paid employees]
Kind of business2002
NAICS code 1
Establishments (1,000)
Receipts (mil.dol.)
2005 2006 2007 2005 2006 2007
Arts, entertainment, and recreation . . . . . . . . . . . . . 71 972 .5 1,001 .8 1,119 .6 23,704 24,782 27,357Performing arts, spectator sports, and related industries . . . . . . . . . . . . . . . . . . . . . . . . . . . . . . . . . . . . 711 828.8 855.7 967.4 17,741 18,733 20,841 Performing arts companies . . . . . . . . . . . . . . . . . . . . . . 7111 30.0 41.7 53.4 827 944 1,132 Spectator sports . . . . . . . . . . . . . . . . . . . . . . . . . . . . . . 7112 91.6 95.6 141.6 1,877 1,993 2,532 Promoters of performing arts, sports, and similar events . . . . . . . . . . . . . . . . . . . . . . . . . . . . . . . . . . . . . 7113 35.5 37.8 39.8 1,434 1,475 1,584 Agents/managers for artists, athletes, and other public figures . . . . . . . . . . . . . . . . . . . . . . . . . . . . . . . . . . . . . 7114 32.6 33.7 33.8 1,183 1,253 1,294 Independent artists, writers, and performers . . . . . . . . 7115 639.1 646.9 698.9 12,419 13,067 14,299Museums, historical sites, and similar institutions . . . . . . 712 5.6 5.9 6.2 91 88 103Amusement, gambling, and recreation . . . . . . . . . . . . . . industries . . . . . . . . . . . . . . . . . . . . . . . . . . . . . . . . . . . . 713 138.1 140.1 145.9 5,873 5,961 6,413 Amusement parks and arcades . . . . . . . . . . . . . . . . . . . 7131 5.4 5.6 5.5 346 337 330 Gambling industries . . . . . . . . . . . . . . . . . . . . . . . . . . . . 7132 8.4 8.8 10.4 1,064 1,122 330 Other amusement and recreation services . . . . . . . . . . 7139 124.2 125.6 130.0 4,463 4,503 4,805
1 Based on the 2002 North American Industry Classification System (NAICS); see text, Section 15.Source: U.S. Census Bureau, Nonemployer Statistics, released June 2009, <http://www.census.gov/econ/nonemployer>.
Table 1230. Arts, Entertainment, and Recreation—Establishments, Employees, and Payroll by Kind of Business (NAICS Basis): 2006 to 2007[(1,973.7 represents 1,973,700). Covers establishments with paid employees. Excludes self-employed individuals, employees government employees of private households, railroad employees, agricultural production employees and most government employees. For statement on methodology, see Appendix III. County Business Patterns excludes rail transportation (NAICS 482) and the National Postal Service (NAICS 491)]
Kind of business2002
NAICS code 1
Establishments Employees (1,000) Payroll (mil.dol)
2006 2007 2006 2007 2006 2007
Arts, entertainment, & recreation . . . . . . . . . . . . 71 123,048 125,222 1,973 .7 2,008 .6 56,839 60,357Performing arts, spectator sports . . . . . . . . . . . . . . . 711 42,430 44,260 424.9 436.1 26,636 28,932 Performing arts companies . . . . . . . . . . . . . . . . . . . 7111 9,195 9,453 133.5 134.4 3,913 4,243 Theater companies & dinner theaters . . . . . . . . . . 71111 3,524 3,553 74.1 69.7 1,976 2,038 Dance companies . . . . . . . . . . . . . . . . . . . . . . . . . 71112 620 703 9.3 9.5 225 250 Musical groups & artists . . . . . . . . . . . . . . . . . . . . 71113 4,522 4,612 43.3 43.3 1,470 1,584 Other performing arts companies . . . . . . . . . . . . . 71119 529 585 6.8 12.0 243 371 Spectator sports . . . . . . . . . . . . . . . . . . . . . . . . . . . 7112 4,564 4,631 120.3 126.1 13,298 14,591 Sports teams & clubs . . . . . . . . . . . . . . . . . . . . . . 711211 818 819 50.9 52.8 11,148 12,186 Racetracks . . . . . . . . . . . . . . . . . . . . . . . . . . . . . . . 711212 741 733 48.3 51.2 1,229 1,389 Other spectator sports . . . . . . . . . . . . . . . . . . . . . . 711219 3,005 3,079 21.1 22.1 922 1,017 Promoters of performing arts, sports, and similar events . . . . . . . . . . . . . . . . . . . . . . . . . . . . . . . . . . 7113 5,779 6,367 107.1 112.4 2,665 2,992 Promoters of performing arts, sports, & similar events with facilities . . . . . . . . . . . . . . . . . . . . . . . . 71131 2,089 2,580 80.1 85.8 1,409 1,782 Promoters of performing arts, sports, & similar events without facilities . . . . . . . . . . . . . . . . . . . . . 71132 3,690 3,787 27.0 26.6 1,256 1,210 Agents/managers for artists, athletes, and other public figures . . . . . . . . . . . . . . . . . . . . . . . . . . . . . 7114 3,494 3,722 16.4 17.4 1,579 1,709 Independent artists, writers, & performers. . . . . . . . 7115 19,398 20,087 47.6 45.8 5,181 5,397Museums, historical sites, & similar institutions . . . . . 712 7,089 7,312 123.2 128.5 3,360 3,597 Museums . . . . . . . . . . . . . . . . . . . . . . . . . . . . . . . . . 71211 4,787 4,920 80.7 83.7 2,235 2,404 Historical sites . . . . . . . . . . . . . . . . . . . . . . . . . . . . . 71212 979 1,051 9.4 9.8 208 228 Zoos & botanical gardens . . . . . . . . . . . . . . . . . . . . 71213 611 595 26.5 28.5 742 784 Nature parks & other similar institutions . . . . . . . . . 71219 712 746 6.6 6.6 174 180Amusement, gambling, & recreation industries . . . . . 713 73,529 73,650 1,425.6 1,444.0 26,843 27,828 Amusement parks & arcades . . . . . . . . . . . . . . . . . 7131 2,927 3,097 136.4 128.4 2,662 2,755 Amusement & theme parks . . . . . . . . . . . . . . . . . . 71311 579 634 108.7 101.2 2,310 2,391 Amusement arcades . . . . . . . . . . . . . . . . . . . . . . . 71312 2,348 2,463 27.6 27.1 352 364 Gambling industries . . . . . . . . . . . . . . . . . . . . . . . . . 7132 2,600 2,729 196.0 205.3 5,540 5,851 Casinos (except casino hotels) . . . . . . . . . . . . . . . 71321 468 488 133.6 136.9 3,861 4,099 Other gambling industries . . . . . . . . . . . . . . . . . . . 71329 2,132 2,241 62.3 68.4 1,679 1,753 Other amusement & recreation services . . . . . . . . . 7139 68,002 67,824 1,093.2 1,110.3 18,642 19,221 Golf courses & country clubs . . . . . . . . . . . . . . . . . 71391 11,870 11,851 309.4 316.4 7,839 8,059 Skiing facilities . . . . . . . . . . . . . . . . . . . . . . . . . . . . 71392 381 402 75.3 75.7 624 651 Marinas . . . . . . . . . . . . . . . . . . . . . . . . . . . . . . . . . 71393 4,025 4,085 28.3 28.8 894 945 Fitness & recreational sports centers . . . . . . . . . . 71394 32,432 31,453 507.9 514.5 6,478 6,617 Bowling centers . . . . . . . . . . . . . . . . . . . . . . . . . . . 71395 4,615 4,571 81.3 80.5 1,000 997 All other amusement & recreation industries . . . . . 71399 14,679 15,462 91.0 94.4 1,807 1,951
1 Based on the 2002 North American Industry Classification System (NAICS); see text, this section and Section 15.Source: U.S. Census Bureau, “County Business Patterns,” released July 2009, <http://www.census.gov/econ/cbp/index.html>.

760 Arts, Recreation, and TravelU.S. Census Bureau, Statistical Abstract of the United States: 2011
Table 1231. Expenditures Per Consumer Unit for Entertainment and Reading: 1985 to 2008[Data are annual averages. In dollars, except as indicated. Based on Consumer Expenditure Survey (CE); see text in Section 13 for description of survey. See also headnote, Table 685. For composition of regions, see map, inside front cover]
Year and characteristic
Entertainment and reading
Entertainment
ReadingTotal
Percent of total
expendi-tures Total
Fees and
admis-sions
Audio and visual equip-ment and
services
Other entertain-
ment, sup-plies, and
equipment services 1
1985. . . . . . . . . . . . . . . . . . . . . . . . . . . . . . . . . . 1,311 5.6 1,170 320 371 479 1411990. . . . . . . . . . . . . . . . . . . . . . . . . . . . . . . . . . 1,575 5.6 1,422 371 454 597 1531993. . . . . . . . . . . . . . . . . . . . . . . . . . . . . . . . . . 1,792 5.8 1,626 414 590 621 1661994. . . . . . . . . . . . . . . . . . . . . . . . . . . . . . . . . . 1,732 5.5 1,567 439 533 595 165
1995. . . . . . . . . . . . . . . . . . . . . . . . . . . . . . . . . . 1,775 5.5 1,612 433 542 637 1631996. . . . . . . . . . . . . . . . . . . . . . . . . . . . . . . . . . 1,993 5.9 1,834 459 561 814 1591997. . . . . . . . . . . . . . . . . . . . . . . . . . . . . . . . . . 1,977 5.7 1,813 471 577 766 1641998. . . . . . . . . . . . . . . . . . . . . . . . . . . . . . . . . . 1,907 5.4 1,746 449 535 762 1611999. . . . . . . . . . . . . . . . . . . . . . . . . . . . . . . . . . 2,050 5.5 1,891 459 608 824 159
2000. . . . . . . . . . . . . . . . . . . . . . . . . . . . . . . . . . 2,009 5.3 1,863 515 622 727 1462001. . . . . . . . . . . . . . . . . . . . . . . . . . . . . . . . . . 2,094 5.3 1,953 526 660 767 1412002. . . . . . . . . . . . . . . . . . . . . . . . . . . . . . . . . . 2,218 5.5 2,079 542 692 845 1392003. . . . . . . . . . . . . . . . . . . . . . . . . . . . . . . . . . 2,187 5.4 2,060 494 730 835 1272004. . . . . . . . . . . . . . . . . . . . . . . . . . . . . . . . . . 2,348 5.4 2,218 528 788 903 1302005. . . . . . . . . . . . . . . . . . . . . . . . . . . . . . . . . . 2,514 5.4 2,388 588 888 912 1262006. . . . . . . . . . . . . . . . . . . . . . . . . . . . . . . . . . 2,493 5.2 2,376 606 906 863 1172007. . . . . . . . . . . . . . . . . . . . . . . . . . . . . . . . . . 2,816 5.7 2,698 658 987 1,053 118
2008, total . . . . . . . . . . . . . . . . . . . . . . . . . . . 2,951 5 .8 2,835 616 1,036 1,183 116
Age of reference person: Under 25 years old . . . . . . . . . . . . . . . . . . . . . 1,656 5.6 1,608 271 681 656 48 25 to 34 years old . . . . . . . . . . . . . . . . . . . . . . 2,845 5.9 2,766 524 1,105 1,137 79 35 to 44 years old . . . . . . . . . . . . . . . . . . . . . . 3,705 6.3 3,603 823 1,168 1,613 102 45 to 54 years old . . . . . . . . . . . . . . . . . . . . . . 3,421 5.6 3,297 805 1,174 1,318 124 55 to 64 years old . . . . . . . . . . . . . . . . . . . . . . 3,193 5.8 3,036 643 1,113 1,280 157 65 to 74 years old . . . . . . . . . . . . . . . . . . . . . . 2,570 7.0 2,418 498 885 1,035 152 75 years old and over . . . . . . . . . . . . . . . . . . . 1,481 3.6 1,349 268 628 453 132
Hispanic or Latino Origin of reference person: Hispanic . . . . . . . . . . . . . . . . . . . . . . . . . . . . . . 1,825 4.2 1,787 364 851 572 38 Non-Hispanic . . . . . . . . . . . . . . . . . . . . . . . . . . 3,097 6.0 2,971 648 1,060 1,262 126
Race of reference person: White, Asian, and all other races . . . . . . . . . . . 3,148 6.0 3,022 672 1,056 1,294 126 Black . . . . . . . . . . . . . . . . . . . . . . . . . . . . . . . . 1,525 4.2 1,478 210 894 375 47
Region of residence: Northeast . . . . . . . . . . . . . . . . . . . . . . . . . . . . . 3,101 5.6 2,960 724 1,090 1,145 141 Midwest . . . . . . . . . . . . . . . . . . . . . . . . . . . . . . 2,876 6.0 2,758 592 987 1,179 118 South . . . . . . . . . . . . . . . . . . . . . . . . . . . . . . . . 2,599 5.6 2,512 507 1,027 977 87 West . . . . . . . . . . . . . . . . . . . . . . . . . . . . . . . . . 3,473 6.3 3,333 726 1,056 1,551 140
Size of consumer unit: One person . . . . . . . . . . . . . . . . . . . . . . . . . . . 1,743 5.8 1,655 322 694 639 88 Two or more persons . . . . . . . . . . . . . . . . . . . . 3,443 5.9 3,315 736 1,176 1,404 128 Two persons . . . . . . . . . . . . . . . . . . . . . . . . . . 3,322 6.2 3,178 595 1,122 1,461 144 Three persons . . . . . . . . . . . . . . . . . . . . . . . . 3,193 5.4 3,070 720 1,206 1,143 123 Four persons . . . . . . . . . . . . . . . . . . . . . . . . . 3,829 5.8 3,714 942 1,276 1,496 115 Five persons or more . . . . . . . . . . . . . . . . . . . 3,710 5.6 3,612 949 1,177 1,486 98
Income before taxes: Quintiles of income: Lowest 20 percent . . . . . . . . . . . . . . . . . . . . . 1,137 5.1 1,082 156 536 390 55 Second 20 percent . . . . . . . . . . . . . . . . . . . . 1,789 5.6 1,716 221 726 769 73 Third 20 percent. . . . . . . . . . . . . . . . . . . . . . . 2,523 5.9 2,422 372 948 1,102 101 Fourth 20 percent . . . . . . . . . . . . . . . . . . . . . 3,404 5.8 3,276 647 1,262 1,367 128 Highest 20 percent . . . . . . . . . . . . . . . . . . . . 5,898 6.1 5,673 1,681 1,707 2,286 225
Education: Less than a high school graduate . . . . . . . . . . 1,361 4.6 1,318 129 640 549 43 High school graduate . . . . . . . . . . . . . . . . . . . . 2,205 5.4 2,129 297 947 885 76 High school graduate with some . . . . . . . . . . . 2,800 5.9 2,700 525 1,005 1,169 100 college . . . . . . . . . . . . . . . . . . . . . . . . . . . . . . Associate's degree . . . . . . . . . . . . . . . . . . . . . 3,264 6.1 3,146 628 1,214 1,305 118 Bachelor's degree . . . . . . . . . . . . . . . . . . . . . . 4,216 6.4 4,048 1,054 1,246 1,749 168 Master's, professional, doctoral degree . . . . . . 4,788 6.0 4,530 1,477 1,340 1,713 258
1 Other equipment and services include pets, toys, hobbies, and playground equipment; and other entertainment supplies, equipment, and services.
Source: U.S. Bureau of Labor Statistics, Consumer Expenditure Survey, “Consumer Expenditures in 2008,” October 2009. See also <http://www.bls.gov/cex/home.htm#tables>.

Arts, Recreation, and Travel 761U.S. Census Bureau, Statistical Abstract of the United States: 2011
Table 1233. Performing Arts—Selected Data: 1990 to 2008[Sales, receipts, and expenditures in millions of dollars (282 represents $282,000,000). For season ending in year shown, except as indicated]
Item 1990 1995 2000 2002 2003 2004 2005 2006 2007 2008Legitimate theater: 1
Broadway shows: New productions . . . . . . . . . . . . . . 40 33 37 37 36 39 39 39 35 36 Attendance (mil.) . . . . . . . . . . . . . . 8.0 9.0 11.4 11.0 11.4 11.6 11.5 12.0 12.3 12.3 Playing weeks 2, 3 . . . . . . . . . . . . . . 1,070 1,120 1,464 1,434 1,544 1,451 1,494 1,501 1,509 1,560 Gross ticket sales . . . . . . . . . . . . . 282 406 603 643 721 771 769 862 939 938 Broadway road tours:4
Attendance (mil.) . . . . . . . . . . . . . . 11.1 15.6 11.7 11.7 12.4 12.9 18.2 17.1 16.7 15.3 Playing weeks . . . . . . . . . . . . . . . . 944 1,242 888 863 877 1,060 1,389 1,377 1,400 1,138 Gross ticket sales . . . . . . . . . . . . . 367 701 572 593 642 714 934 915 950 956Nonprofit professional theatres: 5
Companies reporting 6 . . . . . . . . . . . 185 215 262 1,146 1,274 1,477 1,490 1,893 1,910 1,919 Gross income . . . . . . . . . . . . . . . . . 308 444 791 1,436 1,481 1,571 1,647 1,791 1,881 1,884 Earned income . . . . . . . . . . . . . . . 188 281 466 761 787 856 845 923 962 955 Contributed income . . . . . . . . . . . . 119 163 325 675 694 715 802 868 919 929 Gross expenses . . . . . . . . . . . . . . . . 306 445 708 1,405 1,476 1,464 1,530 1,667 1,742 1,860 Productions . . . . . . . . . . . . . . . . . . . 2,265 2,646 3,241 10,000 13,000 11,000 12,000 14,000 17,000 15,000 Performances . . . . . . . . . . . . . . . . . 46,131 56,608 66,123 157,000 170,000 169,000 169,000 172,000 197,000 202,000 Total attendance (mil.) . . . . . . . . . . . 15.2 18.6 22.0 32.2 34.3 32.1 32.5 30.5 31.0 32.0OPERA America professional member companies: 7
Number of companies reporting 8 . . 98 88 98 86 91 95 93 94 97 85 Expenses 8 . . . . . . . . . . . . . . . . . . . 321 435 637 684 692 678 742 752 872 826 Performances 9 . . . . . . . . . . . . . . . . 2,336 2,120 1,768 1,824.0 1,741 1,946 1,893 1,851 1,961 1,753 Total attendance (mil.) 9, 10 . . . . . . . 7.5 4.1 6.2 4.9 5.8 5.1 5 5.3 5.3 5.1 Main season attendance (mil.) 9, 11 . . . . . . . . . . . . . . . . . . . . 4.1 3.9 3.8 3.2 3.1 3.4 3.3 3.4 3.6 3.1Symphony orchestras: 12
Concerts . . . . . . . . . . . . . . . . . . . . . 18,931 29,328 33,154 37,118 38,182 37,263 37,196 36,731 37,169 (NA) Attendance (mil.) . . . . . . . . . . . . . . . 24.7 30.9 31.7 30.3 27.8 27.7 26.5 29.1 28.8 (NA) Gross revenue . . . . . . . . . . . . . . . . . 378 536 734 764 781 827 812 945 1,052 (NA) Operating expenses. . . . . . . . . . . . . 622 859 1,126 1,312 1,315 1,483 1,513 1,603 1,808 (NA) Support . . . . . . . . . . . . . . . . . . . . . . 258 351 521 580 576 639 626 713 721 (NA)
NA Not available. 1 Source: The Broadway League, New York, NY. For season ending in year shown. 2 All shows (newproductions and holdovers from previous seasons). 3 Eight performances constitute one playing week. 4 North American Tours include U.S. and Canadian companies. 5 Source: Theatre Communications Group, New York, NY. For years ending on or prior to Aug. 31. 6 Beginning in 2002, nonprofit theatre data is based on survey responses and extrapolated data from IRS Form 990.7 Source: OPERA America, New York, NY. For years ending on or prior to Aug 31. 8 U.S. companies. 9 Prior to 1993, and for 1999, U.S. and Canadian companies; 1993 to 1998 and 2000 to 2008, U.S. companies only. 10 Includes educational performances,outreach, etc. 11 For paid performances. 12 Source: League of American Orchestras, New York, NY. For years ending Aug. 31.Prior to 1995, represents 254 U.S. orchestras; beginning 1995, represents all U.S. orchestras, excluding college/university and youth orchestras. Also, beginning 1995, data based on 1,200 orchestras.
Source: Compiled from sources listed in footnotes. See also <http://www.livebroadway.com/>; <http://www.tcg.org/>; <http://www.operaamerica.org/>; and <http://www.americanorchestras.org/>.
Table 1232. Personal Consumption Expenditures for Recreation: 1990 to 2008[In billions of dollars (314.7 represents $314,700,000,000), except percent. Represents market value of purchases of goods and services by individuals and nonprofit institutions. Table data have been revised, along with changes to "Type of products and services." These changes resulted from BEA's 13th comprehensive NIPA revision released in July 2009. For more on these changes and revisions, see <http://www.bea.gov/scb/pdf/2009/03%20March/0309_nipa_preview.pdf>]
Type of product or service 1990 2000 2004 2005 2006 2007 2008 Total recreation expenditures . . . . . . . . . . . . . . . . . . . . . . . . 314 .7 639 .9 764 .6 807 .4 859 .1 906 .5 928 .0Percent of total personal consumption 1 . . . . . . . . . . . . . . . . . . . . 8.2 9.4 9.2 9.2 9.2 9.2 9.2Video and audio equipment, computers, and related services . . . 81.1 184.4 224.8 239.4 256.1 269.8 276.2 Video and audio equipment . . . . . . . . . . . . . . . . . . . . . . . . . . . . . 43.7 83.1 100.9 107.8 114.6 116.6 117.7Information processing equipment . . . . . . . . . . . . . . . . . . . . . . . . 9.6 44.1 51.5 55.9 60.4 65.3 66.3Services related to video and audio goods and computers . . . . . . 27.8 57.2 72.4 75.7 81.1 87.9 92.2Sports and recreational goods and related services . . . . . . . . . . . 74.2 147.9 178.3 188.4 199.6 209.3 211.5 Sports and recreational vehicles . . . . . . . . . . . . . . . . . . . . . . . . . 16.6 34.9 45.0 47.7 49.7 51.1 49.0 Other sporting and recreational goods . . . . . . . . . . . . . . . . . . . . 55.4 108.7 128.1 135.2 144.2 152.1 156.9 Maintenance and repair of recreational vehicles and sports equipment . . . . . . . . . . . . . . . . . . . . . . . . . . . . . . . . . . . . . . . . . 2.1 4.2 5.1 5.4 5.8 6.1 5.5Membership clubs, sports centers, parks, theaters, and museums . . . . . . . . . . . . . . . . . . . . . . . . . . . . . . . . . . . . . . . . . . . 49.7 91.9 106.5 110.6 117.8 125.1 128.3 Membership clubs and participant sports centers . . . . . . . . . . . 14.3 26.4 29.4 30.5 31.9 33.3 33.9Amusements parks, campgrounds, and related recreational services . . . . . . . . . . . . . . . . . . . . . . . . . . . . . . . . . . . . . . . . . . . . 19.2 31.1 33.1 34.9 37.4 40.2 41.7 Admissions to specified spectator amusements . . . . . . . . . . . . . . 14.4 30.6 38.5 39.2 42.1 44.5 45.6 Motion picture theaters . . . . . . . . . . . . . . . . . . . . . . . . . . . . . . . . 5.1 8.6 9.9 9.1 9.4 9.6 9.5 Live entertainment, excluding sports . . . . . . . . . . . . . . . . . . . . . 4.5 10.4 13.2 13.8 14.9 15.3 15.5 Spectator sports . . . . . . . . . . . . . . . . . . . . . . . . . . . . . . . . . . . . . 4.8 11.6 15.5 16.3 17.8 19.5 20.5Museums and libraries . . . . . . . . . . . . . . . . . . . . . . . . . . . . . . . . . 1.9 3.8 5.5 5.9 6.4 7.0 7.2Magazines, newspapers, books, and stationery . . . . . . . . . . . . . . 47.3 81.0 88.3 93.1 98.2 103.4 105.6Gambling . . . . . . . . . . . . . . . . . . . . . . . . . . . . . . . . . . . . . . . . . . . . 23.7 67.6 89.8 95.6 103.9 109.6 113.7Pets, pet products, and related services . . . . . . . . . . . . . . . . . . . . 18.8 39.7 49.8 53.1 56.9 61.6 65.1Photographic goods and services . . . . . . . . . . . . . . . . . . . . . . . . . 16.7 19.7 19.1 18.7 18.2 18.9 19.0Package tours 2 . . . . . . . . . . . . . . . . . . . . . . . . . . . . . . . . . . . . . . . 3.2 7.8 8.0 8.5 8.3 8.8 8.6
1 See Table 676. 2 Consists of tour operators' and travel agents' margins. Purchases of travel and accommodations included in tours are accounted for separately in other personal consumption expenditures categories.
Source: U.S. Bureau of Economic Analysis, National Economic Accounts, National Income and Product Account Tables,Table 2.5.5, August 2009. See also <http://www.bea.gov/national/nipaweb/Index.asp>

762 Arts, Recreation, and TravelU.S. Census Bureau, Statistical Abstract of the United States: 2011
Table 1235. Total State Arts Agency Legislative Appropriations: 2009 to 2010[In thousands of dollars (329,801 represents 329,801,000). For fiscal year ending September 30. The National Assembly of State Arts Agencies (NASAA) is the membership organization of the nations’ state and jurisdictional arts agencies. Legislative appropriations include funds designated to the state arts agency by state legislatures. These include line items, which are not controlled by the agency but passed through to designated entities. State arts agencies also receive monies from other sources including other state funds, the federal government (primarily the National Endowment for the Arts), private funds, and legislative earmarks. Minus sign (–) indicates decrease in spending]
State
Legislative appropriations
including line items
Percent change 2009 to
2010
State
Legislative appropriations
including line items
Percent change 2009 to
2010
State
Legislative appropriations
including line items
Percent change 2009 to
20102009 2010 2009 2010 2009 2010
U .S . . . . 329,801 296,973 –10 .0 KY . . . . . 3,410 3,285 –3.7 OH . . . . . 10,060 6,594 –34.4AL . . . . . 5,001 4,626 –7.5 LA . . . . . 7,127 5,579 –21.7 OK . . . . . 5,151 4,914 –4.6AK . . . . . 668 684 2.4 ME . . . . . 694 723 4.0 OR . . . . . 2,115 2,088 –1.3AZ . . . . . 1,454 956 –34.2 MD . . . . . 14,183 13,312 –6.1 PA . . . . . 15,615 11,992 –23.2AR . . . . . 1,597 2,121 32.8 MA . . . . . 12,659 9,693 –23.4 RI . . . . . . 1,906 1,984 4.1CA . . . . . 4,286 4,300 0.3 MI . . . . . . 7,255 1,417 –80.5 SC . . . . . 3,396 2,583 –23.9CO . . . . . 1,600 1,200 –25.0 MN . . . . . 10,227 30,274 196.0 SD . . . . . 644 669 3.9CT . . . . . 9,442 6,450 –31.7 MS . . . . . 1,813 1,907 5.2 TN . . . . . 8,084 8,383 3.7DE . . . . . 1,833 1,740 –5.1 MO . . . . . 7,072 13,580 92.0 TX . . . . . 3,898 7,745 98.7DC . . . . . 13,227 6,578 –50.3 MT . . . . . 459 460 0.3 UT . . . . . 3,555 2,911 –18.1FL . . . . . 7,160 2,500 –65.1 NE . . . . . 1,480 1,489 0.6 VT . . . . . 508 508 –GA . . . . . 3,951 2,595 –34.3 NV . . . . . 1,719 1,102 –35.9 VA . . . . . 5,234 4,421 –15.5HI . . . . . . 6,596 6,160 –6.6 NH . . . . . 807 603 –25.3 WA . . . . . 2,448 1,876 –23.4ID . . . . . . 898 788 –12.3 NJ . . . . . 22,134 17,047 –23.0 WV . . . . . 2,581 2,501 –3.1IL . . . . . . 15,959 7,553 –52.7 NM . . . . . 2,199 1,958 –11.0 WI . . . . . 2,470 2,418 –2.1IN . . . . . . 3,756 3,042 –19.0 NY . . . . . 48,890 52,032 6.4 WY . . . . . 1,254 1,144 –8.8IA . . . . . . 1,217 1,024 –15.9 NC . . . . . 9,767 8,678 –11.1KS . . . . . 1,469 1,262 –14.1 ND . . . . . 585 684 17.1
– Represents zero.Source: National Assembly of State Arts Agencies, “Legislative Appropriations Annual Survey,” February 2010,
<http://www.nasaa-arts.org/>.
Table 1236. Personal Participation in Various Arts or Creative Activities: 2008[In percent, except as indicated (224.8 represents 224,800,000). For persons 18 years old and over. Represents participation at least once in the prior 12 months]
Item
Adult popu-lation
(millions)Classical
music 1
Paint- ing 2 Pottery Sewing 3
Photo-graphy
Creative writing
Pur-chased
art 4
Choir/chorale
Total . . . . . . . . . . . . . . . . . 224 .8 3 .1 9 .0 6 .0 13 .1 14 .7 6 .9 28 .7 5 .2Sex: Male . . . . . . . . . . . . . . . . . . 108.5 3.0 7.1 4.5 2.3 13.3 6.2 29.6 3.9 Female . . . . . . . . . . . . . . . . 116.3 3.2 10.7 7.4 23.2 16.1 7.5 27.9 6.3Race and ethnicity: White alone . . . . . . . . . . . . 154.5 3.5 9.4 6.9 15.5 16.1 7.0 29.6 4.9 African American alone . . . 25.6 2.0 6.8 3.5 7.6 10.0 7.5 20.1 10.3 Other alone . . . . . . . . . . . . 14.3 4.7 11.9 6.1 10.2 16.2 8.2 16.5 5.5 Hispanic . . . . . . . . . . . . . . . 30.4 1.1 7.4 3.6 7.1 10.9 5.3 30.6 2.2Age: 18 to 24 years old . . . . . . . 28.9 5.9 14.7 6.4 9.0 17.8 11.3 37.2 6.1 25 to 34 years old . . . . . . . 39.9 3.7 11.3 6.1 10.0 16.1 9.7 38.8 3.8 35 to 44 years old . . . . . . . 41.8 3.0 9.9 7.5 11.4 18.6 6.2 27.1 4.3 45 to 54 years old . . . . . . . 43.9 2.5 7.4 7.0 15.4 14.6 6.4 28.0 6.8 55 to 64 years old . . . . . . . 33.3 2.4 6.8 5.4 15.7 13.0 4.4 25.6 5.3 65 to 74 years old . . . . . . . 19.9 1.8 5.0 4.1 17.7 10.4 5.2 28.7 6.2 75 years old and older . . . . 17.1 1.4 4.4 2.1 15.4 5.5 3.1 14.2 3.6
1 Of those who reported playing a musical instrument in the last 12 months. 2 Includes painting, drawing, sculpture, andprintmaking. 3 Includes weaving, crocheting, quilting, needlepoint, and sewing. 4 Of those who reported owning original art.
Source: U.S. National Endowment for the Arts, “2008 Survey of Public Participation in the Arts,” <http://www.nea.gov /pub/research/index.html>.
Table 1234. Arts and Humanities—Selected Federal Aid Programs: 1990 to 2008[In millions of dollars (170.8 represents $170,800,000), except as indicated. For fiscal year ending September 30]
Type of fund and program 1990 1995 2000 2003 2004 2005 2006 2007 2008National Endowment for the Arts: Funds available 1 . . . . . . . . . . . . . . . . . . . 170.8 152.1 85.2 101.0 105.5 108.8 112.8 111.7 129.3 Program appropriation 2 . . . . . . . . . . . . . 152.3 138.1 79.6 95.2 99.3 99.5 100.7 100.3 119.6 Grants awarded (number) 3 . . . . . . . . . . . 4,252 3,534 1,906 1,885 2,150 2,161 2,293 2,158 2,219 Funds obligated 4, 5 . . . . . . . . . . . . . . . . 157.6 147.9 83.5 99.3 102.6 104.4 107.0 106.5 125.5National Endowment for the Humanities: Funds available 1 . . . . . . . . . . . . . . . . . . . 140.6 152.3 102.6 111.6 127.1 119.8 121.5 122.3 128.6 Program appropriation . . . . . . . . . . . . . . 114.2 125.7 82.7 89.3 98.7 99.9 102.2 102.2 105.7 Matching funds 6 . . . . . . . . . . . . . . . . . . 26.3 25.7 15.1 16.0 15.9 15.9 15.2 15.2 14.3
1 Includes other funds, not shown separately. Excludes administrative funds. 2 FY 1990 and FY 1995 include Regular Program Funds, Treasury Funds, Challenge Grant Funds, and Policy, Planning, and Research Funds. FY 2000 includes Regular Program Funds and Matching Grant Funds. 3 Excludes cooperative agreements and interagency agreements. 4 Includes obligations for new grants, supplemental awards on previous years’ grants, cooperative agreements, and interagency agreements. 5 Beginning with 1997 data, the grantmaking structure changed from discipline-based categories to thematic ones. 6 Represents federal fundsobligated only upon receipt or certification by endowment of matching nonfederal gifts.
Source: U.S. National Endowment for the Arts, Annual Report, and U.S. National Endowment for the Humanities, Annual Report. See also <http://arts.endow.gov/> and <http://www.neh.gov/>.

Arts, Recreation, and Travel 763U.S. Census Bureau, Statistical Abstract of the United States: 2011
Table 1237. Attendance/Participation Rates for Various Arts Activities: 2008[In percent, except as indicated (224.8 represents 224,800,000). For persons 18 years old and over. Represents attending, visiting, or reading at least once in the prior twelve months. Excludes elementary and high school performances]
Item
Adult popu-lation
(million)Jazz
concert
Classical music
concert Musicals
Non-musical
plays
Art muse-
ums/ galleries
Craft/ visual
art festivals
Parks/ historic
build-ings 1
Read litera-ture 2
Total . . . . . . . . . . . . . . . . . . 224 .8 7 .8 9 .3 16 .7 9 .4 22 .7 24 .5 24 .9 50 .2Sex: Male . . . . . . . . . . . . . . . . . . 108.5 7.7 8.5 14.4 8.2 21.4 20.5 24.4 41.9 Female . . . . . . . . . . . . . . . . 116.3 7.9 10.0 18.9 10.6 24.0 28.3 25.4 58.0Race and Ethnicity: White alone . . . . . . . . . . . . 154.5 8.8 11.3 20.0 11.4 26.0 29.3 29.5 55.7 African American alone . . . 25.6 8.6 4.3 8.6 5.5 12.0 12.2 12.6 42.6 Other alone . . . . . . . . . . . . 14.3 4.0 8.8 13.4 6.1 23.4 17.0 20.0 43.9 Hispanic . . . . . . . . . . . . . . . 30.4 3.9 3.8 8.1 4.3 14.5 13.7 14.0 31.9Age: 18 to 24 years old . . . . . . . 28.9 7.3 6.9 14.5 8.2 22.9 17.8 21.9 51.7 25 to 34 years old . . . . . . . 39.9 7.7 7.0 16.0 9.2 24.3 22.7 25.7 50.1 35 to 44 years old . . . . . . . 41.8 7.2 8.9 18.2 8.9 25.7 27.2 26.8 50.8 45 to 54 years old . . . . . . . 43.9 9.8 10.2 17.4 8.7 23.3 29.1 28.0 50.3 55 to 64 years old . . . . . . . 33.3 9.7 11.6 19.5 12.3 24.3 28.9 27.6 53.1 65 to 74 years old . . . . . . . 19.9 6.1 12.2 18.0 11.0 19.9 24.8 24.1 49.1 75 years old and older . . . . 17.1 4.0 9.7 10.0 7.4 10.5 12.7 11.2 42.3Education: Grade school . . . . . . . . . . . 11.2 1.5 1.8 1.7 0.7 3.8 4.9 3.8 18.5 Some high school . . . . . . . 22.1 2.4 2.3 5.2 2.8 9.2 11.2 9.1 34.3 High school graduate . . . . . 68.3 3.9 3.1 8.1 4.0 9.6 17.3 14.6 39.1 Some college . . . . . . . . . . . 61.4 8.1 9.1 17.1 9.0 23.8 27.5 28.4 56.2 College graduate . . . . . . . . 41.3 13.7 16.7 30.1 17.5 40.6 35.8 39.4 66.6 Graduate school . . . . . . . . 20.5 17.4 27.1 37.9 24.3 52.2 41.6 48.1 71.2Income: 3
Less than $10,000 . . . . . . . 11.6 4.3 4.0 6.6 4.2 9.4 10.7 10.3 38.6 $10,000 to $19,999 . . . . . . 19.3 3.6 3.9 6.3 3.7 10.3 13.0 11.4 38.3 $20,000 to $29,999 . . . . . . 23.4 4.1 4.4 7.7 4.1 11.9 15.5 13.9 41.7 $30,000 to $39,999 . . . . . . 22.6 7.1 6.8 11.0 6.7 16.3 21.8 19.9 43.2 $40,000 to $49,999 . . . . . . 18.8 8.9 8.7 15.4 7.4 20.2 24.7 23.2 51.9 $50,000 to $74,999 . . . . . . 40.7 7.6 9.5 15.4 8.6 23.9 26.2 26.8 50.1 $75,000 to $99,999 . . . . . . 27.2 8.7 11.7 21.8 13.4 31.3 33.8 32.6 59.1 $100,000 to $149,999 . . . . 21.4 13.4 14.8 32.0 14.1 34.4 34.5 41.2 62.1 $150,000 and over . . . . . . . 16.0 15.4 22.8 40.1 24.2 51.9 37.5 47.3 71.2
1 Visiting historic parks or monuments or touring buildings or neighborhoods for the historic or design value.2 Literature is defined as poetry, novels, short stories, or plays. 3 Excludes results for respondents who did not report income
Source: U.S. National Endowment for the Arts, “2008 Survey of Public Participation in the Arts,” <http://www.nea.gov/pub/>.
Table 1238. Attendance/Participation in Various Leisure Activities: 2008[In percent, except as indicated (224.8 represents 224,800,000). See headnote, Table 1236]
ItemAdult
popu-lation (mil.)
Attendance at— Participation in—
MoviesSports events Exercise
Playing sports
Outdoor activities
Garden-ing
Volun-teering/ charity
work
Com-munity
activities Total . . . . . . . . . . . . . . . . . 224 .8 53 .3 30 .6 52 .9 26 .3 28 .2 41 .6 32 .0 27 .8Sex: Male . . . . . . . . . . . . . . . . . . 108.5 52.7 34.9 52.1 33.2 31.1 33.6 28.9 26.2 Female . . . . . . . . . . . . . . . . 116.3 54.0 26.6 53.6 20.0 25.4 48.9 34.9 29.3Race and Ethnicity: White alone . . . . . . . . . . . . 154.5 55.7 34.0 57.4 29.2 16.9 47.2 35.8 31.8 African American alone . . . 25.6 47.4 24.5 42.6 21.0 7.2 24.4 27.0 21.9 Other alone . . . . . . . . . . . . 14.3 49.3 21.8 48.6 23.5 26.1 40.1 25.7 22.7 Hispanic . . . . . . . . . . . . . . . 30.4 48.1 22.1 40.7 17.9 17.3 28.0 20.1 14.7Age: 18 to 24 years old . . . . . . . 28.9 74.2 37.4 57.4 42.0 34.8 15.1 27.2 19.4 25 to 34 years old . . . . . . . 39.9 64.5 37.3 57.5 34.9 35.7 34.8 29.4 23.5 35 to 44 years old . . . . . . . 41.8 59.5 36.7 59.5 32.0 34.3 43.9 37.6 33.2 45 to 54 years old . . . . . . . 43.9 52.6 31.3 51.8 23.9 29.0 49.1 35.7 31.8 55 to 64 years old . . . . . . . 33.3 46.2 25.9 51.8 17.1 22.4 52.4 33.4 29.7 65 to 74 years old . . . . . . . 19.9 31.7 18.2 47.6 13.3 17.9 54.5 30.2 30.9 75 years old and over . . . . 17.1 18.9 10.3 30.0 6.4 6.3 41.0 23.2 21.5Education: Grade school . . . . . . . . . . . 11.2 15.9 6.6 21.1 6.7 8.2 30.3 11.4 8.4 Some high school . . . . . . . 22.1 37.9 17.8 35.7 19.0 17.8 29.5 17.7 14.8 High school graduate . . . . . 68.3 42.5 22.8 40.0 17.4 20.8 37.7 20.9 18.3 Some college . . . . . . . . . . . 61.4 60.8 33.7 58.5 29.1 30.9 43.2 35.6 29.5 College graduate . . . . . . . . 41.3 68.8 44.9 70.8 38.9 39.8 49.0 48.1 42.6 Graduate school . . . . . . . . 20.5 71.6 44.2 77.1 40.0 42.3 53.3 51.5 48.0Income: 1
Less than $10,000 . . . . . . . 11.6 32.3 14.9 35.6 15.9 14.6 25.3 16.0 15.0 $10,000 to $19,999 . . . . . . 19.3 32.4 13.4 35.3 14.5 15.3 30.4 18.8 14.8 $20,000 to $29,999 . . . . . . 23.4 38.2 21.1 40.4 14.9 18.3 35.4 19.6 18.1 $30,000 to $39,999 . . . . . . 22.6 48.6 22.3 46.8 23.3 24.2 37.7 29.2 22.9 $40,000 to $49,999 . . . . . . 18.8 54.0 28.7 54.9 26.5 28.7 44.9 31.5 25.9 $50,000 to $74,999 . . . . . . 40.7 58.5 33.3 55.6 26.0 31.6 42.8 32.2 27.5 $75,000 or more . . . . . . . . 27.2 67.5 42.2 66.2 37.0 40.9 50.2 42.0 35.0 $100,000 to $149,999 . . . . 21.4 71.4 46.8 73.3 39.1 39.7 54.0 49.6 47.2 $150,000 and over . . . . . . . 16.0 76.7 53.1 73.2 46.0 43.9 50.9 49.0 43.9
1 Excludes results for respondents who did not report income.Source: U.S. National Endowment for the Arts, “2008 Survey of Public Participation in the Arts,” <http://www.nea.gov/pub/>.

764 Arts, Recreation, and TravelU.S. Census Bureau, Statistical Abstract of the United States: 2011
Table 1239. Adult Participation in Selected Leisure Activities by Frequency: 2009[In thousands (16,135 represents 16,135,000), except percent. For fall 2009. Percent is based on total projected population of 225,887,000. Based on sample and subject to sampling error; see source]
Activity
Participated in the last
12 months 1
Freqency of participation
Two or more times a week
Once a weekTwo to three
times a monthOnce a month
Number Percent Number Percent Number Percent Number Percent Number Percent
Adult education courses . . . . . . . . . . . . 16,135 7.1 2,889 1.3 2,281 1.0 835 0.4 918 0.4Attend auto shows . . . . . . . . . . . . . . . . . 18,908 8.4 129 0.1 338 0.2 610 0.3 909 0.4Attend art galleries or shows . . . . . . . . . 21,664 9.6 206 0.1 207 0.1 755 0.3 2,397 1.1Attend classical music/opera performances . . . . . . . . . . . . . . . . . . . . 9,721 4.3 99 (Z) 57 (Z) 427 0.2 1,032 0.5Attend country music performances . . . 12,534 5.6 116 0.1 122 0.1 230 0.1 471 0.2Attend dance performances . . . . . . . . . 10,673 4.7 86 (Z) 130 0.1 290 0.1 710 0.3Attend horse races . . . . . . . . . . . . . . . . 6,836 3.0 111 0.1 187 0.1 266 0.1 398 0.2Attend other music performances 2 . . . . 26,350 11.7 398 0.2 395 0.2 1,098 0.5 2,143 1.0Attend rock music performances . . . . . . 25,919 11.5 175 0.1 247 0.1 930 0.4 1,741 0.8Backgammon . . . . . . . . . . . . . . . . . . . . . 4,391 1.9 476 0.2 310 0.1 588 0.3 406 0.2Baking . . . . . . . . . . . . . . . . . . . . . . . . . . 58,905 26.1 10,575 4.7 8,901 3.9 13,141 5.8 9,268 4.1Barbecuing . . . . . . . . . . . . . . . . . . . . . . 81,453 36.1 12,955 5.7 12,809 5.7 19,341 8.6 11,375 5.0Billiards/pool . . . . . . . . . . . . . . . . . . . . . 23,224 10.3 1,399 0.6 1,520 0.7 2,153 1.0 2,759 1.2Bird watching . . . . . . . . . . . . . . . . . . . . . 14,090 6.2 6,098 2.7 1,040 0.5 1,005 0.4 1,026 0.5Board games . . . . . . . . . . . . . . . . . . . . . 41,148 18.2 2,882 1.3 3,890 1.7 7,928 3.5 7,988 3.5Book clubs . . . . . . . . . . . . . . . . . . . . . . . 6,706 3.0 217 0.1 456 0.2 422 0.2 2,354 1.0Chess . . . . . . . . . . . . . . . . . . . . . . . . . . 8,332 3.7 791 0.4 649 0.3 754 0.3 803 0.4Concerts on radio . . . . . . . . . . . . . . . . . 8,640 3.8 1,356 0.6 998 0.4 979 0.4 943 0.4Cooking for fun . . . . . . . . . . . . . . . . . . . 51,247 22.7 17,440 7.7 8,937 4.0 8,128 3.6 4,185 1.9Crossword puzzles . . . . . . . . . . . . . . . . 32,676 14.5 12,773 5.7 3,849 1.7 3,912 1.7 2,604 1.2Dance/go dancing . . . . . . . . . . . . . . . . . 22,877 10.1 1,927 0.9 2,656 1.2 2,573 1.1 3,463 1.5Dining out . . . . . . . . . . . . . . . . . . . . . . . 116,074 51.4 21,862 9.7 25,939 11.5 28,531 12.6 14,558 6.4Entertain friends or relatives at home . . 92,684 41.0 8,021 3.6 12,395 5.5 18,734 8.3 19,596 8.7Fantasy sports league . . . . . . . . . . . . . . 7,820 3.5 1,969 0.9 1,724 0.8 380 0.2 495 0.2Furniture refinishing . . . . . . . . . . . . . . . . 6,531 2.9 262 0.1 206 0.1 244 0.1 306 0.1Go to bars/night clubs . . . . . . . . . . . . . . 45,635 20.2 3,423 1.5 5,450 2.4 8,186 3.6 7,144 3.2Go to beach . . . . . . . . . . . . . . . . . . . . . . 56,671 25.1 2,867 1.3 2,621 1.2 5,544 2.5 5,956 2.6Go to live theater . . . . . . . . . . . . . . . . . . 32,325 14.3 218 0.1 632 0.3 1,285 0.6 3,740 1.7Go to museums . . . . . . . . . . . . . . . . . . . 32,724 14.5 315 0.1 325 0.1 948 0.4 3,523 1.6Home decoration and furnishing . . . . . . 24,058 10.7 752 0.3 1,342 0.6 2,248 1.0 3,901 1.7Karaoke . . . . . . . . . . . . . . . . . . . . . . . . . 9,274 4.1 301 0.1 758 0.3 714 0.3 1,299 0.6Painting, drawing . . . . . . . . . . . . . . . . . . 13,861 6.1 2,103 0.9 1,606 0.7 1,695 0.8 1,885 0.8Photo album/scrap book . . . . . . . . . . . . 18,392 8.1 1,347 0.6 1,156 0.5 1,839 0.8 3,365 1.5Photography . . . . . . . . . . . . . . . . . . . . . 26,268 11.6 4,075 1.8 3,236 1.4 5,568 2.5 4,178 1.9Picnic . . . . . . . . . . . . . . . . . . . . . . . . . . . 26,659 11.8 378 0.2 636 0.3 2,224 1.0 3,055 1.4Play bingo . . . . . . . . . . . . . . . . . . . . . . . 10,800 4.8 749 0.3 1,024 0.5 832 0.4 1,037 0.5Play cards . . . . . . . . . . . . . . . . . . . . . . . 48,249 21.4 5,680 2.5 5,488 2.4 6,838 3.0 6,978 3.1Play musical instrument . . . . . . . . . . . . . 17,863 7.9 6,321 2.8 2,240 1.0 1,913 0.9 1,042 0.5Reading books . . . . . . . . . . . . . . . . . . . . 93,536 41.4 50,063 22.2 8,921 4.0 8,250 3.7 6,397 2.8Reading comic books . . . . . . . . . . . . . . 5,624 2.5 1,028 0.5 504 0.2 649 0.3 605 0.3Sodoku puzzles . . . . . . . . . . . . . . . . . . . 26,250 11.6 8,719 3.9 3,292 1.5 3,330 1.5 2,704 1.2Trivia games . . . . . . . . . . . . . . . . . . . . . 14,136 6.3 2,447 1.1 1,360 0.6 1,708 0.8 1,311 0.6Woodworking . . . . . . . . . . . . . . . . . . . . . 12,001 5.3 1,909 0.9 1,344 0.6 1,633 0.7 1,373 0.6Word games . . . . . . . . . . . . . . . . . . . . . 23,596 10.5 7,998 3.5 3,188 1.4 2,715 1.2 1,796 0.8Zoo attendance . . . . . . . . . . . . . . . . . . . 30,685 13.6 143 0.1 283 0.1 630 0.3 1,765 0.8
Z represents less than 0.05. 1 Includes those participating less than once a month not shown separately. 2 Excluding country and rock.
Source: Mediamark Research & Intelligence, LLC, New York, NY, Top-line Reports, (copyright). See also<http://www.mediamark.com/>.
Table 1240. Household Pet Ownership: 2006[Based on a sample survey of 47,000 households in 2006; For definition of mean, see source]
Item Dogs Cats Birds Horses
Total companion pet population 1 . . . . . . . . . . . . . . . . . . . . . . . . . 72.1 81.7 11.2 7.3Number of households owning pets . . . . . . . . . . . . . . . . . . . . . . 43.0 37.5 4.5 2.1 Percent of households owning companion pets 1 . . . . . . . . . . . 37.2 32.4 3.9 1.8 Average number owned per household . . . . . . . . . . . . . . . . . . . 1.7 2.2 2.5 3.5
PERCENT OF HOUSEHOLDS OWNING PETSAnnual household income: Under $20,000 . . . . . . . . . . . . . . . . . . . . . . . . . . . . . . . . . . . . . . 30.7 30.1 4.4 1.5 $20,000 to $34,999 . . . . . . . . . . . . . . . . . . . . . . . . . . . . . . . . . . 37.3 33.6 4.2 1.7 $35,000 to $54,999 . . . . . . . . . . . . . . . . . . . . . . . . . . . . . . . . . . 39.8 34.1 4.4 2.1 $55,000 to $84,999 . . . . . . . . . . . . . . . . . . . . . . . . . . . . . . . . . . 42.8 35.5 3.7 1.9 $85,000 and over . . . . . . . . . . . . . . . . . . . . . . . . . . . . . . . . . . . . 42.1 33.3 3.7 2.3Household size:1
One person . . . . . . . . . . . . . . . . . . . . . . . . . . . . . . . . . . . . . . . . 21.9 24.7 2.1 0.8 Two persons . . . . . . . . . . . . . . . . . . . . . . . . . . . . . . . . . . . . . . . . 37.6 33.4 3.9 1.7 Three persons . . . . . . . . . . . . . . . . . . . . . . . . . . . . . . . . . . . . . . 47.5 39.1 5.1 2.3 Four persons . . . . . . . . . . . . . . . . . . . . . . . . . . . . . . . . . . . . . . . 51.9 38.5 5.4 2.7 Five or more persons . . . . . . . . . . . . . . . . . . . . . . . . . . . . . . . . . 54.3 40.0 6.6 3.6
1 As of December 31, 2006.Source: American Veterinary Medical Association, Schaumburg, IL, U.S. Pet Ownership and Demographics Sourcebook, 2007,
(copyright). See also <http://www.avma.org/reference/marketstats/sourcebook.asp>.

Arts, Recreation, and Travel 765U.S. Census Bureau, Statistical Abstract of the United States: 2011
Table 1241. Retail Sales and Household Participation in Lawn and Garden Activities: 2005 to 2009[(35,208 represents $35,208,000,000). For calendar year. Subject to sampling variability; see source]
ActivityRetail sales (mil. dol.) Percent households engaged in activity
2005 2006 2007 2008 2009 2005 2006 2007 2008 2009
Total . . . . . . . . . . . . . . . . . 35,208 34,077 35,102 36,060 30,121 83 74 71 70 72
Lawn care . . . . . . . . . . . . . . 9,657 8,558 10,754 9,638 8,075 54 48 48 46 46Indoor houseplants . . . . . . . 1,464 1,156 988 1,177 1,081 42 35 31 31 30Flower gardening . . . . . . . . . 3,003 2,572 2,386 2,679 2,299 41 33 30 32 31Insect control . . . . . . . . . . . . 1,869 1,746 2,103 1,734 1,567 30 26 25 25 22Shrub care . . . . . . . . . . . . . . 1,109 840 913 746 623 31 25 23 22 21
Vegetable gardening . . . . . . 1,154 1,164 1,421 1,402 1,762 25 22 22 23 27Tree care . . . . . . . . . . . . . . . 2,820 2,322 2,192 2,473 1,743 26 21 18 20 19Landscaping . . . . . . . . . . . . 9,078 10,893 9,874 11,712 8,418 31 30 27 28 27Flower bulbs . . . . . . . . . . . . 945 786 811 796 748 29 22 20 20 19Fruit trees . . . . . . . . . . . . . . 507 640 477 538 575 13 11 10 10 11
Container gardening . . . . . . 1,295 948 927 1,003 994 26 18 18 19 19Raising transplants 1 . . . . . . 237 257 320 220 241 11 9 7 8 9Herb gardening . . . . . . . . . . 371 296 451 391 423 17 12 13 12 14Growing berries . . . . . . . . . . 151 121 144 138 229 8 6 5 6 8Ornamental gardening . . . . . 678 493 561 424 445 12 7 6 6 6Water gardening . . . . . . . . . 870 1,285 780 989 898 11 14 11 10 11
1 Starting plants in advance of planting in ground.Source: The National Gardening Association, Burlington, VT, National Gardening Survey, annual (copyright). See also
<http://www.garden.org/>.
Table 1242. Selected Recreational Activities: 1990 to 2009[21,000 represents 21,000,000]
Activity Unit 1990 1995 2000 2004 2005 2006 2007 2008 2009
Golf facilities 1 . . . . . . . . . . . . Number . . . 12,846 14,074 15,489 16,057 16,052 15,990 15,970 15,979 15,979Tennis players 2 . . . . . . . . . . . 1,000 . . . . . 21,000 17,820 22,900 24,000 24,720 24,200 25,130 26,880 30,130Tenpin bowling: 3
Establishments . . . . . . . . . . Number . . . 7,611 7,049 6,247 5,761 5,818 5,566 5,498 (NA) (NA) Membership, total 4 . . . . . . . 1,000 . . . . . 6,588 4,925 3,756 3,112 2,896 2,728 2,608 (NA) (NA)
Skiing: 5
Skier visits 6 . . . . . . . . . . . . . Million . . . . 50.0 52.7 52.2 57.1 56.9 58.9 60.1 57.1 59.7 Operating resorts . . . . . . . . . Number . . . 591 520 503 494 492 478 481 473 471
Motion picture screens 7 . . . . 1,000 . . . . . 24 28 37 37 39 39 40 40 (NA) Receipts, box office . . . . . . . Mil. dol. . . . 5,022 5,494 7,468 9,215 8,832 9,137 9,630 9,791 (NA) Attendance . . . . . . . . . . . . . Million . . . . 1,189 1,263 1,385 1,484 1,378 1,395 1,400 1,364 (NA)
Boating: 8
People participating in recreational boating 9 . . . . . Million . . . . 67.4 70.0 67.5 63.4 57.9 60.2 66.4 70.1 65.9 Retail expenditures on boating 10 . . . . . . . . . . . . . . Mil. dol. . . . 13,731 17,226 27,065 32,953 37,317 39,493 37,416 33,624 30,821Recreational boats in use by boat type 11 . . . . . . . . . . . Million . . . . 16.0 15.4 16.8 17.4 17.7 16.8 16.9 16.9 16.7 Outboard . . . . . . . . . . . . . . Million . . . . (NA) (NA) 8.3 8.4 8.5 8.3 8.3 8.3 8.2 Inboard . . . . . . . . . . . . . . . Million . . . . (NA) (NA) 1.0 1.1 1.1 1.1 1.1 1.1 1.1 Sterndrive . . . . . . . . . . . . . Million . . . . (NA) (NA) 1.6 1.7 1.7 1.6 1.7 1.7 1.5 Personal watercraft . . . . . . Million . . . . (NA) (NA) 1.2 1.3 1.2 1.2 1.2 1.3 1.3 Sailboat . . . . . . . . . . . . . . . Million . . . . (NA) (NA) 1.6 1.6 1.6 1.6 1.6 1.6 1.5 Other . . . . . . . . . . . . . . . . . Million . . . . (NA) (NA) 3.1 3.4 3.6 3.1 3.1 3.1 3.0
NA Not available. 1 Source: National Golf Foundation, Jupiter, FL. 2 Source: Tennis Industry Association, Hilton Head, SC. Players for persons 12 years old and over who played at least once. 2008 data are for players 6 years old and over who played at least once. 3 Source: United States Bowling Congress, Greendale, WI. 4 Membership totals are for U.S., Canada, and for U.S. military personnel worldwide. 5 Source: National Ski Areas Association, Kottke National End of Season Survey Report (copyright).6 Represents one person visiting a ski area for all or any part of a day or night, and includes full- and half-day, night, complimen-tary, adult, child, season, and other types of tickets. Data are estimated and are for the season ending in the year shown. 7 Source: Motion Picture Association of America, Inc., Encino, CA. 8 Source: National Marine Manufacturers Association, Chicago, IL. (copyright). 9 People participating is now measured as adults 18 years and older. 10 Represents estimated expenditures for new and used boats, motors and engines, accessories, safety equipment, fuel, insurance, docking, maintenance, launching, storage, repairs, and other expenses. 11 2009 data are estimated.
Source: Compiled from sources listed in footnotes.

766 Arts, Recreation, and TravelU.S. Census Bureau, Statistical Abstract of the United States: 2011
Table 1245. Adult Attendance at Sports Events by Frequency: 2009[In thousands (2,097 represents 2,097,000), except percent. For fall 2009. Percent is based on total projected population of 225,887,000. Based on survey and subject to sampling error; see source]
Event
Attend one or more times in a
month
Attend less than once a
month Event
Attend one or more times in
a month
Attend less than once a
month
Num-ber
Per-cent
Num-ber
Per-cent
Num-ber
Per-cent
Num-ber
Per-cent
Auto racing—NASCAR . . . . . 2,097 0.9 16,693 7.4 Weekend professional games . . . 4,715 2.1 18,721 8.3Auto racing—Other . . . . . . . . 2,332 1.0 14,134 6.3 Golf . . . . . . . . . . . . . . . . . . . . . . . . 1,747 0.8 12,491 5.5Baseball . . . . . . . . . . . . . . . . . 9,442 4.2 27,778 12.3 High school sports . . . . . . . . . . . . . 11,724 5.2 15,426 6.8Basketball: Horse racing: College games . . . . . . . . . . . 4,623 2.1 15,615 6.9 Flats, runners . . . . . . . . . . . . . . . . 1,142 0.5 11,622 5.2 Professional games . . . . . . . 3,990 1.8 17,893 7.9 Trotters/harness . . . . . . . . . . . . . . 802 0.4 10,912 4.8Bowling . . . . . . . . . . . . . . . . . 1,878 0.8 11,478 5.1 Ice hockey . . . . . . . . . . . . . . . . . . . 2,465 1.1 15,781 7.0Boxing . . . . . . . . . . . . . . . . . . 1,199 0.5 11,124 4.9 Motorcycle racing . . . . . . . . . . . . . 980 0.4 11,434 5.1Equestrian events . . . . . . . . . 471 0.2 11,111 4.9 Pro beach volleyball. . . . . . . . . . . . 611 0.3 10,695 4.7Figure skating . . . . . . . . . . . . 554 0.3 11,021 4.9 Pro bull riding 1 . . . . . . . . . . . . . . . 716 0.3 11,488 5.1Fishing tournaments . . . . . . . 1,059 0.5 11,094 4.9 Rodeo 1 . . . . . . . . . . . . . . . . . . . . . 1,312 0.6 12,107 5.4Football: Soccer . . . . . . . . . . . . . . . . . . . . . . 3,819 1.7 12,585 5.6 College games . . . . . . . . . . . 7,522 3.3 18,805 8.3 Tennis . . . . . . . . . . . . . . . . . . . . . . 1,101 0.5 11,396 5.0 Monday night professional games . . . . . . . . . . . . . . . . 2,998 1.3 13,629 6.0
Truck and tractor pull mud racing. . 1,213 0.5 11,955 5.3Wrestling—professional . . . . . . . . . 1,651 0.7 11,333 5.0
1 Both pro bull riding and rodeo were measured as the combined “Rodeo/Bull riding.”Source: Mediamark Research & Intelligence. LLC, New York, NY, Top-line Reports (copyright). See <http://www.mediamark
.com>.
Table 1243. College and Professional Football Summary: 1990 to 2009[35,330 represents 35,330,000. For definition of median, see Guide to Tabular Presentation]
Sport Unit 1990 1995 2000 2005 2006 2007 2008 2009
NCAA college: 1 Teams . . . . . . . . . . . . . . . . . Number . . . 533 565 606 615 615 619 628 630 Attendance . . . . . . . . . . . . . 1,000 . . . . . 35,330 35,638 39,059 43,487 47,909 48,752 48,839 48,285National Football League: 2
Teams . . . . . . . . . . . . . . . . . Number . . . 28 30 31 32 32 32 32 32 Attendance, total 3 . . . . . . . . 1,000 . . . . . 17,666 19,203 20,954 21,792 22,200 22,256 21,859 21,285 Regular season . . . . . . . . . 1,000 . . . . . 13,960 15,044 16,387 17,012 17,341 17,345 17,057 16,651 Average per game . . . . . . Number . . . 62,321 62,682 66,078 66,455 67,738 67,755 66,629 65,043 Postseason games 4 . . . . . 1,000 . . . . . 848 (NA) 809 802 776 792 807 824 Players’ salaries: 5
Average . . . . . . . . . . . . . . . $1,000 . . . . 354 584 787 1,400 1,700 1,750 1,824 1,896 Median base salary . . . . . . $1,000 . . . . 275 301 441 569 722 772 788 790
NA Not available. 1 Source: National Collegiate Athletic Association, Indianapolis, IN, <http://www.ncaa.org/wps/portal> (copyright). 2 Source: National Football League, New York, NY, <http://www.nfl.com/>. 3 Preseason attendance data are not shown. 4 Includes Pro Bowl (a nonchampionship game) and Super Bowl. 5 Source: National Football League Players Association, Washington, DC., <http://www.nflpa.org/>.
Source: Compiled from sources listed in footnotes.
Table 1244. Selected Spectator Sports: 1990 to 2009[55,512 represents 55,512,000]
Sport Unit 1990 1995 2000 2004 2005 2006 2007 2008 2009
Baseball, major leagues: 1
Attendance . . . . . . . . . . . . . . . 1,000 . . . . . 55,512 51,288 74,339 74,822 76,286 77,524 80,803 79,975 74,823 Regular season . . . . . . . . . . . 1,000 . . . . . 54,824 50,469 72,748 73,023 74,926 76,043 79,503 78,588 73,368 National League . . . . . . . . . 1,000 . . . . . 24,492 25,110 39,851 40,221 41,644 44,085 44,114 41,579 41,128 American League . . . . . . . . 1,000 . . . . . 30,332 25,359 32,898 32,802 33,282 34,503 35,390 34,464 32,239 Playoffs 2 . . . . . . . . . . . . . . . . 1,000 . . . . . 479 533 1,314 1,625 1,191 1,218 1,083 1,167 1,166 World Series . . . . . . . . . . . . . 1,000 . . . . . 209 286 277 174 168 225 173 219 289 Players’ salaries: 3
Average . . . . . . . . . . . . . . . . . $1,000 . . . . 598 1,111 1,896 2,313 2,476 2,699 2,825 (NA) (NA)Basketball: 4, 5
NCAA—Men’s college: Teams . . . . . . . . . . . . . . . . . . Number . . . 767 868 932 981 983 984 982 1,017 1,017 Attendance . . . . . . . . . . . . . . 1,000 . . . . . 28,741 28,548 29,025 30,761 30,569 30,940 32,836 33,396 33,111 NCAA—Women’s college: Teams . . . . . . . . . . . . . . . . . . Number . . . 782 864 956 1,008 1,036 1,018 1,003 1,013 1,032 Attendance 6 . . . . . . . . . . . . . 1000. . . . . . 2,777 4,962 8,698 10,016 9,940 9,903 10,878 11,121 11,160National hockey league: Regular season attendance . . . 1,000 . . . . . 12,580 9,234 18,800 20,356 (8) 20,854 20,862 21,236 21,475 Playoffs attendance . . . . . . . . . 1,000 . . . . . 1,356 1,329 1,525 1,709 (8) 1,530 1,497 1,587 1,640Professional rodeo: 9
Rodeos . . . . . . . . . . . . . . . . . . Number . . . 754 739 688 671 662 649 592 609 560 Performances . . . . . . . . . . . . . Number . . . 2,159 2,217 2,081 1,982 1,940 1,884 1,733 1,861 1,656 Members . . . . . . . . . . . . . . . . . Number . . . 5,693 6,894 6,255 6,247 6,127 5,892 5,528 5,825 5,653 Permit-holders (rookies) . . . . . Number . . . 3,290 3,835 3,249 2,990 2,701 2,468 2,186 2,233 2,042 Total prize money . . . . . . . . . . . Mil. dol. . . . . 18.2 24.5 32.3 35.5 36.6 36.2 40.5 39.1 38.0
1 Source: Major League Baseball (previously, The National League of Professional Baseball Clubs), New York, NY, National League Green Book, and The American League of Professional Baseball Clubs, New York, NY, American League Red Book. 2 Beginning 1997, two rounds of playoffs were played. Prior years had one round. 3 Source: Major League Baseball Players Association, New York, NY. 4 Season ending in year shown. 5 Source: National Collegiate Athletic Association, Indianapolis, IN (copyright). 6 For women’s attendance total, excludes double-headers with men’s teams. 7 For season ending in year shown. Source: National Hockey League, Montreal, Quebec. 8 In September 2004, franchise owners locked out their players upon the expiration of the collective bar-gaining agreement. The entire season was cancelled in February 2005. 9 Source: Professional Rodeo Cowboys Association, Colorado Springs, CO., Official Professional Rodeo Media Guide, annual (copyright).
Source: Compiled from sources listed in footnotes.

Arts, Recreation, and Travel 767U.S. Census Bureau, Statistical Abstract of the United States: 2011
Table 1246. Participation in NCAA Sports by Sex: 2008 to 2009 [For the academic year]
SportMales Females
Teams AthletesAverage
squad Teams AthletesAverage
squad
Total . . . . . . . . . . . . . . . . . . . . . 8,465 244,267 (X) 9,560 182,503 (X)Archery . . . . . . . . . . . . . . . . . . . . (X) (X) (X) 1 12 12Badminton . . . . . . . . . . . . . . . . . . (X) (X) (X) 2 19 9.5Baseball . . . . . . . . . . . . . . . . . . . . 905 29,816 32.9 (X) (X) (X)Basketball . . . . . . . . . . . . . . . . . . 1,030 16,911 16.4 1,054 15,381 14.6Bowling . . . . . . . . . . . . . . . . . . . . 1 35 35 55 485 8.8Cross country . . . . . . . . . . . . . . . 916 13,015 14.2 996 14,101 14.2Equestrian 1, 2 . . . . . . . . . . . . . . . . 3 9 3.0 46 1,451 31.5Fencing 2 . . . . . . . . . . . . . . . . . . . 34 615 18.1 41 673 16.4Field hockey . . . . . . . . . . . . . . . . . (X) (X) (X) 260 5,603 21.6Football . . . . . . . . . . . . . . . . . . . . 633 64,879 102.5 (X) (X) (X)Golf 2 . . . . . . . . . . . . . . . . . . . . . . 792 8,299 10.5 543 4,308 7.9Gymnastics . . . . . . . . . . . . . . . . . 18 335 18.6 84 1,455 17.3Ice hockey . . . . . . . . . . . . . . . . . . 139 4,101 29.5 84 1,976 23.5Lacrosse . . . . . . . . . . . . . . . . . . . 247 9,266 37.5 319 7,219 22.6Rifle 2 . . . . . . . . . . . . . . . . . . . . . . 30 220 7.3 35 172 4.9Rowing . . . . . . . . . . . . . . . . . . . . . 63 2,353 37.3 146 7,289 49.9Rugby 1 . . . . . . . . . . . . . . . . . . . . 1 63 63.0 5 184 36.8Sailing 1 . . . . . . . . . . . . . . . . . . . . 25 520 20.8 (X) (X) (X)Skiing 2 . . . . . . . . . . . . . . . . . . . . . 38 505 13.3 41 502 12.2Soccer . . . . . . . . . . . . . . . . . . . . . 777 21,601 27.8 959 23,357 24.4Softball . . . . . . . . . . . . . . . . . . . . . (X) (X) (X) 949 17,489 18.4Squash 1 . . . . . . . . . . . . . . . . . . . (X) (X) (X) 28 381 13.6Swimming/diving 2 . . . . . . . . . . . . 393 8,868 22.6 510 11,626 22.8Synchronized swimming 1 . . . . . . (X) (X) (X) 8 109 13.6Tennis . . . . . . . . . . . . . . . . . . . . . 749 7,960 10.6 900 8,719 9.7Track, indoor 2 . . . . . . . . . . . . . . . 593 21,258 35.8 661 21,054 31.9Track, outdoor 2 . . . . . . . . . . . . . . 701 24,418 34.8 758 22,955 30.3Volleyball . . . . . . . . . . . . . . . . . . . 83 1,319 15.9 1,015 14,827 14.6Water polo . . . . . . . . . . . . . . . . . . 42 914 21.8 60 1,156 19.3Wrestling . . . . . . . . . . . . . . . . . . . 224 6,522 29.1 (X) (X) (X)
X Not applicable. 1 Sport recognized by the NCAA but does not have an NCAA championship. 2 Co-ed championship sport.Source: The National Collegiate Athletic Association (NCAA), Indianapolis, IN, 2008–09 Participation study (copyright),
<http://www.ncaa.org/wps/portal>.
Table 1247. Participation in High School Athletic Programs by Sex: 1980 to 2009[Data based on number of state associations reporting and may underrepresent the number of schools with and participants in athletic programs]
YearParticipant 1
Sex and sportMost popular sports,
2008–2009 2
Males Females Schools Participants
1980–81. . . . . . . . . . . . . . . . 3,503,124 1,853,789 MALE1985–86. . . . . . . . . . . . . . . . 3,344,275 1,807,121 Football (11-player) . . . . . . . . . 14,105 1,112,3031987–88. . . . . . . . . . . . . . . . 3,425,777 1,849,684 Track & field (outdoor) . . . . . . . 15,936 558,0071988–89. . . . . . . . . . . . . . . . 3,416,844 1,839,352 Basketball . . . . . . . . . . . . . . . . 17,869 545,1451989–90. . . . . . . . . . . . . . . . 3,398,192 1,858,659 Baseball . . . . . . . . . . . . . . . . . . 15,699 473,1841990–91. . . . . . . . . . . . . . . . 3,406,355 1,892,316 Soccer . . . . . . . . . . . . . . . . . . . 11,139 383,8241991–92. . . . . . . . . . . . . . . . 3,429,853 1,940,801 Wrestling . . . . . . . . . . . . . . . . . 10,254 267,3781992–93. . . . . . . . . . . . . . . . 3,416,389 1,997,489 Cross country . . . . . . . . . . . . . 13,647 231,4521993–94. . . . . . . . . . . . . . . . 3,472,967 2,130,315 Tennis . . . . . . . . . . . . . . . . . . . 9,499 157,1651994–95. . . . . . . . . . . . . . . . 3,536,359 2,240,461 Golf . . . . . . . . . . . . . . . . . . . . . 13,543 157,0621995–96. . . . . . . . . . . . . . . . 3,634,052 2,367,936 Swimming & diving . . . . . . . . . 6,556 130,1821996–97. . . . . . . . . . . . . . . . 3,706,225 2,474,0431997–98. . . . . . . . . . . . . . . . 3,763,120 2,570,3331998–99. . . . . . . . . . . . . . . . 3,832,352 2,652,726 FEMALE1999–20. . . . . . . . . . . . . . . . 3,861,749 2,675,874 Track & field (outdoor) . . . . . . . 15,864 457,7322000–01. . . . . . . . . . . . . . . . 3,921,069 2,784,154 Basketball . . . . . . . . . . . . . . . . 17,582 444,8092001–02. . . . . . . . . . . . . . . . 3,960,517 2,806,998 Volleyball . . . . . . . . . . . . . . . . . 15,069 404,2432002–03. . . . . . . . . . . . . . . . 3,988,738 2,856,358 Softball (fast pitch) . . . . . . . . . . 15,172 368,9212003–04. . . . . . . . . . . . . . . . 4,038,253 2,865,299 Soccer . . . . . . . . . . . . . . . . . . . 10,548 344,5342004–05. . . . . . . . . . . . . . . . 4,110,319 2,908,390 Cross country . . . . . . . . . . . . . 13,457 198,1992005–06. . . . . . . . . . . . . . . . 4,206,549 2,953,355 Tennis . . . . . . . . . . . . . . . . . . . 9,693 177,5932006–07. . . . . . . . . . . . . . . . 4,321,103 3,021,807 Swimming & diving . . . . . . . . . 6,902 158,8782007–08. . . . . . . . . . . . . . . . 4,372,115 3,057,266 Competitive spirit squads . . . . 4,748 117,7932008–09. . . . . . . . . . . . . . . . 4,422,662 3,114,091 Golf . . . . . . . . . . . . . . . . . . . . . 9,344 69,223
1 A participant is counted in the number of sports participated in. 2 Ten most popular sports for each sex in terms of number of participants.
Source: National Federation of State High School Associations, Indianapolis, IN, The 2008–2009 High School Athletics Participation Survey (copyright), <http://www.nfhs.org/>.

768 Arts, Recreation, and TravelU.S. Census Bureau, Statistical Abstract of the United States: 2011
Tab
le 1
24
8.
Part
icip
ati
on
in
Sele
cte
d S
port
s A
cti
vit
ies: 2
00
8[In
thou
sand
s (2
67,5
86 r
epre
sent
s 26
7,58
6,00
0), e
xcep
t ran
k. D
ata
are
base
d on
a q
uest
ionn
aire
mai
led
to 1
0,00
0 ho
useh
olds
. The
que
stio
nnai
re a
sked
the
mal
e an
d fe
mal
e he
ads
of h
ouse
hold
s an
d up
to tw
o ot
her
hous
ehol
d m
embe
rs w
ho w
ere
at le
ast s
even
yea
rs o
f age
to in
dica
te th
eir
age,
the
spor
ts in
whi
ch th
ey p
artic
ipat
ed in
200
8, a
nd th
e nu
mbe
r of
day
s of
par
ticip
atio
n in
200
8. A
par
ticip
ant i
s de
fined
as
an in
divi
dual
se
ven
year
s of
age
or
olde
r w
ho p
artic
ipat
es in
a s
port
mor
e th
an o
nce
a ye
ar. S
ee s
ourc
e fo
r m
etho
dolo
gy]
Act
ivity
All
pers
ons
Sex
Age
Hou
seho
ld in
com
e (d
olla
rs)
Num
ber
Mal
eF
emal
e7–
11
year
s12
–17
year
s18
–24
year
s25
–34
year
s35
–44
year
s45
–54
year
s55
–64
year
s65
and
ov
erU
nder
15
,000
15,0
00–
24,9
9925
,000
–34
,999
35,0
00–
49,9
9950
,000
–74
,999
75,0
00–
99,9
9910
0,00
0 an
d ov
er
SE
RIE
S I
SP
OR
TS
T
ota
l . . .
. . . .
. . . .
. . . .
267,
586
130,
281
137,
304
19,4
3925
,116
29,3
4837
,808
40,8
0743
,821
32,9
8538
,261
25,9
7425
,236
27,4
1435
,463
57,2
4638
,092
58,1
62N
umbe
r pa
rtic
ipat
ed in
— A
erob
ic e
xerc
isin
g 1 .
...
36,1
7710
,519
25,6
571,
458
2,32
44,
330
8,81
46,
727
6,43
93,
230
2,85
42,
030
2,79
22,
872
3,87
57,
904
5,69
111
,014
Bac
kpac
king
2 .
....
...
12,9
687,
383
5,58
51,
248
2,27
21,
859
2,83
62,
047
1,87
555
627
61,
037
906
1,10
72,
291
2,64
52,
553
2,43
0 B
aseb
all .
....
....
....
15,1
6612
,338
2,82
84,
004
3,26
42,
045
2,20
81,
487
992
647
519
1,24
599
088
22,
142
3,74
72,
358
3,80
2 B
aske
tbal
l ..
....
....
.29
,696
20,5
789,
118
5,26
28,
026
4,62
94,
801
3,36
02,
307
923
389
2,72
21,
554
2,37
64,
216
7,07
54,
393
7,36
0
Bic
ycle
rid
ing
1 ...
....
.44
,707
25,2
9419
,413
8,97
69,
076
3,79
45,
366
6,85
85,
870
3,00
61,
761
2,83
02,
689
2,90
84,
837
10,9
787,
068
13,3
96 B
illia
rds
...
....
....
..31
,680
19,6
5512
,025
1,56
32,
752
5,47
88,
483
5,95
04,
609
1,88
296
42,
547
2,51
43,
536
3,70
06,
815
4,30
58,
263
Bow
ling
...
....
....
..49
,522
24,6
9124
,831
6,48
27,
706
7,99
59,
602
8,40
05,
413
2,16
61,
758
3,45
72,
747
4,57
56,
238
11,0
998,
600
12,8
06 C
ampi
ng 3
...
....
....
49,3
5925
,897
23,4
635,
979
6,75
85,
742
8,76
67,
945
8,19
53,
591
2,38
43,
410
3,17
34,
088
7,16
012
,364
9,82
99,
336
Exe
rcis
e w
alki
ng 1
...
..96
,613
37,3
3759
277
3,83
95,
826
8,94
814
,958
16,4
3319
,539
13,6
2213
,448
8,13
68,
520
8,57
912
,353
21,4
5313
,824
23,7
50
Exe
rcis
ing
with
equ
ipm
ent 1
....
....
.62
,982
29,6
8833
,295
1,24
64,
364
8,81
212
,830
11,5
4910
,818
6,80
26,
561
3,31
44,
166
5,56
77,
418
13,8
569,
898
18,7
63 F
ishi
ng (
net)
....
....
..42
,161
28,4
4013
,722
4,12
64,
659
4,39
67,
304
7,56
47,
054
4,19
32,
865
3,48
03,
514
4,62
76,
472
9,93
66,
399
7,73
3
Fis
hing
––fr
esh
wat
er .
.37
,798
25,3
4712
,452
3,84
74,
452
4,15
66,
783
6,75
65,
984
3,52
32,
297
3,32
53,
022
4,37
65,
989
8,89
35,
637
6,55
6
Fis
hing
––sa
lt w
ater
...
9,35
77,
197
2,16
051
766
068
71,
466
1,97
21,
751
1,29
81,
005
345
755
576
1,09
42,
237
1,82
72,
520
Foo
tbal
l—ta
ckle
...
....
10,4
779,
391
1,08
61,
939
3,56
92,
047
1,37
261
737
822
832
81,
133
623
909
1,40
12,
760
1,61
12,
040
Gol
f ..
....
....
....
..25
,620
19,9
275,
692
1,37
91,
468
2,42
05,
104
4,70
84,
621
3,24
02,
679
514
968
2,07
72,
418
5,28
04,
788
9,57
5 H
ikin
g ...
....
....
....
38,0
2519
,098
18,9
273,
089
3,73
63,
668
8,36
26,
584
6,84
63,
673
2,06
73,
000
2,25
23,
372
5,06
78,
456
5,92
99,
949
Run
ning
/jogg
ing
1 .
....
35,9
0418
,670
17,2
332,
834
6,06
26,
508
8,78
45,
625
4,14
61,
459
485
1,99
21,
682
3,05
74,
824
7,49
65,
979
10,8
74 S
occe
r ...
....
....
...
15,4
929,
015
6,47
75,
050
4,23
41,
701
2,27
11,
161
787
201
861,
420
632
1,10
32,
022
3,24
52,
392
4,67
7 S
oftb
all .
....
....
....
.12
,843
6,61
36,
230
1,80
52,
442
1,86
93,
065
1,76
31,
077
649
172
1,33
457
21,
311
1,63
02,
914
1,94
23,
139
Sw
imm
ing
1 .
....
....
.63
,507
30,1
5233
,354
10,0
1010
,522
6,76
99,
956
9,42
68,
527
4,49
63,
799
3,68
53,
899
4,44
97,
983
15,0
799,
993
18,4
19 T
enni
s .
....
....
....
.12
,646
6,29
06,
356
1,34
92,
193
2,05
32,
307
1,92
81,
540
816
459
425
432
508
1,28
82,
893
2,40
54,
695
Vol
leyb
all .
....
....
...
12,1
555,
052
7,10
31,
453
3,68
21,
766
1,89
71,
525
1,24
739
918
653
948
899
51,
886
2,41
12,
318
3,51
7 W
eigh
tlifti
ng .
....
....
.37
,504
24,0
1513
,488
370
4,19
16,
240
9,84
86,
973
5,84
22,
574
1,46
51,
515
2,47
03,
243
4,63
17,
896
6,34
511
,403
Yog
a ..
....
....
....
..16
,018
3,14
512
,873
452
953
2,84
44,
128
2,95
62,
386
1,23
81,
062
1,32
91,
208
1,31
51,
655
3,52
72,
088
4,89
5
See
foot
note
s at
end
of t
able
.
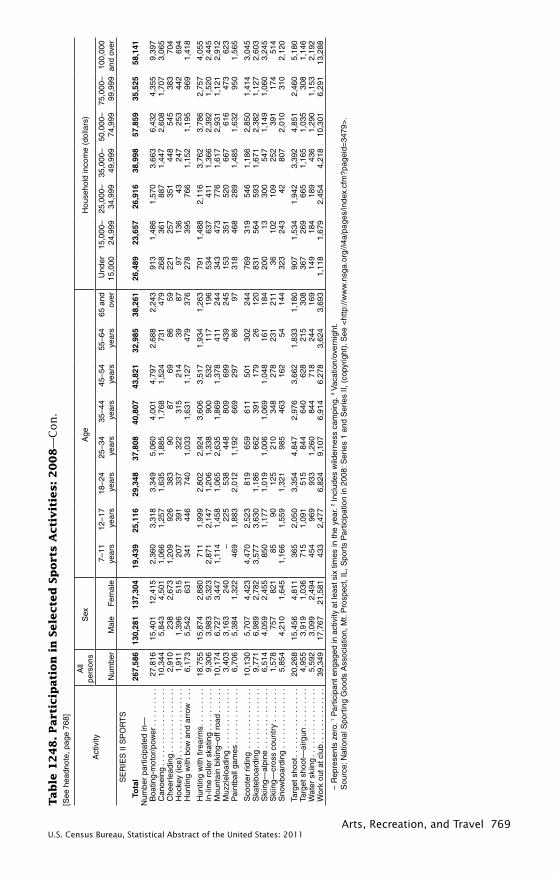
Arts, Recreation, and Travel 769U.S. Census Bureau, Statistical Abstract of the United States: 2011
Tab
le 1
24
8.
Part
icip
ati
on
in
Sele
cte
d S
port
s A
cti
vit
ies: 2
00
8—
Con
.[S
ee h
eadn
ote,
pag
e 76
8]
Act
ivity
All
pers
ons
Sex
Age
Hou
seho
ld in
com
e (d
olla
rs)
Num
ber
Mal
eF
emal
e7–
11
year
s12
–17
year
s18
–24
year
s25
–34
year
s35
–44
year
s45
–54
year
s55
–64
year
s65
and
ov
erU
nder
15
,000
15,0
00–
24,9
9925
,000
–34
,999
35,0
00–
49,9
9950
,000
–74
,999
75,0
00–
99,9
9910
0,00
0 an
d ov
er
SE
RIE
S II
SP
OR
TS
T
ota
l26
7,58
613
0,28
113
7,30
419
,439
25,1
1629
,348
37,8
0840
,807
43,8
2132
,985
38,2
6126
,489
23,6
5726
,916
38,9
9857
,859
35,5
2558
,141
Num
ber
part
icip
ated
in—
Boa
ting-
mot
or/p
ower
...
....
..27
,816
15,4
0112
,415
2,36
03,
318
3,34
95,
060
4,00
14,
797
2,68
82,
243
913
1,48
61,
570
3,66
36,
432
4,35
59,
397
Can
oein
g ..
....
....
....
....
10,3
445,
843
4,50
11,
066
1,25
71,
635
1,88
51,
768
1,52
473
147
926
836
188
71,
447
2,60
81,
707
3,06
5 C
heer
lead
ing
....
....
....
...
2,91
023
82,
673
1,20
992
638
390
8769
8659
221
257
351
448
545
383
704
Hoc
key
(ice)
...
....
....
....
.1,
911
1,39
651
520
739
133
732
231
521
439
8797
136
4324
725
344
269
4 H
untin
g w
ith b
ow a
nd a
rrow
...
6,17
35,
542
631
341
446
740
1,03
31,
631
1,12
747
937
627
839
576
61,
152
1,19
596
91,
418
Hun
ting
with
fire
arm
s ...
....
..18
,755
15,8
742,
880
711
1,99
92,
802
2,92
43,
606
3,51
71,
934
1,26
379
11,
488
2,11
63,
762
3,78
62,
757
4,05
5 I
n-lin
e ro
ller
skat
ing
....
....
..9,
306
3,98
35,
323
2,87
12,
147
1,20
61,
338
900
532
117
196
534
637
411
1,36
62,
392
1,52
02,
445
Mou
ntai
n bi
king
–off
road
...
...
10,1
746,
727
3,44
71,
114
1,45
81,
065
2,63
51,
869
1,37
841
124
434
347
377
61,
617
2,93
11,
121
2,91
2 M
uzzl
eloa
ding
...
....
....
...
3,40
33,
163
240
☼–22
553
844
880
969
943
924
515
335
152
066
761
647
362
3 P
aint
ball
gam
es .
....
....
....
6,70
65,
384
1,32
246
91,
883
2,01
21,
192
669
297
8697
318
468
289
1,48
51,
632
950
1,56
5
Sco
oter
rid
ing
...
....
....
...
10,1
305,
707
4,42
34,
470
2,52
381
965
961
150
130
224
476
931
954
61,
186
2,85
01,
414
3,04
5 S
kate
boar
ding
...
....
....
...
9,77
16,
989
2,78
23,
577
3,63
01,
186
662
391
179
2612
083
156
459
31,
671
2,38
21,
127
2,60
3 S
kiin
g—al
pine
...
....
....
...
6,51
44,
059
2,45
585
01,
177
1,01
91,
006
1,06
91,
048
161
184
200
1330
054
71,
149
1,06
03,
245
Ski
ing—
cros
s co
untr
y ..
....
..1,
578
757
821
8590
125
210
348
278
231
211
3610
210
925
239
117
451
4 S
now
boar
ding
...
....
....
...
5,85
44,
210
1,64
51,
166
1,55
91,
321
985
463
162
5414
432
324
342
807
2,01
031
02,
120
Tar
get s
hoot
...
....
....
....
.20
,268
15,4
564,
811
365
2,05
03,
354
4,84
72,
976
3,66
21,
833
1,18
090
71,
534
1,94
23,
392
4,85
12,
460
5,18
0 T
arge
t sho
ot—
airg
un .
....
....
4,95
53,
919
1,03
671
51,
091
515
844
640
628
215
308
367
269
665
1,16
51,
035
308
1,14
6 W
ater
ski
ing
....
....
....
....
5,59
23,
099
2,49
445
496
993
31,
260
844
718
244
169
149
184
189
436
1,29
01,
153
2,19
2 W
ork
out a
t clu
b ..
....
....
...
39,3
4917
,767
21,5
8143
32,
477
6,82
49,
107
6,91
46,
278
3,62
43,
693
1,11
81,
679
2,45
44,
218
10,3
016,
291
13,2
88
– R
epre
sent
s ze
ro. 1
Par
ticip
ant e
ngag
ed in
act
ivity
at l
east
six
tim
es in
the
year
. 2 In
clud
es w
ilder
ness
cam
ping
. 3 Vac
atio
n/ov
erni
ght.
Sou
rce:
Nat
iona
l Spo
rtin
g G
oods
Ass
ocia
tion,
Mt.
Pro
spec
t, IL
, Spo
rts
Par
ticip
atio
n in
200
8: S
erie
s 1
and
Ser
ies
II, (
copy
right
). S
ee <
http
://w
ww
.nsg
a.or
g//i4
a/pa
ges/
inde
x.cf
m?p
agei
d=34
79>
.

770 Arts, Recreation, and TravelU.S. Census Bureau, Statistical Abstract of the United States: 2011
Table 1249. Sporting Goods Sales by Product Category: 1990 to 2008, and Projection, 2009[In millions of dollars (50,725 represents $50,725,000,000), except percent. Based on a sample survey of consumer purchases of 80,000 households, (100,000 beginning 2000), except recreational transport, which was provided by industry associations. Excludes Alaska and Hawaii. Minus sign (–) indicates decrease]
Selected product category1990 2000 2003 2004 2005 2006 2007 2008
2009, proj.
Sales, all products . . . . . . . . . . . . . . . . 50,725 74,442 79,779 85,811 88,434 90,472 91,423 79,632 72,055 Annual percent change 1 . . . . . . . . . . . (NA) 4.6 2.6 7.6 3.1 2.3 1.1 –12.9 –9.5 Percent of retail sales . . . . . . . . . . . . . . (NA) 2.5 2.4 2.5 2.4 2.3 2.3 2.0 1.8
Athletic and sport clothing . . . . . . . . . . . . . 10,130 11,030 10,543 11,201 10,898 10,580 10,834 10,563 10,476Athletic and sport footwear 2 . . . . . . . . . . . 11,654 13,026 14,446 14,752 15,719 16,910 17,524 17,190 17,191 Aerobic shoes . . . . . . . . . . . . . . . . . . . . . 611 292 222 237 261 262 280 260 257 Basketball shoes . . . . . . . . . . . . . . . . . . . 918 786 890 877 878 964 892 718 726 Cross training shoes . . . . . . . . . . . . . . . . 679 1,528 1,407 1,327 1,437 1,516 1,584 1,626 1,640 Golf shoes . . . . . . . . . . . . . . . . . . . . . . . . 226 226 222 230 259 232 244 239 234 Gym shoes, sneakers . . . . . . . . . . . . . . . 2,536 1,871 2,059 2,221 2,314 2,434 2,699 2,639 2,656 Jogging and running shoes . . . . . . . . . . . 1,110 1,638 1,802 1,989 2,157 2,260 2,193 2,301 2,292 Tennis shoes . . . . . . . . . . . . . . . . . . . . . . 740 533 544 508 528 505 452 467 459 Walking shoes . . . . . . . . . . . . . . . . . . . . . 2,950 3,317 3,468 3,496 3,673 4,091 4,197 4,204 4,164Athletic and sport equipment 2 . . . . . . . . . . 14,439 21,608 22,394 23,328 23,735 24,497 25,061 24,883 24,638 Archery . . . . . . . . . . . . . . . . . . . . . . . . . . 265 259 320 332 372 396 396 394 383 Baseball and softball . . . . . . . . . . . . . . . . 217 319 340 352 372 388 401 396 387 Billiards and indoor games . . . . . . . . . . . 192 516 625 622 572 574 531 426 395 Camping . . . . . . . . . . . . . . . . . . . . . . . . . 1,072 1,354 1,487 1,531 1,447 1,526 1,453 1,460 1,431 Exercise . . . . . . . . . . . . . . . . . . . . . . . . . . 1,824 3,610 4,957 5,074 5,177 5,239 5,500 5,308 5,096 Fishing tackle . . . . . . . . . . . . . . . . . . . . . . 1,910 2,030 1,981 2,026 2,139 2,218 2,247 2,105 2,038 Golf . . . . . . . . . . . . . . . . . . . . . . . . . . . . . 2,514 3,805 3,046 3,198 3,466 3,669 3,722 3,546 3,439 Hunting and firearms . . . . . . . . . . . . . . . . 2,202 2,274 2,654 3,175 3,563 3,732 3,942 4,584 4,938 Optics . . . . . . . . . . . . . . . . . . . . . . . . . . . 438 729 847 859 887 1,014 1,019 1,024 1,034 Skin diving and scuba . . . . . . . . . . . . . . . 294 355 338 351 358 369 376 373 363 Snow skiing 3 . . . . . . . . . . . . . . . . . . . . . . 475 495 462 452 643 501 531 494 479 Tennis . . . . . . . . . . . . . . . . . . . . . . . . . . . 333 383 343 362 397 418 440 380 368Recreational transport . . . . . . . . . . . . . . . . 14,502 28,779 32,397 36,531 38,082 38,485 38,003 26,996 19,750 Bicycles and supplies . . . . . . . . . . . . . . . 2,423 5,131 4,736 4,898 5,343 5,161 5,393 5,285 4,968 Pleasure boats, motors, accessories . . . . 7,644 13,224 14,705 16,054 17,634 17,907 17,473 12,580 8,200 Recreational vehicles . . . . . . . . . . . . . . . 4,113 9,529 12,058 14,753 14,366 14,732 14,505 8,587 6,011 Snowmobiles . . . . . . . . . . . . . . . . . . . . . . 322 894 898 826 739 685 632 544 571
NA Not available. 1 Represents change from immediate prior year. 2 Includes other products not shown separately. 3 Data through 2004 categorized as “Skiing Downhill.”
Source: National Sporting Goods Association, Mt. Prospect, IL, The Sporting Goods Market in 2009 and prior issues,(copyright). See <http://www.nsga.org/i4a/pages/index.cfm?pageid=3345>.
Table 1250. Consumer Purchases of Sporting Goods by Consumer Characteristics: 2008[In percent. Based on sample survey of consumer purchases of 100,000 households. Excludes Alaska and Hawaii]
Characteristic
Total
Footwear Equipment
Aerobic shoes
Fitness shoes
Gym shoes/sneak-
ers
Jog-ging/
running shoes
Walking shoes
Multi pur-
pose home gyms
Rod/reel
combi-nation
Golf club sets Rifles
Soccer balls
Total . . . . . . . . . . . . . . . . . . 100 100 100 100 100 100 100 100 100 100 100Age of user: . . . . . . . . . . . . . . . . Under 14 years old . . . . . . . . . 18.8 6.4 12.7 42.1 7.6 6.3 – 10.5 7.6 3.5 53.6 14 to 17 years old… 5.7 4.8 6.6 8.7 9.2 2.2 2.6 3.4 1.1 2.6 14.5 18 to 24 years old . . . . . . . . . . 9.8 6.6 6.6 5.2 7.2 3.4 1.1 2.9 3.8 7.1 5.6 25 to 34 years old . . . . . . . . . . 13.4 27.4 17.7 13.8 27.3 9.6 31.4 17.0 19.1 19.8 13.3 35 to 44 years old . . . . . . . . . . 14.3 18.7 15.7 11.2 20.3 13.4 18.5 24.7 9.3 17.1 8.7 45 to 64 years old . . . . . . . . . . 25.4 29.0 30.3 14.4 23.8 43.5 40.3 33.5 43.2 40.2 0.5 65 years old and over . . . . . . . 12.6 7.1 10.4 4.6 4.6 21.6 3.9 7.1 15.9 9.7 – Multiple ages . . . . . . . . . . . . . . – – – – – – 2.2 0.9 – – 3.8Sex of user: Male . . . . . . . . . . . . . . . . . . . . . 49.3 17.8 36.7 56.6 47.0 37.0 58.0 82.3 80.6 90.3 68.9 Female . . . . . . . . . . . . . . . . . . . 50.7 82.2 63.3 43.4 53.0 63.0 33.9 8.7 19.4 7.4 26.4 Household use . . . . . . . . . . . . . – – 0.1 – – – 8.1 9.0 – 2.3 4.7Annual household income: Under $15,000 . . . . . . . . . . . . . 11.3 7.5 8.0 6.0 2.7 7.7 – 7.4 0.5 11.9 2.6 $15,000 to $24,999 . . . . . . . . . 12.2 11.2 4.7 6.9 5.5 10.9 1.3 4.0 – 14.2 2.3 $25,000 to $34,999 . . . . . . . . . 12.7 11.9 12.2 13.1 7.6 9.2 9.6 15.4 2.8 12.3 8.9 $35,000 to $49,999 . . . . . . . . . 14.8 12.4 16.3 15.3 11.3 16.0 7.2 15.8 6.4 16.3 11.3 $50,000 to $74,999 . . . . . . . . . 18.2 16.3 13.9 21.0 21.0 20.5 20.0 24.8 22.1 20.1 18.9 $75,000 to $99,999 . . . . . . . . . 15.2 15.8 24.6 16.1 18.3 17.6 28.0 12.3 23.2 16.2 27.3 $100,000 and over . . . . . . . . . . 15.6 24.9 20.3 21.6 33.6 18.1 33.9 20.3 45.0 9.0 28.7Education of household head:Less than high school . . . . . . . . 6.3 1.8 3.8 4.8 2.2 4.8 0.9 6.4 1.3 3.8 1.5High school . . . . . . . . . . . . . . . . 22.7 11.4 18.9 21.3 13.4 22.9 10.0 24.2 8.3 26.6 11.6Some college . . . . . . . . . . . . . . . 36.1 35.3 29.9 37.8 27.1 37.4 30.4 45.1 23.8 39.5 29.8College graduate . . . . . . . . . . . . 34.9 51.5 47.4 36.1 57.3 34.9 58.7 24.3 66.6 30.1 57.1
– Represents or rounds to zero. Source: National Sporting Goods Association, Mt. Prospect, IL, The Sporting Goods Market in 2009, (copyright).
See <http://www.nsga.org.public/pages/index.cfm?pageid=869\>.

Arts, Recreation, and Travel 771U.S. Census Bureau, Statistical Abstract of the United States: 2011
Table 1251. National Park System—Summary: 1990 to 2008 [For year ending September 30, except as noted. (986 represents $986,000,000). Includes data for five areas in Puerto Rico and Virgin Islands, one area in American Samoa, and one area in Guam]
Item 1990 1995 2000 2004 2005 2006 2007 2008Finances (mil. dol.): 1
Expenditures reported . . . . . . . . . . . . . . . . . . . 986 1,445 1,833 2,371 2,451 2,463 2,412 2,614 Salaries and wages . . . . . . . . . . . . . . . . . . . . 459 633 799 956 984 998 1,005 1,066 Improvements, maintenance . . . . . . . . . . . . . 160 234 299 332 361 389 381 428 Construction . . . . . . . . . . . . . . . . . . . . . . . . . 109 192 215 354 381 300 280 303 Other . . . . . . . . . . . . . . . . . . . . . . . . . . . . . . . 259 386 520 729 725 776 746 817 Funds available . . . . . . . . . . . . . . . . . . . . . . . . 1,506 2,225 3,316 4,087 4,218 4,242 4,266 4,537 Appropriations . . . . . . . . . . . . . . . . . . . . . . . . 1,053 1,325 1,881 2,388 2,425 2,450 2,484 2,636 Other 2 . . . . . . . . . . . . . . . . . . . . . . . . . . . . . . 453 900 1,435 1,699 1,793 1,792 1,782 1,901 Revenue from operations . . . . . . . . . . . . . . . . 79 106 234 264 286 308 346 404Recreation visits (millions): 3
All areas . . . . . . . . . . . . . . . . . . . . . . . . . . . . . . 258.7 269.6 285.9 276.9 273.5 272.6 275.6 274.9 National parks 4 . . . . . . . . . . . . . . . . . . . . . . . 57.7 64.8 66.1 63.8 63.5 60.4 62.3 61.2 National monuments . . . . . . . . . . . . . . . . . . . 23.9 23.5 23.8 19.8 20.9 19.6 19.7 20.2 National historical, commemorative, archaeological 5 . . . . . . . . . . . . . . . . . . . . . . 57.5 56.9 72.2 77.0 74.9 73.6 75.1 76.2 National parkways . . . . . . . . . . . . . . . . . . . . . 29.1 31.3 34.0 31.7 31.7 32.6 31.1 30.2 National recreation areas 4 . . . . . . . . . . . . . . 47.2 53.7 50.0 46.6 46.8 47.8 48.9 49.6 National seashores and lakeshores . . . . . . . 23.3 22.5 22.5 21.3 21.7 19.6 19.9 19.3 National Capital Parks . . . . . . . . . . . . . . . . . . 7.5 5.5 5.4 4.7 4.3 6.2 4.9 5.1 Recreation overnight stays (millions) . . . . . . . . 17.6 16.8 15.4 13.7 13.5 13.2 13.8 13.7 In commercial lodgings . . . . . . . . . . . . . . . . . 3.9 3.8 3.7 3.5 3.4 3.4 3.6 3.6 In Park Service campgrounds . . . . . . . . . . . . 7.9 7.1 5.9 5.4 5.2 5.0 5.1 5.0 In backcountry . . . . . . . . . . . . . . . . . . . . . . . . 1.7 2.2 1.9 1.7 1.7 1.7 1.7 1.8 Other . . . . . . . . . . . . . . . . . . . . . . . . . . . . . . . 4.2 3.7 3.8 3.1 3.2 3.1 3.4 3.3Land (1,000 acres): 6, 7
Total . . . . . . . . . . . . . . . . . . . . . . . . . . . . . . . . . 76,362 77,355 78,153 79,023 79,048 78,810 78,845 78,859 Parks . . . . . . . . . . . . . . . . . . . . . . . . . . . . . . . 46,089 49,307 49,785 49,892 49,910 49,912 49,911 49,916 Recreation areas . . . . . . . . . . . . . . . . . . . . . . 3,344 3,353 3,388 3,391 3,391 3,391 3,413 3,413 Other . . . . . . . . . . . . . . . . . . . . . . . . . . . . . . . 26,929 24,695 24,980 25,740 25,747 25,507 25,521 25,530 Acquisition, net . . . . . . . . . . . . . . . . . . . . . . . . 21 27 186 12 17 16 23 7
1 Financial data are those associated with the National Park System. Certain other functions of the National Park Service (principally the activities absorbed from the former Heritage Conservation and Recreation Service in 1981) are excluded. 2 Includes funds carried over from prior years. 3 For calendar year. Includes other areas, not shown separately. 4 For 1990, com-bined data for North Cascades National Park and two adjacent National Recreation Areas are included in National Parks total. 5 Includes military areas. 6 Federal land only, as of Dec. 31. Federal land acreages, in addition to National Park Service admin-istered lands, also include lands within national park system area boundaries but under the administration of other agencies. Year-to-year changes in the federal lands figures includes changes in the acreages of these other lands and hence often differ from “net acquisition.” 7 The decrease in the 2006 land total reflects corrected acreage by the Bureau of Land Management, and not by the National Park Service lands.
Source: U.S. National Park Service, National Park Statistical Abstract, annual and unpublished data. See also <http://www2.nature.nps.gov/stats/>.
Table 1252. State Parks and Recreation Areas by State: 2007[For year ending June 30 (13,922 represents 13,922,000). Data are shown as reported by state park directors. In some states, park agency has forests, fish and wildlife areas, and/or other areas under its control. In other states, park agency is responsible for state parks only]
StateAcreage (1,000)
Visitors (1,000)1
Revenue
StateAcreage (1,000)
Visitors (1,000)1
Revenue
Total ($1,000)
Percent of operating expendi-
turesTotal
($1,000)
Percent of operating expendi-
tures
United States . . . 13,922 747,964 935,005 40 .1 Missouri . . . . . . . . . 204 15,142 8,095 27.5Montana . . . . . . . . . 55 5,333 4,952 55.3
Alabama . . . . . . . . 48 5,142 22,567 57.0 Nebraska . . . . . . . . 135 10,236 16,681 84.7Alaska . . . . . . . . . . 3,361 4,977 2,791 35.2 Nevada . . . . . . . . . 139 3,132 2,748 18.3Arizona . . . . . . . . . 64 2,348 9,639 38.9 New Hampshire . . . 233 1,626 4,324 58.7Arkansas . . . . . . . . 54 8,399 22,332 48.3 New Jersey . . . . . . 426 18,543 10,388 26.9California . . . . . . . . 1,566 79,854 90,672 21.3 New Mexico . . . . . . 93 4,604 3,904 14.0Colorado . . . . . . . . 420 11,834 25,811 66.9 New York . . . . . . . . 1,348 61,771 88,000 43.2Connecticut . . . . . . 206 7,504 5,104 29.9 North Carolina . . . . 202 12,868 5,317 13.8Delaware . . . . . . . . 26 5,022 12,397 53.6 North Dakota . . . . . 18 879 1,585 47.0Florida . . . . . . . . . . 700 20,737 42,779 54.8 Ohio . . . . . . . . . . . . 174 49,659 27,530 37.3Georgia . . . . . . . . . 86 10,351 35,272 56.2 Oklahoma . . . . . . . 72 13,485 36,368 78.7Hawaii . . . . . . . . . . 34 10,182 2,206 20.5 Oregon . . . . . . . . . . 99 42,605 17,187 36.1Idaho . . . . . . . . . . . 46 4,031 3,608 20.9 Pennsylvania . . . . . 292 33,210 17,176 20.6Illinois . . . . . . . . . . . 486 45,159 6,804 11.9 Rhode Island . . . . . 9 6,217 4,322 47.6Indiana . . . . . . . . . . 179 18,043 41,379 78.1 South Carolina . . . . 84 7,050 21,116 77.9Iowa . . . . . . . . . . . . 69 13,382 3,864 25.1 South Dakota . . . . . 103 7,375 11,530 82.0Kansas . . . . . . . . . . 33 6,875 5,998 57.1 Tennessee . . . . . . . 174 32,264 37,770 44.6Kentucky . . . . . . . . 49 7,082 54,983 61.1 Texas . . . . . . . . . . . 602 7,142 38,172 43.8Louisiana . . . . . . . . 43 1,679 7,669 24.6 Utah . . . . . . . . . . . . 151 4,554 10,694 34.3Maine . . . . . . . . . . . 100 2,124 3,027 34.4 Vermont . . . . . . . . . 69 698 6,124 79.9Maryland . . . . . . . . 133 11,330 16,694 49.4 Virginia . . . . . . . . . . 68 7,040 14,214 45.5Massachusetts . . . . 341 31,635 11,299 14.6 Washington . . . . . . 117 41,590 17,881 25.7Michigan . . . . . . . . 273 19,309 38,639 86.7 West Virginia . . . . . 177 7,324 20,390 57.7Minnesota . . . . . . . 279 8,380 15,694 44.9 Wisconsin . . . . . . . 139 14,516 17,011 80.4Mississippi . . . . . . . 24 1,212 8,926 63.0 Wyoming . . . . . . . . 122 2,511 1,371 19.0
1 Includes overnight visitors.Source: The National Association of State Park Directors, Raleigh, NC, 2007–2008 Annual Information Exchange, February
2009. See <http://www.naspd.org/>.

772 Arts, Recreation, and TravelU.S. Census Bureau, Statistical Abstract of the United States: 2011
Table 1253. National Park Service (NPS) Visits and Acreage by State: 2009[See headnote, Table 1254]
State Recreation
visits 1
Gross area acres
Federal land Nonfederal land
NPS fee acres 2
NPS/OTFED less than
fee acres 3
Other federal
fee acres 4
Other public acres
Private acres
Total . . . . . . . . . . . . . 283,654,947 84,320,287 79,691,620 276,867 427,466 1,173,078 2,751,256Alabama . . . . . . . . . . . 790,752 22,737 16,715 202 – 3,295 2,525Alaska . . . . . . . . . . . . . 2,278,488 54,654,052 52,636,434 27,959 8 188,256 1,801,395Arizona . . . . . . . . . . . . 10,713,122 2,962,853 2,618,735 115 76,937 57,067 209,999Arkansas . . . . . . . . . . . 3,031,842 104,976 98,319 3,395 6 2,736 521California . . . . . . . . . . . 35,318,711 8,109,854 7,564,496 22,437 12,917 313,800 196,205Colorado . . . . . . . . . . . 5,443,039 673,589 609,880 6,859 42,451 862 13,537Connecticut . . . . . . . . . 19,386 7,782 5,719 1,055 – 874 133District of Columbia . . . 35,695,833 7,090 6,953 7 – 126 4Florida . . . . . . . . . . . . . 9,495,437 2,638,354 2,436,859 1,330 45,839 129,192 25,135Georgia . . . . . . . . . . . . 6,475,874 62,888 39,664 125 1,461 16,777 4,861Hawaii . . . . . . . . . . . . . 4,312,818 369,122 357,772 1 22 11,228 98Idaho . . . . . . . . . . . . . . 494,196 517,904 507,585 1,138 3,960 901 4,320Illinois . . . . . . . . . . . . . . 464,074 13 12 – – – 1Indiana . . . . . . . . . . . . . 2,230,024 15,378 10,590 499 – 3,286 1,003Iowa . . . . . . . . . . . . . . . 241,063 2,713 2,708 – – 5 1Kansas . . . . . . . . . . . . . 101,906 11,636 461 269 – 39 10,866Kentucky . . . . . . . . . . . 1,828,340 95,415 94,395 137 – 831 52Louisiana . . . . . . . . . . . 443,314 24,107 17,531 – – 2,476 4,101Maine . . . . . . . . . . . . . . 2,227,698 90,282 66,919 11,120 22 10,646 1,575Maryland . . . . . . . . . . . 3,445,530 73,325 40,480 5,938 480 23,806 2,621Massachusetts . . . . . . . 9,772,738 57,954 32,946 973 40 21,915 2,080Michigan . . . . . . . . . . . 1,628,704 718,188 631,717 732 42 58,515 27,183Minnesota . . . . . . . . . . 650,156 301,343 139,528 3,193 142 98,802 59,678Mississippi . . . . . . . . . . 6,582,890 118,736 103,698 5,232 – 71 9,734Missouri . . . . . . . . . . . . 3,933,043 83,475 54,382 9,262 – 14,070 5,760Montana . . . . . . . . . . . . 4,195,484 1,274,374 1,214,184 1,233 6,137 1,464 51,355Nebraska . . . . . . . . . . . 273,444 45,735 5,650 494 981 386 38,223Nevada . . . . . . . . . . . . 5,836,491 778,512 774,751 – 2,508 81 1,172New Hampshire . . . . . . 34,558 21,894 8,391 1,556 5,772 162 6,013New Jersey . . . . . . . . . 5,828,477 99,206 35,362 140 3,208 59,000 1,497New Mexico . . . . . . . . . 1,659,574 391,029 376,528 5 2,524 3,365 8,607New York . . . . . . . . . . . 17,327,234 72,674 33,483 3,920 164 19,812 15,295North Carolina . . . . . . . 18,198,530 406,159 363,042 12,272 20,782 3,289 6,774North Dakota . . . . . . . . 631,459 72,579 71,250 256 151 56 867Ohio . . . . . . . . . . . . . . . 2,882,593 34,149 19,423 1,329 84 8,203 5,109Oklahoma . . . . . . . . . . 1,249,011 10,241 10,008 9 189 8 27Oregon . . . . . . . . . . . . . 891,783 199,095 192,020 1,404 4,975 183 513Pennsylvania . . . . . . . . 8,885,894 137,660 49,927 2,590 387 19,627 65,130Rhode Island . . . . . . . . 50,397 5 5 – – – –South Carolina . . . . . . . 1,504,680 32,618 31,125 61 5 51 1,376South Dakota . . . . . . . . 4,134,663 297,417 141,313 122,328 – 79 33,697Tennessee . . . . . . . . . . 8,061,847 384,752 356,476 1,679 9,629 3,614 13,353Texas . . . . . . . . . . . . . . 6,938,238 1,244,635 1,199,425 85 1,013 5,079 39,033Utah . . . . . . . . . . . . . . . 8,755,401 2,117,043 2,097,106 833 1,142 12,803 5,160Vermont . . . . . . . . . . . . 31,129 23,174 8,830 3,874 8,809 544 1,116Virginia . . . . . . . . . . . . . 22,953,894 363,640 304,105 6,843 24,914 7,002 20,776Washington . . . . . . . . . 7,559,552 1,967,116 1,833,697 2,147 100,187 12,799 18,286West Virginia . . . . . . . . 1,803,552 92,670 64,425 326 314 6,894 20,711Wisconsin . . . . . . . . . . 452,365 133,754 61,744 11,484 802 47,624 12,102Wyoming . . . . . . . . . . . 5,895,719 2,396,390 2,344,852 21 48,462 1,380 1,675
– Represents zero. 1 See footnotes, Table 1254.Source: U.S. National Park Service, Land Resource Board, and unpublished data. See also <http://www2.nature.nps.gov
/stats/>.
Table 1254. National Park Service (NPS) Visits and Acreage by Type of Area: 2009[Includes data for five areas in Puerto Rico and Virgin Islands, one area in American Samoa, and one area in Guam]
Type of areaRecreation
visits 1
Gross area acres
Federal land Non-federal land
NPS fee acres 2
NPS/OTFED less than
fee acres 3
Other federal
fee acres 4
Other public acres
Private acres
Total 5 . . . . . . . . . . . . . . . . 285,579,941 84,378,873 79,706,436 276,870 458,310 1,179,266 2,757,992National historic sites. . . . . . . 9,975,007 33,980 21,204 783 51 922 11,020National historical parks . . . . 28,432,210 182,300 130,460 3,556 360 28,716 19,207National memorials . . . . . . . . 30,559,258 10,638 9,428 8 138 63 1,000National monuments . . . . . . . 22,646,428 2,026,731 1,840,938 14,830 43,418 5,899 121,646National parks . . . . . . . . . . . . 62,950,968 52,095,017 50,393,545 148,822 49,270 497,192 1,006,188National recreation areas . . . 50,945,414 3,700,280 3,147,473 23,718 243,101 106,309 179,681National seashores . . . . . . . . 17,920,507 596,564 404,438 14,890 61,226 106,668 9,341National parkways . . . . . . . . . 29,948,911 178,071 158,137 9,108 213 319 10,293
1 Recreation visit represents the entry of a person onto lands or waters administered by the National Park Service (NPS) for recreational purposes excluding government personnel, through traffic (commuters), trades-persons, and persons residing within park boundaries. 2 Fee represents complete Federal ownership of all rights in the land. 3 Represents Federal ownership of some rights in the land. 4 NPS acreage lies under the jurisdiction of another federal agency (such as Bureau of Land Management).5 Includes other “type of areas,” not shown separately.
Source: U.S. National Park Service, Land Resource Board, and unpublished data. See also <http://www2.nature.nps.gov /stats/>.

Arts, Recreation, and Travel 773U.S. Census Bureau, Statistical Abstract of the United States: 2011
Table 1255. Participants in Wildlife-Related Recreation Activities: 2006[In thousands (33,916 represents 33,916,000). For persons 16 years old and over engaging in activity at least once in 2006. Based on survey and subject to sampling error; see source for details]
ParticipantNumber
Days of participa-
tion TripsParticipant
Number
Days of
participation
Total sportspersons 1 . . 33,916 736,707 588,891 Wildlife watchers 1 . . . . . . . . 71,132 (X)Total anglers . . . . . . . . . . . . 29,952 516,781 403,492 Away from home 2 . . . . . . . 22,977 352,070 Freshwater . . . . . . . . . . . . . 25,431 433,337 336,528 Observe wildlife . . . . . . . . 21,546 291,027 Excluding Great Lakes . . 25,035 419,942 323,265 Photograph wildlife . . . . . 11,708 103,872 Great Lakes . . . . . . . . . . . 1,420 18,016 13,264 Feed wildlife . . . . . . . . . . . 7,084 77,329 Saltwater . . . . . . . . . . . . . . 7,717 85,663 66,963 Around the home 3 . . . . . . . 67,756 (X)Total hunters . . . . . . . . . . . . 12,510 219,925 185,399 Observe wildlife . . . . . . . . 44,467 (X) Big game . . . . . . . . . . . . . . 10,682 164,061 115,255 Photograph wildlife . . . . . 18,763 (X) Small game . . . . . . . . . . . . 4,797 52,395 40,856 Feed wildlife . . . . . . . . . . . 55,512 (X) Migratory birds . . . . . . . . . . 2,293 19,770 16,390 Visit public parks . . . . . . . 13,271 (X) Other animals . . . . . . . . . . 1,128 15,205 12,898 Maintain plantings or
natural areas . . . . . . . . . 14,508 (X)
X Not applicable. 1 Detail does not add to total due to multiple responses and nonresponse. 2 Persons taking a trip of at least 1 mile from home for activity. 3 Activity within 1 mile of home.
Source: U.S. Fish and Wildlife Service, 2006 National Survey of Fishing, Hunting, and Wildlife Associated Recreation, October 2007. See also <http://wsfrprograms.fws.gov/Subpages/NationalSurvey/nat_survey2006_final.pdf>.
Table 1256. Expenditures for Wildlife-Related Recreation Activities: 2006[(42,011 represents $42,011,000,000). For persons 16 years old and over. Based on survey and subject to sampling error; see source for details]
Expenditure item
Fishing Hunting Wildlife watching
Expendi-tures
(mil. dol.)
Spenders
Expendi-tures
(mil. dol.)
Spenders
Expendi-tures
(mil. dol.)
Spenders
Number (1,000)
Percent of anglers
Number (1,000)
Percent of hunters
Number (1,000)
Percent of watch-
ers 2
Total, all items 1 . . . . . . . . . 42,011 28,307 95 22,893 12,153 97 45,655 55,979 79
Total trip-related 3 . . . . . . . . . . . 17,879 26,318 88 6,679 10,828 87 12,875 19,443 85 Food and lodging . . . . . . . . . . 6,303 22,572 75 2,791 9,567 76 7,516 16,415 71 Food . . . . . . . . . . . . . . . . . . 4,327 22,415 75 2,177 9,533 76 4,298 16,261 71 Lodging . . . . . . . . . . . . . . . . 1,975 5,304 18 614 1,599 13 3,218 6,624 29 Transportation . . . . . . . . . . . . 4,962 22,361 75 2,697 10,064 80 4,456 18,329 80 Public . . . . . . . . . . . . . . . . . . 524 1,163 4 214 401 3 1,567 2,902 13 Private . . . . . . . . . . . . . . . . . 4,438 21,979 73 2,483 9,982 80 2,889 17,447 76 Other trip costs . . . . . . . . . . . 6,614 22,275 74 1,190 3,416 27 903 7,681 33
Total equipment and other expenditures . . . . . . . . . . . . . 24,133 25,355 85 16,215 11,745 94 32,780 52,178 73 Equipment 4 . . . . . . . . . . . . . . 5,332 19,082 64 5,366 9,287 74 9,870 49,040 69 Auxiliary equipment . . . . . . . . 779 3,837 13 1,330 4,196 34 1,033 4,848 7 Special equipment 5 . . . . . . . . 12,646 1,818 6 4,035 505 4 12,271 1,914 3 Other expenditures 6 . . . . . . . 5,375 20,638 69 5,483 10,632 85 9,606 19,070 27 Magazines, books . . . . . . . . 115 2,944 10 84 1,767 14 360 9,490 13 Licenses, stamps, tags, and permits . . . . . . . . . . . . 503 16,259 54 743 9,862 79 (X) (X) (X)
X Not applicable. 1 Total not adjusted for multiple responses or nonresponse. 2 Percent of wildlife-watching participants column is based on away-from-home participants for trip-related expenditures. For equipment and other expenditures the percent of wildlife-watching participants is based on total participants. 3 Information on trip-related expenditures for wildlife watching was collected for away-from-home participants only. Equipment and other expenditures for wildlife watching are based on information collected from both away-from-home and around-the-home participants. 4 Includes fishing, hunting, and wildlife-watching. 5 Special equipment includes boats, campers, cabins, trail bikes, etc. 6 Other expenditures not shown.
Source: U.S. Fish and Wildlife Service, 2006 National Survey of Fishing, Hunting, and Wildlife Associated Recreation, October 2007. See <http://wsfrprograms.fws.gov/Subpages/NationalSurvey/nat_survey2006_final.pdf>.
Table 1257. Tribal Gaming Revenues: 2004 to 2009[In millions (19,479 represents $19,479,000,000). For year ending September 30]
Region
2004 2005 2006 2007 2008 2009
Num-ber of
opera-tions
Rev-enue
Num-ber of
opera-tions
Rev-enue
Num-ber of
opera-tions
Rev-enue
Num-ber of
opera-tions
Rev-enue
Num-ber of
opera-tions
Rev-enue
Num-ber of
opera-tions
Rev-enue
Total 1 . . . . . 375 19,479 392 22,579 394 24,889 391 26,143 405 26,739 419 26,482Region I . . . . 45 1,602 49 1,829 46 2,080 46 2,264 47 2,376 49 2,376Region II . . . . 54 5,822 57 6,993 56 7,675 58 7,796 59 7,363 62 6,970Region III . . . . 45 2,160 48 2,529 45 2,719 46 2,874 46 2,774 47 2,600Region IV . . . . 117 3,816 118 3,984 122 4,070 111 4,225 115 4,402 120 4,384Region V . . . . 87 1,259 92 1,730 98 2,126 102 2,584 110 3,047 113 3,225Region VI . . . . 27 4,821 28 5,514 27 6,219 28 6,400 28 6,776 28 6,783
1 Portland (Region 1): Alaska, Idaho, Oregon, and Washington. Sacramento (Region 2): California, and Northern Nevada. Phoenix (Region 3): Arizona, Colorado, New Mexico, and Southern Nevada. St Paul (Region 4): Iowa, Michigan, Minnesota, Montana, North Dakota, Nebraska, South Dakota, Wisconsin, and Wyoming. Data for Montana not included for 2004. Oklahoma City (Region 5): Western Oklahoma, and Texas. Tulsa (Region 5): Kansas and Eastern Oklahoma. Washington (Region 6): Alabama, Connecticut, Florida, Louisiana, Mississippi, North Carolina, and New York.
Source: National Indian Gaming Commission, Tribal Gaming Revenues, annual. See also <http://www.nigc.gov>.

774 Arts, Recreation, and TravelU.S. Census Bureau, Statistical Abstract of the United States: 2011
Table 1259. North America Cruise Industry in the United States: 2004 to 2008[The North American passenger cruise industry is defined as those cruise lines that primarily market their cruises in North America. These cruise lines offer cruises with destinations throughout the globe. While most of these cruises originate in ports throughout North America, cruises also originate at ports in other continents]
Item Unit 2004 2005 2006 2007 2008
Capacity Measures: Number of ships . . . . . . . . . . . . . . . . . . . . Number . . . . . . . 144 145 151 159 161 Lower berths 1. . . . . . . . . . . . . . . . . . . . . . Number . . . . . . . 225,714 225,364 244,271 259,973 270,664Passenger embarkations, global: 2 . . . . . 1,000 . . . . . . . . . 10,850 11,500 12,000 12,562 13,006 United States . . . . . . . . . . . . . . . . . . . . . . . 1,000 . . . . . . . . . 8,100 8,612 9,001 9,184 8,958 Florida . . . . . . . . . . . . . . . . . . . . . . . . . . . 1,000 . . . . . . . . . 4,791 4,875 4,994 4,977 5,110 California . . . . . . . . . . . . . . . . . . . . . . . . . 1,000 . . . . . . . . . 1,095 1,301 1,241 1,334 1,436 New York . . . . . . . . . . . . . . . . . . . . . . . . . 1,000 . . . . . . . . . 547 382 512 537 524 Other U.S. ports . . . . . . . . . . . . . . . . . . . . 1,000 . . . . . . . . . 1,667 2,054 2,254 2,336 1,888 Canada . . . . . . . . . . . . . . . . . . . . . . . . . . . 1,000 . . . . . . . . . 454 455 423 477 427 San Juan . . . . . . . . . . . . . . . . . . . . . . . . . . 1,000 . . . . . . . . . 450 581 555 534 521 Rest of world . . . . . . . . . . . . . . . . . . . . . . . 1,000 . . . . . . . . . 1,846 1,852 2,021 2,367 3,100
United States expenditures of the North American cruise industry: 3, 4 . . . . Bil . dol . . . . . . . . 14 .70 16 .18 17 .64 18 .70 19 .07 U.S. purchases of the cruise lines . . . . . . Bil. dol. . . . . . . . . 10.70 11.76 12.89 13.74 14.40 Passenger and crew . . . . . . . . . . . . . . . . . Bil. dol. . . . . . . . . 2.88 3.23 3.48 3.63 3.40 Wages & taxes paid by cruise lines . . . . . Bil. dol. . . . . . . . . 1.12 1.19 1.27 1.33 1.27
1 Single beds. 2 Port of departure. 3 See details in the report for the sources of U.S. expenditures of the North American cruise industry. 4 Includes wages and salaries paid to U.S. employees of the cruise lines.
Source: Business Research & Economic Advisors (BREA), Exton, PA. The Contribution of the North American Cruise Industry to the U.S. Economy in 2008. Prepared for the Cruise Lines International Association, June 2009, <http://www.cruising.org>.
Table 1258. Gaming Revenue by Industry: 2000 to 2009[In millions of dollars (62,154 represents $62,154,000,000). Data shown are for gross revenue. Gross gambling revenue (GGR) is the amount wagered minus the winnings returned to players, a true measure of the economic value of gambling. GGR is the figure used to determine what an operation earns before taxes, salaries, and other expenses are paid]
Industry 2000 2003 2004 2005 2006 2007 2008 2009 Total 2 . . . . . . . . . . . . . . . . . . 62,154 73,036 78,589 84,433 90,931 1 92,272 1, 3 92,157 1, 3 89,262
Card rooms . . . . . . . . . . . . . . . . 949 979 989 1,025 1,104 3 1,180 3 1,282 3 1,232Commercial casinos . . . . . . . . . 26,455 1 28,669 1 30,595 1 31,775 1 34,113 3 34,407 1, 3 33,031 1, 3 31,379Charitable games and bingo . . . 2,466 2,331 2,336 3 2,338 3 2,237 3 2,220 3 2,131 3 2,067Legal bookmaking . . . . . . . . . . . 131 128 116 130 192 168 136 136Lotteries . . . . . . . . . . . . . . . . . . . 17,277 20,283 21,405 22,898 24,631 24,780 25,698 25,139Parimutuel wagering . . . . . . . . . 3,935 3,821 3,750 3,683 3,677 3 3,529 3 3,141 3 2,827
1 Amount includes deepwater cruise ships, curises-to-nowhere and noncasino devices. 2 Includes industry not shownseparately. 3 Data are estimated.
Source: Christiansen Capital Advisors, LLC. Prepared for the American Gaming Association (AGA). Industry Information, Fact Sheets, Gaming Revenue: Current-Year Data (copyright), <http://www.americangaming.org/Industry/factsheets/index.cfm> and <www.cca-i.com>.
Table 1260. Top States and Cities Visited by Overseas Travelers: 2000 to 2009[25,975 represents 25,975,000. Includes travelers for business and pleasure, international travelers in transit through the United States, and students. Excludes travel by international personnel and international businessmen employed in the United States. Starting with the 2006 data, the statistical policy for visitation estimates of international travelers to the United States has changed. For more information, go to <http://tinet.ita.doc.gov/outreachpages/2007_statistical_policy.html>. States and Cities are ranked by the latest overseas visitors data]
State and other areaOverseas visitors 1 (1,000)
CityOverseas visitors 1 (1,000)
2000 2005 2008 2009 2000 2005 2008 2009
Total overseas travelers 2, 3 . . 25,975 21,679 25,341 23,756 New York City, NY . . . . . . . . 5,714 5,810 8,211 7,792New York . . . . . . . . . . . . . . . . . . 5,922 6,092 8,413 8,006 Miami, FL . . . . . . . . . . . . . . . 2,935 2,081 2,585 2,661Florida . . . . . . . . . . . . . . . . . . . . 6,026 4,379 5,246 5,274 Los Angeles, CA . . . . . . . . . 3,533 2,580 2,788 2,518California . . . . . . . . . . . . . . . . . . 6,364 4,791 5,296 4,632 Orlando, FL . . . . . . . . . . . . . 3,013 2,016 2,433 2,399Nevada . . . . . . . . . . . . . . . . . . . 2,364 1,821 2,103 1,900 San Francisco, CA . . . . . . . . 2,831 2,124 2,610 2,233Hawaiian Islands . . . . . . . . . . . . 2,727 2,255 1,825 1,853 Las Vegas, NV . . . . . . . . . . . 2,260 1,778 2,027 1,853Massachusetts . . . . . . . . . . . . . . 1,429 867 1,267 1,259 Washington, DC (metro) . . . 1,481 1,106 1,470 1,544Illinois . . . . . . . . . . . . . . . . . . . . . 1,377 1,149 1,419 1,164 Oahu/Honolulu, HI . . . . . . . . 2,234 1,821 1,495 1,497Guam . . . . . . . . . . . . . . . . . . . . . 1,325 1,127 1,191 1,140 Boston, MA . . . . . . . . . . . . . 1,325 802 1,115 1,140New Jersey . . . . . . . . . . . . . . . . 909 997 1,039 926 Chicago, IL. . . . . . . . . . . . . . 1,351 1,084 1,368 1,117Texas . . . . . . . . . . . . . . . . . . . . . 1,169 954 1,090 903 San Diego, CA . . . . . . . . . . . 701 499 684 618Pennsylvania . . . . . . . . . . . . . . . 649 629 1,014 879 Philadelphia, PA . . . . . . . . . . 390 434 710 594Georgia . . . . . . . . . . . . . . . . . . . 805 650 634 689 Atlanta, GA . . . . . . . . . . . . . 701 564 532 570Arizona . . . . . . . . . . . . . . . . . . . 883 564 710 665 Houston, TX . . . . . . . . . . . . . 442 369 481 428Virginia . . . . . . . . . . . . . . . . . . . . 364 282 329 380 Flagstaff, AZ 4 . . . . . . . . . . . (B) (B) 431 428Washington . . . . . . . . . . . . . . . . 468 369 456 380 Tampa/St. Petersburg, FL . . 519 455 380 404Colorado . . . . . . . . . . . . . . . . . . 519 303 380 333 Seattle, WA . . . . . . . . . . . . . 416 347 405 356North Carolina . . . . . . . . . . . . . . 416 282 355 309 Anaheim-Santa Ana, CA . . . 494 390 355 309Ohio . . . . . . . . . . . . . . . . . . . . . . 390 369 304 309 Dallas-Plano-Irving, TX . . . . 494 347 380 285
1 Excludes Canada and Mexico. 2 A person is counted in each area visited, but only once in the total. 3 Includes other states and cities, not shown separately. 4 Data include Flagstaff, Grand Canyon, and Sedona grouped together.
Source: U.S. Department of Commerce, International Trade Administration, Office of Travel and Tourism Industries, and the Bureau of Economic Analysis (BEA), May 2010, <http://www.tinet.ita.doc.gov/outreachpages/inbound.general_information .inbound_overview.html>.

Arts, Recreation, and Travel 775U.S. Census Bureau, Statistical Abstract of the United States: 2011
Table 1262. Domestic Travel Expenditures by State: 2008[662,446 represents $662,446,000,000. Represents U.S. spending on domestic overnight trips and day trips of 50 miles or more, one way, away from home. Excludes spending by foreign visitors and by U.S. residents in U.S. territories and abroad]
State Total (mil. dol.)
Percent distribu-
tion RankState Total
(mil. dol.)
Percent distribu-
tion RankState Total
(mil. dol.)
Percent distribu-
tion Rank
U .S . total . . . 662,446 100 .0 (X) KS . . . . . 5,596 0.8 38 ND . . . . . 1,867 0.3 48KY . . . . . 7,527 1.1 30 OH . . . . . 15,796 2.4 12
AL . . . . . . . . . 7,628 1.2 29 LA . . . . . 9,326 1.4 24 OK . . . . . 6,136 0.9 33AK . . . . . . . . . 1,920 0.3 47 ME . . . . . 2,616 0.4 44 OR . . . . . 7,747 1.2 28AZ . . . . . . . . . 12,688 1.9 17 MD . . . . . 12,044 1.8 19 PA . . . . . 19,766 3.0 7AR . . . . . . . . . 5,652 0.9 37 MA . . . . . 13,540 2.0 15 RI . . . . . . 1,718 0.3 50CA . . . . . . . . . 83,015 12.5 1 MI . . . . . . 15,205 2.3 13 SC . . . . . 9,870 1.5 22CO . . . . . . . . . 13,509 2.0 16 MN . . . . . 10,353 1.6 21 SD . . . . . 2,253 0.3 46CT . . . . . . . . . 9,053 1.4 26 MS . . . . . 6,266 0.9 32 TN . . . . . 14,024 2.1 14DE . . . . . . . . . 1,417 0.2 51 MO . . . . . 12,144 1.8 18 TX . . . . . 46,347 7.0 3DC . . . . . . . . . 5,660 0.9 36 MT . . . . . 3,004 0.5 42 UT . . . . . 5,669 0.9 35FL . . . . . . . . . 52,313 7.9 2 NE . . . . . 3,934 0.6 39 VT . . . . . 1,727 0.3 49GA . . . . . . . . . 19,026 2.9 9 NV . . . . . 30,511 4.6 5 VA . . . . . 19,220 2.9 8HI . . . . . . . . . . 9,310 1.4 25 NH . . . . . 3,401 0.5 40 WA . . . . . 11,383 1.7 20ID . . . . . . . . . . 3,363 0.5 41 NJ . . . . . 18,433 2.8 10 WV . . . . . 2,496 0.4 45IL . . . . . . . . . . 28,385 4.3 6 NM . . . . . 5,879 0.9 34 WI . . . . . 9,379 1.4 23IN . . . . . . . . . . 8,954 1.4 27 NY . . . . . 39,467 6.0 4 WY . . . . . 2,636 0.4 43IA . . . . . . . . . . 6,407 1.0 31 NC . . . . . 16,865 2.5 11
X Not applicable.Source: U.S. Travel Association, Washington, DC, Impact of Travel on State Economies, 2008 (copyright). See also
<http://www.ustravel.org/index.html>.
Table 1261. Real Tourism Output: 2000 to 2008[In millions of dollars (546,908 represents 546,908,000,000)]
CommodityDirect output
(current dollars)Real output
(chained 2000 dollars)
2000 2005 2008 2000 2005 2008
Total . . . . . . . . . . . . . . . . . . . . . . . . . . . . . . . . . . . . . . . . . 546,908 660,004 767,043 546,908 590,822 603,487
Traveler accommodations . . . . . . . . . . . . . . . . . . . . . . . . . 97,041 115,142 136,681 97,041 100,081 109,119Food services and drinking places . . . . . . . . . . . . . . . . . . 83,683 110,599 128,573 83,683 96,194 100,108Domestic passenger air transportation services . . . . . . . . 71,026 63,669 62,931 71,026 72,305 60,361International passenger air transportation services . . . . . 26,651 34,983 49,171 26,651 27,513 31,790Passenger rail transportation services . . . . . . . . . . . . . . . 1,145 1,225 1,587 1,145 1,239 1,377Passenger water transportation services . . . . . . . . . . . . . 5,526 8,658 10,016 5,526 10,665 12,554Interurban bus transportation . . . . . . . . . . . . . . . . . . . . . . 1,537 1,917 1,919 1,537 1,613 1,403Interurban charter bus transportation . . . . . . . . . . . . . . . . 966 864 811 966 740 633Urban transit systems and other transportation services . . . . . . . . . . . . . . . . . . . . . . . . . . . . . . . . . . . . . . 2,993 3,581 4,689 2,993 3,023 3,573Taxi service . . . . . . . . . . . . . . . . . . . . . . . . . . . . . . . . . . . . 3,461 3,693 5,040 3,461 2,950 3,671Scenic and sightseeing transportation services . . . . . . . . 2,316 2,490 2,794 2,316 2,130 2,184Automotive rental . . . . . . . . . . . . . . . . . . . . . . . . . . . . . . . . 20,851 23,251 27,091 20,851 21,249 21,287Other vehicle rental . . . . . . . . . . . . . . . . . . . . . . . . . . . . . . 525 643 815 525 552 660Automotive repair services . . . . . . . . . . . . . . . . . . . . . . . . 11,014 11,277 12,306 11,014 9,761 9,360Parking lots and garages . . . . . . . . . . . . . . . . . . . . . . . . . . 1,315 2,045 2,011 1,315 1,652 1,424Highway tolls . . . . . . . . . . . . . . . . . . . . . . . . . . . . . . . . . . . 548 722 766 548 592 472Travel arrangement and reservation services . . . . . . . . . . 30,735 36,287 39,605 30,735 36,074 37,785Motion pictures and performing arts . . . . . . . . . . . . . . . . . 9,466 12,304 12,909 9,466 10,021 9,692Spectator sports . . . . . . . . . . . . . . . . . . . . . . . . . . . . . . . . 4,294 5,760 6,396 4,294 4,598 4,442Participant sports . . . . . . . . . . . . . . . . . . . . . . . . . . . . . . . . 9,954 11,253 12,960 9,954 10,032 10,795Gambling . . . . . . . . . . . . . . . . . . . . . . . . . . . . . . . . . . . . . . 21,760 32,628 34,061 21,760 28,860 27,337All other recreation and entertainment . . . . . . . . . . . . . . . 13,620 16,239 18,900 13,620 14,123 15,179Gasoline . . . . . . . . . . . . . . . . . . . . . . . . . . . . . . . . . . . . . . 38,430 57,474 79,670 38,430 37,885 37,001Nondurable PCE 1 commodities other than gasoline . . . . . 88,050 103,300 115,343 88,050 97,046 100,277
1 Personal consumption expenditures.Source: U.S. Bureau of Economic Analysis, “Industry Economic Accounts, U.S. Travel and Tourism Satellite Accounts for
2005–2008,” <http://www.bea.gov/industry/>.

776 Arts, Recreation, and TravelU.S. Census Bureau, Statistical Abstract of the United States: 2011
Table 1263. Travel Forecast Summary: 2007 to 2013[In billions of dollars (13,254 represents $13,254,000,000,000)]
Measurement Unit 2007 2008 2009 1 2010 1 2011 2 2012 2 2013 2
Real GDP . . . . . . . . . . . . . . . . . . . . . . Billions . . . . . . 13,254 13,312 12,993 13,408 13,851 14,308 14,737Unemployment rate . . . . . . . . . . . . . . . Percent . . . . . 4.6 5.8 9.3 9.7 9.1 8.0 6.9Consumer price index (CPI) 3 . . . . . . . Percent . . . . . 207.3 215.2 214.5 219.0 223.4 229.6 235.9Travel price index (TPI) 3 . . . . . . . . . . . Percent . . . . . 244.0 257.7 241.5 249.9 260.8 272.1 281.0Total travel expenditures in US . . . . . . Billions . . . . . . 738.0 772.5 704.4 748.3 806.9 862.7 902.4 U.S. residents . . . . . . . . . . . . . . . . . . Billions . . . . . . 641.3 662.4 610.2 647.9 697.1 740.2 771.7 International visitors 4 . . . . . . . . . . . . Billions . . . . . . 96.7 110.1 94.2 100.4 109.8 122.5 130.7
Total international visitors to the United States . . . . . . . . . . . . . . Millions . . . . . . 56.0 58.0 54.9 57.1 60.1 62.9 65.3Total domestic person trips 5 . . . . . . . . Millions . . . . . . 2,004.5 1,964.9 1,901.7 1,953.9 2,011.8 2,059.2 2,091.9
1 Projected. 2 Forecast. 3 1982 through 1984 = 100. 4 Excludes international visitors' spending on traveling to the U.S. on U.S. flag carriers, and other misc. transportation. 5 One person on one trip 50 miles or more, one way, away from home or including one or more nights away from home.
Source: U.S.Travel Association's Travel Forecast Model, Bureau of Labor Statistics, Department of Commerce, Bureau of Economic Analysis, Office of Travel and Tourism Industries. See <http://www.ustravel.org/index.html>.
Table 1264. Chain-Type Price Indexes for Direct Tourism Output: 2000 to 2009[Index numbers, 2000=100. See headnote, Table 1265. For explanation of chain-type price indexes, see text, Section 13]
Tourism goods and services group 2000 2001 2002 2003 2004 2005 2006 2007 2008 2009
Traveler accommodations . . . . . . . . . . 100.0 102.0 101.2 102.8 108.7 114.8 119.1 124.8 125.0 116.6Transportation . . . . . . . . . . . . . . . . . . . 100.0 97.8 95.1 98.9 102.7 109.8 117.4 121.5 131.8 119.1 Passenger air transportation . . . . . . . 100.0 95.8 90.3 93.2 92.2 96.6 102.8 104.6 114.8 104.2 All other transportation-related commodities . . . . . . . . . . . . . . . . . . 100.0 99.9 99.4 103.3 110.8 120.1 128.8 134.6 145.1 130.8Food services and drinking places . . . 100.0 103.2 106.0 108.2 111.5 115.0 118.6 122.9 128.4 132.9Recreation, entertainment, and shopping . . . . . . . . . . . . . . . . . . . . . 100.0 102.5 104.0 105.4 110.2 113.0 115.7 118.4 122.7 124.7 Recreation and entertainment . . . . . . 100.0 103.4 105.9 108.6 110.2 114.0 117.7 120.8 124.7 125.8 Shopping . . . . . . . . . . . . . . . . . . . . . . 100.0 101.8 102.6 103.1 104.9 106.5 108.4 110.7 115.1 117.5All tourism goods and services . . . . . . 100.0 100.6 100.4 102.8 106.4 111.5 116.5 120.5 126.6 121.7
Source: U.S. Department of Commerce, Bureau of Economic Analysis, Office of Travel and Tourism Industries, United States Travel and Tourism Satellite Accounts (TTSAs), <http://www.bea.gov/bea/dn2/home/tourism.htm>.
Table 1265. Tourism Sales by Commodity Group and Tourism Employment by Industry Group: 2006 to 2009[Sales in billions of dollars (710 represents $710,000,000,000). Employment in thousands (5,847 represents 5,847,000). Direct tourism-related sales comprise all output consumed directly by visitors (e.g., traveler accommodations, passenger air transportation, souvenirs). Direct tourism-related employment comprises all jobs where the workers are engaged in the production of direct tourism-related output (e.g., hotel staff, airline pilots, and souvenir sellers)]
Tourism commodity groupDirect tourism sales
(bil. dol.) Tourism industry groupDirect tourism employment
(1,000)
2006 2007 2008 2009 2006 2007 2008 2009
All commodities 1 . . . . . . . . . . 710 742 767 708 All industries . . . . . . . . . . . . . . 5,847 5,908 5,906 5,649Traveler accommodations . . . . . . 124 134 137 120 Traveler accommodations . . . . . . 1,363 1,376 1,376 1,297Transportation . . . . . . . . . . . . . . . 275 287 301 259 Transportation . . . . . . . . . . . . . . . 1,117 1,131 1,130 1,056 Passenger air transportation . . . 105 109 112 93 Air transportation services . . . . . 447 452 454 428 All other transportation-related commodities . . . . . . . . . . . . . . 170 179 190 166
All other transportation-related industries . . . . . . . . . . . . . . . . . 670 679 676 629
Food services and drinking places . . . . . . . . . . . . . . . . . . . . 118 123 128 129
Food and beverage services . . . . 1,908 1,940 1,944 1,899Recreation, entertainment, and shopping . . . . . . . . . . . . . . . . . . 1,199 1,198 1,195 1,151Recreation, entertainment, and
shopping . . . . . . . . . . . . . . . . . . 192 197 200 200 Recreation and entertainment . . 637 651 658 643 Recreation and entertainment . 82 85 85 85 Shopping . . . . . . . . . . . . . . . . . 562 547 536 508 Shopping . . . . . . . . . . . . . . . . . 110 112 115 115 All other industries . . . . . . . . . . . . 260 264 262 246
1 Commodities that are typically purchased by visitors from the producer: such as airline passenger fares, meals, or hotel services.
Source: U.S. Bureau of Economic Analysis, “Industry Economic Accounts, Satellite Industry Accounts, Travel and Tourism.” See <http://www.bea.gov/bea/dn2/home/tourism.htm>.

Arts, Recreation, and Travel 777U.S. Census Bureau, Statistical Abstract of the United States: 2011
Table 1268. Top 20 U.S. Gateways for Nonstop International Air Travel: 2007 and 2008[160,846 represents 160,846,000. International passengers are residents of any country traveling nonstop to and from the United States on U.S. and foreign carriers. The data cover all passengers arriving and departing from U.S. airports on nonstop commercial international flights with 60 seats or more]
Gateway airport
2007 1 2008
Percent change 2007–2008
Gateway airport
2007 1 2008
Percent change 2007– 2008
Total . . . . . . . . . . . . . . . . . . . . . . 160,846 160,379 –0 .3 Washington (Dulles), DC . . . . 5,822 6,011 3.2 Total, top 20 . . . . . . . . . . . . . . . 142,134 142,733 0 .4 Dallas-Ft. Worth, TX . . . . . . . 5,031 4,938 –1.9 Top 20, percentage of total . . . 88 .4 89 .0 0 .6 Detroit, MI . . . . . . . . . . . . . . . 3,830 3,800 –0.8
Philadelphia, PA . . . . . . . . . . . 3,611 3,724 3.1New York (JFK), NY . . . . . . . . . . . . 21,460 22,029 2.7 Boston, MA . . . . . . . . . . . . . . 3,808 3,523 –7.5Los Angeles, CA . . . . . . . . . . . . . . 16,869 16,164 –4.2 Honolulu, HI . . . . . . . . . . . . . . 3,858 3,414 –11.5Miami, FL . . . . . . . . . . . . . . . . . . . . 15,586 15,999 2.7 Fort Lauderdale, FL . . . . . . . . 2,883 3,073 6.6Chicago (O’Hare), IL . . . . . . . . . . . 11,539 11,106 –3.7 Seattle-Tacoma, WA . . . . . . . 2,547 2,787 9.4Newark, NJ . . . . . . . . . . . . . . . . . . 10,568 10,934 3.5 Orlando, FL . . . . . . . . . . . . . . 2,214 2,575 16.3Atlanta, GA . . . . . . . . . . . . . . . . . . 8,911 9,232 3.6 Guam Island, GU . . . . . . . . . . 2,777 2,564 –7.7San Francisco, CA . . . . . . . . . . . . . 8,601 8,331 –3.1 Minneapolis-St. Paul, MN . . . 2,515 2,560 1.8Houston (G. Bush), TX . . . . . . . . . . 7,476 7,673 2.6 Charlotte, NC . . . . . . . . . . . . . 2,110 2,297 8.9
1 Data have been revised.Source: U.S. Department of Transportation, Research and Innovative Technology Administration, Bureau of Transportation
Statistics, Office of Airline Information, T-100 Segment data, September 2009, <http://www.bts.gov/publications>.
Table 1266. International Travelers and Payments: 1990 to 2009[(47,880 represents $47,880,000,000). For coverage, see Table 1267. Some traveler data revised since originally issued]
Year
Travel and passenger fare (mil. dol.) U.S. net travel and
passenger receipts (mil. dol)
U.S. travelers to
international countries
(1,000)
International travelers
to the U.S. (1,000)
Payments by U.S. travelersReceipts from
international visitors
Total 1
Travel payments Total 1
Travel receipts
1990. . . . . . . . . . . 47,880 37,349 58,305 43,007 10,425 44,624 39,3631995. . . . . . . . . . . 59,579 44,916 82,304 63,395 22,725 51,285 43,4912000. . . . . . . . . . . 88,979 64,705 103,087 82,400 14,108 61,327 51,2382003. . . . . . . . . . . 78,436 57,447 80,250 64,359 1,814 56,250 41,2182004. . . . . . . . . . . 90,468 65,750 93,397 74,546 2,929 61,809 46,0862005. . . . . . . . . . . 95,119 68,970 102,769 81,799 7,650 63,503 49,2062006. . . . . . . . . . . 99,605 72,104 107,825 85,789 8,220 63,662 50,9772007. . . . . . . . . . . 104,768 76,331 122,542 96,896 17,774 64,024 55,9792008. . . . . . . . . . . 112,289 79,726 141,380 109,976 29,091 63,564 57,9372009 2 . . . . . . . . . 99,210 73,230 120,341 93,917 21,131 61,419 54,958
1 Includes passenger fares, not shown separately. 2 Preliminary estimates for the receipts payment figures, and U.S. travelers to international countries.
Source: U.S. Department of Commerce, International Trade Administration, Office of Travel and Tourism Industries, and the Bureau of Economic Analysis (BEA), June 2010, <http://www.tinet.ita.doc.gov>.
Table 1267. International Travel: 1990 to 2009[In thousands (44,619 represents 44,619,000). U.S. travelers cover residents of the United States, its territories and possessions. International travelers to the U.S. include travelers for business and pleasure, excludes travel by international personnel and international businessmen employed in the United States. Some traveler data revised since originally issued]
Item and area 1990 1995 2000 2005 2006 2006 2007 2008 2009
U .S . travelers to international countries 1, 2 . . . 44,619 51,285 61,327 63,503 63,642 63,662 64,024 63,564 61,419 Canada . . . . . . . . . . . . . . . . . . . . . . . . . . . . . . . 12,252 13,005 15,188 14,391 13,835 13,855 13,371 12,504 11,667 Mexico . . . . . . . . . . . . . . . . . . . . . . . . . . . . . . . . 16,377 19,221 19,285 20,325 19,659 19,659 19,425 20,271 19,452 Total overseas . . . . . . . . . . . . . . . . . . . . . . . . . . 15,990 19,059 26,853 28,787 30,148 30,148 31,228 30,789 30,300 Europe . . . . . . . . . . . . . . . . . . . . . . . . . . . . . . . 8,043 8,596 13,373 11,976 12,029 12,029 12,304 11,238 10,635
International travelers to the U .S . . . . . . . . . . . . 39,363 43,491 51,238 49,206 50,980 51,063 55,979 57,937 54,949 Canada . . . . . . . . . . . . . . . . . . . . . . . . . . . . . . . 17,263 14,663 14,667 14,862 15,995 15,992 17,760 18,910 17,964 Mexico . . . . . . . . . . . . . . . . . . . . . . . . . . . . . . . . 7,041 8,189 10,596 12,665 13,317 13,317 14,327 13,686 13,229 Total overseas . . . . . . . . . . . . . . . . . . . . . . . . . . 15,059 20,639 25,975 21,679 21,668 21,668 23,892 25,341 23,756 Europe . . . . . . . . . . . . . . . . . . . . . . . . . . . . . . . 6,659 8,793 11,597 10,313 10,136 10,136 11,406 12,783 11,550 Asia . . . . . . . . . . . . . . . . . . . . . . . . . . . . . . . . . 4,360 6,616 7,554 6,198 6,152 6,152 6,377 6,179 5,669 South America . . . . . . . . . . . . . . . . . . . . . . . . . 1,328 2,449 2,941 1,820 1,928 1,928 2,274 2,556 2,742 Caribbean . . . . . . . . . . . . . . . . . . . . . . . . . . . . 1,137 1,044 1,331 1,135 1,198 1,198 1,317 1,201 1,206 Oceania . . . . . . . . . . . . . . . . . . . . . . . . . . . . . . 662 588 731 737 756 756 834 852 872 Central America . . . . . . . . . . . . . . . . . . . . . . . . 412 509 822 696 694 694 786 776 758 Middle East . . . . . . . . . . . . . . . . . . . . . . . . . . . 365 454 702 527 553 553 620 681 666 Africa . . . . . . . . . . . . . . . . . . . . . . . . . . . . . . . . 137 186 295 252 253 253 278 315 294
1 A person is counted in each area visited but only once in the total. 2 2009 U.S. outbound totals are preliminary estimates.Source: U.S. Department of Commerce, International Trade Administration, Office of Travel and Tourism, June 2010,
<http://www.tinet.ita.doc.gov>

778 Arts, Recreation, and TravelU.S. Census Bureau, Statistical Abstract of the United States: 2011
Table 1269. Selected U.S.-Canadian and U.S.-Mexican Border Land—Passenger Gateways: 2009 [(26,919 represents 26,919,000)]
Item and gatewayEntering the U.S.
(1,000)Item and gateway
Entering the U.S. (1,000)
All U .S .-Canadian land gateways 1 All U .S .-Mexican land gateways 1
Personal vehicles . . . . . . . . . . . . . . . . . . . . . . . 26,919 Personal vehicles . . . . . . . . . . . . . . . . . . . . . . 70,305 Personal vehicle passengers . . . . . . . . . . . . . . 53,509 Personal vehicle passengers . . . . . . . . . . . . . 141,017 Buses . . . . . . . . . . . . . . . . . . . . . . . . . . . . . . . . 116 Buses . . . . . . . . . . . . . . . . . . . . . . . . . . . . . . . 228 Bus passengers . . . . . . . . . . . . . . . . . . . . . . . . 2,503 Bus passengers . . . . . . . . . . . . . . . . . . . . . . . 2,429 Train passengers . . . . . . . . . . . . . . . . . . . . . . . 218 Train passengers . . . . . . . . . . . . . . . . . . . . . . 4 Pedestrians . . . . . . . . . . . . . . . . . . . . . . . . . . . 380 Pedestrians . . . . . . . . . . . . . . . . . . . . . . . . . . 41,315 Selected top five gateways: Selected top five gateways: Personal vehicles Personal vehicles Buffalo-Niagara Falls, NY . . . . . . . . . . . . . . 5,292 El Paso, TX . . . . . . . . . . . . . . . . . . . . . . . . 13,355 Detroit, MI . . . . . . . . . . . . . . . . . . . . . . . . . . 4,082 San Ysidro, CA . . . . . . . . . . . . . . . . . . . . . 10,529 Blaine, WA . . . . . . . . . . . . . . . . . . . . . . . . . . 2,843 Hidalgo, TX . . . . . . . . . . . . . . . . . . . . . . . . 6,178 Port Huron, MI . . . . . . . . . . . . . . . . . . . . . . . 1,570 Brownsville, TX . . . . . . . . . . . . . . . . . . . . . 5,513 Massena, NY . . . . . . . . . . . . . . . . . . . . . . . . 1,040 Laredo, TX . . . . . . . . . . . . . . . . . . . . . . . . 5,452
Personal vehicle passengers Personal vehicle passengers Buffalo-Niagara Falls, NY . . . . . . . . . . . . . . 11,818 San Ysidro, CA . . . . . . . . . . . . . . . . . . . . . 23,935 Detroit, MI . . . . . . . . . . . . . . . . . . . . . . . . . . 7,271 El Paso, TX . . . . . . . . . . . . . . . . . . . . . . . . 18,377 Blaine, WA . . . . . . . . . . . . . . . . . . . . . . . . . . 5,966 Laredo, TX . . . . . . . . . . . . . . . . . . . . . . . . 12,729 Port Huron, MI . . . . . . . . . . . . . . . . . . . . . . . 3,320 Hidalgo, TX . . . . . . . . . . . . . . . . . . . . . . . . 12,074 Champlain-Rouses Point, NY . . . . . . . . . . . 2,198 Brownsville, TX . . . . . . . . . . . . . . . . . . . . . 11,157
Pedestrians Pedestrians Buffalo-Niagara Falls, NY . . . . . . . . . . . . . . 245 El Paso, TX . . . . . . . . . . . . . . . . . . . . . . . . 7,638 Sumas, WA . . . . . . . . . . . . . . . . . . . . . . . . . 27 San Ysidro, CA . . . . . . . . . . . . . . . . . . . . . 6,188 Calais, ME . . . . . . . . . . . . . . . . . . . . . . . . . 17 Nogales, AZ . . . . . . . . . . . . . . . . . . . . . . . 4,090 Detroit, MI . . . . . . . . . . . . . . . . . . . . . . . . . . 17 Calexico, CA . . . . . . . . . . . . . . . . . . . . . . . 4,038 International Falls, MN . . . . . . . . . . . . . . . . 15 Laredo, TX . . . . . . . . . . . . . . . . . . . . . . . . 3,905
1 Data reflect all personal vehicles and buses, passengers, and pedestrians entering the U.S.-Canadian border andU.S.-Mexican border, regardless of nationality.
Source: U.S. Department of Transportation, Bureau of Transportation Statistics, based on data from the Department of Homeland Security, U.S. Customs and Border Protection, Office of Field Operations, Operations Management Reporting system. See also <http://www.transtats.bts.gov/BorderCrossing.aspx/>.
Table 1270. Foreign Visitors for Pleasure Admitted by Country of Citizenship: 2000 to 2008[In thousands (30,511 represents 30,511,000). For years ending September 30. Represents non-U.S. citizens (also known as nonimmigrants) admitted to the country for a temporary period of time]
Country 2000 1 2005 2007 2008 Country 2000 1 2005 2007 2008 All countries 2 . . . . . . 30,511 23,815 27,486 29,442 Thailand . . . . . . . . . . . . . . 76 37 46 48
Turkey . . . . . . . . . . . . . . . . 93 57 64 71Europe 3 . . . . . . . . . . . . . 11,806 10,016 10,703 12,558 United Arab Emirates . . . . 36 3 4 5 Austria . . . . . . . . . . . . . 182 116 124 154 Africa 3 . . . . . . . . . . . . . . . . 327 212 228 253 Belgium . . . . . . . . . . . . 254 154 175 231 Egypt . . . . . . . . . . . . . . . . 44 19 24 27 Czech Republic . . . . . . 44 26 30 36 Nigeria . . . . . . . . . . . . . . . 27 40 41 54 Denmark . . . . . . . . . . . 150 153 191 236 South Africa . . . . . . . . . . . 114 64 67 65 Finland . . . . . . . . . . . . . 95 76 78 100 Oceania 3 . . . . . . . . . . . . . . 748 723 823 878 France . . . . . . . . . . . . . 1,113 1,007 1,073 1,345 Australia . . . . . . . . . . . . . . 535 527 623 672 Germany . . . . . . . . . . . 1,925 1,248 1,315 1,579 New Zealand . . . . . . . . . . 170 184 188 195 Greece . . . . . . . . . . . . . 60 40 42 52 North America 3, 5 . . . . . . . . 6,501 5,546 8,071 7,867 Hungary . . . . . . . . . . . . 58 30 32 34 Canada . . . . . . . . . . . . . . . 277 23 36 43 Iceland . . . . . . . . . . . . . 27 34 44 49 Mexico . . . . . . . . . . . . . . . 3,972 4,070 6,326 6,112 Ireland . . . . . . . . . . . . . 325 398 501 585 Caribbean . . . . . . . . . . . . . 1,404 876 1,081 1,049 Italy . . . . . . . . . . . . . . . 626 636 700 884 Bahamas, The . . . . . . . . 24 257 334 302 Netherlands . . . . . . . . . 559 483 515 638 Dominican Republic . . . . 195 189 228 207 Norway. . . . . . . . . . . . . 144 117 143 184 Haiti . . . . . . . . . . . . . . . . 72 65 82 93 Poland . . . . . . . . . . . . . 116 119 121 125 Jamaica . . . . . . . . . . . . . 240 152 205 200 Portugal . . . . . . . . . . . . 86 81 98 114 Trinidad and Tobago . . . . 133 106 122 128 Russia . . . . . . . . . . . . . 74 53 72 94 Central America . . . . . . . . 792 578 628 663 Spain . . . . . . . . . . . . . . 370 402 533 699 Costa Rica . . . . . . . . . . . 172 109 122 138 Sweden . . . . . . . . . . . . 321 249 282 356 El Salvador . . . . . . . . . . . 175 147 141 129 Switzerland . . . . . . . . . 400 207 232 267 Guatemala . . . . . . . . . . . 177 135 148 161 United Kingdom . . . . . . 4,671 4,232 4,211 4,568 Honduras . . . . . . . . . . . . 87 75 90 101Asia 3 . . . . . . . . . . . . . . . 7,853 5,688 5,745 5,693 Nicaragua . . . . . . . . . . . . 47 33 37 40 China 4 . . . . . . . . . . . . . 656 221 278 319 Panama . . . . . . . . . . . . . 106 64 72 77 India . . . . . . . . . . . . . . . 253 247 379 421 South America 3 . . . . . . . . . 2,867 1,498 1,856 2,114 Indonesia . . . . . . . . . . . 62 42 45 45 Argentina . . . . . . . . . . . . . 515 145 214 261 Israel . . . . . . . . . . . . . . 319 220 241 254 Bolivia . . . . . . . . . . . . . . . . 48 18 23 25 Japan . . . . . . . . . . . . . . 4,946 3,758 3,446 3,266 Brazil . . . . . . . . . . . . . . . . . 706 385 491 600 Korea, South . . . . . . . . 606 528 625 600 Chile . . . . . . . . . . . . . . . . . 194 82 98 106 Malaysia . . . . . . . . . . . 64 32 34 37 Colombia . . . . . . . . . . . . . 411 282 353 379 Pakistan . . . . . . . . . . . . 47 34 32 35 Ecuador . . . . . . . . . . . . . . 122 119 137 132 Philippines . . . . . . . . . . 163 144 156 170 Peru . . . . . . . . . . . . . . . . . 190 142 135 148 Saudi Arabia . . . . . . . . 67 10 13 19 Uruguay . . . . . . . . . . . . . . 66 24 27 28 Singapore . . . . . . . . . . 131 57 64 77 Venezuela . . . . . . . . . . . . . 570 270 348 404
1 Due to the temporary expiration of the Visa Waiver Program from May through October 2000, data for business and pleasure not available separately for 2000 and 2001. 2 Total includes unknown visitors by country of citizenship. 3 Total includes other countries, not shown separately. 4 See Table 1331, footnote 4. 5 The majority of short-term admissions from Canada and Mexico are excluded.
Source: U.S. Dept. of Homeland Security, Office of Immigration Statistics, 2008 Yearbook of Immigration Statistics. See also <http://www.dhs.gov/ximgtn/statistics/publications/yearbook.shtm>.