section 3 chapter 2 - ohio epa homeepa.ohio.gov/portals/27/atu/section3chapter2.pdf · section 3,...
TRANSCRIPT
Section 3, Chapter 2 RESPIRATORY ILLNESS AND AIR
QUALITY
The monitoring data in this report was gathered to assess levels of air pollutants in the ambient environment. When examining health effects associated with environmental contaminants, it is common for researchers to argue that the presence of a pollutant is indicative of adverse health effects. In other words, if contaminants are present, then health effects are inferred. However, a more rational approach to linking environmental contaminants with adverse health effects is to look for signs of illness that can be statistically associated with levels of pollution. This chapter summarizes the statistical relationship between levels of air pollution and respiratory illness. OUTCOME MEASURES
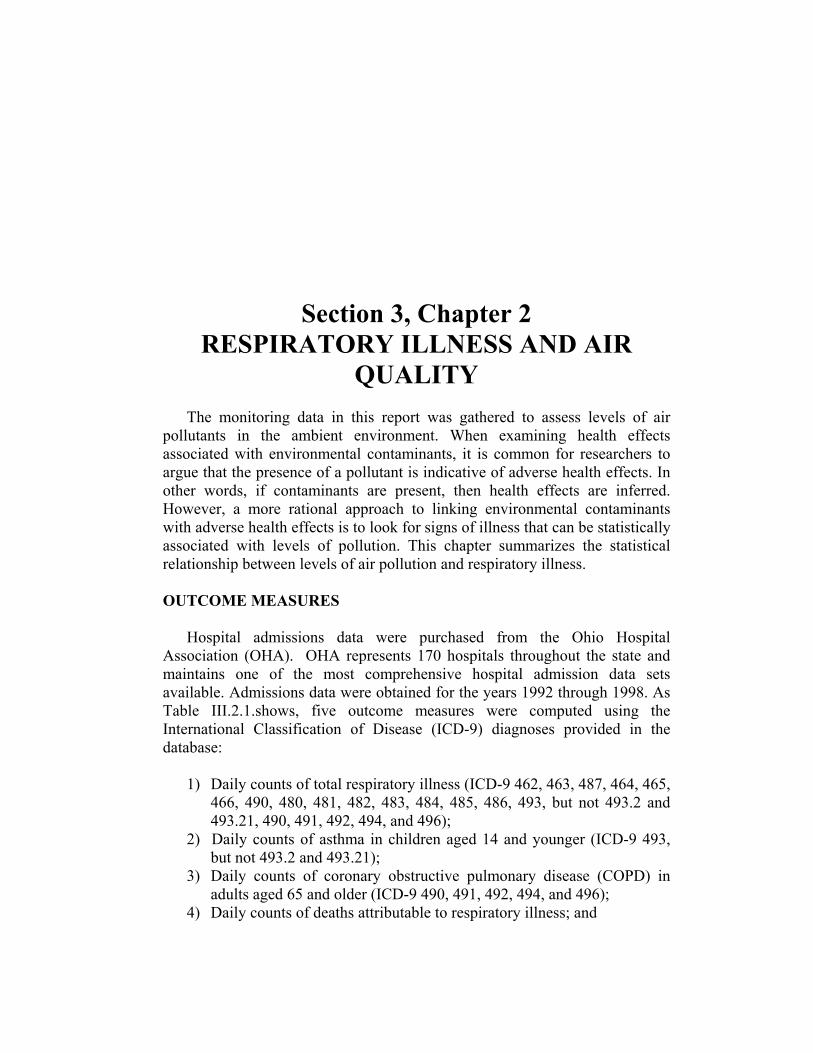
Hospital admissions data were purchased from the Ohio Hospital Association (OHA). OHA represents 170 hospitals throughout the state and maintains one of the most comprehensive hospital admission data sets available. Admissions data were obtained for the years 1992 through 1998. As Table III.2.1.shows, five outcome measures were computed using the International Classification of Disease (ICD-9) diagnoses provided in the database:
1) Daily counts of total respiratory illness (ICD-9 462, 463, 487, 464, 465,
466, 490, 480, 481, 482, 483, 484, 485, 486, 493, but not 493.2 and 493.21, 490, 491, 492, 494, and 496);
2) Daily counts of asthma in children aged 14 and younger (ICD-9 493, but not 493.2 and 493.21);
3) Daily counts of coronary obstructive pulmonary disease (COPD) in adults aged 65 and older (ICD-9 490, 491, 492, 494, and 496);
4) Daily counts of deaths attributable to respiratory illness; and
230 Respiratory Illness
5) Daily counts of non-respiratory illnesses (ICD-9 365, 540, 590, 531, and 532), served as a control for the other measures.
Table III.2.1. Principal Diagnosis codes (ICD-9) Used in this Study
Illness category ICD-9 Code
Respiratory
Upper respiratory
Acute infections
Pneumonias
COPD
Asthma
462, 463, 487
464-466
480-486
490-492, 496
493
Non- respiratory:
Glaucoma
Acute Apendicitis
Renal Infections
Stomach and Duodenum
365
540
590
531, 532
Eight cities were the focus of this study: Cincinnati, Columbus, Dayton,
Toledo, Cleveland, Steubenville, Youngstown and Akron. For each city, daily hospital admissions for each of the outcome measures were tallied for all patients who lived within 20 miles of a central ozone monitor within the city. The distance a patient lived from the ozone monitoring site was determined by the zip code of the patient’s home address.
Hospital admissions data in the state of Ohio may include as many as nine different diagnoses. Counts of deaths attributable to respiratory illness included all patients who had received a diagnosis of respiratory illness upon admission to the hospital, whether or not respiratory illness was the primary diagnosis. For the other outcome measures, counts included only those patients whose primary diagnosis upon admission to the hospital was the appropriate one.
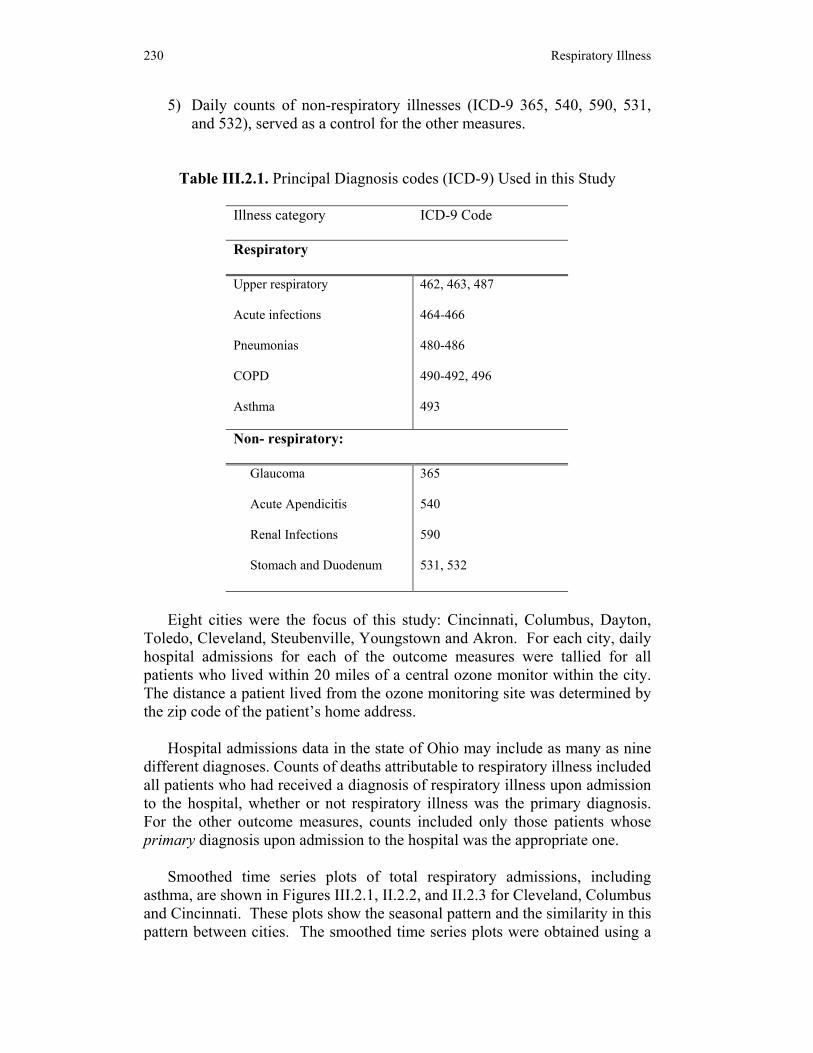
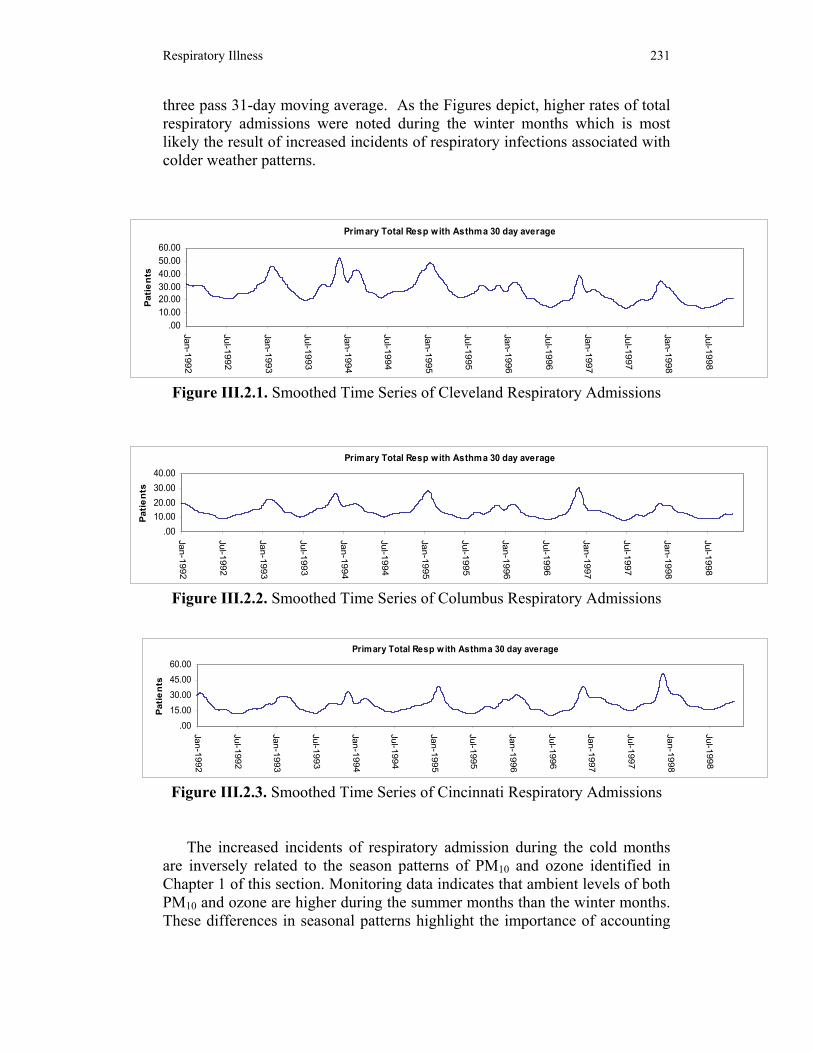
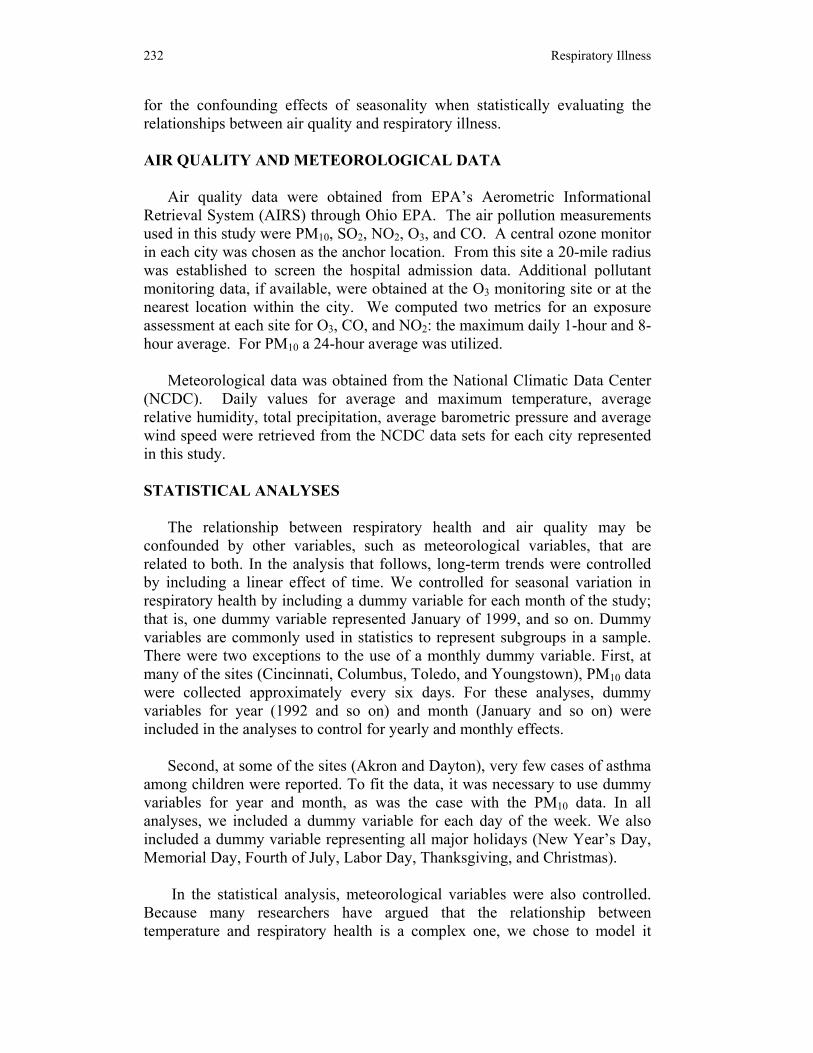
Smoothed time series plots of total respiratory admissions, including asthma, are shown in Figures III.2.1, II.2.2, and II.2.3 for Cleveland, Columbus and Cincinnati. These plots show the seasonal pattern and the similarity in this pattern between cities. The smoothed time series plots were obtained using a
Respiratory Illness 231
three pass 31-day moving average. As the Figures depict, higher rates of total respiratory admissions were noted during the winter months which is most likely the result of increased incidents of respiratory infections associated with colder weather patterns.
Figure III.2.1. Smoothed Time Series of Cleveland Respiratory Admissions
Figure III.2.2. Smoothed Time Series of Columbus Respiratory Admissions
Figure III.2.3. Smoothed Time Series of Cincinnati Respiratory Admissions
The increased incidents of respiratory admission during the cold months
are inversely related to the season patterns of PM10 and ozone identified in Chapter 1 of this section. Monitoring data indicates that ambient levels of both PM10 and ozone are higher during the summer months than the winter months. These differences in seasonal patterns highlight the importance of accounting
Primary Total Resp with Asthma 30 day average
.0010.0020.0030.0040.00
Jan-1992
Jul-1 992
Jan- 1993
Jul-199 3
Jan- 1994
Jul-1994
Jan-19 95
Jul- 1995
Ja n-199 6
Jul- 1996
Jan- 1997
Jul-1 997
Jan- 1998
Jul-199 8
Patie
nts
Primary Total Resp with Asthma 30 day average
.0010.0020.0030.0040.0050.0060.00
Jan-1992
Jul- 1992
Jan- 1993
Jul- 1993
Ja n-199 4
Jul-1994
Jan- 1995
Ju l- 1995
Jan-1 996
Jul-1 996
Jan -1997
Jul- 1997
Jan-1 998
Jul- 1998
Patie
nts
Primary Total Resp w ith Asthma 30 day average
.0015.0030.0045.0060.00
Jan-1992
Jul- 1992
Jan-1993
Jul- 1993
Jan- 1994
Jul-199 4
Jan- 1995
Jul-1995
Jan-19 96
Jul- 1996
Jan-1997
Jul- 1997
Jan -1998
Jul-1 998
Patie
nts
232 Respiratory Illness
for the confounding effects of seasonality when statistically evaluating the relationships between air quality and respiratory illness. AIR QUALITY AND METEOROLOGICAL DATA
Air quality data were obtained from EPA’s Aerometric Informational Retrieval System (AIRS) through Ohio EPA. The air pollution measurements used in this study were PM10, SO2, NO2, O3, and CO. A central ozone monitor in each city was chosen as the anchor location. From this site a 20-mile radius was established to screen the hospital admission data. Additional pollutant monitoring data, if available, were obtained at the O3 monitoring site or at the nearest location within the city. We computed two metrics for an exposure assessment at each site for O3, CO, and NO2: the maximum daily 1-hour and 8-hour average. For PM10 a 24-hour average was utilized.
Meteorological data was obtained from the National Climatic Data Center (NCDC). Daily values for average and maximum temperature, average relative humidity, total precipitation, average barometric pressure and average wind speed were retrieved from the NCDC data sets for each city represented in this study. STATISTICAL ANALYSES
The relationship between respiratory health and air quality may be confounded by other variables, such as meteorological variables, that are related to both. In the analysis that follows, long-term trends were controlled by including a linear effect of time. We controlled for seasonal variation in respiratory health by including a dummy variable for each month of the study; that is, one dummy variable represented January of 1999, and so on. Dummy variables are commonly used in statistics to represent subgroups in a sample. There were two exceptions to the use of a monthly dummy variable. First, at many of the sites (Cincinnati, Columbus, Toledo, and Youngstown), PM10 data were collected approximately every six days. For these analyses, dummy variables for year (1992 and so on) and month (January and so on) were included in the analyses to control for yearly and monthly effects.
Second, at some of the sites (Akron and Dayton), very few cases of asthma among children were reported. To fit the data, it was necessary to use dummy variables for year and month, as was the case with the PM10 data. In all analyses, we included a dummy variable for each day of the week. We also included a dummy variable representing all major holidays (New Year’s Day, Memorial Day, Fourth of July, Labor Day, Thanksgiving, and Christmas).
In the statistical analysis, meteorological variables were also controlled.
Because many researchers have argued that the relationship between temperature and respiratory health is a complex one, we chose to model it
Respiratory Illness 233
using linear, quadratic, and cubic effects. Because ozone is only collected during warm months, for analyses involving ozone, we included only a linear effect for temperature. In all analyses, we also included linear effects for average wind speed, average relative humidity, average barometric pressure, and the occurrence of precipitation.
In any analysis of time series data, the possibility that the residuals exhibit
autocorrelation must be considered. Preliminary analyses were conducted with only the seasonal and weather variables in the models. Analyses of the residuals indicated the presence of autocorrelation. A first-order autocorrelation structure was as effective as any of the more complex structures examined for modeling the autocorrelation present in the data.
Separate analyses were conducted for each pollutant. Analyses were also
conducted for each pollutant lagged one, two, and three days. Because ozone is essentially nonexistent during the winter—indeed, it is usually only collected during warm months—we only used data collected for May, June, July, August, and September in analyses involving ozone.
We used Poisson regression models based on the generalized estimating equations approach developed by Liang and Zeger1,2 with a first-order autoregressive structure. For analyses of the PM10 data collected at the Cincinnati, Columbus, Toledo, and Youngstown sites, an independent error term was assumed. RESULTS
Due to the amount of data generated in this component of the research, appendices are used to display the data. Descriptive statistics for the meteorological, air pollution, and respiratory measures, respectively, at the study sites can be found in Appendix E. Correlation matrices for the three sets of variables are also found in Appendix E.
Akron
Table III.2.1. summarizes significant correlations between air pollutants and health effects in Akron. A significant positive zero-order correlation was obtained between daily counts of hospital admissions for respiratory illness and PM10, while significant negative zero-order correlations were obtained between daily counts of hospital admissions for respiratory illness and O3 and PM10. After controlling for seasonality and weather conditions, none of the air pollutants was positively related to daily counts of hospital admissions for respiratory illness.
234 Respiratory Illness
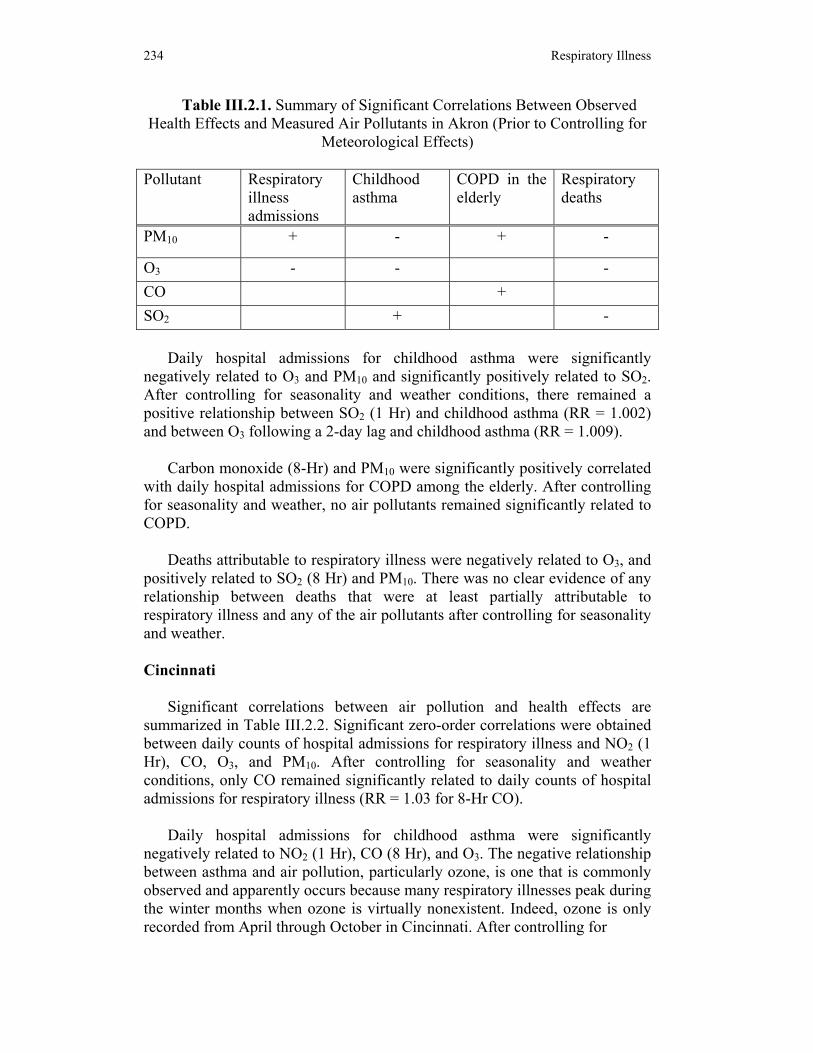
Table III.2.1. Summary of Significant Correlations Between Observed Health Effects and Measured Air Pollutants in Akron (Prior to Controlling for
Meteorological Effects)
Pollutant Respiratory illness admissions
Childhood asthma
COPD in the elderly
Respiratory deaths
PM10 + - + -
O3 - - - CO + SO2 + -
Daily hospital admissions for childhood asthma were significantly
negatively related to O3 and PM10 and significantly positively related to SO2. After controlling for seasonality and weather conditions, there remained a positive relationship between SO2 (1 Hr) and childhood asthma (RR = 1.002) and between O3 following a 2-day lag and childhood asthma (RR = 1.009).
Carbon monoxide (8-Hr) and PM10 were significantly positively correlated with daily hospital admissions for COPD among the elderly. After controlling for seasonality and weather, no air pollutants remained significantly related to COPD.
Deaths attributable to respiratory illness were negatively related to O3, and
positively related to SO2 (8 Hr) and PM10. There was no clear evidence of any relationship between deaths that were at least partially attributable to respiratory illness and any of the air pollutants after controlling for seasonality and weather. Cincinnati
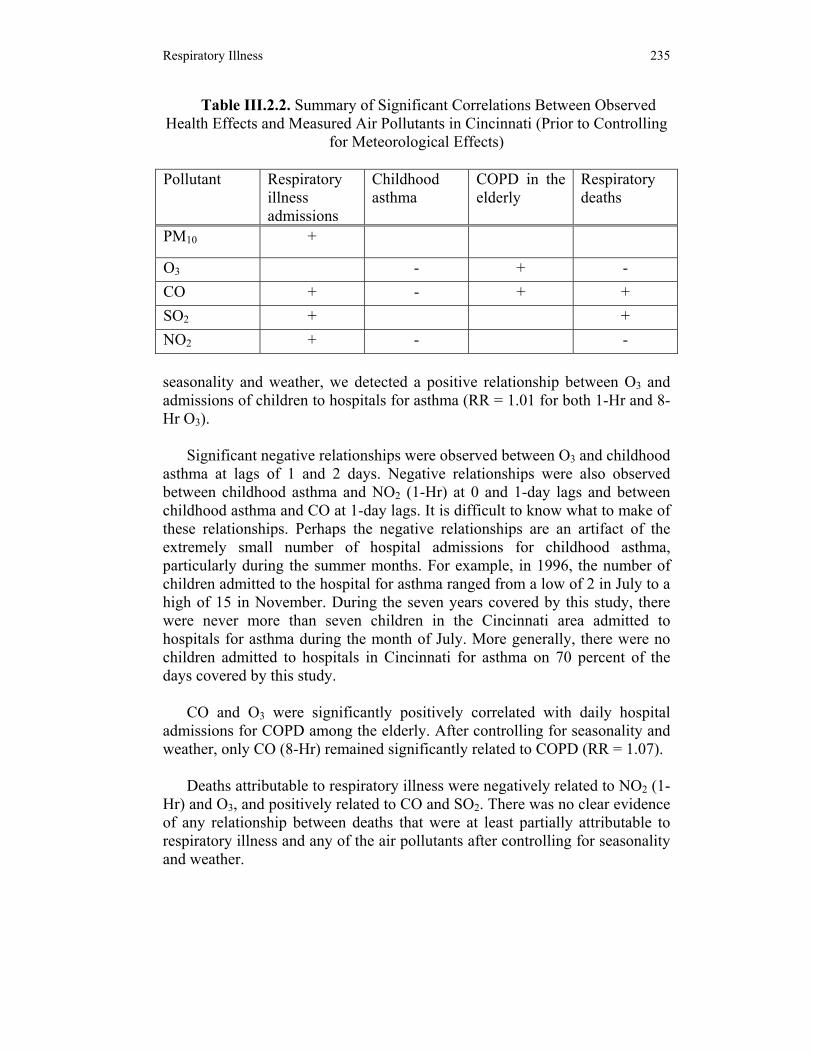
Significant correlations between air pollution and health effects are summarized in Table III.2.2. Significant zero-order correlations were obtained between daily counts of hospital admissions for respiratory illness and NO2 (1 Hr), CO, O3, and PM10. After controlling for seasonality and weather conditions, only CO remained significantly related to daily counts of hospital admissions for respiratory illness (RR = 1.03 for 8-Hr CO).
Daily hospital admissions for childhood asthma were significantly
negatively related to NO2 (1 Hr), CO (8 Hr), and O3. The negative relationship between asthma and air pollution, particularly ozone, is one that is commonly observed and apparently occurs because many respiratory illnesses peak during the winter months when ozone is virtually nonexistent. Indeed, ozone is only recorded from April through October in Cincinnati. After controlling for
Respiratory Illness 235
Table III.2.2. Summary of Significant Correlations Between Observed Health Effects and Measured Air Pollutants in Cincinnati (Prior to Controlling
for Meteorological Effects)
Pollutant Respiratory illness admissions
Childhood asthma
COPD in the elderly
Respiratory deaths
PM10 +
O3 - + - CO + - + + SO2 + + NO2 + - -
seasonality and weather, we detected a positive relationship between O3 and admissions of children to hospitals for asthma (RR = 1.01 for both 1-Hr and 8- Hr O3).
Significant negative relationships were observed between O3 and childhood
asthma at lags of 1 and 2 days. Negative relationships were also observed between childhood asthma and NO2 (1-Hr) at 0 and 1-day lags and between childhood asthma and CO at 1-day lags. It is difficult to know what to make of these relationships. Perhaps the negative relationships are an artifact of the extremely small number of hospital admissions for childhood asthma, particularly during the summer months. For example, in 1996, the number of children admitted to the hospital for asthma ranged from a low of 2 in July to a high of 15 in November. During the seven years covered by this study, there were never more than seven children in the Cincinnati area admitted to hospitals for asthma during the month of July. More generally, there were no children admitted to hospitals in Cincinnati for asthma on 70 percent of the days covered by this study.
CO and O3 were significantly positively correlated with daily hospital
admissions for COPD among the elderly. After controlling for seasonality and weather, only CO (8-Hr) remained significantly related to COPD (RR = 1.07).
Deaths attributable to respiratory illness were negatively related to NO2 (1-
Hr) and O3, and positively related to CO and SO2. There was no clear evidence of any relationship between deaths that were at least partially attributable to respiratory illness and any of the air pollutants after controlling for seasonality and weather.
236 Respiratory Illness
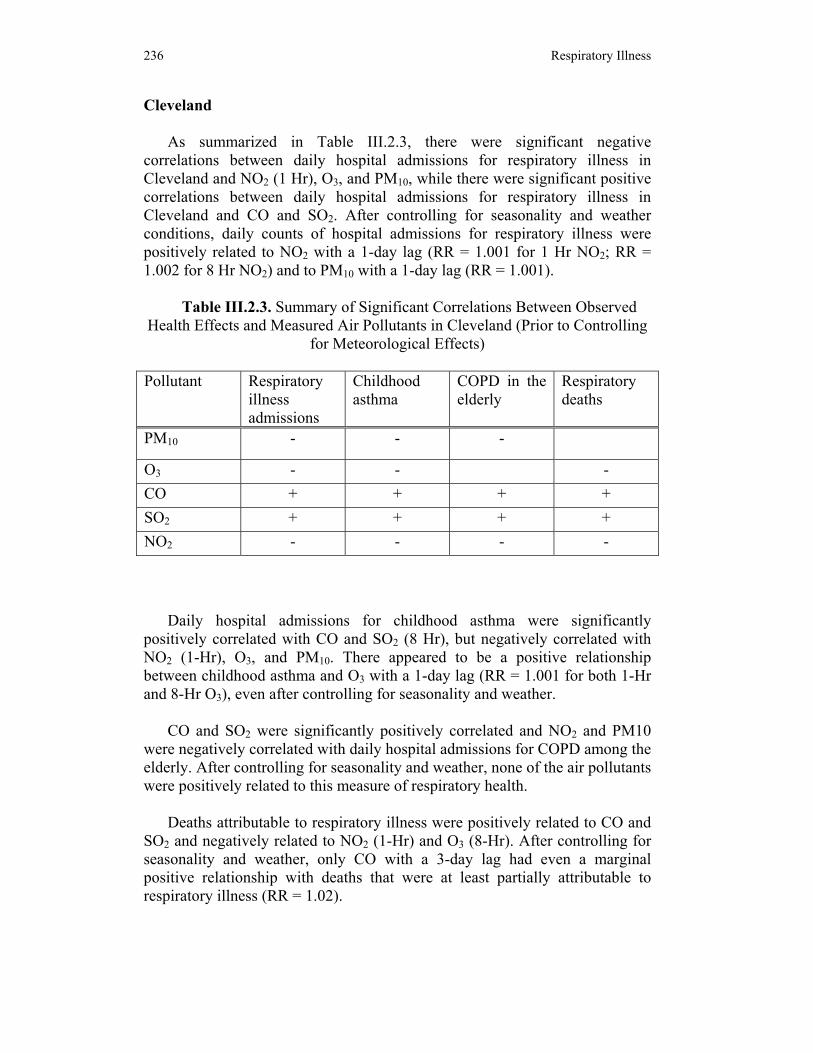
Cleveland
As summarized in Table III.2.3, there were significant negative correlations between daily hospital admissions for respiratory illness in Cleveland and NO2 (1 Hr), O3, and PM10, while there were significant positive correlations between daily hospital admissions for respiratory illness in Cleveland and CO and SO2. After controlling for seasonality and weather conditions, daily counts of hospital admissions for respiratory illness were positively related to NO2 with a 1-day lag (RR = 1.001 for 1 Hr NO2; RR = 1.002 for 8 Hr NO2) and to PM10 with a 1-day lag (RR = 1.001).
Table III.2.3. Summary of Significant Correlations Between Observed
Health Effects and Measured Air Pollutants in Cleveland (Prior to Controlling for Meteorological Effects)
Pollutant Respiratory
illness admissions
Childhood asthma
COPD in the elderly
Respiratory deaths
PM10 - - -
O3 - - - CO + + + + SO2 + + + + NO2 - - - -
Daily hospital admissions for childhood asthma were significantly
positively correlated with CO and SO2 (8 Hr), but negatively correlated with NO2 (1-Hr), O3, and PM10. There appeared to be a positive relationship between childhood asthma and O3 with a 1-day lag (RR = 1.001 for both 1-Hr and 8-Hr O3), even after controlling for seasonality and weather.
CO and SO2 were significantly positively correlated and NO2 and PM10
were negatively correlated with daily hospital admissions for COPD among the elderly. After controlling for seasonality and weather, none of the air pollutants were positively related to this measure of respiratory health.
Deaths attributable to respiratory illness were positively related to CO and
SO2 and negatively related to NO2 (1-Hr) and O3 (8-Hr). After controlling for seasonality and weather, only CO with a 3-day lag had even a marginal positive relationship with deaths that were at least partially attributable to respiratory illness (RR = 1.02).
Respiratory Illness 237
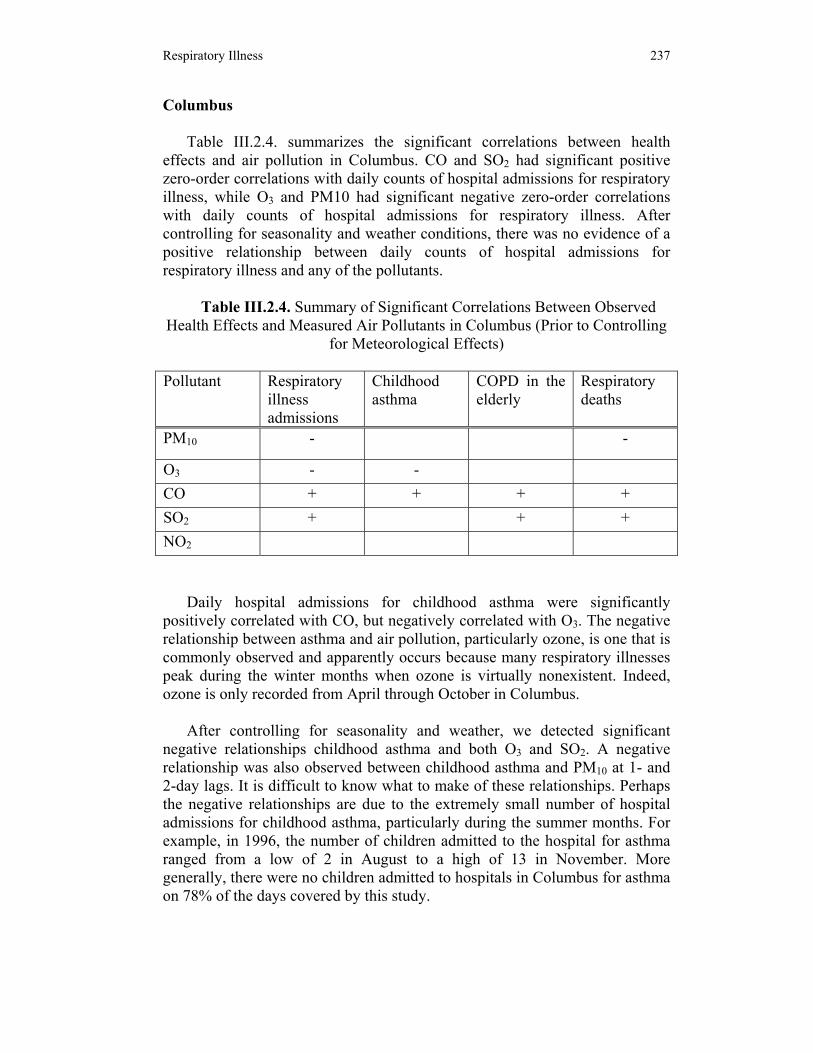
Columbus
Table III.2.4. summarizes the significant correlations between health effects and air pollution in Columbus. CO and SO2 had significant positive zero-order correlations with daily counts of hospital admissions for respiratory illness, while O3 and PM10 had significant negative zero-order correlations with daily counts of hospital admissions for respiratory illness. After controlling for seasonality and weather conditions, there was no evidence of a positive relationship between daily counts of hospital admissions for respiratory illness and any of the pollutants.
Table III.2.4. Summary of Significant Correlations Between Observed
Health Effects and Measured Air Pollutants in Columbus (Prior to Controlling for Meteorological Effects)
Pollutant Respiratory
illness admissions
Childhood asthma
COPD in the elderly
Respiratory deaths
PM10 - -
O3 - - CO + + + + SO2 + + + NO2
Daily hospital admissions for childhood asthma were significantly
positively correlated with CO, but negatively correlated with O3. The negative relationship between asthma and air pollution, particularly ozone, is one that is commonly observed and apparently occurs because many respiratory illnesses peak during the winter months when ozone is virtually nonexistent. Indeed, ozone is only recorded from April through October in Columbus.
After controlling for seasonality and weather, we detected significant
negative relationships childhood asthma and both O3 and SO2. A negative relationship was also observed between childhood asthma and PM10 at 1- and 2-day lags. It is difficult to know what to make of these relationships. Perhaps the negative relationships are due to the extremely small number of hospital admissions for childhood asthma, particularly during the summer months. For example, in 1996, the number of children admitted to the hospital for asthma ranged from a low of 2 in August to a high of 13 in November. More generally, there were no children admitted to hospitals in Columbus for asthma on 78% of the days covered by this study.
238 Respiratory Illness
CO and SO2 were significantly positively correlated with daily hospital admissions for COPD among the elderly. After controlling for seasonality and weather, CO (8 Hr) with a lag of 3 days (RR = 1.10) and SO2 with a lag of 3 days (RR = 1.002 for 1 Hr SO2; RR = 1.005 for 8 Hr SO2) remained significantly positively related to COPD.
Deaths attributable to respiratory illness were positively related to CO and
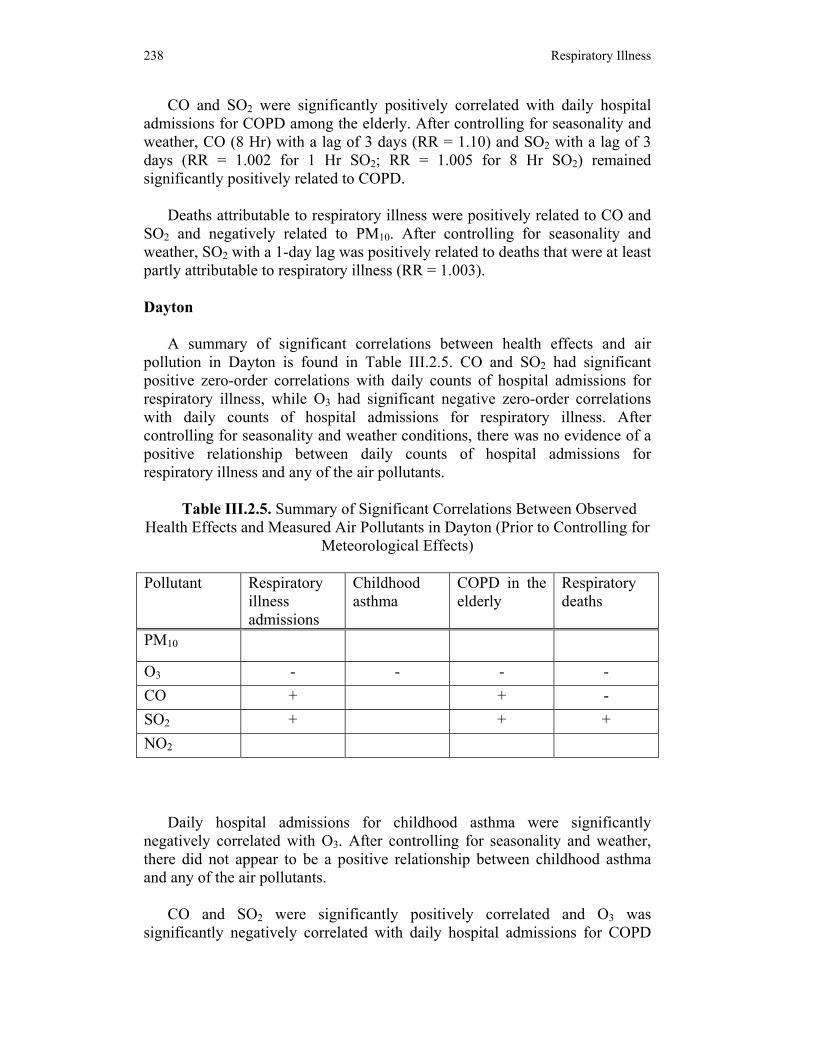
SO2 and negatively related to PM10. After controlling for seasonality and weather, SO2 with a 1-day lag was positively related to deaths that were at least partly attributable to respiratory illness (RR = 1.003). Dayton
A summary of significant correlations between health effects and air pollution in Dayton is found in Table III.2.5. CO and SO2 had significant positive zero-order correlations with daily counts of hospital admissions for respiratory illness, while O3 had significant negative zero-order correlations with daily counts of hospital admissions for respiratory illness. After controlling for seasonality and weather conditions, there was no evidence of a positive relationship between daily counts of hospital admissions for respiratory illness and any of the air pollutants.
Table III.2.5. Summary of Significant Correlations Between Observed
Health Effects and Measured Air Pollutants in Dayton (Prior to Controlling for Meteorological Effects)
Pollutant Respiratory
illness admissions
Childhood asthma
COPD in the elderly
Respiratory deaths
PM10
O3 - - - - CO + + - SO2 + + + NO2
Daily hospital admissions for childhood asthma were significantly
negatively correlated with O3. After controlling for seasonality and weather, there did not appear to be a positive relationship between childhood asthma and any of the air pollutants.
CO and SO2 were significantly positively correlated and O3 was
significantly negatively correlated with daily hospital admissions for COPD

Respiratory Illness 239
among the elderly. After controlling for seasonality and weather, O3 (8 Hr) with a 1-day lag (RR = 1.10) had a significant positive relationship with COPD (RR = 1.005 for both 1-Hr and 8-Hr O3).
Deaths attributable to respiratory illness were positively related to SO2 and negatively related to CO and O3. After controlling for seasonality and weather, there did not appear to be a positive relationship between deaths due to respiratory illness and any of the air pollutants. Steubenville
Table III.2.6. is a summary of significant correlations between health effects and air pollution in Steubenville. NO2, CO, and SO2 (8-Hr) had significant positive zero-order correlations with daily counts of hospital admissions for respiratory illness, while O3 had significant negative zero-order correlations with daily counts of hospital admissions for respiratory illness. After controlling for seasonality and weather conditions, there were positive relationships between hospital admissions for respiratory illness and NO2 (RR = 1.004 for 1-Hr NO2; RR = 1.005 for 8-Hr NO2), CO (8 Hr) (RR = 1.027), and O3 with a 1-day lag (RR = 1.003 for both 1-Hr and 8-Hr O3).
Table III.2.6. Summary of Significant Correlations Between Observed Health Effects and Measured Air Pollutants in Steubenville (Prior to
Controlling for Meteorological Effects)
Pollutant Respiratory illness admissions
Childhood asthma
COPD in the elderly
Respiratory deaths
PM10
O3 - - - CO + SO2 + NO2 +
Daily hospital admissions for childhood asthma were significantly
negatively correlated with O3. After controlling for seasonality and weather, there appeared to be a positive relationship between daily hospital admissions for childhood asthma and NO2 with a 2-day lag (RR = 1.02 for both 1-Hr and 8-Hr NO2), CO with a 2-day lag (RR = 1.07 for 1-Hr CO; RR = 1.14 for 8-Hr CO) and a 3-day lag (RR = 1.06 for 1-Hr CO; RR = 1.14 for 8-Hr CO), SO2 with a 2-day lag (RR = 1.004 for 1-Hr SO2; RR = 1.006 for 8-Hr SO2), and PM10 with a 2-day lag (RR = 1.006).

240 Respiratory Illness
None of the air pollutants was correlated with daily hospital admissions for COPD among the elderly. After controlling for seasonality and weather, there did not appear to be a positive relationship between daily hospital admissions for COPD among the elderly and any of the air pollutants.
Deaths attributable to respiratory illness were negatively related to O3.
There was weak evidence of a positive relationship between deaths and CO with a 3-day lag (RR = 1.030 for 1-Hr CO; RR = 1.067 for 8-Hr CO), after controlling for seasonality and weather. Toledo
A summary of significant correlation between health effects and air pollution in Toledo can be found in Table III.2.7. CO and SO2 had significant positive zero-order correlations with daily counts of hospital admissions for respiratory illness, while O3 had significant negative zero-order correlations with daily counts of hospital admissions for respiratory illness. After controlling for seasonality and weather conditions, there was only weak evidence of a positive relationship between daily counts of hospital admissions for respiratory illness and CO (1-Hr) (RR = 1.002) and O3 (RR = 1.002).
Table III.2.7. Summary of Significant Correlations Between Observed
Health Effects and Measured Air Pollutants in Toledo (Prior to Controlling for Meteorological Effects)
Pollutant Respiratory
illness admissions
Childhood asthma
COPD in the elderly
Respiratory deaths
PM10 +
O3 - - - CO + + + SO2 + + NO2
Daily hospital admissions for childhood asthma were significantly
negatively correlated with O3. After controlling for seasonality and weather, there did not appear to be a positive relationship between childhood asthma and any of the air pollutants.
CO and SO2 were significantly positively correlated with daily hospital
admissions for COPD among the elderly. After controlling for seasonality and weather, there did appeared to be a positive relationship between COPD

Respiratory Illness 241
among the elderly and SO2 with a 3-day lag (RR = 1.003 for 1-Hr SO2; RR = 1.005 for 8-Hr SO2).
Deaths attributable to respiratory illness were positively related to CO and
PM10 and negatively related to O3. After controlling for seasonality and weather, there did not appear to be a positive relationship between deaths due to respiratory illness and any of the air pollutants. Youngstown
Table III.2.8 is a summary of significant correlations between health effects and air pollution in Youngstown. SO2 had significant positive zero-order correlations with daily counts of hospital admissions for respiratory illness, while O3 had significant negative zero-order correlations with daily counts of hospital admissions for respiratory illness. After controlling for seasonality and weather conditions, there was evidence of a positive relationship between daily counts of hospital admissions for respiratory illness and SO2 (8-Hr) at no lag (RR = 1.002), SO2 (1 Hr) at a 1-day lag (RR = 1.001), and PM10 at no lag (RR = 1.003).
Table III.2.8. Summary of Significant Correlations Between Observed Health Effects and Measured Air Pollutants in Youngstown (Prior to
Controlling for Meteorological Effects)
Pollutant Respiratory illness admissions
Childhood asthma
COPD in the elderly
Respiratory deaths
PM10
O3 - - CO SO2 + + NO2
Daily hospital admissions for childhood asthma were significantly positively
correlated with SO2 (8 Hr), but negatively correlated with O3. As was the case with the other sites, there were relatively few hospital admissions of children for asthma. More specifically, no children were admitted to hospitals with asthma as the primary diagnosis on 90% of the days covered in this study. As discussed later, this may help to explain why no relationship was detected between childhood asthma and air pollution, after controlling for seasonality and weather.

242 Respiratory Illness
None of the air pollutants were significantly with daily hospital admissions
for COPD among the elderly or with deaths attributable to respiratory illness. Not surprisingly, we found no evidence of any relationship between the air pollutants and either of these respiratory health measures, after controlling for seasonality and weather. DISCUSSION
An examination of the zero-order correlations between respiratory health and air pollution reveals a significant amount of consistency across the eight sites included in this study. At every site, O3 is significantly negatively correlated with hospital admissions for all respiratory illnesses and for asthma in children at every one of the eight sites. O3 is also significantly negatively correlated with hospital admissions for COPD in the elderly at two sites and with total respiratory deaths at five sites. As explained previously, the reason for the negative correlations is that respiratory illness peaks during the winter months when ozone is virtually nonexistent. Indeed, ozone is only recorded from April through October in most sites in Ohio.
The other pollutants that were also negatively correlated with respiratory
health were NO2 and PM10. Surprisingly, the correlation between respiratory health and PM10 varied substantially from one site to another. For example, the correlation between total respiratory illness and PM10 was positive at Akron, negative at Cincinnati, Cleveland, and Columbus, and non-significant at Steubenville and Youngstown.
Not unexpectedly, CO and SO2 were generally positively correlated with
respiratory health. The results from the eight sites were far from unanimous, however, as many of the correlations failed to attain the traditional significance, suggesting that CO and SO2 were either uncorrelated or weakly correlated with respiratory health at many of the sites.
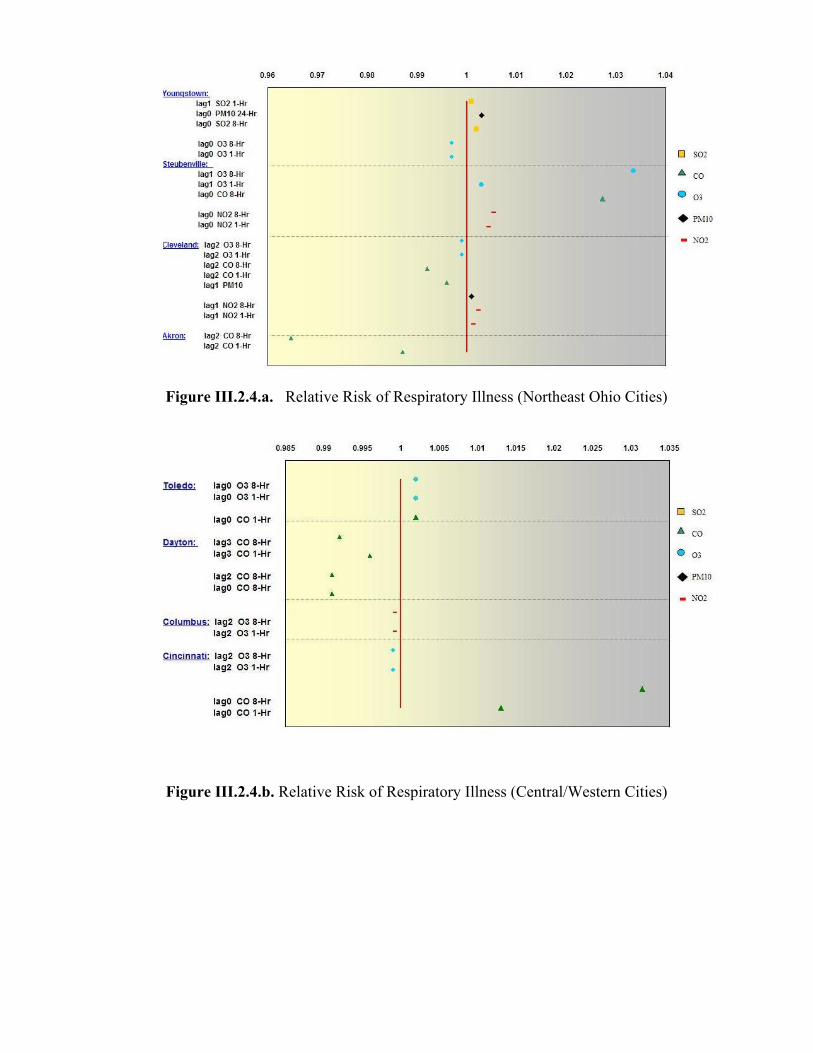
After partitioning out the effects of seasonality and weather, there was little
evidence of a consistent relationship between any of the air pollutants and any of the measures of respiratory health across the eight sites. Figures III.2.4 and III.2.5 show the relative risk for total respiratory illness, and children’s asthma for the 8 cities for lags 0 through 3 days. These figures highlight that no consistent positive relative risk for an individual pollutant was experienced between the cities. The cities in the Northeast (Figure III.2.4.a) did experience a slightly higher incidence of relative risks greater than 1 for total respiratory illness than the cities in central and eastern Ohio (Figure III.2.4.b). However, no general pattern for a given pollutant across the state was identified.
Respiratory Illness 243
Figure III.2.4.a. Relative Risk of Respiratory Illness (Northeast Ohio Cities)
Figure III.2.4.b. Relative Risk of Respiratory Illness (Central/Western Cities)

244 Respiratory Illness
Figure III.2.5.a. Relative Risk for Children’s Asthma (Northeast Ohio Cities)
Figure III.2.5.b. Relative Risk for Children’s Asthma (Central/Western Ohio Cities)

Respiratory Illness 245
For children’s asthma again no consistent pattern was seen from city to city. Steubenville showed the greatest prevalence of positive correlations, with positive correlations for all the pollutants except ozone. Slight positive correlations with ozone and children’s asthma were experienced in Cincinnati, and Cleveland.
Given the abundance of evidence suggesting that the two sets of variables ought to be related, it is important to consider why they were not in this study. A number of explanations seem possible. First, a given air pollutant may pose a problem in some locales, but not in others. It may be unreasonable to expect consistency across the different sites.
Second, because of decreases in the levels of many air pollutants over the
last decade, it has become difficult to detect the presence of a relationship between air pollution and respiratory health. Most of the evidence for a strong link between air pollution and respiratory health comes from studies that used data that were collected at least 10 years ago, when levels of air pollution were generally higher, and selected sites, e.g., London, Mexico City, and so on, with relatively high concentrations of air pollution. In contrast, our aim was to survey sites throughout the state of Ohio, without considering the a priori levels of air pollution in the various sites that we selected.
A third explanation is a possible lack of statistical power, especially in choosing measures of respiratory health that showed relatively little daily variability. Although care is always warranted in considering the results from any study, it is particularly important to be cautious in using the results of this study to draw conclusions about hospital admissions of children for asthma. We were surprised by the extremely small number of such cases reported by hospitals during the years covered by this study. The lack of daily variation in asthma cases complicated the statistical analyses that were conducted, as was discussed earlier. One of the consequences of this lack of variability may have been a lack of power for detecting relationships between air pollution and asthma at the different sites.
The fourth explanation is the appropriateness of the respiratory health
indices. As we pointed out, there were relatively few hospital admissions for asthma among children. The number of respiratory deaths was also relatively small compared to the number reported in other studies. It is difficult to know the reason for this. Two possibilities are that urban areas in Ohio are less heavily polluted than other urban areas that are frequently studied and that we used data from the Ohio Hospital Association, rather than from the federal death registry. It is also conceivable that our decision to use a twenty-mile radius for deciding whether or not cases were to be included in counts for a site affected our results.

246 Respiratory Illness
The fifth and final explanation is the conservativeness of the statistical analyses. An examination of the zero-order correlations between the air pollutants and the respiratory health measures depicts that air pollution is related to respiratory health. However, the results of this research do not allow the conclusion that air pollution causes adverse health effects. The difficulty in drawing a conclusion about causality is that both health and air pollution exhibit seasonal trends and both are related to a wide variety of meteorological variables, as was evident in this research.
Our goal in attempting to answer the question about the causal relationship
between air pollution and respiratory health was to eliminate seasonality and weather as explanations for the observed relationships between air pollution and respiratory health. Even after controlling for seasonality and weather, respiratory health and air pollution remained correlated with one another, although to a far lesser extent than what would have been expected after an examination of the bivariate correlations between the air pollutants and the respiratory health measures. This suggests that a sizeable amount of the relationship between air pollution and respiratory health can be attributed to other factors. In considering this possibility, it is worth considering whether it is indeed changes in these other variables that produce changes in respiratory health. In other words, to conclude that a sizeable amount of the relationship between air pollution and respiratory health can be attributed to other factors is not the same as concluding that a sizeable amount of the relationship between air pollution and respiratory health is actually due to other factors. NOTES
1. K. Liang & S. Zeger, Longitudinal data analysis for discrete and continuous outcomes, Biometrics 73(1986): 13-22.
2. S. Zeger & K. Liang Longitudinal data analyisis for discrete and continuous outcomes, Biometrics 42(1986): 121-130.