section 3: environmental setting air quality
TRANSCRIPT

USFWS / CONSERVATION DISTRICT 3.1-1 D ECEMBER 2019
SECTION
3.0 3.0 ENVIRONMENTAL SETTING
3.1 AIR QUALITY
ENVIRONMENTAL SETTING AIR QUALITY
This section describes the existing air quality conditions and greenhouse gas (GHG) emissions within the Plan Area.
3.1.1 REGULATORY SETTING
3.1.1.1 Federal
Air Quality Standards
Pursuant to the Federal Clean Air Act (CAA) of 1970, the EPA established national ambient air quality standards (NAAQS). The NAAQS were established for six major pollutants, termed criteria pollutants. The criteria pollutants are carbon monoxide (CO), oxides of nitrogen (NOx), ozone (O3), atmospheric particulate matter (PM), sulfur dioxide (SO2), and lead (Pb). Criteria pollutants are defined as those pollutants for which Federal and State governments have established ambient air quality standards, or criteria, for outdoor concentrations that safeguard public health. These standards identify concentrations for criteria pollutants that are the maximum levels of ambient (background) air pollutants considered safe, with an adequate margin of safety, to protect the public health and welfare; refer to Table 3.1-1.

DEIS/SEIR FOR A PROPOSED HCP AND SECTION 10 PERMIT FOR THE UPPER SANTA ANA RIVER WASH PLAN SECTION 3.1
USFWS / CONSERVATION DISTRICT 3.1-2 D ECEMBER 2019
Table 3.1-1: National and California Ambient Air Quality Standards and Attainment Status for the Project Area
Pollutant Averaging Time California1 Federal2
Standard3 Attainment Status Standards3,4 Attainment Status
Ozone (O3) 1 Hour 0.09 ppm (180 µg/m3) Nonattainment Severe N/A Nonattainment/
Extreme
8 Hour 0.070 ppm (137 µg/m3) N/A 0.070 ppm (147 µg/m3) Nonattainment/ Extreme
Particulate Matter (PM )5
10
24 Hour 50 µg/m3 Nonattainment 150 µg/m3 Attainment/ Maintenance
Annual Arithmetic Mean 20 µg/m3 Nonattainment N/A N/A
Fine Particulate Matter(PM )5
2.5
24 Hour No Separate State Standard 35 µg/m3 Nonattainment/ Serious
Annual Arithmetic Mean 12.0 µg/m3 Nonattainment 12.0 µg/m3 Nonattainment/
Moderate
Carbon Monoxide (CO) 8 Hour 9.0 ppm (10 mg/m3) Attainment 9 ppm (10 mg/m3) Attainment/
Maintenance
1 Hour 20 ppm (23 mg/m3) Attainment 35 ppm (40 mg/m3) Attainment/ Maintenance
Nitrogen Dioxide (NO )6
2
Annual Arithmetic Mean 0.030 ppm (57 µg/m3) Attainment 53 ppb (100 µg/m3) Maintenance
1 Hour 0.18 ppm (339 µg/m3) Attainment 100 ppb (188 µg/m3) Attainment/ Maintenance
LEAD (PB)8, 9
30 day average 1.5 µg/m3 Nonattainment N/A N/A
Calendar Quarter N/A N/A 1.5 µg/m3 (for certain areas) Unclassified
Rolling 3-month Average N/A N/A 0.15 µg/m3 Unclassified/
Attainment
Sulfur Dioxide (SO )7 2
Annual Arithmetic Mean N/A N/A 0.030 ppm (for certain
areas) Attainment
24 Hour 0.04 ppm (105 µg/m3) Attainment 0.14 ppm (for certain areas) Attainment
3 Hour N/A N/A N/A Attainment
1 Hour 0.25 ppm (655 µg/m3) Attainment 75 ppb (196 µg/m3) Attainment/ Unclassifiable

DEIS/SEIR FOR A PROPOSED HCP AND SECTION 10 PERMIT FOR THE UPPER SANTA ANA RIVER WASH PLAN SECTION 3.1
USFWS / CONSERVATION DISTRICT 3.1-3 D ECEMBER 2019
Visibility-Reducing Particles10 8 Hours (10 a.m. to 6 p.m., PST)
Extinction coefficient = 0.23 km@<70% RH Unclassified
No Federal Standards Sulfates 24 Hour 25 µg/m3 Attainment
Hydrogen Sulfide 1 Hour 0.03 ppm (42 µg/m3) Unclassified
Vinyl Chloride8 24 Hour 0.01 ppm (26 µg/m3) N/A
µg/m3 = micrograms per cubic meter; ppm = parts per million; ppb = parts per billion; km = kilometer(s); RH = relative humidity; PST = Pacific Standard Time; N/A = Not Applicable. 1. California standards for ozone, carbon monoxide (except Lake Tahoe), sulfur dioxide (1- and 24-hour), nitrogen dioxide, suspended particulate matter-PM10 and visibility-reducing particles, are values
that are not to be exceeded. All others are not to be equaled or exceeded. California ambient air quality standards are listed in the Table of Standards in Section 70200 of Title 17 of the California Code of Regulations
2. National standards (other than ozone, particulate matter and those based on annual averages or annual arithmetic mean) are not to be exceeded more than once a year. The ozone standard is attained when the fourth highest 8-hour concentration measured at each site in a year, averaged over three years, is equal to or less than the standard. For PM10, the 24-hour standard is attained when the expected number of days per calendar year with a 24-hour average concentration above 150 μg/m3 is equal to or less than one. For PM2.5, the 24-hour standard is attained when 98 percent of the daily concentrations, averaged over three years, are equal to or less than the standard.
3. Concentration is expressed first in units in which it was promulgated. Equivalent units given in parentheses are based upon a reference temperature of 25°C and a reference pressure of 760 torr. Most measurements of air quality are to be corrected to a reference temperature of 25°C and a reference pressure of 760 torr; ppm in this table refers to ppm by volume, or micromoles of pollutant per mole of gas.
4. National Primary Standards: The levels of air quality necessary, with an adequate margin of safety, to protect the public health. 5. On December 14, 2012, the national annual PM2.5 primary standard was lowered from 15 µg/m3 to 12.0 µg/m3. The existing national 24-hour PM2.5 standards (primary and secondary) were retained at 35
µg/m3, as was the annual secondary standard of 15 µg/m3. The existing 24-hour PM10 standards (primary and secondary) of 150 µg/m3 also were retained. The form of the annual primary and secondary standards is the annual mean, averaged over 3 years.
6. To attain the 1-hour standard, the 3-year average of the 98th percentile of the daily maximum 1-hour average at each monitor within an area must not exceed 0.100 ppm. 7. On June 2, 2010, a new 1-hour SO2 standard was established and the existing 24-hour and annual primary standards were revoked. To attain the 1-hour national standard, the 3-year average of the
annual 99th percentile of the 1-hour daily maximum concentrations at each site must not exceed 75 ppb. The 1971 SO2 national standards (24-hour and annual) remain in effect until one year after an area is designated for the 2010 standard, except that in areas designated nonattainment for the 1971 standards, the 1971 standards remain in effect until implementation plans to attain or maintain the 2010 standards are approved. Note that the 1-hour national standard is in units of parts per billion (ppb). California standards are in units of parts per million (ppm). To directly compare the 1-hour national standard to the California standard the units can be converted to ppm. In this case, the national standard of 75 ppb is identical to 0.075 ppm.
8. CARB has identified lead and vinyl chloride as ‘toxic contaminants with no threshold level of exposure for adverse health effects determined. These actions allow for the implementation of control measures at levels below the ambient concentrations specified for these pollutants.
9. The national lead standard, rolling 3-month average; final rule signed October 15, 2008. 10. In 1989, CARB converted both the general statewide 10-mile visibility standard and the Lake Tahoe 30-mile visibility standard to instrumental equivalents, which are "extinction of 0.23 per kilometer"
and "extinction of 0.07 per kilometer" for the statewide and Lake Tahoe Air Basin standards, respectively.
Source: California Air Resources Board and U.S. Environmental Protection Agency, May 4, 2016. (www.arb.ca.gov/research/aaqs2.pdf)
Detailed information on state and local air quality regulations can be found in Appendix B.

DEIS/SEIR FOR A PROPOSED HCP AND SECTION 10 PERMIT FOR THE UPPER SANTA ANA RIVER WASH PLAN SECTION 3.1
USFWS / CONSERVATION DISTRICT 3.1-4 D ECEMBER 2019
3.1.2 ENVIRONMENTAL SETTING
The Plan Area is located in the non-desert portion of the South Coast Air Basin (Basin), a geographic area that includes all of Orange County and the non-desert portions of Los Angeles, Riverside, and San Bernardino counties. The Basin encompasses the coastal plain and connects broad inland valleys, low hills, and mountains. The South Coast Air Quality Management District (SCAQMD) administers air quality regulation in the Basin.
The Basin experiences a persistent temperature inversion (increasing temperature with increasing altitude) as a result of a subtropical high-pressure system which holds air contaminants near the ground. During the summer, air pollutants generated in urbanized areas are transported predominantly onshore into Riverside and San Bernardino counties. The long daylight hours and sunshine combine to cause a reaction between hydrocarbons, designated volatile organic compounds (VOCs) or reactive organic gases (ROGs), and oxides of nitrogen (NOx) to form photochemical smog. In the fall and winter, strong, dry north or northeasterly winds known as the Santa Ana winds disperse air contaminants. The greatest pollution problems during these seasons are carbon monoxide (CO) and oxides of nitrogen (NOx), because of extremely low inversions and air stagnation during the night and early morning hours.
Predominant winds in the Basin have relatively low average velocities, averaging about 4.0 miles per hour (mph). These low average wind speeds, together with a persistent temperature inversion, limit the vertical dispersion of air pollutants throughout the Basin.
3.1.2.1 Regional Air Quality
The Federal CAA of 1970 established the National Ambient Air Quality Standards (NAAQS). Six “criteria” air pollutants were identified using specific medical evidence available at that time, and NAAQS were established for those chemicals. The State of California has adopted the same six chemicals as criteria pollutants, but has established in some instances different allowable levels or different methods to measure criteria pollutants (Table 3-1.1). The six criteria pollutants are: carbon monoxide, ozone, nitrogen dioxide, particulates less than 10 microns in size (PM10), sulfur dioxide, and lead. A further discussion of the criteria pollutants, as well as PM2.5 and volatile organic compounds can be found in Section C.1.1of Appendix C.
3.1.2.2 Local Air Quality
The California Air Resources Board (CARB) coordinates and oversees Federal and State air pollution control programs in California, oversees activities of local air quality management agencies, incorporates the Air Quality Management Plan (AQMP) for local air basins into a State Implementation Plan (SIP) for US EPA approval, and maintains air quality monitoring stations throughout the State in conjunction with the EPA and local air districts. The CARB has divided the State into 15 air basins based on meteorological and topographical factors of air pollution. Based on air quality data for the most recent three calendar

DEIS/SEIR FOR A PROPOSED HCP AND SECTION 10 PERMIT FOR THE UPPER SANTA ANA RIVER WASH PLAN SECTION 3.1
USFWS / CONSERVATION DISTRICT 3.1-5 D ECEMBER 2019
years compared with federal and California AAQS, data collected at these stations are used by the CARB and EPA to classify air basins using the following four classifications:
● Attainment: A pollutant is designated attainment if the AAQS for that pollutant was not violated
at any site in the area during a three-year period;
● Nonattainment: A pollutant is designated nonattainment if there was at least one violation of an AAQS for that pollutant in the area;
● Nonattainment-transition: This is a subcategory of the nonattainment designation. An area is designated nonattainment-transitional to signify that the area is close to attaining the standard for that pollutant;
● Attainment / Maintenance: This subcategory refers to a former nonattainment area that has attained the AAAQ by following a maintenance plan consisting of best available controls and technologies to ensure ongoing attainment; and
● Unclassified: A pollutant is designated unclassified if the data are incomplete and do not support a designation of attainment or nonattainment.
The Plan Area is located in the South Coast Air Basin (Basin) which is in nonattainment for ozone and PM2.5 (See Table 3.1-1).
Air quality data are also used to monitor progress in attaining air quality standards. The SCAQMD, together with the CARB, maintains ambient air quality monitoring stations in the Basin. The air quality monitoring station closest to the Plan Area is in the City of Redlands, but only monitors O3 and PM10. The closest station that monitors most of the criteria pollutants is located in the City of San Bernardino. SO2 is not monitored at most stations because there has been no exceedance of the Federal standards in the past 10 years. However, the Fontana station monitors SO2. The existing levels in the Plan Area can be sorted into two categories: 1) consistently below the relevant Federal standards for NO2, SO2, and CO; and 2) regularly exceeding Federal standards for O3 and PM2.5.
3.1.2.3 Toxic Air Contaminants
Toxic Air Contaminants (TACs) are another group of pollutants of concern. There are many different types of TACs, with varying degrees of toxicity. Sources of TACs include industrial processes such as petroleum refining and chrome-plating operations, commercial operations such as gasoline stations and dry cleaners, and motor vehicle exhaust. Cars and trucks release at least 40 different toxic air contaminants. The most important, in terms of health risk, are diesel particulate matter, benzene, formaldehyde, acrolein, 1, 3-butadiene, and acetaldehyde. Public exposure to TACs can result from emissions from normal operations as well as accidental releases. Health effects of TACs include cancer, birth defects, neurological damage, and death. The CARB has developed recommendations regarding the siting of new land uses with sensitive receptors near sources of TACs, such as freeways with heavy diesel truck traffic. The recommendations identify minimum separations between sources and receptors (CARB, 2005).

DEIS/SEIR FOR A PROPOSED HCP AND SECTION 10 PERMIT FOR THE UPPER SANTA ANA RIVER WASH PLAN SECTION 3.1
USFWS / CONSERVATION DISTRICT 3.1-6 D ECEMBER 2019
Determining how hazardous a substance depends on many factors, including the amount of the substance in the air, how it enters the body, and how long the exposure lasts. One major way these substances enter the body is through inhalation of either gas or particulate. While many gases are harmful, very small particles penetrate deep into the lungs, contributing to a range of health problems. Exhaust from diesel engines is a major source of these airborne particles. The Office of Environmental Health Hazard Assessment (OEHHA) has determined that long-term exposure to diesel exhaust particulates (PM) poses the highest cancer risk of any TAC it has evaluated. Fortunately, improvements to diesel fuel and diesel engines have already reduced emissions of some contaminants. The Risk Reduction Plan to Reduce Particulate Matter Emissions from Diesel-Fueled Engines and Vehicles, when fully implemented in 2020, will result in an 85 percent reduction in particle emissions from diesel- powered trucks and other equipment compared to 2000 levels.
CARB proposes to:
● Establish more stringent emission standards for new diesel-fueled engines and vehicles;
● Establish particulate trap retrofit requirements for existing engines and vehicles where traps are determined to be technically feasible and cost-effective;
● Require the sulfur content of diesel fuel to be reduced to enable the use of advanced diesel PM emission controls; and
● Evaluate alternatives for diesel-fueled engines and vehicles.
3.1.3 GLOBAL CLIMATE CHANGE
Although the Federal government has not regulated emissions of GHGs, the State of California has been proactive in the study of impacts of climate change and reducing emissions of GHG. According to the California Energy Commission (CEC) California is a substantial contributor of global GHG as it is the second largest contributor in the U.S. and the sixteenth largest in the world (CEC 2006). During 1990 to 2003, California’s gross state product grew 83 percent, while GHG emissions grew 12 percent. Although California has a high amount of GHG emissions, it has low emissions per capita.
The major source of GHG in California is transportation, contributing 39 percent of the State’s total GHG emissions (CEC 2018). GHG emissions from the electricity sector declined by 18% in 2016 compared to 2015 (CEC 2016). The decrease in GHG was driven primarily by the large increase in renewable energy resources as a result of California’s Renewable Portfolio Standard and the Cap-and-Trade Program.
There are currently no direct Federal rules or legislation pertaining to GHG emissions under the CAA.
3.1.4 EXISTING EMISSION SOURCES
The existing land uses in the Plan Area consist of water conservation, flood control, water production, habitat conservation, unmanaged open space, aggregate mining, arterial/highway, agriculture, and

DEIS/SEIR FOR A PROPOSED HCP AND SECTION 10 PERMIT FOR THE UPPER SANTA ANA RIVER WASH PLAN SECTION 3.1
USFWS / CONSERVATION DISTRICT 3.1-7 D ECEMBER 2019
vacant land. Of the current existing uses permitted within the Plan Area, water conservation and flood control activities have the tendency to emit coarse particulate matter (PM10) due to the need to regularly maintain and monitor their respective primarily earthen facilities. Coarse particulate matter is primarily emitted from water conservation and flood control activities due to the lack of paved maintenance roads. Additionally, mining activities would emit coarse particles (fugitive dust) from the daily mining and processing of aggregate material as well as from the proposed construction and vehicle use of haul roads and access roads.
To combat the emission of PM10 in the air, the Conservation District and the SBCFCD enforce speed limits of 15 mph for their service vehicles on all maintenance roads within the Plan Area. Mining vehicle speed limits are established per their mining plan. In addition, water spraying efforts are conducted as often as needed during the day depending on conditions (e.g., during high winds) to reduce fugitive dust. Proper and regular maintenance of roads is also implemented to reduce the emission of course particulate matter.
Currently, Cemex is permitted to produce up to 5.4 million tons of aggregate materials per year, and Robertson’s is permitted to produce up to 2.55 million tons per year as per their SCAQMD permits. Existing mining operations include excavation, transport, and processing of materials in the Plan Area. Excavation operations require the use of excavators, and transporting operations require the use of haul trucks and water trucks. The processing of materials requires the use of crushers, screens, conveyors, and stacking conveyors. The existing rate of production at both Cemex and Robertson’s facilities is approximately 4.0-4.5 million tons per year (MTPY).
Existing Cemex and Robertson’s mining activities and Conservation District and SBCFCD activities contribute fugitive dust and fuel-combustion emissions generated during operations within the Plan Area. Existing emissions sources fall under the following categories:
● Off-Site Mobile Emissions: Vehicle emissions resulting from traffic traveling to and from the
processing facilities;
● On-Site Mobile Emissions: Vehicle and heavy-duty mobile equipment exhaust emissions, including when idling;
● On-Site Stationary Emissions: Cemex and Robertson’s currently operate the following stationary sources: (1) a rock plant used for crushing and screening of quarried materials; and (2) a ready- mix plant. Commercial electric power is used for all plant operations and operations are scheduled around peak energy demands in coordination with Southern California Edison; and
● On-Site Fugitive Emissions: Dust from heavy-duty mobile equipment used on site for quarry and loading operations, and wind erosion of disturbed areas, including topsoil stockpiles.
Cemex, Robertson’s, SBCFCD, and the Conservation District reduce the amount of emissions emitted from their respective activities conducted within the Plan Area with compliance with applicable SCAQMD Rules and with the air quality policies contained in the general plans of the City of Highland and City of Redlands which include (but are not limited to) the following:

DEIS/SEIR FOR A PROPOSED HCP AND SECTION 10 PERMIT FOR THE UPPER SANTA ANA RIVER WASH PLAN SECTION 3.1
USFWS / CONSERVATION DISTRICT 3.1-8 D ECEMBER 2019
● Enforced speed limits;
● Watering of road surfaces on a regular basis;
● Maintaining a smooth road bed through grading and filling of potholes to reduce spillage;
● Shut down of plant and quarry operations in winds over 25 mph;
● Shifts at non-peak traffic hours;
● Reduced power usage during peak consumption hours when applicable (summer);
● Spraying of water in active mining areas during removal and loading of haul trucks;
● Specific control measures (not inclusive) to meet standards of SCAQMD Rules 403 and 1157:
− Paved entrances (driveways), scales, washing areas, and front office areas.
− Water truck wash racks to wash truck sides and wheels and to moisten load.
− Ruble grates to reduce track-out.
− Loading of trucks per California Vehicle Code 23114 including covering of load or
maintaining a 6-inch freeboard.
− Loading of some trucks from bins with drop chutes to reduce dust.
− Wet sweeping paved plant areas and surrounding paved public streets as needed to remove
track-out every 8-hour shift or two times per day.
− Application of dust suppressants approved by the SCAQMD and CARB on other heavily used
internal roads.
− Waters spraying of stockpiles.
− Operate stationary plant equipment per SCAQMD permit conditions including controlling
dust with baghouses, water sprays, enclosures, and production limits.
− Maintenance of the 20-foot high landscaped berm on the west side of the Orange Street
plant to reduce blowing dust.
In addition, managers and other selected employees receive dust control training and certification at SCAQMD to have a certified dust control employee at all times. A person must be trained and/or certified to conduct opacity or visibility readings as required by Rule 1157, and employees are provided instruction on how to reduce dust during scheduled safety and training sessions. Dust is not only a nuisance for the public, it can cause major costly maintenance issues for on-site equipment and engines, so it is to the benefit of the operator to reduce dust.
From 2004 through 2008, the Inland Empire experienced a drastic increase in development, thus increasing air quality emissions within the vicinity of the Plan Area. Subsequently that time, a significant

DEIS/SEIR FOR A PROPOSED HCP AND SECTION 10 PERMIT FOR THE UPPER SANTA ANA RIVER WASH PLAN SECTION 3.1
USFWS / CONSERVATION DISTRICT 3.1-9 D ECEMBER 2019
decrease in development has occurred. Therefore, the air quality analysis conducted in 2007 is expected to still illustrate a reasonable scenario when compared to current conditions.
Also, due to implementation of existing regulations for the fleet of haul trucks and processing equipment that would be in use at the time the Proposed Projects are implemented are anticipated to be cleaner than those used in 2007 when the emissions analysis was conducted. Some statewide regulations proposed to reduce one form of pollutant have the added benefit of reducing other forms of pollution. For example, after the CARB approved the Heavy-Duty Vehicle Greenhouse Gas Reduction Measure in 2008 and the most recent amendments in December 2014 to reduce greenhouse gas emissions from heavy-duty trucks, it also reduces NOx emissions. This measure requires a compliance schedule for trucks to be certified under the USEPA SmartWay Program, which reduces fuel consumption by improving fuel efficiency through improvements to tractor and trailer aerodynamics and low-rolling resistance tires. Also, on February 1, 2005, a requirement limiting the idling of diesel- fueled commercial vehicles to five minutes at any location pursuant to Section 2485 of Chapter 10 within Title 13 of CCR was adopted. Similarly, Section 2449 prohibits construction equipment and truck idling times shall be prohibited in excess of five minutes on site. Therefore, emissions from the fleet of haul trucks and processing equipment when the Proposed Projects and expanded aggregate mining are implemented are anticipated to be less than what was estimated in the 2008 EIR.
On-site exhaust emissions for mining operations, off-site emissions for haul trucks, and fugitive dust sources were estimated and included in the Conservation District’s November 2008 Final EIR (SCH No. 2004051023) for the Upper Santa Ana River Wash Land Management and Habitat Conservation Plan. Table 3.1-2, Existing Wash Plan Area Emissions, shows the existing on-site and off-site emissions for the Plan Area that were included in the 2008 EIR. Existing emissions rates do not exceed Operations thresholds set by the South Coast Air Quality Management District (SCAQMD) for CO or VOCs but do exceed thresholds for NOX, PM10 and PM 2.5.
Table 3.1-2: Existing Wash Plan Area Emissions
Emission Source
Emission Rates (lbs/day)
CO VOC NOX PM10 PM25 CO2 Off-site Exhaust Sources 19 6.4 35 2.4 2.2 3,800
On-site Exhaust Sources 128 40 364 62 29 N/C
On-site Fugitive Dust Sources — — — 781 234 —
SAQMD Thresholds 550 55 55 150 55 No Threshold
Significant? No No Yes Yes Yes
Source: Conservation District’s November 2008 Final EIR (SCH No. 2004051023) for the Upper Santa Ana River Wash Land Management and Habitat Conservation Plan Note that numbers are rounded. N/C = Not Calculated

DEIS/SEIR FOR A PROPOSED HCP AND SECTION 10 PERMIT FOR THE UPPER SANTA ANA RIVER WASH PLAN SECTION 3.1
USFWS / CONSERVATION DISTRICT 3.1-10 D ECEMBER 2019
Existing vehicular trips associated with aggregate mining contribute to the congestion at intersections and along roadway segments in the Plan Area. The primary mobile source pollutant of local concern is CO. CO is a direct result of vehicle idling time and, thus, traffic flow conditions. CO transport is extremely limited; it disperses rapidly with distance from the source under normal meteorological conditions. However, under certain extreme meteorological conditions, CO concentrations proximate to a congested roadway or intersection may reach unhealthful levels affecting local sensitive receptors (residents, school children, the elderly, hospital patients, etc.). Typically, high CO concentrations are associated with roadways or intersections operating at unacceptable levels of service or with extremely high traffic volumes.
The highest CO concentrations would occur during peak traffic hours; hence, CO impacts calculated during peak traffic conditions would represent a worst-case analysis. Based on the Traffic Study (LSA Associates, Inc., August 2007), CO hot spot analyses were conducted for existing conditions. The impact on local CO levels was assessed with the CARB-approved CALINE4 air quality model, which allows microscale CO concentrations to be estimated along roadway corridors or near intersections. This model is designed to identify localized concentrations of CO hot spots. Table 3.1-3 shows the existing CO concentrations at principal intersections that would be affected by traffic from ongoing mining operations.

DEIS/SEIR FOR A PROPOSED HCP AND SECTION 10 PERMIT FOR THE UPPER SANTA ANA RIVER WASH PLAN SECTION 3.1
USFWS / CONSERVATION DISTRICT 3.1-11 D ECEMBER 2019
Table 3.1-3 – Existing CO Concentrations
Intersection
Receptor Distance to Road
Centerline (Meters)
Existing 1- hour
CO Concentration (ppm)
Existing 8- hour
CO Concentration (ppm)
Exceeds State Standards
1-Hr 8-Hr
Palm Avenue and 5th Street
12 6.5 5.1 No No 12 6.5 5.1 No No 10 6.3 4.9 No No 10 6.2 4.9 No No
Palm Avenue and 3rd Street
14 5.7 4.5 No NO 14 5.6 4.5 No No 12 5.6 4.5 No No 7 5.6 4.5 No No
Palm Avenue and Robertson’s
Access
10 5.5 4.4 No No 7 5.5 4.4 No No 7 5.5 4.4 No No 7 5.4 4.3 No No
Palm Avenue
and Cemex Acess
14 5.3 4.2 No No 12 5.3 4.2 No No 7 5.2 4.2 No No 7 5.2 4.2 No No
Church Avenue and 5th Street
14 5.9 4.7 No No 14 5.8 4.6 No No 14 5.7 4.5 No No 12 5.5 4.4 No No
Truck Access Road and 5th
Street
17 5.7 4.5 No No 17 5.5 4.4 No No 17 5.5 4.4 No No 15 5.4 4.3 No No
State Route 210 Southbound
Ramps and 5th Street
10 6.4 5.0 No No 10 6.3 4.9 No No 10 6.2 4.9 No No 10 5.9 4.7 No No
State Route 210 Northbound
Ramps and 5th Street
7 6.8 5.3 No No 7 6.6 5.2 No No 7 6.5 5.1 No No 7 6.4 5.0 No No
Boulder Avenue and Greenspot
Road
7 6.6 5.2 No No 7 6.4 5.0 No No 7 6.3 4.9 No No 7 6.3 4.9 No No
Orange Street and Cemex
Access
7 6.4 5.0 No No 7 6.4 5.0 No No 7 6.3 4.9 No No 7 6.3 4.9 No No
Includes ambient 1-hour concentration of 3.8 ppm and ambient 8-hour concentration of 2.9 ppm. Measured at the 24302 4th Street, San Bernardino, California, AQ Station (San Bernardino County). Source: Conservation District’s 2008 Final EIR (SCH No. 2004051023) for the Upper Santa Ana River Wash Land Management and Habitat Conservation Plan
None of the principal intersections that would be affected by expanded mining have existing CO concentrations that exceed state standards; there are no existing hot spots at principal intersections.

DEIS/SEIR FOR A PROPOSED HCP AND SECTION 10 PERMIT FOR THE UPPER SANTA ANA RIVER WASH PLAN SECTION 3.1
USFWS / CONSERVATION DISTRICT 3.1-12 D ECEMBER 2019
This page intentionally left blank.

SECTION
3.2 GEOLOGY AND MINERAL RESOURCES
USFWS/ CONSERVATION DISTRICT 3.2-1 D ECEMBER 2019
3.2 GEOLOGY AND MINERAL RESOURCES
The purpose of this section is to identify and describe the current geologic and soil conditions and mineral resources in the Plan Area.
3.2.1 REGULATORY SETTING
Federal, state, and local regulations in regards to geology and mineral resources can be found in Appendix B.
3.2.2 ENVIRONMENTAL SETTING
3.2.2.1 Geologic Setting
The Plan Area is located within the Bunker Hill-San Timoteo Basin portion of the San Bernardino Valley at the northeastern edge of the Peninsular Ranges Geomorphic Province. The geomorphology of the Peninsular Ranges is characterized by northwest/southwest-trending mountain ridges, valleys, and faults which run parallel and sub-parallel to the San Andreas Fault. As a result of the active tectonism of the area, the surficial geology of this province is typified by gently to moderately sloping igneous and metamorphic rocks of the Peninsular Ranges. The Bunker Hill-San Timoteo Basin is a subsiding series of horsts (high ground flanked by faults) and grabens (low ground flanked by faults) bounded on the northeast by the San Andreas Fault and on the southeast by the San Jacinto Fault. Alluvial fans derived from the San Bernardino Mountains (to the north) and, to a lesser extent, from the San Timoteo Badlands (to the south) are filling the basin with sediment as it subsides. These alluvial deposits have formed the alluvial plain known as the Santa Ana River Wash (Conservation District 2008 EIR).
The Santa Ana River Wash is comprised of recent and older washes deposited by several stream channels and drainages that are derived from the San Bernardino Mountains to the north, several of which impact the Plan Area. These channels include Santa Ana River, Mill Creek, City Creek, and Plunge Creek. Due to the irregular surface of the basin floor, the alluvial deposits vary in thickness and depth between 600 to 1,200 feet. Artificial fill associated with man-made earthen berms, roadways, and unprocessed stockpiles at mining sites, is also found within the limits of the Plan Area. (Conservation District 2008 EIR).
3.2.2.2 Seismic Setting
The Plan Area is in a seismically active region between two major fault systems, the San Andreas and San Jacinto Faults. The Alquist-Priolo Earthquake Fault Zone established for the San Andreas Fault extends into the northeastern corner of the Plan Area. The San Jacinto Fault is outside the Plan Area and at its closest approach is approximately 4.75 miles to the west. Motion on both the San Andreas and San

DEIS/SEIR FOR A PROPOSED HCP AND SECTION 10 PERMIT FOR THE UPPER SANTA ANA RIVER WASH PLAN SECTION 3.2
USFWS/ CONSERVATION DISTRICT 3.2-2 D ECEMBER 2019
Jacinto Faults is transferred laterally from one fault to another and then back again. Activity on any fault in this transfer zone will produce associated motion on other faults in the zone. Figure 3.2-1 depicts the San Andreas fault and its associated Alquist-Priolo Fault Zone in relation to the Plan Area and vicinity (Conservation District 2008 EIR).
The San Andreas Fault is the major surface expression of the tectonic boundary between the Pacific and North American plates. The San Andreas Fault zone near the Plan Area is composed of numerous echelon fault strands that traverse the base of the San Bernardino Mountains. The San Bernardino Mountains segment of the San Andreas Fault consists of three paleotectonic strands (the Wilson Creek, Mission Creek, and Mill Creek Faults). These strands separate the San Bernardino Mountains Block, which is being actively pushed upward and over the San Bernardino Block. The Wilson Creek Fault is the oldest of the three strands and has generated about 40 kilometers of displacement (Conservation District 2008 EIR).
In the San Bernardino area, the toe of the mountain delineates the present active expression of the San Andreas Fault. The Working Group on California Earthquake Probabilities has assigned a 28 percent probability that a major earthquake could occur on the San Bernardino Mountain segment of the San Andreas Fault between 1994 and 2024. (Conservation District 2008 EIR) The 3rd Uniform California Earthquake Rupture Forecast (UCERF3) assigned a 19 percent probability that a major earthquake will occur in the next 30 years (starting from 2014).
The main expression of the San Jacinto Fault is approximately 4.75 miles west of the Plan Area. The San Jacinto Fault zone is a system of northwest-trending, right-lateral, strike-slip faults. The Working Group on California Earthquake Probabilities assigned a 37 percent probability that a major earthquake would occur on the San Bernardino Valley segment of the San Jacinto Fault between 1994 and 2024. (Conservation District 2008 EIR) The 3rd Uniform California Earthquake Rupture Forecast (UCERF3) assigned a 5 percent probability that a major earthquake will occur in the next 30 years (starting from 2014).
The Greenspot Fault is located outside the eastern boundary of the Plan Area and somewhat parallel to and is considered part of the San Andreas/San Jacinto Fault zone. This fault is considered by the CGS to be potentially active. Studies performed to date have not established activity, nor have structural setbacks been recommended for this feature (Conservation District 2008 EIR).
3.2.2.3 Geologic and Seismic Hazards
Geologic and seismic hazards include the following:
● Surface rupture;
● Ground shaking;
● Liquefaction;
● Subsidence and seismic settlement;

DEIS/SEIR FOR A PROPOSED HCP AND SECTION 10 PERMIT FOR THE UPPER SANTA ANA RIVER WASH PLAN SECTION 3.2
USFWS/ CONSERVATION DISTRICT 3.2-3 D ECEMBER 2019
● Landslides/slope stability; and
● Expansive soils.
Surface Rupture
Surface rupture occurs when displacement or fissuring develops adjacent to a fault. Significant structural damage may result when a structure is located close to a surface rupture. Reduction of the potential damage due to surface rupture is difficult to achieve through structural design. The primary way to avoid surface rupture hazard is to set structures and facilities away from active faults, or avoid their construction in close relation to an active fault. The California Building Code regulations include avoidance of faults.
Ground Shaking
Ground shaking causes the vast majority of earthquake damage. Because of the proximity of the Plan Area to two major faults (San Andreas and San Jacinto), the Plan Area can be expected to be subject to severe ground shaking during the lifetime of the Proposed Action/Projects. In general, the degree of shaking depends upon source effects, path effects, and site effects. Source effects include earthquake size, location, and distance. The bigger and closer the earthquake is, the more severe the damage will be. The exact way that rocks move along the fault can also influence shaking, as well as the orientation of the fault in the ground. Path effects are caused by seismic waves that change direction as they travel through the earth’s contrasting layers, just as light bounces (reflects) and bends (refracts) as it moves from air to water. Sometimes this can focus seismic energy at one location, and cause damage in unexpected areas. Site effects are brought about by seismic waves that slowdown in the loose sediments and weathered rock at the surface of the earth. As they slow, their energy converts from speed to amplitude, which increases shaking. This is identical to the behavior of ocean waves. As the waves slow down near shore their crests grow higher. Sometimes, too, seismic waves get trapped at the surface and resonate. Whether resonance will occur depends on the period (the length) of the incoming waves. Waves, soils and buildings all have resonant periods. When these match, tremendous damage can occur (District 2008).
Liquefaction
Liquefaction occurs in saturated, poorly consolidated, fine-to-medium-grained soils in areas where the groundwater table is within 50 feet of the surface. Ground shaking can cause soil to suddenly lose strength and behave as a liquid. During such an event, an increase in interstitial pore-water pressure causes the resulting liquid mass to move upward through fissures in the soil. This can cause a water-soil slurry mixture to bubble onto the ground surface. The resulting features are commonly identified as “sand boils,” or “sand blows.” Liquefaction-related effects include loss of bearing strength, ground oscillations, lateral spreading, or slumping.
DEIS/SEIR FOR A PROPOSED HCP AND SECTION 10 PERMIT FOR THE UPPER SANTA ANA RIVER WASH PLAN SECTION 3.2
USFWS/ CONSERVATION DISTRICT 3.2-4 D ECEMBER 2019
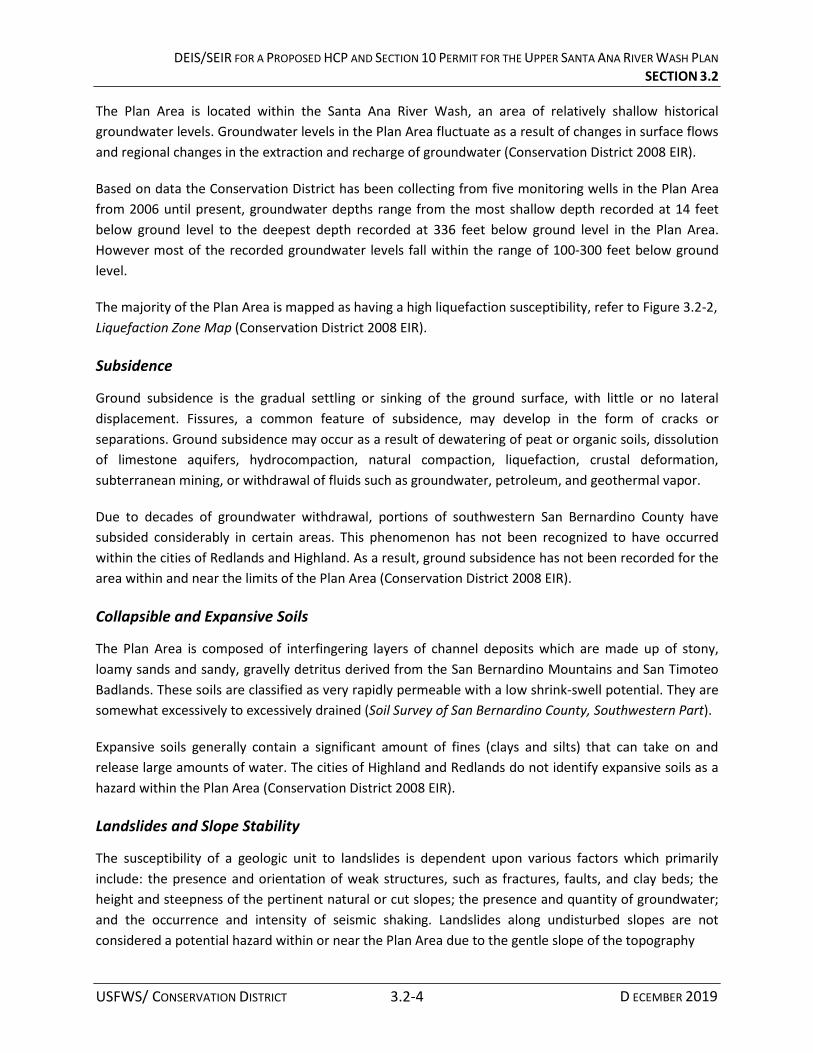
The Plan Area is located within the Santa Ana River Wash, an area of relatively shallow historical groundwater levels. Groundwater levels in the Plan Area fluctuate as a result of changes in surface flows and regional changes in the extraction and recharge of groundwater (Conservation District 2008 EIR).
Based on data the Conservation District has been collecting from five monitoring wells in the Plan Area from 2006 until present, groundwater depths range from the most shallow depth recorded at 14 feet below ground level to the deepest depth recorded at 336 feet below ground level in the Plan Area. However most of the recorded groundwater levels fall within the range of 100-300 feet below ground level.
The majority of the Plan Area is mapped as having a high liquefaction susceptibility, refer to Figure 3.2-2, Liquefaction Zone Map (Conservation District 2008 EIR).
Subsidence
Ground subsidence is the gradual settling or sinking of the ground surface, with little or no lateral displacement. Fissures, a common feature of subsidence, may develop in the form of cracks or separations. Ground subsidence may occur as a result of dewatering of peat or organic soils, dissolution of limestone aquifers, hydrocompaction, natural compaction, liquefaction, crustal deformation, subterranean mining, or withdrawal of fluids such as groundwater, petroleum, and geothermal vapor.
Due to decades of groundwater withdrawal, portions of southwestern San Bernardino County have subsided considerably in certain areas. This phenomenon has not been recognized to have occurred within the cities of Redlands and Highland. As a result, ground subsidence has not been recorded for the area within and near the limits of the Plan Area (Conservation District 2008 EIR).
Collapsible and Expansive Soils
The Plan Area is composed of interfingering layers of channel deposits which are made up of stony, loamy sands and sandy, gravelly detritus derived from the San Bernardino Mountains and San Timoteo Badlands. These soils are classified as very rapidly permeable with a low shrink-swell potential. They are somewhat excessively to excessively drained (Soil Survey of San Bernardino County, Southwestern Part).
Expansive soils generally contain a significant amount of fines (clays and silts) that can take on and release large amounts of water. The cities of Highland and Redlands do not identify expansive soils as a hazard within the Plan Area (Conservation District 2008 EIR).
Landslides and Slope Stability
The susceptibility of a geologic unit to landslides is dependent upon various factors which primarily include: the presence and orientation of weak structures, such as fractures, faults, and clay beds; the height and steepness of the pertinent natural or cut slopes; the presence and quantity of groundwater; and the occurrence and intensity of seismic shaking. Landslides along undisturbed slopes are not considered a potential hazard within or near the Plan Area due to the gentle slope of the topography

DEIS/SEIR FOR A PROPOSED HCP AND SECTION 10 PERMIT FOR THE UPPER SANTA ANA RIVER WASH PLAN SECTION 3.2
USFWS/ CONSERVATION DISTRICT 3.2-5 D ECEMBER 2019
that is indicative of the City of Redlands and the City of Highland, and the rapidly draining soil that comprises the Plan Area. Regardless, slope failure is considered a potential hazard due to mining operations which have created steep, near-vertical slopes with heights of greater than 30 feet. Movement from nearby faults may trigger slope failure and soil settlement from a near vertical condition down to as gentle as a 2:1 inclination.
Soils
Soils within the limits of the Plan Area include Soboba and Riverwash Association soils (Lilburn Corporation 2006). The Soboba Association soils form along the gentle to moderately sloping terrace banks of creeks and washes, within alluvial or stream outwash deposits. The soils are characterized by a surficial cover of cobbly, coarse, loamy sand over single grain, very gravelly and cobbly sand and loamy sand subsoils. The Riverwash Association soils form along the active channels, main washes, and creek beds. Consequently, Riverwash Association soils comprise river-deposited sands, gravels, cobbles, and stones. Ten specific soils can be found within the limits of the Plan Area as outlined in Figure 3.2-3, Soils Map:
NRCS Wind Erodibility Group1
● Soboba stony loamy sand, 2 to 9 percent slopes (SpC); 2
● Hanford Coarse Sandy Loam, 2 to 9 percent slopes (HaC); 3
● Soboba gravelly loamy sand, 0 to 9 percent slopes (SoC); 2
● Soboba-Hanford Families Association (AbD);
● Hanford Sandy Loam, 0 to 2 percent slopes (HbA); 3
● Ramona Sandy Loam (RmC); 3
● Quarries and Pits soils (GP); 2
● Psamments, Fluvents and Frequently flooded soils (Ps); 1
● Tujunga Gravelly Loamy Sand, 0-9 percent slopes (TvC); and 2
● Tujunga Loamy Sand, 0 to 5 percent slopes (TuB). 2
3.2.2.4 Mineral Resources
In general, the Plan Area is not within an area of high mineral resources other than aggregate (BLM Mineral Report, August 2006). There is a very low potential for oil and gas based on the geologic setting of the area; however, high-quality sand, gravel, and aggregate resources are present in the alluvial deposits throughout the Santa Ana River Wash. Large alluvial fans and alluvial wash deposits have developed in the San Bernardino Valley, including the Plan Area. The maximum alluvial thickness in the San Bernardino Valley is 1,200 feet. The thickness varies, generally thinning out in areas adjacent to the
1 Wind erodibility groups are made up of soils that have similar properties affecting their resistance to soil blowing. Soils assigned to group 1 are the most susceptible to soil blowing (Natural Resource Conservation Service).

DEIS/SEIR FOR A PROPOSED HCP AND SECTION 10 PERMIT FOR THE UPPER SANTA ANA RIVER WASH PLAN SECTION 3.2
USFWS/ CONSERVATION DISTRICT 3.2-6 D ECEMBER 2019
San Bernardino Mountains and in upstream areas. The thickness of Holocene alluvium suitable for commercial grade aggregate ranges from 15 to 390 feet (BLM Mineral Report, August 2006).
The entirety of the Plan Area has been classified as MRZ-2, which indicates the likelihood of significant mineral deposits (refer to Figure 3.2-4, Mineral Resource Map). There are currently two active aggregate mining operations within the Plan Area by Cemex and Robertson's. There are no unpatented mining claims within the Plan Area boundary.2
2 http://www.mylandmatters.org/Maps/ClaimsCa/GetMap

SECTION
3.3 HYDROLOGY AND WATER QUALITY
USFWS/ CONSERVATION DISTRICT 3.3-1 D ECEMBER 2019
3.3 HYDROLOGY AND WATER QUALITY
This section describes the existing hydrology in the Plan Area, including the drainages and their associated floodplains, and the groundwater, as well as the water quality of these surface and groundwater bodies.
3.3.1 REGULATORY SETTING
Information regarding, Federal, State, and Local regulations in regards to hydrology can be found in Appendix B.
3.3.1.1 Waters of the US/State
The Santa Ana River and its major tributaries (Mill Creek, Plunge Creek and City Creek) are tributary to the Pacific Ocean, a navigable water, and thus are considered to be waters of the US/State and rivers/streams, subject to United States Army Corps of Engineers (USACE), Regional Water Quality Control Board and California Department of Fish and Wildlife (CDFW) jurisdiction.
A formal jurisdiction delineation has not been conducted for the Plan Area. However, a preliminary assessment of the extent of waters of the Plan Area associated with the Santa Ana River and its major tributaries was prepared. Various data including aerial photographs that show erosional in active channels, topography, and site visits to the area were used to develop the preliminary assessment, represented in Figure 3.4-8, Preliminary Assessment of Waters of the US. Approximately 677 acres of potential jurisdictional waters of the US/streambeds were mapped within the Plan Area and associated with the Santa Ana River, Mill Creek, Plunge Creek and City Creek.
3.3.2 ENVIRONMENTAL SETTING
3.3.2.1 Surface Water
The Plan Area is located in the Upper Santa Ana Watershed. The Santa Ana River is the major surface water body within the Santa Ana Watershed. The Santa Ana River drains an approximately 2,800-square mile area from its headwaters in the San Bernardino National Forest, southwest through San Bernardino County, into Riverside and Orange Counties, and then discharges into the Pacific Ocean through the cities of Huntington Beach and Costa Mesa.
The Santa Ana River comes into the Plan Area from the northeast and continues along the southern boundary of the area. From there, the Santa Ana flows generally southwest to its outlet at the Pacific Ocean. Aside from the Santa Ana River, there are three other drainage courses in or immediately adjacent to the Plan Area (refer to Figure 3.3-1, Surface Hydrology):

USFWS/ CONSERVATION DISTRICT 3.3-2 D ECEMBER 2019
DEIS/SEIR FOR A PROPOSED HCP AND SECTION 10 PERMIT FOR THE UPPER SANTA ANA RIVER WASH PLAN SECTION 3.3
● Plunge Creek;
● City Creek; and
● Mill Creek.
Plunge Creek enters the Plan Area along its northern edge and flows in a westerly direction to its confluence with City Creek west of the 210 freeway. Historically, Plunge Creek turned to the southwest just west of Orange Street until it joined the Santa Ana River. It was diverted west to City Creek to facilitate mining operations. City Creek borders the northwestern edge of the Plan Area, and Mill Creek joins the Santa Ana River to the southeast. Surface water is usually present only after large rainfall events, particularly during the rainy season.
In the 1960s, dry conditions resulted in the over-commitment of water resources in the Santa Ana River watershed which led to lawsuits between water users in the upper and lower portions of the watershed regarding both surface flows and groundwater. The lawsuits culminated in 1969 in the Orange County and Western Judgments. Under the terms of the judgments, San Bernardino Valley Municipal Water District (SBVMWD) became responsible for providing a portion of the specified Santa Ana River base flow to Orange County and for replenishing the San Bernardino Basin Area (SBBA) under certain conditions. If the conditions of either judgment are not met by the natural water supply, including new conservation efforts, SBVMWD is required to deliver supplemental water to offset the deficiency. The judgments resolved the major water rights issues that had prevented the development of long-term, region-wide water supply plans and established specific objectives for the management of the groundwater basins. (IRWMP 2015). Per the judgment, SBVMWD is responsible for an average annual adjusted base flow of 15,250 acre feet at Riverside Narrows, approximately 8.5 miles west of the Plan Area.
3.3.2.2 Existing Flood Conditions
The Plan Area is located within the Upper Santa Ana River Wash and is within 100-year and 500-year floodplains as delineated by the Federal Emergency Management Agency (FEMA); refer to Figure 3.3-1, Surface Hydrology. The 100-year floodplain boundary is generally located within the Plan Area’s northern, southern, and western footprint, as floodplain waters would roughly flow from east to west. The 500-year flood plain boundary is generally located within the Plan Area’s central footprint as floodplain waters would flow from east to west.
The Seven Oaks Dam is located approximately one mile northeast of the Plan Area’s northeast boundary. The dam was constructed to provide flood protection for Orange, Riverside and San Bernardino counties. The reservoir behind the dam has a capacity of 145,600 acre-feet and retains storm water runoff from an area of approximately 177 square miles. During flood events Seven Oaks Dam will store runoff as long as the reservoir of Prado Dam is rising then release the captured water at a rate that does not exceed downstream channel capacity. Seven Oaks Dam is designed to completely contain a “Reservoir Design Flood” of 85,000 cubic feet per second (cfs), corresponding to a 350-year

USFWS/ CONSERVATION DISTRICT 3.3-3 D ECEMBER 2019
DEIS/SEIR FOR A PROPOSED HCP AND SECTION 10 PERMIT FOR THE UPPER SANTA ANA RIVER WASH PLAN SECTION 3.3
flood event, reducing it to a peak outflow of 7,000cfs. In addition, controlled releases from the dam allow about 10,000-acre feet of additional groundwater recharge in the upper Santa Ana River basin each year. Captured floodwater from the Seven Oaks Dam benefits local water districts, as river water costs only a fraction of water imported through the State Water Project.
Table 3.3-1, below, details 100-year flows in the Plan Area for three segments of river: Seven Oaks Dam to Mill Creek, Mill Creek to Orange Street-Boulder Avenue, and Orange Street-Boulder Avenue to Alabama Street.
Table 3.3-1: Plan Area 100-Year Flows
River Segment 100-Year Flows (cubic feet per second) Seven Oaks Dam to Mill Creek 5,500 Mill Creek to Orange Street-Boulder Avenue 25,000 Orange Street-Boulder Avenue to Alabama Street 28,000 Source: Technical Memorandum, Hydrology/Flooding for Upper Santa Ana River Wash Land Management Plan and Habitat Conservation Plan EIR/EIS, prepared by Brown and Caldwell, June 2005.
Levees and other flood control structures have been erected to manage the flows during flooding events in the Plan Area. These features include the following:
● Levee on the south bank of the Santa Ana River;
● Mill Creek levee;
● Plunge Creek levees; and
● City Creek levees.
The San Bernardino County Flood Control District (SBCFCD) maintains the levee along the Santa Ana River from its confluence with Mill Creek to the Alabama Street crossing. A levee on the south side of the Mill Creek extends upstream from its confluence with the Santa Ana River. It is an earth-fill embankment dating from 1960 and contains two stone masonry flood walls. Maintained levees bound the sides of Plunge Creek just upstream of Greenspot Road.
There are small levees and/or drainage structures at various road crossings including at the Orange Street-Boulder Ave crossing over Plunge Creek, and at the upstream and downstream ends of the Alabama Street crossing over City Creek. The channel found at the confluence of City Creek and Plunge Creek requires erosion-prevention maintenance during large storm events.
Beyond the above-mentioned levees, current mining site and water percolation basins have additional levees, berms, and dikes around them to further protect against flooding or to redirect flows.
3.3.2.3 Surface Water Quality
The Santa Ana Region Basin Plan identifies beneficial uses for surface water bodies in which water uses could benefit people and/or wildlife such as drinking, swimming, agricultural, and the support of fresh

USFWS/ CONSERVATION DISTRICT 3.3-4 D ECEMBER 2019
DEIS/SEIR FOR A PROPOSED HCP AND SECTION 10 PERMIT FOR THE UPPER SANTA ANA RIVER WASH PLAN SECTION 3.3
and saline aquatic habitats. Table 3.3-2 summarizes the Basin Plan’s beneficial uses for surface water bodies within, or downstream of, the Plan Area and Table 3.3-3 defines the abbreviated beneficial uses described in Table 3.3-2. The Clean Water Act Section 303(d) requires that states assess the quality of their waters every two years and publish a list of those waters not meeting the water quality standards established for them. Once a waterbody is placed on the 303(d) list of water quality-limited segments, it remains on the list until a Total Maximum Daily Load (TMDL) is adopted and the water quality standards are attained or sufficient data demonstrate that water quality standards have been met and delisting should take place. Reach 4 of the Santa Ana River, located downstream of the Plan Area, is listed as impaired for pathogens as well as Mill Creek Reach 1.
Table 3.3-2: Beneficial Uses and Constituents for Water Bodies within or
Downstream of the Plan Area
Water Body Name 303(d) List Constituents
TMDL Constituents Beneficial uses
Santa Ana Reach 5 -- -- MUN, AGR, GWR, REC1, REC2, WARM, WILD, RARE
Santa Ana Reach 4 Pathogens -- GWR, REC1, REC2, WARM, WILD, SPWN
Mill Creek Reach 1 Pathogens -- MUN*, AGR*, GWR*, REC1*, REC2*, WARM, COLD*, WILD*, RARE*
City Creek -- -- MUN, AGR, GWR, REC1, REC2, COLD, WILD, RARE, SPWN
Plunge Creek -- -- MUN, AGR, GWR, REC1, REC2, COLD, WILD, RARE *Beneficial use is intermittent; Source: Basin Plan, Table 3-1

USFWS/ CONSERVATION DISTRICT 3.3-5 D ECEMBER 2019
DEIS/SEIR FOR A PROPOSED HCP AND SECTION 10 PERMIT FOR THE UPPER SANTA ANA RIVER WASH PLAN SECTION 3.3
Table 3.3-3: Abbreviation Definitions for Beneficial Uses Abbreviation Definition and Use
MUN Municipal and Domestic Supply waters are used for community, military, municipal, or individual water supply systems. These uses may include, but are not limited to, drinking water supply.
IND
Industrial Service Supply waters are used for industrial activities that do not depend primarily on water quality. These uses may include, but are not limited to, mining, cooling water supply, hydraulic conveyance, gravel washing, fire protection, and oil well pressurization.
PROC
Industrial Process Supply waters are used for industrial activities that depend primarily on water quality. These uses may include, but are not limited to, process water supply and all uses of water related to product manufacture or food preparation.
AGR Agricultural Supply waters are used for farming, horticulture, or ranching including. These uses may include, but are not limited to, irrigation, stock watering, and support of vegetation for range grazing.
GWR
Groundwater Recharge waters are used for natural or artificial recharge of groundwater for purposes that may include, but are not limited to, future extraction, maintaining water quality, or halting saltwater intrusion into freshwater aquifers.
REC1
Water Contact Recreation waters are used for recreational activities involving body contact with water, where ingestion of water is reasonably possible. These uses may include, but are not limited to, swimming, wading, water-skiing, skin and scuba diving, surfing, whitewater activities, fishing, and use of natural hot springs.
REC2
Non-Contact Water Recreation waters are used for recreational activities involving proximity to water, but not normally involving body contact with water where ingestion of water would be reasonably possible. These uses may include, but are not limited to, picnicking, sunbathing, hiking, beachcombing, camping, boating, tide pool and marine life study, hunting, sightseeing, and aesthetic enjoyment in conjunction with the above activities.
WARM Warm Freshwater Habitat waters support warm water ecosystems that may include, but not limited to, preservation and enhancement of aquatic habitats, vegetation, fish and wildlife, including invertebrates.
COLD Cold Freshwater Habitat waters support cold water ecosystems that may include, but are not limited to, preservations and enhancement of aquatic habitats, vegetation, fish and wildlife, including invertebrates.
WILD Wildlife Habitat waters that support terrestrial ecosystems including, but not limited to, preservation and enhancement of vegetation and prey species used by waterfowl and other wildlife.
RARE
Rare, Threatened or Endangered Species waters that support habitats necessary, at least in part, for the survival and successful maintenance of plant or animal species established under State or Federal law as rare, threatened or endangered.
SPWN Spawning, Reproduction and/or Early Development waters that support high quality aquatic habitats suitable for reproduction and early development of fish and wildlife.
Source: Basin Plan, Chapter 3
Once beneficial uses are identified in the Basin Plan, objectives for the quality of the water bodies are established to protect the beneficial uses. Table 3.3-4 summarizes the Basin Plan’s numeric water quality objectives for the bodies within, or downstream of, the Plan Area.
Table 3.3-4: Water Quality Objectives for Water Bodies within or Downstream of the Plan Area
Watershed/Stream
Reach
Total Dissolved
Solids (mg/L)
Hardness
(mg/L)
Sodium (mg/L)
Chloride (mg/L)
Total Inorganic Nitrogen
(mg/L)
Sulfate (mg/L)
Chemical Oxygen Demand (mg/L)
Santa Ana Reach 5 300 190 30 20 5 60 25 Santa Ana Reach 4 550 - - - 10 - 30 Mill Creek Reach 1 200 100 30 10 1 20 5 City Creek 200 115 30 10 1 20 5 Plunge Creek 200 100 30 10 20 5 Source: Basin Plan, Table 4-1

USFWS/ CONSERVATION DISTRICT 3.3-6 D ECEMBER 2019
DEIS/SEIR FOR A PROPOSED HCP AND SECTION 10 PERMIT FOR THE UPPER SANTA ANA RIVER WASH PLAN SECTION 3.3
Groundwater
The 1969 Western-San Bernardino Judgment defines an area known as the San Bernardino Basin Area (SBBA). This area is defined as the “area above Bunker Hill Dike [San Jacinto fault], but excluding certain mountainous regions and the Yucaipa, San Timoteo, Oak Glen and Beaumont Basins.” The SBBA traditionally refers to two groundwater subbasins – Bunker Hill and Lytle Creek. The Plan Area is located in the Bunker Hill Subbasin. The Bunker Hill Subbasin (8-002.06) is the largest subbasin in the upper Santa Ana River Watershed. The basin is bordered on the northwest by the San Gabriel Mountains and the Cucamonga fault zone; on the northeast by the San Bernardino Mountains and the San Andreas Fault zone; on the east by the Banning fault and Crafton Hills; and on the south by a low, east-facing escarpment of the San Jacinto fault and the San Timoteo Badlands (IRWMP 2015).
The entire SBBA has a surface area of approximately 141 square miles (90,000 acres) and lies between the San Andreas and San Jacinto faults. The numerous faults surrounding the SBBA impede the movement of groundwater and produce springs and high water table in several areas. The SBBA is uniquely constrained by shallow groundwater levels when the basin is too full and poses a liquefaction hazard. Groundwater in the Bunker Hill Subbasin generally flows in a southwesterly direction from the San Bernardino Mountains to the Riverside Narrows. The San Jacinto fault generally runs perpendicular to the groundwater flow and acts as a partial barrier resulting in water level differences across the fault. For the basin as a whole, wide fluctuations in the average depth to groundwater occur from year to year, with annual changes as great as almost 40 feet. However, for the most part, annual changes register less than ± 20 feet , with only six years exceeding this range (IRWMP 2015).
The Conservation District has five groundwater wells in the Plan Area to monitor groundwater levels. Based on data collected by the Conservation District from these five monitoring wells in the Plan Area from 2006 until present, groundwater depths range from the shallowest depth recorded at 14 feet below ground level to the deepest depth recorded at 336 feet below ground level in the Plan Area. However most of the recorded groundwater levels fall within the range of 100-300 feet below ground level.
Historically, the Bunker Hill Groundwater Basin has been recharged from infiltration of runoff from the San Gabriel and San Bernardino Mountains. The Santa Ana River, Mill Creek, and Lytle Creek contribute more than 60 percent of the total percolating recharge to the groundwater basin. Lesser contributions come from Lytle Creek, Cajon Creek, San Timoteo Creek, and most of the creeks flowing southward out of the San Bernardino Mountains. The subbasin is also replenished by deep percolation of water from precipitation and resulting runoff, percolation from delivered water, and water spread in streambeds and spreading grounds. The total groundwater storage capacity of the Bunker Hill Groundwater Basin is estimated at 5,976,000 acre-feet (an acre-foot of water is equivalent to 325,851 gallons) (IRWMP 2015).
Groundwater Wells
The City of Redlands and EVWD operate municipal wells within the Plan Area. The City of Redlands operates three wells along Orange Street producing a combined average of 4,500 AF per year. EVWD

USFWS/ CONSERVATION DISTRICT 3.3-7 D ECEMBER 2019
DEIS/SEIR FOR A PROPOSED HCP AND SECTION 10 PERMIT FOR THE UPPER SANTA ANA RIVER WASH PLAN SECTION 3.3
operates the Plant 125 well in the middle of the Plan Area near the Groundwater Recharge Operations. This well produces an average of 1,100 AF per Year (District 2019).
Existing Cemex operations utilize groundwater from two wells within the Plan Area. One well is located at the Orange Street aggregate plant site and the other is at the Alabama Street ready mix plant site. The Orange Street well is currently used for aggregate processing and dust control and also supplies water to all faucets and toilets within these areas. Based on Cemex estimates, these uses amount to approximately 2,030 acre-feet of water from this well. The Alabama Street well is currently used for batching concrete and dust control and also supplies water to faucets and toilets at the Alabama Street ready mix plant. Approximately 190 acre-feet of water is used on a yearly basis from this well. Total existing water use from Cemex operations is approximately 2,220 acre-feet per year (District 2008).
Water for current Robertson’s operations are supplied from two existing wells within the Planning area. The well supplying the East Basin processing plant is located just north of the plant adjacent to Plunge Creek and currently produces approximately 350 acre-feet per year for aggregate processing. The well supplying water to the batch plant uses approximately 15 acre-feet per year. Total existing water use from Robertson’s is approximately 365 acre-feet per year (District 2008).
Table 3.3-5: Existing Cemex and Robertson’s Operations Water Use
Mining Operator Well Water Use (AFY)
Cemex Orange Street Aggregate Plant Site 2,030 Alabama Street Ready Mix Plant Site 190
Cemex Total 2,220
Robertson’s East Basin Processing Plant 350 Batch Plant 15
Robertson’s Total 365 Source: District 2008
3.3.2.4 Groundwater Quality and Management
Groundwater quality varies among the Region’s groundwater basins, particularly in the subbasins of the Upper Santa Ana River Watershed due to geology, faulting patterns, recharge points, and anthropogenic sources of contamination. Groundwater in the SBBA is generally a calcium-bicarbonate type, containing equal amounts (on an equivalent basis) of sodium and calcium in water near the land surface and an increasing predominance of sodium in water from deeper parts of the valley-fill aquifer. A Total Dissolved Solids (TDS) range of 150 to 550 milligrams per liter (mg/L), with an average of 324 mg/L, is found in public supply wells (IRWMP 2015).
Five major groundwater contaminant plumes affect the SBBA. Plumes in the basin include (1) the Crafton-Redlands plume, with trichloroethylene (TCE) and lower levels of perchlorethylene (PCE), debromochloropropane (DBCP) and perchlorate; (2) the Norton Air Force Base TCE and PCE plume, stretching 2.5 miles from its source and contaminating 100,000 AF of groundwater; (3 and 4) the Muscoy and Newmark plumes near the Shandon Hills, which are Superfund sites with TCE and PCE; and (5) the Santa Fe plume with PCE, TCE, and 1,2 dichloroethylene (1,2-DCE) contamination (IRWMP 2015).

USFWS/ CONSERVATION DISTRICT 3.3-8 D ECEMBER 2019
DEIS/SEIR FOR A PROPOSED HCP AND SECTION 10 PERMIT FOR THE UPPER SANTA ANA RIVER WASH PLAN SECTION 3.3
The groundwater rights to pump from the Bunker Hill Groundwater Basin were determined through adjudication in the 1969 case, Western Municipal Water District of Riverside County et al., v. East San Bernardino County Water District et al., Riverside Superior Court, Case No. 78426. The water adjudication of the Bunker Hill Groundwater Basin set the annual groundwater pumping safe-yield to 232,100 acre-feet of water per year (AFY). Per the water adjudication, waters users are permitted to pump as much ground water as needed. Groundwater pumped in excess of the safe-yield must be recharged back into the groundwater basin by the Conservation District. Typically, the Conservation District utilizes imported water from State Water Project to recharge the basin. The water judgment does not require that the Bunker Hill Groundwater Basin have the same-year recharge, therefore, allowing the parties of the judgment, to pump more during dry years and recharge during wet years.
The Conservation District operates the San Ana River Spreading Grounds in the Plan Area, consisting of 16 percolation basins that use low flows from the Santa Ana River, see Figure 2.0-1 Covered Activity CD.01. The Bunker Hill Groundwater Subbasin is recharged both naturally (rainfall and stream flow) and artificially (imported water from State Water Project). This recharge occurs primarily in the rainy season when both the Santa Ana River and Mill Creek are flowing. Water users immediately adjacent to the Plan Area include the City of Redlands, the East Valley Water District (EVWD), and the City of San Bernardino.
Similar to the Basin Plan’s water quality objectives of water bodies, the Basin Plan also establishes objectives for groundwater zones. The Plan Area is located in the Groundwater Management Zone B of the Bunker Hill Basin, as shown in Figure 3.3-2, Groundwater Basin. Per the Santa Ana Region Basin Plan (1995 as amended), the Bunker Hill Groundwater Basin is divided into the following six management zones: Lytle, Bunker Hill-A, Bunker Hill-B, San Timoteo, Yucaipa, and Beaumont. Table 3.3-6 summarizes the Bunker Hill B Groundwater Basin’s water quality objectives.
Table 3.3-6: Water Quality Objectives for Groundwater Basin Relative to the Plan Area
Groundwater Management
Zone
Total Dissolved
Solids (mg/L)
Hardness (mg/L)
Sodium (mg/L)
Chloride (mg/L)
Nitrate as Nitrogen
(mg/L)
Sulfate (mg/L)
Bunker Hill – B 330 - - - 7.3 - Source: Basin Plan, Table 4-1
SECTION
3.4 BIOLOGICAL RESOURCES
USFWS / CONSERVATION DISTRICT 3.4-1 D ECEMBER 2019
3.4 BIOLOGICAL RESOURCES
This section describes the affected environment for biological resources1. The existing biological conditions are presented for the Plan Area, which includes all lands involved in the land exchange in addition to a portion of BLM Parcel 108-081 that is proposed to be designated as an Area of Critical Environmental Concern (ACEC), as well as all lands covered by the Plan Area. The Plan Area is located on an alluvial plain and encompasses approximately 4,892.2 acres, extending approximately six miles westward from Greenspot Road in the City of Highland to Alabama Street in the City of Redlands. The Plan Area contains both public and private lands supporting a variety of uses, including mining, water conservation, water wells and infrastructure, trails, transportation, agriculture, and preserved areas for listed species.
3.4.1 REGULATORY SETTING
Federal, state, and local regulations pertaining to biological resources can be found in Appendix B.
3.4.2 VEGETATION COMMUNITIES AND LAND COVER TYPES
Eight primary vegetation and land covers have been identified onsite. In addition, seral stages of Riversidian Alluvial Fan Sage Scrub (RAFSS) have been identified along with an indication of non-native grass abundance, which is of particular importance to SBKR habitat quality. Table 3.4-1 lists the acres of each vegetation or land cover type in the Plan Area as outlined in the HCP. For a detailed description of each vegetation or land cover type, refer to the Biological Resources Section C.3 of Appendix C. Figure 3.4-2, Vegetation Communities, shows the distribution of vegetation types in the Plan Area.
1 For the purposes of this analysis, “biological resources” include terrestrial and aquatic plants, wildlife, and habitats that occur, or have the potential to occur, within the Proposed Action defined Plan Area.

USFWS / CONSERVATION DISTRICT 3.4-2 D ECEMBER 2019
DEIS/SEIR FOR A PROPOSED HCP AND SECTION 10 PERMIT FOR THE UPPER SANTA ANA RIVER WASH PLAN SECTION 3.4
Table 3.4-1: Vegetation and Land Cover Types in the Plan Area Vegetation community / land cover types Acres
Riversidean Alluvial Fan Sage Scrub - Pioneer 470.9
Riversidean Alluvial Fan Sage Scrub - Intermediate 1,129.7
Riversidean Alluvial Fan Sage Scrub - Intermediate/Mature 1,057.8
Riversidean Alluvial Fan Sage Scrub - Mature 428.6
Riversidean Alluvial Fan Sage Scrub - Mature/Non-Native Grassland 109.2
Riversidean Upland Sage Scrub (RSS) 9.4
Chamise Chaparral 108.2
Willow Thickets 11.3
Mule fat Scrub 1.4
Aquatic Vegetation 0.2
Non-Native Grassland (NNG) 156.3
Perennial Pepper Weed 21.1
Tamarisk Thickets 30.0
Recharge Basin 68.9
Active Sedimentation Basin 2.9
Developed/ Disturbed 1,286.4
Total 4,892.2
3.4.3 GENERAL WILDLIFE
The Plan Area supports diverse wildlife species associated with chaparral, grassland, and alluvial fan sage scrub habitats. Common species include California ground squirrel (Spermophilus beecheyi), woodrat species (Neotoma sp.), desert cottontail (Sylvilagus audubonii), California side-blotched lizard (Uta stansburiana elegans), checkered white butterfly (Pontia protodice), and California horned lark (Eremophila alpestris actia), Painted lady (Vanessa cardui), western fence lizard (Sceloporus occidentalis), California side-blotched lizard (Uta stansburiana elegans), California quail (Callipepla californica), common raven (Corvus corax), California scrubjay (Aphelocoma californica), wrentit (Chamaea fasciata), mule deer (Odocoileus hemionus), and raccoon (Procyon lotor).
3.4.4 CALIFORNIA SPECIAL STATUS PLANT SPECIES
Twenty-six special status plant species have the potential to occur within the Plan Area and vicinity based on the species habitat requirements and documented distribution. Table 3.4-2, Special Status Plant Species Potentially Occurring within the Plan Area, summarizes the special status plant species and their potential to occur within the Plan Area. Two state and federally listed plant species, Santa Ana

USFWS / CONSERVATION DISTRICT 3.4-3 D ECEMBER 2019
DEIS/SEIR FOR A PROPOSED HCP AND SECTION 10 PERMIT FOR THE UPPER SANTA ANA RIVER WASH PLAN SECTION 3.4
River woolly star (Eriastrum densifolium ssp. sanctorum) and slender-horned spineflower (Dodecahema leptoceras), occur in the Plan Area.
Twenty of the twenty-six special status plant species that may occur within the Plan Area were determined to have an absent or low potential for occurrence because their distribution was restricted by substantive habitat requirements that are absent or negligible within the Plan Area. The remaining six plants, Parry's spineflower (Chorizanthe parryi var. parryi), Plummer’s mariposa-lily (Calochortus plummerae), Robinson’s peppergrass (Lepidium virginicum var. robinsonii), Santa Ana River woolly star (Eriastrum densifolium ssp. sanctorum), slender-horned spineflower (Dodecahema leptoceras, spineflower), and California spineflower (Mucronea californica) were determined to be present or have a moderate or high potential for occurrence due to the presence of suitable habitat within the Plan Area.

DEIS/SEIR FOR A PROPOSED HCP AND SECTION 10 PERMIT FOR THE UPPER SANTA ANA RIVER WASH PLAN SECTION 3.4
USFWS / CONSERVATION DISTRICT 3.4-4 D ECEMBER 2019
Table 3.4-2: Special Status Plant Species Potentially Occurring within the Wash Plan HCP Area Scientific Name Common Name Habitat and Distribution Flowering
Season Status Designation Potential to Occur
Arenaria paludicola Marsh sandwort
Stoloniferous herb. Occurs in freshwater or brackish marshes or swamps. From 3 to 170 m in elevation.
May – Aug Fed: FE State: SE CRPR: 1B.1
ABSENT
Berberis nevinii Nevin’s barberry
Evergreen shrub. Occurs in chaparral, cismontane woodland, coastal and riparian scrub. From 274 to 825 m in elevation. The site is outside the expected range of the species. Nearest location of natural population is in canyons <4 miles to the southwest of the Plan Area. Species not known from Plan Area.
Mar – Jun Fed: FE Fed: SE CRPR: 1B.1
LOW
Calochortus plummerae Plummer’s mariposa-lily
Bulbiferous herb. Occurs in chaparral, cismontane woodland, coastal scrub, lower montane coniferous forests, and valley and foothill grasslands. From 100 to 1,700 m in elevation. Species is known from the Plan Area.
May – Jul Fed: None State: None CRPR: 4.2
PRESENT
Caulanthus simulans Payson’s jewelflower
Annual herb. Occurs in chaparral and coastal scrub. From 90 to 2,200 m in elevation.
Mar – May Fed: None State: None CRPR: 4.2
ABSENT
Carex comosa Bristly sedge
Bogs and fens, freshwater marshes and swamps, and lake margins below 425 m. Known from Lake, San Bernardino, Santa Cruz, San Francisco, Shasta, San Joaquin, and Sonoma Counties, and Idaho, Oregon, and Washington. The last known occurrence of this species in San Bernardino County was in 1882 and is believed extirpated. No marshes or similar habitats in the Plan Area.
May – Sep Fed: None State: None CRPR: 2B.1
ABSENT
Centromadia pungens ssp. laevis Smooth tarplant
Annual herb. Grows within valley and foothill grassland, chenopod scrub, meadows, playas, and riparian woodland. Microhabitats include alkali meadow, alkali scrub, and also in disturbed places. From 0-480 m in elevation. No alkaline soils in the Plan Area.
Apr – Sep Fed: None State: None CRPR: 1B.1
ABSENT
Chorizanthe parryi var. parryi Parry's spineflower
Annual herb. Occurs within coastal scrub and chaparral on dry slopes and flats; sometimes at interface of 2 vegetation types, such as chaparral and oak woodland. Found on dry sandy soils. From 40- 1705 m in elevation.
Species is known in the Plan Area. Species prefers open/sandy gravelly soils clear of non-native species with occasional flooding.
Apr – Jun Fed: None State: None CRPR: 1B.1
PRESENT
Cordylanthus maritimus ssp. maritimus Salt marsh bird’s-beak
Hemi parasitic annual herb. Occurs in coastal dunes, marshes, and swamps. Up to 30 m in elevation.
May – Oct Fed: FE State: SE CRPR: 1B.2
ABSENT

DEIS/SEIR FOR A PROPOSED HCP AND SECTION 10 PERMIT FOR THE UPPER SANTA ANA RIVER WASH PLAN SECTION 3.4
USFWS / CONSERVATION DISTRICT 3.4-5 D ECEMBER 2019
Scientific Name Common Name Habitat and Distribution Flowering
Season Status Designation Potential to Occur
Dodecahema leptoceras slender-horned spineflower
Annual herb. Occurs within chaparral and coastal scrub (alluvial fan sage scrub). Found on flood-deposited terraces and washes; associates include Encelia, Dalea, Lepidospartum, etc. From 200-760 m in elevation. Species is known from the Plan Area.
Apr – Jun Fed: FE State: SE CRPR: 1B.1
PRESENT
Dudleya multicaulis Many-stemmed dudleya
Perennial herb. Occurs in coastal scrub, chaparral, and valley and foothill grassland, usually on clay soils or grassy slopes. Up to 2,590 feet in elevation.
Apr – Jul Fed: None State: None CRPR: 1B.2
LOW
Eriastrum densifolium ssp. sanctorum Santa Ana River woolly star
Perennial herb. Occurs in chaparral and sandy or gravelly coastal scrub. From 299 to 2,001 feet in elevation. Species is known from the Plan Area.
May – Sep Fed : FE State : SE CRPR: 1B.1
PRESENT
Helianthus nuttallii ssp. parishii Los Angeles sunflower
Rhizomatous herb. Occurs in coastal salt and freshwater marshes and swamps. From 33 to 5,495 feet in elevation. The Plan Area does not contain suitable habitat.
Aug – Oct Fed: None State: None CRPR: 1A
ABSENT
Horkelia cuneata ssp. puberula Mesa horkelia
Sandy or gravelly soils in chaparral, or rarely in cismontane woodland or coastal scrub at 70 to 825 meters elevation. Known from San Luis Obispo, Santa Barbara, Los Angeles, and Orange Counties. Believed extirpated from Ventura, San Bernardino, Riverside, and San Diego Counties. Known only from the site vicinity. Believed extirpated from the region.
Feb – Jul (Sep) (uncommon)
Fed: None CA: None CRPR: 1B.1
ABSENT
Imperata brevifolia California satintail
Rhizomatous herb. Occurs in chaparral, coastal scrub, Mojave desert scrub, meadows and seeps (often alkali), and riparian scrub. Up to 500 m in elevation. Marginal habitat in Plan Area. Found just west of the project area.
Sep – May Fed: None State: None CRPR: 2.B1
LOW
Lepidium virginicum var. robinsonii Robinson’s pepper-grass
Annual herb. Occurs in chaparral and coastal scrub. From 1 to 885 m in elevation. Known from the Plan Area.
Jan – Jul Fed: None State: None CRPR: 4.3
PRESENT
Lycium parishii Parish’s desert-thorn
Deciduous shrub of coastal scrub and Sonoran desert scrub at 305 to 1,000 m elevation. In California, known from Imperial and San Diego Counties. Known only historically from San Bernardino County (benches and/or foothills north of San Bernardino). Nearest occurrence was from 1885, approximately 10 miles from the Plan Area. Believe extirpated from the region.
Mar – Apr Fed: None State: None CRPR: 2B.3.3
ABSENT

DEIS/SEIR FOR A PROPOSED HCP AND SECTION 10 PERMIT FOR THE UPPER SANTA ANA RIVER WASH PLAN SECTION 3.4
USFWS / CONSERVATION DISTRICT 3.4-6 D ECEMBER 2019
Scientific Name Common Name Habitat and Distribution Flowering
Season Status Designation Potential to Occur
Malacothamnus parishii Parish’s bush-mallow
Deciduous shrub. Occurs in chaparral and coastal scrub. From 305 to 455 m in elevation. Known only historically from site vicinity. Presumed extinct.
Jun – Jul Fed: None State: None CRPR: 1A
LOW
Monardella macrantha ssp. hallii Hall’s monardella
Rhizomatous herb. Occurs in broad-leaved upland forests, chaparral, cismontane woodland, lower montane coniferous forests, and valley and foothill grasslands. From 730 to 2,195 m in elevation.
Jun – Aug Fed: None State: None CRPR: 1B.3
ABSENT
Monardella pringlei Pringle’s monardella
Sandy hills in coastal sage scrub at 300 to 400 m elevation. Known only from two occurrences west of Colton. Nearest record approximately 8 miles from Plan Area. Last seen in 1941. Habitat in Plan Area marginal or absent. Presumed extinct.
May – Jun Fed: None State: None CRPR: 1A
ABSENT
Mucronea californica California spineflower
Annual herb. Known from the plan area. Mar - Jul Fed: None State: None CRPR: 4.2
PRESENT
Phlox dolichantha Big Bear Valley phlox
Perennial herb. Occurs in pebble plain and upper montane coniferous forests. From 1,830 to 2,970 meters.
May – Jul Fed: None State: None CRPR: 1B.2
ABSENT
Ribes divaricatum var. parishii Parish’s gooseberry
Deciduous shrub. Occurs in riparian woodland. From 54 to 300 m in elevation.
Feb – Apr Fed: None State: None CRPR: 1A
ABSENT
Nasturtium gambelii Gambel’s watercress
Freshwater or brackish marshes and swamps; 5 to 330 m elevation. Known from Los Angeles, Orange, San Diego, and San Luis Obispo Counties and Baja California. No marshes or swamp in the Plan Area.
Apr – Oct Fed: FE State: ST CRPR: 1B.1
ABSENT
Sidalcea hickmanii ssp. parishii Parish’s checkerbloom
Perennial herb. Occurs in chaparral, cismontane woodland, and lower montane coniferous forests. From 100 to 2,499 m in elevation.
Jun – Aug Fed: None State: SR CRPR: 1B.2
LOW
Sidalcea neomexicana Salt spring checkbloom
Alkaline springs and marshes below 1,530 meters elevation. In California, known only from Los Angeles, Orange, Riverside, Santa Barbara, San Bernardino, and Ventura Counties. No alkaline springs or mashes in the Plan Area.
Mar – Jun Fed: None State: None CRPR: 2B.2
ABSENT

DEIS/SEIR FOR A PROPOSED HCP AND SECTION 10 PERMIT FOR THE UPPER SANTA ANA RIVER WASH PLAN SECTION 3.4
USFWS / CONSERVATION DISTRICT 3.4-7 D ECEMBER 2019
Scientific Name Common Name Habitat and Distribution Flowering
Season Status Designation Potential to Occur
Sphenopholis obtusata Prairie wedge grass
Cismontane woodland, meadows and seeps/mesic, in elevations ranging from 300 to 2,000 m, in Amador, Fresno, Inyo, Mono, Riverside, San Bernardino, and Tulare Counties. No woodlands, meadows, or seeps in Plan Area.
Apr – Jul Fed: None State: None CRPR: 2B.2
ABSENT
Symphyotrichum defoliatum San Bernardino aster
Cismontane woodland, coastal scrub, lower montane coniferous forest, meadows and seeps, marshes and swamps, valley and foothill grasses (vernally mesic) near ditches, streams, springs. No records of recent occurrences in the vicinity of the Plan Area. Habitat in Plan Area is marginal or absent.
Jul-Nov CRPR: 1B LOW
Federal designations: (FESA, USFWS): FE: Federally listed endangered California Rare Plant Ranking (CRPR) Designations; List 1A: Plants presumed extinct in California and either rare or extinct elsewhere. List 1B: Plants rare, threatened, or endangered in California and elsewhere. List 1B plant species are designated BLM Sensitive. List 2A: Plants presumed extirpated in California, but common elsewhere List 2B: Plants rare, threatened, or endangered in California, but more common elsewhere List 3: Plants about which we need more information; a review list. List 4: Plants of limited distribution; a watch list. State designations: (CESA, CDFW) SE: State listed endangered ST: State listed threatened SR: State listed rare SC: State candidate for listing Threat Ranks: .1: Seriously endangered in California (over 80 percent of occurrences threatened / high degree and immediacy of threat). .2: Moderately threatened in California (20-80 percent occurrences threatened/ moderate degree and immediacy of threat). .3: Not very threatened in California (<20 percent of occurrences threatened/ low degree and immediacy of threat or no current threats known). Sources: 1. Calflora: Information on California plants for education, research and conservation, with data contributed by public and private institutions and individuals, including the Consortium of California Herbaria. [Web application]. 2017. Berkeley, California: The Calflora Database [a non-profit organization]. Available: http://www.calflora.org/ (Accessed: Feb 09, 2017) 2. California Natural Diversity Database (CNDDB). 2017. State & Federally Listed Endangered & Threatened Plants of California. February 2017.

USFWS / CONSERVATION DISTRICT 3.4-8 D ECEMBER 2019
DEIS/SEIR FOR A PROPOSED HCP AND SECTION 10 PERMIT FOR THE UPPER SANTA ANA RIVER WASH PLAN
SECTION 3.4
3.4.5 SPECIAL STATUS WILDLIFE SPECIES
Forty-two special status wildlife species may occur within the Plan Area. Table 3.4-3, Special Status Wildlife Species Potentially Occurring within the Wash Plan HCP Area, summarizes special status wildlife species and their potential to occur within the Plan Area and vicinity based on the species habitat requirements and documented distribution. Two federally listed wildlife species, coastal California gnatcatcher and SBKR, occur within the Plan Area.
Twenty-one of the forty-one special status wildlife species that may occur within the Plan Area were determined to be absent or have a low potential for occurrence because their distribution was restricted by substantive habitat requirements that are absent or negligible within the Plan Area. The remaining twenty wildlife species, including American badger, Bell’s sparrow, coastal California gnatcatcher, California horned lark, coast (San Diego) horned lizard, coastal western whiptail, golden eagle, loggerhead shrike, Los Angeles pocket mouse, orange-throated whiptail, northern red-diamond rattlesnake, northwestern San Diego pocket mouse, SBKR, San Diego black-tailed jackrabbit, San Diego desert woodrat, short-eared owl, silvery legless lizard, western mastiff bat, western spadefoot, and white-tailed kite, were determined to be present or have a moderate or high potential for occurrence due to the presence of suitable habitat for these species within the Plan Area.
Ten special status species were directly observed during the 2008 surveys: 1) California horned lark; 2) coastal California gnatcatcher; 3) coastal western whiptail; 4) cactus wren 5) San Diego black-tailed jackrabbit; 6) SBKR; 7) northwestern San Diego pocket mouse; 8) American badger; 9) San Diego desert woodrat; and 10) short-eared owl.

DEIS/SEIR FOR A PROPOSED HCP AND SECTION 10 PERMIT FOR THE UPPER SANTA ANA RIVER WASH PLAN SECTION 3.4
USFWS / CONSERVATION DISTRICT 3.4-9 D ECEMBER 2019
Table 3.4-3: Special Status Wildlife Species Potentially Occurring within the Wash Plan HCP Area Scientific Name Common Name
Habitat Description Status
Designation Probability of Occurrence
Invertebrates Carolella busckana Busck’s gallmoth
Habitat requirements unknown. Only known occurrence from Plan Area vicinity was in Loma Linda and is believed to have been extirpated.
Fed: None State: None
LOW
Rhaphiomidas terminatus abdominalis Delhi sands flower-loving fly
Restricted to Delhi series sands in western Riverside and San Bernardino Counties. No Delhi sands soils in Plan Area.
Fed: FE State: SSC
ABSENT
Fish Catostomus santaanae Santa Ana sucker
Clear, cool rocky pools and runs of creeks and small to medium rivers. Generally, it is associated with coarse substrates of boulder, rubble, and gravel, but sometimes it occurs on sand/mud bottoms. It prefers permanent streams with pools and riparian vegetation that provide cover and refuge from floods.
The Santa Ana sucker’s historical range includes the Los Angeles, San Gabriel, and Santa Ana River drainage systems located in southern California. An introduced population also occurs in the Santa Clara River drainage system in southern California. Critical habitat present but no individual animals because there is no perennial water in Plan Area. The active channel of the Santa Ana River is a source of coarse sediment for downstream reaches.
Fed: FT State: SSC
ABSENT
Gila orcuttii Arroyo chub
Perennial streams or intermittent streams with permanent pools; slow water sections of streams with mud or sand substrates; spawning occurs in pools.
Native to Los Angeles, San Gabriel, San Luis Rey, Santa Ana, and Santa Margarita River systems; introduced in Santa Ynez, Santa Maria, Cuyama, and Mojave River systems and smaller coastal streams. No individual animals because there is no perennial water in the Plan Area.
Fed: None State: SSC
ABSENT
Rhinichthys osculus ssp. Santa Ana speckled dace
Found in the headwaters of the Santa Ana and San Gabriel River drainages. Speckled dace occupies many isolated western drainages and have diversified into numerous subspecies, with those in swift water taking on streamlined forms, while those in slower water are relatively chubby and small finned. No individual animals because there is no perennial water in the Plan Area.
Fed: None State: SSC
ABSENT

DEIS/SEIR FOR A PROPOSED HCP AND SECTION 10 PERMIT FOR THE UPPER SANTA ANA RIVER WASH PLAN SECTION 3.4
USFWS / CONSERVATION DISTRICT 3.4-10 D ECEMBER 2019
Scientific Name Common Name
Habitat Description Status
Designation Probability of Occurrence
Amphibians and reptiles Spea (=Scaphiopus) hammondii Western spadefoot
Prefers open areas with sandy or gravelly soils, in a variety of habitats including mixed woodlands, grasslands, coastal sage scrub, chaparral, sandy washes, lowlands, river floodplains, alluvial fans, playas, alkali flats, foothills and mountains.
Occurs in the Central Valley and adjacent foothills, the non-desert areas of southern California, and in Baja California. Observed in Plan Area.
Fed: None State: SSC BLM: S
PRESENT
Anniella pulchra pulchra Silvery legless lizard
Most common in coastal dune, valley-foothill, chaparral, and coastal sage scrub. Associated with friable soils with some moisture content and some vegetative cover. Has a broad thermal tolerance. Species was observed in Plan Area.
Fed: None State: SSC
PRESENT
Aspidoscelis tigris stejnegeri Coastal western whiptail
Wide variety of habitats including coastal sage scrub, sparse grassland, and riparian woodland; coastal and inland valleys and foothills; Ventura County to Baja California. Relatively widespread and common.
Fed: None State: SSC
PRESENT
Crotalus ruber ruber Northern red-diamond rattlesnake
Desert scrub, thornscrub, open chaparral and woodland; occasional in grassland and cultivated areas. Prefers rocky areas and dense vegetation. Morongo Valley in San Bernardino and Riverside Counties to Baja California. Relatively widespread and common.
Fed: None State: SSC
HIGH
Diadophis punctatus modestus San Bernardino ringneck snake
Occurs in open relatively rocky areas often in moist microhabitats near intermittent streams. Found along the southern California coast from the Santa Barbara area south along the coast to San Diego County, and inland into the San Bernardino Mountains. Suitable mesic chaparral and oak and walnut woodland communities not present in the Plan Area.
Fed: None CA: None
ABSENT
Phrynosoma coronatum (blainvillii population) Coast (San Diego) horned lizard
Occurs in wide variety of habitats including coastal sage scrub, chaparral, grassland, coniferous forest, riparian, oak woodland, and the margins of the higher elevation desert where it is restricted to the juniper-desert chaparral. Is known from the Plan Area.
Fed: None State: SSC BLM: S
PRESENT
Thamnophis hammondii Two-striped garter snake
Highly aquatic, found in or near permanent fresh water. Often along streams with rocky beds and riparian growth. Occurs from Coastal California from the vicinity of Salinas to northwest Baja California. From sea level to about 7,000 feet in elevation. No perennial water in the Plan Area.
Fed: None State: SSC BLM: S
LOW

DEIS/SEIR FOR A PROPOSED HCP AND SECTION 10 PERMIT FOR THE UPPER SANTA ANA RIVER WASH PLAN SECTION 3.4
USFWS / CONSERVATION DISTRICT 3.4-11 D ECEMBER 2019
Scientific Name Common Name
Habitat Description Status
Designation Probability of Occurrence
Birds
Accipiter cooperii Cooper’s hawk
Primarily forests and woodlands throughout North America. Increasingly common in urban habitats. Nests in tall trees, especially pines. Occasionally nests in isolated trees in more open areas. Marginally suitable habitat is present for nesting. This species has been observed foraging in the Plan Area.
Fed: None State: WL
LOW (nesting). Marginally suitable habitat is present for nesting. PRESENT (foraging).
Aimophila ruficeps canescens Southern California rufous-crowned sparrow
Resident in southern California coastal sage scrub and sparse mixed chaparral. Frequents relatively steep, often rocky hillsides with grass & forb patches. Species is known from the Plan Area.
Fed: None State: None
PRESENT
Amphispiza belli belli Bell’s sparrow
(Nesting) Occupies chaparral and coastal sage scrub from west central California to northwestern Baja California. Prefers semi-open habitats with evenly spaced shrubs 1-2 m high. Species is known from the Plan Area.
Fed: None State: None
PRESENT
Aquila chrysaetos Golden eagle
(Nesting and Wintering) Generally open country of the Temperate Zone worldwide. Nesting primarily in rugged mountainous country. Uncommon resident in southern California. Nesting habitat is not present within the Plan Area. This species has been observed flying over the Plan Area and probably uses it for foraging.
Fed: None State: FP BLM: S
LOW (nesting) PRESENT (foraging)
Asio flammeus Short-eared owl
(Nesting) Occurs in flat, open lands including grasslands. The short-eared owl occurs on all continents except Antarctica and Australia; thus, it has one of the largest distributions of any bird. Nests are concealed by low vegetation, usually situated in the shelter of a grass mound, under a grass tuft, or among herbaceous ground cover. A short-eared owl was seen in the Plan Area during biological surveys but the Plan Area is outside the breeding range.
Fed: None State: None
PRESENT
Athene cunicularia Burrowing owl
(Burrow sites and some wintering sites) Open annual grasslands or perennial grasslands, deserts, and scrublands characterized by low-growing vegetation. Dependent upon burrowing mammals (especially California ground squirrel) for burrows. The burrowing owl is known from the site.
Fed: None State: None BLM: S
PRESENT
Campylorhynchus brunneicapillus Cactus wren
Found in California east to Texas, extending south through Baja California and mainland Mexico. The cactus wren is a non-migratory resident and occurs along the alluvial plains of the Santa Ana River, Plunge Creek, and Mill Creek.
Fed: None State: SSC
PRESENT
Coccyzus americanus occidentalis Western yellow-billed cuckoo
(Nesting) Inhabits riparian forest along the broad, lower flood-bottoms of larger river systems. Nests in riparian jungles of willow, often mixed with cottonwoods, with lower story of blackberry, nettles, or wild grape. The riparian areas within the Plan Area are insufficient in size and configuration to support this species.
Fed: None State: SSC
ABSENT

DEIS/SEIR FOR A PROPOSED HCP AND SECTION 10 PERMIT FOR THE UPPER SANTA ANA RIVER WASH PLAN SECTION 3.4
USFWS / CONSERVATION DISTRICT 3.4-12 D ECEMBER 2019
Scientific Name Common Name
Habitat Description Status
Designation Probability of Occurrence
Dendroica petechia brewsteri Yellow warbler
(Nesting) Prefers wetlands and mature riparian woodlands dominated by cottonwoods, alders, and willows. Feeds on caterpillars, cankerworms, moth larvae, bark beetles, borers, weevils, small moths, aphids, grasshoppers, and spiders, and occasionally feeds on a few species of berries. The riparian areas within the Plan Area are likely to be insufficient in size and configuration to support this species.
Fed: None State: SSC
LOW
Elanus leucurus White-tailed kite
(Nesting) Typically nests in riparian trees such as oaks, willows, and cottonwoods at low elevations. Forages in open country. Found in South America and in southern areas and along the western coast of North America. Not known from the Plan Area but some suitable habitat is present in Plan Area.
Fed: None State: FP
MODERATE
Empidonax traillii extimus Southwestern willow flycatcher
(Nesting) Occurs in riparian woodlands along streams and rivers with mature, dense stands of willows (Salix spp.), cottonwoods (Populus spp.), or smaller spring fed or boggy areas with willows or alders (Alnus spp.) It breeds in relatively dense riparian habitats from near sea level to over 2,600 meters. Insufficient riparian habitat occurs within Plan Area to support nesting birds. However, transient individuals may use the riparian areas in the Plan Area.
Fed: FE State: SE
LOW
Eremophila alpestris actia California horned lark
Desert scrub, short grass plains, grasslands interrupted by bare ground, grassy hillsides, mesas and ridges, plowed agricultural land, sagebrush flats, alpine meadows, and fell-fields, alkali flats. This species has been observed in the Plan Area.
Fed: None State: None
PRESENT
Falco mexicanus Prairie falcon
(Nesting) Open country in much of North America. Nests in cliffs or rocky outcrops; forages in open arid valleys and agricultural fields. Rare in southwestern California. Nesting habitat is not present within the Plan Area. This species has been observed flying over and may occasionally forage in the Plan Area.
Fed: None State: SE
LOW
Icteria virens Yellow-breasted chat
(Nesting) summer resident; inhabits riparian thickets of willow & other brushy tangles near watercourses. Nests in low, dense riparian, consisting of willow, blackberry, wild grape; forage, and nest w/in 10 ft of ground. The Plan Area is outside of the breeding range.
Fed: None State: SSC
ABSENT
Lanius ludovicianus Loggerhead shrike
(Nesting) Occurs in broken woodlands, savannah, pinyon-juniper, Joshua tree and riparian woodlands, desert oasis scrub and washes. Prefers open country for hunting, with perches for scanning and fairly dense shrubs and brush for nesting. This species is known from the Plan Area.
Fed: None State: SSC
PRESENT
Polioptila californica californica Coastal California gnatcatcher
Occurs in coastal sage scrub vegetation on mesas, arid hillsides, and in washes and nests almost exclusively in California sagebrush. This species is known from the Plan Area.
Fed: FT State: SSC
PRESENT

DEIS/SEIR FOR A PROPOSED HCP AND SECTION 10 PERMIT FOR THE UPPER SANTA ANA RIVER WASH PLAN SECTION 3.4
USFWS / CONSERVATION DISTRICT 3.4-13 D ECEMBER 2019
Scientific Name Common Name
Habitat Description Status
Designation Probability of Occurrence
Vireo bellii pusillus Least Bell’s vireo
(Nesting) Resides in low riparian areas close to water or dry riverbeds. Their nests are usually constructed in bushes or within the branches of willows, mule fat, and mesquite. They are usually found below an elevation of 2,000 feet. The riparian habitat in the Plan Area is insufficient in size and structure to support nesting.
Fed: FE State: SE
LOW
Mammals Antrozous pallidus Pallid bat
Occurs in deserts, grasslands, shrublands, woodlands, and forests. Most common in open, dry habitats with rocky areas for roosting. Roosts must protect bats from high temperatures.
Fed: None State: SSC BLM: S
LOW
Chaetodipus fallax fallax Northwestern San Diego pocket mouse
Inhabits coastal scrub, chaparral, grasslands, sagebrush, etc. Found in western San Diego County in sandy, herbaceous areas, usually in association with rocks or coarse gravel. This species is known from the Plan Area.
Fed: None State: SSC
PRESENT
Dipodomys merriami parvus San Bernardino kangaroo rat
Typically, is found in RAFSS and sandy loam soils, alluvial fans and flood plains, and along washes with nearby sage scrub. Soil texture is a primary factor in this subspecies occurrence. Sandy loam substrates allow for the necessary digging of simple, shallow burrows. This species is known from the Plan Area.
Fed: FE State: SSC
PRESENT
Dipodomys stephensi Stephens' kangaroo rat
Primarily inhabits annual & perennial grasslands, but also occurs in coastal scrub & sagebrush with sparse canopy cover. Prefers buckwheat, chamise, brome grass & filaree. Will burrow into firm soil. The Plan Area is not within the range of this species.
Fed: FE State: ST
ABSENT
Eumops perotis californicus Western mastiff bat
Many open, semi-arid to arid habitats, including conifer & deciduous woodlands, coastal scrub, grasslands, chaparral, etc. Roosts in crevices in cliff faces, high buildings, trees & tunnels. Roosting habitat may be present. Observed foraging over Plan Area.
Fed: None State: SSC BLM: S
MODERATE
Lasiurus xanthinus Western yellow bat
Occurs in valley foothill riparian, desert riparian, desert wash, and palm oasis habitats. Roosts in trees, particularly palms. Forages over water and among trees. No palm habitat occurs in the Plan Area.
Fed: None State: None
ABSENT
Lepus californicus bennettii San Diego black-tailed jackrabbit
Variety of habitats including herbaceous and desert scrub areas, early stages of relatively open habitats. Restricted to the cismontane areas of southern California, extending from the coast to the Santa Monica, San Gabriel, San Bernardino, and Santa Rosa Mountain ranges. This species is known from the Plan Area.
Fed: None State: SSC
PRESENT
Neotoma lepida intermedia San Diego desert woodrat
Desert woodrats are found in a variety of shrub and desert habitats, primarily associated with rock outcroppings, boulders, cacti, or areas of dense undergrowth. This species is known from the Plan Area.
Fed: None State: SSC
PRESENT

DEIS/SEIR FOR A PROPOSED HCP AND SECTION 10 PERMIT FOR THE UPPER SANTA ANA RIVER WASH PLAN SECTION 3.4
USFWS / CONSERVATION DISTRICT 3.4-14 D ECEMBER 2019
Scientific Name Common Name
Habitat Description Status
Designation Probability of Occurrence
Nyctinomops femorosaccus Pocketed free-tailed bat
Occurs in a variety of arid areas in southern California: pine-juniper woodlands, desert oasis, desert wash, desert riparian, and rocky areas with high cliffs.
Fed: None State: SSC
LOW
Onychomys torridus ramona Southern grasshopper mouse
Arid habitats, especially scrub habitats with friable soils. Coastal scrub, mixed chaparral, sagebrush, low sage, and bitterbrush habitats. Arid portions of southwestern California and northwestern Baja California. The Plan Area has suitable habitat.
Fed: None State: SSC
MODERATE
Perognathus longimembris brevinasus Los Angeles pocket mouse
Lower elevation grasslands & coastal sage communities in the Los Angeles basin. Open ground with fine sandy soils. May not dig extensive burrows, hiding under weeds & dead leaves instead. This species is known from the Plan Area.
Fed: None State: SSC
PRESENT
Taxidea taxus American badger
Most abundant in drier open stages of most shrub, forest and herbaceous habitats, with friable soils. Needs sufficient food, friable soils, and open uncultivated ground. Preys on burrowing rodents. There are no recent records from the Plan Area vicinity.
Fed: None State: SSC
HIGH
Status Codes Federal FE = Federally listed Endangered FT = Federally listed Threatened BLM S = BLM Sensitive State ST = State listed Threatened SE = State listed Endangered FP = Fully protected SSC = CA State Species of Concern WL-California Department of Fish and Wildlife Watch List -- = Not Listed 1. California Natural Diversity Database (CNDDB). 2017. State & Federally Listed Endangered & Threatened Animals of California. February 2017.

DEIS/SEIR FOR A PROPOSED HCP AND SECTION 10 PERMIT FOR THE UPPER SANTA ANA RIVER WASH PLAN SECTION 3.4
USFWS / CONSERVATION DISTRICT 3.4-15 D ECEMBER 2019
3.4.5.1 HCP Covered Species
The species proposed to be covered under the HCP are federally listed endangered Santa Ana River woolly-star, endangered slender-horned spineflower, endangered SBKR, threatened Coastal California gnatcatcher, and the non-listed cactus wren (refer to HCP Table 3.4-4). The incidental take authorization under Section 10 of the FESA will apply only to the wildlife species. Federal authorization for incidental take of other wildlife species may be sought through the amendment process and in accordance with FESA Sections 10(a) and 7. The species covered by the incidental take authorization under the CESA are woolly-star and spineflower. State authorization for incidental take of other species may be sought through the amendment process and in accordance with the applicable provisions of the California Fish and Game Code.
A summary of the key elements of each Covered Species’ life history that is important for habitat conservation planning, monitoring, and adaptive management is outlined in the Public Review Draft Upper Santa Ana River Wash Plan Habitat Conservation Plan (November 2016). The summary includes current distribution, habitat affinities, taxonomy/genetics, pollination/seed dispersal, threats, life history, phenology and special management considerations. These relevant details are included in HCP Tables 3-4 through 3-8, for each of the five Covered Species, which also summarizes what is known about their occurrence in the Plan Area. Refer to Figure 3.4-3, Slender-horned Spineflower Occurrences [HCP Figure 3-5], Figure 3.4-4, Santa Ana Woolly Star Occurrences [HCP Figure 3-6], Figure 3.4-5, Potentially Suitable Cactus Wren Habitat and Occurrences [HCP Figure 3-7], Figure 3.4-6, California Gnatcatcher Habitat Assessment and Occurrences [HCP Figure 3-8], and Figure 3.4-7, SBKR Habitat Assessments and Occurrences [HCP Figure 3-9], for the distribution of these species in the Wash Plan HCP Area.
3.4.6 WILDLIFE CORRIDORS
Wildlife corridors connect areas of similar habitat types and prevent habitat fragmentation. Habitat fragmentation diminishes an area's capacity to sustain healthy native wildlife populations. Wildlife corridors serve as conduits for animal movement that provides genetic exchange between populations, as well as provide a source of animals to repopulate or augment existing populations that may have suffered large losses of individuals from environmental changes and natural disasters. In general, research suggests that larger habitat patches and connectivity significantly improve habitat conditions for mammal species.
Previous large storm events in 1938 and 1969 from the Santa Ana River and Mill Creek caused flows and debris to be trapped on the railroad trestle crossing the river. The debris acted like a dam and caused flows to build up behind it and flow over the banks. These break out areas provided a linkage between the Santa Ana River and Plunge Creek. Since then Plunge Creek has been re-routed away from the Santa Ana River to City Creek.

DEIS/SEIR FOR A PROPOSED HCP AND SECTION 10 PERMIT FOR THE UPPER SANTA ANA RIVER WASH PLAN SECTION 3.4
USFWS / CONSERVATION DISTRICT 3.4-16 D ECEMBER 2019
The San Bernardino County Land Use Services maintains the Open Space Valley-Mountain Map2 identifies the Santa Ana River as a major wildlife corridor across in the region which is mapped across the entire Plan Area and also follows along City Creek, Mill Creek, Plunge Creek, and along Santa Ana River in to the San Bernardino Mountains to the north and east. Implementation of the Wash Plan HCP will help preserve, enhance, and manage the habitats along the Santa Ana River corridor that supports wildlife movement through the Plan Area.
2 http://cms.sbcounty.gov/lus/Planning/ZoningOverlayMaps.aspx

SECTION
3.5 LAND USE
USFWS / CONSERVATION DISTRICT 3.5-1 D ECEMBER 2019
3.5 LAND USE
The purpose of this section is to identify and describe current land use conditions in the Plan Area, as well as the immediate vicinity.
3.5.1 REGULATORY SETTING
Information regarding, Federal, State, and Local regulations in regards to land use can be found in Appendix B.
3.5.2 ENVIRONMENTAL SETTING – EXISTING USES
3.5.2.1 Mining
There are two mining operators in the Plan Area, Cemex and Robertson’s, both of which are currently extracting and processing aggregate, primarily to make cement. Current operations of both companies are located in the northwestern and central portion of the Plan Area.
3.5.2.2 Flood Control
The San Bernardino County Flood Control District (SBCFCD) conducts flood control operations and maintenance activities in the Plan Area, primarily along four bodies of water: Plunge Creek, City Creek, Mill Creek, and the Santa Ana River.
3.5.2.3 Habitat Conservation
To protect significant populations of the woolly-star, habitat along the Santa Ana River and portions of the alluvial fan terraces were set aside and established as the Woolly-star Preservation Area (WSPA). The WSPA is a 544.5-acre area in a conservation easement west of the Greenspot Bridge that crosses the Santa Ana River. The WSPA was established as mitigation in the 1990s by the USACE to address impacts related to the construction and operation of Seven Oaks Dam.
3.5.2.4 Water Conservation
The Conservation District conducts water conservation activities, operation and maintenance of existing recharge basins and access roads in the Plan Area, primarily on the eastern portion. These activities are carried out in recharge/percolation basins, which pond to a depth of 3 to 10 feet, to recharge the Bunker Hill Groundwater Basin.

DEIS/SEIR FOR A PROPOSED HCP AND SECTION 10 PERMIT FOR THE UPPER SANTA ANA RIVER WASH PLAN SECTION 3.5
USFWS / CONSERVATION DISTRICT 3.5-2 D ECEMBER 2019
Other Activities
There is one active citrus grove in the Plan Area, in the northeastern corner. This citrus grove is on land owned by the East Valley Water District (EVWD).
Adjacent Uses
The Plan Area is bounded by the following land uses:
● Urban uses and vacant land to the north;
● Urban and agricultural land uses, in addition to vacant land and Redlands Municipal Airport, to the south;
● San Bernardino International Airport, Redlands Wastewater Treatment Facility, and the California Street Landfill to the west; and
● Agricultural uses and the San Bernardino Mountains to the east.
3.5.2.5 Airports
The San Bernardino International Airport (SBIA) is located just west of the Plan Area and the Redlands Municipal Airport is located south of the Plan Area. Currently, the SBIA does not have an Airport Land Use Compatibility Plan (ALUCP).
The Redlands Municipal Airport Influence Area is comprised of varying Compatibility Zones. Zones 1, 2, 3 and 4 overlap the southern portion of the Plan Area with the remaining majority of the Plan Area within Zone 5. Zone 1 restricts uses in the area to aeronautical functions and includes the airport runway and immediately adjacent areas and residential and other uses that would have people are not allowed. Zone 2 is described as the area for the approach/departure of aviation. Zone 3 includes the inner turning zone. Zone 4 includes the outer approach and departure zone. Zone 6 is the traffic pattern zone/ airport influence area, includes zones where aircraft at an altitude of 1,000 feet or less are commonly overflown. Zone 1 has the highest risk and Zone 6 has the lowest risk of impacts from aviation.
3.5.2.6 Public Lands
There are existing land use authorizations located on BLM-managed lands in the Plan Area.
● CACA CACA025557 - Robertson’s Ready Mix. The BLM issued a right of way grant 07/16/1992 for road access across lands within section 10, T 1 S., R. 3 W., SBB&M to access leased mining claims located on San Bernardino County lands. The right of way grant will expires 7/16/2022 unless renewed.

DEIS/SEIR FOR A PROPOSED HCP AND SECTION 10 PERMIT FOR THE UPPER SANTA ANA RIVER WASH PLAN SECTION 3.5
USFWS / CONSERVATION DISTRICT 3.5-3 D ECEMBER 2019
● CALA024759 - San Bernardino County Valley Municipal Water District. The BLM issued a 16 ft wide right of way on 01/22/1915 within sections 10 and 12, T 1 S., R. 3 W., SBB&M to access their land. The expiration date is unknown.
● CACA050427 - San Bernardino County. The BLM issued a 4,600 ft x 35 ft ROW on 6/16/2011
within section 10, T 1 S., R. 3 W., SBB&M to access private lands. The ROW expires 12/31/2040.
● CACA036490 - Robertson’s Ready Mix. The BLM issued a ROW on 12/05/1998 within section 10, T 1 S., R. 3 W., SBB&M to access leased mining claims located on San Bernardino County lands. The ROW expires 12/31/2041.

DEIS/SEIR FOR A PROPOSED HCP AND SECTION 10 PERMIT FOR THE UPPER SANTA ANA RIVER WASH PLAN SECTION 3.5
USFWS / CONSERVATION DISTRICT 3.5-4 D ECEMBER 2019
This page intentionally left blank.

SOCIOECONOMICS, POPULATION AND HOUSING, AND ENVIRONMENTAL JUSTICE
SECTION
3.6
USFWS / CONSERVATION DISTRICT 3.6-1 D ECEMBER 2019
3.6 SOCIOECONOMICS, POPULATION AND HOUSING, AND
ENVIRONMENTAL JUSTICE
This section provides a discussion of the regional socioeconomic setting and the demographic and economic conditions of the affected environment as well as the current population and housing conditions in and around the Plan Area. This section also identifies the presence of minority and/or low- income populations in compliance with the requirements of Executive Order 12898, Federal Actions to Address Environmental Justice in Minority Populations and Low-Income Populations.
3.6.1 REGULATORY SETTING
Information regarding Federal, State, and Local regulations in regards to socioeconomics, population and housing, and environmental justice can be found in Appendix B.
3.6.2 REGIONAL SETTING
Aggregate mining operations have been conducted in portions of the Plan Area for more than 80 years. The Plan Area is located in a region that has experienced considerable population growth during the past two decades, with growth expected to continue through the next decade.
The socioeconomically affected environment includes population centers located to the north and south of the Plan Area. Affected communities would include the City of Redlands and City of Highland, located in San Bernardino County. For policy and planning purposes, the Southern California Association of Governments (SCAG) has established the San Bernardino County Transportation Authority (SBCTA) (formerly known as San Bernardino Association of Governments [SANBAG]) sub-region that comprises the local governments in the County, including the cities of Redlands and Highland.
3.6.3 ENVIRONMENTAL SETTING
3.6.3.1 Demographic Characteristics
Population Growth – The population in the surrounding region of the Plan Area has increased moderately from 2000 to 2010. As shown in Table 3.6-1, Population and Population Change, the City of Redlands had a population growth of approximately 7.6 percent from 2000 to 2010, and is projected to have a population of approximately 75,500 by 2020, for a total increase of a little over 18 percent. The City of Highland had a population growth of approximately 18.9 percent from 2000 to 2010, and is projected to have a population of approximately 58,600 by 2020, which would be an increase of over 31 percent. San Bernardino County had a population growth of approximately 19.1 percent from 2000 to

USFWS / CONSERVATION DISTRICT 3.6-2 D ECEMBER 2019
DEIS/SEIR FOR A PROPOSED HCP AND SECTION 10 PERMIT FOR THE UPPER SANTA ANA RIVER WASH PLAN SECTION 3.6
2010, and is projected to have a population of approximately 2,268,000 by 2020, which would be an increase of 32.7 percent.
Table 3.6-1: Population and Population Change
Jurisdiction1 2000 2010 2020 (projected)
Percent Increase from 2000 - 2010
CT 76.04, BG 3 N/A 1,961 N/A N/A
CT 79.04, BG 3 N/A 3,613 N/A N/A
CT 80.01, BG 3 2,865 3,629 N/A 26.7%
CT 84.01, BG 1 1,146 1,854 N/A 61.8%
City of Redlands 63,875 68,747 75,500 7.6%
City of Highland 44,668 53,104 58,600 18.9%
County of San Bernardino 1,709,434 2,035,210 2,268,000 19.1%
Sources: Southern California Association of Governments, RTP 2012 Adopted Growth Forecast: City Projections, http://www.scag.ca.gov/DataAndTools/Pages/GrowthForecasting.aspx. U.S. Census Bureau, Census 2000, and 2010 Summary File 1. Notes: 1 = The Census Bureau changed the numbering system for Census Tracts and Block Groups from 2000 to 2010. For example, the area designated as Census Tract 76.02, Block Group 6 in the 2000 Census was renamed as Census Tract 76.04, Block Group 3 in the 2010 Census. It should also be noted that the area of the Block Groups have changed. The 2010 Census Tract 76.04, Block Group 3 covers a slightly different geographic area compared to the 2000 block groups.
Race and Ethnicity – Tables 3.6-2 and 3.6-3 show the ethnic composition within San Bernardino County and the Project study area cities, and for the Plan Area census tracts. CEQA guidelines state that minority populations should be identified where either (a) the minority population of the affected area exceeds 50 percent, or (b) the minority population percentage of the affected area is meaningfully greater than the minority population percentage in the general population.
As shown in Table 3.6-2, below, neither of the two cities nor the County contains a minority population greater than 50 percent. The City and County data is generally included as a basis of comparison against the smaller and more detailed geographical census tract areas, discussed below.
As shown in Table 3.6-3, below, two of the four Plan Area census tracts do contain a minority population of greater than 50 percent: Census Tracts 76.04 and 80.01. The other two census tracts, Census Tracts 76.04 and 84.01, contain a less than 50 percent minority population. These totals can be derived from subtracting the totals in the Black, American Indian, Asian, Hawaiian/Other Pacific Islander, and Other/Two or More Races’ categories, from the total in the White category.

USFWS / CONSERVATION DISTRICT 3.6-3 D ECEMBER 2019
DEIS/SEIR FOR A PROPOSED HCP AND SECTION 10 PERMIT FOR THE UPPER SANTA ANA RIVER WASH PLAN SECTION 3.6
Table 3.6-2: Racial and Ethnic Composition for the County and Cities
Area
White
Black American Indian
Asian
Hawaiian/ Other Pacific
Islander
Other/ Two or More
Races
Hispanic1
San Bernardino County 56.7% 8.9% 1.1% 6.3% 0.3% 26.6% 49.2%
Redlands 69.0% 5.2% 0.9% 7.6% 0.3% 16.9% 30.3%
Highland 52.4% 11.1% 1.0% 7.4% 0.3% 27.7% 48.1%
Source: U.S. Census Bureau, 2010 Census, DP-01 http://factfinder2.census.gov/ Note: 1 = The U.S. Census Bureau defines Hispanic and Latino as an ethnicity, not a race. Consequently, a person of Hispanic or Latino descent could identify racially as White, Black/African American, Native American, Asian or other. Therefore, percentages do not add up to 100 percent because the White, Black, American Indian, Hawaiian, and Other categories included persons identified with only one race; the Hispanic category overlaps with other categories.
Table 3.6-3: Racial and Ethnic Composition for the Plan Area Census Tracts
Area1
White
Black American Indian
Asian
Hawaiian/ Other Pacific
Islander
Other/ Two or More
Races
Hispanic2
CT 76.04 45.7% 3.9% 0.0% 6.9% 0.0% 43.5% 57.1%
CT 79.04 60.8% 6.8% 0.1% 8.9% 0.0% 23.4% 30.9%
CT 80.01 46.7% 8.1% 1.2% 15.0% 0.0% 29.0% 49.7%
CT 84.01 70.5% 3.2% 0.2% 7.6% 0.5% 18.0% 33.9%
Source: U.S. Census Bureau, 2010 Census, DP-01 http://factfinder2.census.gov/
Note: 1 = Racial and ethnic data are not available at the census tract block group level. Therefore, racial and ethnic data were used for the entire census tract. 2 = The U.S. Census Bureau defines Hispanic and Latino as an ethnicity, not a race. Consequently, a person of Hispanic or Latino descent could identify racially as White, Black/African American, Native American, Asian or other. Therefore, percentages do not add up to 100 percent because the White, Black, American Indian, Hawaiian, and Other categories included persons identified with only one race; the Hispanic category overlaps with other categories.
Age – Overall, the demographic data indicate that residents in Redlands and Highland only make up a small percentage of the total county population. In general, these residents tend to be in early adulthood. The median age of residents in the vicinity of the Plan Area was 29.9 years in the City of Highland; 36.2 years in the City of Redlands; 45.6 years in Census Tract 76.04 Block Group 3; 36.8 years in Census Tract 79.04 Block Group 3; 30.4 years in Census Tract 80.01 Block Group 3; and 29.8 years in Census Tract 84.01 Block Group 1, as reported by the 2010 U.S. Census and represented in Table 3.6-4, Demographic Profile. For the County of San Bernardino, the median age was 31.9 years.
Median Household Income – The median household incomes within the Plan Area vary widely, from a low of $46,458 in Census Tract 76.04 Block Group 3 to a high of $98,882 in Census Tract 79.04 Block Group 3. The City of Redlands had a significantly higher median household income at $85,308 than both the City of Highland ($59,095) and the County of San Bernardino ($59,294), but was consistent with the median household incomes of Census Tract 76.04 Block Group 3 ($98,882) and Census Tract 84.01 Block Group 1 ($91,429).

USFWS / CONSERVATION DISTRICT 3.6-4 D ECEMBER 2019
DEIS/SEIR FOR A PROPOSED HCP AND SECTION 10 PERMIT FOR THE UPPER SANTA ANA RIVER WASH PLAN SECTION 3.6
Poverty Levels – According to Census data, the County of San Bernardino currently had a poverty level of 15.0 percent. The other jurisdictions within the Plan Area had similar or lower poverty levels than the County, ranging from a low of 6.0 percent in Census Tract 76.04 Block Group 3, to a high of 17.8 percent in the City of Highland. However, none of the jurisdictions had a poverty level that represents a disproportionate percentage of families living below the poverty level. According to the U.S. Department of Health and Human Services (DHHS) poverty guidelines, the poverty threshold for a family of four in 2017 was $24,600. None of the geographical areas included in the Plan Area showed a median household income that was comparable to the DHHS poverty threshold.
Educational Attainment – The percentage of residents that are high school graduates or higher (attained a high school diploma and/or Associate’s Degree) varies widely throughout the Plan Area, ranging from a low of 53.0 percent in Census Tract 79.04 Block Group 3, to a high of 90.1 percent in the City of Redlands. Overall, County of San Bernardino residents fell approximately in the middle of that range at 78.2 percent. The variance between the percentage of residents with a Bachelor’s Degree or higher was less broad. The percentage of college graduates ranges from a low of 4.5 percent in Census Tract 76.04 Block Group 3, to a high of 38.2 percent in the City of Redlands, compared with the overall County percentage of 18.7 percent, again falling in mid-range of the Plan Area college graduate totals.
Unemployment – Unemployment totals were fairly consistent within the geographic areas included in the Plan Area, with a range of 7.5 percent in Census Tract 80.01 Block Group 3, to 24.5 percent in Census Tract 76.04 Block Group 3. The County’s unemployment rate of 8.8 percent was slightly higher than that of the State of California overall at 7.3 percent.
Table 3.6-4: Demographic Profile
Characteristic CT
76.04 BG 3
CT 79.04 BG 3
CT 80.01 BG.3
CT 84.01 BG 1
City of Redlands
City of Highland
County of San
Bernardino Total Population in 2013 1,257 3,888 3,863 2,206 69,277 53,575 2,056,915
Median Age 45.6 36.8 30.4 29.8 36.2 29.9 31.9
Gender Male 498 2,014 1,884 1,081 33,433 26,315 1,023,385
Female 759 1,874 1,979 1,125 35,844 27,260 1,033,530
Median Household Income $46,458 $98,882 $59,923 $91,429 $85,308 $59,095 $59,294
Percent Below Poverty Level 6.0% 10.4% 14.4% 7.3% 8.5% 17.8% 15.0%
Labor Forces Unemployed 24.5% 10.5% 7.5% 12.0% 5.3% 8.0% 8.8%
Education High School Graduate or higher 58.1% 53.0% 53.9% 59.1% 90.1% 73.5% 78.2%% College Graduate (Bachelor’s Degree or higher) 4.5% 34.4% 29.3% 27.6% 38.2% 19.8% 18.7%
Source: U.S. Census Bureau Census 2013 American Community Survey 5-Year Estimates 2009-2013.

USFWS / CONSERVATION DISTRICT 3.6-5 D ECEMBER 2019
DEIS/SEIR FOR A PROPOSED HCP AND SECTION 10 PERMIT FOR THE UPPER SANTA ANA RIVER WASH PLAN SECTION 3.6
3.6.3.2 Economic Characteristics
Relevant Economy
San Bernardino and Riverside counties are known as the Inland Empire, a rapidly growing part of southern California. San Bernardino County is the largest county in the U.S., consisting of over 20,000 square miles. The Plan Area is only a small part of San Bernardino County, but the aggregate mining industry in the County supplies construction materials for an extensive development market in southern California.
In this sense, San Bernardino County represents both the demand side (development) and the supply side (aggregate mining) of the construction materials industry. The California Department of Conservation projects that San Bernardino County is one of the areas with the greatest future need for aggregate. The San Bernardino Region is expected to demand 1,074 million tons of aggregate over the next 50 years, while currently having only 262 million tons permitted for mining.
Because of the significant excess demand for aggregate in the County and in nearby areas, there is little likelihood that the mining of aggregate in the Plan Area would result in unsold surpluses that could lead to price collapses and worker layoffs. The mining industry in the Plan Area is likely to experience a strong market over an extended period of time, even with fluctuations in the demand of development.
Relevant Employment and Income
In January 2010, San Bernardino County ranked 26th out of the 58 California counties for unemployment, with a 14.5 percent rate, while the state of California overall had an unemployment rate of 12.3 percent. The County’s unemployment rates in January 2011 (14.2 percent), 2012 (12.7 percent), and 2013 (11.4 percent) remained slightly higher than the statewide unemployment rates of 12.1 percent, 11.0 percent, and 9.5, respectively, during the same time period. However, these data also indicate that the County has been recovering from the recent economic downturn of the late 2000’s, by which it had been significantly affected. Most recently in 2014, the County has experienced a return to a single-digit unemployment rate of 9.5 percent (the lowest rate since 2008) while California’s statewide unemployment rate for 2014 was 8.1 percent.
Based on the 2002 Economic Census, Construction Sand and Gravel Mining: 2002 Report, issued December 2004 by the US Census Bureau (the most recent report available1) page 15, California had a total of 153 sand and gravel mining establishments, of which 13 had 20 employees or more. The total number of employees for these establishments in California in 2002 was 2,752.
The annual per capita personal income in San Bernardino County has also seen slight growth in recent years. In 2012, the per capita personal income in San Bernardino County rose to $32,048 from $29,998 in 2011, as compared to California’s statewide per capita personal income growth in 2012 to $47,505 from $43,647 in 2011. In 2013, this growth continued although at a slower pace. The per capita personal
1https://www2.census.gov/library/publications/economic-census/2002/mining-reports/industry-series/ec0221i212321.pdf

USFWS / CONSERVATION DISTRICT 3.6-6 D ECEMBER 2019
DEIS/SEIR FOR A PROPOSED HCP AND SECTION 10 PERMIT FOR THE UPPER SANTA ANA RIVER WASH PLAN SECTION 3.6
income in San Bernardino County increased to $32,747 in 2013, and California’s statewide per capita personal income increased to $48,434. These increases indicate a steady strengthening of the economy at both the local and statewide level.

SECTION
3.7 TRANSPORTATION SYSTEMS AND TRAFFIC
USFWS / CONSERVATION DISTRICT 3.7-1 D ECEMBER 2019
3.7 TRANSPORTATION SYSTEMS AND TRAFFIC
This section describes the existing transportation systems and traffic conditions in and around the Plan Area.
3.7.1 REGULATORY SETTING
Information regarding Federal, State, and Local regulations in regards to transportation systems and traffic can be found in Appendix B.
3.7.2 ENVIRONMENTAL SETTING
Existing transportation facilities in the Plan Area include highways and roadways. There currently are no trails open to the public located within the Plan Area outside of existing public road right-of-ways.
3.7.2.1 Existing Roadways and Highways
The transportation network within the Plan Area is composed of a mix of a state highway and local roadways. The circulation system plays a major role in the movement of existing and future aggregate mining products within the Plan Area. According to the May 2019 Wash Plan HCP, the total acreage of City/County roads located within the Plan Area is 149.8 acres, representing 3.1 percent of the total Plan Area of 4,892.2 acres. The roadways and highway within the vicinity of the Plan Area are listed and described below.
City of Highland
● Orange Street between the southern City boundary and where it becomes Boulder Avenue is designated as a Secondary Highway, Class II Bike Lane (on street), as well as a Truck Route according to the City of Highland General Plan;
● Boulder Avenue is designated as a Modified Primary Arterial. The Modified Primary Arterial is designated as a four-lane divided roadway, Class II Bike Lane, and truck route;
● Greenspot Road is classified as a Primary Arterial and truck route from SR-210 east to Boulder Avenue and as a Major Highway with a dedicated Class II bike lane on both sides from Boulder Avenue to the bridge over the Santa Ana River;
● Alabama Street is designated as a Primary Arterial, Class II Bike Lane, and truck route from the City’s southern boundary at the bridge over the Santa Ana River north to Third Street;
● Palm Avenue is designated as a Major Highway, Class II Bike Lane, and truck route north of the Plan Area and Third Street north to between Base Line. This is a two-lane roadway with a 52- foot roadway, curb-to-curb, within a 66-foot right-of-way; and

DEIS/SEIR FOR A PROPOSED HCP AND SECTION 10 PERMIT FOR THE UPPER SANTA ANA RIVER WASH PLAN SECTION 3.7
USFWS / CONSERVATION DISTRICT 3.7-2 D ECEMBER 2019
● 3rd Street from Victoria Avenue west to west of Alabama Avenue is designated as a Major Highway and truck route.
City of Redlands
● Orange Street is classified as a Minor Arterial;
● Greenspot Road is classified as a Minor Arterial; and
● Alabama Street is classified as a Major Arterial.
State of California Department of Transportation (Caltrans)
● State Route 210 (SR-210) (formerly State Route 30) is maintained and operated by Caltrans. The right-of-way along SR-210 is not included within the Plan Area and has been excluded as “Not A Part” of the HCP; however, it is still required to include this roadway in the level of service standards analysis discussed below as it is part of the roadway network used by existing and to be used by expanded aggregate mining.
Maintenance Access Roads and Mining Haul Roads
The Plan Area has a network of unpaved internal access roads, and maintenance service roads used for operation and maintenance (O&M) activities associated with habitat preservation and water management, located within areas of the Conservation District’s ownership. These roads serve the onsite needs of utility providers, water service companies, flood control districts, and the Conservation District, and are maintained mostly by the Conservation District. O&M activities are identified as “Covered Activities” and would include actions that occur repeatedly in one area or over a wide area, such as bank stabilization, storm-damage repair, and maintenance of roads and facilities.
In addition, Cemex and Robertson’s have private haul roads that are used internally to transport aggregates by mining trucks within the Plan Area. These haul roads are generally located in the western portion of the Plan Area, and are maintained exclusively by Cemex and Robertson’s.
Planned Transportation Facilities
Roadways
Covered Activities/Projects include the widening and other improvements (curb, gutter, sidewalk, landscaped parkway, roadway drainage, and street lights) of three existing roadways and general road maintenance on paved roads throughout the Plan Area. The Covered Activities/Projects are located within City of Highland and City of Redlands boundaries and include the following projects:
● Alabama Street Improvements Project (High.01 & Redl.14);
● Orange Street Improvements Project (High.02 & Redl.15); and
● Greenspot Road Improvement Project (High.03 & Redl.19).

SECTION
3.8 VISUAL RESOURCES
3.8 VISUAL RESOURCES
3.8.1 REGULATORY SETTING
Information regarding, Federal, State, and Local regulations in regards to visual resources can be found in Appendix B.
3.8.2 ENVIRONMENTAL SETTING
The Plan Area is located at the base of the San Bernardino Mountains in an area created by periodic flooding of the Santa Ana River and its tributaries City Creek, Mill Creek, and Plunge Creek. Historically, these waterways were not channelized and large flows flooded these tributary creeks and the Santa Ana River. During heavy rainfall, usually occurring in the winter months, water flowed from local mountains via the creeks and river, and combined to create a fast-moving, turbulent river with a high sediment load. When the rainfall subsided, the river and creeks returned to their smaller courses and left large areas between the waterways consisting of rocks, debris, and sediment, creating the wide Santa Ana wash area.
There are currently no Caltrans designated scenic highways within the vicinity of the Plan Area. The limitations on land use imposed by potential flooding have contributed to the open, undeveloped character of the area. Vegetation consists mostly of native scrub types, like California buckwheat and California sagebrush, and is relatively sparse with dense stands of shrubs in some areas. The wash appears as an open, sandy area interspersed with boulders and rocks. Although vegetation is typically less than three feet in height, some shrubs can reach 10 feet, including California juniper and laurel sumac.
The San Bernardino Mountains are a prominent feature in the region. During periods of clear weather, these mountains are visible. Looking south from the City of Highland, foothills can be seen in the distance 6 miles away. The Plan Area, like the mountains, is a dominant feature, primarily due to its lack of development and the patterns of vegetation. However, the landscape contains several man-made modifications, including highways, roads, transmission lines, and flood control facilities and spreading basins. Figure 3.4-2 Vegetation Communities, shows the Plan Area’s pattern of vegetation and developed areas. Quarries and mining operations are visible, and together with the prominent State Route 210 (SR-210) freeway (above-grade alignment) contribute to complex patterns of form, texture, and color that make up the aesthetic environment.
Adjacent land uses include the Redlands Municipal Airport, agriculture, private residential, and industrial to the south and the Redlands Wastewater Treatment Facility to the southwest. The San Bernardino International Airport (former Norton Air Force Base), commercial, industrial and residential uses are located to the west and northwest. Primarily residential but also commercial uses are located to the
USFWS/ CONSERVATION DISTRICT 3.8-1 DECEMBER 2019

DEIS/SEIR FOR A PROPOSED HCP AND SECTION 10 PERMIT FOR THE UPPER SANTA ANA RIVER WASH PLAN SECTION 3.8
USFWS/ CONSERVATION DISTRICT 3.8-2 DECEMBER 2019
north. Agricultural, rural residential and undeveloped areas are located to the west. Three north-south paved roads cross the Plan Area: Orange Street-Boulder Avenue and SR-210. Greenspot Road forms a portion of the northern and eastern boundary, and Alabama Street is the western boundary.
3.8.3 METHODOLOGY
Sensitive viewing areas were identified and inventoried within a five-mile radius of the Plan Area. The identification of sensitive viewing areas within the viewshed was conducted through review of existing land use data, agency contacts, and field surveys/reviews. The following is a representative list of the sensitive viewing areas that were considered during the inventory:
● Residential areas (e.g., residences closest to the Plan Area);
● Travel routes: major roads or highways used primarily by origin/destination travelers and designated scenic roads (e.g., local residents, workers, and commuter travelers along Greenspot Road, Orange Street-Boulder Avenue and SR-210); and
● Parks, recreation areas, wildlife areas, visitor centers, areas used for camping, picnicking, bicycling, boating, or other recreational activities.
During field surveys conducted within the immediate project vicinity, it was noted that the residential areas present in the vicinity of the Plan Area have few or no views of the Plan Area. The nearest residential developments lie approximately 0.5 miles to the north, 0.77 miles to the southwest, and 0.6 miles to the south of the Plan Area boundary. These residential communities have only limited views of the Plan Area, as fences, buildings, or other man-made structures obstruct them. Also, the Plan Area is essentially surrounded by industrial and commercial uses, which block most residential views to the Plan Area.
3.8.3.1 Visual Resource Management (VRM) Methodology
The VRM survey was based on BLM methodology and was intended to identify and quantify scenic values, and to analyze the impacts of proposed landscape modifications. This methodology is used to establish the scenic quality of an area and then to evaluate the degree of contrast between the existing landscape and with implementation of the Proposed Action/Projects.
In rating these elements, a score is based on evaluation criteria, using a graduated range (0-5). The inventory and evaluation of the above elements assist with the characterization of scenic attractiveness within the VSOI. In general, landscapes are characterized by three levels, Class A through Class C:
● Class A: Areas have outstanding diversity or interest; characteristic features of landform, water,
and vegetation are distinctive or unique in relation to the surrounding region. These areas contain considerable variety in form, line, color, and texture.

DEIS/SEIR FOR A PROPOSED HCP AND SECTION 10 PERMIT FOR THE UPPER SANTA ANA RIVER WASH PLAN SECTION 3.8
USFWS/ CONSERVATION DISTRICT 3.8-3 DECEMBER 2019
● Class B: Areas have above-average diversity or interest, providing some variety in form, line, color, and texture. The natural features are not considered rare in the surrounding region but provide adequate visual diversity to be considered of value.
● Class C: Areas have minimal diversity or interest; representative natural features have limited variation in form, line, color, or texture in the context of the surrounding region. Discordant cultural modifications (e.g., substations, transmission lines, and other cultural modifications) can be highly noticeable, which can reduce the inherent value of the natural setting.
The viewpoints for the Plan Area are Class C and Class B landscapes (SBVWCD 2008).
The VRM system is designed to separate the existing landscape and the Plan Area into their respective features and elements and to compare each part to the other to identify parts that are incompatible (BLM 1986). The resulting VRM landscape classifications are:
● VRM Class I: The objective of this class is to preserve the existing character of the landscape.
Changes to the landscape character should not be evident.
● VRM Class II: The objective of this class is to retain the existing character of the landscape. Changes to the landscape character may attract slight attention but should be subordinate to the visual setting.
● VRM Class III: The objective of this class is to partially retain the existing character of the landscape. Changes to the landscape character may begin to attract attention but should not dominate the visual setting.
● VRM Class IV: The objective of this class is to allow for activities that modify the existing character of the landscape. Changes to the landscape character may attract attention and dominate the visual setting. However, these activities should minimize changes to the landscape where possible.

DEIS/SEIR FOR A PROPOSED HCP AND SECTION 10 PERMIT FOR THE UPPER SANTA ANA RIVER WASH PLAN SECTION 3.8
USFWS/ CONSERVATION DISTRICT 3.8-4 DECEMBER 2019
This page intentionally left blank.

SECTION
3.9 CULTURAL RESOURCES
USFWS / CONSERVATION DISTRICT 3.9-1 DECEMBER 2019
3.9 CULTURAL RESOURCES
This section describes the current affected environment for cultural resources in the Plan Area.
3.9.1 REGULATORY SETTING
Information regarding, Federal, State, and Local regulations in regards to cultural resources can be found in Appendix B.
3.9.2 ENVIRONMENTAL SETTING
A Cultural Resources Assessment (CRA) was prepared for the Plan Area. The CRA was prepared pursuant to Section 106 of the National Historic Preservation Act (NHPA), CEQA, the Public Resources Code (PRC) Chapter 2/6, Section 21083.2, and the California Code of Regulations (CCR) Title 14, Chapter 3, Article 5, Section 15064.5. The information contained in this section is based on information contained in the CRA. The CRA included a records search at the South Central Coastal Information Center at California State University, Fullerton. This archival research included review of status of all recorded historic and prehistoric cultural resources, and survey and excavation reports completed within one mile of the Plan Area boundary. The research also included review of known cultural resources reports completed in the vicinity of the Plan Area. In addition, the California State Historic Property Data File (HPD), which includes the National Register of Historic Places, California Historical Landmarks (CHL), California Points of Historical Interest (CPHI), and various local historic registers were examined. The records search revealed that 83 cultural resource studies have taken place, resulting in 70 cultural resources recorded within one mile of the Plan Area. Of the previous studies, 11 have previously assessed portions of the Area of Potential Effect (APE), and eight cultural resources, all historic-period, have been previously recorded within its boundaries. The pedestrian cultural resources survey was intended to locate and document previously recorded or new cultural resources, including archaeological sites, features, isolates, and historic-period buildings, that exceed 45 years in age within the APE boundary (the APE boundary coincides with the Plan Area boundary).
3.9.2.1 Local Sequence
The Plan Area is adjacent to the historic Rancho San Bernardino, which dominated the region’s early history. A mission rancho originally associated with the nearby Spanish Asistencia, Rancho San Bernardino became the property of the Lugo family and Diego Sepulveda in 1842 as part of the secularization process, securing Mexico's local hegemony after official independence from Spain. When the United States annexed California after the Mexican-American War, the Lugo family and Diego Sepulveda received the official U.S. land patent for the property, via a claim filed under the authority of Congress. Brigham Young’s Mormon scouts subsequently bought Rancho San Bernardino from the Lugos and Sepulveda and erected a sawmill and irrigation system, splitting the land into a system of ranches

DEIS/SEIR FOR A PROPOSED HCP AND SECTION 10 PERMIT FOR THE UPPER SANTA ANA RIVER WASH PLAN SECTION 3.9
USFWS / CONSERVATION DISTRICT 3.9-2 DECEMBER 2019
and farms. The resulting economy soon necessitated a stage stop, and by 1855 the freight-hauling enterprise of Banning & Alexander was running a brisk service between San Bernardino and Los Angeles.
Although large tracts owned by the U.S. Government became available for homesteading during the 1860s, various pressures forced local Mormon pioneers to recede to Salt Lake City during this period. In the wake of the Mormon exodus, other settlers began to take advantage of new homestead opportunities. Agriculture (particularly citrus orchards) was central to the region’s success, and by the early 20th century the City of San Bernardino’s downtown took shape as the hub of economic activity. Spanish Colonial-style civic and commercial buildings predominated San Bernardino construction projects between the 1920s to the 1940s. While similar popular architectural styles were reflected in some residential neighborhoods, the gradual development of forms more typical of the California working class population became common. These included 1920s Craftsman and Spanish Colonial Revival style bungalows, and the simple Minimal Traditional Style during the 1930s.
Subsequent to World War II, southern California experienced an unprecedented land boom resulting from the local discharge of former military personnel. The railroad, U.S. Air Force (both civilian and military), and Kaiser Steel initially remained strong, and a revitalized construction industry formed due to new commercial, residential, and infrastructure developments. Although San Bernardino initially prospered during the postwar years, the eventual closures of Norton Air Force Base and Kaiser Steel in addition to the relocation of many railroad jobs punctuated a general economic downturn for San Bernardino’s working class that has persisted since the 1980s.
3.9.2.2 Pre-historic Resources
No pre-historic resources were identified through the records search or pedestrian survey within the Plan Area.
3.9.2.3 Historic Resources
Five of the nine previously recorded resources located within the APE were inspected. Three of the nine previously recorded resources located within the APE have been destroyed. All resources within, or previously within, the APE are described below. No other cultural resources (including prehistoric or historic-period archaeological resources or historic-period buildings) were discovered during the field survey.
CA-SBR-6006-H Civilian Conservation Corps Cone Camp (Cone Camp). Cone Camp was recorded in June 1987 (by R. Paul Hampson, Roderick S. Brown, and Margaret A. Doyle of Greenwood and Associates) to include 38 features. Between 1931 and 1938 the Civilian Conservation Corps (CCC) used the camp as a worker base. Between 1942 and 1964 its buildings were leased to house local orchard workers under the federal Bracero Program. At its peak, the camp housed more than 1,000 workers. The buildings were used for storage until 1977, when the wood frames were burned for fire department training exercises. The site was revisited in 2004 and overall the site integrity remained good, and artificial impacts were noted at the time as minimal. Some natural deterioration was evident.

DEIS/SEIR FOR A PROPOSED HCP AND SECTION 10 PERMIT FOR THE UPPER SANTA ANA RIVER WASH PLAN SECTION 3.9
USFWS / CONSERVATION DISTRICT 3.9-3 DECEMBER 2019
P-36-5526. This resource was previously recorded as a historic period orchard and associated features. Features included poured concrete footings with exposed iron anchor bolts, a house foundation, several cobble/boulder pads, one poured concrete slab, a cement and cobble aqueduct, and numerous debris scatters. Artifacts included sun colored amethyst bottle glass, amber hand-tooled bottle finishes, tobacco tins, hole in cap cans, brick fragments, whiteware, and blue and porcelain ceramic fragments. BCR Consulting personnel revisited the resource and checked its location and description using a hand- held Global Positioning System (GPS). It was found in place, basically intact as recorded.
This historic-period orchard complex was determined eligible for National Register listing in 1988. The field study performed during the current effort has confirmed that it remains in place as originally recorded. Field results indicate that it retains good integrity of location, setting, feeling, and association, and a measure of integrity of design and materials, with little evidence of integrity of workmanship. Results indicate that this resource’s eligibility stems from a potential to yield information important to the prehistory or history of the area/region (National Register Criterion D/California Register Criterion 4). As a result, this resource is recommended a historic property under Section 106 of the NHPA, and a historical resource under CEQA. However, it does not appear to be a unique archaeological resource under CEQA.
P-36-6062. This resource was previously recorded as a historic-period domestic debris deposit composed of five loci on either side of a dirt road. Debris included steel beverage cans, aluminum cans, milk tins, glass fragments (brown, clear, cobalt, olive, and sun-colored amethyst), stoneware fragments, metal rivets and one rubber shoe. BCR Consulting personnel revisited the resource and checked its location and description using a hand-held GPS. It was found in place as recorded.
BCR Consulting has completed substantial research regarding the APE and there is no evidence to suggest that this historic-period refuse scatter is associated with events that have made a significant contribution to the broad patterns of American history (National Register Criterion A/California Register Criterion 1). That research has also failed to show that the resource is specifically associated with the lives of persons important to our past, or that persons of significant regional or national stature can be linked to it (National Register Criterion B/California Register Criterion 2). Such debris scatters are not indicative of the distinctive characteristics of a type, period, region, or method of construction, and do not represent the work of master, possess high artistic values, or represent a significant or distinguishable entity whose components may lack individual distinction (National Register Criterion C/California Register Criterion 3). The resource does appear to contain a high diversity of artifacts from many dumping episodes, and as such it does have potential to yield information important to the history of the region (National Register Criterion D/California Register Criterion 4). Finally, the resource does not meet criteria necessary to define it as a unique archaeological resource under CEQA. Because of the resource’s ability to meet criterion D/4, BCR recommends that it is potentially eligible for the National Register or the California Register, and as such is recommended a potential historic property under Section 106 of the NHPA, and a potential historical resource under CEQA.

DEIS/SEIR FOR A PROPOSED HCP AND SECTION 10 PERMIT FOR THE UPPER SANTA ANA RIVER WASH PLAN SECTION 3.9
USFWS / CONSERVATION DISTRICT 3.9-4 DECEMBER 2019
P-36-6068. This resource was previously recorded as a small scatter of debris including three hole-in-cap cans, one solder-seam can fragment, a riveted steel pipe, and an aluminum pull-tab beverage can along a dirt road among a cluster of eucalyptus trees. BCR Consulting personnel revisited the resource and checked its location and description using a hand-held GPS. The riveted pipe and eucalyptus trees were present, however no cans were identified and some peppertrees were also growing among the eucalyptus.
BCR Consulting has completed substantial research regarding the APE and there is no evidence to suggest that this historic-period refuse scatter is associated with events that have made a significant contribution to the broad patterns of American history (National Register Criterion A/California Register Criterion 1). That research has also failed to show that the resource is specifically associated with the lives of persons important to our past, or that persons of significant regional or national stature can be linked to it (National Register Criterion B/California Register Criterion 2). Such debris scatters are not indicative of the distinctive characteristics of a type, period, region, or method of construction, and do not represent the work of master, possess high artistic values, or represent a significant or distinguishable entity whose components may lack individual distinction (National Register Criterion C/California Register Criterion 3). The scatter is small and does not appear to have the potential for buried resources, and as such it is not likely to yield information important to the history or prehistory of the region (National Register Criterion D/California Register Criterion 4). Finally, the resource does not meet criteria necessary to define it as a unique archaeological resource under CEQA. Because of the resource’s failure to meet any of the above criteria, BCR Consulting recommends that it is not eligible for the National Register or the California Register, and as such is not recommended a historic property under Section 106 of the NHPA, or a historical resource under CEQA.
P-36-6072. This resource was previously recorded as structural foundations accompanied by three loci of domestic and architectural debris. Artifacts include cement blocks, steel cans, crimped beverage cans, clear bottle glass, wire nails, and a wooden box. BCR Consulting personnel revisited the resource and checked its location and description using a hand-held GPS. It was found in place. The structural foundations are seven poured-concrete bridge footings stamped “1944”. The footings are the remnants of the Santa Fe Railroad that traversed the area from before 1938 until the 1980s. The railroad tracks and ties are no longer present, although a dirt road remains within the original alignment.
BCR Consulting has completed substantial research regarding the APE and there is no evidence to suggest that this historic-period debris and 1944 railroad bridge footing is associated with events that have made a significant contribution to the broad patterns of American history (National Register Criterion A/California Register Criterion 1). That research has also failed to show that the resource is specifically associated with the lives of persons important to our past, or that persons of significant regional or national stature can be linked to it (National Register Criterion B/California Register Criterion 2). The debris and bridge footings are common types and are not indicative of the distinctive characteristics of a type, period, region, or method of construction, and do not represent the work of master, possess high artistic values, or represent a significant or distinguishable entity whose components may lack individual distinction (National Register Criterion C/California Register Criterion 3).

DEIS/SEIR FOR A PROPOSED HCP AND SECTION 10 PERMIT FOR THE UPPER SANTA ANA RIVER WASH PLAN SECTION 3.9
USFWS / CONSERVATION DISTRICT 3.9-5 DECEMBER 2019
The scatter is small and does not appear to have the potential for buried resources, and the local history of the Santa Fe Railroad is readily available and as such the resource is not likely to yield information important to the history or prehistory of the region (National Register Criterion D/California Register Criterion 4). The resource does not meet criteria necessary to define it as a unique archaeological resource under CEQA. Finally, the bridge was part of a larger railroad alignment that was dismantled by 1995 and as such it fails to convey integrity of setting, design, materials, workmanship, feeling, and association. It does retain locational integrity. Because of the resource’s failure to meet any of the above criteria and because of its lack of integrity, BCR Consulting recommends that it is not eligible for the National Register or the California Register, and as such is not recommended a historic property under Section 106 of the NHPA, or a historical resource under CEQA.
P-36-6074. This resource was previously recorded as a single episode of historic-period can, ceramic, and glass refuse. The site was reported destroyed in 2005. The 2015 survey efforts by BCR Consulting archaeologists have confirmed this.
P-36-6078. This resource was previously recorded as stone foundation and associated light refuse scatter. The site was reported destroyed in 2005. The 2015 survey efforts by BCR Consulting archaeologists have confirmed this.
P-36-6087. This resource was previously recorded as a series of historic-period domestic debris deposits composed of artifacts dated to ca. 1863-1900, and one apparent pet grave. BCR Consulting personnel revisited the resource and checked its location and description using a hand-held Global Positioning System (GPS). It was found in place as mostly as recorded, however BCR Consulting personnel note three loci and could only find two. It is likely that the northernmost locus (Locus A) has been destroyed.
BCR Consulting has completed substantial research regarding the APE and there is no evidence to suggest that this historic-period refuse scatter is associated with events that have made a significant contribution to the broad patterns of American history (National Register Criterion A/California Register Criterion 1). That research has also failed to show that the resource is specifically associated with the lives of persons important to our past, or that persons of significant regional or national stature can be linked to it (National Register Criterion B/California Register Criterion 2). Such debris scatters are not indicative of the distinctive characteristics of a type, period, region, or method of construction, and do not represent the work of a master, possess high artistic values, or represent a significant or distinguishable entity whose components may lack individual distinction (National Register Criterion C/California Register Criterion 3). The scatter is small and does not appear to have the potential for buried resources, and as such it is not likely to yield information important to the history or prehistory of the region (National Register Criterion D/California Register Criterion 4). Finally, the resource does not meet criteria necessary to define it as a unique archaeological resource under CEQA. Because of the resource’s failure to meet any of the above criteria, BCR Consulting recommends that it is not eligible for the National Register or the California Register, and as such is not recommended a historic property under Section 106 of the NHPA, or a historical resource under CEQA.

DEIS/SEIR FOR A PROPOSED HCP AND SECTION 10 PERMIT FOR THE UPPER SANTA ANA RIVER WASH PLAN SECTION 3.9
USFWS / CONSERVATION DISTRICT 3.9-6 DECEMBER 2019
P-36-6088. This resource was originally recorded in 1987 as a late 19th century historic-period ranch or farmstead that contained the remains of a cement block house, a cement and cobble foundation, various rock alignments, and debris concentrations. Updated field surveys in 2005, and the current effort reveal that the site has been destroyed.
Of the above resources, P-36-5526 (a historic-period orchard complex) was determined eligible for National Register listing (ergo eligible for California Register listing) in 1991. The 2015 CRA has confirmed this and has confirmed that the resource appears to retain integrity. As a result, this resource is recommended a historic property under Section 106 of the NHPA and a “historical resource” under CEQA. Additionally, P-36-6062 (a multiple-episode deposit of historic-period debris) is recommended potentially eligible for National Register and California Register listing eligibility due to its potential significance.
3.9.2.4 Paleontological Resources
Paleontological resources include fossils or assemblages of fossils that are unique, unusual, rare, or add to the existing body of knowledge either stratigraphically, taxonomically, or regionally. Such resources may include the remains of large to very small terrestrial and/or aquatic species that can assist in the interpretation of tectonic events, geomorphic evolution, paleoclimatology, and relationships of terrestrial and aquatic species.
The sediments in the Planning Area contain very coarse sediments deposited during latest Pleistocene and Holocene times. The sediments are topographically stratified with the oldest at the highest, near source elevation, and the youngest, most deeply inset, at the lowest topographic elevation. The sediments are too coarse to preserve significant paleontological specimens or are too young to preserve specimens of the Pleistocene period that could shed light on significant paleontological events.
Section 106 of the NHPA does not apply to paleontological resources unless they are found in a culturally-related context. In addition to the Antiquities Act (16 USC 431-433), the preservation and salvage of fossils and other paleontological resources can be protected under the National Registry of Natural Landmarks (16 USC 461-467) and the NEPA, which directs Federal agencies to “preserve important historic, cultural, and natural aspects of our national heritage.”
Potential impacts to paleontological resources must be accessed for any project subject to CEQA review. California law protects paleontological sites on State lands and establishes authority to protect paleontological resources while allowing mitigation through the permit process.
SECTION
3.10 NOISE
USFWS / CONSERVATION DISTRICT 3.10-1 DECEMBER 2019
3.10 NOISE
This section describes the affected environment related to noise in the Plan Area as well as the immediate vicinity.
3.10.1 REGULATORY SETTING
Information regarding Federal, State, and Local regulations in regards to noise can be found in Appendix B.
3.10.2 ENVIRONMENTAL SETTING
The Plan Area contains the following land uses: water conservation, flood control, water production, habitat conservation, unmanaged open space, aggregate mining, arterial/highway, agriculture, and vacant land. Surrounding the Plan Area are residential, agriculture, light industrial, and open space land uses as well as the Redlands Airport and the San Bernardino International Airport.
3.10.2.1 Existing Noise Environment
The existing substantial noise sources in the Plan Area include aggregate operations, including Cemex and Robertson’s, Redlands Municipal Airport, San Bernardino International Airport (formerly Norton Air Force Base), and State and local transportation facilities. Aggregate mining facilities generate noise and groundborne vibration from sand and gravel operations and haul trucks that transport the raw materials. The Redlands Municipal Airport is located immediately south of the Plan Area, and the San Bernardino International Airport is located immediately west of the Plan Area. Areas surrounding the Redlands Municipal Airport and the San Bernardino International Airport are exposed to aircraft noise. Traffic on Greenspot Road, SR-210, Orange Street, Opal Avenue, and Alabama Street also contribute to the existing noise levels in the Plan Area.
Ambient Noise Monitoring in the Project Vicinity
An ambient noise survey was conducted in 2003 and data from the survey was included in the Conservation District’s November 2008 Final EIR (SCH No. 2004051023) for the Upper Santa Ana River Wash Land Management and Habitat Conservation Plan. Ambient noise measurements were taken for 20 minutes each at six sites in and adjacent to the Plan Area. These measurements were conducted to document the existing noise environment levels. Four of the six measurements represent noise-sensitive locations in the vicinity of the Plan Area. Two of the six noise measurements represent locations where ambient noise is dominated by noise generated by aggregate mining operations. Table 3.10-1 summarizes the noise measurement data from the six noise monitoring locations that are shown in Figure 3.10-2, Noise Monitoring Locations.

DEIS/SEIR FOR A PROPOSED HCP AND SECTION 10 PERMIT FOR THE UPPER SANTA ANA RIVER WASH PLAN SECTION 3.10
USFWS / CONSERVATION DISTRICT 3.10-2 DECEMBER 2019
Table 3.10-1: Ambient Noise Monitoring Results
Monitor Location Start Time and Duration Noise Sources Leq
(dBA)
M-1
Residence at 7998 Cortez Street, Highland, located at the corner of Cortez Street and Merris Street (about 600 feet from Plan boundary).
9:48 a.m.
20 minutes
Activity with the use of a hammer from nearby aggregate mining facility and birds.
45.4
M-2
Residences along Abbey Way, Highland, located about 50 feet north of aggregate facility.
10:53 a.m. 20 minutes
Stacking conveyor, screen, crusher, and activity with a use of a hammer in the background.
54.5
M-3 Aggregate operations along Orange Street at the Cemex weighing station and the office building in the City of Redlands.
11:21 a.m. 20 minutes
Heavy trucks at 15 mph, stacking conveyor (approximately 100 feet), car radio, and activity with the use of a hammer in the background.
65.6
M-4 Aggregate operations along Alabama at the Hot Asphalt Plant and Cemex, Redlands.
12:06 p.m. 20 minutes
Traffic along Alabama, trucks entering and exiting the facility. 63.8
M-5
Residence at 1956 Cave Street, Redlands, located at the corner of Cave Street and Riverview Street (about 725 feet from Plan boundary).
12:40 p.m. 20 minutes
Heavy truck activity, rock tumbling, some aircraft noise, and faint sounds of a gunshot or engine backfiring.
48.2
M-6
Residence at 828 Riverview Street between Church Street and Duke (about 525 feet from Plan boundary).
1:10 p.m. 20 minutes
Noise from the Cemex facility, truck noises in the background, birds, and tree leaves.
52.0
Source: Conservation District’s November 2008 Final EIR (SCH No. 2004051023) for the Upper Santa Ana River Wash Land Management and Habitat Conservation Plan.
Existing Traffic Noise
The Federal Highway Administration (FHWA) highway traffic noise prediction model (FHWA RD-77-108) was used to evaluate traffic-related noise conditions in the Plan Area. This model requires various parameters, including traffic volumes, vehicle mix, vehicle speed, and roadway geometry, to compute typical equivalent noise levels during daytime, evening, and nighttime hours. The modeling parameters for the existing average daily traffic (ADT) volumes, vehicle speed, and roadway geometry were obtained from the Traffic Study (LSA 2007). The following lists the parameters used for each roadway.
● Greenspot Road. Greenspot Road was modeled as a four-lane divided roadway (two lanes in each direction) with vehicle speeds at 50 miles per hour (mph).
● Alabama Street. Alabama Street was modeled as a two to four-lane roadway (varying from one to two lanes in each direction) with vehicle speeds at 45 mph.
● Boulder Avenue. Boulder Avenue was modeled a two-lane roadway (one lane in each direction) with vehicle speeds at 40 mph.
The vehicle mix was assumed to be 97.42 percent automobiles, 1.84 percent medium trucks, and 0.74 percent heavy trucks. The resultant noise levels are weighted and summed over 24-hour periods to determine the community noise equivalent level (CNEL) values. Table 3.10-2 provides the existing traffic noise levels along Greenspot Road, Alabama Street, and Boulder Avenue. These noise levels represent the worst-case scenario, which assumes that no shielding is provided between the traffic and the location where the noise contours are drawn. The specific assumptions used in developing these noise levels and the model printouts are provided in the Conservation District’s November 2008 Final EIR, Appendix I – Noise Model Printouts.

DEIS/SEIR FOR A PROPOSED HCP AND SECTION 10 PERMIT FOR THE UPPER SANTA ANA RIVER WASH PLAN SECTION 3.10
USFWS / CONSERVATION DISTRICT 3.10-3 DECEMBER 2019
Table 3.10-2: Existing Traffic Noise Levels
Roadway Segment
ADT Centerline to 70 CNEL
feet)
Centerline to 65 CNEL
(feet)
Centerline to 60 CNEL
(feet)
CNEL (dBA) 50 feet from
Outermost Lane 5th Street West of Alabama Street 9,060 < 50* 86 180 66.1 Between Alabama Street and Church Avenue 17,780 65 132 281 69.0
Between Church Avenue and State Route 210 westbound ramp 18,600 67 136 289 69.2
Between State Route 210 westbound ramp and State Route 210 eastbound ramp
18,580
67
136
289
69.2
Between State Route 210 eastbound ramp and Boulder Avenue 17,555 64 131 278 69.0
East of Boulder Avenue 13,780 56 112 237 67.9 Alabama Street North of 5th Street 7,970 < 50 68 139 64.4 Between 5th Street and 3rd Street 15,475 < 50 102 215 67.3 Between 3rd Street and Robertson’s Access 11,495 < 50 82 176 67.5
Between Robertson’s Access and Cemex Access 10,670 < 50 78 167 67.2
South of Cemex Access 10,250 < 50 76 163 67.0 Boulder Avenue North of Greenspot Road 6,420 < 50 < 50 98 63.7 South of Greenspot Road 9,420 < 50 59 127 65.4 North of Cemex Access 14,910 < 50 80 172 67.3 South of Cemex Access 14,940 < 50 80 172 67.4 * Traffic noise within 50 feet of the roadway centerline should be evaluated with site-specific information. Source: Traffic Study 2007, Conservation District’s November 2008 Final EIR (SCH No. 2004051023) for the Upper Santa Ana River Wash Land Management and Habitat Conservation Plan.
As shown in Table 3.10-2, traffic noise is generally moderate to high along the existing roadway segments in the project vicinity. The 70, 65, and 60 dBA impact zones extend 67, 136, and 289 feet along the Greenspot Road centerline. Also, Table 3.10-2 shows that the 70 dBA impact zone is confined to the right-of-way along Alabama Street and Boulder Avenue. The 65 and 60 dBA impact zones extend 102 and 215 feet along Alabama Street. The 65 and 60 dBA impact zones extend 80 and 172 feet along the Boulder Avenue centerline.
As outlined in Section 4.7, Transportation Systems and Traffic, at the time the Traffic Study was prepared in 2007, the now designated SR-210 that runs north-south in the western portion of the Plan Area was designated SR-30. The mainline freeway section between I-210 in Glendora and the I-10 in Redlands was completed in 2007. Caltrans census data was reviewed to determine if there have been any significant changes in volume along SR-210 in the Plan Area since the Traffic Study was prepared in 2007. SR-210 is the primary traffic route through the Plan Area and the best available indicator of traffic volume trends in the study area since 2007.
Based on Caltrans’ traffic volume data there has been an increase in Annual Average Daily Traffic (AADT) on SR-210 at Fifth Street in Highland from 2007 to 2016 from 90,000 to 97,000, which represents a 7.7%

DEIS/SEIR FOR A PROPOSED HCP AND SECTION 10 PERMIT FOR THE UPPER SANTA ANA RIVER WASH PLAN SECTION 3.10
USFWS / CONSERVATION DISTRICT 3.10-4 DECEMBER 2019
increase over a 9-year period or a 0.86% increase per year if averaged over the 9-year period. The ambient growth rate used in the Traffic Study was 2% annually. Therefore, the cumulative analysis contained in the Traffic Study is a conservative estimate (considered worst-case) of the potential traffic impacts from proposed aggregate mining trips, cumulative projects in the area, and ambient growth. Consequently, as the traffic-related noise conditions outlined in Table 3.10-2 were based on Traffic Study data, they are also expected to still illustrate a reasonable scenario when compared to current conditions.
Existing Mining Operations
Two aggregate mining and processing operations comprise a total of 832 acres, or 18.6 percent of the total Plan Area. The existing mining and processing operations are generally located in the western and central western portions of the Plan Area. The Cities of Highland and Redlands have approved land use permits for the existing mining operations.
Cemex is currently conducting excavations in the approved Alabama Street Northwest, Northeast, and Southeast quarries adjacent to SR-210 and is using the portions of the East Quarry North for mining, processing at the Orange Street Plant, and silt ponds and aggregate storage. Aggregate processing occurs at both the Alabama Street and the Orange Street Plants, and concrete batching occurs at the Alabama Street plant. From the years 2003 through 2005, Cemex had an average annual processing rate of 2.5 million tons per year (MTPY). Currently Cemex has an annual processing rate of approximately 2.0-2.5 MTPY.
Robertson’s currently operates an aggregate facility at the East Basin Processing Plant and a concrete batch plant at its West Basin facility. Excavations are currently conducted in the former “Webster Pit” area, to be a part of the East Quarry South. From 2003 to 2005, Robertson’s has an average annual processing rate of approximately 2 MTPY. Robertson’s has land use approval to produce 2 MTPY at its East Basin Processing Plant. Currently, Robertson’s has an annual processing rate of approximately 2.0- 2.5 MTPY.
Existing Operation & Maintenance Activities
Existing Operation & Maintenance Activities that occur in the Plan Area include aggregate mining operations, operation and maintenance of water conservation facilities (spreading basins, dikes, weir gates, and access roads), general water wells and pipeline maintenance, flood control channels, levees, and outlets, and other structures and access roads, as well as operation of the 6.7-acre citrus grove.
The types of equipment used for these operation and maintenance activities include dozers, excavators, pickup trucks, haul trucks, scrapers, pavers, rollers, cranes, flatbed trucks, drill rigs, pump hoists, dump trucks, water trucks, and vacuum street sweepers. The different operations and maintenance activities, equipment needs for each, and the max noise level based on the type of equipment used are outlined in detail in Table 3.10-3 below.

DEIS/SEIR FOR A PROPOSED HCP AND SECTION 10 PERMIT FOR THE UPPER SANTA ANA RIVER WASH PLAN SECTION 3.10
USFWS / CONSERVATION DISTRICT 3.10-5 DECEMBER 2019
Table 3.10-3: Construction and O&M Equipment Noise Levels
Activity Description Frequency Equipment Used Max Noise Level (dBA)
Aggregate mining
New aggregate mining Surface excavation Crusher, excavator, haul truck, dozer 96
Haul road expansion Extension and construction Once Dozer, dump truck, excavator, front end loader, scraper, water trucks 91
Mining operations buildings, parking lots lighting, settling ponds, pits, and haul roads
Ongoing 24 hours/day Haul trucks 94
Water conservation Spreading operations – water measurements and water diversion, and monitoring
Conservation District staff driving to locations
Daily
Pickup truck
55
Basin maintenance – replace and repair
Facility repair (ex. Weir gates, dikes), access (ex. Fences, gates, locks, signs boulders)
As needed
Concrete truck, dozer, dump truck, excavator, pick up truck, water truck, welder
91
Basin maintenance – removal
Debris, silt, and vegetation removal
Annual (wet years) or 5
years (average)
Dozer, excavator
88
Basin maintenance – bank grading
Dozer 85
Stockpile and processing Materials from cleanout are stockpiled on site/nearby and later transported
Dozer, excavator 88
Access road construction Construction and resurfacing Dozer 85
Access road maintenance Clearing encroaching vegetation, grading, resurfacing, repairing washouts, filling ruts and potholes
Dozer, excavator, pickup truck 88
Access road maintenance Encroaching vegetation clearing – clearing sides of roads annual Dozer or weed eater 85
Access road maintenance Vegetation maintenance – clearing of roads Quarterly Dozer 85
Basin construction – vegetation clearing
Clearing and grubbing
Between September
and February
Dozer
85
Basin construction – soil removal Grading/ excavation of basins
Dozer, excavator, haul truck 95
Greenspot channel improvements Channel improvements at road crossing
Dozer, excavator, haul truck 89

DEIS/SEIR FOR A PROPOSED HCP AND SECTION 10 PERMIT FOR THE UPPER SANTA ANA RIVER WASH PLAN SECTION 3.10
USFWS / CONSERVATION DISTRICT 3.10-6 DECEMBER 2019
Activity Description Frequency Equipment Used Max Noise
Level (dBA) Wells and water infrastructure
Well construction
Access road, detention basins, connector pipelines, main pipelines; construction involves clearing and grubbing vegetation, rough grade, drilling, soil removal and transport
Concrete truck, crane, drill rig truck, excavator, haul truck, water truck
96
General well maintenance – inspection, sampling, repairs, weeding, minor grading
Dozer, pickup truck
85
General well maintenance – well motor pulling
5-6 years Crane, flatbed truck 88
General well maintenance – rehabilitation, redevelopment, and/or replacement
Temporary removal of above ground equipment, brushing and bailing, chemical treatment, redevelopment, and reinstallation of above ground equipment
Air compressor, cable-tool rig, drill rig or pump hoist equipment
86
General well maintenance – testing
Step drawdown testing, constant rate pumping test, spinner surveys, downhole video survey, casing sidewall sampling, biological activity test, packer testing
15 years (pump testing)
Pickup truck
55
General waterpPipeline maintenance – leak repair, internal inspection, water release
Includes maintenance of turnouts; replace/repair appurtenances, fittings, manholes, and meters; meter inspections and repairs; maintenance of pump stations, operation yards, utility yards, and corporation yards, may require blow off, vault maintenance
Pickup truck
55
Water pipeline –rehabilitation and/or replacement Pipeline components may require excavation
Crane, excavator, flatbed truck, haul truck, pickup truck 95
Water pipeline – bank stabilization and erosion control
May require excavation
Loader
85
Water pipeline – replacement/ repair of buried service valves May require excavation and bank stabilization activities
Excavator, haul truck 95
Water pipeline – telemetry cable/system inspections and repairs
Often sited in the center of roads and may require excavation to access components
Dozer, excavator, pickup truck
88
Transportation
Street widening and improvements
Road widening and improvements including curb, gutter, sidewalk, landscaped parkway, roadway drainage and streetlights
Concrete trucks, crane, dozer, excavator, haul trucks, pavers, pick up truck, rollers, water trucks
97

DEIS/SEIR FOR A PROPOSED HCP AND SECTION 10 PERMIT FOR THE UPPER SANTA ANA RIVER WASH PLAN SECTION 3.10
USFWS / CONSERVATION DISTRICT 3.10-7 DECEMBER 2019
Activity Description Frequency Equipment Used Max Noise Level (dBA)
General road maintenance Shoulder grading Weed control Sign and guardrail
replacement Street sweeping Drainage facility
management Striping Slurry seal Overlay
At inlets and outlets
As needed As needed As needed
As needed Annual
2-3 years 6-7 years 20 years
Loader Pickup truck Pickup truck
Vacuum street sweeper
Excavator, pickup truck Pickup truck Pavement scarifier, paver Rollers, paver, dump truck, water truck
Flood control
Elder/Plunge Creek Restoration Project
Lead remediation, construction, operation and maintenance
Excavator, haul truck, crane, concrete truck, dozer 96
In-stream maintenance – centerflow channel, debris removal, full clean out
Clear sediment and vegetation Full clean out
– 15 years
Dozers, scrapers, haul trucks
95
Access road maintenance Grading, repair potholes and wash-outs, fencing/gate repairs, small excavations for pothole or shoulder slump
Dozers, roller, pickup truck 88
Access road maintenance Large excavations for install/repair culverts or drainage ditches, repair slope failures
Dozer, excavator, water truck, concrete truck, haul truck 95
Levee maintenance
Weed control, facility repair (fill material and rock lining), erosion repair, armor levee face, storm damaged facilities, security maintenance (gates, barriers, fencing)
Scrapers, front end loader, dozers, excavator, haul truck, concrete truck, haul truck, pickup truck
55-95
Stockpiling Debris placement Haul truck, excavator 95
Maintenance and operations of drainage facilities
Herbicide application channel and road maintenance, repair and sediment removal, rebuild, security maintenance, drain pipes or utility installation
Pick up truck, scraper, dozer, front end loader, excavator, water truck, concrete truck, haul truck
55-95
Drainage channel and outlet/ dissipater operation and maintenance
Pick up truck, front end loader
80
Drainage and dissipater construction
Excavator, haul truck, concrete truck, water truck, crane 95

DEIS/SEIR FOR A PROPOSED HCP AND SECTION 10 PERMIT FOR THE UPPER SANTA ANA RIVER WASH PLAN SECTION 3.10
USFWS / CONSERVATION DISTRICT 3.10-8 DECEMBER 2019
Activity Description Frequency Equipment Used Max Noise Level (dBA)
Trails
Patrols and maintenance Pickup truck 55
Access control Barricade, gate, fencing Pickup truck, welder, dozer 85
Access road maintenance
Clearing roads of vegetation, grading, resurfacing, repairing washouts Clearing vegetation on sides of road
Quarterly
Annual
Dozer, pickup truck
85
SART construction and crossing
Trail construction and post/cable barrier construction
Dozer, paver, roller, pickup truck, haul truck, concrete truck, water truck, welder, excavator
95
Highland/Redlands Regional Connector
Construction of bike lane
Dozer, excavator, rollers, pavers, haul trucks, water trucks, concrete trucks, pic up truck, crane
97
Habitat enhancement and monitoring
Levee removal Boulder placement, removal of rock and other materials and transport
Dozer, excavator, haul trucks 88-95
SBKR bridge Grading, pipe placement, welding, backfill Excavator, dozer, dump truck 89
Plunge Creek Project Access road construction, excavation, boulder placement Dozer, excavator, haul truck, crane 85-95
Agriculture
Access road maintenance Dozer 85
Irrigation infrastructure maintenance, pesticide and fertilizer application, grove pest (vertebrate) management
Pickup trucks
55
Source: Conservation District, March 2018.

USFWS / CONSERVATION DISTRICT 3.11-1 DECEMBER 2019
SECTION
3.11 3.11 HAZARDS
This section describes the existing conditions for hazards in the Plan Area.
3.11.1 REGULATORY SETTING
HAZARDS
Information regarding Federal, State, and Local regulations in regards to hazards can be found in Appendix B.
3.11.2 ENVIRONMENTAL SETTING
A hazardous material may become hazardous waste consequent to its accidental discharge into the environment and, if handled inappropriately, hazardous materials and hazardous waste could pose potential risks to the health, safety, and welfare of workers in the Plan Area and adjacent occupants. The following discussion details three different types of key existing hazards and hazardous materials associated with the Plan Area:
● Hazardous Materials sites;
● Mining hazards;
● Aviation hazards; and
● Wildland fire hazards.
3.11.2.1 Hazardous Materials Sites
Current studies have shown from 1945 to mid-2009, the Inland Fish and Game (IF&G) Conservation Association (a nonprofit mutual benefit corporation) operated an open-air recreational shooting area or shooting facility on approximately 40 acres of BLM lands in the area west of the intersection of Boulder Avenue and Orange Street. The BLM continuously issued leases under the Recreation and Public Purposes Act (43 CFR Part 2740) to the nonprofit corporation for sport shooting from 1964 to 2012. The authorized facility included a rifle and pistol range, a shotgun range for trap and skeet, and a meeting hall with a kitchen and snack bar facilities. The facility was open to the public and members. Prior to use as a shooting range, the southeastern portion of the property was used for a gravel operation. A historical aerial photograph, dated 1938, shows the quarry, several structures, a conveyor system, and some small ponds. The Santa Ana River Wash contains high quality construction aggregates that have been mined since the 1920s. The mining operations ceased some time prior to 1948.
From 1959 until about 1963, approximately 10 acres of the property were used as a cut-and-fill dump (Plunge Creek Levee Dump). Materials disposed may have included non-hazardous and inert solid wastes, such as residential and commercial waste, construction and demolition waste and debris,

USFWS / CONSERVATION DISTRICT 3.11-2 DECEMBER 2019
DEIS/SEIR FOR A PROPOSED HCP AND SECTION 10 PERMIT FOR THE UPPER SANTA ANA RIVER WASH PLAN SECTION 3.11
agricultural refuse, and used tires. Solid waste and construction debris were used to construct a flood- control levee along the northern boundary of the site. This levee was approximately 1,000 feet long and 25 feet high. Rubbish and debris were used to form the base of the flood control debris levee, which was covered with approximately 2 feet of cover soil after the levee was completed. There is no information indicating the quantities of material that were dumped. The flood control debris (trash) levee is not included within the Elder/Plunge site limits and will not be disturbed to maintain cover integrity. A concrete v-ditch will be installed north of the trash levee to prevent off-site migration of trash or contaminated soil.
In July 2007, a lawsuit was filed against IF&G Conservation Association by the owner of the adjacent property to the north. The lawsuit involved allegations that lead shot from the shotgun range reached the adjacent private property without authorization from the property owner. In October 2007, BLM directed IF&G to cease shooting activities at the shotgun range to prevent additional lead shot from entering the adjacent private property. On July 30, 2009, IF&G Conservation Association informed the BLM that they were ceasing all shooting at the leased facility to assess legal options. On August 3, 2012, the BLM decided to cancel the Recreation and Public Purposes Act lease.
According to the DTSC Envirostor website (www.envirostor.dtsc.ca.gov/public/) accessed on August 23, 2017) a voluntary cleanup site is located outside of the Plan Area boundary on private property north of and adjacent to the BLM property discussed above. EnviroStor is the DTSC’s data management system for tracking cleanup, permitting, enforcement and investigation efforts at hazardous waste facilities and sites with known contamination or site where there may be reasons to investigate further. This site consists of approximately 22 acres of undeveloped land in a rectangular shape. Although the site does not appear to have been developed, various wood, concrete, asphalt, and miscellaneous debris was observed on site. A Metropolitan Water District (MWD) easement, approximately 90 feet by 1,300 feet, covers the southern portion of the site. The MWD easement includes a 12-foot diameter water pipeline and associated appurtenances, power poles, and a fire road. The site owner is Highland Fifth-Orange Partners, LLC (HFO).
Based on the results of previous investigations, the southern portion of the site is impacted with lead from shotgun lead pellet fallout from the adjacent trap, skeet and rifle range. During previous investigations, lead was detected at a maximum concentration of 70,000 milligrams per kilogram (mg/kg) in unsieved samples to remove lead fragments. Antimony, arsenic, and nickel were also detected in soil. Additionally, empty used oil containers and stained soil were observed in two areas on site.
In March 2013, DTSC approved a Site Assessment Plan to determine the nature and extent of contamination associated with lead pellet fallout and waste oil release, and whether these releases pose an unreasonable risk to public health and safety or the environment. The Site Assessment Plan was implemented from May 30 through June 6, 2013. Field activities included s-ray fluorescence screening for lead shot, and soil sampling for lead shot, clay pigeon debris, and discarded oil containers.

USFWS / CONSERVATION DISTRICT 3.11-3 DECEMBER 2019
DEIS/SEIR FOR A PROPOSED HCP AND SECTION 10 PERMIT FOR THE UPPER SANTA ANA RIVER WASH PLAN SECTION 3.11
In October 2013, DTSC approved a Site Assessment Report that documents findings of an investigation to characterize the nature and extent of contamination from lead shot, discarded waste oil containers, and possible clay pigeons at the site. The report also presented an evaluation of potential risk to public health and safety or the environment. Various environmental approvals or reviews, including Federal Environmental Management Agency (FEMA), United States Army Corps of Engineers, United States Fish and Wildlife Service, and the California Department of Fish and Wildlife, are required before can proceed with a Response Plan to address lead shot on the surface and elevated lead concentrations in the soil. Due to inactivity at the site, the project status was changed to Inactive – Action Required on July 29, 2016, and the site code was deactivated to prevent accidental charges. On March 3, 2017, DTSC received an email from the consultant for HFO requesting direction on restarting the project since critical path issues have been resolved and HFO is clear to proceed with the lead mitigation.
Mining Hazards
Mining activities within the Plan Area involve the use of materials commonly used in the industry, including concrete admixtures, fuels, oils, and lubricants. The transport, storage, and handling of these substances are routinely conducted at the mining sites, and usage varies depending on production levels and haul distances. Tanks for storage of fuels and oils are permitted and installed in accordance with local and State regulations.
Maintenance is conducted by Cemex on mining equipment and vehicles at its maintenance shop off Alabama Street. The Orange Street and Alabama Street plant sites in the City of Redlands generates hazardous wastes such as waste oils, grease, hydraulic fluid, and solvents. Maintenance is also conducted by Robertson’s on trucks and equipment at its workshop located on 3rd Street near Alabama Street. Solvents used for maintenance, waste oil, and hydraulic fluids are typical hazardous wastes generated at this location.
Recycling is practiced for used oils and other waste hydrocarbon products. Although areas of the Plan Area store these waste products, the waste products are periodically removed by a licensed private recycler. Required time limits are placed on the removal of solvents and other hazardous wastes after they are stored in approved containers and appropriately labeled.
Aviation Hazards
The Plan Area is bordered by the San Bernardino International Airport to the west and the Redlands Municipal Airport to the south.
San Bernardino International Airport. The San Bernardino International Airport Traffic Pattern Zone is located west of the Plan Area and includes all portions of the airport’s designated traffic pattern and pattern entry routes. The area surrounding the airport that has potential to be affected by airport operations is considered the Airport Influence Area in which the western portion of the Plan Area is included. The Inner Turning Zone is considered an area where aircraft are typically turning and

USFWS / CONSERVATION DISTRICT 3.11-4 DECEMBER 2019
DEIS/SEIR FOR A PROPOSED HCP AND SECTION 10 PERMIT FOR THE UPPER SANTA ANA RIVER WASH PLAN SECTION 3.11
descending for landing, or turning and climbing for departure, in which a small portion in the northwest corner of the Plan Area is included.
Redlands Municipal Airport. The Redlands Municipal Airport Influence Area is comprised of varying Compatibility Zones in which the Plan Area’s southern tip boundary is located. Compatibility Zones A, B1, B2, and C are within the Plan Area’s boundary. Zone A restricts uses in the area to aeronautical functions and includes the airport runway and immediately adjacent areas. Zone B1 is described as the area for the approach/departure of aviation and Zone B2 is an extension of Zone B1. Zone C includes zones where aircraft at an altitude of 1,000 feet or less are commonly overflown.
The City of Highland’s southern edge boundary includes an area of Special Compatibility Concern. Section 2.2.4 of the Redlands Municipal Airport Land Use Compatibility Plan states:
2.2.4. Areas of Special Compatibility Concern. The purpose of this designation is to take note of
locations which: (1) are routinely overflown by aircraft approaching and/or departing the Redlands Municipal Airport, but at some distance from the airport; and (2) have existing and planned land uses which are compatible with the airport activity.
(a) Notation of areas of special compatibility concern is intended to serve as a
reminder that airport impacts should be carefully considered in any decision to change the current land use designation.
(b) These areas are not part of the Redlands Municipal Airport influence area and are not subject to the review policies contained in this Compatibility Plan, except with respect to the notification requirements indicated in Paragraph 1.8.4. Also, establishment of a buyer awareness program is encouraged if any of these areas are to be converted to residential uses.
(c) The only portion of the Redlands Municipal Airport environs designated in this manner is the southern edge of the City of Highland.
Wildland Fire Hazards
The majority of the Plan Area consists of undeveloped wildland containing shrubs, grasses or a combination of the two, all of which are susceptible to wildland fire. In addition, portions of the Plan Area are located near natural hillsides with vegetation considered susceptible to wildland fires. The northeastern portion of the Plan Area is located within the City of Highland’s Fire Severity Zone II, as depicted in Figure 6.6 of the City of Highland General Plan and established by the Uniform Building Code. Zones I and II are expressed as areas at high-risk for fire. Zones I and II contain standards established by the Uniform Building Code for fire safety to be built into structures of various types and in which certain occupancies are prohibited in Zones I and II. The City of Redlands’ High Fire Hazard Zone is located within some portions of the Plan Area as well as the San Bernardino County Fire Safety Overlay District’s FR-2 Fire Safety Review Area 2.

USFWS / CONSERVATION DISTRICT 3.11-5 DECEMBER 2019
DEIS/SEIR FOR A PROPOSED HCP AND SECTION 10 PERMIT FOR THE UPPER SANTA ANA RIVER WASH PLAN SECTION 3.11
A number of agencies provide fire protection for to the Plan Area. The California Department of Forestry and Fire Protection provide fire protection and emergency medical services for the City of Highland. The City of Redlands Fire Department provides fire protection services to the City of Redlands. Mutual aid agreements with other agencies are also implemented by the cities. The City of Highland has mutual aid agreements with the Cities of Redlands and Yucaipa, California Department of Forestry and Fire Protection, and the U.S. Forest Service. The City of Highland also participates in the Statewide Master Mutual Aid Agreement, which provides assistance from other fire departments throughout the State.

USFWS / CONSERVATION DISTRICT 3.11-6 DECEMBER 2019
DEIS/SEIR FOR A PROPOSED HCP AND SECTION 10 PERMIT FOR THE UPPER SANTA ANA RIVER WASH PLAN SECTION 3.11
This page intentionally left blank.

SECTION
3.12 RECREATION
USFWS / CONSERVATION DISTRICT 3.12-1 DECEMBER 2019
3.12 RECREATION
This section describes the regulatory and physical environmental setting for recreation in the Plan Area.
3.12.1 REGULATORY SETTING
Information regarding, Federal, State, and Local regulations in regards to recreation can be found in Appendix B.
3.12.2 RECREATIONAL SETTING
This section describes the existing conditions for recreational resources within the Plan Area. Although there are existing access roads used for mining, water conservation, municipal water utilities, and flood control operations and maintenance, there are currently no existing trails or other recreational facilities developed for the purpose of recreational use by the public within the Plan Area. Section 4.12 of this document will address the proposed trails which are conditional Covered Activities in the Wash Plan HCP. There are currently no parks or developed recreational opportunities within the Plan Area. The City of Redlands has plans for a future park located adjacent to the southern boundary of the Plan Area. Centennial Park is a proposed 18.5-acre park between Orange Street and Riverview Drive near the proposed Santa Ana Trail.
Conservation District Lands
Access to existing access roads/trails within lands currently owned by the Conservation District of approximately 1,907 acres can be obtained by trail users with a Common Use Agreement from the Conservation District for legal access to trails that are used for flood control operations.
Other Lands in the Wash Plan Area
In addition to BLM (approx. 970 acres) and Conservation District lands, there are lands owned by different municipalities including Highland (approx. 40 acres), Redlands (approx.160), and SBCFC (approx. 1,035). There are also private lands including, lands owned by Robertson’s (approx. 339) and others. Currently there are no recreational facilities on these lands. BLM lands are currently gated at access points and are generally accessible to the public only with permission.

DEIS/SEIR FOR A PROPOSED HCP AND SECTION 10 PERMIT FOR THE UPPER SANTA ANA RIVER WASH PLAN SECTION 3.12
USFWS /CONSERVATION DISTRICT 3.12-2 DECEMBER 2019
This page intentionally left blank.