section 5 hazards assessment 5.1 o verview of the risk
TRANSCRIPT

Santa Barbara County 2011 Multi-Jurisdictional Hazard Mitigation Plan
5-1
SECTION 5 HAZARDS ASSESSMENT
During the 2011 update, the Mitigation Advisory Committee reviewed the existing prioritization of identified hazards and risk assessment. Through a collaborative process at the first milestone MAC meeting on October 26, 2010, the committee re-organized some of the identified hazards and added Agricultural Pests and Diseases for consideration. This process is detailed in Section 5.2. Hazard profiles for each of the identified hazards in the order of priority as determined by the MAC begin with Section 5.3. The hazard profiles have been updated to reflect the most current hazard history and data.
5.1 OVERVIEW OF THE RISK ASSESSMENT PROCESS
The Santa Barbara County Mitigation Advisory Committee updated this hazard mitigation plan by reviewing and revising the risk assessment process conducted in the previous plan. The risk assessment conducted followed a process similar to that outlined in the FEMA State and Local Mitigation Planning How-to-Guide:
1. Identify Hazards The purpose of this step is to determine the hazards that pose a threat to the County’s geographical area. Modifications to the identified hazards and updates to the prioritization are presented in Section 5.2 Hazard Identification and Prioritization.
2. Profile Hazards Updated hazard profiles are presented in Section 5.3 Hazard Profiles. Maps of identified hazards are included in the applicable hazard profiles within Section 5.3.
3. Identify Assets Each participating jurisdiction identified critical facilities for inclusion in
vulnerability assessments. Where available replacement values were assigned to the identified facilities to assist in predicting the extent of potential damage. The County’s critical facilities are presented in Section 6.1 Asset Inventory. Each of the incorporated City’s critical facilities are presented in the respective City annexes.
4. Assess Vulnerability A countywide exposure analysis is included in Section 6.2 Exposure
Analysis to present an understanding of the total value at risk to natural hazards throughout the County. A vulnerability analysis of the County’s critical facilities by hazard is presented in Section 6.3 County Vulnerability Assessment. Vulnerability assessments for each of the City’s lists of critical facilities are presented in the respective City annexes. The vulnerability analyses inform development of mitigation strategies by quantifying the potential damage due to any given hazard.
5.2 HAZARD IDENTIFICATION AND PRIORITIZATION
5.2.1 Hazard Identification
As part of the plan update process, the MAC reviewed the plan’s hazard identification and prioritization section during their first milestone meeting on October 26, 2010. Through discussion of

Santa Barbara County 2011 Multi-Jurisdictional Hazard Mitigation Plan
5-2
the hazards that were profiled in and excluded from the previous plan, the MAC agreed to make three changes to the previous plan hazard list. First, the MAC agreed to add a Climate Change consideration to all relevant profiled hazards. Second, the MAC identified Agricultural Pests & Disease as a new hazard to profile in this plan. Lastly, the MAC decided to separate Coastal Storm Surge from Tsunami and to consider coastal storm within the flood profile. Table 5.1 shows a summary of the rationale for identified hazards within Santa Barbara County as documented in the original plan and revised during the MAC’s discussion throughout the update process.
Table 5.1 Summary of Profiled Hazards
Hazard Representative Data Collected for Hazard Identification Justification for Inclusion
Flood/Coastal Surge
• FEMA FIRM Maps • Base flood elevations (FEMA) • Historical flood records and recent
damage location maps • Santa Barbara County Water
Conservation and Flood Control District • Santa Barbara County Floodplain
Management Plan • FEMA Hazards website
• Much of Santa Barbara County is located within the 100-year floodplain
• Flash floods and other flood events occur regularly during rainstorms due to terrain and hydrology of Santa Barbara County
• Every Jurisdiction within the County, except Guadalupe has FEMA mapped flood hazard areas
• There have been 10 Proclaimed Disaster Declarations as a result of flooding in Santa Barbara County
Wildfire • CDF-FRAP • USFS • CDFG • Topography • County Fire • County OEM • Historical fire records • FEMA Hazards website
• Santa Barbara County experiences wildfires on a regular basis – history presented below
• Fuels, weather, and topography in Santa Barbara County.
• Sundowner Winds.
Earthquake • USGS • CGS • CISN • FEMA-HAZUS 99 • FEMA Hazards website
• Several active fault zones pass through Santa Barbara County
• Historical Earthquake Damage
Tsunami • Maximum Tsunami Run up Projections (Cal EMA)
• FEMA FIRM Maps • FEMA Hazards website
• Coastal storms history • Coastline stabilization measures have been
implemented at various times in the past (erosion)
• Extensive development along the coast Landslide/Coastal Erosion
• USGS • CGS • Tan Map Series • Steep slope data (USGS DEM) • FEMA FIRM V-Zones • FEMA-HAZUS
• Steep slopes within earthquake zones characterize Santa Barbara County, which creates landslide risk.
• Landslide history (primarily during flooding events, severe winter storms, and areas recently hit by wildfire)

Santa Barbara County 2011 Multi-Jurisdictional Hazard Mitigation Plan
5-3
Hazard Representative Data Collected for Hazard Identification Justification for Inclusion
• FEMA Hazards website • Maximum Tsunami Run up Projections
(Cal EMA) • FEMA Hazards website
• Coastal storm/erosion history • Coastline stabilization measures have been
implemented at various times in the past (erosion)
• Extensive development along the coast Dam Failure • FEMA-HAZUS
• Dam Inundation Data (Cal EMA) • County Public Works GIS Services • FEMA FIRM maps • FEMA Hazards website
• Potential threat to drinking water supply • Several dams exist throughout Santa Barbara
County • Many dams over 30 years old • Some downstream development
Agricultural (Pests and Disease)
• County Agricultural Commissioner’s Office
• Importance of Agriculture to local economy
Non-Profiled Hazards
During the original evaluation, the MAC determined that a number of hazards would not be included in the profiling step because they were not prevalent hazards within the County, were found to pose only minor or very minor threats to the County compared to the other hazards, or were generally linked to or covered by other selected hazards. During the plan update the MAC came to the same conclusion, that some hazards would not be included in the plan due to them being not prevalent and posing very little threat for damage. The following table gives a brief description of those hazards and the reason for their exclusion.
Table 5.2 Summary of Hazards Excluded from Hazard Profiling Hazard Description Reason for Exclusion
Avalanche A mass of snow moving down a slope. There are two basic elements to a slide; a steep, snow-covered slope and a trigger
Snowfall in County mountains not significant; poses very minor threat compared to other hazards
Drought/water supply Long periods without substantial rainfall. The most populous area of the County (South County) receives its water from the Cachuma Reservoir. Although droughts are somewhat common, no significant long term threats were identified. Mitigation strategies are limited.
Expansive soils Expansive soils shrink when dry and swell when wet. This movement can exert enough pressure to crack sidewalks, driveways, basement floors, pipelines and even foundations
Presents a minor threat to limited portions of the County. No historical problems with expansive soils were identified. No soil data was identified for profiling and analysis.
Extreme heat Temperatures that hover 10 degrees or more above the average high temperature for the region and last for several weeks
Prolonged heat waves are not a historically documented hazard in the region
Hailstorm Can occur during thunderstorms that bring heavy rains, strong winds, hail, lightning and tornadoes
Occurs during severe thunderstorms; most likely to occur in the central and southern states; no historical record of this hazard in the region.

Santa Barbara County 2011 Multi-Jurisdictional Hazard Mitigation Plan
5-4
Hazard Description Reason for Exclusion
Land subsidence Occurs when large amounts of ground water have been withdrawn from certain types of rocks, such as fine-grained sediments. The rock compacts because the water is partly responsible for holding the ground up. When the water is withdrawn, the rocks fall in on themselves.
Soils in the County are mostly hard. Presents a minor threat. No historical record of this hazard in the region.
Severe winter storm Large amounts of falling or blowing snow and sustained winds of at least 35 miles per hour occurring for several hours
Minor threat in mountains of the County. No historical record of this hazard in the region.
Tornado A tornado is a violent windstorm characterized by a twisting, funnel-shaped cloud. It is spawned by a thunderstorm (or sometimes as a result of a hurricane) and produced when cool air overrides a layer of warm air, forcing the warm air to rise rapidly. The damage from a tornado is a result of the high wind velocity and wind-blown debris.
Less than one tornado event occurs in the entire State of California in any given year; poses very minor threat compared to other hazards. No historical record of this hazard in the region.
Volcano
A volcano is a mountain that is built up by an accumulation of lava, ash flows, and airborne ash and dust. When pressure from gases and the molten rock within the volcano becomes strong enough to cause an explosion, eruptions occur
No active volcanoes in Santa Barbara County. No historical record of this hazard in the region.
Windstorm A storm with winds that have reached a constant speed of 74 miles per hour or more
Maximum wind speed in the region is less than 60 miles per hour and would not be expected to cause major damage or injury
Liquefaction Liquefaction occurs in saturated soils, that is, soils in which the space between individual particles is completely filled with water. This water exerts a pressure on the soil particles that influences how tightly the particles themselves are pressed together. Prior to an earthquake, the water pressure is relatively low. However, earthquake shaking can cause the water pressure to increase to the point where the soil particles can readily move with respect to each other.
Will be covered generally in earthquake section. Consistent quality liquefaction mapping not available Countywide. History of liquefaction in Santa Barbara County is not available. Soil types A – C (hard soils) are most prevalent in the County. Although there are some soil type D areas in the County that may present more of a risk.
The original plan collected hazard data from the Internet, direct communication with various agencies, discussions with consultant team in-house experts, and historical records. During the Plan Update, the data was verified to be correct and updated as necessary. Specific sources included:
• United States Geological Survey (USGS) • California Geological Survey (CGS)

Santa Barbara County 2011 Multi-Jurisdictional Hazard Mitigation Plan
5-5
• Federal Emergency Management Agency (FEMA) HAZUS • FEMA Flood Insurance Rate Maps (FIRM) • United States Forest Service (USFS) • California Emergency Management Agency (Cal EMA) • California Department of Forestry – Fire and Resource Assessment Program
(CDF-FRAP) • National Oceanographic and Atmospheric Administration (NOAA) • National Climatologic Data Center (NCDC) • Santa Barbara County Flood Control District • Southern California Earthquake Data Center (SCEDC) • California Seismic Safety Commission (CSSC) • California Integrated Seismic Network (CISN) • California Department of Fish and Game (CDFG) • Input from local jurisdictions, districts and agencies • General Plan Safety and Land Use Elements from the 8 cities • Santa Barbara County Comprehensive Plan • Santa Barbara County Public Works, GIS Services • Santa Barbara OEM • Santa Barbara County Fire, Vegetation Management Section/GIS
5.2.2 Hazard Prioritization
After updating the list of identified hazards, the MAC revisited the hazard ranking tool from the original plan and edited it based on these changes to develop an updated prioritization of the identified hazards. The results of the revised hazard ranking for the 2011 Plan Update are discussed below. The probability for tsunami was reduced since it no longer includes consideration of coastal storm surges. Recent wildfires within the County have increased the affected area for flooding and landslides. Similarly, the recent wildfires have increased the secondary impacts from wildfire and landslide. The secondary impacts for dam failure have increased because the 2004 ranking seemed unrealistic to the MAC. Climate Change exacerbations and infrastructure failure, while not ranked, are important to the MAC and will be considered throughout the risk assessment.
Ranking Tool Design The ranking tool allows the MAC to prioritize hazards on two separate factors:
• Probability that the hazard will affect the community; and, • Potential impacts on the community
Each hazard’s total impact is the sum of three criteria:
• The potential geographic extent of the affected area; • Primary impacts of the hazard event; and, • Related secondary impacts
While primary impacts are a direct result of the hazard, secondary impacts arise subsequent to a primary impact. For example, a primary impact of a flood event may be road damage due to submerged pavement

Santa Barbara County 2011 Multi-Jurisdictional Hazard Mitigation Plan
5-6
or eroded surface. A possible secondary impact in this circumstance would be restricted access of emergency vehicles to citizens in a portion of the County due to the road closure. A formula was developed to assign a value for probability and impact for each of the hazards considered. The probability of each hazard was determined by assigning a level, from 1 to 4, based on the likelihood of occurrence, which is based on historical data, as well as interviews with citizens and department heads and public and agency surveys conducted early in the planning process. A value of 1 indicates low probability of occurrence while a value of 4 indicates a high probability of occurrence. The total impact value for each hazard was determined by analyzing the potential affected area, primary impact, and secondary impact levels of each hazard using the same ranking scale of 1 to 4. These levels were then multiplied by an importance factor to obtain a score for each of the three impact criteria. To obtain the final score of each hazard, the probability score was multiplied by the sum of the three impact criteria scores. From the final score, hazards were separated into three rankings based on the relative risk level they pose to the County: significant, moderate and limited. In order to focus on the most critical hazards, those assigned a level of Significant or Moderate were given the most extensive attention in the remainder of this analysis, while those assigned a level of Limited include more general hazard profiles. The hazard ranking is based on the overall probability and impact on the County as a whole. When examining the multiple jurisdictions included in this plan, the same ranking does not always apply. For example, in Guadalupe, where there are no mapped flooding hazards, flooding would not be given the highest priority, as obviously coastal surge and Tsunami would not be a factor for communities far inland. Each City’s annex presents modifications to the hazard ranking as appropriate for that jurisdiction.
Table 5.3 Hazard Ranking and Planning Consideration 2011 Hazard Type and Ranking Planning Consideration Based on Hazard Level
Flooding (including coastal surge) Significant Wildfire Significant Agriculture (pests and disease) Significant Earthquake Significant Landslide/Coastal Erosion Moderate Dam Failure Limited Tsunami Limited
The completed hazard ranking tool is included as Table 5.4 and contains all the calculations and formulas utilized.

Santa Barbara County 2011 Multi-Jurisdictional Hazard Mitigation Plan
5-7
Table 5.4 Hazard Ranking Worksheet

Santa Barbara County 2011 Multi-Jurisdictional Hazard Mitigation Plan
5-8
5.3 FLOOD AND COASTAL STORM SURGE PROFILE
5.3.1 Nature of Hazard
Flood A flood occurs when water from rainfall flows into rivers and streams where it exceeds the bank capacity and is forced onto the river’s floodplains. Floodplains are lowlands adjacent to rivers, lakes, and oceans that are subject to recurring floods. Most injury and death from floods occur when people are swept away by flood currents, and property damage typically occurs as a result of inundation by sediment-filled water. Most areas around the globe are subject to some form of flooding. Portions of the County are subject to flooding due to flash flooding, urban flooding, river channel overflow, and downstream flooding. Several factors determine the severity of floods, including rainfall intensity and duration, surface permeability, and geographic characteristics of the watershed such as shape and slope. A large amount of rainfall in a short time can result in flash flood conditions, as can a dam failure, or other sudden spill. The National Weather Service’s definition of a flash flood is a flood occurring in a watershed where the time of travel of the peak of flow from one end of the watershed to the other is less than six hours. Coastal Storm Surge When coastal storms make landfall they produce large ocean waves that sweep across coastlines. Storm surges inundate coastal areas, destroy dunes, and cause flooding. If a storm surge occurs at the same time as high tide, the water height will be even greater. The County historically has been vulnerable to storm surge inundation associated with tropical storms. The Santa Barbara County General Plan’s Seismic Safety and Safety Element includes a discussion of the risks associated with flooding. 5.3.2 History of Flooding
Flooding has been a major problem throughout Santa Barbara County’s history. Santa Barbara County has several hydrologic basins that have different types of flooding problems, including over bank riverine flooding, flash floods, tidal flooding/tsunamis, and dam failure. The most common flooding in Santa Barbara is due to riverine flooding and flash flood events. Details of flooding due to tsunamis and dam failure can be found subsequent to this section. Between 1862 and the 2010, Santa Barbara experienced 15 significant floods. Eight of these floods received Presidential Disaster Declarations. Table 5.5 lists these floods, as well as information concerning the nature of the flooding and the extent of the damages.

Santa Barbara County 2011 Multi-Jurisdictional Hazard Mitigation Plan
5-9
Table 5.5 Historical Records of Large Floods in Santa Barbara County
Date Damages Source of Estimate Comments
1862 Not available 1993 Precipitation Report Largest discharges ever in California
1907 Significant damage to structures, crops 1993 Precipitation Report 4 straight days of rain, entire
Lompoc Valley engulfed
1914 Twelve houses and six bridges lost
County of Santa Barbara Sanitation and Flood Control
Destroyed 2 dams, 22 deaths
1952 50+ homes inundated, large-scale evacuations EIR, 1993 Precipitation Report Propagated the formation of the
Flood Control District
1964 Millions of dollars Floodplain Information Montecito Streams Vicinity of Montecito, SB County
Relatively light rain fell on recently burned areas. 20’ walls of water, mud, boulders, and trees
1969 $4.5 million Floodplain Information Montecito Streams Vicinity of Montecito, SB County
Highest flows in 2900 years on Santa Ynez River, 16” of rain in 24 hours at Juncal Dam
1971 Federal Disaster Declaration
Floodplain Information Montecito Streams Vicinity of Montecito, SB County
High flows and flooding along Romero Canyon Creek, Garrapata Creek, and Toro Canyon Creek
1978 Millions of dollars,
Presidential Disaster Declaration
1993 Precipitation Report and Hydrology Methods
Inundation of agricultural areas and mudslides.
1980 Presidential Disaster Declaration n/a Severe flooding, mudslides, and
high tides throughout County
1982-1983 2 Presidential Disaster Declarations n/a
Parts of southern California received over 200% of normal rainfall
1993 $1.4 million in disaster
recovery funds received from FEMA
1993 Precipitation Report and Hydrology Methods
180%-209% or normal rainfall, with highest-ever intensity for the County recorded at Buellton Fire Station: 11/4 inches in 15 minutes.
January 1995
$50 million, Presidential Disaster Declaration 1995 Floods
Flooding on most major channels in Goleta, Santa Barbara, Montecito, and Carpinteria
March 1995
$30 million, Presidential Disaster Declaration 1995 Floods
Major flooding in Goleta, Santa Barbara, and Montecito, many of the same structures flooded in January were flooded again
1998 $15 million, Presidential Disaster Declaration 1998 Flood Report
21.36” of rainfall that month in Santa Barbara, many areas at 600% of normal February rainfall
February 2005
$2 million NCDC In Santa Barbara county, flash flooding and mudslides closed down Highway 101 at Bates Road.
Santa Barbara County 2011 Multi-Jurisdictional Hazard Mitigation Plan
5-10
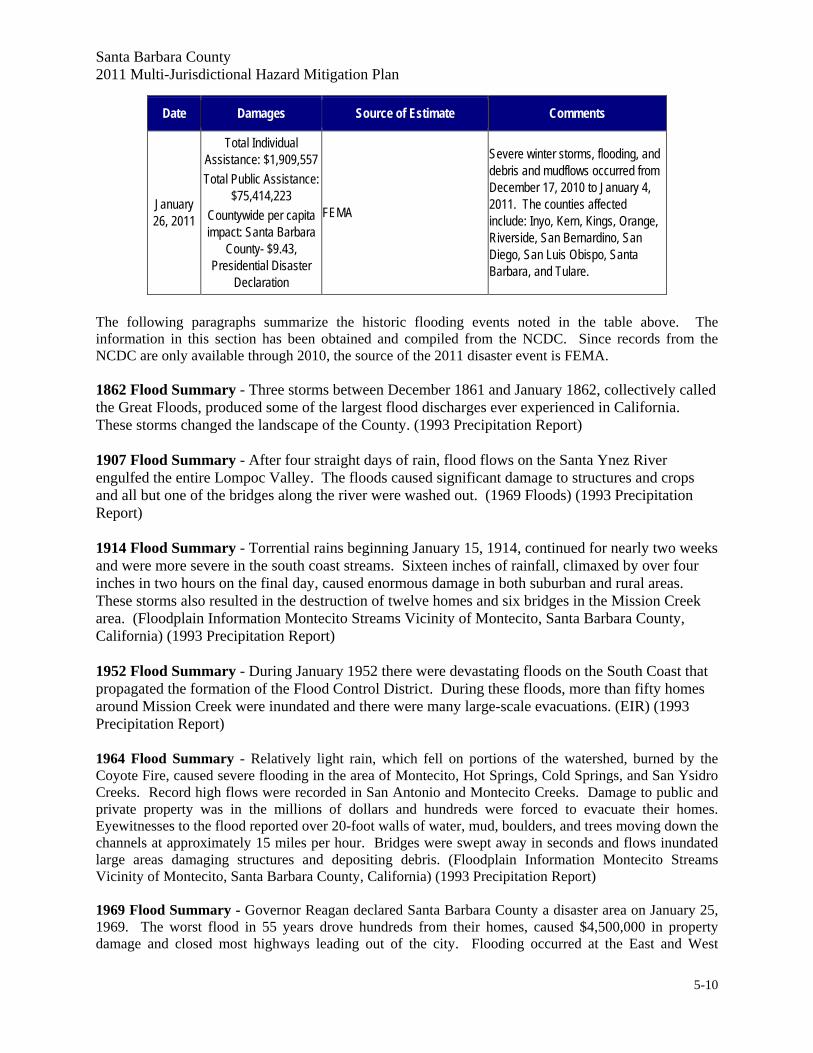
Date Damages Source of Estimate Comments
January 26, 2011
Total Individual Assistance: $1,909,557 Total Public Assistance:
$75,414,223 Countywide per capita impact: Santa Barbara
County- $9.43, Presidential Disaster
Declaration
FEMA
Severe winter storms, flooding, and debris and mudflows occurred from December 17, 2010 to January 4, 2011. The counties affected include: Inyo, Kern, Kings, Orange, Riverside, San Bernardino, San Diego, San Luis Obispo, Santa Barbara, and Tulare.
The following paragraphs summarize the historic flooding events noted in the table above. The information in this section has been obtained and compiled from the NCDC. Since records from the NCDC are only available through 2010, the source of the 2011 disaster event is FEMA. 1862 Flood Summary - Three storms between December 1861 and January 1862, collectively called the Great Floods, produced some of the largest flood discharges ever experienced in California. These storms changed the landscape of the County. (1993 Precipitation Report) 1907 Flood Summary - After four straight days of rain, flood flows on the Santa Ynez River engulfed the entire Lompoc Valley. The floods caused significant damage to structures and crops and all but one of the bridges along the river were washed out. (1969 Floods) (1993 Precipitation Report) 1914 Flood Summary - Torrential rains beginning January 15, 1914, continued for nearly two weeks and were more severe in the south coast streams. Sixteen inches of rainfall, climaxed by over four inches in two hours on the final day, caused enormous damage in both suburban and rural areas. These storms also resulted in the destruction of twelve homes and six bridges in the Mission Creek area. (Floodplain Information Montecito Streams Vicinity of Montecito, Santa Barbara County, California) (1993 Precipitation Report) 1952 Flood Summary - During January 1952 there were devastating floods on the South Coast that propagated the formation of the Flood Control District. During these floods, more than fifty homes around Mission Creek were inundated and there were many large-scale evacuations. (EIR) (1993 Precipitation Report) 1964 Flood Summary - Relatively light rain, which fell on portions of the watershed, burned by the Coyote Fire, caused severe flooding in the area of Montecito, Hot Springs, Cold Springs, and San Ysidro Creeks. Record high flows were recorded in San Antonio and Montecito Creeks. Damage to public and private property was in the millions of dollars and hundreds were forced to evacuate their homes. Eyewitnesses to the flood reported over 20-foot walls of water, mud, boulders, and trees moving down the channels at approximately 15 miles per hour. Bridges were swept away in seconds and flows inundated large areas damaging structures and depositing debris. (Floodplain Information Montecito Streams Vicinity of Montecito, Santa Barbara County, California) (1993 Precipitation Report) 1969 Flood Summary - Governor Reagan declared Santa Barbara County a disaster area on January 25, 1969. The worst flood in 55 years drove hundreds from their homes, caused $4,500,000 in property damage and closed most highways leading out of the city. Flooding occurred at the East and West

Santa Barbara County 2011 Multi-Jurisdictional Hazard Mitigation Plan
5-11
branches of Toro Creek, Oak Creek at Mouth, San Ysidro Creek, Buena Vista Creek, and Romero Canyon Creek. (Floodplain Information Montecito Streams Vicinity of Montecito, Santa Barbara County, California) The Santa Ynez River experienced highest flows in 2,900 years and 16-inches of rain fell at Juncal Dam in a 24-hour period. The 1969 storm was equivalent to a 100-year storm in the upper Santa Ynez watershed and the Lompoc, San Antonio, Santa Maria, and Goleta Valleys experienced 5-10-year storms. (1969 Floods) 1971 Flood Summary - In December of 1971 flooding and high flows were recorded at Romero Canyon Creek, Garrapata Creek, and Toro Canyon Creek. Santa Barbara County, particularly the Montecito-Summerland area, was declared a federal disaster area. (Floodplain Information Montecito Streams Vicinity of Montecito, Santa Barbara County, California) 1978 Flood Summary - Storms in February and March of 1978 caused inundation of agricultural areas, mudslides, and millions of dollars of damage. (1993 Precipitation Report and Hydrology Methods) (Presidential Disaster Declaration) 1980 Floods Summary - Storms in February, 1980 caused severe flooding mudslides and high tides throughout the County. (Presidential Disaster Declaration) 1982 – 1983 Flooding - During 1982 – 1983, several parts of southern California received over 200% of normal rainfall during what was the strongest El Nino event of record. Santa Barbara County had widespread slope destabilization and coastal flooding. (2 Presidential Disaster Declarations) 1992 Flood Summary - The 1992 – 1993 rainy season was one of the wettest recorded in Santa Barbara County, areas of the County received 180% to 209% normal rainfall. One of the County’s highest short-duration rainfall intensities was recorded during 1993; 1-¼-inches fell in fifteen minutes at the Buellton Fire Station. Following a 25-year storm event that occurred in late March, Santa Barbara was declared a federal disaster area with 12 creeks substantially damaged along with several detention basins and residences. Santa Barbara County received approximately $1.4 million in disaster recovery funds from FEMA. (1993 Precipitation Report and Hydrology Methods) (Presidential Disaster Declaration) 1995 Flood Summary - The floods of 1995 brought widespread flooding to Santa Barbara County. The most severe flooding occurred on the South Coast while the rest of the County was largely spared from serious damages. On the South Coast, the 1995 Flood was more severe and wide spread than either the 1969 or 1967 floods. Flooding occurred on most major streams from Goleta to Montecito. Estimated public and private damages were around $100 million and the area was declared a federal disaster area. (1995 Floods) January 1995 - Flooding occurred on most major channels in Goleta, Santa Barbara, Montecito, and Carpinteria. Approximately 510 structures were reported flooded and/or damaged along the South Coast, with a total cost resulting from public and private damages of approximately $50,000,000. All modes of transportation in and out of the South Coast were cut off for several hours; some modes of transportation were not restored for several days. (1995 Floods) (Presidential Disaster Declaration) March 1995 - During the March 10th 1995 storm, major flooding occurred again in the areas of Goleta, Santa Barbara, and Montecito. More than 300 structures were reported flooded and/or damaged; many of the same structures flooded or damaged during the January 1995 storm event. Approximately 30 million dollars of public and private property were damaged during the storm. Once again, all modes of transportation in and out of the South Coast were cut off for several hours. (1995 Floods) (Presidential Disaster Declaration)

Santa Barbara County 2011 Multi-Jurisdictional Hazard Mitigation Plan
5-12
1998 Flood Summary – February 1998 brought several record-breaking rainfalls with 50-year storm event intensities. The City of Santa Barbara recorded its wettest month in history, 21.36-inches of rainfall. By the end of the month, many areas in the County had received 600% of normal February rainfall. Flood related damages within Santa Barbara occurred during three major storm periods: February 1-4, February 6-9, and February 22-24. The cost to repair extensive flood damage to public and private property was estimated at $15 million. Just like in 1995, transportation throughout the County was disrupted through closures of roads, the Santa Barbara Airport, and train service. Flood damage was spread throughout the County and the County was declared a Federal Disaster Area on February 9. (Presidential Disaster Declaration) Although the February storms had higher annual rainfalls, flooding in 1998 was considered less severe than other historical events due to flood control improvements, such as Cachuma Reservoir, and channel and debris dam maintenance performed by the County. (1998 Flood Report). 2005 Flood Summary – A powerful Pacific storm tapped into a subtropical moisture source to produce heavy rain and flash flooding across Southwestern California. Overall, rainfall totals ranged from 4 to 8 inches over coastal areas to between 10 and 20 inches in the mountains. In Ventura County, State Route 150 was closed at the Dennison Grade due to flash flooding and mudslides. In Los Angeles County, numerous roadways were closed due to mudslide and flash flooding including Interstates 5 and 10, Highway 101 in Hollywood, North Topanga Canyon Road in the San Fernando Valley, Malibu Canyon Road near Malibu and East Colima Road in Walnut. In Santa Barbara county, flash flooding and mudslides closed down Highway 101 at Bates Road. With such heavy rainfall, both the Santa Clara River and the Santa Ynez River exceeded their respective flood stages. In the mountains of Ventura and Los Angeles counties, resort areas received between 3 and 4 feet of new snowfall. Preliminary damage estimates from this storm range between $8-10 million with agricultural interests in Ventura county accounting for most of the monetary damage. 2011 Flood Summary- Severe winter storms, flooding, and debris and mudflows occurred from December 17, 2010 to January 4, 2011. The counties affected include: Inyo, Kern, Kings, Orange, Riverside, San Bernardino, San Diego, San Luis Obispo, Santa Barbara, and Tulare.
5.3.3 Location and Extent
Watersheds The County is divided into five major watersheds: Santa Maria, Cuyama, San Antonio, Santa Ynez River and South Coast. The Santa Maria Watershed includes the Cuyama and Sisquoc watersheds. The location and drainage areas for these watersheds are presented in Table 5.6.
Table 5.6 Santa Barbara County Watersheds Watershed Location Drainage Area
Santa Maria Northern Portion of County 1,845 square miles Cuyama Northern Portion of County 1,140 square miles
San Antonio Northern Portion of County 165 square miles Santa Ynez River Southern Portion of County 900 square miles
South Coast Southern Portion of County 416 square miles

Santa Barbara County 2011 Multi-Jurisdictional Hazard Mitigation Plan
5-13
Drainage In regions such as Santa Barbara, without extended periods of below-freezing temperatures, floods usually occur during the season of highest precipitations or during heavy rainfalls after long dry spells. Due to the Mediterranean climate of Santa Barbara County and the variability of rainfall, stream flow throughout the County is highly variable and directly impacted from rainfall with little snowmelt or base flow from headwaters. Most streams in the County are dry during the summer months and a majority of streams only flow during the winter months. Watercourses can experience a high amount of sedimentation during wet years and high amounts of vegetative growth during dry and moderate years. The drainages in the southern part of the County are characterized by high intensity, short duration runoff events, due to the relatively short distance from the top of the Santa Ynez Mountains to the Pacific Ocean. Runoff from high intensity, short duration storm events can cause inundation of over bank areas, debris in the water that can plug culverts and bridges, erosion and sloughing of banks, and loss of channel capacity due to sedimentation. The drainages in the northern part of the County are contained in the upper mountain areas, but broaden out into level valley floors. The drainages in the northern part of the County are generally characterized by longer duration and less intense storms than the southern coastal areas. Reservoirs There are four major reservoirs located in the County: Lake Cachuma, Twitchell, Gibraltar, and Jameson Lake. The Cachuma and Twitchell reservoirs are owned by the federal government, administered by the County Water Resources Division, and operated by local water purveyors. The Gibraltar Reservoir is owned and operated by the City of Santa Barbara and the Jameson Reservoir is owned and operated by the Montecito Water District. Lake Cachuma, Gibraltar Reservoir, and Jameson Lake are located along the Santa Ynez River, in the South County. Lake Cachuma is the largest reservoir along the Santa Ynez River, with a drainage area of 421 square miles upstream of the Bradbury Dam. Gibraltar Reservoir has a drainage area of 214 square miles upstream of Gibraltar Dam and Jameson Lake has a drainage area of 14 square miles upstream of Juncal Dam. In the North County, the Twitchell Reservoir is located along the Cuyama River. The Cuyama River Basin has a drainage area of approximately 1,140 square miles and it is the confluence of the Cuyama and Sisquoc Rivers that form the Santa Maria River. The Twitchell Reservoir has a drainage area of 1,135 square miles above Twitchell Dam. County Flood “Hot Spot” Locations There are numerous undersized culverts, low water crossings, and low capacity bridges throughout the County that cause flooding problems. A few of the County’s flood “hot spots” are listed below. Low Water Crossing • McLaughlin Road (Outskirts of Lompoc on Santa Ynez River) • Orcutt-Garey Road (Outskirts of Santa Maria on unnamed intermittent stream) • Refugio Road (Several crossings causing closing road in frequent events –connecting Gaviota Coast to Santa Ynez valley – major emergency access road for fire and other hazards) • Tepusquet Road (Outskirts of Santa Maria – Sisquoc)

Santa Barbara County 2011 Multi-Jurisdictional Hazard Mitigation Plan
5-14
Low Capacity Bridges (Bridge Capacity) • Lompoc-Casmalia (connects Lompoc to Santa Maria through Vandenberg AFB – bridge has no
capacity – disrupts emergency access) • Bonita School Road – (Elevated Rail Car Structure – Connector across Santa Maria River
between SBCO and San Luis Obispo County) • Refugio Road (multiple low capacity bridges cause flooding and access problems)
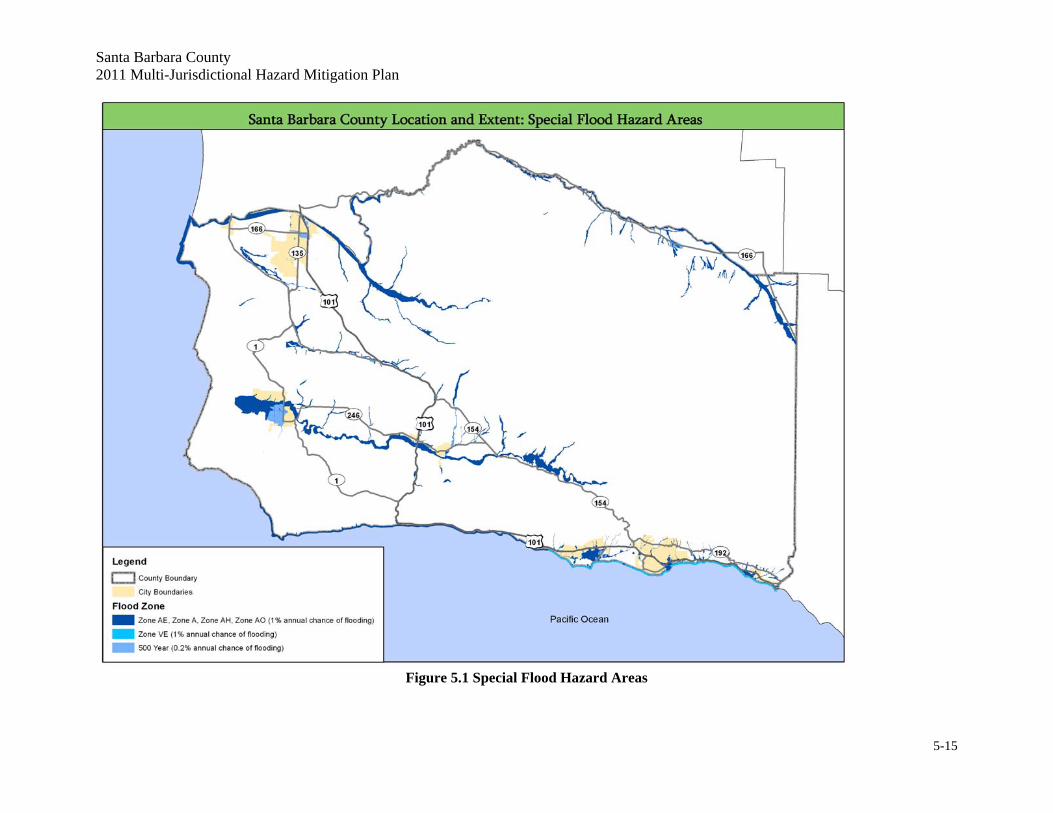
DFIRM Flood zones are geographic areas that FEMA has defined according to varying levels of flood risk. These zones are depicted on a community’s Flood Insurance Rate Map (FIRM). Each zone reflects the severity or type of flooding in the area. The FIRM boundaries are developed by FEMA to convey flood risk and be used for the purpose of determining flood insurance rates. The map below shows the location of the special flood hazard zones in Santa Barbara County. As shown in this map, high hazard (100-year flood) zones in Santa Barbara County are generally concentrated within the coastal areas, including bays, coastal inlets and estuaries and in major watershed areas connecting the local mountain range to the coastal region, where flash floods are more common. Source: Flood Insurance Rate Map (FIRM) Boundaries, Santa Barbara County GIS available at http://www.countyofsb.org/itd/gis/default.aspx?id=2802, September 15, 2009, prepared by FEMA.
Santa Barbara County 2011 Multi-Jurisdictional Hazard Mitigation Plan
5-15
Figure 5.1 Special Flood Hazard Areas
Santa Barbara County 2011 Multi-Jurisdictional Hazard Mitigation Plan
5-16
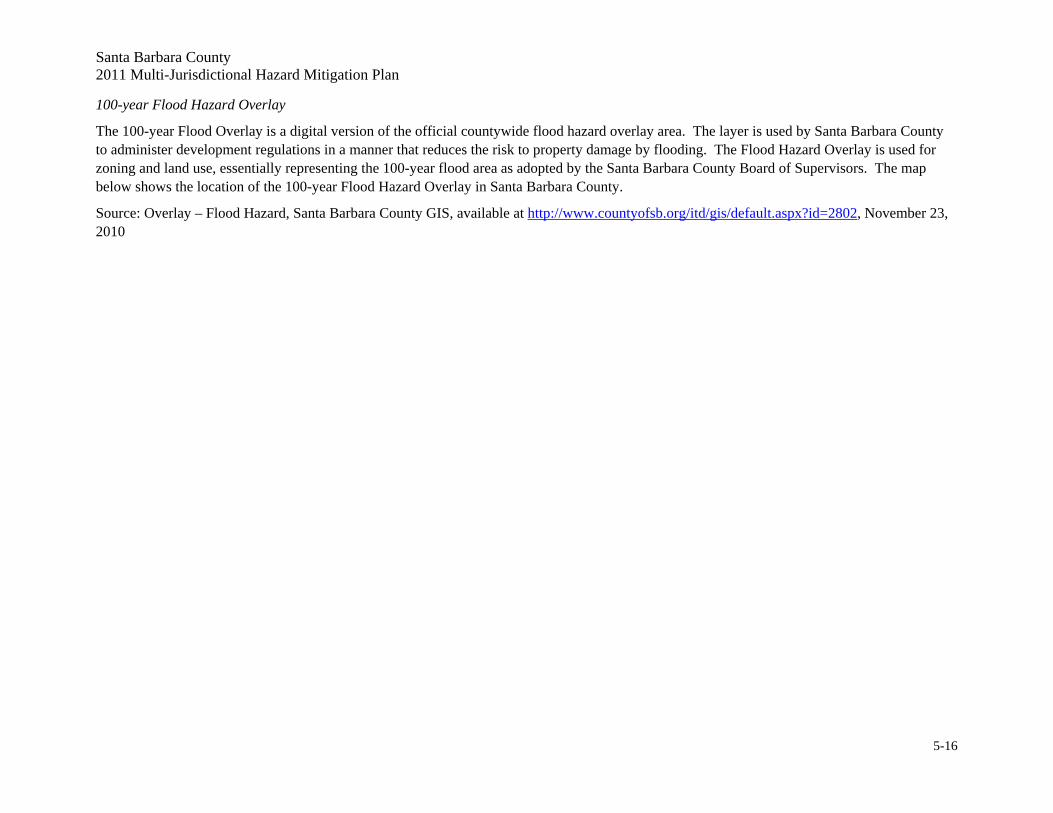
100-year Flood Hazard Overlay
The 100-year Flood Overlay is a digital version of the official countywide flood hazard overlay area. The layer is used by Santa Barbara County to administer development regulations in a manner that reduces the risk to property damage by flooding. The Flood Hazard Overlay is used for zoning and land use, essentially representing the 100-year flood area as adopted by the Santa Barbara County Board of Supervisors. The map below shows the location of the 100-year Flood Hazard Overlay in Santa Barbara County.
Source: Overlay – Flood Hazard, Santa Barbara County GIS, available at http://www.countyofsb.org/itd/gis/default.aspx?id=2802, November 23, 2010

Santa Barbara County 2011 Multi-Jurisdictional Hazard Mitigation Plan
5-17
Figure 5.2 100-Year Flood Hazard Overlay

Santa Barbara County 2011 Multi-Jurisdictional Hazard Mitigation Plan
5-18
Coastal Storm Surge The areas exposed to coastal storm surge/coastal erosion can be identified using FEMA VE Zones. FEMA defines Zone VE as an area inundated by 100-year flooding with velocity hazard (wave action). The DFIRM map above shows the location of Zone VE. It extends from Goleta to Carpinteria. This portion of the coast is periodically subject to high velocity wave action, as was experience in January and March of 1983 (Presidential Disaster Declaration). The Base Flood Elevation (BFE) ranges from six to ten feet along the coastal strip. On the portion of the coastal strip in the vicinity of the Carpinteria Slough, the V Zone BFE is eight feet. During past flooding events, County personnel have observed flood elevations of approximately ten to eleven feet (USGS MSL Datum) in the vicinity of the Carpinteria Slough. 5.3.4 Probability of Occurrence
FEMA FIRM data was used to determine hazard risk for floods in the County of Santa Barbara. FEMA defines flood risk primarily by a 100-year flood zone, which is applied to those areas with a 1% chance, on average, of flooding in any given year. Any area that lies within the FEMA-designated 100-year floodplain is designated as high risk. Any area found in the 500-year floodplain is designated at low risk. FEMA Flood Insurance Maps (FIRMs) are produced to show flooding probability in a manner that informs the cost of flood insurance. The designated zones represent varying levels of flood risk. The FEMA DFIRM map shown in Figure 5.1 above shows special flood hazard areas in Santa Barbara County. The table below describes the different flood hazard areas and their associated probabilities.
Annual Probability of Flooding of 1% or greater A Subject to 100-year flood. Base flood elevation undetermined.
AE or A1-A30
Both AE and A1-A30 represent areas subject to 100-year flood with base flood elevation determined.
AH Subject to 100-year shallow flooding (usually areas of ponding) with average depth of 1-3 feet. Base flood elevation determined.
AO Subject to 100-year shallow flooding (usually sheet flow on sloping terrain) with average depth of 1-3 feet. Base flood elevation undetermined.
V Subject to 100-year flood and additional velocity hazard (wave action). Base flood elevation undetermined.
VE or V1-V30
Both VE and V1-V30 represent areas subject to 100-year flood and additional velocity hazard (wave action). Base flood elevation determined.
Annual Probability of Flooding of 0.2% to 1%
B or X500
Both B and X500 represent areas between the limits of the 100-year and 500-year flood; or certain areas subject to 100-year flood with average depths less than 1 foot or where the contributing drainage area is less than 1 square mile; or areas protected by levees from the 100-year flood.
Annual Probability of Flooding of Less than 0.2%
C or X
Both C and X represent areas outside the 500-year flood plain with less than 0.2% annual probability of flooding.

Santa Barbara County 2011 Multi-Jurisdictional Hazard Mitigation Plan
5-19
Annual Probability of Flooding of Less than 1%
No SFHA
Areas outside a "Special Flood Hazard Area" (or 100-year floodplain). Can include areas inundated by 0.2% annual chance flooding; areas inundated by 1% annual chance flooding with average depths of less than 1 foot or with drainage areas less than 1 square mile; areas protected by levees from 1% annual chance flooding; or areas outside the 1% and 0.2% annual chance floodplains.
5.3.5 Climate Change Consideration
Climate change is both a present threat and a slow-onset disaster. It acts as an amplifier of existing hazards. Extreme weather events have become more frequent over the past 40 to 50 years and this trend is projected to continue. Rising sea levels, changes in rainfall distribution and intensity are expected to have a significant impact on coastal communities, including portions of Santa Barbara County. This section presents a discussion of how climate change might impact the frequency, intensity and distribution of flood hazards. Sea Level Rise Rising sea levels pose a significant threat to coastal areas of Santa Barbara County. Sea level rise (SLR) can occur through one or more of three processes that include land subsidence, the melting of ice sheets and thermal expansion of water as a result of warming. Sea levels are already rising along the Santa Barbara County coastline as is evident in long term tidal gauge records from Station 9411340 where the rate of rise has been approximately 0.41 feet per century1 (see Figure 5.3). A growing consensus of scientists believes that sea level rise will continue and the rate of rise will increase. The Intergovernmental Panel on Climate Change (IPCC) suggests that global SLR on the order of 0.2 m (0.66 ft) and 0.6 m (1.97 ft) is possible by 2100 with other scientists indicating this rise could be over 1 meter (3.28 ft). 2
Figure 5.3 Mean Sea Level Trend in Santa Barbara
1 NOAA: http://tidesandcurrents.noaa.gov/sltrends/sltrends_station.shtml?stnid=9411340; retrieved April 6, 2011. 2 M. Vermeer and S. Rahmstorf. 2009. Global sea level linked to global temperature. Proceedings of the National Academy of Sciences, USA.

Santa Barbara County 2011 Multi-Jurisdictional Hazard Mitigation Plan
5-20
(Station 9411340; Source: NOAA) A study conducted by the Pacific Institute in 2009 examined how the 100-year floodplain might expand under various scenarios of sea level rise. Approximately 3,400 people in Santa Barbara County are currently vulnerable to a 100-year flood. A sea level rise of 1.4 meters would mean that approximately 6,700 would be within what would become the new 100-year flood plain. The same study determined that with a 1.4 meter rise in sea level, 25 miles of roadway and approximately 8 miles of highway would be vulnerable to inundation during a 100-year flood. In terms of railways, 8.9 miles would be vulnerable to a 100-year flood in a 1.0 meter sea level rise scenario, while 7 miles would be at risk in a 1.4 meter scenario. The study found that total replacement cost of buildings and contents at risk of a 100-year flood in a 1.4 meter sea level rise scenario is approximately $1.1 billion. Figure 5.4: depicts areas (dark blue along and near the Santa Barbara County coastline that may be vulnerable to sea level rise in a 1.4 meter sea level rise scenario. 3 From the figure, it is apparent that a considerable number of buildings and infrastructure may be impacted.
3 M. Heberger, H. Cookley, P. Herrera, The Pacific Institute, May 2009. The Impacts of Sea‐Level Rise on The California Coast.

Santa Barbara County 2011 Multi-Jurisdictional Hazard Mitigation Plan
5-21
Figure 5.4: Sea Level Rise Santa Barbara Quadrangle
(Source: Pacific Institute: http://www.pacinst.org/reports/sea_level_rise/hazmaps/Santa_Barbara.pdf )
Santa Barbara County 2011 Multi-Jurisdictional Hazard Mitigation Plan
5-22
Flood In addition to possible inundation resulting from rising sea levels, climate change has the potential to increase flood risk through changes in precipitation patterns. Climate models project that a warming planet could lead to changes in the distribution of precipitation across the country. These models suggest fewer precipitation events overall, but a trend toward an increased frequency of intense precipitation events.4 These changes may translate into greater storm water run-off into the future, which could exacerbate flooding hazards. While it might not seem intuitive, fewer, but more intense precipitation events might lead to more frequent flash flooding episodes, while longer dry periods between precipitation events might also increase the frequency and severity of drought.
4 Gutowski, W.J., G.C. Hegerl, G.J. Holland, T.R. Knutson, L.O. Mearns, R.J. Stouffer, P.J. Webster, M.F. Wehner, and F.W. Zwiers, 2008: Causes of observed changes in extremes and projections of future changes. In: Weather and Climate Extremes in a Changing Climate: Regions of Focus: North America, Hawaii, Caribbean, and U.S. Pacific Islands [Karl, T.R., G.A. Meehl, C.D. Miller, S.J. Hassol, A.M. Waple, and W.L. Murray (eds.)]. Synthesis and Assessment Product 3.3. U.S. Climate Change Science Program, Washington, DC, pp. 81-116.
Santa Barbara County 2011 Multi-Jurisdictional Hazard Mitigation Plan
5-23
5.4 WILDFIRE PROFILE
5.4.1 Nature of Hazard
“A wildfire is an uncontrolled fire spreading through vegetative fuels, exposing and possibly consuming structures” (FEMA 386-2, 2001) and may originate from a variety of ignition sources. Three different types of wildfires exist. A “surface fire” is the most common type and burns along the floor of a forest, moving slowly and killing or damaging trees. A “ground fire” is usually started by lightning and burns on or below the forest floor in the organic layer down to the mineral soil. “Crown fires” spread rapidly by wind and move quickly by jumping along the tops of trees. Wildfires can be classified as either a wildland fire or a wildland-urban interface (WUI) fire. The former involves situations where wildfire occurs in an area that is relatively undeveloped except for the possible existence of basic infrastructure such as roads and power lines. A wildland-urban interface fire includes situations in which a wildfire enters an area that is developed with structures and other human developments. In WUI fires, the fire is fueled by both naturally occurring vegetation and the urban structural elements themselves. According to the National Fire Plan issued by the U.S. Departments of Agriculture and Interior, the wildland-urban interface is defined as “…the line, area, or zone where structures and other human development meet or intermingle with undeveloped wildland or vegetative fuels.” The WUI fire can be subdivided into three categories (NWUIFPP, 1998): The classic wildland-urban interface exists where well-defined urban and suburban development presses up against open expanses of wildland areas. The mixed wildland-urban interface is characterized by isolated homes, subdivisions, and small communities situated predominantly in wildland settings. The occluded wildland-urban interface exists where islands of wildland vegetation occur inside a largely urbanized area. Generally, the areas at risk within the Santa Barbara County fall into the classic wildland-urban interface category. Certain conditions must be present for a wildfire hazard to occur; a large source of fuel must be present, the weather must be conducive (generally hot, dry, and windy), and fire suppression sources must not be able to easily suppress and control the fire. The cause of a majority of wildfires is human-induced or lightning; however, once burning, wildfire behavior is based on three primary factors: fuel, topography, and weather. Fuel will affect the potential size and behavior of a wildfire depending on the amount present, its burning qualities (e.g. level of moisture), and its horizontal and vertical continuity. Topography affects the movement of air, and thus the fire, over the ground surface. The terrain can also change the speed at which the fire travels, and the ability of firefighters to reach and extinguish the fire. Weather as manifested in temperature, humidity and wind (both short and long term) affect the probability, severity, and duration of wildfires. The vegetation in Santa Barbara County is conducive to wildfires. Commonly called chaparral, it is a dense and scrubby bush that has evolved to persist in a fire-prone habitat. Chaparral plants will eventually age and die; however, they will not be replaced by new growth until a fire rejuvenates the area. Chamise, manzanita and ceanothus are all examples of chaparral which are quite common in Santa Barbara County. Large fires have several indirect effects beyond those of a smaller, local fire. These may include air quality and health issues, road closures, business closures, and other forms of losses. Furthermore, large wildfires increase the threat of other disasters such as landslide and flooding.

Santa Barbara County 2011 Multi-Jurisdictional Hazard Mitigation Plan
5-24
5.4.2 History of Wildfires Table 5.7 is extracted directly from the Santa Barbara County Comprehensive General Plan Seismic Safety and Safety Element. The table lists major wildfires in Santa Barbara County from 1922-2009. Descriptions of these wildfires are located in the paragraphs below the table. Not listed in this table, the La Brea Wildfire occurred in 2010 and should be noted as a recent major wildfire. The Santa Barbara County Comprehensive General Plan Seismic Safety and Safety Element further provides a comprehensive description of the history of wildfires in the County.
Table 5.7 Major Wildfires in Santa Barbara County
Between the years 1950 and 1997, Santa Barbara County was declared a state of emergency due to fires four times. In 1977, a kite caught on a power line started a fire that burned about 1.25 square miles. More recently, the famous Painted Cave Fire of 1990 burned 62/3 square miles and the 2004 Gaviota fires burned over 7,000 acres. Since 2004, five major wildfires have impacted the County. In 2006, the Perkins Fire burned nearly 15,000 acres. The Zaca Wildfire was fully contained on the evening of September 2nd 2007. The total acreage burned by the fire was 240,207 acres, making the Zaca Fire the second largest wildfire in California history. The total cost of suppression was over

Santa Barbara County 2011 Multi-Jurisdictional Hazard Mitigation Plan
5-25
$119 million. During the month of July 2008, the Gap Wildfire charred 9,443 acres of forest in the Los Padres National Forest. The fire was located in the Santa Ynez Mountains north of the community of Goleta. The 2009 Jesusita Fire burned over 8,700 acres in the hills above the City of Santa Barbara. This wildfire was driven by a combination of a large dead fuel bed and Sundowner winds gusting over 60 miles per hour. The damage, as a result of this fire, was significant, with 80 homes destroyed and another 15 homes badly damaged. No deaths were reported, but at least 30 firefighters were injured battling the fire. In the month of August 2009, the La Brea Wildfire burned over 89,000 acres in the Los Padres National Forest in the County of Santa Barbara. The fire was fueled by very hot temperatures, low relative humidity and significant fuels. Over the last ten years, Santa Barbara County has experienced seven major fires. Three of these fires, Gap, Tea, and Jesusita, directly threatened the heavily populated Santa Barbara Front Country. Two of these fires, Tea and the Jesusita, destroyed close to three hundred structures and burned a total 16 ½ square miles. Combined, the La Brea Fire and the Zaca Fire burned a total of 518 square miles, predominately in backcountry areas of the County. Although these two fires did not directly threaten urban areas, the smoke and ash produced created air quality issues for hundreds of miles. The figures below show locations of historic fires in Santa Barbara County.

Santa Barbara County 2011 Multi-Jurisdictional Hazard Mitigation Plan
5-26
Figure 5.5 Fire History 2010 (Source: Santa Barbara County Fire Department)

Santa Barbara County 2011 Multi-Jurisdictional Hazard Mitigation Plan
5-27
Figure 5.6 2007 Zaca Fire perimeter
(Source: Department of Public Works, County of Santa Barbara)

Santa Barbara County 2011 Multi-Jurisdictional Hazard Mitigation Plan
5-28
Figure 5.7 Zaca Fire extent in Santa Barbara County.
(Source: County of Santa Barbara Assessor’s Office)

Santa Barbara County 2011 Multi-Jurisdictional Hazard Mitigation Plan
5-29
Figure 5.8 Recent Fires in Santa Barbara County
including the Gap Fire, Painted Cave Fire, Jesusita Fire and Tea Fire (Source: County of Santa Barbara Assessor’s Office) 5.4.3 Location and Extent
As part of the California Fire Plan, The California Department of Forestry and Fire Protection, Fire and Resource Assessment Program (CDF-FRAP) compiles fire perimeters and has established an on-going fire perimeter data capture process. The map below shows fire perimeters in Santa Barbara County. Source: Fire Perimeters, Fire and Resource Assessment Program (FRAP) available at http://frap.cdf.ca.gov/data/frapgisdata/select.asp?theme=5, 2010 Purpose: Fire perimeters provide a reasonable view of the spatial distribution of past large fires. The time period of the data is from 1878 to 2010. Due to missing perimeters, this layer should not be used for statistical analysis and reporting. For the National Park Service, Bureau of Land Management, and US Forest Service, fires of 10 acres and greater are reported. For CAL FIRE, timer fires greater than 10 acres, brush fires greater than 50 acres, grass fires greater than 300 acres, and fires that destroy three or more residential dwellings or commercial structures are reported.

Santa Barbara County 2011 Multi-Jurisdictional Hazard Mitigation Plan
5-30
Figure 5.9 Fire History

Santa Barbara County 2011 Multi-Jurisdictional Hazard Mitigation Plan
5-31
CDF-FRAP was mandated to map areas of significant fire hazards based on fuels, terrain, weather, and other relevant factors. These zones, referred to as Fire Hazard Severity Zones, define the application of various mitigation strategies to reduce risk associated with wildland fires. The most current mapping efforts by CDF-FRAP were conducted in 2007. The map below shows the Fire Hazard Severity Zones located in Santa Barbara County.

Santa Barbara County 2011 Multi-Jurisdictional Hazard Mitigation Plan
5-32
Figure 5.10 Fire Hazard Severity Zones
(Source: County of Santa Barbara Fire GIS)

Santa Barbara County 2011 Multi-Jurisdictional Hazard Mitigation Plan
5-33
CDF-FRAP developed data that displays the relative risk to areas of significant population density from wildfire. This data is created by intersecting residential housing unit density with proximate fire threat, to give a relative measure of potential loss of structures and threats to public safety from wildfire. The first map following this page was generated from this data and shows only the wildland-urban interface (WUI) in Santa Barbara County. The WUI map depicts areas where potential fuels treatments will be prioritized to reduce wildland fire threats. The Mitigation Advisory Committee acknowledged that the WUI data shown below is developed on a statewide basis and does not consider the placement of local neighborhoods within the geography. Santa Barbara County Fire has synthesized the data at a more local level to convey communities at risk. These are presented in the second map following this page. Communities at Risk: To help protect people and their property from potential catastrophic wildfire, the National Fire Plan directs funding to be provided for projects designed to reduce the fire risks to communities. A fundamental step in achieving this goal was the identification of communities that are at high risk of damage from wildfire. These high risk communities identified within the wildland-urban interface, were published in the Federal Register in 2001. At the request of Congress, the Federal Register notice only listed those communities neighboring federal lands. The list represents the collaborative work of the 50 states and five federal agencies using a standardized process, whereby states were asked to submit all communities within their borders that met the criteria of a structure at high risk from wildfire. The following list contains the federally regulated (communities which adjoin federal lands) communities at risk within Santa Barbara County: Orcutt Santa Barbara Tajiguas Vandenberg Air Force Base Vandenberg Village Mission Hills
Carpinteria Cuyama Casmalia Gaviota Goleta Lompoc
With California's extensive urban Wildland-Urban Interface situation, the list of communities extends beyond just those adjacent to Federal lands. After the 2000 fire season the California Department of Forestry and Fire Protection (CAL FIRE), working with the California Fire Alliance, developed a list of communities at risk from wildfire using 1990 Census and USGS Geographic Names Information System data to identify populated places, and CAL FIRE’s Fire and Resource Assessment Program (FRAP) fuel hazard data. In addition to the already-mentioned communities, they designated the following as WUI Communities at Risk: Buellton Santa Maria Santa Ynez Sisquoc Solvang Summerland Montecito
Los Olivos Garey Guadalupe Isla Vista Los Alamos Venucopa
Combining both lists, there are currently 25 communities on the Communities at Risk List in Santa Barbara County. The California State Forester (CAL FIRE Director) has assigned the role of

Santa Barbara County 2011 Multi-Jurisdictional Hazard Mitigation Plan
5-34
managing the list to the California Fire Alliance (Alliance). The list can be found on the California Fire Alliance website: http://www.cafirealliance.org/communities_at_risk/communities_at_risk_list. In addition to the 25 State and Federal recognized communities, there are other communities within the county that are also at risk of wildfire and need to be identified. Communities that were not captured in any state or federally recognized list, but have been identified by County Fire and other jurisdictions to be at risk include: Cebada Canyon El Capitan Jonata Ranch/Bobcat Springs Miguelito Canyon Mission Canyon Painted Cave Refugio Canyon Tepusquet Canyon
Toro Canyon Woodstock Hope Ranch Trout Club Rosario Park Jalama Paradise

Santa Barbara County 2011 Multi-Jurisdictional Hazard Mitigation Plan
5-35
Figure 5.11 Wildland Urban Interface
Source: Wildland Urban Interface (WUI) Fire Threat, Fire and Resource Assessment Program (FRAP) available at http://frap.cdf.ca.gov/data/frapgisdata/select.asp?theme=5, 2003

Santa Barbara County 2011 Multi-Jurisdictional Hazard Mitigation Plan
5-36
Figure 5.12 Communities at Risk
(Source: County of Santa Barbara Fire GIS)

Santa Barbara County 2011 Multi-Jurisdictional Hazard Mitigation Plan
5-37
5.4.4 Probability of Occurrence
Santa Barbara County was subject to 29 major wildfires over 88 years, resulting in a 33% chance of occurrence in any given year. In addition, the map below shows the threat of fire to Santa Barbara County. Fire threat is a combination of two factors: fire frequency or the likelihood of a given area burning, and potential fire behavior. These two factors are combined to create four threat classes ranging from moderate to extreme.

Santa Barbara County 2011 Multi-Jurisdictional Hazard Mitigation Plan
5-38
Figure 5.13 Fire Threat
Source: Fire Threat, Fire and Resource Assessment Program (FRAP) available at http://frap.cdf.ca.gov/data/frapgisdata/select.asp?theme=5, 2004

Santa Barbara County 2011 Multi-Jurisdictional Hazard Mitigation Plan
5-39
5.4.5 Climate Change Consideration
Heat waves, drought, cyclical climate changes such as El Nino, and regional weather patterns can increase the risk and alter the behavior of wildfires dramatically. Projections of future climate change from general circulation models simulate significant increases in temperature across the western United States during the 21st century. Projections of precipitation are more variable, but they generally suggest drier summer conditions in the West. These projections, combined with an increase in population density and the continued expansion of the urban-wildland interface, indicate that fires will continue to be a concern. (http://www.pewclimate.org/docuploads/regional-impacts-west.pdf) The paragraphs below detail how drought and heat, two catalysts of wildfire events, may be affected due to climate change. Drought Climate change has the potential to make drought events, such as that experienced in 2006 and at various points in the past, more common in the West, including in California. Long-term climate forecast models suggest that a warming planet will lead to changes in precipitation distribution and more frequent and severe drought in some parts of the country, particularly the western U.S. In addition, the Intergovernmental Panel on Climate Change (IPCC) Fourth Assessment Report indicates that it is very likely that hot extremes and heat waves will become more frequent as the Earth warms. This too will have implications for the frequency and severity of future drought occurrence. Extreme heat creates conditions more conducive for evaporation of moisture from the ground, thereby increasing the possibility of drought. A warming planet could lead to earlier melting of winter snow packs, leaving lower streamflows and drier conditions in the late spring and summer. Snow packs are important in terms of providing water storage and ensuring adequate supply in the summer, when water is most needed. Changing precipitation distribution and intensity have the potential to cause more of the precipitation that does fall to run-off rather than be stored. The result of these processes is an increased potential for more frequent and more severe periods of drought. Heat Average temperatures in the Southwest, including California have increased approximately 1.5°F as compared to a 1960 to 1979 baseline average.5 Temperatures are projected to rise 4°F to 10°F above this baseline average by the end of the century. In addition to average temperatures rising, periods of excessive heat are expected to become a more common occurrence. The Intergovernmental Panel on Climate Change (IPCC) Fourth Assessment Report indicates that it is very likely that hot extremes and heat waves will become more frequent as the Earth warms. Extreme weather events, including heat waves and droughts, have already become more frequent and intense during the past 40 to 50 years. Increased frequency and severity of heat waves and droughts could lead to an increased occurrence of wildfire as the three hazards are closely related. In addition to the obvious dangers associated with periods of intense heat, rising temperatures might also lead to a decline in air quality. Increased heat and sunlight can act to produce higher levels of ground-level ozone, resulting in unhealthy air quality, particularly in urban areas.
5 Thomas R. Karl, Jerry M. Melillo, and Thomas C. Peterson, (eds.), Cambridge University Press, 2009. Global Climate Change Impacts in the United States.

Santa Barbara County 2011 Multi-Jurisdictional Hazard Mitigation Plan
5-40
5.5 AGRICULTURAL PESTS PROFILE
5.5.1 Nature of Hazard
Insect and disease infestation occur when an undesirable organism inhabits an area in a manner that causes serious harm to agriculture crops, livestock or poultry, and wild land vegetation or animals. Countless insects and diseases live on, in, and around plants and animals in all environments. Most are harmless, while some can cause significant damage and loss. Under some conditions, insects and diseases that have been relatively harmless can become hazardous. For example, severe drought conditions can weaken trees and make them more susceptible to destruction from insect attacks than they would be under normal conditions. Due to its interaction with the global economy, its mild Mediterranean climate, and its diversified agricultural and native landscape, Santa Barbara County currently experiences and will continue to experience periodic losses due to agricultural pests and diseases. In addition to agricultural pests and diseases, the effects of flooding can be devastating on agriculture. Flooding can damage crops, livestock, dairy stock, and can also have deleterious effects on soil and the ability to reinvigorate the agricultural activities impacted once the flood waters recede. Damage to water resources such as underground irrigation systems, water storage reservoirs, springs and other natural water bodies, which can all be a result of flooding, can have a serious effect upon crops and livestock. Similar to a significant flood event, a tsunami could cause the same potential impacts on agricultural land. Wildfires can burn crop land, livestock, dairy stock, and grazing land, while also causing harm to soil and water. The harm caused by wildfire can impact agriculture for an extended period of time. Earthquakes can cause loss of human life, loss of animal life, and property damage to structures and land dedicated to agricultural uses. Secondary impacts of an earthquake include fire and flood, which can have long-term negative effects on agriculture. Landslides and coastal erosion can temporarily or permanently remove land from agriculture. Loss of human life, farm animals and agriculture structure damage are all possible. Many acres of agricultural lands are located in dam inundation zones. Severe erosion, loss of human and animal life, and property loss are all potentially negative impacts on agriculture that could result from a dam failure. 5.5.2 History of Agricultural Pests
Santa Barbara County has a demonstrated vulnerability to insect infestation. Infestations of Medfly, Gypsy Moth, Oriental Fruit Fly, Glassy-winged Sharpshooter, Vine Mealybug and Light-brown Apple Moth have all occurred in the last 30 years. All but the sharpshooter and the mealybug were successfully eradicated. Diseases such as Chrysanthemum White Rust and Pierce’s Disease of Grapes have caused significant losses to local growers. The rust has been eradicated, Pierce’s Disease has not.
Santa Barbara County 2011 Multi-Jurisdictional Hazard Mitigation Plan
5-41
5.5.3 Location and Extent
The first figure below shows land that, under the Williamson Act, has been zoned as agricultural, open space, or recreational. These lands are susceptible to agricultural pests and diseases. The second figure below portrays crop land. These areas are also susceptible to agricultural pests and diseases.

Santa Barbara County 2011 Multi-Jurisdictional Hazard Mitigation Plan
5-42
Figure 5.14 Agricultural Preserves, 2010
Source: Agricultural Preserves (Williamson Act), Santa Barbara GIS, available at http://www.countyofsb.org/itd/gis/default.aspx?id=2802, November 17, 2010

Santa Barbara County 2011 Multi-Jurisdictional Hazard Mitigation Plan
5-43
Figure 5.15 Agricultural Crops
Source: Agricultural Growers’ Sites, Santa Barbara County GIS available at http://www.countyofsb.org/itd/gis/default.aspx?id=2802, September 5, 2009, Prepared by Santa Barbara County Agricultural Commission

Santa Barbara County 2011 Multi-Jurisdictional Hazard Mitigation Plan
5-44
5.5.4 Probability of Occurrence
Past history is the best tool available to Santa Barbara County for predicting the likelihood of a pest or disease problem. In Santa Barbara County, the California Department of Food and Agriculture (CDFA) monitors an array of insect traps year-round as an early detection tool. Some of the traps contain general insect attractants while other traps contain lures that target specific pests. These are insect pests that have occurred in the past and are thought to be most likely to occur again. 5.5.5 Climate Change Consideration
California farmers contend with a wide range of crop‐damaging pests and pathogens. Continued climate change is likely to alter the abundance and types of many pests, lengthen pests’ breeding season, and increase pathogen growth rates. For example, the pink bollworm, a common pest of cotton crops, is currently a problem only in southern desert valleys because it cannot survive winter frosts elsewhere in the state. However, if winter temperatures rise 3 to 4.5°F, the pink bollworm’s range would likely expand northward, which could lead to substantial economic and ecological consequences for the state. Temperature is not the only climatic influence on pests. For example, some insects are unable to cope in extreme drought, while others cannot survive in extremely wet conditions. Furthermore, while warming speeds up the lifecycles of many insects, suggesting that pest problems could increase, some insects may grow more slowly as elevated carbon dioxide levels decrease the protein content of the leaves on which they feed (California Climate Change Center 2006).

Santa Barbara County 2011 Multi-Jurisdictional Hazard Mitigation Plan
5-45
5.6 EARTHQUAKE PROFILE
5.6.1 Nature of Hazard
An earthquake is caused by a release of strain within or along the edge of the Earth's tectonic plates that produces ground motion and shaking, surface fault ruptures, and ground failure. The severity of the motion increases with the amount of energy released, decreases with distance from the causative fault or epicenter, and is amplified by soft soils. After just a few seconds, earthquakes can cause massive damage and extensive casualties. The effect of an earthquake on the Earth's surface is called the intensity. The intensity scale consists of a series of certain key responses such as people awakening, movement of furniture, damage to chimneys, and finally, total destruction. Although numerous intensity scales have been developed over the last several hundred years to evaluate the effects of earthquakes, the one currently used in the United States is the Modified Mercalli Intensity (MMI) Scale. It was developed in 1931 by the American seismologists Harry Wood and Frank Neumann. This scale, composed of 12 increasing levels of intensity that range from imperceptible shaking to catastrophic destruction, is designated by Roman numerals. It does not have a mathematical basis; instead it is an arbitrary ranking based on observed effects. The MMI value assigned to a specific site after an earthquake has a more meaningful measure of severity to the nonscientist than the magnitude because intensity refers to the effects actually experienced at a particular place. The lower numbers of the intensity scale deal with the manner in which people feel the earthquake. The higher numbers of the scale are based on observed structural damage. Structural engineers usually contribute information for assigning intensity values of VIII or above. Table 5.8 Modified Mercalli Intensity Scale for Earthquakes
Scale Intensity
Earthquake Effects Typical
Richter Scale Magnitude
I Instrumental Detected only on seismographs
II Feeble Some people feel it
III Slight
Felt by people resting; like a truck rumbling by
IV Moderate Felt by people walking <4.2 V Slightly Strong Sleepers awake; church bells ring <4.8
VI Strong Trees sway; suspended objects swing; objects fall off shelves
<5.4
VII Very Strong Mild Alarm; walls crack; plaster falls <6.1
VIII Destructive Moving cars uncontrollable; masonry fractures; poorly constructed buildings damaged
IX Ruinous Some houses collapse; ground cracks; pipes break open <6.9

Santa Barbara County 2011 Multi-Jurisdictional Hazard Mitigation Plan
5-46
Table 5.8 Modified Mercalli Intensity Scale for Earthquakes
Scale Intensity
Earthquake Effects Typical
Richter Scale Magnitude
X Disastrous Ground cracks profusely; many buildings destroyed; liquefaction and landslides widespread
<7.3
XI Very Disastrous Most buildings and bridges collapse; roads, railways, pipes and cables destroyed; general triggering of other hazards
<8.1
XII Catastrophic Total destruction; trees fall; ground rises and falls in waves >8.1
Most people are familiar with the Richter scale, a method of rating earthquakes based on strength using an indirect measure of released energy. The Richter scale is logarithmic. Each one-point increase corresponds to a 10-fold increase in the amplitude of the seismic shock waves and a 32-fold increase in energy released. An earthquake registering 7.0 on the Richter scale releases over 1,000 times more energy than an earthquake registering 5.0.
Table 5.9 Richter Scale Richter
Magnitudes Earthquake Effects
Less than 3.5 Generally not felt, but recorded.
3.5-5.4 Often felt, but rarely causes damage.
Under 6.0 At most slight damage to well-designed buildings. Can cause major damage to poorly constructed buildings over small regions.
6.1-6.9 Can be destructive in areas up to about 100 kilometers across where people live. 7.0-7.9 Major earthquake. Can cause serious damage over larger areas.
8 or greater Great earthquake. Can cause serious damage in areas several hundred kilometers across.
Peak ground acceleration (PGA) is a measure of the strength of ground movement. Rapid ground acceleration results in greater damage to structures. PGA is used to project the risk of damage from future earthquakes by showing earthquake ground motions that have a specified probability (10%, 5%, or 2%) of being exceeded in 50 years return period. Therefore these values are often used for reference in construction design, and in assessing relative hazards when making economic and safety decisions. PGA is the measurement system used in this plan. Liquefaction is the phenomenon that occurs when ground shaking causes loose, saturated soils to lose strength and act like viscous fluid. Liquefaction causes two types of ground failure: lateral spread and loss of bearing strength. Lateral spreads develop on gentle slopes and entails the sidelong movement of large masses of soil as an underlying layer liquefies. Loss of bearing strength results when the soil supporting structures liquefies and causes structures to collapse. The Santa Barbara County Comprehensive General Plan Seismic Safety and Safety Element provides a comprehensive description of the factors relevant to Santa Barbara County concerning earthquakes.
Santa Barbara County 2011 Multi-Jurisdictional Hazard Mitigation Plan
5-47
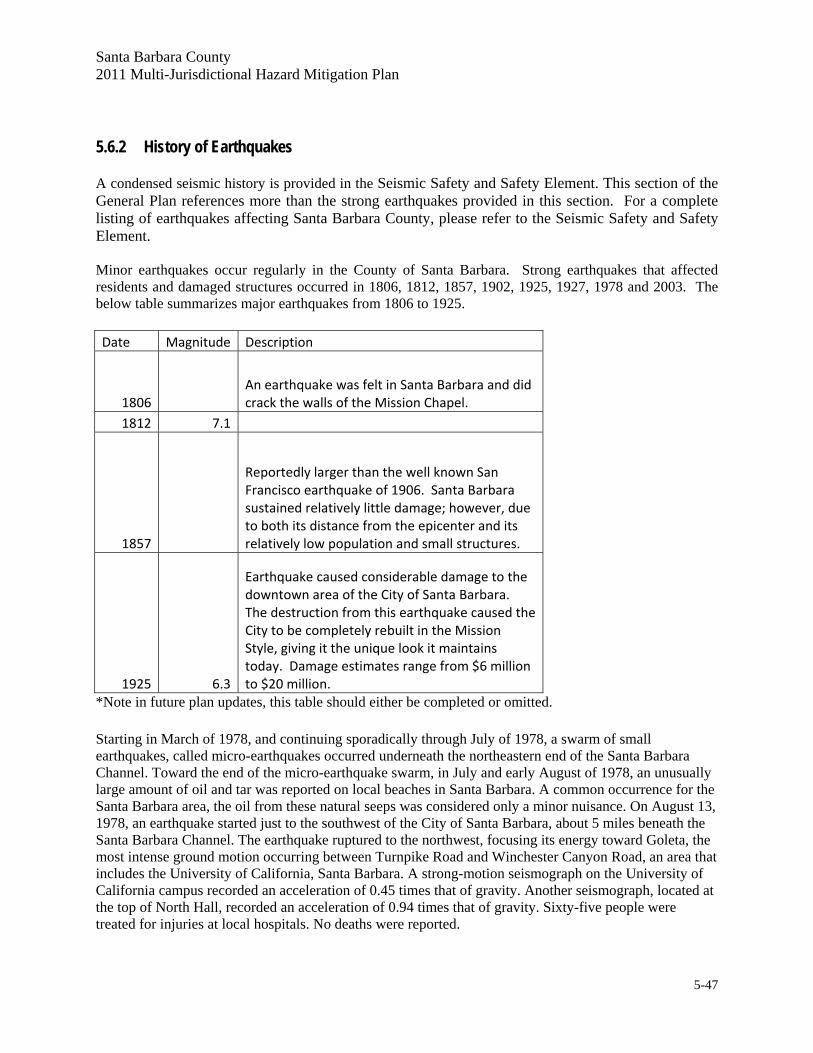
5.6.2 History of Earthquakes
A condensed seismic history is provided in the Seismic Safety and Safety Element. This section of the General Plan references more than the strong earthquakes provided in this section. For a complete listing of earthquakes affecting Santa Barbara County, please refer to the Seismic Safety and Safety Element. Minor earthquakes occur regularly in the County of Santa Barbara. Strong earthquakes that affected residents and damaged structures occurred in 1806, 1812, 1857, 1902, 1925, 1927, 1978 and 2003. The below table summarizes major earthquakes from 1806 to 1925. Date Magnitude Description
1806 An earthquake was felt in Santa Barbara and did crack the walls of the Mission Chapel.
1812 7.1
1857
Reportedly larger than the well known San Francisco earthquake of 1906. Santa Barbara sustained relatively little damage; however, due to both its distance from the epicenter and its relatively low population and small structures.
1925 6.3
Earthquake caused considerable damage to the downtown area of the City of Santa Barbara. The destruction from this earthquake caused the City to be completely rebuilt in the Mission Style, giving it the unique look it maintains today. Damage estimates range from $6 million to $20 million.
*Note in future plan updates, this table should either be completed or omitted. Starting in March of 1978, and continuing sporadically through July of 1978, a swarm of small earthquakes, called micro-earthquakes occurred underneath the northeastern end of the Santa Barbara Channel. Toward the end of the micro-earthquake swarm, in July and early August of 1978, an unusually large amount of oil and tar was reported on local beaches in Santa Barbara. A common occurrence for the Santa Barbara area, the oil from these natural seeps was considered only a minor nuisance. On August 13, 1978, an earthquake started just to the southwest of the City of Santa Barbara, about 5 miles beneath the Santa Barbara Channel. The earthquake ruptured to the northwest, focusing its energy toward Goleta, the most intense ground motion occurring between Turnpike Road and Winchester Canyon Road, an area that includes the University of California, Santa Barbara. A strong-motion seismograph on the University of California campus recorded an acceleration of 0.45 times that of gravity. Another seismograph, located at the top of North Hall, recorded an acceleration of 0.94 times that of gravity. Sixty-five people were treated for injuries at local hospitals. No deaths were reported.

Santa Barbara County 2011 Multi-Jurisdictional Hazard Mitigation Plan
5-48
A magnitude 6.5 earthquake struck the central California coast on December 22, 2003 at 11:15 in the morning. The event, known as the San Simeon Earthquake, was located 11 kilometers northeast of San Simeon, and 39 kilometers west/northwest of Paso Robles, in which the brunt of the damage and casualties occurred. Two deaths due to a building collapse were experienced in Paso Robles. The most severe damage was to un-reinforced masonry structures (URM) that had not yet been retrofitted to better withstand earthquakes. Some of the un-reinforced masonry structures that had been retrofitted survived the earthquake. Although the San Simeon Earthquake hit the adjacent County of San Luis Obispo to the north much harder, there was minor damage to more than 30 URM buildings in the City of Guadalupe. According to reports by the U.S. Geological Survey, Menlo Park, California and U.C. Berkeley Seismological Laboratory, Berkeley, California, in addition to the two people killed, over 40 buildings collapsed or were severely damaged in the Paso Robles area and 40 additional people were injured. More than 10,000 homes and businesses were without power in the same area. The event was reportedly felt as a MMS VI in Guadalupe and Santa Maria and as a MMS V in Lompoc, Santa Ynez and Solvang. The below map displays historical epicenters, from 1568 to 2009, of earthquakes located in the Santa Barbara County area. The dates of the more significant earthquake events are provided adjacent to the epicenters. Source: Earthquakes, 1568-2009, National Atlas available at http://www.nationalatlas.gov/mld/quksigx.html, July 2010, Prepared by USGS Purpose: The data is intended to show significant earthquakes in the US, Puerto Rico, the US Virgin Islands and adjacent portions of Canada and Mexico for the time period beginning in August of 1568 and ending in August of 2009. Significant earthquakes are defined as those that caused deaths, property damage, or geological effects, or that were experienced by population in the epicentral area.

Santa Barbara County 2011 Multi-Jurisdictional Hazard Mitigation Plan
5-49
Figure 5.16 Significant Earthquakes 1568 to 2009

Santa Barbara County 2011 Multi-Jurisdictional Hazard Mitigation Plan
5-50
5.6.3 Location and Extent
Earthquake Location of Past Events and Magnitude The map above shows the location of epicenters and magnitudes from past events. Most historic seismic events in the Santa Barbara region have been centered offshore between Santa Barbara and the Channel Islands. The estimated magnitudes of the maximum credible earthquake along the faults in the region range from 5.0 to 7.2, with the San Andreas Fault being the outlier, with an estimated maximum credible earthquake in the low 8.0 range. Location of Faults The County is located in the Transverse Range geologic province. Movement of continental plates is manifest primarily along the San Andreas Fault system. Other faults in the region include the Big Pine, Mesa, and Santa Ynez faults. A map of faults in the Santa Barbara County region is located below. This map highlights the Los Alamos fault and incorrectly labels it the Zaca Creek and Cuyama Alquist-Priolo (AP) fault zones. This will be corrected in the next plan update. Alquist-Priolo faults are mapped under the Alquist-Priolo Earthquake Fault Zoning Act with the main purpose of preventing the construction of buildings used for human occupancy on the surface trace of active faults. Source: Zaca Creek and Cuyama Alquist-Priolo Earthquake Fault Zones, California Geological Survey available at http://www.conservation.ca.gov/cgs/rghm/ap/Pages/Index.aspx, 1986 and 1974 respectively Purpose: The Alquist-Priolo Earthquake Fault Zoning Act was passed into law following the destructive February 9, 1971 San Fernando earthquake. The Act provides a mechanism for reducing losses from surface fault rupture on a statewide basis. The intent of the Act is to ensure public safety by prohibiting the development of most structures for human occupancy across traces of active faults that constitute potential hazard to structures from surface faulting or fault creep. To be designated as an Alquist-Priolo zoned fault, it must be demonstrated that the fault has had surface rupture in the past 11,000 years (active buried faults are not included. Source: Quaternary Faults and Folds database, USGS Earthquake Hazards Program available at http://earthquake.usgs.gov/hazards/qfaults/, November 3, 2010 Purpose: This database contains Quaternary Faults and Folds that are believed to be sources of M>6 earthquakes during the past 1,600,000 years.

Santa Barbara County 2011 Multi-Jurisdictional Hazard Mitigation Plan
5-51
Figure 5.17 Earthquake Faults (Note: green area is the Los Alamos fault)

Santa Barbara County 2011 Multi-Jurisdictional Hazard Mitigation Plan
5-52
The Seismic Safety and Safety Element provides descriptions of all faults in Santa Barbara County, including historically active, active, potentially active and inactive, as well as their location and fault length. Location and Extent of Peak Ground Acceleration Peak ground acceleration is described in the section above. The map below displays the location and extent of the profiled earthquake hazard areas for Santa Barbara County. This is based on a USGS earthquake model that shows probabilistic peak ground acceleration for every location in Santa Barbara County.

Santa Barbara County 2011 Multi-Jurisdictional Hazard Mitigation Plan
5-53
Figure 5.18 Ground Shaking Potential and Fault Lines

Santa Barbara County 2011 Multi-Jurisdictional Hazard Mitigation Plan
5-54
Ground Shake Potential The map below displays relative risk to ground shaking throughout Santa Barbara County. This data was received from the California Geological Survey. Further information may be found at: http://www.conservation.ca.gov/cgs/rghm/psha/Pages/index.aspx Earthquake shaking hazards are calculated by projecting earthquake rates based on earthquake history and fault slip rates, the same data used for calculating earthquake probabilities. New fault parameters have been developed for those calculations and are included in the report of the 2007 Working Group of California Earthquake Probabilities. Calculations of earthquake shaking hazard for California are part of a cooperative project between USGS and CGS, and are part of the National Seismic Hazard Maps. The unit “G” is acceleration of gravity. Source: Seismic Shaking Hazard, Obtained from California Geological Survey, for more information: http://www.conservation.ca.gov/cgs/rghm/psha/Pages/index.aspx, 2002.

Santa Barbara County 2011 Multi-Jurisdictional Hazard Mitigation Plan
5-55
Figure 5.19 Ground Shake Potential

Santa Barbara County 2011 Multi-Jurisdictional Hazard Mitigation Plan
5-56
Groundwater and Liquefaction Severity The map below portrays a digital version of the groundwater/liquefaction maps made by a consultant (Moore and Taber) to the County in preparation for the Seismic Safety Element in 1974. This data was received from Santa Barbara County GIS (July 15, 2010) and may be found at: http://www.countyofsb.org/itd/gis/default.aspx?id=2802 The original maps which were digitized to create this shapefile are housed in the office of the “County Geologist”. It is believed by the County GIS that these are the more “accurate” versions of the Seismic Safety Element maps which were reduced and printed in the document itself. Please note, however, that there are discrepancies between the maps in the document and these larger scaled, higher precision maps digitized for this shapefile. There is no base map information underlying the groundwater/liquefaction problem rating areas. Liquefaction The National Earthquake Hazards Reduction Program (NEHRP) rates soils from hard to soft, and gives the soils ratings from Type A through Type E, with the hardest soils being Type A, and the softest soils rated at Type E. Liquefaction risk is considered high if there were soft soils (Types D or E) present within an active fault zone. The majority of the soils in the County are types A-C, with some areas having type D. There have been no Type E soils identified. A further discussion of soils can be found in the Seismic Safety and Safety Element, along with maps of the expansive soils and collapsible soils problems ranking. Source: Groundwater Liquefaction, Santa Barbara County GIS, available at http://www.countyofsb.org/itd/gis/default.aspx?id=2802, July 15, 2010, originally prepared by Moore and Taber in 1974.

Santa Barbara County 2011 Multi-Jurisdictional Hazard Mitigation Plan
5-57
Figure 5.20 Groundwater and Liquefaction Severity

Santa Barbara County 2011 Multi-Jurisdictional Hazard Mitigation Plan
5-58
Potential Losses from Earthquakes Earthquakes were modeled using HAZUS-MH, which uses base information to derive probabilistic peak ground accelerations much like the PGA map from USGS that was used for the profiling process. A 7.0 event was selected as representative of risk in the County and the model was run for 500 year and 2000 year recurrence events. The figure below shows seven earthquake simulation output results for estimated building losses in Isla Vista, CA. This information comes from a report titled “Mapping Earthquake Risk in Isla Vista, CA Using HAZUS-MH and a Geographic Information System”, which was written by University of California Santa Barbara students. The report was conducted in June 2010 and assesses how the Isla Vista population, infrastructure, critical facilities, and structures will withstand a significant earthquake event.
Figure 5.21 Earthquake Simulation Results

Santa Barbara County 2011 Multi-Jurisdictional Hazard Mitigation Plan
5-59
The below table lists estimated building losses in Isla Vista, CA.
Table 5.10 Number of Parcels by Event and Estimated Losses
5.6.4 Probability of Occurrence
In general, the greater the displacement of geologic units, the greater the number of earthquakes that have occurred. Although data are insufficient to estimate recurrence intervals for other faults in Santa Barbara County, total displacements can be found in the Seismic Safety and Safety Element. These data provide a qualitative basis for comparing earthquake risk of individual faults. The 2007 Working Group on California Earthquake Probabilities (WGCEP) has developed a statewide earthquake-rupture forecast that uses “best available science”. This model, called the Uniform California Earthquake Rupture Forecast (UCERF), is the product of a collaborative project of the U.S. Geological Survey (USGS), the California Geological Survey (CGS) and the Southern California Earthquake Center (SCEC) with the assistance of the California Earthquake Authority (CEA). Development of this model was tightly coordinated with the USGS National Seismic Hazard Mapping Program (NSHMP). For this project, the WGCEP has assembled and analyzed the latest data on the rates of earthquake occurrence from historic and instrumental data, paleoseismology, slip rates on faults, and deformation rates from GPS and long-term plate-tectonic models. The resulting model achieves an unprecedented degree of agreement with all the available data and can be used to calculate future earthquake hazards. (http://www.conservation.ca.gov/cgs/rghm/psha/Pages/sp_203.aspx) Based on the modeling discussed above, the image below shows the probability of an M > 6.7 earthquake occurring in California in the next 30 years.

Santa Barbara County 2011 Multi-Jurisdictional Hazard Mitigation Plan
5-60
Figure 5.22 Probability of a M > 6.7 Earthquake
The figure below shows the number of times per century that shaking from earthquakes will exceed 20% the force of gravity. Damage to non-improved buildings begins to occur at this intensity.

Santa Barbara County 2011 Multi-Jurisdictional Hazard Mitigation Plan
5-61
Figure 5.23 Frequency of Shaking in Excess of 20% the Force of Gravity
(Source: Southern California Earthquake Center, from Santa Barbara Materials Laboratory Manager)

Santa Barbara County 2011 Multi-Jurisdictional Hazard Mitigation Plan
5-62
5.7 LANDSLIDE/COASTAL EROSION PROFILE
5.7.1 Nature of Hazard
Landslides and coastal erosion can be defined as rock, earth, or debris displacing down an incline. Types of landslides and coastal erosion include: rock falls, rock slides, deep slope failures, shallow debris flows, and mud flows. In order for landslides or mass coastal wasting to occur, the correct geological conditions, which include unstable or weak soil or rock, and topographical conditions, such as steep slopes, are necessary. Heavy rain often triggers these hazards, as the water adds extra weight that the soil cannot bear. Over irrigating has the same affect. Earthquakes can also affect soil stability, causing enough weakening to favor gravitational forces. Both landslides and coastal erosion are influenced by human activity, such as mining and the construction of buildings, railroads, and highways. The most common cause of a landslide is an increase in the down slope gravitational stress applied to slope materials, also known as over-steepening. Over-steepening can be caused by natural processes or by man-made activities. Undercutting of a valley wall by stream erosion or of a sea cliff by wave erosion are ways in which over-steeping may occur naturally. Another type of soil failure is slope wash, the erosion of slopes by surface-water runoff. The intensity of slope wash is dependent on the discharge and velocity of surface runoff and on the resistance of surface materials to erosion. Surface runoff and velocity is greatly increased in urban and suburban areas due to the presence of roads, parking lots, and buildings, which are impermeable to water and provide relatively smooth surfaces that do not slow down runoff. Mudflows, another type of soil failure, are defined as flows or rivers of liquid mud down a hillside. They occur when water accumulates under the ground, usually following long and heavy rain falls. Mud forms and flows down slope if there is no ground cover such as brush or trees to hold the soil in place. Various locations throughout the County are subject to all of these types of events. Further discussion of landslides and slope stability is located in the Seismic Safety and Safety Element of the County’s General Plan.
5.7.2 History of Landslides/Coastal Erosion
The map below was derived from USGS data and shows the most costly landslide events in the US. The event depicted in this Santa Barbara County specific map occurred in 1980 and affected six southern California counties, including Santa Barbara County. The type of landslide was mostly debris flow from heavy rainfall. $800 million dollars worth of damage resulted from this event. *Note to include information regarding the 2000 Sycamore Canyon landslide in the next plan update.
Source: Landslides-Costly Regional Events, National Atlas available at http://www.nationalatlas.gov/mld/landslx.html, October 2001, Prepared by USGS
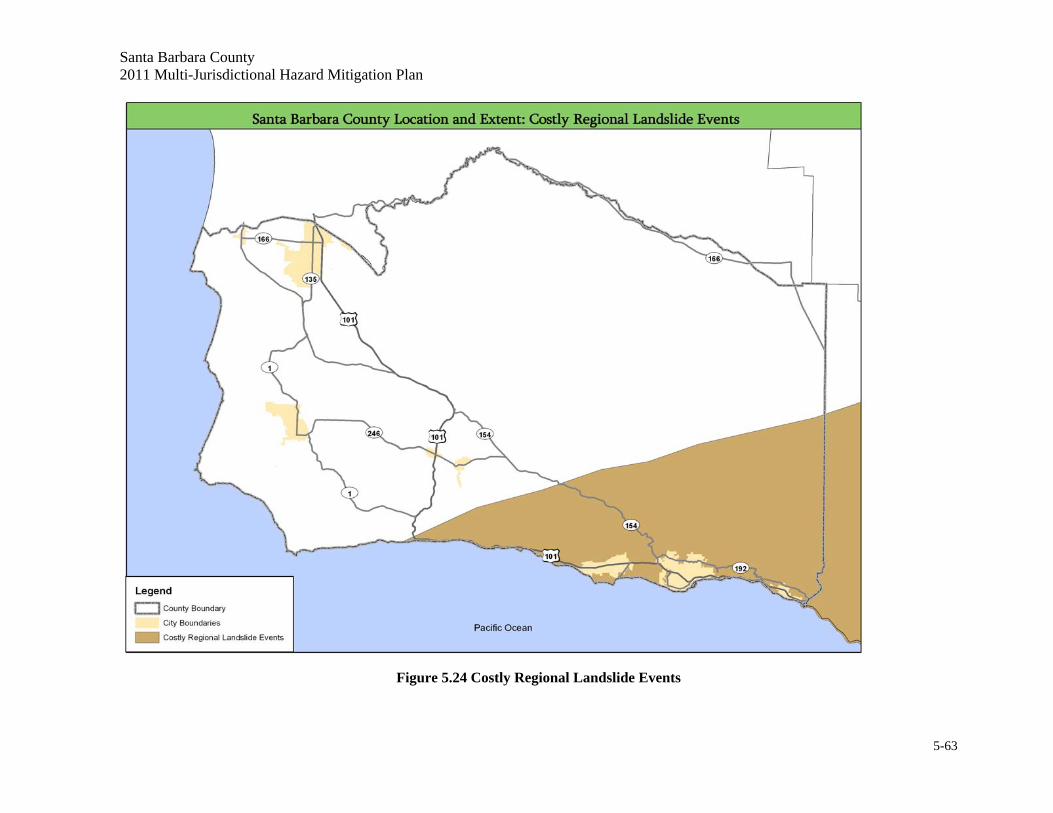
Santa Barbara County 2011 Multi-Jurisdictional Hazard Mitigation Plan
5-63
Figure 5.24 Costly Regional Landslide Events

Santa Barbara County 2011 Multi-Jurisdictional Hazard Mitigation Plan
5-64
During the late 1990’s in Sycamore Canyon, which resides near the border of Santa Barbara County and the City of Santa Barbara, a mud flow displaced a home from its foundation and moved it several feet downhill. This is only a minor example of the destruction that landslides can cause. In the spring of 1995, La Conchita, located at the western border of Ventura County and adjacent to Santa Barbara County, experienced a landslide that completely destroyed several houses in its path. A portion of the bank of the Cuyama River collapsed east of Santa Maria in 1998, affecting half a dozen cars and a tractor trailer rig on Highway 166, which were caught in the slide. Two people were killed. In January 2005, a powerful Pacific storm brought heavy rain, snow, flash flooding, high winds and landslides to Central and Southern California. During the 5 day event, rainfall totals ranged from 3 to 10 inches over coastal areas with up to 32 inches in the mountains. With such copious rainfall, flash flooding was a serious problem across Santa Barbara, Ventura and Los Angeles counties. In Santa Barbara county, flash flooding and mudslides closed Gibraltar Road at Mt. Calvary Road, stranding several vehicles, while mudslides inundated 3 homes in Lake Casitas. Across Ventura county, flash flooding and mudslides closed down Creek Road at Hermosa Road. In addition, the Ventura Beach RV Resort was flooded and Highways 1 and 126 were closed due to flooding. Across Los Angeles county, flash flooding killed a homeless man in Elysian Park, flooded a mobile home park in Santa Clarita, closed Highway 1 and caused numerous problems in Palmdale. In the mountains, 4 to 12 feet of snowfall was recorded along with southeast winds between 30 and 50 MPH with higher gusts. Across the Central Coast and in the Salinas River Valley, high winds gusting to 65 MPH knocked down numerous trees and power lines. In La Conchita, a devastating mudslide killed 10 people, destroyed 15 homes and damaged 12 other homes. Overall, damage estimates for the entire series of storms that started December 27th, 2004 and ended on January 11th, 2005 were easily over $200 million with the most damage incurred by agricultural interests in Ventura county. Several areas in the County are prone to more frequent rain induced landslides, resulting in disruption to transportation and damage to roadways. The most common areas of recent historic slides are listed below. South County
• Palomino Road (1995, 1998) • Gibraltar Road (1995, 1998, 2001, 2003) • Glen Annie Road (1995, 1998, 2001, 2004) • All Roads underlain by the Rincon Shale Formation. • Refugio Road (1995, 1998, 2001) • Ortega Hill Road (1995, 1998) • Stagecoach Road (Constant, 2003, 2004) • Painted Cave (1995, 1998) • Old San Marcos Road (1995, 1998, currently moving) • Gobernador Canyon (1995, 1998, currently moving) • East Mountain Drive (1995, 1998, 2001)
North County (Most experienced sliding in 1995 and 1998, and are considered ongoing threats)
• Miguelito Canyon • Sweeney Road • Jalama Road

Santa Barbara County 2011 Multi-Jurisdictional Hazard Mitigation Plan
5-65
• Point Sal Road • Drum Canyon Road • Mail Road • Santa Rosa Road • Figueroa Mountain Road
More detailed descriptions of the landslide prone areas listed above are included as Appendix 4-E. In addition to these 18 areas where landslide is a common occurrence, listed below are several bridges throughout the County that are known to experience scour during flooding erosion events. Scour Critical Bridges North County
• Foothill (Cuyama) • Jalama Road at Ramajal Creek (Bridge No 51C-0016) is listed as Scour Critical, with Unstable
Foundation South County
• East Mountain Drive at San Ysidro Creek (Bridge No 51C-0202) is listed as Scour Critical, with Extensive Foundation Scour
• Ashley Road at Montecito Creek (Bridge No 51C-0043) is listed as Scour Critical, with Extensive Foundation Scour
• Cathedral Oaks Road at San Antonio Creek (Bridge No 51C-0001) is listed as Scour Critical, with Extensive Foundation Scour
Landslides and landslide prone sedimentary formations are present throughout the coastal plain of western Santa Barbara County. Landslides also occur in the granitic mountains of East Santa Barbara County, although they are less prevalent. Many of these landslides are thought to have occurred under much wetter climatic conditions than at present. Recent landslides are those with fresh or sharp geomorphic expressions suggestive of active (ongoing) movement or movement within the past several decades. Reactivations of existing landslides can be triggered by disturbances such as heavy rainfall, seismic shaking and/or grading. Many recent landslides are thought to be reactivations of ancient landslides.
5.7.3 Location and Extent
Landslides The location and extent of landslides are extremely difficult to predict consistently for a planning area the size of Santa Barbara County. There are locations throughout the County that are prone to landslide and erosion activity, in addition to areas of known concern, which are listed in the section above. In 2004, URS obtained a digital version of the Landslide Overview Map of the Conterminous United States from the USGS. Because this data was created at a nationwide scale and is not suitable for local planning, URS refined this data layer using slope derived from the USGS 30-meter resolution Digital Elevation Model. High and moderate risk areas within Santa Barbara County were refined by identifying the areas where the risk of landslide incidence was considered high or moderate by the

Santa Barbara County 2011 Multi-Jurisdictional Hazard Mitigation Plan
5-66
national data set and where the slope exceeded 25%. The data from the USGS has not changed since the last plan, and, therefore, this map is still the best available source that can be used to determine landslide susceptibility and incidence in Santa Barbara County. Source: Landslide Incidence and Susceptibility in the Conterminous US, National Atlas available at http://www.nationalatlas.gov/atlasftp.html#lsoverp, September 2002, Prepared by USGS Purpose: Landslide incidence is a measure of how frequently landslides occur in any given area. This data is highly generalized and should not be used for local planning or actual site selection. The data is meant to give general indication of areas that may be susceptible to land sliding.

Santa Barbara County 2011 Multi-Jurisdictional Hazard Mitigation Plan
5-67
Figure 5.25 Landslide Incidence

Santa Barbara County 2011 Multi-Jurisdictional Hazard Mitigation Plan
5-68
The Seismic Safety and Safety Element of the General Plan lists the areas in Santa Barbara County where there is fairly severe land sliding and associated geologic formations. They are as follows:
• Foothills in the Summerland area • Foothills of the South Coast – from Santa Barbara west to Gaviota Pass • Hope Ranch area – west of Lavigia Hill to Goleta • Sea cliffs along the coast from Santa Barbara to Gaviota, particularly those with out-of-slope
dips • Solvang area south of the Santa Ynez River in the vicinity of, and east of Alisal Ranch • Areas east and northeast of Los Olivos near the Los Padres National Forest boundary • Lompoc area south of Santa Ynez River • Mountains south of Guadalupe and east of Point Sal
Maps and further discussion regarding slope stability can be found in the Seismic Safety and Safety Element. The overview map of slope stability for the County from this section of the General Plan is provided in Figure 5.26.

Santa Barbara County 2011 Multi-Jurisdictional Hazard Mitigation Plan
5-69
Figure 5.26 Slope Stability, Landslides
(Source: County of Santa Barbara, taken from the Seismic Safety & Safety Element)
Coastal Erosion FEMA Zone VE has also been added to the map displaying landslide susceptibility and incidence in the section above. FEMA defines Zone VE as an area inundated by 100-year flooding with velocity hazard (wave action).The general assumption is that property within the V-Zones is more susceptible to coastal erosion.

Santa Barbara County 2011 Multi-Jurisdictional Hazard Mitigation Plan
5-70
5.7.4 Probability of Occurrence
Landslide Figure 5.26 in the section above shows the general locations of high and moderate landslide risk based on the methodology described above. These areas are considered to have a higher probability of landslide occurrence than the low landslide risk areas in Santa Barbara County. Coastal Erosion Property within FEMA’s VE Zone, as shown on the map in the section above, is more susceptible to coastal erosion in the future.
5.7.5 Climate Change Consideration
Landslide Climate change can increase the frequency and/or intensity of landslides. As discussed in further detail in Section 5.3.5, changes in precipitation, specifically the increased frequency of intense precipitation, can result in a water content the ground cannot tolerate, and may cause landslides. These landslides may happen more frequently due to the increased number of heavy rainfall events. Also, the increased heavy precipitation events may cause instability in areas where landslides we not as likely before. Therefore, resulting landslides may be larger or more widespread. Coastal Erosion Coastal erosion can be increased by climate change in two ways. First, sea level rise, over time, will cause more rapid erosion of more inland areas than in previous years. This will be chronic erosion, however it will reach new, more inland areas, in the future due to higher average sea levels. Secondly, while the topic of increased frequency of storms is up in debate, if more severe or frequent storms do occur, it will increase coastal erosion events. More frequent storms will impact the how frequently coastal erosion acute events occur, while more intense events will cause the erosion to occur in areas more inland than before.

Santa Barbara County 2011 Multi-Jurisdictional Hazard Mitigation Plan
5-71
5.8 DAM FAILURE PROFILE
5.8.1 Nature of Hazard
Dams fail due to old age, poor design, structural damage, improper sitting, landslides flowing into a reservoir, or terrorist actions. Structural damage is often a result of a flood, erosion, or earthquake. A catastrophic dam failure could inundate the area downstream. The force of the water is large enough to carry boulders, trees, automobiles, and even houses along a destructive path downstream. The potential for casualties, environmental damage, and economic loss is great. Damage to electric generating facilities and transmission lines could impact life support systems in communities outside the immediate hazard area. The cities of Lompoc, Santa Barbara, and Carpinteria and portions of Santa Maria, Buellton, and Solvang are subject to potential dam failure. There are nine major dams in the County. These include: Alisal Creek, Bradbury, Dos Pueblos, Gibraltar, Glen Anne, Juncal, Ortega, Rancho Del Ciervo, and Twitchell. Bradbury dam has the largest concern of failure because floodwaters from this dam would affect Cachuma Village, Solvang, Buellton, Lompoc City, Lompoc Valley, and south Vandenberg AFB. A failure of the remaining eight dams would affect portions of populated cities and communities, forest and agricultural lands, roads, and highways. A brief discussion of dam failure is provided in the Santa Barbara County Comprehensive General Plan Seismic Safety and Safety Element. 5.8.2 History of Dam Failure
Built in 1917, the Sheffield Dam only survived for eight years, failing catastrophically during an earthquake in 1925. It was built on sandy soil which liquefied during the event. The center 300-feet of the 720-feet long dam broke off and was carried away on the liquefied soil, spilling 30 million gallons of water. Damage estimates are unavailable. This is the only major dam failure identified in the County during research. The floods of 1995 and the nearby 1994 Northridge earthquake prompted the Santa Barbara County Grand Jury to investigate preparedness for disasters within the County of Santa Barbara. The findings of the investigation noted that the Bradbury Dam could suffer catastrophic structural damage if a major earthquake should occur in its vicinity. When the US Department of the Interior evaluated all dams under its jurisdiction, the review of the Bradbury Dam disclosed deficiencies. The alluvial earth at the front of the Bradbury Dam was water saturated. In 1995, to alleviate this condition, 17 pumps were installed after holes were drilled down to the bedrock. The removal of this water was done to prevent liquefaction and instability that can result from an earthquake. Although this mitigation project was completed, further work on the Bradbury Dam is needed. When it was first announced that seismic dam failure was a possibility before repairs were completed, the County OES distributed safety brochures throughout the Santa Ynez Valley, including Lompoc, Solvang and Buellton. Since the possibility of a major earthquake is rare, the risk

Santa Barbara County 2011 Multi-Jurisdictional Hazard Mitigation Plan
5-72
of a catastrophic dam break cause by an earthquake is also minimal. The City of Lompoc has plotted those areas of the city that would be impacted by flood waters and has installed warning sirens, designated evacuation routes, and held simulated drills.
5.8.3 Location and Extent
Figure 5.27 was taken from the Seismic Safety and Safety Element and includes the locations of all the dams in the County.
Figure 5.27 Dam Locations
(Source: County of Santa Barbara, taken from the Seismic Safety & Safety Element) Dam inundation zones, obtained through the Santa Barbara County Flood Control and Water Conservation District, show areas that would be flooded should a dam fail. Figure 5.27 displays the dam failure inundation areas along with the location of major dams in the County. Information about the four major reservoirs located in Santa Barbara County and dam locations can be found in the Flood Location and Extent section.

Santa Barbara County 2011 Multi-Jurisdictional Hazard Mitigation Plan
5-73
5.8.4 Probability of Occurrence
Dam failure events are infrequent and usually coincide with the events that cause them, such as earthquakes, landslides and excessive rainfall and snowmelt. There is a “residual risk” associated with dams; residual risk is the risk that remains after safeguards have been implemented. For dams, the residual risk is associated with events beyond those that the facility was designed to withstand. However, the probability of occurrence of any type of dam failure event is considered to be low in today’s regulatory and dam safety oversight environment. 5.8.5 Climate Change Consideration
Dams are designed partly based on assumptions about a river’s flow behavior, expressed as hydrographs. Changes in weather patterns can have significant effects on the hydrograph used for the design of a dam. If the hygrograph changes, it is conceivable that the dam can lose some or its entire designed margin of safety, also known as freeboard. If freeboard is reduced, dam operators may be forced to release increased volumes earlier in a storm cycle in order to maintain the required margins of safety. Such early releases of increased volumes can increase flood potential downstream. Additionally, dams are constructed with safety features know as “spillways.” Spillways are put in place on dams as a safety measure in the event of the reservoir filling too quickly. Spillway overflow events, often referred to as “design failures,” result in increased discharges downstream and increased flooding potential. Dam operators face increased probability of design failures due to weather impacts from climate change. So while climate change will not increase the probability of catastrophic dam failure, it may increase the probability of design failures. Throughout the west, communities downstream of dams are already seeing impacts from climate change due to increases in stream flows from earlier releases from dams. 5.9 TSUNAMI PROFILE
5.9.1 Nature of Hazard
A tsunami is a series of long waves generated in the ocean by a sudden displacement of a large volume of water. Underwater earthquakes, landslides, volcanic eruptions, meteoric impacts, or onshore slope failures cause this displacement. Tsunami waves travel at speeds averaging 450 to 600 miles per hour. As a tsunami nears the coastline, its speed diminishes, its wavelength decreases, and its height increases. Depending on the type of event that creates the tsunami, as well the remoteness of the event, the tsunami could reach land within a few minutes or after several hours. Low-lying areas could experience severe inland inundation of water and deposition of debris more than 3,000 feet inland. The Cities of Santa Barbara and Carpinteria are located on or near several offshore geological faults, the more prominent faults being the Mesa Fault, the Santa Ynez Fault in the mountains, and the Santa

Santa Barbara County 2011 Multi-Jurisdictional Hazard Mitigation Plan
5-74
Rosa Fault. There are other unnamed faults in the offshore area of the Channel Islands. These faults have been active in the past and can subject the entire area to seismic action at any time. 5.9.2 History of Tsunami
The relative threat for local tsunamis in California can be considered low due to low recurrence frequencies. Large, locally-generated tsunamis in California are estimated to occur once every 100 years. Thirteen possible tsunamis have been observed or recorded from local earthquakes between 1812 and 1988. These tsunami events were poorly documented and some are very questionable. There is no doubt that earthquakes occurring along submarine faults off Santa Barbara could generate large destructive local tsunamis (http://www.drgeorgepc.com/Tsunami1812SantaBarbara.html). Internet research provides some documentation that two tsunamis were generated from two major earthquakes in the Santa Barbara region in December of 1812. The size of these tsunamis may never be known with certainty, but there are unconfirmed estimates of 15 feet waves at Gaviota, 30-35 feet waves at Santa Barbara, and waves of 15 feet or more at Ventura. These estimates are found in various literature and based on anecdotal history only. Major faults of the San Andreas zone, although capable of strong earthquakes, cannot generate any significant tsunamis. Only earthquakes in the Transverse Ranges, specifically the seaward extensions in the Santa Barbara Channel and offshore area from Point Arguello, can generate local tsunamis of any significance. The reason for this may be that earthquakes occurring in these regions result in a significant vertical displacement of the crust along these faults. Such tectonic displacements are necessary for tsunami generation. Two separate events, occurring in 1877 and 1896, are listed in NOAA’s online database as having heights of 1.8 and 2.5 feet waves. However, tsunami heights from historical records are estimated and should not be regarded as exact. Other recorded tsunamis affecting Santa Barbara during the 20th century are in the 0.1 – 1.0 foot range. On February 27, 2010, a magnitude 8.8 earthquake occurred along the central coast of Chile and produced a tsunami. For the coast of Southern California, it was one of the largest tsunami episodes since 1964. In general, tsunami waves between 2 and 4 feet were reported. Tsunami waves of around 3 feet were reported by tide gauges across the Santa Barbara Channel. At Santa Barbara Pier, significant beach erosion was reported along with displacement of buoys. The tsunami surge lasted in excess of 20 hours. The most significant damage occurred along the coasts of Ventura and southern Santa Barbara counties. Numerous reports of dock damage were reported along with beach erosion. On March 11, 2011, a magnitude 9.0 earthquake occurred off the Pacific coast of Tohoku, Japan. This earthquake devastated many communities in Japan and caused tsunami effects across the ocean in Santa Barbara County. The only significant impact to Santa Barbara County was to the dredging contractor for the harbor. The City harbor operations documented approximately $1,500 of damages (Public Assistance). The dredging contractor may pursue SBA funding.

Santa Barbara County 2011 Multi-Jurisdictional Hazard Mitigation Plan
5-75
5.9.3 Location and Extent
The University Of Southern California Tsunami Research Group has modeled areas in Santa Barbara County that could potentially be inundated in the event of a tsunami. This model is based on potential earthquake sources and hypothetical extreme undersea, near-shore landslide sources. The data was mapped by Cal EMA for the purpose of Tsunami Evacuation Planning. Extreme tsunami inundation areas were mapped and used to profile maximum potential exposure. The figure below shows tsunami run up limits for Santa Barbara County. The tsunami inundation map helps to assist cities and counties in identifying their tsunami hazard areas. The inundation line represents the maximum considered tsunami run up from a number of extreme, yet realistic, tsunami sources. Source: Tsunami Runup Limits, Santa Barbara County GIS available at http://www.countyofsb.org/itd/gis/default.aspx?id=2802&ekmensel=e2f22c9a_486_496_btnlink, September 2009.

Santa Barbara County 2011 Multi-Jurisdictional Hazard Mitigation Plan
5-76
Figure 5.28 Tsunami Inundation Area

Santa Barbara County 2011 Multi-Jurisdictional Hazard Mitigation Plan
5-77
5.9.4 Probability of Occurrence
Based on the tsunami inundation map above, several areas along the coast of Santa Barbara have the potential to be inundated by a tsunami. However, since the probability of an earthquake occurring is rare, the probability of a tsunami is also rare. 5.9.5 Climate Change Consideration
Climate change may increase the impact of tsunamis indirectly. While climate change may not have any impact on the frequency or intensity of underwater earthquakes, sea level rise from climate change will likely intensify the impact of a tsunami. Rising sea levels, discussed in detail in Section 5.3.5, will allow for waters to reach more inland areas. When a tsunami hits, the waters will reach further inland than without sea level rise and the resulting tsunami waves will impact more people and structure.