section 7.3.1. to 7 - ministry of statistics and...
TRANSCRIPT

CHAPTER SEVENCHAPTER SEVEN
HUMAN SETTLEMENTSHUMAN SETTLEMENTS

CHAPTER SEVEN
Human Settlements
POPULATION & POVERTY 7.1 The root cause of environmental degradation in India can be attributed to rapid growth of population. India has approximately 18 per cent of the world population but only 2 per cent of the geographical area. 7.2 In 1972, in the Stockholm Conference on Environment, the then Prime Minister of India, Smt. Indira Gandhi had said that poverty is a great pollutant. Twenty years later, in 1992, World Bank stated, “poor are the agents and victims of environmental degradation”. The poor become agents of environmental degradation when they are victims of it. 7.3 Human development is also adversely affected by the environmental degradation. Two of the environmental indicators, viz. access to the safe drinking water and the sanitation are closely linked with two of the very important human development indicators, viz. an infant mortality rate and the life expectancy. Polluted air and poor and unhygienic conditions in settlements contribute to reduction in life expectancy and increase in infant mortality. Life expectancy in India is still on very low ebb and an infant mortality rate is much more than desirable. The poor, therefore, take fertility decisions to compensate for all those factors and to avoid risks. Larger population leads to more poverty and worsens the environment, and creates vicious cycle. HOUSING AND BASIC SERVICES 7.4 Access to safe drinking water and proper sanitation is both a right and a basic need. It has a significant bearing on the achievements of other Millennium
Development Goals including poverty reduction, and gender equality. However, despite two decades of concerted efforts by national governments and international communities, equitable access to safe drinking water supply and improved sanitation for all remains elusive. It is a pressing development issue. 7.5 Almost two-thirds of the world’s population without access to safe water and 80 percent without access to improved sanitation, lives in Asia. In the last decade of the 20th century, Asian countries invested about $60 billion in water supply and about $ 11 billion in sanitation. This enabled about 585 million people in both rural and urban areas to gain access to safe water supply, and the Johannesburg Summit goal of halving the number of people without access to improved sanitation by 2015, are to be achieved, about 1 billion people in Asia would have to obtain access to safe drinking water and another 1 billion people to improved sanitation. 7.6 Water is a finite resource. Conserving water is one way of ensuring that more is available for those who do not have it. The reduction of non-revenue water in Asia (currently ranging from 25-70 per cent in most water utilities) will significantly lower capital requirements for new investments and conserve. It costs far less to reduce non-revenue water than to expand capacity and perpetuate system inefficiencies. Access can also be expanded by applying the results of research in new technologies that separate water use (e. g., for cooking, drinking, bathing, sanitation), and through natural means such as rainwater harvesting and storage. In conjunction, water quality must remain a key focus area.
266 225

7.7 We do not need only food, we also need potable drinking water, adequate system for disposal of excreta, good sanitation and personal hygiene to reduce prevalence of morbidity. Several studies carried out in our villages confirm that diarrhea and respiratory diseases are the most common and dangerous diseases affecting children. The majority of illness tends to synergies malnutrition both by demanding higher energy intake to meet the rise in BMR which accompany fever and by requiring higher intake of protein and other nutrients to form antibodies to fight the illness. It is this negative correlation that Japan used to formulate its policy in post war years to provide water for drinking, pit latrines to dispose of excreta, sanitation to control breeding of flies and mosquitoes, which in turn resulted an increase in life expectation of 12 years during the immediate post war decade. SLUM POPULATION 7.8 A total of 42.6 million people living in 8.2 million households have been enumerated in slums of 640 cities/towns spread across 26 states and union territories in 2001 census. The slum population constitutes 4 percent of the total population of the country. The slum dwellers in the country constitute nearly a seventh of the total urban population of the states and union territories reporting slum population and 23.1 percent of the population of the 640 cities/towns reporting slums. 7.9 The large urban cities are the centres of economic growth and contributes significantly to the GDP of the country. Cities with population above 100,000 accounts for 60 percent of country’s population in 2001. About 17.7 million population lives in the citites with population above one million, which is 41.6 percent of the total slum population in the country. In absolute numbers, Greater Mumbai has the highest slum population of around 6.5 million followed by Delhi 1.9
million and Kolkata 1.5 million. The slum areas of Surat, Hyderabad, Chennai and Nagpur have more than half a million population each. SOLID WASTE AND HAZARDOUS MATERIAL MANANGEMENT 7.10 Due to a rapid growth of urbanization, there is a substantial increase in generation of solid waste in both absolute and per capita terms. Surveys have been conducted to assess for solid waste generation, collection, treatment and disposal in 291 Class I cities and 345 Class II cities. It has been indicated that very little amount of waste generated is treated. The problems in management of wastes relate to its collection, handling, transport and disposal. Segregation of solid wastes is not uncommon in India as much of recycling work is being done either by ragpickers or non-Governmental agencies in few areas. Proper sanitary landfilling sites need to be developed which are effective in keeping the surface and ground water free from leachates. 7.11 When this solid waste is not
collected and disposed of efficiently and effectively, it attracts rodents and flies which then spread diseases. It also pollutes and degrades land and water resources. If these wastes are left untreated, they would ferment slowly and produce bio-gas which would be distributed in the atmosphere. The bio-gas contains 65-70% methane gas which is a green house gas, have a global warming potential 34 times more than that of Carbon Dioxide. Therefore, development of suitable technologies for utilization of wastes is essential to minimize adverse health and environment consequences. Comprehensive guidelines are available with Central Pollution Control Board for Toxic
226

Waste Management including hospital wastes.
STUDY ON SOLID WASTES IN DELHI 7.11 As per a study conducted in 1999, to generate data on Solid Wastes produced in Delhi, it was found that an average daily generation of municipal solid wastes in Delhi is 5327 tons. Its physical analysis revealed that the wastes consist of about 47% of biodegradable component. The recyclable components include paper and cardboard (6.7%), plastics (4.17%) and metal (1%). Total revenues to be earned through selling out these recyclable components will be of the order of crores of rupees. Data revealed that a large amount of Municipal Solid Waste generated can be recycled and reused. Technique and technologies for the same are available. It is also economically attractive and commonly practised by many countries in the world. PLASTICS WASTE MANAGEMENT 7.12 Use of plastics have grown manifolds all over the world as it has many advantages. They are light, easy to mould, durable and easy to adopt to different user requirements. However, plastics are difficult to destroy and are classified as non-biodegradable. On the other hand, it is easy to recycle plastics. 7.13 In the Indian context, it is seen that the growth of the plastic industries is phenomenal. Polymer demand in India has consistently recorded double digit growth rates, trebling every 10 years. India's per capita consumption of 1.6 kg of plastics in 1998 was expected to rise to around 4 Kg by the year 2000. However, as compared to the world's statistics of per capita consumption of plastics, it is still far less. In the year 1998 , the per capita consumption of Western Europe was 60 Kg. that of Japan 70 Kg. and of USA 78 Kg. as against 1.6 Kg of India. Also, about 60% of the plastic wastes
generated in India are recycled which is the highest in the world. However, the remaining 40 % of the plastic wastes remains uncollected, unsegregated, strewn on the ground, littered around in open drains or in unmanaged garbage dumps. The collection of such Soiled Waste including the one recycled three or even four times earlier, is not only uneconomical for recovery of material, but also unhygienic and undermines the environmental benefits of materials recycling. These indiscriminately disposed solid plastic wastes are of concern in view of causing chokage of municipal sewers, blocking of the storm water run-offs in drains particularly in hilly areas, causing deaths to many animals, like, cows which feed on the garbage food thrown in polythene bags.
227

POPULAION AND POVERTY
(Numbers)States/U.Ts.
Male Female Male Female Male Female1 2 3 4 5 6 7 8
States1 Andhra Pradesh 27,109,616 26,441,410 33,724,581 32,783,427 38,527,413 37,682,5942 Arunachal Pradesh 339,322 292,517 465,004 399,554 579,941 518,0273 Assam 9,444,037 8,597,211 11,657,989 10,756,333 13,777,037 12,878,4914 Bihar 35,930,560 33,984,174 33,838,238 30,692,316 43,243,795 39,754,7145 Chhattisgarh++ .. 8,872,620 8,742,308 10,474,218 10,359,5856 Goa 510,152 497,597 594,790 575,003 687,248 660,4207 Gujarat 17,552,640 16,533,159 21,355,209 19,954,373 26,385,577 24,285,4408 Haryana 6,909,679 6,012,440 8,827,474 7,636,174 11,363,953 9,780,6119 Himachal Pradesh 2,169,931 2,110,887 2,617,467 2,553,410 3,087,940 2,989,960
10 Jammu & Kashmir+ 3,164,660 2,822,729 4,142,082 3,694,969 5,360,926 4,782,77411 Jharkhand++ .. .. 11,363,853 10,480,058 13,885,037 13,060,79212 Karnataka 18,922,627 18,213,087 22,951,917 22,025,284 26,898,918 25,951,64413 Kerala 12,527,767 12,925,913 14,288,995 14,809,523 15,468,614 16,372,76014 Madhya Pradesh 26,886,305 25,292,539 25,394,673 23,171,569 31,443,652 28,904,37115 Maharashtra 32,414,432 30,368,386 40,825,618 38,111,569 50,400,596 46,478,03116 Manipur1 721,006 699,947 938,359 898,790 1,161,952 1,131,94417 Meghalaya 683,710 652,109 907,687 867,091 1,176,087 1,142,73518 Mizoram 257,239 236,518 358,978 330,778 459,109 429,46419 Nagaland 415,910 359,020 641,282 568,264 1,047,141 942,89520 Orissa 13,309,786 13,060,485 16,064,146 15,595,590 18,660,570 18,144,09021 Punjab 8,937,210 7,851,705 10,778,034 9,503,935 12,985,045 11,373,95422 Rajasthan 17,854,154 16,407,708 23,042,780 20,963,210 29,420,011 27,087,17723 Sikkim 172,440 143,945 216,427 190,030 288,484 252,36724 Tamil Nadu 24,487,624 23,920,453 28,298,975 27,559,971 31,400,909 31,004,77025 Tripura 1,054,846 998,212 1,417,930 1,339,275 1,642,225 1,556,97826 Uttaranchal++ .. .. 3,674,540 3,438,943 4,325,924 4,163,42527 Uttar Pradesh 58,819,535 52,042,977 70,362,417 61,636,387 87,565,369 78,632,55228 West Bengal 28,560,901 26,019,746 35,510,633 32,567,332 41,465,985 38,710,212
Union Territories1 A&N Islands 107,261 81,480 154,369 126,292 192,972 163,1802 Chandigarh 255,278 196,332 358,614 283,401 506,938 393,6973 D&N Haveli 52,515 51,161 70,953 67,524 121,666 98,8244 Daman & Diu 38,298 40,683 51,595 49,991 92,512 65,6925 Delhi 3,440,081 2,780,325 5,155,512 4,265,132 7,607,234 6,243,2736 Lakshadweep 20,377 19,872 26,618 25,089 31,131 29,5197 Pondicherry 304,561 299,910 408,081 399,704 486,961 487,384
353,374,460 329,954,637 439,358,440 407,062,599 532,223,090 496,514,346
Source : Office of the Registrar General, India
1 - :
All India+ & 1
India and Manipur figures include estimated figures for those of the three sub-divisions viz. Mao Maram,Paomata and Purul of Senapati district of Manipur as population Census 2001 in these three sub-divisions werecancelled due to technical and administrative reasons.
Table 7.1.1: Population Totals - India and States
Sl. No.
1981 1991 2001
++ : The States of Uttaranchal, Jharkhand and Chhattisgarh are carved out from Uttar Pradesh,Bihar, and Madhya Pradesh respectivly, in 2001 Census. In 1991 the recasted figures for these States are given as per jurisdiction of 2001 Census.
+ : The 1991 Census was not held in Jammu & Kashmir. 1991 Census figures include interpolated Population of Jammu & Kashmir.
229

230
PO
PU
LATIO
N A
ND
PO
VE
RTY
600
800
1000
1200
Popu
latio
n in
Mill
iom
CHART 7.1: POPULATION OF INDIA
PO
PU
LATIO
N IN
MILLIO
N
0
200
400
600
1981 1991 2001
Popu
latio
n in
Mill
iom
Male Female Total
PO
PU
LATIO
N IN
MILLIO
N
YEAR

POPULATION AND POVERTY
Year OverallFemale Male Rural Urban
1 2 3 4 5 6 7
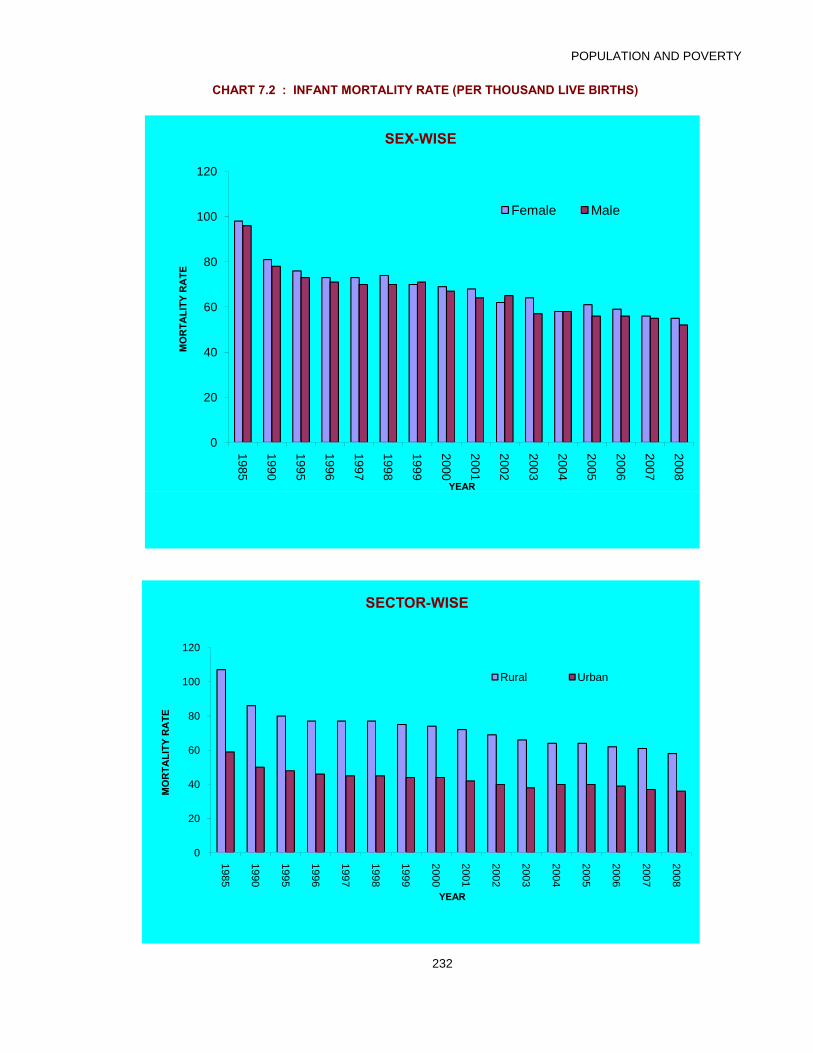
1 1985 98 96 107 59 97
6 1990 81 78 86 50 80
11 1995* 76 73 80 48 74
12 1996* 73 71 77 46 72
13 1997* 72 70 77 45 71
14 1998* 74 70 77 45 72
15 1999 70 71 75 44 70
16 2000 69 67 74 44 68
17 2001 68 64 72 42 66
18 2002** 62 62 69 40 63
19 2003* 64 57 66 38 60
20 2004 58 58 64 40 58
21 2005 61 56 64 40 58
TABLE 7.1.2 : INFANT MORTALITY RATE
(Per Thousand Live Births)Sl. No.
Sex Sector
22 2006 59 56 62 39 57
23 2007 56 55 61 37 55
24 2008 55 52 58 36 53
Source : Office of the Registrar General, India, Sample Registration System * : Excludes Jammu and Kashmir due to non-receipt of returns. * : Excludes Nagaland (Rural) due to part-receipt of returns.
231
POPULATION AND POVERTY
CHART 7.2 : INFANT MORTALITY RATE (PER THOUSAND LIVE BIRTHS)
0
20
40
60
80
100
120
1985
1990
1995
1996
1997
1998
1999
2000
2001
2002
2003
2004
2005
2006
2007
2008
MO
RTA
LITY
RA
TE
YEAR
SEX-WISE
Female Male
232
YEAR
0
20
40
60
80
100
120
1985
1990
1995
1996
1997
1998
1999
2000
2001
2002
2003
2004
2005
2006
2007
2008
MO
RTA
LITY
RA
TE
YEAR
SECTOR-WISE
Rural Urban

POPULATION AND POVERTY
(In Years)Sl. No. Year Female Male Combined
1 2 3 4 51 1901-11 23.3 22.6 22.92 1911-21 20.9 19.4 20.13 1921-31 26.6 26.9 26.84 1931-41 31.4 32.1 31.85 1941-51 31.7 32.4 32.16 1951-61 40.6 41.9 41.37 1961-71 44.7 46.4 45.68 1970-75 49.0 50.5 49.79 1976-80 52.1 52.5 52.3
10 1981-85 55.7 55.4 55.511 1986-90 58.1 57.7 57.712 1987-91* 58.6 58.1 58.313 1988-92* 59.0 58.6 58.714 1989-93* 59.7 59.0 59.415 1990-94* 60.4 59.4 60.016 1991-95* 60.9 59.7 60.317 1992-96* 61.4 60.1 60.718 1993-97* 61.8 60.4 61.119 1994-98 62.2 60.6 61.420 1995-99 62.5 60.8 61.721 1996-00 62.7 61.0 61.922 1997-01 63.0 61.3 62.223 1998-02 63.3 61.6 62.5
Table 7.1.3 : EXPECTATION OF LIFE AT BIRTH
23 1998-02 63.3 61.6 62.524 1999-03 63.5 61.8 62.725 2000-04 63.7 62.1 63.026 2001-05 63.3 63.9 63.626 2002-06 62.6 64.2 63.4
Source : Office of the Registrar General, India, SRS based Abridge life tablesNotes : Figures for 1901-11 to 1961-71 are based on Census Actuarial Reports and for 1970-75 onwards on the basis of estimate from Sample Registration System * : Excludes Jammu and Kashmir
54565860626466
Expe
ctat
ion
of L
ife
Year
Chart 7.3: Expectation of Life at Birth
Female
Male
233

POPULATION AND POVERTY
Sl. No. States/Union Territories 1973-74 1977-78 1983 1987-88 1993-94 1999-2000 2004-05
(URP)*2004-05 (MRP)*
1 2 3 4 5 6 7 8 9 10
States1 Andhra Pradesh 48.41 38.11 26.53 20.92 15.92 11.05 11.20 7.502 Arunachal Pradesh 52.67 59.82 42.60 39.35 45.01 40.04 22.30 17.003 Assam 52.67 59.82 42.60 39.35 45.01 40.04 22.30 17.004 Bihar 62.99 63.25 64.37 52.63 58.21 44.30 42.10 32.905 Chattisgarh - - - - - - 40.80 31.206 Goa 46.85 37.64 14.81 17.64 5.34 1.35 5.40 1.907 Gujarat 46.35 41.76 29.80 28.67 22.18 13.17 19.10 13.908 Haryana 34.23 27.73 20.56 16.22 28.02 8.27 13.60 9.209 Himachal Pradesh 27.42 33.49 17.00 16.28 30.34 7.94 10.70 7.20
10 Jammu & Kashmir 45.51 42.86 26.04 25.70 30.34 3.97 4.60 2.7011 Jharkhand - - - - - - 46.30 40.2012 Karnataka 55.14 48.18 36.33 32.82 29.88 17.38 20.80 12.0013 Kerala 59.19 51.48 39.03 29.10 25.76 9.38 13.20 9.6014 Madhya Pradesh 62.66 62.52 48.90 41.92 40.64 37.06 36.90 29.8015 Maharashtra 57.71 63.97 45.23 40.78 37.93 23.72 29.60 22.2016 Manipur 52.67 59.82 42.60 39.35 45.01 40.04 22.30 17.0017 Meghalaya 52.67 59.82 42.60 39.35 45.01 40.04 22.30 17.0018 Mizoram 52.67 59.82 42.60 39.35 45.01 40.04 22.30 17.0019 Nagaland 52.67 59.82 42.60 39.35 45.01 40.04 22.30 17.0020 Orissa 67.28 72.38 67.53 57.64 49.72 48.01 46.80 39.8021 Punjab 28.21 16.37 13.20 12.60 11.95 6.35 9.10 5.9022 Rajasthan 44.76 35.89 33.50 33.21 26.46 13.74 18.70 14.3023 Sikkim 52.67 59.82 42.60 39.35 45.01 40.04 22.30 17.0024 Tamil Nadu 57.43 57.68 53.99 45.80 32.48 20.55 22.80 16.9025 Tripura 52.67 59.82 42.60 39.35 45.01 40.04 22.30 17.0026 Uttar Pradesh 56.53 47.60 46.45 41.10 42.28 31.22 33.40 25.3027 Uttarkhand - - - - - - 40.80 31.7028 West Bengal 73.16 68.34 63.05 48.30 40.80 31.85 28.60 24.20
TABLE 7.1.4 (a): STATE-WISE PERCENTAGE OF POPULATION BELOW THE POVERTY LINE -RURAL (1973-74 to 2004-05)
(in % of person)
Union Territories1 Andman& Nicobar Islands 57.43 57.68 53.99 45.80 32.48 20.55 22.90 16.902 Chandigarh 27.96 27.32 23.79 14.67 11.35 5.75 7.10 3.803 Dadra & Nagar Haveli 46.85 37.64 14.81 67.11 51.95 17.57 39.80 36.004 Daman & Diu NA NA NA NA 5.34 1.35 5.40 1.905 Delhi 24.44 30.19 7.66 1.29 1.90 0.40 6.90 0.106 Lakshadweep 59.19 51.48 39.03 29.10 25.76 9.38 13.30 9.607 Pondicherry 57.43 57.68 53.99 45.80 32.48 20.55 22.90 16.90
56.44 53.07 45.65 39.09 37.27 27.09 28.30 21.80 * URP- Unifrom Reference Period : MRP- Mixed Reference PeriodSource : Planning Commission & NSSO Data, 61st RoundNotes : 1. Poverty Ratio of Assam is used for Sikkim, Arunachal Pradesh, Meghalaya, Mizoram, Manipur, Nagaland, and Tripura. 2. Poverty Line of Maharashtra and expenditure distribution of Goa is used to estimate Poverty Ratio of Goa. 3. Poverty Line of Himachal Pradesh and expenditure distribution of Jammu & Kashmir is used to estimate poverty ratio of Jammu & Kashmir. 4. Poverty Ratio of Tamilnadu is used for Pondicherry and A & N Islands. 5. Urban Poverty Ratio of Punjab used for both rural and urban Poverty of Chandigarh. 6 . Poverty Line of Maharashtra and expenditure distribution of Dadra & Nagar Haveli is used to estimate Poverty Ratio of Dadra & Nagar Haveli. 7. Poverty Ratio of Goa is used for Daman & Diu. 8. Poverty ratio of Kerala is used for Lakshadweep. 9. Urban poverty ratio of Rajasthan may be treated as tentative.
234
All India

POPULATION AND POVERTY
Sl. No. States 1973-74 1977-78 1983 1987-88 1993-94 1999-2000 2004-05
(URP)*2004-05 (MRP)*
1 2 3 4 5 6 7 8 9 10
States1 Andhra Pradesh 50.61 43.55 36.30 40.11 38.33 26.63 28.00 20.702 Arunachal Pradesh 36.92 32.71 21.73 9.94 7.73 7.47 3.30 2.403 Assam 36.92 32.71 21.73 9.94 7.73 7.47 3.30 2.404 Bihar 52.96 48.76 47.33 48.73 34.50 32.91 34.60 28.90
Chattisgarh - - - - - - 41.20 34.705 Goa 37.69 36.31 27.00 35.48 27.03 7.52 21.30 20.906 Gujarat 52.57 40.02 39.14 37.26 27.89 15.59 13.00 10.107 Haryana 40.18 36.57 24.15 17.99 16.38 9.99 15.10 11.308 Himachal Pradesh 13.17 19.44 9.43 6.29 9.18 4.63 3.40 2.609 Jammu & Kashmir 21.32 23.71 17.76 17.47 9.18 1.98 7.90 8.50
Jharkhand - - - - - - 20.20 16.3010 Karnataka 52.53 50.36 42.82 48.42 40.14 25.25 32.60 27.2011 Kerala 62.74 55.62 45.68 40.33 24.55 20.27 20.20 16.4012 Madhya Pradesh 57.65 58.66 53.06 47.09 48.38 38.44 42.10 39.3013 Maharashtra 43.87 40.09 40.26 39.78 35.15 26.81 32.20 29.0014 Manipur 36.92 32.71 21.73 9.94 7.73 7.47 3.30 2.4015 Meghalaya 36.92 32.71 21.73 9.94 7.73 7.47 3.30 2.4016 Mizoram 36.92 32.71 21.73 9.94 7.73 7.47 3.30 2.4017 Nagaland 36.92 32.71 21.73 9.94 7.73 7.47 3.30 2.4018 Orissa 55.62 50.92 49.15 41.63 41.64 42.83 44.30 40.3019 Punjab 27.96 27.32 23.79 14.67 11.35 5.75 7.10 3.8020 Rajasthan 52.13 43.53 37.94 41.92 30.49 19.85 32.90 28.1021 Sikkim 36.92 32.71 21.73 9.94 7.73 7.47 3.30 2.4022 Tamil Nadu 49.40 48.69 46.96 38.64 39.77 22.11 22.20 18.8023 Tripura 36.92 32.71 21.73 9.94 7.73 7.47 3.30 2.4024 Uttar Pradesh 60.09 56.23 49.82 42.96 35.39 30.89 30.60 26.30
Uttarkhand - - - - - - 36.50 32.0025 West Bengal 34.67 38.20 32.32 35.08 22.41 14.86 14.80 11.20
TABLE 7.1.4 (b) : STATE-WISE PERCENTAGE OF POPULATION BELOW THE POVERTY LINE- URBAN (1973-74 to 2004-05)
(in % of person)
Union Territories1 Andman& Nicobar Islands 49.40 48.69 46.96 38.64 39.77 22.11 22.20 18.802 Chandigarh 27.96 27.32 23.79 14.67 11.35 5.75 7.10 3.803 Dadra & Nagar Haveli 37.69 36.31 27.00 - 39.93 13.52 19.10 19.204 Daman & Diu NA NA NA NA 27.03 7.52 21.20 20.805 Delhi 52.23 33.51 27.89 13.56 16.03 9.42 15.20 10.806 Lakshadweep 62.74 55.62 45.68 40.33 24.55 20.27 20.20 16.407 Pondicherry 49.40 48.69 46.96 38.64 39.77 22.11 22.20 18.80
49.01 45.24 40.79 38.20 32.36 23.62 25.70 21.70 * URP- Unifrom Reference Period : MRP - Mixed Reference PeriodSource : Planning Commission & NSSO Data, 61st RoundNotes : 1. Poverty Ratio of Assam is used for Sikkim, Arunachal Pradesh, Meghalaya, Mizoram, Manipur, Nagaland, and Tripura. 2. Poverty Line of Maharashtra and expenditure distribution of Goa is used to estimate Poverty Ratio of Goa. 3. Poverty Line of Himachal Pradesh and expenditure distribution of Jammu & Kashmir is used to estimate poverty ratio of Jammu & Kashmir. 4. Poverty Ratio of Tamilnadu is used for Pondicherry and A & N Islands. 5. Urban Poverty Ratio of Punjab used for both rural and urban Poverty of Chandigarh. 6 . Poverty Line of Maharashtra and expenditure distribution of Dadra & Nagar Haveli is used to estimate Poverty Ratio of Dadra & Nagar Haveli. 7. Poverty Ratio of Goa is used for Daman & Diu. 8. Poverty ratio of Kerala is used for Lakshadweep. 9. Urban poverty ratio of Rajasthan may be treated as tentative.
235
All India

POPULATION AND POVERTY
Sl. No. States 1973-74 1977-78 1983 1987-88 1993-94 1999-2000 2004-05
(URP)*2004-05 (MRP)*
1 2 3 4 5 6 7 8 9 10
States1 Andhra Pradesh 48.86 39.31 28.91 25.86 22.19 15.77 15.80 11.102 Arunachal Pradesh 51.93 58.32 40.88 36.22 39.35 33.47 17.60 13.403 Assam 51.21 57.15 40.47 36.21 40.86 36.09 19.70 15.004 Bihar 61.91 61.55 62.22 52.13 54.96 42.60 41.40 32.505 Chattisgarh - - - - - - 40.90 32.006 Goa 44.26 37.23 18.90 24.52 14.92 4.40 14.70 10.207 Gujarat 48.15 41.23 32.79 31.54 24.21 14.07 13.80 12.008 Haryana 35.36 29.55 21.37 16.64 25.05 8.74 16.80 12.509 Himachal Pradesh 26.39 32.45 16.40 15.45 28.44 7.63 14.00 9.90
10 Jammu & Kashmir 40.83 38.97 24.24 23.82 25.17 3.48 10.00 6.7011 Jharkhand - - - - - - 5.40 4.2012 Karnataka 54.47 48.78 38.24 37.53 33.16 20.04 40.30 34.8013 Kerala 59.79 52.22 40.42 31.79 25.43 12.72 25.00 17.4014 Madhya Pradesh 61.78 61.78 49.78 43.07 42.52 37.43 15.00 11.4015 Maharashtra 53.24 55.88 43.44 40.41 36.86 25.02 38.30 32.4016 Manipur 49.96 53.72 37.02 31.35 33.78 28.54 30.70 25.2017 Meghalaya 50.20 55.19 38.81 33.92 37.92 33.87 17.30 13.2018 Mizoram 50.32 54.38 36.00 27.52 25.66 19.47 18.50 14.1019 Nagaland 50.81 56.04 39.25 34.43 37.92 32.67 12.60 9.5020 Orissa 66.18 70.07 65.29 55.58 48.56 47.15 19.00 14.5021 Punjab 28.15 19.27 16.18 13.20 11.77 6.16 46.40 39.9022 Rajasthan 46.14 37.42 34.46 35.15 27.41 15.28 8.40 5.2023 Sikkim 50.86 55.89 39.71 36.06 41.43 36.55 22.10 17.5024 Tamil Nadu 54.94 54.79 51.66 43.39 35.03 21.12 20.10 15.2025 Tripura 51.00 56.88 40.03 35.23 39.01 34.44 22.50 17.8026 Uttar Pradesh 57.07 49.05 47.07 41.46 40.85 31.15 18.90 14.4027 Uttarkhand - - - - - - 32.80 25.5028 West Bengal 63.43 60.52 54.85 44.72 35.66 27.02 39.60 31.80
TABLE 7.1.4 (c): STATE-WISE PERCENTAGE OF POPULATION BELOW THE POVERTY LINE -(RURAL+ URBAN) (1973-74 to 2004-05)
(in % of person)
Union Territories1 Andman& Nicobar Islands 55.56 55.42 52.13 43.89 34.47 20.99 24.70 20.602 Chandigarh 27.96 27.32 23.79 14.67 11.35 5.75 22.60 17.603 Dadra & Nagar Haveli 46.55 37.20 15.67 67.11 50.84 17.14 7.10 3.804 Daman & Diu NA NA NA NA 15.80 4.44 33.20 30.605 Delhi 49.61 33.23 26.22 12.41 14.69 8.23 10.50 8.006 Lakshadweep 59.68 52.79 42.36 34.95 25.04 15.60 16.00 12.307 Pondicherry 53.82 53.25 50.06 41.46 37.40 21.67 22.40 18.20
54.88 51.32 44.48 38.86 35.97 26.10 27.50 21.80 * URP- Unifrom Reference Period : MRP - Mixed Reference PeriodSource : Planning Commission & NSSO Data, 61st RoundNotes : 1. Poverty Ratio of Assam is used for Sikkim, Arunachal Pradesh, Meghalaya, Mizoram, Manipur, Nagaland, and Tripura. 2. Poverty Line of Maharashtra and expenditure distribution of Goa is used to estimate Poverty Ratio of Goa. 3. Poverty Line of Himachal Pradesh and expenditure distribution of Jammu & Kashmir is used to estimate poverty ratio of Jammu & Kashmir. 4. Poverty Ratio of Tamilnadu is used for Pondicherry and A & N Islands. 5. Urban Poverty Ratio of Punjab used for both rural and urban Poverty of Chandigarh. 6 . Poverty Line of Maharashtra and expenditure distribution of Dadra & Nagar Haveli is used to estimate Poverty Ratio of Dadra & Nagar Haveli. 7. Poverty Ratio of Goa is used for Daman & Diu. 8. Poverty ratio of Kerala is used for Lakshadweep. 9. Urban poverty ratio of Rajasthan may be treated as tentative.
236
All India

POPULATION AND POVERTY
10
20
30
40
50
60
% o
f Pop
ulat
ion
Chart 7.4 : Percentage of Population Below Poverty Line
Rural
Urban
Combined
237
0
1973
-74
1977
-78
1983
1987
-88
1993
-94
1999
-00
2004
-05
Year

HOUSING, SLUMS AND BASIC FACILITIES
TABLE 7.2.1 : URBAN-RURAL BREAKUP OF TOTAL POPULATION, NUMBER OF HOUSEHOLDS, HOUSES AND AVERAGE SIZE OF HOUSEHOLDS,
Sl. No.
Year Total Population No. of Households
No. of Houses Av. Size of Households
Av. No of Household Per House
Av. No. of Persons Per
House
1 2 3 4 5 6 7 8
1 1981*
Total 665,287,849 119,772,545 121782109** 5.6 1.0 5.5
Urban 157,680,171 28,905,949 29,897,491 5.5 1.0 5.3
Rural 507,607,678 90,866,596 91,884,618 5.6 1.0 5.5
2 1991+
Total 838,583,988 152,009,467 159425666** 5.5 1.0 5.3
Urban 215,771,612 40,418,141 43,518,317 5.3 0.9 5.0
Rural 622,812,376 111,591,326 115,907,349 5.6 1.0 5.4
3 2001++
Total 1,028,610,328 193,579,954 202973364# 5.3 1.0 5.1
Urban 286,119,689 55,832,570 58,514,738 5.1 1.0 4.9
Rural 742,490,639 137,747,384 144,458,626 5.4 1.0 5.1
Source : Office of Registrar General of India * : Excluding Assam + : Excluding J & K ** : No. of Occupied residential houses + No. of Census houses vacant at the time of house listing.++
# The occupied residential houses and vacant houses are based on Census 2001 Houselisting data.
India figures are final and exclude those of the three sub-divisions viz. Mao Maram, Paomata and Purul of Senapati district of Manipur as population Census 2001 in these three sub-divisions were cancelled due to technical and administrative reasons although a population census was carried out in these sub-divisions as per schedule.
AVERAGE NO. O F HOUSEHOLDS AND PERSONS PER HOUSE
238

HOUSING, SLUMS AND BASIC FACILITIES
VACANT HOUSES WITH RURA/ URBAN BREAK UP
Total Male FemaleTotal # Occupied
residentialVacant
1 2 3 4 5 6 7 8 9 10
1 1981*
Total Total 119,772,545 665,287,849 343,930,423 321,357,426 121,782,109 113,735,542 8,046,567
Institutional 247,457 3,790,700 3,116,289 674,411
Urban Total 28,905,949 157,680,171 83,876,403 73,803,768 29,897,491 27,604,947 2,292,544
Institutional 143,015 2,377,559 1,956,711 420,848
Rural Total 90,866,596 507,607,678 260,054,020 247,553,658 91,884,618 86,130,595 5,754,023
Institutional 104,442 1,413,141 1,159,578 253,563
2 1991+
Total Total 152,009,467 838,583,988 435,216,358 403,367,630 159,425,666 147,013,766 12,411,900
Institutional 244,881 4,252,976 3,351,584 901,392
Urban Total 40,418,141 215,771,612 113,936,953 101,834,659 43,518,317 39,073,337 4,444,980
Institutional 140,702 2,406,841 1,893,949 512,892
Rural Total 111,591,326 622,812,376 321,279,405 301,532,971 115,907,349 107,940,429 7,966,920
Institutional 104,179 1,846,135 1,457,635 388,500
3 2001++
Total Total 193,579,954 1,028,610,328 532,156,772 496,453,556 202,973,364 187,162,172 15,811,192
Institutional 460,717 7,802,866 5,460,238 2,342,628
Urban Total 55,832,570 286,119,689 150,554,098 135,565,591 58,514,738 52,062,718 6,452,020
Institutional 208,470 3,758,714 2,717,220 1,041,494
Rural Total 137,747,384 742,490,639 381,602,674 360,887,965 144,458,626 135,099,454 9,359,172
Institutional 252,247 4,044,152 2,743,018 1,301,134
Source : Office of Registrar General of IndiaNote : # : No. of census houses (occupied residential + vacant) * : Excluding Assam + : Excluding Jammu & Kashmir++ India figures are final and exclude those of the three sub-divisions viz. Mao Maram, Paomata and Purul of Senapati
district of Manipur as population Census 2001 in these three sub-divisions were cancelled due to technical and administrative reasons although a population census was carried out in these sub-divisions as per schedule.
TABLE 7.2.2 : NUMBER OF HOUSEHOLDS, POPULATION AND OCCUPIED RESIDENTIAL AND
Number of Households Population
No. of Houses at the time of Houselisting
Sl. No.
Total/ Urban/ Rural
239

HOUSAING , SLUMS AND BASIC FACILITIES
No. of Households One Room Two Room Three Rooms Four Room Five or More No exclusive Un-specified
Rooms room rooms1 2 3 4 5 6 7 8 9
1981*Total 118,614,803 53,046,175 33,948,809 14,496,724 7,482,461 6,852,624 769,506 2,018,504Rate 100.00 44.70 28.60 12.20 6.30 5.80 0.65 1.70Urban 28,541,877 13,072,617 7,947,026 3,484,741 1,804,721 1,626,979 149,001 456,792Rate 100.00 45.80 27.80 12.30 6.30 5.70 0.52 1.60Rural 90,072,926 39,973,558 26,001,783 11,011,983 5,677,740 5,225,645 620,505 1,561,712Rate 100.00 44.40 28.90 12.20 6.30 5.80 0.69 1.73
1991+Total 151,032,898 61,154,743 46,180,064 20,910,465 10,791,101 10,608,294 43,538 1,344,693
240 Rate 100.00 40.50 30.60 13.80 7.20 7.00 0.03 0.89Urban 39,493,450 15,620,078 11,992,915 5,852,191 3,070,829 2,751,947 16,578 188,912Rate 100.00 39.50 30.40 14.80 7.80 7.00 0.04 0.48Rural 111,539,448 45,534,665 34,187,149 15,058,274 7,720,272 7,856,347 26,960 1,155,781Rate 100.00 40.80 30.70 13.50 6.90 7.00 0.02 1.04
2001Total 191,963,935 73,856,117 57,571,314 27,541,899 14,361,957 12,660,232 5,972,416 -Rate 100.00 38.47 29.99 14.35 7.48 6.60 3.11Urban 53,692,376 18,852,794 15,857,448 9,176,931 4,656,850 3,900,405 1,247,948 -Rate 100.00 35.11 29.53 17.09 8.67 7.26 2.32Rural 138,271,559 55,003,323 41,713,866 18,364,968 9,705,107 8,759,827 4,724,468 -Rate 100.00 39.78 30.17 13.28 7.02 6.34 3.42
Source: Office of the Registrar General of India
+ : Excluding J& K ,Excluding houseless and Institutional Households
Distribution of Households according to number of dwelling rooms
TABLE 7.2.3 : HOUSEHOLD BY NUMBER OF DWELLING ROOMS
* : Excuding Assam Excluding houseless and Institutional Households

HOUSING , SLUMS AND BASIC FACILITIES
Sl.No. Name of the city Sewage generation (in MLD)
Sewage Treatment Capacity (in MLD)
Percent of treatment capacity
1 Hyderabad 426.21 593 1002 Vishakhapatnam 134.99 - -3 Vijayawada 128.39 - -4 Patna 279.14 105 375 Delhi 3800.00 2330 616 Ahmadabad 472.00 488 967 Surat 432.00 202 468 Rajkot 108.80 44.5 409 Vadodara 180.00 206 10010 Bangalore 771.75 - -11 Indore 204.00 78 3812 Bhopal 334.75 22 613 Jabalpur 143.34 - -14 Mumbai 2671.00 2130 8015 Pune 474.00 305 6416 Nagpur 380.00 100 2617 Nasik 227.84 107.5 4718 Ludhiana 235.20 311 10019 Amritsar 192.00 - -20 Jaipur 451.71 54 1121 Chennai 158.00 264 10022 Kanpur 417.35 171 4123 Lucknow 363.81 42 1124 Agra 260.36 88 3325 Kolkata 705.86 172 2426 Faridabad 164.00 65 3927 Jamshedpur 199.43 - -28 Asansol 147.00 - -29 Coimbatore 120.00 - -30 Madurai 97.93 - -31 Meerut 177.05 - -32 Varanasi 230.17 102 4433 Allahabad 176.00 60 3434 Kochi 188.40 - -35 Dhanbad 192.00 - -
Total 15644.48 8040 51
Note: Information relataed to Sewage Generation and Treatment Capacities of Metropolitan Cities.● Status of Municipal Wastewater Generation and treatment capacity of Metro Politian Cities.●
●
● Next ot Delhi, Mumbai has the capacity of 2130 MLD, which is 26% of total capacity in metropolitan cities.● Delhi and Mumbai therefore in combination have 55% of treatment capacity of the metropolitan cities.●
● Cities like Delhi, Dhanbad have more than 50% capacity, rest of the cities have the capacity less than 50%
Some cities such as Hydrerabad, Vadodara, Chennai and Ludhiana and Ahmadabad treatment capacity meets the volume of generation.
TABLE7.2.4 (a) : STATUS OF SEWAGE GENERATION AND TREATMENT CAPACITY IN METROPOLITAN CITIES
Source: Central Pollution Control Board.
There are 35 metropolitan cities (more than 10 Lac populaiton), 15,644 Millions Liter Per Day (MLD) of sewage is generated from these metro Politian cities. The treatment capacity exists for 8040 MLD i.e. 51% is treatment capacity is created.Among the Metropolitan cites, Delhi has the maximum treatment capacity that is 2330 MLD (30% of the total treatment capacity of metropolitan cities)
241

HOUSING, SLUMS AN\D BASIC FACILITIES
Sl.No. State/Union Territory No. of Cities Population (in Year 2008)
Sewage Generation (in MLD)
Sewage Treatment Capacity (in MLD)
1 Andaman & Nicobar 1 107200 12.9 -2 Andhra Pradesh 47 20143050 1760.6 6543 Assam 5 1417820 380.7 -4 Bihar 23 5783554 1009.7 135.55 Chandigarh 1 994820 429.76 164.796 Chhattisgarh 7 2515100 350 697 Delhi 1 14858800 3800 23308 Gujarat 28 14678240 1680.92 782.59 Haryana 20 5494110 626.69 31210 Himachal Pradesh 1 163490 28.94 35.6311 Jammu & Kashmir 2 1910060 213.93 -12 Jharkhand 14 4964171 830.47 -13 Karnataka 33 15102373 1790.4 43.4414 Kerala 8 3778516 575.17 -15 Madhya Pradesh 25 10795000 1248.72 186.116 Maharashtra 50 40255170 9986.29 4225.2517 Manipur 1 249870 26.74 -18 Meghalaya 1 186030 20.84 -19 Mizoram 1 282550 31.65 -20 Nagaland 1 171810 19.24 -21 Orissa 12 3335930 660.73 5322 Puducherry 2 504130 56.46 -23 Punjab 19 6329860 1545.3 41124 Rajasthan 24 9611490 1382.37 5425 Tamilnadu 42 16852940 1077.21 333.4226 Tripura 1 214327 24 -27 Uttar Pradesh 61 25762280 3506.016 1240.1328 Uttarakhand 6 1249380 176.97 1829 West Bengal 60 19818471 2345.21 505.92
Total 497 142961474 35559.23 11553.68
1 Questionnaire survey on 20072 Status of sewage treatment in India (CUPS/61/2005-06), Central Pollution Control Board.
•
••
••••
•
93% of total wastewater is generated in Class-I cities only.Total Sewage treatment Capacity of class-I cities is reported 11553.68 MLD, which is 32% of the sewage generation.Out of 11553.69 MLD sewage treatment capacity, 8040 MLD is treated in 35 Metropolitan cities i.e. 69%. This indicates that other than metropolitan cities, the capacity of 462 Class-I cities is only 31%.Actual sewage treatment due to inadequacy of the sewerage system shall be low compare to capacity.
TABLE 7.2.4 ( b) : STATE-WISE SEWAGE GENERATION OF CLASS-I CITIES
Source:
Note : Data not availableStatus of Municipal Wastewater Generation and treatment capacity of Class-I Cities.
There are projected 497 Class-I Cities (having more than 1 Lac Population) with respect to 2001 census (426 Cities as per 2001 Census).The Population of Class-I Cities is projected 14.29 Crore.Nearly 52% cities (260 out of 497) cities are located in Andhra Pradesh, Maharashtra,Tamilnadu, Uttar Pradesh and West Bengal.The sewage generated in class-I cities estimated 35559.23 MLD.
242

HOUSING,SLUMS AND BASIC FACILITIES
Sl.No. State/Union Territory Population in Year 2008
No of Class -II Towns
Sewage generation of
Class-II Towns (in MLD)
Sewage Treatment
capacity (in MLD)
1 Andhra Pradesh 3448610 52 217.59 10.422 Assam 573290 8 6.46 -3 Bihar 1113800 14 107.42 2.004 Chhattisgarh 566080 7 40.825 Goa 295180 3 23.62 18.186 Gujarat 2180590 31 227.55 -7 Haryana 544040 7 43.52 -8 Jammu & Kashmir 244990 4 27.86 -9 Jharkhand 826300 10 78.21 -10 Karnataka 1800258 26 233.37 12.1811 Kerala 1686660 26 231.32 -12 Madhya Pradesh 1745050 23 130.90 9.0013 Maharashtra 2503080 34 213.73 29.0014 Meghalaya 81750 1 11.25 -15 Nagaland 126520 1 1.36 -16 Orissa 904510 12 78.42 -17 Puducherry 79690 1 7.98 -18 Punjab 1109670 14 157.40 42.8019 Rajasthan 1599260 21 147.79 -20 Tamilnadu 3254950 42 184.67 29.3021 Uttar Pradesh 3382520 46 345.70 12.6122 Uttarakhand 152860 5 14.26 6.3323 West Bengal 2004440 27 180.42 61.88
Total 30224098 415 2711.62 233.70
1 Questionnaire survey on 20072 Status of sewage treatment in India (CUPS/61/2005-06), Central Pollution Control Board.
•
•
• The Total wastewater generated in class-II towns is 2711 MLD• Total sewage treatment capacity in Class-II towns is 233.7 which is 8% of the total sewage generated.
The class-II towns are mostly located in Andhra Pradesh, Maharashtra, Tamilnadu, Uttar Pradesh and Gujarat (Total 225, nearly 50%).
TABLE 7.2.4 (c) : STATE-WISE SEWAGE GENERATION OF CLASS-II TOWNS
Source:
Status of Municipal Wastewater Generation and treatment capacity of Class-II Cities.Number of cities projected are 415. (499 cities as per census 2001). The reduction is due to transformation of some Class-II cities (84 Nos) into Class -I cities.
243

HOUSING, SLUMS AND BASIC FACILITIES
Total Male Female
1 2 3 4 5 6
1 1981*Total 629929 2342954 1376512 966442Urban 209520 618843 406154 212689Rural 420409 1724111 970358 753753
2 1991+Total 522,445 2,007,489 1,180,368 827,121Urban 216,917 725,592 471,077 254,515Rural 305,528 1,281,897 709,291 572,606
3 2001Total 447,585 1,943,766 1,136,496 807,270Urban 187,810 778,599 502,344 276,255Rural 259,775 1,165,167 634,152 531,015
Source: Office of the Registrar General of India * : Excluding Assam + : Excludes Jammu & Kashmir
TABLE 7.2.5 : NUMBER OF HOMELESS HOUSEHOLDS AND POPULATION
Homeless PopulationSl. No.
Numbers of Homeless
households
244

HOUSING, SLUMS AND BASIC FACILITIES
Urban populaiton of
States/UtsPopulation of cities/towns
reporting slums1 2 3 4 5 6 7 81 Jammu & Kashmir 5 2516638 1446148 268513 10.7 18.62 Punjab 27 8262511 5660268 1159561 14.0 20.53 Chandigarh* 1 808515 808515 107125 13.2 13.24 Uttaranchal 6 2179074 1010188 195470 9.0 19.35 Haryana 22 6115304 4296670 1420407 23.2 33.16 Delhi* 16 12905780 11277586 2029755 15.7 18.07 Rajasthan 26 13214375 7668508 1294106 9.8 16.98 Uttar Pradesh 69 34539582 21256870 4395276 12.7 20.79 Bihar 23 8681800 4814512 531481 6.1 11.010 Tripura 1 545750 189998 29949 5.5 15.811 Meghalaya 1 454111 132867 86304 19.0 65.012 Assam 7 3439240 1371881 82289 2.4 6.013 West Bengal 59 22427251 15184596 4115980 18.4 27.114 Jharkhand 11 5993741 2422943 301569 5.0 12.415 Orissa 15 5517238 2838014 629999 11.4 22.216 Chhattisgarh 12 4185747 2604933 817908 19.5 31.417 Madhya Pradesh 43 15967145 9599007 2417091 15.1 25.218 Gujarat 41 18930250 12697360 1866797 9.9 14.719 Maharashtra 61 41100980 33635219 11202762 27.3 33.320 Andhra Pradesh 77 20808940 16090585 5187493 24.9 32.221 Karnataka 35 17961529 11023376 1402971 7.8 12.722 Goa 2 670577 175536 14482 2.2 8.323 Kerala 13 8266925 3196622 64556 0.8 2.024 Tamil Nadu 63 27483998 14337225 2866893 10.4 20.025 Pondicherry* 3 648619 513010 73169 11.3 14.326 A & N Island * 1 116198 99984 16244 14.0 16.2
INDIA 640 283741818 184352421 42578150 15.0 23.1Source :Slum Population -Census of India, 2001
* Union Territory
Total slum populaiton
percentagte of slum populaiton to total
Note : Himachal Pradesh, Sikkim, Arunachal Pradesh, Nagaland, Manipur, Mizoram, Daman & Diu, Dadra & Nagar Haveli and Lakshadweep have not reported any slums in 2001
TABLE 7.2.6 (a) : TOTAL URBAN POPULATION, POPULATION OF CITIES/TOWN REPORTING SLUMS AND SLUM POPULAITON IN SLUM AREA- INDIA, STATES, UNION TERRITORIES- 2001
Sl. No.
State/Uts Number of cities towns
reporting slums
Total urban populaiton of
State/Ut
Population of cities/towns
reporting slums
245

HOUSING, SLUMS AND BASIC FACILITIES
1 2 3 4 5 61 Greater Mumbai Maharashtra 11978450 6475440 54.12 Delhi* Delhi* 9879172 1851231 18.73 Kolkatta West Bengal 4572876 1485309 32.54 Chennai Tamil Nadu 4343645 819873 18.95 Bangalore Karnataka 4301326 430501 10.06 Hyderabad Andhra Pradesh 3637483 626849 17.27 Ahmadabad Gujarat 3520085 473662 13.58 Surat Gujarat 2433835 508485 20.99 Kanpur Uttar Pradesh 2551337 367980 14.410 Pune Maharashtra 2538473 492179 19.411 Jaipur Rajasthan 2322575 368570 15.912 Lucknow Uttar Pradesh 2185927 179176 8.213 Nagpur Maharashtra 2052066 737219 35.914 Indore Madhya Pradesh 1474968 260975 17.715 Bhopal Madhya Pradesh 1437354 125720 8.716 Ludhiana Punjab 1398467 314904 22.517 Patna Bihar 1366444 3592 0.318 Vadodara Gujarat 1306227 186020 14.219 Agra Uttar Pradesh 1275134 121761 9.520 Thane Maharashtra 1262551 351065 27.821 Kalyan-Dombivli Maharashtra 1193512 34860 2.922 Varanasi Uttar Pradesh 1091918 137977 12.623 Nashik Maharashtra 1077236 138797 12.924 Meerut Uttar Pradesh 1068772 471581 44.125 Faridabad Haryana 1055938 490981 46.526 Pimpri Chinchwad Maharashtra 1012472 123957 12.227 Haora West Bengal 1007532 118286 11.7
Total 73345775 17696950 24.1Source :Slum Population -Census of India, 2001
TABLE 7.2.6 (b) : TOTAL POPULATION, SLUM POPULATION IN MUNICIPAL CORPORATIONS WITH POPULATION ABOVE ONE MILLION - 2001
Sl. No.
Name of Million Plus Municipal Corporations
State/Union territory*
Total populaiton
Total slum populaiton
Percentage of slum
population to total
population
246

HOUSING, SLUMS AND BASIC FACILITIES
1 2 3 4 5 6 7 81 Jammu & Kashmir 17147 1091 6.4 0.4 5.3 2.02 Punjab 331320 NST 28.6 0.0 20.7 0.03 Chandigarh* 41869 NST 39.1 0.0 17.7 0.04 Uttaranchal 44865 362 23.0 0.2 12.0 0.75 Haryana 267975 NST 18.9 0.0 14.4 0.06 Delhi* 552784 NST 27.2 0.0 16.7 0.07 Rajasthan 349473 52763 27.0 4.1 14.8 2.98 Uttar Pradesh 898790 2495 20.4 0.1 12.5 0.09 Bihar 94523 7724 17.8 1.5 10.0 0.5
10 Tripura 7136 619 23.8 2.1 18.3 4.711 Meghalaya 720 43843 0.8 50.8 0.9 68.312 Assam 12355 211 15.0 0.3 7.9 4.513 West Bengal 567522 50810 13.8 1.2 13.1 1.214 Jharkhand 26105 50425 8.7 16.7 10.0 9.815 Orissa 108961 72763 17.3 11.5 12.7 8.116 Chhattisgarh 143533 64945 17.5 7.9 12.4 8.417 Madhya Pradesh 510034 91399 21.1 3.8 14.0 4.918 Gujarat 259986 83741 13.9 4.5 7.5 3.219 Maharashtra 1292808 284010 11.5 2.5 9.2 2.720 Andhra Pradesh 767272 130997 14.8 2.5 10.2 1.821 Karnataka 339218 64863 24.2 4.6 12.0 2.922 Goa 294 7 2.0 0.0 1.9 0.123 Kerala 4870 120 7.5 0.2 6.9 0.224 Tamil Nadu 744558 14196 26.0 0.5 12.9 0.425 Pondicherry* 18255 NST 24.9 0.0 10.7 0.026 A & N Island * NSC 24 0.0 0.1 0.0 0.9
INDIA 7402373 1017408 17.4 2.4 11.8 2.2
NSC : No notified Scheduled Castes, NST : No notified Scheduled Tribes. * Union Territory
Scheduled Caste
Scheduled Tribes
Scheduled Castes
Scheduled Tribes
Source :Slum Population -Census of India, 2001Note : In case of Himachal Pradesh, Sikkim, Arunachal Pradesh, Nagaland, Manipur, Mizoram, Daman & Diu, Dadra & Nagar Haveli and Lakshadweep no slum population has been reported at the Census of India - 2001
TABLE 7.2.6 (c) : POPULATION OF SCHEDULED CASTES AND SCHEDULED TRIBES LIVING IN SLUM AREAS AND THEIR PROPORTION TO THE TOTAL SLUM
POPULATION - STATE/UNITON TERRITORY REPORTING SLUM POPULATION-2001Sl. No State/Uts
Population in slum areasPercentage of populaiton in
slum areasPercentage of populaiton
in urban areasScheduled
Castes population
Scheduled Tribes
populaiton
247

HOUSING, SLUMS AND BASIC FACILITIES
1 2 3 3 4 5 6 7 81 Greater Mumbai Maharashtra 385626 56567 6.0 0.9 4.9 0.82 Delhi* Delhi* 483640 NST 26.1 0.0 15.8 0.03 Kolkatta West Bengal 92812 2507 6.2 0.2 6.0 0.24 Chennai Tamil Nadu 269301 1830 32.8 0.2 13.8 0.25 Bangalore Karnataka 139920 6957 32.5 1.6 11.1 1.16 Hyderabad Andhra Pradesh 89860 8875 14.3 1.4 7.4 0.97 Ahmadabad Gujarat 95633 6692 20.2 1.4 12.1 1.08 Surat Gujarat 30112 36236 5.9 7.1 3.6 3.59 Kanpur Uttar Pradesh 84255 786 22.9 0.2 11.1 0.1
10 Pune Maharashtra 125127 5264 25.4 1.1 11.8 1.011 Jaipur Rajasthan 90607 19957 24.6 5.4 12.6 3.712 Lucknow Uttar Pradesh 24943 107 13.9 0.1 10.1 0.113 Nagpur Maharashtra 151111 107936 20.5 14.6 16.7 8.914 Indore Madhya Pradesh 61244 4429 23.5 1.7 13.7 2.515 Bhopal Madhya Pradesh 36073 5794 28.7 4.6 12.4 3.016 Ludhiana Punjab 47917 NST 15.2 0.0 13.1 0.017 Patna Bihar 944 0 26.3 0.0 8.5 0.318 Vadodara Gujarat 20765 12823 11.2 6.9 6.6 3.619 Agra Uttar Pradesh 39054 22 32.1 Neg 21.5 Neg20 Thane Maharashtra 23722 10955 6.8 3.1 4.6 2.521 Kalyan-Dombivli Maharashtra 7111 323 20.4 0.9 5.8 2.122 Varanasi Uttar Pradesh 16622 0 12.0 0.0 7.2 0.023 Nashik Maharashtra 44198 16749 31.8 12.1 12.5 6.824 Meerut Uttar Pradesh 111345 25 23.6 Neg 16.3 Neg25 Faridabad Haryana 57763 NST 11.8 0.0 9.1 0.026 Pimpri Chinchwad Maharashtra 50607 2355 40.8 1.9 13.9 1.927 Haora West Bengal 9430 368 8.0 0.3 4.8 0.4
Total 2589742 307557 14.6 1.7 10.3 1.2Source :Slum Population -Census of India, 2001NST : No notified Scheduled Tribes Neg : Negligible population
Scheduled Tribes
Scheduled Caste
Scheduled Tribes
Scheduled Castes
Scheduled Tribes
TABLE 7.2.6 (D) : POPULATION AND PERCENTAGE OF SCHEDULED CASTES AND SCHEDULED TRIBES POPULAITON LIVING IN SLUMS IN MILLION PLUS CITIES -2001
Sl. No. Name of Million Plus Municipal Corporations
State/Union territory*
Slum Population Percentage of populaton in slum
Percentage of populaiton in urban
areas
Scheduled Castes
248
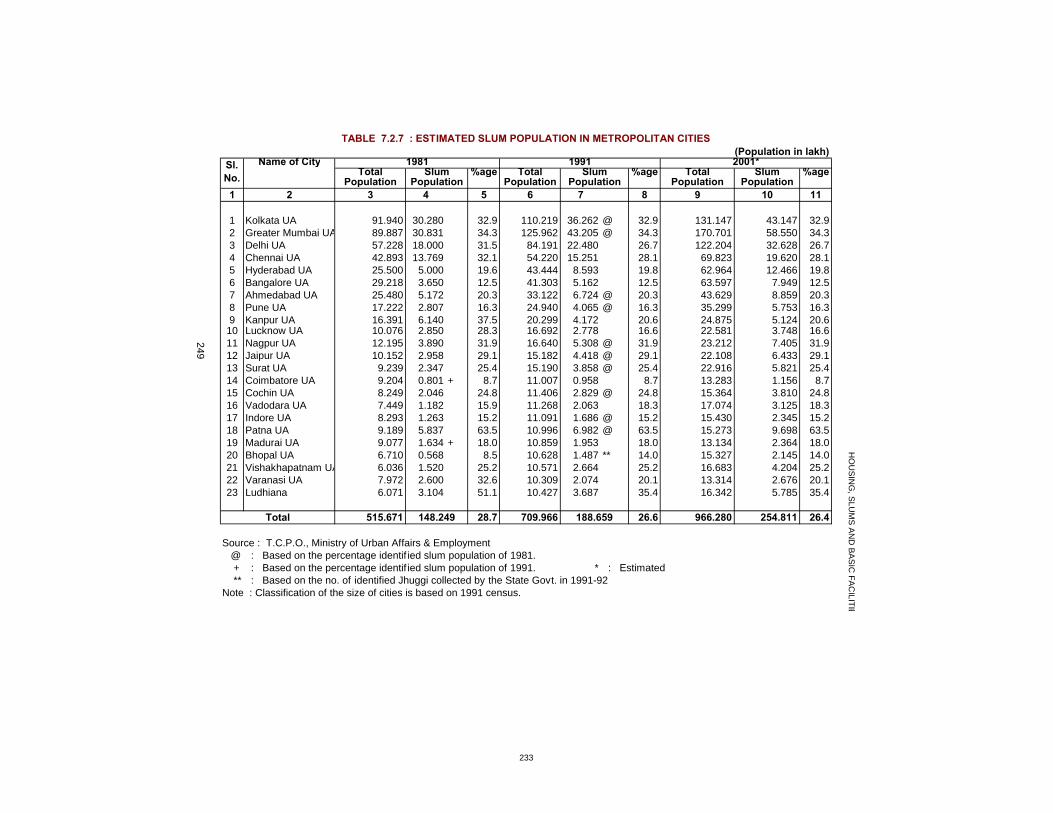
Name of CityTotal %age Total %age Total Slum %age
Population Population Population Population1 2 3 4 5 6 7 8 9 10 11
1 Kolkata UA 91.940 30.280 32.9 110.219 36.262 @ 32.9 131.147 43.147 32.92 Greater Mumbai UA 89.887 30.831 34.3 125.962 43.205 @ 34.3 170.701 58.550 34.33 Delhi UA 57.228 18.000 31.5 84.191 22.480 26.7 122.204 32.628 26.74 Chennai UA 42.893 13.769 32.1 54.220 15.251 28.1 69.823 19.620 28.15 Hyderabad UA 25.500 5.000 19.6 43.444 8.593 19.8 62.964 12.466 19.86 Bangalore UA 29.218 3.650 12.5 41.303 5.162 12.5 63.597 7.949 12.57 Ahmedabad UA 25.480 5.172 20.3 33.122 6.724 @ 20.3 43.629 8.859 20.38 Pune UA 17.222 2.807 16.3 24.940 4.065 @ 16.3 35.299 5.753 16.39 Kanpur UA 16.391 6.140 37.5 20.299 4.172 20.6 24.875 5.124 20.6
10 Lucknow UA 10.076 2.850 28.3 16.692 2.778 16.6 22.581 3.748 16.611 Nagpur UA 12.195 3.890 31.9 16.640 5.308 @ 31.9 23.212 7.405 31.912 Jaipur UA 10.152 2.958 29.1 15.182 4.418 @ 29.1 22.108 6.433 29.113 Surat UA 9.239 2.347 25.4 15.190 3.858 @ 25.4 22.916 5.821 25.414 Coimbatore UA 9.204 0.801 + 8.7 11.007 0.958 8.7 13.283 1.156 8.715 Cochin UA 8.249 2.046 24.8 11.406 2.829 @ 24.8 15.364 3.810 24.816 Vadodara UA 7.449 1.182 15.9 11.268 2.063 18.3 17.074 3.125 18.317 Indore UA 8.293 1.263 15.2 11.091 1.686 @ 15.2 15.430 2.345 15.218 Patna UA 9.189 5.837 63.5 10.996 6.982 @ 63.5 15.273 9.698 63.519 Madurai UA 9.077 1.634 + 18.0 10.859 1.953 18.0 13.134 2.364 18.020 Bhopal UA 6.710 0.568 8.5 10.628 1.487 ** 14.0 15.327 2.145 14.021 Vishakhapatnam UA 6.036 1.520 25.2 10.571 2.664 25.2 16.683 4.204 25.222 Varanasi UA 7.972 2.600 32.6 10.309 2.074 20.1 13.314 2.676 20.123 Ludhiana 6.071 3.104 51.1 10.427 3.687 35.4 16.342 5.785 35.4
515.671 28.7 709.966 26.6 966.280 254.811 26.4
Source : T.C.P.O., Ministry of Urban Affairs & Employment @ : Based on the percentage identif ied slum population of 1981. + : Based on the percentage identif ied slum population of 1991. * : Estimated ** : Based on the no. of identified Jhuggi collected by the State Govt. in 1991-92 Note : Classification of the size of cities is based on 1991 census.
TABLE 7.2.7 : ESTIMATED SLUM POPULATION IN METROPOLITAN CITIES(Population in lakh)
1981 1991 2001*Sl. No. Slum
PopulationSlum
Population
HO
US
ING
, SLU
MS
AN
D B
AS
IC FA
CILITIE
S
Total 148.249 188.659
249
233

HOUSING, SLUMS AND BASIC FACILITIES
Total Inside Outside
1 2 3 4 5 6 7 8
1 1981*Total 118,614,803 27,317,532 12,851,006 14,466,526Percentage 100.0 23.0 10.8 12.2Urban 28,541,877 18,049,114 10,302,247 7,746,867 16,596,103 11,945,774Percentage 100.0 63.2 36.1 27.1 58.1 41.9Rural 90,072,926 9,268,418 2,548,759 6,719,659Percentage 100.0 10.3 2.8 7.5
2 1991+Total 151,111,383 48,745,490 23,414,175 25,331,315 35,819,780 115,291,603Percentage 100.0 32.3 15.5 16.8 23.7 76.3Urban 39,523,184 25,713,794 16,691,096 9,022,698 25,236,449 14,286,735Percentage 100.0 65.1 42.3 22.8 63.9 36.1Rural 111,588,199 23,031,696 6,723,079 16,308,617 10,583,331 101,004,868Percentage 100.0 20.6 6.0 14.6 9.5 90.5
3 2001Total 191,963,935 70,448,827 39,966,085 30,482,742 69,885,799 122,078,136Percentage 100.0 36.7 20.8 15.9 36.4 63.6Urban 53,692,376 36,865,072 26,676,440 10,188,632 39,581,440 14,110,936Percentage 100.0 68.7 49.7 19.0 73.7 26.3Rural 138,271,559 33,583,755 13,289,645 20,294,110 30,304,359 107,967,200
Sl. No
TABLE 7.2.8 : HOUSEHOLDS CLASSIFIED BY SUPPLY OF WATER AND TOILET INSTALLATION BY RURAL AND URBAN
Toilet InstallationWithout
Toilet of Any Type
With Toilet of Any Type
Total number of Households
Households with Water Supply though Tap Water
Rural 138,271,559 33,583,755 13,289,645 20,294,110 30,304,359 107,967,200Percentage 100.0 24.3 9.6 14.7 21.9 78.1
Source : Office of the Registrar General of India * : Excluding Assam, Excluding Institutional and houseless households + : Excluding J&K
250

HOUSING,SLUMS AND BASIC FACILITIES
tap tube well/hand
pump
well tank/pond (reserved for drinking)
other tank/pon
d
river/ canal/lak
e
spring other n.r. all estimated sample
RuralJammu & Kashmir 557 187 30 3 2 59 154 8 0 1000 1087315 1150Himachal Pradesh 741 93 59 4 1 3 97 1 0 1000 1145207 1199Punjab 220 765 13 0 0 0 0 3 0 1000 3150742 1204Chandigarh 899 101 0 0 0 0 0 0 0 1000 28388 96Uttaranchal 562 307 4 11 0 12 77 27 0 1000 1191388 559Haryana 388 450 149 13 0 0 0 0 0 1000 2628646 943Delhi 913 57 4 0 26 0 0 0 0 1000 717683 95Rajasthan 251 457 176 84 20 10 1 2 0 1000 6839890 2709Uttar Pradesh 22 855 123 0 0 0 0 0 0 1000 23286557 7069Bihar 9 888 102 0 0 0 0 1 0 1000 11866728 4337Sikkim 536 1 0 0 0 3 459 1 0 1000 81980 671Arunachal Pradesh 787 24 35 0 12 15 37 88 2 1000 106411 852Nagaland 513 43 51 239 12 0 142 0 0 1000 82602 528Manipur 294 83 48 144 109 155 143 21 3 1000 255172 1094Mizoram 142 5 11 70 24 14 701 32 0 1000 72178 432Tripura 219 420 350 4 1 0 0 7 0 1000 600139 1248Meghalaya 406 45 191 73 18 2 262 2 0 1000 344447 768Assam 69 547 266 17 58 37 7 0 0 1000 4183959 2708West Bengal 125 776 89 2 0 0 7 0 1 1000 12536495 4440Chhattisgarh 18 762 200 0 0 15 4 0 0 1000 3556797 1000Orissa 46 627 258 1 3 33 21 12 0 1000 6462237 2276Jharkhand 36 378 536 0 1 37 2 10 0 1000 3838341 1548Madhya Pradesh 69 599 316 1 1 11 2 2 0 1000 8301488 2904Gujarat 582 299 96 18 0 3 2 0 0 1000 5949669 1428Daman & Diu 753 182 31 34 0 0 0 0 0 1000 23260 96D & N Haveli 148 724 50 4 5 66 0 2 0 1000 32871 144Maharashtra 485 255 226 2 1 26 0 6 0 1000 12225921 3492Andhra Pradesh 543 297 131 10 2 11 2 2 0 1000 14612748 3668Karnataka 595 267 120 5 1 10 0 2 0 1000 6809687 2107Goa 567 6 356 0 0 16 55 0 0 1000 154528 96Lakshadweep 122 1 877 0 0 0 0 0 0 1000 4430 96Kerala 108 15 838 15 3 2 19 0 0 1000 5078075 1932Tamil Nadu 769 132 65 4 0 18 5 8 0 1000 10676451 2715Pondicherry 933 49 12 0 0 0 0 6 0 1000 75647 144A & N Island 795 0 129 0 0 59 17 0 0 1000 43079 218All India 275 513 179 8 4 11 8 3 0 1000 148081155 55966
251
TABLE 7.2.9 (a) NUMBER OF HOUSEHOLDS BY MAJOR SOURCE OF DRINKING WATER PER 1000 HOUSEHOLDS ( RURAL)Distribution of household with major source of driniking water
Source : NSS Reoprt No. 489: Housing Conditions in India : Household Amenities and Other Characteristics
State/UT number of households
n.r. : not reported
HOUSING,SLUMS AND BASIC FACILITIES
tap tube well/hand
pump
well tank/pond (reserved for drinking)
other tank/pon
d
river/ canal/lak
e
spring other n.r. all estimated sample
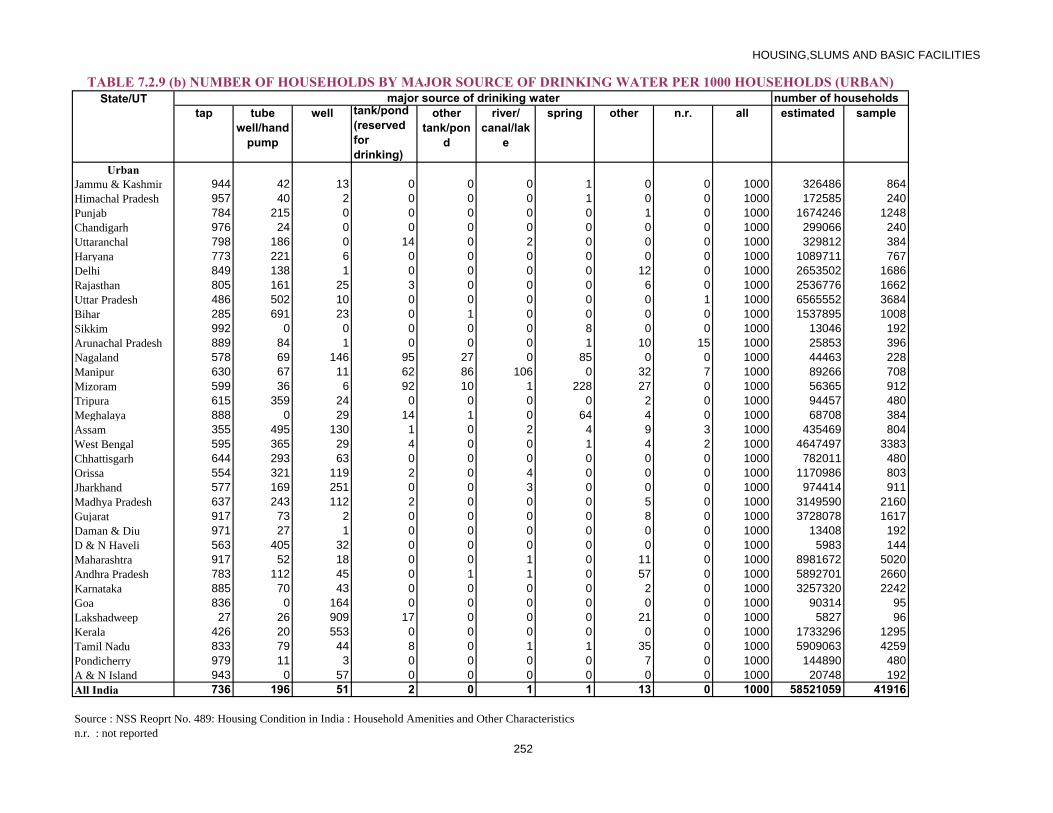
UrbanJammu & Kashmir 944 42 13 0 0 0 1 0 0 1000 326486 864Himachal Pradesh 957 40 2 0 0 0 1 0 0 1000 172585 240Punjab 784 215 0 0 0 0 0 1 0 1000 1674246 1248Chandigarh 976 24 0 0 0 0 0 0 0 1000 299066 240Uttaranchal 798 186 0 14 0 2 0 0 0 1000 329812 384Haryana 773 221 6 0 0 0 0 0 0 1000 1089711 767Delhi 849 138 1 0 0 0 0 12 0 1000 2653502 1686Rajasthan 805 161 25 3 0 0 0 6 0 1000 2536776 1662Uttar Pradesh 486 502 10 0 0 0 0 0 1 1000 6565552 3684Bihar 285 691 23 0 1 0 0 0 0 1000 1537895 1008Sikkim 992 0 0 0 0 0 8 0 0 1000 13046 192Arunachal Pradesh 889 84 1 0 0 0 1 10 15 1000 25853 396Nagaland 578 69 146 95 27 0 85 0 0 1000 44463 228Manipur 630 67 11 62 86 106 0 32 7 1000 89266 708Mizoram 599 36 6 92 10 1 228 27 0 1000 56365 912Tripura 615 359 24 0 0 0 0 2 0 1000 94457 480Meghalaya 888 0 29 14 1 0 64 4 0 1000 68708 384Assam 355 495 130 1 0 2 4 9 3 1000 435469 804West Bengal 595 365 29 4 0 0 1 4 2 1000 4647497 3383Chhattisgarh 644 293 63 0 0 0 0 0 0 1000 782011 480Orissa 554 321 119 2 0 4 0 0 0 1000 1170986 803Jharkhand 577 169 251 0 0 3 0 0 0 1000 974414 911Madhya Pradesh 637 243 112 2 0 0 0 5 0 1000 3149590 2160Gujarat 917 73 2 0 0 0 0 8 0 1000 3728078 1617Daman & Diu 971 27 1 0 0 0 0 0 0 1000 13408 192D & N Haveli 563 405 32 0 0 0 0 0 0 1000 5983 144Maharashtra 917 52 18 0 0 1 0 11 0 1000 8981672 5020Andhra Pradesh 783 112 45 0 1 1 0 57 0 1000 5892701 2660Karnataka 885 70 43 0 0 0 0 2 0 1000 3257320 2242Goa 836 0 164 0 0 0 0 0 0 1000 90314 95Lakshadweep 27 26 909 17 0 0 0 21 0 1000 5827 96Kerala 426 20 553 0 0 0 0 0 0 1000 1733296 1295Tamil Nadu 833 79 44 8 0 1 1 35 0 1000 5909063 4259Pondicherry 979 11 3 0 0 0 0 7 0 1000 144890 480A & N Island 943 0 57 0 0 0 0 0 0 1000 20748 192All India 736 196 51 2 0 1 1 13 0 1000 58521059 41916
252
State/UT major source of driniking water number of households
n.r. : not reportedSource : NSS Reoprt No. 489: Housing Condition in India : Household Amenities and Other Characteristics
TABLE 7.2.9 (b) NUMBER OF HOUSEHOLDS BY MAJOR SOURCE OF DRINKING WATER PER 1000 HOUSEHOLDS (URBAN)

HOUSING,SLUMS AND BASIC FACILITIES
tap tube well/hand
pump
well tank/pond (reserved for drinking)
other tank/ pond
river/ canal/ lake
spring other n.r. all estimated sample
Rural + UrbanJammu & Kashmir 646 154 26 2 2 46 118 6 0 1000 1413801 2014Himachal Pradesh 770 86 52 4 1 3 85 0 0 1000 1317792 1439Punjab 416 574 8 0 0 0 0 2 0 1000 4824988 2452Chandigarh 970 30 0 0 0 0 0 0 0 1000 327454 336Uttaranchal 613 281 3 12 0 10 60 21 0 1000 1521200 943Haryana 501 383 107 9 0 0 0 0 0 1000 3718357 1710Delhi 863 121 1 0 6 0 0 9 0 1000 3371185 1781Rajasthan 401 377 135 62 14 7 0 3 0 1000 9376666 4371Uttar Pradesh 124 777 98 0 0 0 0 0 0 1000 29852109 10753Bihar 41 866 93 0 0 0 0 1 0 1000 13404623 5345Sikkim 599 1 0 0 0 3 397 1 0 1000 95025 863Arunachal Pradesh 807 36 28 0 10 12 30 73 4 1000 132264 1248Nagaland 536 52 84 189 17 0 122 0 0 1000 127070 756Manipur 381 79 38 123 103 142 106 24 4 1000 344438 1802Mizoram 343 19 9 80 18 8 494 30 0 1000 128543 1344Tripura 273 411 305 3 1 0 0 6 0 1000 694596 1728Meghalaya 486 37 164 63 15 2 229 3 0 1000 413155 1152Assam 96 542 253 15 52 34 7 1 0 1000 4619428 3512West Bengal 252 665 72 2 0 0 6 1 1 1000 17183992 7823Chhattisgarh 131 678 175 0 0 13 4 0 0 1000 4338807 1480Orissa 124 580 236 1 3 28 18 10 0 1000 7633223 3079Jharkhand 145 336 478 0 1 30 2 8 0 1000 4812755 2459Madhya Pradesh 225 501 260 1 1 8 2 3 0 1000 11451077 5064Gujarat 711 212 60 11 0 2 1 3 0 1000 9677747 3045Daman & Diu 833 125 20 22 0 0 0 0 0 1000 36669 288D & N Haveli 212 675 47 4 4 56 0 1 0 1000 38854 288Maharashtra 668 169 138 1 1 15 0 8 0 1000 21207593 8512Andhra Pradesh 612 244 106 7 2 8 2 18 0 1000 20505449 6328Karnataka 689 203 95 3 1 7 0 2 0 1000 10067008 4349Goa 666 4 285 0 0 10 35 0 0 1000 244841 191Lakshadweep 68 15 895 10 0 0 0 12 0 1000 10256 192Kerala 189 16 765 11 2 2 14 0 0 1000 6811371 3227Tamil Nadu 792 113 58 5 0 12 3 17 0 1000 16585514 6974Pondicherry 963 24 6 0 0 0 0 6 0 1000 220537 624A & N Island 843 0 106 0 0 40 12 0 0 1000 63827 410All India 405 423 143 7 3 8 6 6 0 1000 206572215 97882
253n.r. : not reportedSource : NSS Reoprt No. 489: Housing Condition in India : Household Amenities and Other Characteristics
TABLE 7.2.9 (c) NUMBER OF HOUSEHOLDS BY MAJOR SOURCE OF DRINKING WATER PER 1000 HOUSEHOLDS (RURAL+ URBAN)
State/UT major source of driniking water number of households
coke, coal
firewood and chips
LPG gobar gas
dung cake
charcoal kerosene electricity other no cooking arrangement
n.r. all estimated sample
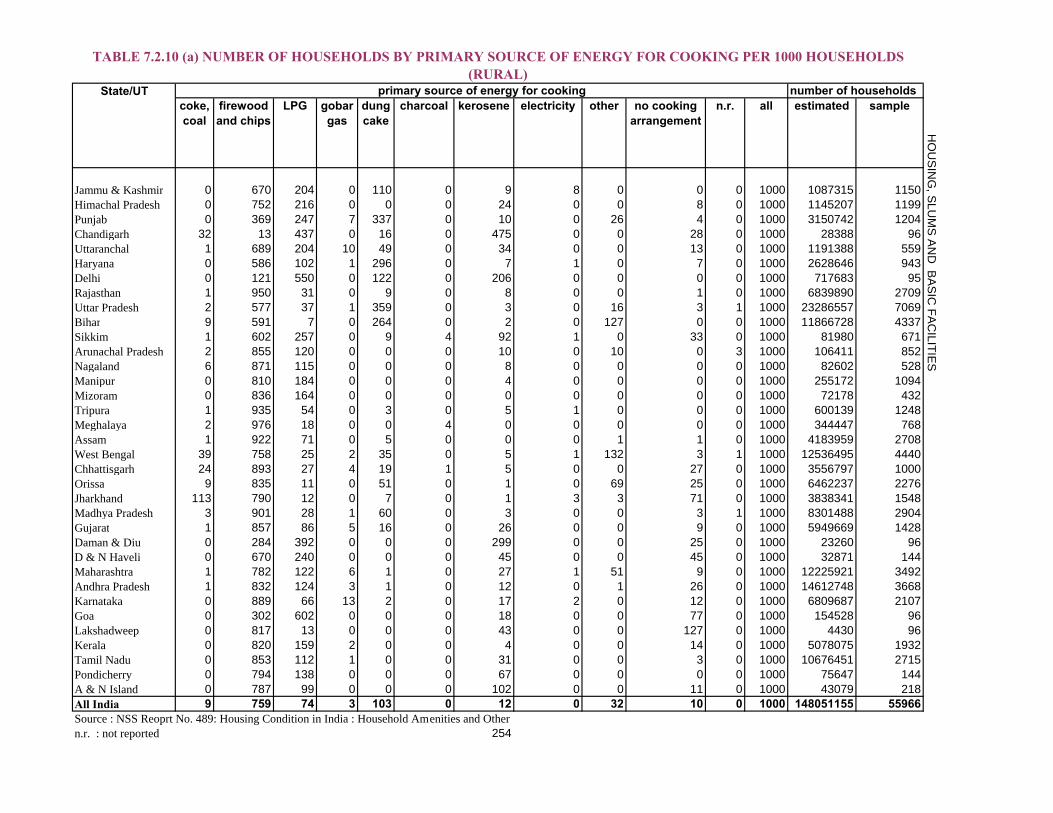
Jammu & Kashmir 0 670 204 0 110 0 9 8 0 0 0 1000 1087315 1150Himachal Pradesh 0 752 216 0 0 0 24 0 0 8 0 1000 1145207 1199Punjab 0 369 247 7 337 0 10 0 26 4 0 1000 3150742 1204Chandigarh 32 13 437 0 16 0 475 0 0 28 0 1000 28388 96Uttaranchal 1 689 204 10 49 0 34 0 0 13 0 1000 1191388 559Haryana 0 586 102 1 296 0 7 1 0 7 0 1000 2628646 943Delhi 0 121 550 0 122 0 206 0 0 0 0 1000 717683 95Rajasthan 1 950 31 0 9 0 8 0 0 1 0 1000 6839890 2709Uttar Pradesh 2 577 37 1 359 0 3 0 16 3 1 1000 23286557 7069Bihar 9 591 7 0 264 0 2 0 127 0 0 1000 11866728 4337Sikkim 1 602 257 0 9 4 92 1 0 33 0 1000 81980 671Arunachal Pradesh 2 855 120 0 0 0 10 0 10 0 3 1000 106411 852Nagaland 6 871 115 0 0 0 8 0 0 0 0 1000 82602 528Manipur 0 810 184 0 0 0 4 0 0 0 0 1000 255172 1094Mizoram 0 836 164 0 0 0 0 0 0 0 0 1000 72178 432Tripura 1 935 54 0 3 0 5 1 0 0 0 1000 600139 1248Meghalaya 2 976 18 0 0 4 0 0 0 0 0 1000 344447 768Assam 1 922 71 0 5 0 0 0 1 1 0 1000 4183959 2708West Bengal 39 758 25 2 35 0 5 1 132 3 1 1000 12536495 4440Chhattisgarh 24 893 27 4 19 1 5 0 0 27 0 1000 3556797 1000Orissa 9 835 11 0 51 0 1 0 69 25 0 1000 6462237 2276Jharkhand 113 790 12 0 7 0 1 3 3 71 0 1000 3838341 1548Madhya Pradesh 3 901 28 1 60 0 3 0 0 3 1 1000 8301488 2904Gujarat 1 857 86 5 16 0 26 0 0 9 0 1000 5949669 1428Daman & Diu 0 284 392 0 0 0 299 0 0 25 0 1000 23260 96D & N Haveli 0 670 240 0 0 0 45 0 0 45 0 1000 32871 144Maharashtra 1 782 122 6 1 0 27 1 51 9 0 1000 12225921 3492Andhra Pradesh 1 832 124 3 1 0 12 0 1 26 0 1000 14612748 3668Karnataka 0 889 66 13 2 0 17 2 0 12 0 1000 6809687 2107Goa 0 302 602 0 0 0 18 0 0 77 0 1000 154528 96Lakshadweep 0 817 13 0 0 0 43 0 0 127 0 1000 4430 96Kerala 0 820 159 2 0 0 4 0 0 14 0 1000 5078075 1932Tamil Nadu 0 853 112 1 0 0 31 0 0 3 0 1000 10676451 2715Pondicherry 0 794 138 0 0 0 67 0 0 0 0 1000 75647 144A & N Island 0 787 99 0 0 0 102 0 0 11 0 1000 43079 218All India 9 759 74 3 103 0 12 0 32 10 0 1000 148051155 55966
254Source : NSS Reoprt No. 489: Housing Condition in India : Household Amenities and Other
primary source of energy for cooking
TABLE 7.2.10 (a) NUMBER OF HOUSEHOLDS BY PRIMARY SOURCE OF ENERGY FOR COOKING PER 1000 HOUSEHOLDS (RURAL)
State/UT number of households
HO
US
ING
, SLU
MS
AN
D B
AS
IC FA
CILITIE
S
n.r. : not reported

coke, coal
firewood and chips
LPG gobar gas
dung cake
charcoal kerosene electricity other no cooking arrangement
n.r. all estimated sample
Jammu & Kashmir 0 188 673 0 19 0 109 10 0 1 0 1000 326486 864Himachal Pradesh 15 65 716 0 2 0 29 157 0 16 0 1000 172585 240Punjab 14 61 636 0 46 0 237 0 5 0 0 1000 1674246 1248Chandigarh 0 25 609 0 0 0 323 0 0 43 0 1000 299066 240Uttaranchal 0 181 701 0 9 0 103 0 0 7 0 1000 329812 384Haryana 1 133 697 4 63 0 88 0 0 15 0 1000 1089711 767Delhi 0 13 671 0 5 0 276 0 0 34 0 1000 2653502 1686Rajasthan 2 417 445 1 6 1 75 0 0 54 0 1000 2536776 1662Uttar Pradesh 10 281 550 2 77 0 62 0 1 16 1 1000 6565552 3684Bihar 118 274 376 0 85 1 58 0 22 65 1 1000 1537895 1008Sikkim 0 0 565 0 0 0 65 0 0 370 0 1000 13046 192Arunachal Pradesh 0 401 561 0 2 0 31 0 0 0 5 1000 25853 396Nagaland 0 321 619 0 0 0 53 0 0 8 0 1000 44468 228Manipur 0 377 561 1 1 0 55 0 1 0 4 1000 89266 708Mizoram 0 156 813 0 3 0 22 6 0 0 0 1000 56365 912Tripura 0 408 515 0 0 0 75 0 0 1 2 1000 94457 480Meghalaya 5 195 399 0 0 62 227 8 0 104 0 1000 68708 384Assam 5 187 698 0 4 0 70 0 0 36 0 1000 435469 804West Bengal 216 149 399 0 12 0 158 2 23 40 1 1000 4647497 3383Chhattisgarh 67 449 408 0 2 2 24 20 28 0 0 1000 782011 480Orissa 19 302 325 0 6 1 114 27 57 149 0 1000 1170986 803Jharkhand 515 61 289 0 13 0 17 8 0 97 0 1000 974414 911Madhya Pradesh 23 354 500 1 17 0 93 0 0 12 0 1000 3149590 2160Gujarat 6 120 621 0 10 2 128 1 55 58 0 1000 3728078 1617Daman & Diu 0 103 797 0 12 0 58 0 0 29 0 1000 13408 192D & N Haveli 0 33 789 0 0 0 103 0 0 76 0 1000 5983 144Maharashtra 2 110 584 0 1 0 240 0 6 57 0 1000 8981672 5020Andhra Pradesh 2 247 529 0 1 0 108 0 3 109 0 1000 5892701 2660Karnataka 4 277 453 1 1 0 176 3 0 84 0 1000 3257320 2242Goa 0 43 585 0 0 0 319 0 0 52 0 1000 90314 95Lakshadweep 0 620 314 0 0 0 46 0 0 19 0 1000 5827 96Kerala 0 455 442 6 0 0 19 2 0 76 0 1000 1733296 1295Tamil Nadu 1 240 506 0 0 1 187 1 0 63 0 1000 5909063 4259Pondicherry 0 241 547 0 0 0 114 0 0 98 0 1000 144890 480A & N Island 0 90 545 0 0 0 331 0 0 34 0 1000 20748 192All India 34 215 524 1 17 0 143 2 9 54 0 1000 58521059 41916
255
TABLE 7.2.10(b) NUMBER OF HOUSEHOLDS BY PRIMARY SOURCE OF ENERGY FOR COOKING PER 1000 HOUSEHOLDS (URBAN)
State/UT primary source of energy for cooking number of households
HO
US
ING
, SLU
MS
AN
D B
AS
IC FA
CILITIE
S
n.r. : not reportedSource : NSS Reoprt No. 489: Housing Condition in India : Household Amenities and Other

coke, coal
firewood and chips
LPG gobar gas
dung cake
charcoal kerosene electricity other no cooking arrangement
n.r. all estimated sample
Jammu & Kashmir 0 559 312 0 89 0 32 8 0 0 0 1000 1413801 2014Himachal Pradesh 2 662 281 0 1 0 24 21 0 9 0 1000 1317792 1439Punjab 5 262 382 5 236 0 89 0 19 2 0 1000 4824988 2452Chandigarh 3 24 594 0 1 0 336 0 0 42 0 1000 327454 336Uttaranchal 1 579 312 8 40 0 49 0 0 11 0 1000 1521200 943Haryana 0 453 276 2 228 0 30 1 0 10 0 1000 3718357 1710Delhi 0 36 646 0 30 0 261 0 0 27 0 1000 3371185 1781Rajasthan 1 806 143 0 9 0 26 0 0 15 0 1000 9376666 4371Uttar Pradesh 4 512 150 1 297 0 16 0 13 6 1 1000 29852109 10753Bihar 21 555 50 0 243 0 8 0 115 8 0 1000 13404623 5345Sikkim 1 520 300 0 8 3 88 1 0 79 0 1000 95025 863Arunachal Pradesh 2 766 206 0 1 0 14 0 8 0 3 1000 132264 1248Nagaland 4 678 291 0 0 0 24 0 0 3 0 1000 127070 756Manipur 0 697 282 0 0 1 17 0 0 0 1 1000 344438 1802Mizoram 0 538 448 0 1 0 9 3 0 0 0 1000 128543 1344Tripura 1 864 116 0 3 0 14 1 0 0 0 1000 694596 1728Meghalaya 3 846 82 0 0 13 38 2 0 17 0 1000 413155 1152Assam 1 853 130 0 5 0 7 0 1 4 0 1000 4619428 3512West Bengal 87 593 126 1 29 0 46 1 102 13 1 1000 17183992 7823Chhattisgarh 32 813 96 3 16 1 9 4 5 22 0 1000 4338807 1480Orissa 11 753 59 0 44 0 18 4 67 44 0 1000 7633223 3079Jharkhand 194 642 68 0 8 0 4 4 2 77 0 1000 4812755 2459Madhya Pradesh 8 751 159 1 48 0 28 0 0 5 0 1000 11451077 5064Gujarat 3 573 292 3 13 1 65 0 21 28 0 1000 9677747 3045Daman & Diu 0 218 540 0 4 0 211 0 0 26 0 1000 36669 288D & N Haveli 0 572 325 0 0 0 54 0 0 50 0 1000 38854 288Maharashtra 1 497 318 4 1 0 117 1 32 29 0 1000 21207593 8512Andhra Pradesh 1 664 240 2 1 0 39 0 1 50 0 1000 20505449 6328Karnataka 1 691 191 9 2 0 68 2 0 35 0 1000 10067008 4349Goa 0 207 596 0 0 0 129 0 0 68 0 1000 244841 191Lakshadweep 0 705 184 0 0 0 45 0 0 66 0 1000 10256 192Kerala 0 727 231 3 0 0 8 0 0 30 0 1000 6811371 3227Tamil Nadu 0 635 252 0 0 0 87 0 0 24 0 1000 16585514 6974Pondicherry 0 431 407 0 0 0 98 0 0 64 0 1000 220537 624A & N Island 0 561 244 0 0 0 176 0 0 19 0 1000 63827 410All India 16 604 201 2 78 0 49 1 25 22 0 1000 206572215 97882
256
primary source of energy for cooking number of households
HO
US
ING
, SLU
MS
AN
D B
AS
IC FA
CILITIE
S
Source : NSS Reoprt No. 489: Housing Condition in India : Household Amenities and Other n.r. : not reported
TABLE 7.2.10 (c) NUMBER OF HOUSEHOLDS BY PRIMARY SOURCE OF ENERGY FOR COOKING PER 1000 HOUSEHOLDS (RURAL + UNBAN)
State/UT
kerosene other oil gas candle electricity others no lighting arrangement
n.r. all estimated sample
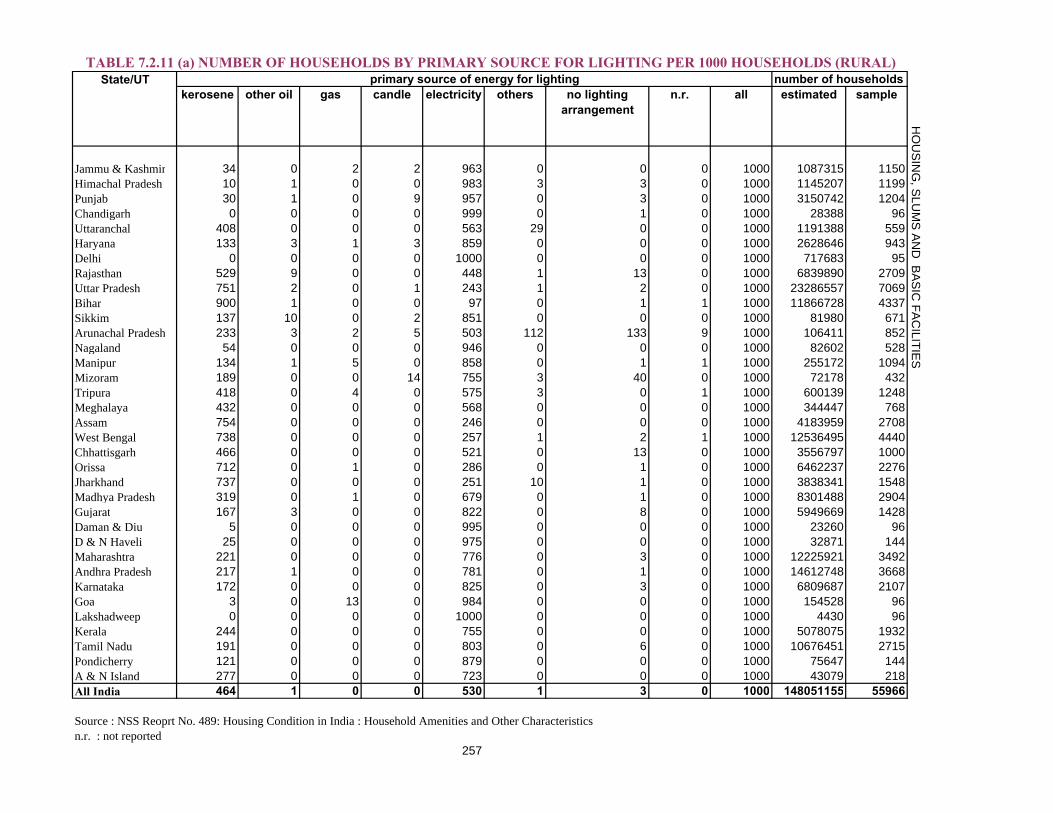
Jammu & Kashmir 34 0 2 2 963 0 0 0 1000 1087315 1150Himachal Pradesh 10 1 0 0 983 3 3 0 1000 1145207 1199Punjab 30 1 0 9 957 0 3 0 1000 3150742 1204Chandigarh 0 0 0 0 999 0 1 0 1000 28388 96Uttaranchal 408 0 0 0 563 29 0 0 1000 1191388 559Haryana 133 3 1 3 859 0 0 0 1000 2628646 943Delhi 0 0 0 0 1000 0 0 0 1000 717683 95Rajasthan 529 9 0 0 448 1 13 0 1000 6839890 2709Uttar Pradesh 751 2 0 1 243 1 2 0 1000 23286557 7069Bihar 900 1 0 0 97 0 1 1 1000 11866728 4337Sikkim 137 10 0 2 851 0 0 0 1000 81980 671Arunachal Pradesh 233 3 2 5 503 112 133 9 1000 106411 852Nagaland 54 0 0 0 946 0 0 0 1000 82602 528Manipur 134 1 5 0 858 0 1 1 1000 255172 1094Mizoram 189 0 0 14 755 3 40 0 1000 72178 432Tripura 418 0 4 0 575 3 0 1 1000 600139 1248Meghalaya 432 0 0 0 568 0 0 0 1000 344447 768Assam 754 0 0 0 246 0 0 0 1000 4183959 2708West Bengal 738 0 0 0 257 1 2 1 1000 12536495 4440Chhattisgarh 466 0 0 0 521 0 13 0 1000 3556797 1000Orissa 712 0 1 0 286 0 1 0 1000 6462237 2276Jharkhand 737 0 0 0 251 10 1 0 1000 3838341 1548Madhya Pradesh 319 0 1 0 679 0 1 0 1000 8301488 2904Gujarat 167 3 0 0 822 0 8 0 1000 5949669 1428Daman & Diu 5 0 0 0 995 0 0 0 1000 23260 96D & N Haveli 25 0 0 0 975 0 0 0 1000 32871 144Maharashtra 221 0 0 0 776 0 3 0 1000 12225921 3492Andhra Pradesh 217 1 0 0 781 0 1 0 1000 14612748 3668Karnataka 172 0 0 0 825 0 3 0 1000 6809687 2107Goa 3 0 13 0 984 0 0 0 1000 154528 96Lakshadweep 0 0 0 0 1000 0 0 0 1000 4430 96Kerala 244 0 0 0 755 0 0 0 1000 5078075 1932Tamil Nadu 191 0 0 0 803 0 6 0 1000 10676451 2715Pondicherry 121 0 0 0 879 0 0 0 1000 75647 144A & N Island 277 0 0 0 723 0 0 0 1000 43079 218All India 464 1 0 0 530 1 3 0 1000 148051155 55966
257
TABLE 7.2.11 (a) NUMBER OF HOUSEHOLDS BY PRIMARY SOURCE FOR LIGHTING PER 1000 HOUSEHOLDS (RURAL)State/UT primary source of energy for lighting number of households
HO
US
ING
, SLU
MS
AN
D B
AS
IC FA
CILITIE
S
n.r. : not reportedSource : NSS Reoprt No. 489: Housing Condition in India : Household Amenities and Other Characteristics

kerosene other iol gas candle electricity others no lighting arrangement
n.r. all estimated sample
Jammu & Kashmir 3 0 0 0 995 0 2 0 1000 326486 864Himachal Pradesh 1 0 0 0 998 0 1 0 1000 172585 240Punjab 18 0 0 2 980 0 0 0 1000 1674246 1248Chandigarh 3 0 0 0 997 0 0 0 1000 299066 240Uttaranchal 20 0 0 0 980 0 0 0 1000 329812 384Haryana 13 1 0 6 977 0 2 0 1000 1089711 767Delhi 5 0 0 0 995 0 0 0 1000 2653502 1686Rajasthan 114 0 0 7 871 0 8 0 1000 2536776 1662Uttar Pradesh 133 0 0 3 863 0 1 0 1000 6565552 3684Bihar 336 0 0 0 660 3 2 0 1000 1537895 1008Sikkim 0 0 0 0 991 9 0 0 1000 13046 192Arunachal Pradesh 37 3 0 0 958 2 0 0 1000 25853 396Nagaland 25 0 0 0 975 0 0 0 1000 44468 228Manipur 66 0 0 0 928 0 0 6 1000 89266 708Mizoram 2 1 0 0 998 0 0 0 1000 56365 912Tripura 88 3 4 0 903 0 0 1 1000 94457 480Meghalaya 61 0 0 0 939 0 0 0 1000 68708 384Assam 131 0 0 0 868 1 0 0 1000 435469 804West Bengal 160 0 1 1 837 0 0 0 1000 4647497 3383Chhattisgarh 134 0 1 0 865 0 0 0 1000 782011 480Orissa 134 0 0 0 866 0 0 0 1000 1170986 803Jharkhand 125 8 0 0 865 0 2 0 1000 974414 911Madhya Pradesh 79 0 0 0 920 0 0 0 1000 3149590 2160Gujarat 35 0 0 0 959 0 5 0 1000 3728078 1617Daman & Diu 1 0 0 0 999 0 0 0 1000 13408 192D & N Haveli 0 0 0 0 1000 0 0 0 1000 5983 144Maharashtra 41 0 0 0 959 0 0 0 1000 8981672 5020Andhra Pradesh 63 0 0 0 937 0 0 0 1000 5892701 2660Karnataka 49 0 0 0 949 0 2 0 1000 3257320 2242Goa 3 0 0 0 997 0 0 0 1000 90314 95Lakshadweep 0 0 0 0 1000 0 0 0 1000 5827 96Kerala 96 0 0 0 904 0 0 0 1000 1733296 1295Tamil Nadu 61 0 0 0 937 0 2 0 1000 5909063 4259Pondicherry 47 0 0 0 953 0 0 0 1000 144890 480A & N Island 28 0 0 0 972 0 0 0 1000 20748 192All India 81 0 0 1 916 0 1 0 1000 58521059 41916
258n.r. : not reported
State/UT
Source : NSS Reoprt No. 489: Housing Condition in India : Household Amenities and Other Characteristics
HO
US
ING
, SLU
MS
AN
D B
AS
IC FA
CILITIE
S
TABLE 7.2.11 (b) NUMBER OF HOUSEHOLDS BY PRIMARY SOURCE FOR LIGHTING PER 1000 HOUSEHOLDS (URBAN)number of householdsprimary source of energy for lighting
kerosene other iol gas candle electricity others no lighting arrangement
n.r. all estimated sample
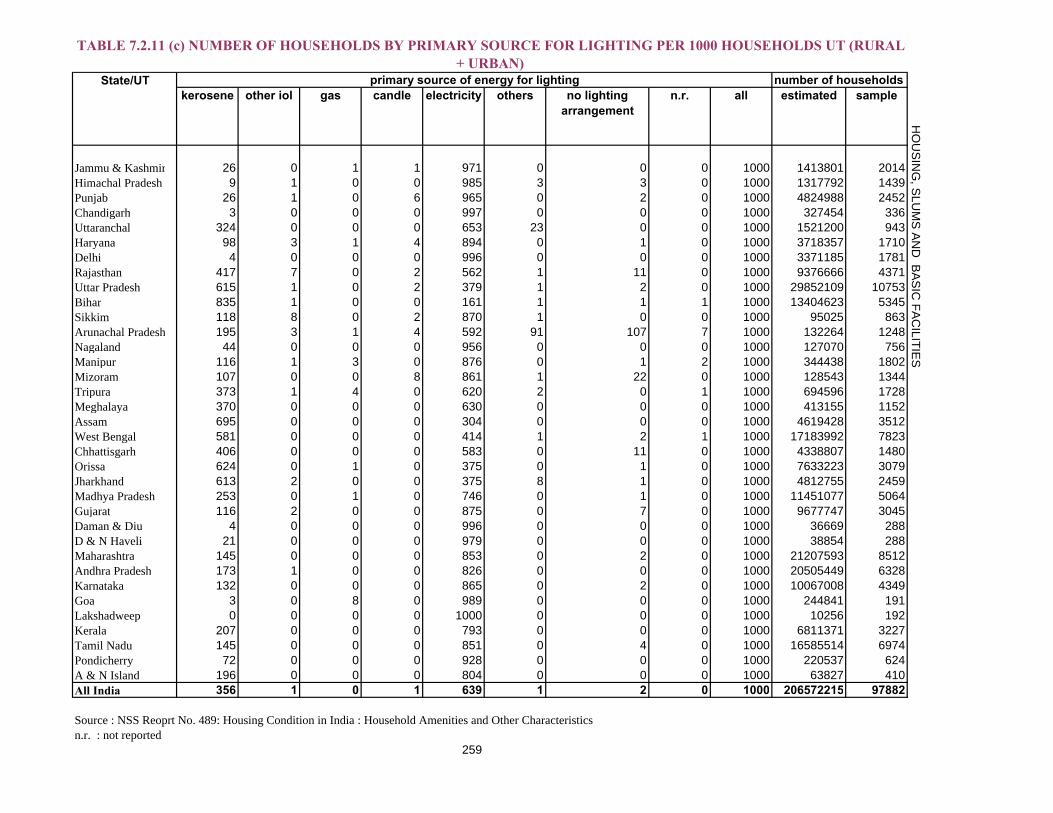
Jammu & Kashmir 26 0 1 1 971 0 0 0 1000 1413801 2014Himachal Pradesh 9 1 0 0 985 3 3 0 1000 1317792 1439Punjab 26 1 0 6 965 0 2 0 1000 4824988 2452Chandigarh 3 0 0 0 997 0 0 0 1000 327454 336Uttaranchal 324 0 0 0 653 23 0 0 1000 1521200 943Haryana 98 3 1 4 894 0 1 0 1000 3718357 1710Delhi 4 0 0 0 996 0 0 0 1000 3371185 1781Rajasthan 417 7 0 2 562 1 11 0 1000 9376666 4371Uttar Pradesh 615 1 0 2 379 1 2 0 1000 29852109 10753Bihar 835 1 0 0 161 1 1 1 1000 13404623 5345Sikkim 118 8 0 2 870 1 0 0 1000 95025 863Arunachal Pradesh 195 3 1 4 592 91 107 7 1000 132264 1248Nagaland 44 0 0 0 956 0 0 0 1000 127070 756Manipur 116 1 3 0 876 0 1 2 1000 344438 1802Mizoram 107 0 0 8 861 1 22 0 1000 128543 1344Tripura 373 1 4 0 620 2 0 1 1000 694596 1728Meghalaya 370 0 0 0 630 0 0 0 1000 413155 1152Assam 695 0 0 0 304 0 0 0 1000 4619428 3512West Bengal 581 0 0 0 414 1 2 1 1000 17183992 7823Chhattisgarh 406 0 0 0 583 0 11 0 1000 4338807 1480Orissa 624 0 1 0 375 0 1 0 1000 7633223 3079Jharkhand 613 2 0 0 375 8 1 0 1000 4812755 2459Madhya Pradesh 253 0 1 0 746 0 1 0 1000 11451077 5064Gujarat 116 2 0 0 875 0 7 0 1000 9677747 3045Daman & Diu 4 0 0 0 996 0 0 0 1000 36669 288D & N Haveli 21 0 0 0 979 0 0 0 1000 38854 288Maharashtra 145 0 0 0 853 0 2 0 1000 21207593 8512Andhra Pradesh 173 1 0 0 826 0 0 0 1000 20505449 6328Karnataka 132 0 0 0 865 0 2 0 1000 10067008 4349Goa 3 0 8 0 989 0 0 0 1000 244841 191Lakshadweep 0 0 0 0 1000 0 0 0 1000 10256 192Kerala 207 0 0 0 793 0 0 0 1000 6811371 3227Tamil Nadu 145 0 0 0 851 0 4 0 1000 16585514 6974Pondicherry 72 0 0 0 928 0 0 0 1000 220537 624A & N Island 196 0 0 0 804 0 0 0 1000 63827 410All India 356 1 0 1 639 1 2 0 1000 206572215 97882
259n.r. : not reported
State/UT primary source of energy for lighting number of households
Source : NSS Reoprt No. 489: Housing Condition in India : Household Amenities and Other Characteristics
HO
US
ING
, SLU
MS
AN
D B
AS
IC FA
CILITIE
S
TABLE 7.2.11 (c) NUMBER OF HOUSEHOLDS BY PRIMARY SOURCE FOR LIGHTING PER 1000 HOUSEHOLDS UT (RURAL + URBAN)

by panchayat/
municipality/corporation
by residents
others no arrangement
n.r. all estimated sample
UrbanJammu & Kashmir 577 108 1 314 0 1000 326486 864Himachal Pradesh 703 112 52 133 0 1000 172585 240Punjab 464 209 47 280 0 1000 1673799 1247Chandigarh 593 132 70 207 0 1000 299066 240Uttaranchal 693 201 71 36 0 1000 329812 384Haryana 361 329 29 281 0 1000 1089711 767Delhi 519 412 11 58 0 1000 2652640 1685Rajasthan 440 302 39 219 0 1000 2531266 1659Uttar Pradesh 544 243 58 151 4 1000 6559728 3676Bihar 393 70 35 498 3 1000 1534197 1003Sikkim 954 32 0 14 0 1000 13046 192Arunachal Pradesh 18 731 109 141 2 1000 25452 387Nagaland 138 699 96 67 0 1000 44468 228Manipur 110 531 176 163 20 1000 89020 707Mizoram 80 498 82 339 2 1000 56285 910Tripura 254 51 63 633 0 1000 94457 480Meghalaya 504 194 98 204 0 1000 68708 384Assam 268 496 75 160 0 1000 435469 804West Bengal 536 102 42 315 0 1000 4644618 3376Chhattisgarh 515 138 61 286 4 1000 779300 479Orissa 512 62 157 268 0 1000 1170317 802Jharkhand 298 209 48 446 1 1000 972694 910Madhya Pradesh 496 96 23 384 0 1000 3149590 2160Gujarat 500 372 41 86 0 1000 3723817 1615Daman & Diu 525 392 22 62 0 1000 13408 192D & N Haveli 359 520 54 67 0 1000 5983 144Maharashtra 807 71 12 110 0 1000 8976198 5014Andhra Pradesh 683 134 40 143 0 1000 5881294 2650Karnataka 670 135 23 171 0 1000 3252093 2240Goa 433 0 4 562 0 1000 90314 95Lakshadweep 117 0 0 883 0 1000 5827 96Kerala 231 159 63 547 0 1000 1732564 1294Tamil Nadu 768 114 10 107 0 1000 5898627 4245Pondicherry 564 292 67 77 0 1000 144890 480A & N Island 870 54 0 76 0 1000 20748 192All India 590 175 36 199 1 1000 584584753 41841
HO
US
ING
, SLU
MS
AN
D B
AS
IC FA
CILITIE
S
n.r. : not reportedSource : NSS Reoprt No. 489: Housing Condition in India : Household Amenities and Other Characteristics
TABLE 7.2.12 : NUMBER OF HOUSEHOLDS BY ARRANGEMENT OF GARBAGE DISPOSAL PER 1000 HOUSEHOLDS LIVING IN A HOUSE
State/UT no. of households living in a house
arrangement of garbage disposal
260

HOUSING,SLUMS AND BASIC FACILITIES
1991 2001 2004 2006 2025 1991 2001 2004 2006 20251 2 3 4 5 6 7 8 9 10 11 12
1 Andhra Pradesh66508 75728 78527 80430 94276 2.50 3.20 3.45 3.63 4.912 Arunachal Pradesh865 1091 1139 1170 1429 0.03 0.05 0.05 0.05 0.073 Assam 22414 26638 28050 29009 36766 0.84 1.13 1.23 1.31 1.914 Bihar 86374 82879 87810 90830 114845 3.25 3.50 3.86 4.09 5.985 Chandigarh 642 901 969 1013 1642 0.02 0.04 0.04 0.05 0.096 Chhattisgarh @ 20796 22011 22859 29513 @ 0.88 0.97 1.03 1.547 Goa 1170 1344 1451 1537 2703 0.04 0.06 0.06 0.07 0.148 Gujarat 41310 50597 53195 54814 67402 1.55 2.14 2.34 2.47 3.519 Haryana 16464 21083 22296 23040 28941 0.62 0.89 0.98 1.04 1.51
10 Himachal Pradesh5171 6077 6294 6425 7345 0.19 0.26 0.28 0.29 0.3811 Jammu & Kashmir7719 10070 10935 11603 21767 0.29 0.43 0.48 0.52 1.1312 Jharkhand @ 26909 28303 29173 35730 @ 1.14 1.24 1.32 1.8613 Karnataka 44977 52734 54824 56137 65879 1.69 2.23 2.41 2.53 3.4314 Kerala 29099 31839 32862 33569 38360 1.09 1.34 1.45 1.51 215 Madhya Pradesh66181 60385 64237 66801 88062 2.49 2.55 2.82 3.01 4.5816 Maharashtra 78937 96752 101275 104104 127719 2.97 4.09 4.45 4.69 6.6517 Manipur 1837 2389 2499 2561 3128 0.07 0.10 0.11 0.12 0.1618 Meghalaya 1775 2306 2411 2472 3021 0.07 0.10 0.11 0.11 0.1619 Mizoram 690 891 932 955 1167 0.03 0.04 0.04 0.04 0.0620 Nagaland 1210 1989 2090 2132 2606 0.05 0.08 0.09 0.10 0.1421 Orissa 31660 36707 38139 39053 45763 1.19 1.55 1.68 1.76 2.3822 Punjab 20282 24289 25336 25976 30609 0.76 1.03 1.11 1.17 1.5923 Rajasthan 44006 56473 60127 62431 80005 1.66 2.39 2.64 2.81 4.1624 Sikkim 406 540 566 579 708 0.02 0.02 0.02 0.03 0.0425 Tamil Nadu 55859 62111 64019 65261 73569 2.10 2.62 2.82 2.94 3.8326 Tripura 2757 3191 3326 3421 4180 0.10 0.13 0.15 0.15 0.2227 Uttar Pradesh139112 166053 176765 183856 245772 5.23 7.01 7.77 8.29 12.7928 Uttaranchal @ 8480 8925 9216 11506 @ 0.36 0.39 0.42 0.629 West Bengal 68078 80221 83585 85780 103194 2.56 3.39 3.68 3.70 5.3730 A. & N.
Islands281 356 377 394 606 0.01 0.02 0.02 0.02 0.03
31 D. & N. Haveli
138 220 237 248 429 0.01 0.01 0.01 0.01 0.02
32 Lakshadweep 52 61 64 66 97 0.00 0.00 0 0.00 0.0133 Pondicherry 808 974 1013 1042 1427 0.03 0.04 0.04 0.05 0.0734 Delhi 9421 13783 15128 16065 28394 0.35 0.58 0.67 0.72 1.4835 Daman & Diu 102 158 170 178 301 0.00 0.01 0.01 0.01 0.023
846303 1027015 1079887 1114200 1398861 31.84 43.38 47.49 50.23 72.81
Source: Central Water Commission BCM : Billion Cubic MetresNote : + : All India figures relate to the estimated requirement as worked out by the standing sub committee for Assessment of availability and requirement of water for diverse uses in the country, 2000. (distributed prorata in the states in proportion to population).@ : Three States namely Jharkhand, Uttaranchal & Chhatisgarh have been formed after 1991 as such their population as well water requirement in year 1991 have been included in the respective states: Chhattisgarh in M.P, Jharkhand in Bihar and Uttaranchal in Uttar Pradesh.
Water Requirement in BCM
TABLE 7.2.13 : STATE-WISE ESTIMATED ANNUAL REQUIREMENT OF WATER FOR DOMESTIC PURPOSES INCLUDING FOR CATTLE IN DIFFERENT STATES
TOTAL
Sl. No. State/UT Population in Thousand
261

WASTE MANAGEMENT
Waste Types of Wastes Regulatory QuantitiesCategory
(Numbers)
1 2 3
1 Cyanide wastes 1 kilogram per year calculated as cyanide
2 Metal finishing wastes 10 kilograms per year the sum of the specified substance 'calculated as pure metal
3 Waste containing water soluble chemical compounds of lead, copper, zinc, chromium, nickle, selenium, bariumand antimony
10 kilograms per year the sum of the specified substance 'calculated as pure metal
4 Mercury, arsenic, thallium, and cadmium bearing wastes
5 kilograms per year the sum of the specified substance 'calculated as pure metal
5 Non-halogenated hydrocarbons including solvents 200 kilograms per year calculated as non-halogenated 'hydrocarbons
6 Halogenated hydrocarbons including solvents 50 kilograms per year calculated as halogenated 'hydrocarbons
7 Wastes from paints, pigments, glue, varnish and printing ink
250 kilograms per year calculated as oil or oil emulsions
8 Wastes from dyes and dye intermediates containing inorganic chemical compounds
200 kilograms per year calculated as inorganic chemicals
9 Wastes from dyes and dye intermediates containing organic chemical compounds
50 kilograms per year calculated as organic chemicals
10 Waste oils and oil-emulsions 1000 kilograms per year calculated as oil and oil emulsions
11 Tarry wastes from refining and tar residues from distillation or pyrolytic treatment
200 kilograms per year calculated as tar
12 Sludge arising from treatment of waste water containing heavy metals, toxic organics, oils, emulsions, and spend chemicals and incineration ash
Irrespective of any quantity
13 Phenols 5 kilograms per year calculated as phenols
14 Asbestos 200 kilograms per year calculated as asbestos
15 Wastes from manufacture of pesticides, herbicides, and residues from pesticides and herbicide formulation units.
5 kilograms per year calculated as pesticides and their intermediate products
16 Acidic/alkaline/slurry wastes 200 kilograms per year calculated as acids/alkalies
17 Off-specification and discarded products Irrespective of any quantity
18 Discarded containers and container liners of hazardousand toxic wastes
Irrespective of any quantity
TABLE 7.3.1 : HAZARDOUS WASTE REGULATORY QUANTITIES
Source : Central Pollution Control Board
262

WASTE MANAGEMENT
Sl. No. Name of city Population (as per 2001
census )
Area (Sq. Km)
Waste Quantity (TPD)
Waste generation rate (Kcal/day)
1 Kavarati 10119 4 3 0.302 Gangtok 29354 15 13 0.443 Itanagar 35022 22 12 0.344 Daman 35770 7 15 0.425 Silvassa 50463 17 16 0.326 Panjim 69066 69 32 0.547 Kohima 77030 30 13 0.178 Port Blair 99984 18 76 0.769 Shilong 132867 10 45 0.3410 Simla 142555 20 39 0.2711 Agartala 189998 63 77 0.4012 Gandhinagar 195985 57 44 0.2213 Dhanbad 199258 24 77 0.3914 Pondicherry 220865 19 130 0.5915 Impal 221492 34 43 0.1916 Aizwal 228280 117 57 0.2517 Jammu 369659 102 215 0.5818 Dehradun 426674 67 131 0.3119 Asansol 745439 127 207 0.4420 Kochi 595575 98 400 0.6721 Raipur 605747 56 184 0.3022 Bhubaneswar 648032 135 234 0.3623 Tiruvananantapuram 744983 142 171 0.2324 Chandigarh 808515 114 326 0.4025 Guwahati 809895 218 166 0.2026 Ranchi 847093 224 208 0.2527 Vijaywada 851282 58 374 0.4428 Srinagar 989440 341 428 0.4829 Madurai 928868 52 275 0.3030 Coimbatore 930882 107 530 0.5731 Jabalpur 932484 134 216 0.2332 Amritsar 966862 77 438 0.4533 Rajkot 967476 105 207 0.2134 Allahabad 975393 71 509 0.5235 Vishakhapatnam 982904 110 584 0.5936 Faridabad 1055938 216 448 0.4237 Meerut 1068772 142 490 0.4638 Nashik 1077236 269 200 0.1939 Varanasi 1091918 80 425 0.3940 Jamshedpur 1104713 64 338 0.3141 Agra 1275135 140 654 0.5142 Vadodara 1306227 240 357 0.2743 Patna 1366444 107 511 0.3744 Ludhiana 1398467 159 735 0.5345 Bhopal 1437354 286 574 0.4046 Indore 1474968 130 557 0.3847 Nagpur 2052066 218 504 0.2548 Lucknow 2185927 310 475 0.2249 Jaipur 2322575 518 904 0.3950 Surat 2433835 112 1000 0.4151 Pune 2538473 244 1175 0.4652 Kanpur 2551337 267 1100 0.4353 Ahemdabad 3520085 191 1302 0.3754 Hyderabad 3843585 169 2187 0.5755 Bangalore 4301326 226 1669 0.3956 Chennai 4343645 174 3036 0.6257 Kolkata 4572876 187 2653 0.5858 Delhi' 10306452 1483 5922 0.5759 Greater Mumbai 11978450 437 5320 0.45
Source :Central Pollution Control Board (CPCB)
TABLE 7.3.2 : QUANTITIES AND WASTE GENERATION RATES IN 59 CITIES
CPCB with the assistance of NEERI conducted survey of sloid waste management in 59 cities (35 metro cities and 24 State capital -2004-05)
263

WASTE MANAGEMENT
Sr. No. Name of City Compostables (%)Recyclables
(%)C/N Ratio HCV*
(Kcal/Kg)Moisture
1 Kavarati 46.01 27.20 18.04 2242 252 Gangtok 46.52 16.48 25.61 1234 443 Itanagar 52.02 20.57 17.68 3414 504 Daman 29.60 22.02 22.34 2588 535 Silvassa 71.67 13.97 35.24 1281 426 Panjim 61.75 17.44 23.77 2211 477 Kohima 57.48 22.67 30.84 2844 658 Port Blair 48.25 27.66 35.88 1474 639 Shilong 62.54 17.27 28.86 2736 63
10 Simla 43.02 36.64 23.76 2572 6011 Agartala 58.57 13.68 30.02 2427 6012 Gandhinagar 34.30 13.20 36.05 698 2413 Dhanbad 46.93 16.16 18.22 591 5014 Pondicherry 49.96 24.29 36.86 1846 5415 Impal 60.00 18.51 22.34 3766 4016 Aizwal 54.24 20.97 27.45 3766 4317 Jammu 51.51 21.08 26.79 1782 4018 Dehradun 51.37 19.58 25.90 2445 6019 Asansol 50.33 14.21 14.08 1156 5420 Kochi 57.24 19.36 18.22 591 5021 Raipur 51.40 16.31 22.35 1273 3022 Bhubaneswar 49.81 12.69 20.57 742 5923 Tiruvananantapuram 72.96 14.36 35.19 2378 6024 Chandigarh 57.18 10.91 20.52 1408 6425 Guwahati 53.69 23.28 17.71 1519 6126 Ranchi 51.49 9.86 20.23 1060 4927 Vijaywada 59.43 17.40 33.90 1910 4628 Srinagar 61.77 17.76 22.46 1264 6129 Madurai 55.32 17.25 32.69 1813 4630 Coimbatore 50.06 15.52 45.83 2381 5431 Jabalpur 58.07 16.61 28.22 2051 3532 Amritsar 65.02 13.94 30.69 1836 6133 Rajkot 41.50 11.20 52.56 687 1734 Allahabad 35.49 19.22 19.00 1180 1835 Vishakhapatnam 45.96 24.20 41.70 1602 5336 Faridabad 42.06 23.31 18.58 1319 3437 Meerut 54.54 10.96 19.24 1089 3238 Nashik 39.52 25.11 37.20 2762 6239 Varanasi 45.18 17.23 19.40 804 4440 Jamshedpur 43.36 15.69 19.69 1009 4841 Agra 46.38 15.76 21.56 520 2842 Vadodara 47.43 14.50 40.34 1781 2543 Patna 51.96 12.57 18.62 819 3644 Ludhiana 49.80 19.32 52.17 2559 6545 Bhopal 52.44 22.33 21.58 1421 4346 Indore 48.97 12.57 29.30 1437 3147 Nagpur 47.41 15.53 26.37 2632 4148 Lucknow 47.41 15.53 21.41 1557 6049 Jaipur 45.50 12.10 43.29 834 2150 Surat 56.87 11.21 42.16 990 5151 Pune 62.44 16.66 35.54 2531 6352 Kanpur 47.52 11.93 27.64 1571 4653 Ahemdabad 40.81 11.65 29.64 1180 3254 Hyderabad 54.20 21.60 25.90 1969 4655 Bangalore 51.84 22.43 35.12 2386 5556 Chennai 41.34 16.34 29.25 2594 4757 Kolkata 50.56 11.48 31.81 1201 4658 Delhi' 54.42 15.52 34.87 1802 4959 Greater Mumbai 62.44 16.66 39.04 1786 54
Source :Central Pollution Control Board (CPCB)
HCV : High colorific valueC/N Ratio : Carbon to Nitrogen Ratio
TABLE 7.3.3 : WASTE CHARACTERISATION IN 59 CITIES
CPCB with the assistance of NEERI conducted sourvey of sloid waste management in 59 cities (35 metro cities and 24 State capital -2004-05)
264
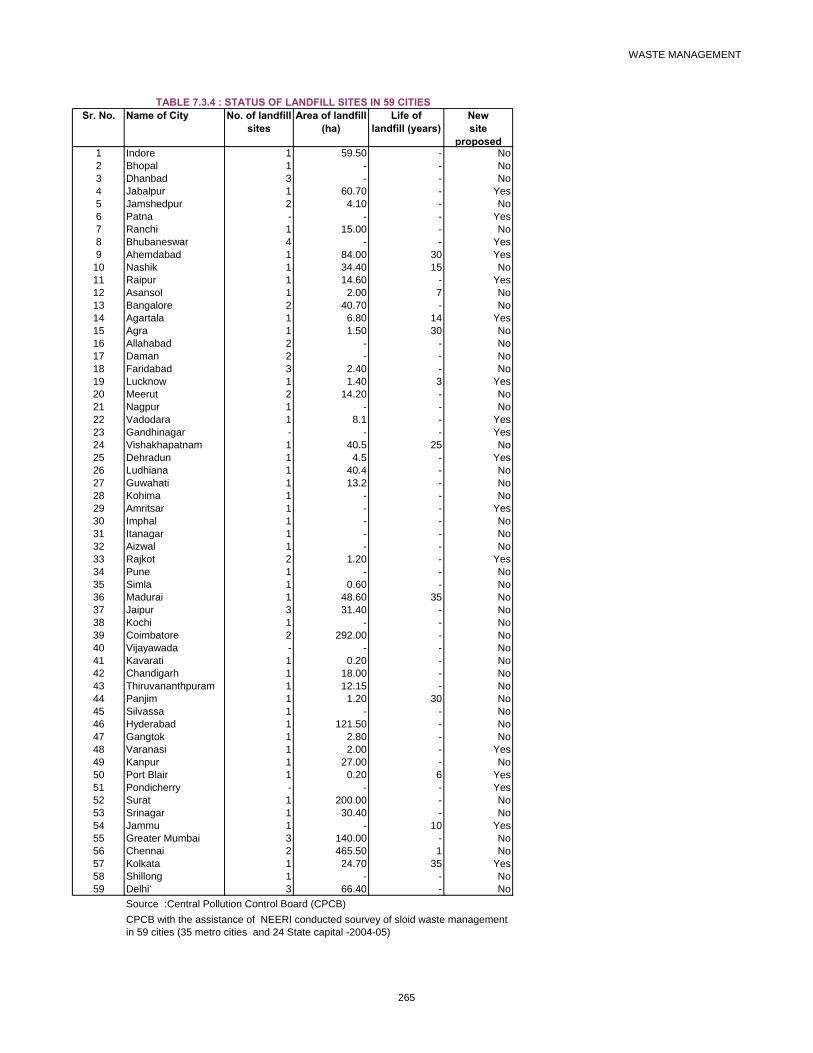
WASTE MANAGEMENT
Sr. No. Name of City No. of landfill sites
Area of landfill (ha)
Life of landfill (years)
New site
proposed1 Indore 1 59.50 - No2 Bhopal 1 - - No3 Dhanbad 3 - - No4 Jabalpur 1 60.70 - Yes5 Jamshedpur 2 4.10 - No6 Patna - - - Yes7 Ranchi 1 15.00 - No8 Bhubaneswar 4 - - Yes9 Ahemdabad 1 84.00 30 Yes
10 Nashik 1 34.40 15 No11 Raipur 1 14.60 - Yes12 Asansol 1 2.00 7 No13 Bangalore 2 40.70 - No14 Agartala 1 6.80 14 Yes15 Agra 1 1.50 30 No16 Allahabad 2 - - No17 Daman 2 - - No18 Faridabad 3 2.40 - No19 Lucknow 1 1.40 3 Yes20 Meerut 2 14.20 - No21 Nagpur 1 - - No22 Vadodara 1 8.1 - Yes23 Gandhinagar - - - Yes24 Vishakhapatnam 1 40.5 25 No25 Dehradun 1 4.5 - Yes26 Ludhiana 1 40.4 - No27 Guwahati 1 13.2 - No28 Kohima 1 - - No29 Amritsar 1 - - Yes30 Imphal 1 - - No31 Itanagar 1 - - No32 Aizwal 1 - - No33 Rajkot 2 1.20 - Yes34 Pune 1 - - No35 Simla 1 0.60 - No36 Madurai 1 48.60 35 No37 Jaipur 3 31.40 - No38 Kochi 1 - - No39 Coimbatore 2 292.00 - No40 Vijayawada - - - No41 Kavarati 1 0.20 - No42 Chandigarh 1 18.00 - No43 Thiruvananthpuram 1 12.15 - No44 Panjim 1 1.20 30 No45 Silvassa 1 - - No46 Hyderabad 1 121.50 - No47 Gangtok 1 2.80 - No48 Varanasi 1 2.00 - Yes49 Kanpur 1 27.00 - No50 Port Blair 1 0.20 6 Yes51 Pondicherry - - - Yes52 Surat 1 200.00 - No53 Srinagar 1 30.40 - No54 Jammu 1 - 10 Yes55 Greater Mumbai 3 140.00 - No56 Chennai 2 465.50 1 No57 Kolkata 1 24.70 35 Yes58 Shillong 1 - - No59 Delhi' 3 66.40 - No
Source :Central Pollution Control Board (CPCB)
TABLE 7.3.4 : STATUS OF LANDFILL SITES IN 59 CITIES
CPCB with the assistance of NEERI conducted sourvey of sloid waste management in 59 cities (35 metro cities and 24 State capital -2004-05)
265

WASTE MANAGEMENT
(Thousands Metric Tonnes)Sl. No.
Country/Region Consumption
1 2 3
1 Europe W, C, E 400002 Eurasia, Russia, Others 40003 North America 450004 Latin America 110005 Middle East, Incl. TR 40006 Africa, North & South 25007 Other Africa 5008 China 190009 India 400010 Japan 1100011 Other Asia Pacific, Rest 13000
154000
Source : www.envis-icpe.com
TABLE 7.3.5 : CONSUMPTION OF PLASTIC IN THE WORLD 2000
Total World
Chart : 7.5: Consumption of Plastic in the World-2000
40000
4000
45000
11000
4000
2500
500
19000
4000
11000
13000
Europe W, C, E
Eurasia, Russia, Others
North America
Latin America
Middle East, Incl. TR
Africa, North & South
Other Africa
China
India
Japan
Other Asia Pacific, Rest
266
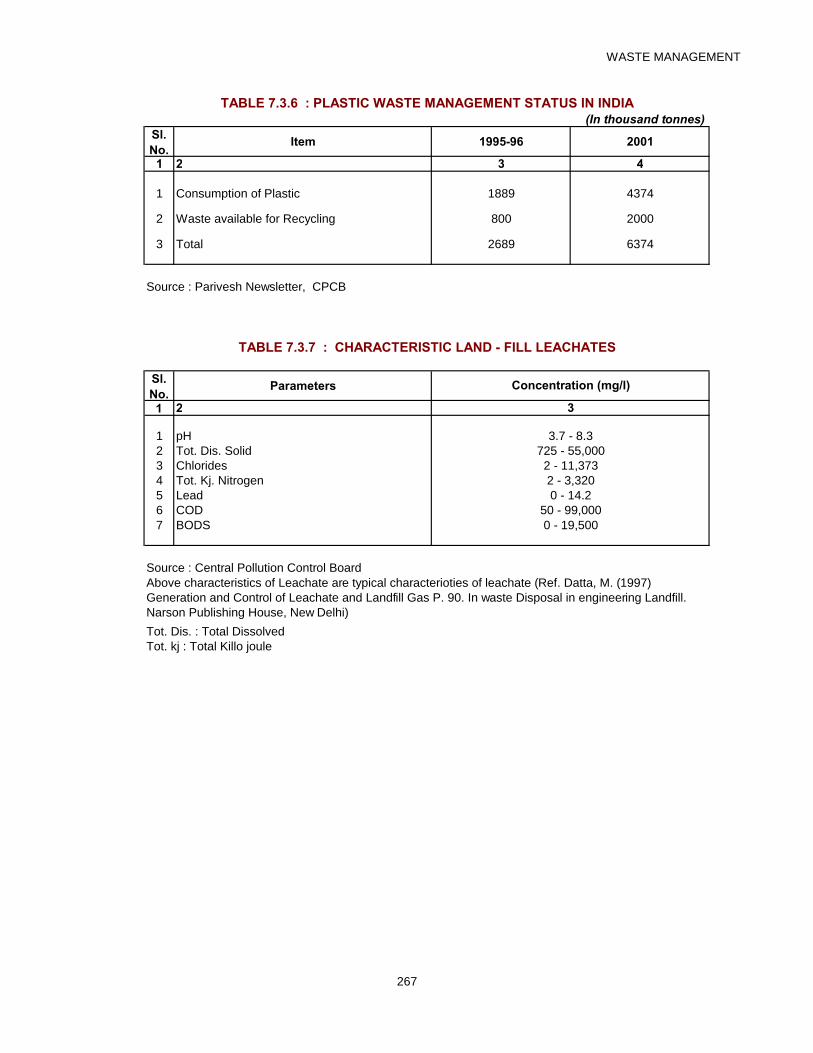
WASTE MANAGEMENT
Sl. No.
Item 1995-96 2001
1 2 3 4
1 Consumption of Plastic 1889 4374
2 Waste available for Recycling 800 2000
3 Total 2689 6374
Source : Parivesh Newsletter, CPCB
Sl. No.
Parameters
1 2
1 pH2 Tot. Dis. Solid3 Chlorides4 Tot. Kj. Nitrogen5 Lead6 COD7 BODS
Source : Central Pollution Control Board
Tot. Dis. : Total DissolvedTot. kj : Total Killo joule
50 - 99,0000 - 19,500
3
(In thousand tonnes)
TABLE 7.3.7 : CHARACTERISTIC LAND - FILL LEACHATES
TABLE 7.3.6 : PLASTIC WASTE MANAGEMENT STATUS IN INDIA
Above characteristics of Leachate are typical characterioties of leachate (Ref. Datta, M. (1997) Generation and Control of Leachate and Landfill Gas P. 90. In waste Disposal in engineering Landfill. Narson Publishing House, New Delhi)
Concentration (mg/l)
3.7 - 8.3725 - 55,0002 - 11,3732 - 3,3200 - 14.2
267

WASTE MANAGEMENT
Landfill able Incinerable Recyclable Total1 2 3 4 5 61 Andhra Pradesh 211442 31660 313217 5563192 Assam 3252 7480 107323 Bihar 3357 9 73 34394 Chattisgarh 5277 6897 283213 2953875 Delhi (unverified) 3338 1740 203 52816 Gujarat 1107128 108622 577037 17927877 Goa 10763 8271 7614 266488 Haryana 30452 1429 4919 368009 Himachal Pradesh 35519 2248 4380 4214710 Jammu & Kashmir 9946 141 6867 1695411 Jharkhand 23135 9813 204236 23718412 Karnataka 18366 3713 54490 7656913 Kerala 59591* 223 23085 82899*14 Madhya Pradesh 34945 5036 127909 16789015 Maharashtra 568135 152791 847442 156836816 Manipur - 115 137 25217 Meghalaya 19 697 6443 715918 Mizoram 90 Nil 12 10219 Nagaland 61 Nil 11 7220 Orissa 74351 4052 18427 9683021 Punjab 13601 14831 89481 11791322 Rajasthan 165107 23025 84739 27287123 Tripura 0 30 237 26724 Tamil Nadu 157909 11145 89593 25864725 Uttar Pradesh 36370 15697 117227 16929426 Uttarakhand 17991 580 11 1858227 West Bangal 120598 12583 126597 259777
Union Territory28 Daman, Diu, Dadra & NH 17219 421 56350 7399029 Pondicherry 132 25 36235 3639230 Chandigarh 232 - 723 955
Total 2728326 415794 3088387 6232507
Note : * This figure of Kerala includes other wastes (8066.745 MTA) from IRE and FACTSource: Central Pollution Control Board, Hazardous Waste Management Division Delhi, Feb., 2009
Quantity of Hazardous Waste GenerationSl. NO. STATE/UTTABLE 7.3.8 : STATE-WISE STATUS OF HAZARDOUS WASTE GENERATION
268