sectoral costs of environmental policy - wählen sie eine...
TRANSCRIPT

Free dissemination
(Contract ENV.G.1/ETU/2006/68)
Sectoral Costs of Environmental Policy
FINAL REPORT
P. Vercaemst, S. Vanassche, P. Campling, L. Vranken (VITO) P. Agnolucci, R. Salmons, B. Shaw, (PSI)
J. Jantzen, H. van der Woerd (TME) M. Grünig, A. Best (Ecologic)
Study accomplished under the authority of the European Commission, DG Environment
2007/IMS/R/427
VITO
December 2007


Partners in research
Sectoral Costs of Environmental Policy 3
Partners in research VITO VITO is an independent research centre in the Flemish region of Belgium. VITO conducts customer oriented contract research and develops innovative products and processes in the fields of energy, environment and materials, for both the public and the private sector. Central to all projects is the aim to protect the environment and encourage the sustainable use of energy and raw materials. To obtain a scientifically sound environmental policy, public authorities and industry need access to recent, reliable, and comprehensive information on a wide variety of environmental aspects. VITO assists both public and private actors in finding and interpreting this information and in making it easily accessible through databases, models, and decision support tools and schemes. One of its core competences is multi-disciplinarity, by combining technological, environmental and, increasingly important, economic insights. Its activities are certified according to ISO 9001:2000. VITO coordinated this project with Peter Vercaemst as project leader. His colleagues Stella Vanassche, dr. Liesbet Vranken and dr. Paul Campling were the main authors; Véronique Van Hoof, Erika Meynaerts, Koen Claes and Peter Stouthuysen contributed to the Annexes. PSI The Policy Studies Institute (PSI) is one of the leading research institutes in the UK. Within the Institute, the Environment Group is dedicated to the analysis of the socio-economic causes of environmental impacts, and the policies that may be used to ameliorate them. It seeks to undertake policy-relevant research of the highest quality, with a view to contributing to the maintenance and enhancement of the environment’s contribution to human welfare, now and in the future. The research undertaken by the Environment Group is clustered around a number of overlapping themes, including (inter alia): - Resource productivity, innovation and economic performance; - Waste management, resources and sustainable consumption; - Energy policy and climate change; - Environmental tax reform; - Environmental policy instruments; - Socio-economic and technology scenarios; - Sustainable development assessment. The Environment Group comprises around thirteen researchers from a wide range of disciplinary backgrounds, spanning economics, sociology, geography, regional planning, environmental technology, engineering, and science and technology policy. For PSI, Roger Salmons, Paolo Agnolucci and Ben Shaw contributed to the project.

Partners in research
Sectoral Costs of Environmental Policy 4
Ecologic Founded in Berlin in 1995, Ecologic is a private non-profit institute dedicated to advancing cooperation between nations and bringing fresh ideas to environmental policies and sustainable development. Ecologic was created to influence international relations, global governance and foreign and security policies in the interest of environmental protection, nature and wildlife conservation and responsible resource management. As an independent, non-partisan body, Ecologic undertakes applied research and analysis to increase awareness and understanding of the political, economic and technological forces driving global change. Ecologic's work program focuses on obtaining practical results. It recognises the existing linkages among policy fields and the need for a new agenda to integrate environmental protection requirements into other sectoral policy processes, notably economic and social development, as well as the work of institutions such as the United Nations and the international financial institutions. Within this project, Ecologic focused on a number of case studies. Aaron Best coordinated, and Max Grünig and Benjamin Görlach were the main authors. TME TME, the Institute for Applied Environmental Economics, the Netherlands, is since 1992 involved in investigating a sustainable future from an environmental economic perspective. The Institute has been involved in integrated environmental-economic assessment at regional, national and international level: EU 5th and 6th Environmental Action Programme, former Accession countries (Poland, Baltic States, Slovakia), World Bank, OECD. But also regularly environmental economic advice is given to the private sector. Its experience thus ranges from integrated continental studies, sectoral assessments, analyses of the use of economic instruments (tradable permits, taxes, etc.), financing of environmental improvements (ranging from company to national level). For TME, Jochem Jantzen and Henk van der Woerd collaborated on this project, with the focus on the analysis of the publicly available data on expenditure.

Acknowledgements
Acknowledgements We gratefully acknowledge funding of this study by the European Commission, DG Environment. In particular we would also like to thank the numerous plants and companies participating in this study either through time dedicated to our survey or to interviews. Last, but not least our gratitude is expressed to the participants to our expert Workshop of October 11, 2007. The report does not necessarily represent the position and views of the European Commission.


Executive Summary
Sectoral Costs of Environmental Policy 7
Executive Summary - Key findings for policy makers This study examined the costs of environmental policy for some of the manufacturing sectors most affected by policy. The headline conclusions are that:
- Environmental policy accounts for a relatively low percentage of costs for the different sectors. Statistical data indicates that annualised environmental costs in the four sectors studies are typically less than 2% of production value. On the other hand the perception from the respondents of the on-line survey is that environmental costs are much higher and that these costs are higher than their competitors;
- Environmental policy seems to account for broadly similar level of costs for firms operating in the EU and in Australia and the United States;
- There is no evidence that environmental policy has a material effect on the competitiveness of Europe’s manufacturing sectors or leads to relocation;
- The costs of environmental policy since the 1990s vary between the studied sectors, but generally tend to fall, except for the refineries where the environmental costs show an increasing trend;
- During this period there has been a marked improvement in environmental performance. One would expect a higher unit cost to reduce the more costly emissions, however innovation and the shift from end-of-pipe towards integrated investments could be viewed as important factors stabilising the unit costs of environmental protection;
- There seem to be synergies between different policies meaning that the cumulative costs of environmental policy are less than the costs would be of the individual policies with no integrated measures by businesses;
- It is more costly to do business in some countries than in others, but there does seem to be a move towards a level European playing field regarding environmental expenditure;
- Environmental policy can also benefit companies, for example, by improving resource efficiency; and,
- Environmental strategy has also helped improve performance.
An integrated study on sectoral costs of environmental policy In recent years some people have perceived a growing tension between the “Lisbon Agenda” of increased competitiveness, economic growth and job creation, and the “Gothenburg Agenda” of sustainable development. It is often argued that the two need not be mutually exclusive, but can indeed be supportive. However, there is also a perception that environmental regulation places an excessive burden on European industries, thereby stifling growth and damaging their competitiveness in an increasingly global market place. The impact of environmental policy on companies has been studied extensively. These studies typically focus on the impact of one Directive, or at one particular aspect, for example the role of different policy instruments. The added value of this study on the 'Sectoral costs of environmental policy' is that it aims to paint an 'integrated’ picture of the effect of environmental policy. In particular, it aims to answer a series of questions frequently asked about environmental policy. Are the costs significant for firms? Do the costs affect their international

Executive Summary
Sectoral Costs of Environmental Policy 8
competitiveness? Is the sum of individual environmental policies more or less than the its constituent parts meaning that it is the cumulative burden that needs to be assessed? How are the costs of environmental policy changing over time? Do costs differ between Member States, suggesting that the European playing field is not level? Do the costs of an individual environmental policy come down over time as firms innovate and seek ways to reduce costs? Are their benefits from environmental policy to firms?
An integrated methodological framework To answer these questions, the study concentrates on a few industrial sectors that are polluting at relatively high levels and/or subject to competitiveness pressures that may make them more vulnerable than other sectors. These are the oil chain industry, electricity producers, the iron and steel industry (extended to base metals), and the textiles and leather sectors. This integrated picture includes a review of the publicly available information plus evidence from our own survey and case studies. More specifically, ‘primary’ data is information from individual companies or consultation with experts and stakeholders. ‘Secondary’ data is information from literature (articles, reports, communiqués) and publicly available databases with aggregated information on environmental expenditure (cf. Eurostat, OECD, National Statistical Offices) ‘Primary’ data was difficult to access from National Statistical Offices because of confidentiality issues, so data was collected using an online questionnaire. The statistical analysis of the on-line questionnaire was complemented by a review of publicly available data on environmental expenditures and a number of case studies based on direct interviews with stakeholders. The preliminary results of the project were also presented to an expert workshop- which included representatives of the sectors studied- to discuss some of the findings. For the survey carried out specifically for this study, we received 64 completed surveys, representing 170 plants, mostly larger ones, from the selected sectors in 14 Member States. Due to the low response rate we grouped the data received into four regions: Central Europe (Austria, Belgium, France, Germany, Netherlands and the UK), Northern Europe (Sweden and Denmark), Southern Europe (Italy and Portugal) and the New Member States (Czech Republic, Hungary, Poland and Slovenia) (Figure 1). Central Europe forms the largest group containing 52 % of the respondents. Northern Europe, Southern Europe and the New Member States represent respectively 14%, 20 % and 14 % of the respondents. The iron and steel industry, extended to the entire base metals sector to increase the sample, represented the largest part of the sample with 39 % of the responses, closely followed by the textile and leather industry with 33 %.

Executive Summary
Sectoral Costs of Environmental Policy 9
0
5
10
15
20
25
30
35
Southern Europe Northern Europe Central Europe New MemberStates
Num
ber
of r
espo
nden
ts
Total Oil Power Textiles Metals
Figure 1: Distribution of the respondents over geographical groups and sectors
Clearly, considering the somewhat small size of the sample, the extent to which the results can be generalised is limited. For this reason, the study tries to answer each of the questions addressed by looking at all of the evidence together – survey results, stakeholder feedback, data collected by National Statistical Offices, other surveys etc. Together, this mixture of primary and secondary data allows for a number of conclusions to be made. The analysis undertaken here could be replicated with a larger sample and also for other sectors. Ideally, information would be gathered as a part of established business surveys done by National Statistical Offices so as to increase the response rate and, ultimately, the size of the sample. Including every three years a limited number of additional close ended questions (similar to the ones used in this study) to gather qualitative information could substantially improve the findings on the drivers and the stories behind the figures, without imposing too much burden on responding companies. Another possibility would be to attach qualitative questions to the process of gathering information through the European Pollutant Emission Register (EPER) and the European Pollutant Release and Transfer Register (E-PRTR). Although not statistically representative it would allow responses to be assessed in terms of the location of major industries and the environmental implications for the region in question.
A conscious choice of sectors A major feature of this study is the focus on the four major manufacturing industries that can cause considerable environmental degradation and which have therefore been much affected by environmental policy. More specifically:

Executive Summary
Sectoral Costs of Environmental Policy 10
- Oil chain industry or ‘Refineries’ and ‘Mining’ (NACE1 11 and NACE 23); - Electricity production or ‘Power’ (NACE 40); - Textiles and leather industry or ‘Textiles’ (NACE 17 and NACE 19); and - Iron and steel industry, and other metals ‘Metals’ (NACE 27)2.
There are a number of reasons why it is useful to make an in-depth analysis at the level of the sector (Jenkins, 2002). Firstly, the dynamics of competition takes place within a sector. The structure of the industry and the forces of competition are key factors determining the behaviour of companies within the sector. Secondly, production processes and technological developments are to a large extent sector specific. Thirdly, most studies on the impact of environmental regulation on competitiveness and technological change are carried out at the macro level (region/country) or at the micro (company) level. The choice of these sectors was conscious. Due to the nature of their activities these industries are pollution intensive in different environmental domains (air, water, energy, waste, etc) and as such are affected by numerous European and national regulatory initiatives. These sectors therefore show some comparable challenges regarding environmental regulation and the subsequent investments.
Are environmental policy costs significant? The following paragraphs integrate the findings from the different analyses we carried out in this project. Clearly, we describe the general situation and trends, but there is some variation between sub-sectors and individual companies. Annualised environmental investments as a percentage of gross production value provide an indication of the importance of environmental investments to the four selected sectors. Data from Eurostat are used to provide a comparison between sectors annual environmental protection expenditures (EPE) in Figure 2. This graph shows the annual EPE in the sectors studied for the period 1995 – 2005. For the period 1995 – 2000 only investment EPE are presented as data on current expenditures is not available for that period at EU level after 2000. Both total EPE (investments and current expenditures) and investment EPE are indicated. Sectoral environmental investments show several peaks, but are not higher than 1.5% of sectoral production values. Total EPE are higher in the sectors strongly related to energy policy (refineries, mining and power). The graph also shows that the level of total annual EPE (shown for the period 2001 – 2005) is highly influenced by the pattern of EPE investments. Current expenditures (the difference between total and investment EPE) are more or less stable.
1 NACE stands for Nomenclature des Activités économiques dans la Communauté Européenne or General Name for Economic Activities in the European Union. NACE is a European industry standard classification system consisting of a 6 digit code. The list of all codes can be found at http://ec.europa.eu/comm/competition/mergers/cases/index/nace_all.html 2 In the Terms of Reference the iron and steel production was selected as a sector, but both for the primary and the secondary data gathering it was necessary to extend the scope to NACE 27 Base Metals.

Executive Summary
Sectoral Costs of Environmental Policy 11
Expressed as a percentage of production values, no overall upward or downward trend for the EPE can be recognised in the period 1995 – 2005. Relatively high levels of total EPE are the result of incidental peaks in EPE investments. The same data can be used to compare EU averages with Australia and the United States of America in Figure 3.
Figure 2: Trends in annualised environmental investments as a percentage of gross production value for different sectors within the European Union
Source: based on Eurostat EPE statistics and EUklems
Figure 3: Annualised environmental investments as a percentage of gross production value for different sectors and environmental media for the European Union, Australia and United States of America
Source: based on Eurostat EPE statistics, Euklems (Average 2001-2005), EPA US (1999), and Australia Statistics (2001)
0.0%
0.5%
1.0%
1.5%
2.0%
2.5%
3.0%
1995 1996 1997 1998 1999 2000 2001 2002 2003 2004 2005
% of production value power investm
refineries investm
mining investm
base metals investm
textiles investm
power tot EPE
refineries tot EPE
mining tot EPE
base metals tot EPE
textiles tot EPE
0.00%
0.25%
0.50%
0.75%
1.00%
1.25%
1.50%
1.75%
2.00%
2.25%
2.50%
texti
les E
U
texti
les A
ustra
lia
texti
les US
refin
eries
EU
refin
eries
Aus
tralia
refin
eries
US
base
met
al E
U
base
metal A
ust r
a lia
base
metal U
S
power
EU
power
US
of production value
air water
waste other

Executive Summary
Sectoral Costs of Environmental Policy 12
Oil chain sectors and electricity production: focus on expenditure related to air emissions,
driven by LCP and IPPC, but also ETS For the oil refinery sector, most of the environmental expenditures are attributed to the control of air emissions, both in terms of investments, operating and annualised costs. The control of waste is the second most important environmental expenditure. The time series data available suggests increasing environmental expenditures for this sector. However, it should be mentioned, that this trend is only present until 2005, whereas higher oil prices after 2006 have led to (much) higher gross production values, thus probably decreasing the percentage of environmental protection expenditures. The narrative case study on the oil sector revealed a trend towards more end-of-pipe rather than process-integrated investments, by observing that the refining process itself cannot be fundamentally changed, which therefore limits the scope for process-integrated innovation. This could not be confirmed by the comparative analysis of the reported environmental investments by Member States, showing an increase of integrated investments. Overall, the time period considered is too short to come to a firm conclusion on a trend that might be extrapolated to the near future. An interesting observation is that for a sector with a long track record of more or less harmonised standards at the EU level there still appears to be large differences in costs between Member States according to data from National Statistical Offices. Unfortunately the qualitative nature of the online survey did not allow us to confirm this. It seems that on average, environmental protection expenditures in the EU are somewhat lower than in the US, but higher that in Australia (see Figure 3). But as the data for US and Australia are not recent, and most of the EU data are from 2001-2005, this conclusion is limited. The electricity producing sector is also largely affected by environmental expenditures related to the prevention and control of air emissions, both in terms of investment and operating costs. It seems that the trend of environmental investments in this sector is moving downwards (see Figure 2). An interesting observation is that, integrated investments in this sector are on average at a higher level than the refinery sector. From the narrative case study on this sector, this is explained by the observation that power suppliers answer the need to control emissions by choosing new types of power plants such as the Combined Cycle Gas Turbine. According to Figure 3 the US power industry has on average lower costs than the EU average. For the oil chain sectors and the electricity producers, we identified in our sector reports and case studies the LCP (Large Combustion Plants), and the IPPC Directives to be the key European regulatory drivers of the past years. Our survey, on the other hand, revealed that plants perceive that they are also highly affected by the ETS (Emission Trading Scheme) Directive. Textiles and leather: focus on the water compartment, with IPPC as key driver in the past
years For the textiles and leather industry, pollution control (end-of-pipe) investment expenditure is mainly focused on wastewater followed by air. The investment for pollution prevention (integrated technology) is more evenly spread over the environmental domains with wastewater being the most important. The investments are increasingly dominated by

Executive Summary
Sectoral Costs of Environmental Policy 13
integrated investments. With regard to current expenditure the picture is somewhat different, with dominance of waste. Adding investments and operating costs into annualised costs, water is the dominant environmental domain, followed by waste. Overall, environmental costs are considered as relatively low compared to the other sectors (see Figure 2). There are no strong indications that environmental costs increased greatly during the last ten years, but the focus has shifted from waste and air towards water. According to our data for the textiles sector, environmental expenditures are on average lower in the US and higher in Australia, than in the EU. Looking at the regulatory drivers for this sector, the IPPC Directive is considered as the key driver of the recent years, more than for example the Water Framework Directive and the Waste Framework Directive. The impact of the Dangerous Substances Directive varies considerably among plants. An interesting observation is that sector operators already indicate the REACH Directive as very important with respect to environmental expenditures, although it has only recently come into force (June 2007). Iron and steel: an incomplete picture Neither secondary nor primary data allowed us to obtain a clear picture of environmental expenditures in the iron and steel sector. Only aggregated figures for the entire basic metals sector are available and so no specific conclusions can be drawn for the iron and steel sector. Considering the broader scope of the base metals sector (NACE 27), investment expenditures on the reduction of air emissions dominate. Regarding operating expenditures the picture is somewhat different as next to major protection expenditures in the domains of waste and air, a large amount of money is spent on wastewater protection measures. Both investments and overall annual costs show a relative stable evolution. According to our data for the base metals industry, average environmental expenditures are on average higher in the US and lower in Australia. Out of the selected regulations, the IPPC Directive proves to affect the respondents from the metals industry the most. As an example, Figure 4 presents environmental costs trends for different environmental issues in the Dutch steel sector. To assess the specific environmental costs for the base metal industry in the Netherlands the environmental costs of this sector have been linked to steel production. In the beginning of the 1990s, environmental costs were dominated by expenditures for air (about 75% of total), being a result from high investments for air protection before 1990. After 1990 little to no new environmental investments for air caused the annualised costs to gradually decrease from over € 25 per tonne steel in 1990 to slightly above € 15 per tonne steel in 1997. At the same time, expenditures in other domains became more important, by 1997 covering about 50% of total environmental costs. In the period 1997 – 2000, again large investments have been made for environmental protection, due primarily to air and waste issues. This resulted in a new peak for environmental costs in 2000 (again about €25 per tonne steel). After 2000, costs gradually decreased to about € 20 per tonne steel in 2005 (no high investments in this period).

Executive Summary
Sectoral Costs of Environmental Policy 14
€ 0
€ 5
€ 10
€ 15
€ 20
€ 25
€ 30
1990
1991
1992
1993
1994
1995
1996
1997
1998
1999
2000
2001
2002
2003
2004
2005
per tonne steel
air water soil wastenoise nature other
Figure 4: Environmental expenditures in the base metal industry in € per tonne steel produced, in the Netherlands, 1990 – 2005 (price level 2006)
Environmental expenditures were a minor share of total expenditure in the past, but what brings the future?
Clearly, all sectors show ‘considerable’ environmental expenditure in the past, both in terms of investments and operational expenditure. This resulted in an overall strong track record of environmental improvements in the past for many environmental domains. However, the results of our analyses confirm the general findings of the literature that environmental expenditures do not represent a large component of overall costs being in the order of 0.25 to 2 % of production value (Figures 2 and 3). An indication that other factors than environment will have a larger influence on value added, profits and competitiveness of the sectors studied, is the sometimes quite large differences between the value added as percentage of total gross production. Often these differences are much larger than the observed differences in specific environmental expenditures. However, the responses from the survey indicate that huge differences between firms exist and a surprisingly high number of respondents say that their environmental investments over the past five years were more than 10% of their total investments. An explanation to this can be that environmental costs are considered as expenses that cut profits, and therefore are typically overestimated by respondents. The online survey confirms the conclusion from the comparative analysis of the officially published expenditure data, that environmental concerns, as far as related to investment and operational and maintenance expenditures, have in the near past not affected significantly the competitiveness of the reviewed sectors. To the contrary, the primary data reveal that increased environmental expenditures, and particularly those driven by the LCP and Water Framework Directive, increased a company’s strategic advantage relative to its competitors and allowed them to compete more effectively in the marketplace. This positive effect can be attributed to the improved use of resources as a result of the environmental expenditures. This does however, not guarantee that this will be the case in the future as industry can foresee more stringent controls on the horizon. In particular, operators expressed, for

Executive Summary
Sectoral Costs of Environmental Policy 15
example at our expert workshop of October 2007, their concerns about the upcoming challenges like the review of the NEC and IPPC Directives, the Post-Kyoto commitments, and the REACH Directive.
We are moving towards a level European playing field… The expectation of these upcoming ambitious environmental challenges reinforces the aspiration for a ‘level European playing field’. European sectors and companies argue for this kind of business environment in which all companies in a given market must follow the same rules and are given an equal ability to compete. Although the major share of environmental policy initiatives is nowadays decided at the European level, and despite the existence of a number of international environmental agreements, the implementation of environmental policy is still carried out at the national level. As a consequence, differences exist in the type and rigour of environmental regulation between European countries and regions. But although EU legislation often has to be implemented in the same time framework in all Member States, no such indication of similar investment patterns appears from the analysis. Sometimes large differences in specific environmental expenditures appear between Member States. The analyses did not allow us to clearly explain these differences. As argued before, the variety of availability and the quality of the data is an important issue. Equally important is the confirmation resulting from our study that the decision making process for environmental investments is a complex interplay of many elements. On reflection our analyses revealed a few interesting issues:
− Firstly, over the last five years, the regions where companies/plants are located had a considerable effect on the impact of regulations on unit production costs and benefits from environmental expenditure. Companies in Southern Europe are clearly behind the other regions in terms of environmental expenditures. This confirms that the way in which European Directives have been implemented and can have a clear effect on their impact.
− Secondly, in new Member States larger specific environmental investments were
needed during the past five years than in old Member States, as a result of the need to catch up with European legislative requirements in a relatively short period of time.
− Thirdly the results from the survey, substantiated by the case studies, tend to
suggest that within the European Union we are moving towards a more level playing field in terms of pressures from environmental regulation. Differences on (perceived) environmental expenditure between the different groups of countries appeared to be small. One could argue that the concerns about a level European playing field tend to be more and more substituted by concerns about a level Global playing field.

Executive Summary
Sectoral Costs of Environmental Policy 16
… in an increasingly globalised world
From the on-line survey there are perceived differences in the ambition level of environmental targets when comparing EU and non-EU competitors. The respondents clearly expressed their view that environmental costs have affected their production costs significantly more than their non-EU competitors. An illustrative example was found in the case study for the leather industry where competitive pressures are on the increase from South America countries with few environmental regulations. A problem with this comparison is that data on environmental expenditures between countries are not always comparable (sector (NACE) classification; availability of sufficient data etc..). Moreover, there are no reliable data available to compare with other countries/regions like China or India. Moreover, the analysis of our survey reveals that there is no evidence to suggest that relocation of production activities is a response to environmental regulations. [so there is some evidence? Or do you mean there is no evidence?]. This is in line with the conclusion that environmental expenditure is only a small share of total expenditure. It is quite an interesting result although it should be somewhat qualified. First of all, relocation could have caused the closure of the plant rather than the partial relocation of production activities. Clearly, the effect of plant closures cannot be observed in our sample. The timeframe should also be borne in mind, as the statement refers to relocation in the last five years. In other words, relocation occurring earlier than five years ago is not registered in the sample.
Environmental investments result from a complex interplay of drivers.
Regulation is a key element… According to the primary survey data, three environmental policies - LCP Directive, IPPC Directive and the Waste Framework Directive- had a significant influence on a company’s investment in environmental technologies. The LCP directive and Waste Framework are particularly important in inducing companies to invest in end-of-pipe technologies, while the IPPC Directive significantly increased investments in process integrated technologies. All three policies were important drivers of environmental investment expenditures relative to overall investment expenditures and to the company’s total operating costs. IPPC as key regulatory driver
From the different data sources we learned that the IPPC Directive 96/61/EC is overall considered as the Directive that substantially affects the plants in all selected sectors and as such is a key regulatory driver for recent and current expenditure. This is not a surprise as the Directive had its deadline for implementation for existing installations on October 30, 2007. The influence of the Directive is most probably also one of the explanations why investments have gradually shifted from end-of-pipe towards more process integrated approaches. This conclusion gives some counterweight to the worries the Commission

Executive Summary
Sectoral Costs of Environmental Policy 17
recently expressed about the effect of the implementation of the Directive so far3 and might be an element in the current discussion on the review of the Directive. Role of policy instruments Member States use different policy instruments to enforce the requirements of the European environmental regulation. In this study, we found that the impact of the instrument in place in terms of environmental investments and improvements is influenced more by the context in which it is implemented than by the nature of the instrument. However, the potential divergence in consequences of using different instruments might disturb the level playing field for companies operating in several Member States to some extent. Moreover, companies with facilities in several Member States need to become acquainted with the different instruments (e.g. a trading system, or a bubble permit system) in a particular country, which potentially leads to additional costs. For instruments introduced at a broader level, such as the European Emission Trading System, this potential disadvantage seems smaller, apart from the potential competitiveness effects regarding non-EU competitors. Finally, by the choice of the instrument and its implementation authorities typically cover the requirements of several pieces of legislation at once, or anticipate upcoming challenges. Typical examples are the permit reviews in the light of implementation of the IPPC Review, taking into account the requirements of the NEC (National Emissions Ceilings) Directive and/or the LCP (Large Combustion Plants) Directive. This fosters the call for an integrated Directive on industrial emissions – see below.
… but environmental strategy, an environmental management system and the size of plants are also important
Over the last five years, environmental strategy has also had considerable impact on a company’s activities. It has been an influence on the impacts of environmental regulations, especially when evaluating the technological responses, the investment expenditures and the emissions abatement of the facilities. Strategy has a somewhat smaller influence in the case of resource efficiency, unit production costs and the administrative burden, although it influences, alongside the presence of Environmental Management Systems, the competitive advantage resulting from environmental expenditure. It should be noted that strategy has always had a positive effect on the impact of regulations, i.e. increasing environmental expenditures, increasing emission abatements and increasing responses. Bearing this in mind, policies aimed at increasing the advantages from environmental strategy, e.g. labels for goods produced according to state-of-the-art Best Available Techniques, can contribute to increasing the impact of environmental regulations, and ultimately, deliver emission abatements or increased resource efficiency. The sizes of a facility and its parent company have been important determinants of a facility’s technological responses to environmental regulations, resource efficiency improvements and reductions in operating costs due to these resource efficiency improvements. Larger facilities are typically more inclined to invest in end-of-pipe
3 For example at the IPPC Review Public Hearing in May 2007, see http://ec.europa.eu/environment/ippc/index.htm

Executive Summary
Sectoral Costs of Environmental Policy 18
technologies, to reformulate pre-existing products or to develop new products in response to environmental regulations, while they are less likely to reduce their energy and water consumption and hence their operating costs due these small resource efficiency improvements. The opposite holds for facilities with a larger parent company. Moreover, larger facilities and facilities with larger parent companies perceive that administrative costs and environmental taxes as well as unit production due to environmental policies are smaller compared to their competitors.
Regulation drives the benefits The scope of this study did not allow us to balance the environmental expenditure and costs against the benefits for the companies and the society. However, the statistical analysis of the on-line survey revealed some interesting conclusions regarding the benefits of environmental regulations:
− Firstly, the LCP and Water Framework Directives significantly induced a company to use its resources more efficiently as these policies reduced the energy and water consumption per unit produced. Therefore, it is not surprising that LCP and Water Framework Directive were also effective in reducing the operating cost of the company, and hence its comparative advantage, due to a reduced water and energy consumption.
− Secondly, the improvements in resource efficiency and the resulting decrease in
operating costs differ among sectors. Companies in the oil sector were for example relatively less efficient in reducing its water and energy consumption, while those in the textile and metal sector were relatively more efficient in reducing its energy consumption and the emission of water pollutants.
− Thirdly, while ultimately a European level playing field is desirable, some regional
differences remain important. Companies in northern Europe are for example more effective in reducing its energy consumption, while the opposite holds for companies in southern European. This might signal a more stringent implementation of the policies in Northern, Europe. However, other possible interpretations of this result, such as the societal importance of environmental friendly production activities, should not be neglected. Furthermore, companies whose activities are affected by the LCP, Water or Waste Framework Directives perceive that their administrative costs and unit production costs were considerably higher than those of their competitors within the EU-15 and the New Member States. This suggests that regional differences in the implementation of environmental policies might be present.
Add on effects of legislation exist, but tell a mixed story
In this study, we were not able to identify the separate effects of one Directive on the investment decisions and the expenditures of the companies. The statistical analysis also did not allow us to fully demonstrate add-on effects of implementation of different pieces of legislation. In general, the analysis learned that it is simply not possible to ‘extract’ one driving factor out of the complex interplay of regulation at different levels, implementing policy instruments, business cycles and strategic considerations of companies. The regression models developed on the basis of the on-line survey retained in most cases

Executive Summary
Sectoral Costs of Environmental Policy 19
several explanatory variables, indicating that expenditure and behaviour cannot be explained by a single driver or regulation. Risk of overestimating ex-ante impacts The case studies also provided some interesting insights. The evidence seems to be that the sum of individual environmental policies is less than its constituent parts meaning that synergies exist so that the cumulative burden is less than the sum of the individual policies. The drive for synergies generally is an important element in the negotiations between (local) authorities and companies, e.g. on a permit review. This is particular the case for different regulations affecting one environmental medium (for example, air emissions combining IPPC and NEC requirements in a single permit review). In this respect, one should be very careful in processes assessing the expected effects of (new) regulation, for example in impact assessments. Typically, one considers the stand-alone consequences of a regulation, underestimating the synergetic effects. This could lead to the recommendation to give more weight in this kind of analyses to add-on effects. However, it will be far from straightforward to identify and quantify these effects, as they –once again- largely depend on the complex interplay of implementation. Towards an integrating Framework (Directive) for industrial pollution? From an industry perspective, these add-on effects will be questioned, for a number of possible reasons. First, there are sometimes many environmental regulations that affect their operations, from different perspectives. Second, what appears as add-ons for competent authorities (e.g. IPPC combined with NEC) might be considered as threatening the level playing field for companies who are obliged, for example, to take measures beyond Best Available Techniques to contribute to achieve stringent national emission ceilings. The main point of critique from industry is that Directives with different approaches coexist and may lead to reduced market efficiency. Most notably, the IPPC Directive calls for Europe-wide application of Best Available Techniques for environmental protection, while the European ETS for greenhouse gases, as a market-based instrument, promotes least cost abatement. In this respect, the Water Framework Directive can be considered as a comprehensive or holistic approach as it replaces several older Directives and it sets a framework for Member States to implement. Moreover, a long-running credible timetable with emission thresholds would lower the risk of investment and thus encourage R&D. This leads to the recommendation to further streamline the several Directives affecting industrial emissions (IPPC, LCP, …) into a single framework Directive. To ensure a level European playing field, guidance for national implementation is needed.


Contents
Sectoral Costs of Environmental Policy 21
Contents 1 STUDY PURPOSE AND METHOD............................................................................................. 33
1.1 BACKGROUND INFORMATION .................................................................................................. 33 1.2 OBJECTIVES OF THE STUDY......................................................................................................34 1.3 THE CONCEPTUAL FRAMEWORK............................................................................................... 35 1.4 SOURCES OF INFORMATION......................................................................................................37
1.4.1 Secondary Data on Environmental Expenditures................................................................ 37 1.4.2 Primary survey data........................................................................................................... 43
1.5 METHODOLOGY...................................................................................................................... 47 1.5.1 Sector reports .................................................................................................................... 47 1.5.2 Comparative analysis of the data on environmental expenditure .........................................48 1.5.3 Statistical analysis of the primary data............................................................................... 48 1.5.4 In-depth ‘narrative’ case-studies........................................................................................ 49
2 DRIVERS OF ENVIRONMENTAL EXPENDITURES.............. ................................................ 53
2.1 SECTOR CHARACTERISTICS......................................................................................................53 2.1.1 Electricity .......................................................................................................................... 54 2.1.2 Oil chain............................................................................................................................ 55 2.1.3 Textiles and leather............................................................................................................ 56 2.1.4 Iron and steel..................................................................................................................... 57
2.2 LOCATION CHARACTERISTICS.................................................................................................. 58 2.3 PLANT /COMPANY CHARACTERISTICS........................................................................................ 58 2.4 REGULATION CHARACTERISTICS.............................................................................................. 60 2.5 TECHNOLOGY CHARACTERISTICS............................................................................................. 63
3 QUANTITATIVE ANALYSIS: EMPIRICAL APPROACH AND VARIA BLES....................... 67
3.1 DEPENDENT VARIABLES.......................................................................................................... 67 3.2 INDEPENDENT VARIABLES....................................................................................................... 69
3.2.1 Sectoral variables.............................................................................................................. 70 3.2.2 Location variables ............................................................................................................. 70 3.2.3 Plant/company variables.................................................................................................... 71
3.3 REGULATION VARIABLES ........................................................................................................ 74
4 TECHNOLOGICAL RESPONSES TO ENVIRONMENTAL POLICIES.. ............................... 81
4.1 CONTEXTUAL BACKGROUND ................................................................................................... 81 4.2 EMPIRICAL ANALYSIS OF A FIRM’S INVESTMENT OR RELOCATION DECISION............................... 83
4.2.1 Results and analysis........................................................................................................... 83 4.2.2 Conclusions....................................................................................................................... 87
4.3 CASES-STUDY ON TECHNOLOGICAL RESPONSES FROM THE OIL AND ELECTRICITY SECTORS........ 87
5 ENVIRONMENTAL EXPENDITURES IN RESPONSE TO ENVIRONME NTAL POLICIES93
5.1 CONTEXTUAL BACKGROUND ................................................................................................... 93 5.1.1 Environmental expenditure in general ................................................................................ 93 5.1.2 Environmental taxes, charges and other financial incentives to reduce pollution................. 95
5.2 EMPIRICAL ANALYSIS OF A COMPANY’ S ENVIRONMENTAL EXPENDITURES................................. 96 5.2.1 Introduction....................................................................................................................... 96 5.2.2 Results and analysis........................................................................................................... 97 5.2.3 Conclusions..................................................................................................................... 101
5.3 COMPARATIVE ANALYSIS OF EUROSTAT’S ENVIRONMENTAL PROTECTION EXPENDITURES........ 101 5.3.1 Data ................................................................................................................................ 101 5.3.2 Analysis........................................................................................................................... 102
5.4 COMPARATIVE ANALYSIS OF SECTORAL ENVIRONMENTAL EXPENDITURE AT THE LEVEL OF
MEMBER STATES................................................................................................................................ 105 5.4.1 Data ................................................................................................................................ 105 5.4.2 Extraction (mining) (NACE 11)........................................................................................ 109 5.4.3 Textiles and leather (NACE 17-19)................................................................................... 111 5.4.4 Oil refineries (NACE 23).................................................................................................. 115 5.4.5 Base metal (NACE 27) ..................................................................................................... 118

Contents
Sectoral Costs of Environmental Policy 22
5.4.6 Electricity (NACE 40) ...................................................................................................... 122 5.4.7 Structure of environmental expenditures: internal and external environmental expenditures 126 5.4.8 Conclusions of the comparative analysis .......................................................................... 128
6 ECONOMIC CONSEQUENCES OF ENVIRONMENTAL POLICIES.... ............................... 133
6.1 CONTEXTUAL BACKGROUND ................................................................................................. 133 6.2 EMPIRICAL ANALYSIS OF THE ECONOMIC CONSEQUENCES OF ENVIRONMENTAL POLICIES......... 137
6.2.1 Independent variables...................................................................................................... 138 6.2.2 Results and analysis......................................................................................................... 141 6.2.3 Conclusions..................................................................................................................... 152
6.3 CASE STUDY ON IMPACT ON COMPETITIVENESS - THE LEATHER INDUSTRY............................... 153
7 ENVIRONMENTAL CONSEQUENCES OF ENVIRONMENTAL POLICIE S...................... 157
7.1 CONTEXTUAL BACKGROUND ................................................................................................. 157 7.2 EMPIRICAL ANALYSIS OF THE ENVIRONMENTAL CONSEQUENCES OF ENVIRONMENTAL POLICIES
159 7.2.1 Introduction..................................................................................................................... 159 7.2.2 Results and analysis......................................................................................................... 160 7.2.3 Conclusions..................................................................................................................... 163
8 CONCLUSIONS AND RECOMMENDATIONS.......................................................................167
8.1 CONCLUSIONS....................................................................................................................... 167 8.2 RECOMMENDATIONS............................................................................................................. 172
9 BIBLIOGRAPHY ....................................................................................................................... 174

List of figures
Sectoral Costs of Environmental Policy 23
LIST OF FIGURES Figure 1: Distribution of the respondents over geographical groups and sectors..............9 Figure 2: Trends in annualised environmental investments as a percentage of gross
production value for different sectors within the European Union...........................11 Figure 3: Annualised environmental investments as a percentage of gross production
value for different sectors and environmental media for the European Union, Australia and United States of America...................................................................11
Figure 4: Environmental expenditures in the base metal industry in € per tonne steel produced, in the Netherlands, 1990 – 2005 (price level 2006).................................14
Figure 5: Simplified flow from legislation to costs and benefits.......................................36 Figure 6: Underlying model for the analysis...................................................................37 Figure 7: Distribution of respondents over the sectors....................................................46 Figure 8: Distribution of the respondents over geographical groups and sectors............47 Figure 9: Distribution of the number of employees.........................................................72 Figure 10: Different types of innovative responses to environmental regulation..............81 Figure 11: Significant investments in end-of-pipe and process integrated investment in
response to the introduction of environmental regulations.......................................84 Figure 12: Responses. Relative importance index for the regression related to the
facilities’ responses to the introduction of environmental regulations......................86 Figure 13: Quantitative assessment of environmental expenditure by respondents..........98 Figure 14: Expenditure. Relative importance index for the regression related to the
facilities’ environmental investments and operating costs...................................... 101 Figure 15: Number of minimal and maximal observations available at Eurostat databases
on environmental protection investments in Member States................................... 102 Figure 16: Environmental Protection Expenditures (EPE), average for the EU, 1995 –
2005 (investments) and 2001 – 2005 (total EPE), as % of total sectoral production value, based on Eurostat EPE and EU klems......................................................... 103
Figure 17: Integrated investments as percentage of total environmental protection investments, EU weighted average, based on Eurostat EPE.................................. 104
Figure 18: Annualised environmental expenditures as percentage of gross production value for different sectors and per environmental domain for the European Union, Australia and United States of America................................................................. 105
Figure 19: Annual environmental investments in the mining sector, as % of production value, 2001 – 2004................................................................................................ 109
Figure 20: Annualised environmental expenditures in the extraction sector, per environmental domain, as % of gross production value and as % of value added, latest year available.............................................................................................. 110
Figure 21: Environmental expenditures per tonne oil-equivalent in the Netherlands, 1990 – 2005 (price level 2006)....................................................................................... 110
Figure 22: Annual environmental investments in the textile industry, as % of production value, 2001 – 2005................................................................................................ 112
Figure 23: Annual environmental investments in the textile industry, per environmental domain, end-of-pipe and integrated, as % of production value, 2001 – 2005......... 113
Figure 24: Annualised environmental expenditures in the textiles industry, per environmental domain, as % of gross production value and as % of value added, latest year available.............................................................................................. 114
Figure 25: Environmental expenditures in the textiles industry, per 1000 € gross production value, in the Netherlands. 1990 – 2005 (price level 2006)................... 115

List of figures
Sectoral Costs of Environmental Policy 24
Figure 26: Annual environmental investments in the oil refining industry, in € per tonne oil refined, 2001 – 2005........................................................................................ 115
Figure 27: Annual environmental investments in the oil refining industry, per environmental domain, end-of-pipe and integrated in € per tonne oil refined 2001 – 2005...................................................................................................................... 116
Figure 28: Annualised environmental expenditures in the oil refining industry, per environmental domain. in € per tonne oil refined, latest year available................. 117
Figure 29: Environmental expenditures in the oil refining industry in € per tonne oil refined, in the Netherlands, 1990 – 2005 (price level 2006)................................... 118
Figure 30: Annual environmental investments in the base metal and metal products industry as % of gross production value, 2001 – 2005........................................... 119
Figure 31: Annual environmental investments in the base metal and metal products industry, per environmental domain, end-of-pipe and integrated, as % of gross production value, 2001 – 2005.............................................................................. 120
Figure 32: Annualised environmental expenditures in the base metal and metal products industry, per environmental domain as % of gross production value and as % of value added, latest year available......................................................................... 121
Figure 33: Environmental expenditures in the base metal industry in € per tonne steel produced, in the Netherlands, 1990 – 2005 (price level 2006)............................... 122
Figure 34: Annual environmental investments in the electricity sector, in € per MWh produced, 2001 – 2005.......................................................................................... 123
Figure 35: Annual environmental investments in electricity sector, per environmental domain, end-of-pipe and integrated, in € per MWh produced, 2001 – 2005........... 124
Figure 36: Annualised environmental expenditures in the electricity sector, per environmental domain in € per MWh produced, latest year available.................... 125
Figure 37: Environmental expenditures in the electricity sector. in € per MWh produced, in the Netherlands, 1990 – 2005 (price level 2006)................................................ 126
Figure 38: Total annual environmental costs (for NACE 11-41), divided in internal and external costs, the Netherlands (current prices)..................................................... 127
Figure 39: Share of environmental costs in value added of manufacturing industries, the Netherlands........................................................................................................... 128
Figure 40: Potential economic pathways and consequences due to environmental regulation............................................................................................................. 133
Figure 41: Impacts of environmental expenditure on efficiency in water consumption.. 142 Figure 42: Efficiency due to environmental expenditure Relative importance index for the
regression related to the facilities’ reduction in the level of energy and water consumption, and waste generation per unit of output caused by environmental expenditure........................................................................................................... 143
Figure 43: Efficiency. Relative importance index for the regression related to the facilities’ reduction in the level of energy and water consumption, and waste generation per unit of output................................................................................. 145
Figure 44: Benefits of environmental expenditure. Relative importance index for the regression related to the facilities’ competitive advantages caused by environmental expenditures and the reductions in operating costs per unit output caused by a reduction in energy and water consumption.......................................................... 147
Figure 45: Unit Production Costs. Relative importance index for the regression related to the changes in the facilities’ unit production costs due to environmental regulations.............................................................................................................................. 149
Figure 46: Administrative burden related to environmental policy compared to producers a) in the EU-15. b) in the new Member States and c) outside of the EU................. 150

List of figures
Sectoral Costs of Environmental Policy 25
Figure 47: Administrative and Tax Burden. Relative importance index for the regression related to the facilities’ benefits from environmental expenditure.......................... 152
Figure 48: Presence of a significant per unit reduction in a) greenhouse gas emissions. b) other air pollutant emissions and c) water pollutant emissions.............................. 161
Figure 49: Emissions. Relative importance index for the regressions related to the facilities’ level of emissions of GHG, water pollutants and other air pollutants per unit of output......................................................................................................... 163

List of tables
LIST OF TABLES Table 1: Main variables of the questionnaire and calculation of Expenditure I and II.....39 Table 2: Producer related sector disaggregation in the JQ.............................................40 Table 3: Example of data availability for Eurostat’s SBS data on the manufacture of
textile and textile products (2001-2004)..................................................................41 Table 4: Number of companies in the selected countries and industries..........................44 Table 5: Dependent variables used in this study..............................................................68 Table 6: Independent variables used in this study...........................................................70 Table 7: Selected regulations per sector.........................................................................75 Table 8: Technological responses to the introduction of environmental regulations in the
last five year............................................................................................................86 Table 9: Overview of magnitude of environmental expenditure.......................................94 Table 10: Overview of magnitude of environmental expenditure in specific sectors.........95 Table 11: Expenditure. Magnitude of environmental investments and operating costs
compared to total investments and operating costs over the past five years........... 100 Table 12: Data available from statistical offices on environmental expenditures by type of
domain.................................................................................................................. 106 Table 13: Data available from statistical offices on environmental expenditures by years
and category of expenditure.................................................................................. 107 Table 14: Data available from statistical offices on environmental expenditures by NACE
sector.................................................................................................................... 108 Table 15: Efficiency due to environmental expenditure. Reductions in the level of energy
and water consumption, and waste generation per unit of output caused by environmental expenditure over the last five years................................................ 143
Table 16: Efficiency. Reductions in the level of energy and water consumption and waste generation per unit of output over the last five years............................................. 145
Table 17: Benefits of environmental expenditure........................................................... 147 Table 18: Unit Production Costs. Change in the facility’s unit production costs due to
environmental regulations over the past five years relative to facilities in the EU-15, in the EU new Member States and outside the EU................................................. 149
Table 19: Administrative and Tax Burden. Size of administrative burden and environmental taxes compared to producers located in the EU-15, in the EU new Member States and outside the EU over the last five years.................................... 151
Table 20: Emissions. Reduction in the facilities’ level of emissions of GHG, water pollutants and other air pollutants per unit of output over the past five years........ 162

List of boxes
Sectoral Costs of Environmental Policy 27
LIST OF BOXES Box 1: Case study on the role of policy instruments........................................................61 Box 2: Questions related to the facilities’ environmental strategy, pro-active
environmental attitude, and autonomy.....................................................................73 Box 3: Statements related to the facilities’ responses to environmental regulations.........83 Box 4: Statements related to the facilities’ environmental expenditure............................97 Box 5: Statements related to the facilities’ resource efficiency caused by environmental
expenditure........................................................................................................... 138 Box 6: Statements related to the facilities’ resource efficiency...................................... 139 Box 7: Statements related to the facilities’ competitive advantage and reductions in unit
production costs caused by resource efficiency improvements............................... 140 Box 8: Statements related to the impact of environmental regulations facilities’ unit
production costs.................................................................................................... 140 Box 9: Statements related to the facilities’ administrative burden and environmental taxes
............................................................................................................................. 141 Box 10: Statements related to the facilities’ emissions...................................................159


Acronyms
Sectoral Costs of Environmental Policy 29
ACRONYMS BAT Best Available Techniques BE Belgium BREF BAT Reference document CAC Command and Control CAPEX Capital Expenditure CBS Central Bureau of Statistics CCGT Combined Cycle Gas Turbine CEC Council of the European Communities CEPA Classification of Environmental Protection Activities and Expenditure CCS Carbon Capture and Storage CH4 Methane CHP Combined Heat and Power plant CO2 Carbon dioxide COMAH Control of Major Accident Hazards DEFRA UK Department for Environment, Food and Rural Affairs DG Directorate General EBRD European Bank for Reconstruction and Development EC European Commission EFTA European Free Trade Association EIPPCB European IPPC Bureau EMAS Eco-Management and Audit Scheme EMS Environmental Management System EPA US Environmental Protection Agency EPEA Environmental Protection Expenditure Account EPE Environmental Protection Expenditure EPER European Pollutant Emission Register E-PRTR European Pollutant Release Transfer Register ETS Emission Trading Scheme EU European Union EUR Euro FAO Food and Agriculture Organisation of the United Nations FYR Former Yugoslav Republic GATT General Agreement on Tariffs and Trade GDP Gross Domestic Product GHG Greenhouse Gas IA Impact Assessment IEA International Energy Agency IISI International Iron and Steel Institute IPP Integrated Product Policy IPPC Integrated Pollution Prevention and Control ISO International Standards Organisation JQ Joint Questionnaire LCP Large Combustion Plant LRTAP UNECE Convention on Long-Range Transboundary Air Pollution MNP Milieu- en Natuurplanbureau MS Member State MW/GW Mega/Gigawatt MWh/GWh Mega/Gigawatt hour N Nitrogen NACE Nomenclature générale des Activités économiques dans les Communautés
Européennes NEC National Emissions Ceilings

Acronyms
Sectoral Costs of Environmental Policy 30
NH3 Ammonia NSO National Statistics Office NOX Nitrogen oxides NVAS Net Value At Stake OECD Organisation for Economic Co-operation and Development OPEX Operational Expenditure P Phosphorous PHS Priority Hazardous Substances PS Priority Substances R&D Research and Development REACH Registration, Evaluation, Authorisation and Restriction of Chemical substances RIVM Rijksinstituut voor Volksgezondheid en Milieu SBS Structural Business Statistics SO2 Sulphur dioxide UK United Kingdom UN United Nations US United States of America VOC Volatile Organic Compound VROM Dutch Ministry of Housing, Spatial Planning and the Environment WFD Water Framework Directive

Chapter 1:
Study purpose and method
This chapter introduces the main objectives of this study and presents the methodology. The overall aim of the study is to paint a clearer picture of the impact of environmental policy in some of the industrial sectors most affected by environmental policy, taking into account the differences between sectors and Member States.


Study purpose and method
Sectoral Costs of Environmental Policy 33
1 STUDY PURPOSE AND METHOD
1.1 Background information Sectoral costs as the link between environmental regulation and competitiveness In recent years some people have perceived a growing tension between the “Lisbon Agenda” of increased competitiveness, economic growth and job creation, and the “Gothenburg Agenda” of sustainable development. Although it is often argued that the two need not be mutually exclusive, but can indeed be supportive, there is also a perception that environmental regulation places an excessive burden on European industries, thereby stifling growth and damaging the competitiveness of European companies in an increasingly globalised market place. Although the major share of environmental policy initiatives is nowadays decided at the European level, and despite the existence of a number of international environmental agreements, the implementation of environmental policy is still carried out at the national level. As a consequence, differences exist in the type and rigour of environmental regulation between European countries and regions. The difference is more pronounced between European and non-European countries, which are not part of the same regulatory framework. This gives rise to a concern about how environmental regulation impacts on environmental expenditure and so on competitiveness. In particular, it is often argued that ambitious environmental regulation is bad for competitiveness because it raises costs. On the other hand, it is also argued that a well thought-out set of environmental policies, giving sufficient flexibility and setting the right incentives, can make an active contribution to European competitiveness by encouraging eco-efficient innovations that will give European companies a competitive edge in (future) markets.4 The issue of environment and economic competitiveness continues to attract attention at the EU level. The Lisbon Agenda’s national simplification plans, for example, seek to reduce regulatory burdens on industry. In a similar vein, a recent report funded by DG Enterprise and Industry gives 76 examples of good practices to follow to reduce the costs of environmental regulation to business (EC, 2006k). Ex-ante versus ex-post costs assessments Since 2002 EU policy proposals are subject to an impact assessment procedure. One of the elements of this procedure is to provide an ex-ante assessment of costs and benefits. If the ex-post costs are lower than originally estimated it may indicate that the environmental ambition could have been higher. If compliance costs are ex-ante expected to be higher than will actually be the case in practice, the ex-ante cost-benefit test may lead to a decision not to proceed with the policy change, whereas knowledge of the actual costs that would have arisen would have led to the opposite decision. Alternatively, higher ex-post costs than predicted may have adverse effects on business competitiveness. Overall, if the perception builds up that environmental policies are excessively burdensome and
4 See for example. the initiative “Clean, Clever, Competitive” that was launched under the Dutch EU presidency in 2004, http://www.cleanclevercompetitive.com

Study purpose and method
Sectoral Costs of Environmental Policy 34
economically damaging, it may become difficult to make any progress in environmental policy. Compliance cost estimates are therefore critical inputs to the appraisal (Impact Assessment) of the regulatory change, and the associated political process. In so far as compliance costs can never be known with absolute certainty, it becomes a matter of managing uncertainty and understanding the probability of alternative cost outcomes. A better understanding of the potential biases in the cost estimation process offers the prospect of improved efficiency (lower costs, reduced uncertainty) of regulation. A particular methodological difficulty stems from the recent move towards more flexible and integrated environmental regulation, which relies increasingly on market-based instruments, mainstreaming, cooperative agreements and the like. While such instruments are generally regarded as more efficient they make it hard to identify and measure the costs of environmental regulation. Ironically, the costs of environmental regulation are easiest to measure for old-school “end-of-pipe” measures such as scrubbers on power plants. By contrast, if environmental considerations are integrated into the planning and design phase of an industrial installation, it may be virtually impossible to distinguish between environmentally minded design decisions, and those that are borne out of technical necessities or economic considerations.
1.2 Objectives of the study Within this general context, DG Environment of the European Commission has launched a study on the 'Sectoral costs of environmental policy'. The overall aim of the study is to obtain a clearer picture of the impact of environmental policy in some of the industrial sectors most affected by environmental policy, taking into account the differences between sectors and Member States. Previous studies mainly focussed on the individual impact of one Directive, but in this study we will assess the cumulative costs attributable to the environmental policy in its entirety and attempt to identify synergies between individual policies. So, is the sum of the costs of individual environmental policies more or less than its constituent parts? The project has the following main objectives:
- paint a clearer picture of the environmental costs for the selected industries; - indicate the differences in costs between individual companies; - indicate the differences in costs between Member States; - demonstrate the drivers for environmental expenditures of the companies and
differences between sectors and Member States; - describe different types of environmental regulation (policy instruments) and their
impact on environmental expenditures; - evaluate the environmental performance of the industries and differences between
companies/Member States; - collect evidence for the impacts of environmental regulation (and associated costs)
on the competitiveness of companies; and, - carry out an international comparison.

Study purpose and method
Sectoral Costs of Environmental Policy 35
The sectors selected are: - oil supply chain; - electricity production; - steel industry; and - textile and leather industry.
In the remaining of the chapter we will first discuss the conceptual framework used to investigate the impact of environmental policy in these industrial sectors. Next, we will describe the data and methodology used in this study.
1.3 The conceptual framework The conceptual diagram in Figure 5 indicates the ‘flow’ from environmental legislation to costs and benefits for companies. Sectors are influenced by legislation through a number of ways: (i) Directly by legislative initiatives and environmental programmes originating from
the European Union or from international bodies, such as the United Nations; (ii) Although many EU environmental Directives and regulations5 encourage
minimum standards in terms of emissions, discharges and by product controls, it is the role of the Member States to enforce these standards via their relevant authorities;
(iii) Next to or in response to the transposition of EU legislative requirements, Member States take country or region specific legislative initiatives. Clearly, there are EU wide differences because of country specific implementation and interpretation. While different nations/regions may have similar objectives in improving air pollution, they may set out to reach these objectives using different types of policies – for example with sectoral emission limits, or air quality limit value taxes;
(iv) In many cases, this leads to sector specific requirements; (v) Clearly, the practical effect is on individual companies within the affected sectors.
Although there are EU and nationally agreed limits in place for certain pollutants, the limits stipulated will differ widely across companies due to production levels, local circumstances, ... Companies try to respond to the requirements, e.g. by investing in technology, management systems, etc. These compliance activities create costs and (non)-financial benefits.
As an example, the implementation of the IPPC Directive 96/61/EC can conceptually be separated in three subsequent steps: (i) the legal transposition and anchoring in Member States’ law, (ii) the application in national regulatory regimes and, (iii) the delivery of the permitting process. Although the IPPC information exchange process typically results in BAT associated emission levels for the whole EU, the limits and conditions stipulated within permits differ (widely) across companies due to production levels, installed equipment and local conditions.
5 Directives are converted into national law by the Member States, to be incorporated into the national legal context. Regulations are directly applicable in each Member State.

Study purpose and method
Sectoral Costs of Environmental Policy 36
Figure 5: Simplified flow from legislation to costs and benefits
Figure 5 provides a schematic representation of the model that underlies the analysis. The effects of environmental regulation – in terms of the responses of producers and the associated costs of these responses (environmental expenditure) – are determined by the interaction of: a) the characteristics of the regulation itself (e.g. the ambition of its objective, the
flexibility of the implementation mechanism, the stringency of enforcement, etc.); b) the resources available to the company (firm) or plant (facility) (e.g. management,
technical, financial, information, etc.); and, c) the technological options that are available and their respective stages in the
“innovation process”. The economic consequences or economic impacts – in terms of profitability, competitiveness, etc. – are determined by the scale of the environmental expenditures and the market characteristics, which determine the extent to which costs can be passed on to
Environmental legislation and policy instruments: - International (e.g. Kyoto protocol) - EU (e.g. NEC)
National/regional compliance - transposing Directives - plans, instruments, ...
Specific national/regional legislation
Sectors e.g. division of emission ceilings
Companies
Costs and benefits
Techniques: - management systems - technology

Study purpose and method
Sectoral Costs of Environmental Policy 37
suppliers and/or customers. The external consequences (external benefits) – in terms of health and environmental benefits – are determined by the (technological) responses to the regulation. The conceptual model in Figure 6 is made operational (for analysis purposes) by identifying a series of “proxy” variables for the antecedents / drivers, effects and consequences, for which data is collected via an online questionnaire. This model is also the basis for the structure of the report.
Figure 6: Underlying model for the analysis
1.4 Sources of information
To address the research questions, different analyses are carried out, using a number of data sources. There were five main sources of information: (i) literature review; (ii) secondary data on environmental expenditure (cf. Eurostat, OECD); (iii) primary data gathered through an on-line survey; (iv) the outcome of an expert workshop of October 11, 2007; and, (v) direct interviews with stakeholders.
1.4.1 Secondary Data on Environmental Expenditures In preparation to the gathering of primary data we asses the availability of data on environmental expenditure on an international level.
Antecedents / drivers
Plant / company characteristics
Regulation characteristics
Technology characteristics
Sector characteristics
Effects
Responses Environmental expenditure
Consequences
Economic impacts
External benefits

Study purpose and method
Sectoral Costs of Environmental Policy 38
a) Background Council Regulation 58/97 of December 1996 on Structural Business Statistics (SBS) is the main legal framework for collecting business statistics. The data is collected and reported to Eurostat by the statistical services in the member countries. National methodologies differ between Member States and comparisons over time and across countries are sometimes limited by methodological factors. Non confidential national and EU data are released at the finest possible level of detail. Yet the general principle “the higher the level of aggregation (the more aggregated the data), the better the quality” applies to SBS. Detailed data for small countries have to be used with a certain caution (Eurostat, 2007c).
The data reported under the SBS Regulation is supplemented by the data collected by means of the Joint OECD/Eurostat Questionnaire (JQ) on Environmental Protection Expenditure and Revenues (Eurostat, 2005b). As with the SBS, the National statistical services collect the data and complete the JQ with the aggregated data.
b) Variables
The variables on environmental expenditure included in the SBS Regulation are: a) 21 11 0: Investment in equipment and plant for pollution control, and special anti-
pollution accessories (mainly end-of-pipe equipment) (annual compilation); b) 21 12 0: Investment in equipment and plant linked to cleaner technology
(‘integrated technology’) (annual compilation); c) 21 14 0: Total current expenditure on environmental protection (triennial
compilation). The SBS series on environmental protection expenditure in industry are closely related to other SBS domains since they are collected in the same framework. This means that the environmental expenditure data can be related to other SBS variables such as turnover, value added and production value. The JQ distinguishes two expenditure concepts:
- Expenditure I according to the abater principle comprises all expenditure (either capital or current) for a given sector or economic unit on the environmental activities it undertakes;
- Expenditure II according to the financing principle corresponds to what they contribute to overall environmental protection activities, whatever the unit that executes them.
The Questionnaire includes six main economic variables described in Table 1.

Study purpose and method
Sectoral Costs of Environmental Policy 39
Table 1: Main variables of the questionnaire and calculation of Expenditure I and II
( A ) INVESTMENT EXPENDITURES ( = A1 + A2 )
( A1 ) End-of-pipe investments ( A2 ) Investments in integrated technologies
( B ) TOTAL CURRENT EXPENDITURE ( = B1 + B2 ) ( B1 ) Internal current expenditure (1) Excluding all payments for bought services ( B2 ) Fees / purchases (2) Paid to other sectors. Includes all payments for bought services - of which to Public sector
( C ) RECEIPTS FROM BY-PRODUCTS ( D ) SUBSIDIES/TRANSFERS (3) Received from the public sector EXPENDITURE I ( = A + B1 - C ) EXPENDITURE II ( = EXP I + B2 - D )
In the Industry Data Collection Handbook (Eurostat, 2005a), further details can be found on:
- the definitions of environmental protection expenditure, environmental protection investment and current expenditure on environmental protection;
- the data collection methodology; and, - the presentation and the interpretation of results.
c) Environmental domains
The three variables included in the SBS Regulation are broken down into four environmental domains:
- protection of ambient air and climate; - waste-water management; - waste management; and, - other environmental protection activities (including soil & groundwater, noise,
biodiversity & landscape, protection against radiation, R&D, general environmental administration and management)
In the JQ Environmental expenditure data is collected on a more detailed level of environmental domains:
- air; - wastewater; - waste; - soil & groundwater; - noise; - biodiversity & landscape; and, - other (protection against radiation, R&D, general environmental administration
and management, and others).
d) Coverage of economic sectors The three variables included in the SBS Regulation are broken down by (Eurostat, 2005b):
- a total of 29 industry groupings (NACE 2-digit level, division), covering mining and quarrying, manufacturing, energy and water supply (NACE 10-41, excluding 37);
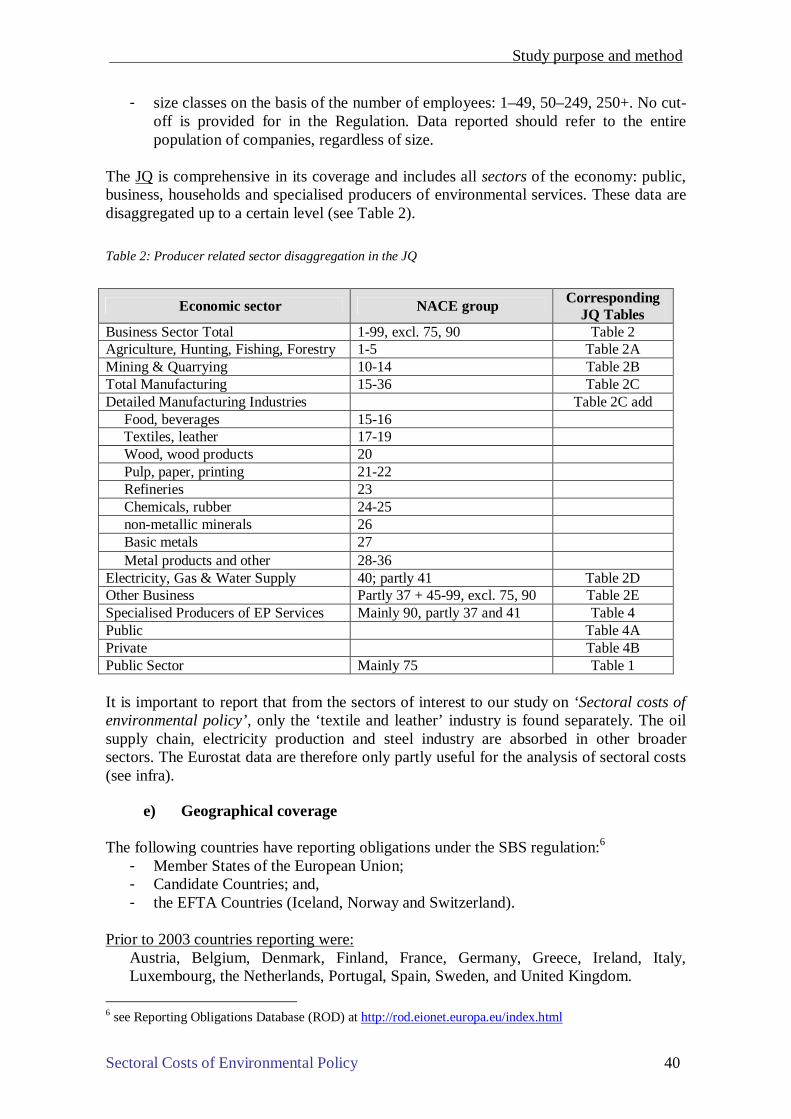
Study purpose and method
Sectoral Costs of Environmental Policy 40
- size classes on the basis of the number of employees: 1–49, 50–249, 250+. No cut-off is provided for in the Regulation. Data reported should refer to the entire population of companies, regardless of size.
The JQ is comprehensive in its coverage and includes all sectors of the economy: public, business, households and specialised producers of environmental services. These data are disaggregated up to a certain level (see Table 2).
Table 2: Producer related sector disaggregation in the JQ
Economic sector NACE group Corresponding JQ Tables
Business Sector Total 1-99, excl. 75, 90 Table 2 Agriculture, Hunting, Fishing, Forestry 1-5 Table 2A Mining & Quarrying 10-14 Table 2B Total Manufacturing 15-36 Table 2C Detailed Manufacturing Industries Table 2C add Food, beverages 15-16 Textiles, leather 17-19 Wood, wood products 20 Pulp, paper, printing 21-22 Refineries 23 Chemicals, rubber 24-25 non-metallic minerals 26 Basic metals 27 Metal products and other 28-36 Electricity, Gas & Water Supply 40; partly 41 Table 2D Other Business Partly 37 + 45-99, excl. 75, 90 Table 2E Specialised Producers of EP Services Mainly 90, partly 37 and 41 Table 4 Public Table 4A Private Table 4B Public Sector Mainly 75 Table 1 It is important to report that from the sectors of interest to our study on ‘Sectoral costs of environmental policy’, only the ‘textile and leather’ industry is found separately. The oil supply chain, electricity production and steel industry are absorbed in other broader sectors. The Eurostat data are therefore only partly useful for the analysis of sectoral costs (see infra).
e) Geographical coverage The following countries have reporting obligations under the SBS regulation:6
- Member States of the European Union; - Candidate Countries; and, - the EFTA Countries (Iceland, Norway and Switzerland).
Prior to 2003 countries reporting were:
Austria, Belgium, Denmark, Finland, France, Germany, Greece, Ireland, Italy, Luxembourg, the Netherlands, Portugal, Spain, Sweden, and United Kingdom.
6 see Reporting Obligations Database (ROD) at http://rod.eionet.europa.eu/index.html
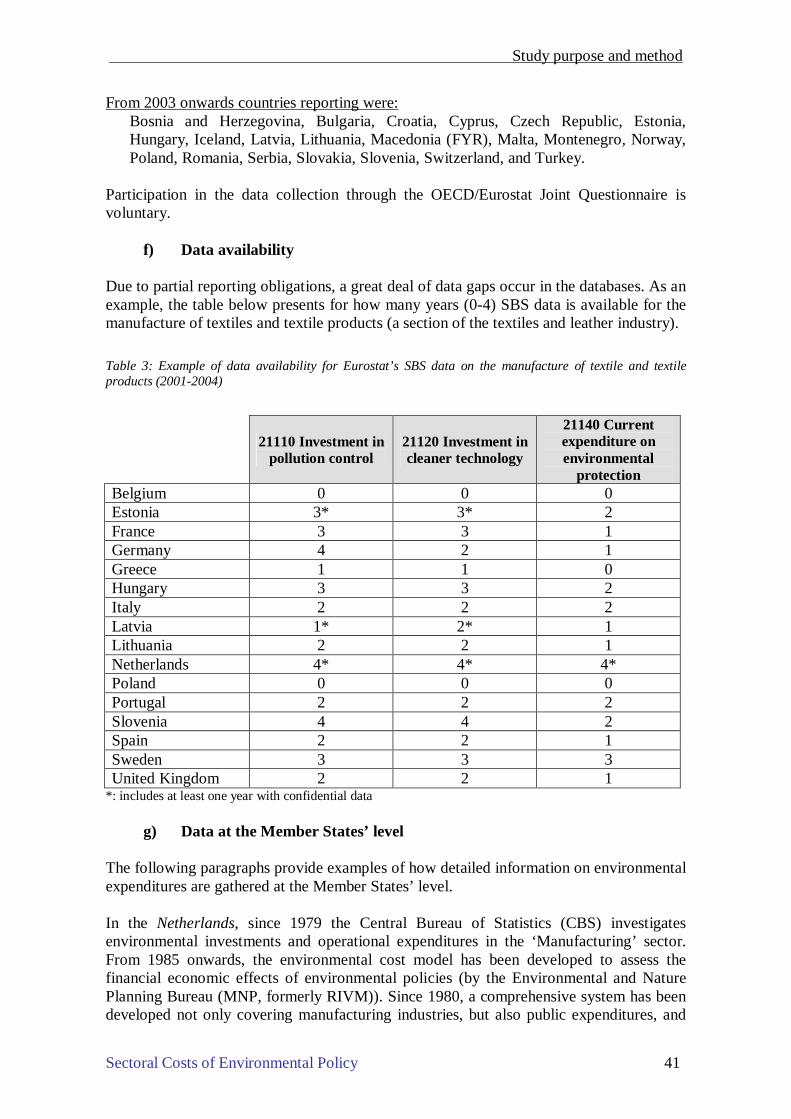
Study purpose and method
Sectoral Costs of Environmental Policy 41
From 2003 onwards countries reporting were: Bosnia and Herzegovina, Bulgaria, Croatia, Cyprus, Czech Republic, Estonia, Hungary, Iceland, Latvia, Lithuania, Macedonia (FYR), Malta, Montenegro, Norway, Poland, Romania, Serbia, Slovakia, Slovenia, Switzerland, and Turkey.
Participation in the data collection through the OECD/Eurostat Joint Questionnaire is voluntary.
f) Data availability Due to partial reporting obligations, a great deal of data gaps occur in the databases. As an example, the table below presents for how many years (0-4) SBS data is available for the manufacture of textiles and textile products (a section of the textiles and leather industry).
Table 3: Example of data availability for Eurostat’s SBS data on the manufacture of textile and textile products (2001-2004)
21110 Investment in pollution control
21120 Investment in cleaner technology
21140 Current expenditure on environmental
protection Belgium 0 0 0 Estonia 3* 3* 2 France 3 3 1 Germany 4 2 1 Greece 1 1 0 Hungary 3 3 2 Italy 2 2 2 Latvia 1* 2* 1 Lithuania 2 2 1 Netherlands 4* 4* 4* Poland 0 0 0 Portugal 2 2 2 Slovenia 4 4 2 Spain 2 2 1 Sweden 3 3 3 United Kingdom 2 2 1
*: includes at least one year with confidential data
g) Data at the Member States’ level The following paragraphs provide examples of how detailed information on environmental expenditures are gathered at the Member States’ level. In the Netherlands, since 1979 the Central Bureau of Statistics (CBS) investigates environmental investments and operational expenditures in the ‘Manufacturing’ sector. From 1985 onwards, the environmental cost model has been developed to assess the financial economic effects of environmental policies (by the Environmental and Nature Planning Bureau (MNP, formerly RIVM)). Since 1980, a comprehensive system has been developed not only covering manufacturing industries, but also public expenditures, and

Study purpose and method
Sectoral Costs of Environmental Policy 42
expenditures of agriculture, the transport sector, the services sectors and households. The annual updates include also the way in which expenditures are financed (through transfers between, for example, industry and waste contractors or households and water sanitation companies and municipalities) giving insight in the development of the real burden of environmental legislation to the different sectors of society. Also other subdivisions are possible such as costs per environmental domain, making detailed analysis of cost developments within sectors feasible. In Germany, the environmental expenditures by public authorities, privatised public companies and private companies are reported as part of the national system of environmental accounts (‘umweltökonomische Gesamtrechnungen’). In Belgium, a survey on environmental investments has been conducted since 1995. This survey is conceived as an annex to the Structural Business Survey covering broad economic aspects and issues. Since 2002, the Structural Business Survey system changed, so that most companies are now obliged to send their balance data to the National Bank (Centre for Balances). The National Statistical Institute receives the administrative file and covers the “gaps” (smallest companies and environmental variables) by sending out a questionnaire. The data on environmental investments (end-of-pipe and process-integrated) and current expenditure are extrapolated to the entire statistical population of about 700 000 companies. In the United Kingdom, an annual survey of environmental protection expenditure by industry has been undertaken since 1997.7 Data is collected by a voluntary postal survey, which is sent to a stratified random sample of 8 155 companies. In the latest survey (in 2004), the number of validated responses was 1 493; representing a response rate of 18.3%. The survey collects information on operating expenditure and capital expenditure, broken down by the media affected; resultant cost savings and income from by-products; use of environmental reporting systems. The survey data is grossed-up and reported at the NACE-2 sector level.8 Statistics Sweden each year conducts a survey of environmental protection expenditures within the industrial sector. Companies are held responsible to submit information about environmental protection expenditure. The work with environmental protection expenditures within the public sector is still under development. The current survey method is in place since 2001 and collects information about:
- pollution treatment investments in air, water, waste and other; - pollution prevention investments in air, water, waste and other; - economising with natural resources; - current expenditure on environmental protection:
� operations, maintenance, inspection and control (air, water, waste and other); � general environmental administration, education and training, information,
etc.; � research and development, of which; � staff expenditure for environmental protection.
7 Although the survey was not undertaken in 1998. 8 Information on cost savings and income are reported at a higher level of aggregation for some sectors.

Study purpose and method
Sectoral Costs of Environmental Policy 43
Although Sweden reports data to Eurostat from enterprises with a number of employees from 1 up as required, the national requirements and thus the national database only include enterprises from 20 employees and up.
1.4.2 Primary survey data The following paragraphs describe how we built up our own questionnaire (included as an Annex) to gather primary data at the level of plants (facilities).
a) General approach The analyses are based on categorical response data, gathered from an on-line survey. This data is of two general types. Respondents were asked to choose between a number of pre-defined categories or options. For example:
From the following five options, please indicate which most closely represents your average annual investment expenditure on environmental protection as a percentage of total investment expenditure over the past five years:
less than 1%
1% -5%
5% - 10%
10% - 20%
more than 20% Alternatively, they were asked to indicate the extent to which they agree with a series of statements using a 5 or 7-point Likert scale. For example:
Please indicate on a scale of ‘1’ (strongly disagree) to ‘7’ (strongly agree) the extent to which you disagree or agree with the following statement:
� We have made significant changes to our production processes as a result of the introduction of environmental regulations.
The questionnaire consisted of two parts. The first part gathers information about the characteristics of the plant or its parent company (e.g. number of employees, country of operation, attitude towards regulation, etc.), while the second part gathers information about the impacts of environmental regulation (e.g. levels of environmental expenditure, improvements in resource efficiency, impacts on unit production costs, etc.). The primary data were collated for individual operating plants rather than at the company level. It should be noted that some of the data that were collected relate to the parent company rather than the plant itself – for example, whether environmental performance is featured in the company’s marketing strategy / positioning. In order to keep the questionnaire to a manageable size and to maximize the response rates, respondents were not asked questions in relation to specific environmental regulations. So, for example, they were not asked to provide information about their responses to the IPPC Directive. Rather, they were asked to assess the significance of a

Study purpose and method
Sectoral Costs of Environmental Policy 44
number of pre-selected regulations to their operations, and this information is included as an explanatory variable in the analyses. The advantages of the proposed approach are that response rates to the questionnaire are likely to be higher (providing larger sample sizes) and the information is likely to be more reliable. The downside is that it is harder to interpret the estimated regression coefficients. The analysis should be able to say whether regulation X has a greater impact on environmental expenditure (for example) than regulation Y.
b) Sample Within this project, it was not required, nor possible to cover all Member States (MS) of the EU-27 needed. Therefore, we aimed to make a selection of Member States with a good mixture of:
- ‘new’ MS and ‘old’ MS; - geographical spread: North-South-West-East; and, - size: large MS and smaller MS.
Considering all the information available we selected the following Member States: Belgium; France; Germany; Hungary; Italy; the Netherlands; Poland; Portugal; Sweden; Slovenia and the United Kingdom. As a starting point, we surveyed companies that have to report in the context of EPER/ E-PRTR9. EPER contains data on the main pollutant emissions to air and water reported by about 10 000 large and medium-sized industrial facilities in the EU-15 Member States, Hungary and Norway for the first reporting cycle and about 12 000 facilities for the EU-25 Member States and Norway for the second reporting cycle. Table 4 shows how many facilities EPER contains in the selected Member States and the industries concerned. The scope of the industries is defined in each of the sector reports.
Table 4: Number of companies in the selected countries and industries
Electricity Iron & Steel Oil chain Textiles & Leather
BE Belgium 23 15 3 17 DE Germany 119 47 20 30 FR France 42 49 16 19 HU Hungary 14 3 2 0 IT Italy 105 31 26 34 NL Netherlands 23 3 11 9 PL Poland 57 20 6 2 PT Portugal 15 5 2 12 SE Sweden 7 16 5 0 SI Slovenia 3 3 0 0 UK United Kingdom 83 17 116 32 Total 491 209 207 155
9 The European Pollutant Emission Register (EPER)9 was established by a Commission Decision of 17 July 2000. It is a publicly accessible register with emission data that enables the Commission and national governments to monitor the trends in annual emissions of large industrial activities covered by Annex I of the IPPC Directive 96/61/EC.

Study purpose and method
Sectoral Costs of Environmental Policy 45
The contact details were mainly obtained from the national/regional contact points within the different Member States. However, for some Member States (e.g. France, UK) it turned out to be impossible to get these details because of confidentiality reasons. A postal letter was sent to these facilities. Moreover, we aimed to increase our sample size by including smaller, non-IPPC facilities. For this purpose, we asked European (e.g. EURELECTRIC) and national industry federations (e.g. Fedustria (BE)) to help us circulating the survey. Following different paths to distribute the invitation to complete the survey, made it impossible to exactly identify the response rate. In total we estimate that we reached about a 1 000 plants/companies.
c) Design We developed a structured, web-based questionnaire designed to elicit specific information from the targeted sample of companies. The questionnaire was sent to the environmental managers of the selected facilities. The survey was conducted in English, and in a later stage also in German and French (as off-line versions). To improve the quality of the responses and to ensure a high response rate, the project team provided desk support. The planned deadline for answering originally was 30th June 2007. However, due to some difficulties, the final date was delayed until the end of July 2007.
- Structure of the questionnaire The questionnaire consisted of five parts:
- background of the project; - instructions; - identification of the respondent; - questions; - definitions of key concepts and Directives (included in the questionnaire as ‘what
is’ fields).
- Technical design of the questionnaire: a web-based survey
The questionnaire was developed as a web-based tool that the respondent could easily fill out. The main advantage of an electronic questionnaire is that a wide geographical area can be covered in a relatively easy way (in comparison with direct interviews). However, the response rates of this type of questionnaire are typically low. Respondents were asked to go to a particular Web location to complete the survey. A web-based survey makes it possible to construct buttons, check boxes, and data-entry fields that prevent respondents from selecting more than one response where only one is intended, or from otherwise typing where no response is required. It is also possible to validate responses as they are entered.

Study purpose and method
Sectoral Costs of Environmental Policy 46
d) Responses In total, 64 respondents fully completed the survey. 11 of them completed the survey at the company level, answering the questions for several facilities in one country at the same time. As said before, the response rate is hard to estimate, but it can be argued that given the different paths used for spreading the survey, the response rate is rather low. While a higher response rate would have been desirable, this is not really a problem to fulfil the objective of this study as primary survey data were only one of the five sources of information that were used to address the research question. Moreover, despite the small sample, the newly collected data contain unique company level information that allowed to explicitly investigate how environmental policy affects a company’s environmental expenditures and environmental improvements. So far few studies have been able to provide such an in-depth company-level analysis on this issue. One of the difficulties of conducting a written survey is that no face-to-face contact with competent respondents can be established and that it is sometimes impossible to find out who the competent person(s) would be. In addition, operators and managers need to take care of their main business and cannot be expected to spend an excessive amount of time on filling out a survey. As a result, surveys on inherently complex and sensitive matters such as the environmental expenditures meet easily either with ignorance and uncertainty or get discarded due to lack of time or other business constraints. Figure 7 presents the distribution of respondents over the selected sectors.
0
5
10
15
20
25
30
Oil Electricity Textiles Metals
Sector
Num
ber
of r
espo
nden
ts
Figure 7: Distribution of respondents over the sectors
The metals industry represents the largest part of the sample with 25 (39 % of) respondents, closely followed by the textile and leather industry 21 (33 % of) respondents. The electricity sector and the oil industry represent respectively 12 (20 % of) and 5 (8 % of) respondents. For the electricity sector, the textiles and leathers sector and, the metals sector respectively 5, 2 and 4 respondents completed the questionnaire for multiple facilities at the same time.

Study purpose and method
Sectoral Costs of Environmental Policy 47
Figure 1 in Annex 3 shows the sample size for each of the selected Member States. For some other Member States (Austria, Czech Republic, Denmark) we also obtained one or a few responses. Most probably the sector federations alerted these facilities. Due to the small number of returned questionnaires from individual Member States, it was decided to aggregate the information to Northern, Southern, and Central European regions and the New Member States. More specifically, Southern Europe comprises plants located in Italy and Portugal, Northern Europe comprises plants located in Sweden and Denmark, Central Europe comprises plants located in Austria, Belgium, France, Germany, Netherlands and the UK; finally, the New Member Sates comprise plants located in the Czech Republic, Hungary, Poland and Slovenia. As shown in Figure 8 Central Europe forms the largest group containing 52 % of respondents. Northern Europe, Southern Europe and the New Member States represent respectively 14%, 20 % and 14 % of the respondents.
0
5
10
15
20
25
30
35
Southern Europe Northern Europe Central Europe New MemberStates
Num
ber
of r
espo
nden
ts
Total Oil Power Textiles Metals
Figure 8: Distribution of the respondents over geographical groups and sectors
1.5 Methodology The different data were processed into four main deliverables: (i) sector reports; (ii) comparative analysis of the data on environmental expenditure; (iii) statistical analysis of the primary data; and, (iv) ‘narrative’ case-studies per sector.
1.5.1 Sector reports Sector reports provide the overall picture of the selected industrial sectors. The reports are based on the gathering and analysis of secondary data sources, completed by reviews by experts from the European sector federations.

Study purpose and method
Sectoral Costs of Environmental Policy 48
For each sector, 6 main issues are discussed: (i) definition of the sector; (ii) socio-economic figures and indicators; (iii) competitive analysis; (iv) main environmental issues; (v) legal aspects; and, (vi) environmental expenditures.
1.5.2 Comparative analysis of the data on environmental expenditure This analysis addresses a comparison between the officially reported data on environmental expenditures for the EU in general and some specific EU Member States. The outline of the analysis is as follows: - Data gathering:
o Annual capital and operational expenditures from: Austria, Czech Republic, Germany, Estonia, Spain, the Netherlands, Poland, Sweden and the UK, added by non-EU figures (US, Australia);
o Investments from: France, Germany, Netherlands, Czech Republic, Germany, UK, Slovenia and Hungary, extracted from Eurostat;
o For the selected sectors, with the level of aggregation NACE 2 (but often more than one sector included);
o For the most recently available years; o Breakdown of expenditures:
� Investments and operational costs; � Investments by end-of-pipe (pollution treatment) and by integrated
technologies (pollution prevention); � Operational costs by internal (in house, or costs for own personnel, materials
etc) and external environmental costs (fees and purchases); � Environmental domains (air, water, waste, …);
o Analysis of long time series for the Netherlands (1990 – 2005); - Analysis of differences between Member States, sectors, environmental media; - Relating these figures to economic data (e.g. added value) and environmental data (e.g.
emissions). This analysis provides further insights into the evolution of the overall expenditures, their order of magnitude (also relative to non-EU regions), the environmental benefits, and the shift between environmental media.
1.5.3 Statistical analysis of the primary data The analysis of the data collected by the online questionnaire starts with a discussion of the regression model that was used to test the impact of environmental policies on a firm’s behaviour. Next, we briefly discuss the dependent and independent variables that were used in the regression analysis. The detailed econometric analysis allowed assessing to what extent environmental policies affect:
- the technological actions that the facilities have undertaken (chapter 4). - the environmental expenditure sustained by the facility (chapter 5); and - the facility’s resource and cost efficiency, as well as its environmental footprint
(chapter 6).

Study purpose and method
Sectoral Costs of Environmental Policy 49
1.5.4 In-depth ‘narrative’ case-studies The quantitative analysis was complemented by some case studies illustrating the interaction between environmental regulations, the choice of policy instruments, the adoption of technologies, and the ensuing costs. These ‘narrative’ cases are supposed to further illustrate the stories behind the numbers. They were carried out as a desk-based study, based on examples and case studies found in the literature. The literature study was supported by a limited number of ad-hoc expert interviews by phone (for example, to suppliers of environmental technology and plant operators). There were essentially two ways how such narratives could be developed:
- starting from specific technologies (e.g. combined heat and power, combined cycle gas turbines) and then assessing which pieces of EU legislation would have an impact on the development, adoption and diffusion of such technologies; or
- setting out from specific pieces of regulation (e.g. LCP, IPPC, ETS, Water Framework Directive etc.) and then assessing what responses are available to companies to comply with this regulation (integrated or end-of-pipe technologies, changes in products and processes etc.).
The advantage of the latter is that it supports a comparison of how different regulations interact, i.e. whether they overlap or whether they are contradictory, and if there may be synergies from implementing both in conjunction. It also allows a comparison of different policy instruments (i.e. market-based measures, suasive instruments (information, labelling), command-and-control etc.) and their interaction. The case studies cover the sectors initially considered: textiles and leather (focus on leather), metals (focus on iron and steel), oil chain, and electricity. The main guiding questions for the studies were:
- How does environmental regulation lead to investment decisions? - What is the cumulative effect of different, related regulations – are effects additive
(total cost is the sum of all regulations), are there synergies from integrated implementation?
- What is the flexibility for companies in the implementation, are there technologies that help to meet the requirement of several pieces of legislation?
- What are the effects of EU plants vis-à-vis non-EU competitors?


Chapter 2:
Drivers of environmental expenditures In this chapter we explore the antecedents or drivers of environmental expenditures: sector characteristics, location characteristics, plant and company characteristics, regulation characteristics, and technology characteristics. For each of the items, some contextual background is provided, and also some related statistics we obtained from our survey. This is complemented with the results from the sector reports and a case study on the use of policy instruments in the metals industry.


Drivers of environmental expenditures
Sectoral Costs of Environmental Policy 53
2 DRIVERS OF ENVIRONMENTAL EXPENDITURES 2.1 Sector characteristics
A major feature of this study is the focus on the four major manufacturing industries that cause considerable environmental degradation and where the costs of reducing policy have been/are substantial:
- Oil supply chain industry or ‘Oil’ ((NACE 11 ‘Mining’ and NACE 23 ‘Refineries’);
- Electricity production or ‘Power’ (NACE 40); - Textile and leather industry or ‘Textiles’ (NACE 17-19); and - Iron and steel industry, and other metals or ‘Metals’ (NACE 27)10.
There are a number of reasons why it is useful to make an in-depth analysis at the level of the sector (Jenkins, 2002). Firstly, the dynamics of competition takes place within a sector. The structure of the industry and the sources of competition are important factors determining the behaviour of companies within the sector. As such, the responses of companies to environmental regulation are dependent on the competitive characteristics of the sectors within which they operate. Secondly, production processes and technological developments are to a large extent sector specific. It is necessary to look at specific sectors to understand how environmental regulation leads to changes in technology and how it affects the competitive position of companies. Thirdly, a review of the literature reveals that most studies on the impact of environmental regulation on competitiveness and technological change are carried out at the macro level (region/country) or at the micro (company) level (see Jenkins, 2002). A study at the meso-level of a sector industry cannot be dismissed easily as being anecdotal as most company level case studies, and at the same time offers more specific insights than can be obtained from often quite aggregated macro studies. To capture all relevant information in a comprehensive way, we made sector specific reports. The sector reports were carried out by the gathering and the analysis of secondary data sources. Then, experts from the European sector federations have reviewed the reports. For each sector, 6 main issues are discussed: (i) definition of the sector; (ii) socio-economic figures and indicators; (iii) competitive analysis; (iv) main environmental issues; (v) legal aspects; and, (vi) environmental expenditures. The complete sector reports can be found in Annex 1. The sections below present the main findings from the reports.
10 In the Terms of Reference the iron and steel production was selected as sector, but both for the primary and the secondary data gathering it was necessary to extend the scope to NACE 27 Base Metals.

Drivers of environmental expenditures
Sectoral Costs of Environmental Policy 54
2.1.1 Electricity With a total turnover well above € 500 billion – comparable to almost half of the UK’s GDP – the electricity industry is an important sector of the European economy. In addition, it comprises some very large companies, such as the French EDF (Electricité de France) and the German E.On, with annual global turnovers of more than € 30 and 67 billion respectively. Electricity companies in Europe include both state owned as well as private enterprises. In recent years, many companies have been privatised or are in the process of being privatised. While there is a move towards unbundling the production and distribution of electricity and the management of the electricity grid, there is also a continued trend towards mergers and acquisitions in the European electricity sector. The electricity industry contributes to a number of environmental impacts during production and distribution. For example, transmission and distribution of electricity through construction and operation of transformers and grids may impact landscape features and habitat. Furthermore, the production of electricity has diverse and major environmental impacts, depending on the technologies and resources used. A major share of Europe’s electricity production is based on the combustion of fossil fuels, which is not only a main cause of global warming, but also a source of other air pollutants including SO2, NOx and particulate matter. Nuclear energy is another important source of energy, but there are risks of nuclear disaster and problems related to the disposal of radioactive wastes. For example, nuclear production discharges heated water into rivers, which has been associated with impacts on aquatic fauna and flora. Lastly, electricity from renewable energy sources, despite its favourable carbon balance, also has environmental drawbacks. For example, biomass production may affect soil, groundwater and surface water quality; hydroelectric power affects hydrology, water ecology and landscape; the production of solar cells involves the use of toxic chemicals; and wind energy has impacts on landscape and wildlife and consumes large amounts of natural resources for the production of windmills. Environmental regulation and planning has a long tradition in electricity generation. The most marked examples in terms of electricity from fossil fuels are the requirements for desulphurisation and cleaning of flue gas of fossil-fired power plants. Technologies related to emissions of acidifying substances are now well integrated in electricity production processes in most of Western Europe, and increasingly in Eastern Europe as well. In addition, nuclear power and its associated environmental impacts have been strictly regulated across Europe. The emerging renewable electricity technologies also face traditional emission, waste and planning regulations aimed at the mitigation of environmental impacts. However, the accumulation of environmental impacts along with the expansion of the sector also opens up new regulatory questions concerning emission allowances or impacts on biodiversity and landscape. In addition, renewable electricity depends on incentive schemes and of the development of regulatory institutions for governing generation, transmission and distribution. Contrary to non-renewable electricity, the renewable electricity sector is still immature in most Member States and depends on support measures.

Drivers of environmental expenditures
Sectoral Costs of Environmental Policy 55
Greenhouse gas mitigation policies will impact on electricity generation. Some scope remains for improved efficiency in fossil-fuel-based electricity generation. However, an emission reduction of 20% in the coming 13 years, as currently discussed at the EU level, could steer the industry towards renewable or nuclear energy or to large-scale carbon capture and sequestration (CCS) measures. Thus, the electricity sector faces significant changes in the coming decades. For example, investment strategies may shift to projects with long gestation and pay back periods, while departing from well-established development trajectories. If this change to climate-friendly electricity production is too rapid then it may negatively impact profits, depending on the regulatory stance (often the price is regulated for energy). European electricity companies currently still find themselves in a relatively comfortable market environment with many companies reporting record profits in recent years. Therefore, investing these profits wisely is key to ensuring the future competitiveness of the sector. Data on environmental expenditures is provided on the NACE 2-digit level, i.e. for the NACE sector E40 “electricity, gas, steam and hot water supply” and is available for 13 of the EU-25 Member States. The expenditures present a rather heterogeneous picture. Whereas most countries reported environmental annual expenditures of around 50 million Euro, and mostly below 100 million Euro, the total expenditure on environmental protection reported for France amounts to 758 million Euro. This is far more than the combined expenditure reported by the twelve other countries for which data is available. The cost in Euro per kW of installed capacity ranges between 0.8 and just above 8 Euro/kW in all Member States, except for Slovakia (16.50 Euro/kW). The costs in proportion to installed capacity differs thus by a factor of 10 or more between the different Member States. Even accounting for the fact that the environmental expenditure captures gas, steam and hot water supply as well as electricity, and accounting for differences in the electricity mix between countries, these discrepancies are difficult to explain.
2.1.2 Oil chain The oil supply chain describes the whole range of economic activities of the oil industry ranging from resource extraction and mining to refining and distribution, thus covering a wide range of NACE codes (see full sector report for a comprehensive list of all codes). The oil industry is also one of the largest sectors of the European economy. The combined turnover of the three largest European-based oil companies (Royal Dutch Shell, BP and Total) exceed the GDP of the Netherlands. Although these companies engage in gas extraction and sales as well as renewable energy sources, the oil sector remains their main field of activity for the near future. The oil industry is also among the most profitable sectors of the European economy, if not the most profitable sector. Companies such as Royal Dutch Shell, BP and Total rank high among the most profitable companies worldwide. Exploration often occurs in environmentally sensitive areas, thus oil industry activities are of immediate environmental relevance in all stages of production. The product of the oil industry – crude oil or refined petroleum products – can cause extreme damage to the environment if spilled during transport, storage or refinement. Finally, the burning of fossil fuels is not only a main cause of global warming, but also a source of other air pollutants including particulate matter, SO2 and NOx.
Drivers of environmental expenditures
Sectoral Costs of Environmental Policy 56
Given the manifold and immediate impacts on the environment, environmental regulation in the oil industry is not a novel concept. The environmental technologies in many stages of the production process can be considered as fairly well-integrated and mature. For example, it is unclear whether activities such as wastewater treatment in refineries should be counted as an environmental protection expenditure or if they are effectively business-as-usual (and thus are included in the baseline). Regardless, the recent economic performance of European-based oil companies provides no indications that the burden imposed by environmental regulation threatens to put companies out of business. Climate protection policies, if pursued consistently, will inevitably have an effect on the oil industry. Emission cuts of 20% in the next 13 years, as currently discussed at the European level, will clearly affect the business environment in which the oil industry operates: ambitious climate policy means that sales of the industry’s staple product may decrease. This decrease could be a result of improved carbon capture or energy efficiency, often estimated to provide 2/3rds of climate change measures. Globally however, industry representatives seem to expect that they will have increased demand for refined oil products in the foreseeable future. Changes cannot be accommodated through process innovations (let alone “end-of-pipe fixes”), but will require the introduction of new products (e.g. biofuels) and even a redefinition of the industry’s core business. This shift could result in new ways of satisfying customer demand for energy, heat and mobility, thereby achieving goals far beyond “classical” compliance costs of environmental regulation. 2.1.3 Textiles and leather The EU textiles and leather industry is composed of the textile manufacturing industry, the clothing manufacturing industry and the production of leather and leather products industry. In 2004, the total EU textiles and leather industry consisted of more than 250 000 enterprises with almost 2.6 million employees (8.1 % of total EU-25 manufacturing) and a total turnover of € 238 billion (3.9 % of total EU-25 manufacturing). Being one of the oldest sectors in the history of industrial development, the textile and clothing industry is often referred to as a ‘traditional industry’, as a sector belonging to the ‘old economy’. The European textile and clothing industry has however undertaken significant restructurings and modernisations during the past decennia. This resulted in increasing productivity throughout the production chain, making about one third of the workforce redundant and re-orienting production towards innovative, high-quality products. Like many other sectors, the textile and leather industry has been greatly affected by the phenomenon of globalisation. Europe is not only an important producer of textile and clothing products, it is also an attractive outlet for other exporting countries, mainly developing countries situated in South-East Asia. Countries from South-East Asia have recently become very competitive, combining low wage costs with high-quality textile equipment and know-how imported from more industrialised countries. After more than forty years of import quota the textile and clothing sector is, since January 2005, subject to the general rules of the General Agreement on Tariffs and Trade. The EU leather industry is also exposed to ever more competition from low-labour cost non-EU countries. At present, the European market is open to virtually unrestricted imports from all over the world. The EU import duties are very low and non-tariff barriers do not exist. At the same

Drivers of environmental expenditures
Sectoral Costs of Environmental Policy 57
time, European tanners are still faced with numerous barriers to trade, of which the barriers restricting access to raw materials (hides and skins) are considered the most harmful. The tanning industry is a potentially pollution-intensive industry. The environmental effects include the load and concentration of the classic pollutants, but also the use of certain chemicals such as biocides, surfactants and organics solvents. The main concern in the textile and clothing industry is the amount of water discharged and the chemical load it carries. Other relevant issues concern air emissions, solid wastes and odours. For the textiles and leather sector 20 Member States report their environmental expenditures and for several of the variables the values are not reported due to confidentiality. For example for ‘Investment in equipment and plant for pollution control’, expenditure is available for 16 countries of which 5 report 0. In total, the sector spends the largest part of its investment expenditure on waste water followed by air, waste and other non-core domains. The manufacturers of leather and manufacture of clothing spend relatively more on the investments in the environmental domain water, while manufacturers of textiles spend relatively more on waste water. Current expenditure on environmental protection goes mainly to the domains wastewater and waste. Other domains represent only a relatively small portion.
2.1.4 Iron and steel The EU iron and steel production industry forms a part of the metal industry. In 2003 the iron and steel manufacturing industry generated a turnover of approximately € 138 billion (2.4% of total EU manufacturing) and employed 0.6 million people (1.7% of total EU manufacturing). Apart from the EU iron and steel industry’s contribution to EU turnover and employment, its function as a supplier of basic and high value added products to the EU economy is of crucial importance. The geographical proximity of the metals’ supply chain and their related industries is a traditional strength of the EU economy, because of their mutual dependency and interests (technical, logistical, innovation and customer service). In order to produce high-performing tailor-made metal products, there is a need to maintain a close relationship with the end user. Downstream industries, which often operate a just-in-time production process, are reliant on timely and secure supplies, which can meet their needs in the most flexible manner. Should there be distortions of these links through closures and/or delocation of EU metals manufacturers, there would also be a significant impact on the competitiveness of the downstream sectors because of these critical links. For this reason, a competitive European metal industry plays a crucial role in the overall performance of the whole European industry and economy. Clearly, this industry can be labeled as an ‘environmentally intensive’ industry, with relatively important emissions to air, energy use, waste streams etc. As a consequence, the industry is subject to multiple environmental legislations, such as the NEC-Directive, ETS, IPPC, … Recycling is also an integral factor of the sector’s competitiveness. Between 40-60% of the EU’s unwrought metal output comes from the recycling of metals scrap. This high use of metals scrap is reducing the European dependency on imported ores and concentrates.

Drivers of environmental expenditures
Sectoral Costs of Environmental Policy 58
Strong economic and environmental advantages to recycling are created as metals extracted from ores & concentrates and recycled metal (industrial scrap, end of life scrap, residues) are almost fully interchangeable. Recycling not only improves the economic performance of the sector, but also has a positive impact on the environment as it offers the most cost-effective way to significantly reduce emissions from the sector. One tonne of secondary steel generates only about one fifth of the CO2 emissions caused by one tonne of primary steel production. Increasing the share of secondary metal production is hence one of the promising strategies to reduce environmental impacts associated to metal production and consumption. For over 20 years, the European Union has been the largest consumer and one of the major producers of ferrous metals in the world. In recent years, the EU metals industry has had to adapt to dramatic changes on the world market of metals with the emergence and recovery of big new economies such as China, Russia and India. The consumption of most metals is still higher in the EU than in China, the USA or Japan. However, over several years and despite continuing high demand, the EU has become less attractive for metals production, leading to a growing share of imported metals. For the metals industry only aggregated figures for the whole basic metals sector are available. The largest part of investment expenditure is spent on air protection measures, followed by waste water, non-core domains and waste. Both investment in end-of-pipe measures and investment in integrated technology follow the same pattern. Looking at the distribution of the current expenditures on environmental protection by environmental domain the picture is different than for the total investments. Next to major protection expenditures in the compartments waste and air, a large amount of money is spent on waste water measures.
2.2 Location characteristics The location of the facility may also have an effect because of different cultural factors. More importantly, although the major share of environmental policy initiatives is nowadays decided at the European level, and despite the existence of a number of international environmental agreements, the implementation of environmental policies is still carried out to a large extent at the national and regional level. As a consequence, major differences continue to exist in the level or rigour of environmental regulation between European countries.
2.3 Plant/company characteristics Due to the importance of exogenous company characteristics there can be as much variation in environmental performance within a sector as there is for similar facilities in different sectors. For policy makers it is key to identify and understand the links between these characteristics and environmental performance to successfully design environmental policy. The empirical literature hypothesizes a number of relationships between various ‘exogenous’ company characteristics and environmental performance. Johnstone (2005) lists the following:
- company size, presumed to be positive due to ‘visibility’ (cf. probability of enforcement), and economies of scale in environmental investments;

Drivers of environmental expenditures
Sectoral Costs of Environmental Policy 59
- capital stock turnover, presumed to be positive due to the ‘cleaner’ nature of newer technologies relative to older technologies;
- exposure to international markets, presumed to be positive due to economies of standardisation and the need to meet standards of stringent markets;
- geographical origins of capital, dependent upon the relative stringency of domestic regulations compared to other countries; and,
- capital availability, presumed to be positive for companies with internal sources of funds due to investments in environmental improvements.
However, there is surprisingly little empirical evidence for these relationships, with few studies looking systematically at the relationship between company characteristics and environmental performance. Clearly, there is a high degree of correlation between the various explanatory variables analysed, for example, large companies tend to have greater access to capital. Moreover, it is very difficult to define an appropriate variable for environmental performance. There are also many factors that might explain (drive) the differences in the responses of a particular plant to environmental regulation, and the variation in cost of these responses between individual companies operating in a sector. In particular, one would expect the following factors to have some influence:
- the internal resources of the company (e.g. management, financial, knowledge, etc.);
- the quality of its environmental management systems; - the technology response options that are available and their costs; - the flexibility allowed by the mechanism used to implement the regulation; - the availability of technical support and advice (e.g. best practice dissemination);
and, - the stringency of the enforcement regime.
The factor ‘internal resources’ is likely to be a function of the scale of the plant. There are various measures that could be used for this – number of employees, physical output, value added, etc. Alternatively a composite measure could be constructed from several individual measures. The trend towards promoting voluntary action and pollution prevention as opposed to the ‘command-and-control’ regulations (see infra) has been accompanied by a growing number of business-initiated actions to introduce environmental management systems (EMS). In the environmental management literature, much research has been undertaken on the determinants of implementing environmental management systems of companies in certain industries within a specific country. Less research has been undertaken from an international perspective, and even less so at the plant level (Vollebergh, 2007). A recent study (Henriques and Sadorsky, 2007) suggests that the development of environmental initiatives such as EMS is more significant in companies with:
- a positive business performance; - a R&D budget; - a quality management system; - viewing employees as important players in developing environmental initiatives; - viewing voluntary agreements as important; and, - developing international skills, as measured by a facility’s market scope.

Drivers of environmental expenditures
Sectoral Costs of Environmental Policy 60
Other recent research explored the role of EMS in the introduction of new, cleaner technologies in some industrial sectors in Slovenia (Radonjic et al., 2007). The investigation revealed that the ISO 14001 standard is mostly considered as very useful by both the industries in their attempts to introduce new, cleaner technology and seems to create better conditions for the implementation of the IPPC Directive by the relevant companies. However, less than 10% of these companies thought that ISO 14001 is a necessary condition to promote and adopt new technology. In our analysis, the presence of an accredited environmental management system is used to represent the quality of the plant’s environmental management, with a distinction being made between no or a non accredited environmental management system and ISO14001 or EMAS. In addition to its own characteristics, a plant’s response to environmental regulation may also be affected by the characteristics of its parent company. In particular:
- the number of plants that the company operates in that country; - the number of countries in which the company operates; - the importance of environmental performance to the company’s marketing
strategy.
2.4 Regulation characteristics The flow from legislation to expenditures was illustrated in Chapter 1. In general, environmental legislation is introduced as a response to environmental problems and challenges, both at the international/European level and the national/local level. Authorities then use policy instruments to convince, stimulate, or oblige targets groups such as industry sectors to take environmental measures. These measures typically bring along environmental expenditures, in terms of investments and (net) operating costs. There are several options to distinguish between different types of instruments for environmental regulation, e.g. Wagner (2003). Essentially there are six broad types of implementation mechanism that can be used. These mechanisms are not mutually exclusive and it is possible that several mechanisms may be used in combination to implement a particular regulation (see also a recent OECD report, 2007).
- Technology-based mechanisms that specify particular production technologies that must (not) be used, or particular technical characteristics of products;
- Consent-based mechanisms which specify the maximum amount of a pollutant that may be emitted by a particular plant, or the maximum amount of a resource that may be used (e.g. water abstraction), either in absolute or relative terms;
- Contract-based mechanisms in which collective agreements are signed with groups of companies (e.g. industry associations) that specify certain collective actions and / or performance targets;
- Market-based mechanisms in which new markets are created which are directly linked to pollutant emissions or resource use (e.g. tradable emission permits, tradable abstraction rights, etc.);
- Price-based mechanisms in which taxes / charges / subsidies are used to introduce a price where one does not exist (e.g. emissions taxes), or to adjust existing market prices (e.g. energy taxes); and,

Drivers of environmental expenditures
Sectoral Costs of Environmental Policy 61
- Information-based mechanisms that disseminate information about best practices and about the costs and benefits of abatement technologies.
A literature review recently performed by SQW (2006) reveals that there is very limited empirical evidence on the influence that the form of regulation could have on competitiveness. Nevertheless, this study suggests that even though this is an under-developed area in the literature, the available evidence and theoretical considerations, suggest that regulatory form needs to be taken into account. There are a number of characteristics of a particular environmental regulation that will affect the responses of plants and the costs of those responses. In particular:
- the relevance of regulation to the plant and its operations; - the stringency of the regulation in terms of its target / objective; - the flexibility of the implementation mechanism for the regulation; and, - the effectiveness of monitoring and enforcement.
The effectiveness of monitoring and enforcement may well vary from country to country. Depending on the regulation, the stringency of the target and the flexibility of the implementation mechanism may differ as well. Determining the incremental costs (and benefits) of a single regulation has proved difficult in practice. As an example, recently, the UK tried to assess the costs and benefits of the IPPC Directive 96/61/EC (Defra, 2007a). It seems that the (I)PPC Regulations have been the vehicle through which the requirements of a number of EU Directives have been implemented, such as the Waste Incineration Directive and the Large Combustion Plant Directive. In the absence of the (I)PPC Regulations these Directives would have been implemented through other means with associated costs and benefits. In this study, it has not been possible to separate out costs (and benefits) associated with individual Directives, nor the synergies. Box 1: Case study on the role of policy instruments In this case study, we focussed on the effect of the policy instruments on the investment decisions of the companies in the metals sector in general, and wherever possible, the iron and steel sector in particular. It is clear that the relationship between regulators and producers continues to vary considerably according to region, country and to individual cases. We investigated these differences for four countries/regions with a different approach. Firstly, we looked at the ‘traditional’ command-and-control approach, considering the permit system in an old (Belgium) and a new Member State (Slovenia). Second, the command-and-control approach was compared with the highly collaborative and localised system of regulation in place in the Basque Country (Spain). Finally, we considered the economic instrument (NOx trading) that the Dutch authorities recently introduced to stimulate further emission reductions in the industry. The following paragraphs present the most striking conclusions; the complete text of the case can be found in Annex 4.

Drivers of environmental expenditures
Sectoral Costs of Environmental Policy 62
Firstly, the cases show that the relationship between a (European) piece of regulation and the instrument used for implementation is equivocal. As an example, both the Netherlands and Belgium face ambitious reduction targets for NOx imposed by the NEC Directive, but opt for a different instrument (respectively a permit review and an economic instrument). In itself this should not be considered as a problem, as Member States should be able to learn from the experiences of others to further design their own implementation policies. However, the potential divergence in consequences of using different instruments might disturb the level playing field for companies operating in several Member States to some extent. Moreover, companies with facilities in several Member States need to become acquainted with the different instruments, which potentially leads to additional costs (for example a trading system, a bubble permit, etc.) For instruments introduced at a broader level, such as the European Emission Trading System, this potential disadvantage seems smaller (apart from the potential competitiveness effects regarding non-EU competitors). Secondly, we conclude that the impact of the instrument in place in terms of environmental investments and improvements is influenced more by the context in which it is implemented than by the nature of the instrument. The NOx trading system for example shows the advantage of allowing companies the flexibility to decide on environmental investments. On the other hand, although the effects of this system in the Netherlands are not fully visible yet, one can argue that the set-up costs of this system in a relatively small region (partly) counteract this advantage. The voluntary agreements in the Basque country were a very important step towards commitment to control industrial emissions and allowed to pre-empt regulation in a flexible way. However, it is doubtful whether this approach would be sufficient in a new Member State such as Slovenia to catch up with (European driven) environmental challenges. The command-and-control approach starting from the results of the European information exchange on BAT turned out to be the most efficient way in this country. In all cases, an intensified dialogue between industry and administration seems key to achieve results in an efficient way. A third general conclusion is that by the choice of the instrument and its implementation authorities typically cover the requirements of several pieces of legislation at once, or anticipate upcoming challenges. The command-and-control approach studied in the Belgian and Slovenian cases aims to cover the IPPC and NEC Directives, even though that the legislative driving force is different (IPPC in Slovenia, NEC in Belgium). The NOx trading system aims to implement measures beyond BAT and IPPC. However, the IPPC requires at least the implementation of BAT in each IPPC installation, which limits the effectiveness of the system. Even for the voluntary agreements in the Basque Country, upcoming regulation seems to have been the main driver for the investments and the approach allowed to cover different areas and several pieces of legislation at the same time.

Drivers of environmental expenditures
Sectoral Costs of Environmental Policy 63
2.5 Technology characteristics The technological response of a plant to the introduction of an environmental regulation, and the cost of that response, will depend to a large extent on the range of technologies that are available for it to choose from and the stages of these technologies in the “innovation process”. If there are only a few options, all in the early stages of market adoption, then the cost is likely to be higher. If there are many mature options then the cost is likely to be lower. There are many ways to distinguish between different types of technologies. As an example, the IPPC-directive 96/61/EC defines “technique” in the broadest sense. Each technique could be identified as a generic category. Examples of categories are:
- housekeeping-type measure (e.g., improved maintenance); - process modification (e.g., minor changes in production processes to reduce waste
arising, use of water-borne paints instead of solvent-borne paints); - integrated measure (e.g., major changes or replacements to processes or plants to
optimise performance); - end-of-pipe technology (e.g., incinerator, waste water treatment plant, adsorption,
filter beds, membrane technology, noise protection wall); and, - non-technical measure (e.g., organisational changes, training of staff, …).
Environmental policy provides an important incentive for companies to develop and/or adopt new more environmentally favourable equipment or technologies. The effects of environmental policy on the type of equipment and technology or innovation that is chosen is likely to differ across different policy instruments (Vollebergh, 2007). The issue of technology characteristics is explored in more depth in Chapter 4.


Chapter 3:
Quantitative analysis:
Empirical approach and variables While the previous chapter discusses in detail which factors are driving a firm’s environmental expenditures and thus its environmental impact, this chapter discusses the independent and dependent variables that are used in the econometric analysis.


Qualitative analysis: empirical approach and variables
Sectoral Costs of Environmental Policy 67
3 QUANTITATIVE ANALYSIS: EMPIRICAL APPROACH AND VARIABLES
3.1 Dependent variables
For each dependent variable, we ran a regression incorporating the same set of dependent variables. In the next step we dropped the least significant variable, as measured by the t-statistic, and re-estimated the regression. This approach, which is widely used in econometrics, is called “General-to-Specific”, as it starts from a general model incorporating all the variables in the study and progressively narrows down the specification until only statistically significant variables are retained. In this study, this process was stopped when all variables left in the regression were significant at the 10% significance level. Arguably, the general-to-specific approach has a number of advantages on other approaches that can be taken in empirical studies (Campos et al., 2005). In this study, heteroschedasticity robust standard errors were used throughout the process. For the final specification of each regression estimated in this study we present the coefficients of the variables, their t-statistics and the adjusted R2 of the regression. T-statistics are a measure of the statistically significance of the variables incorporated in the regression. A value of the t-statistic higher than 1.65, 1.96 and 2.58 implies that the parameter is statistically different from zero at the 10%, 5% and 1% confidence level, respectively. Following the General-to-Specific methodology only variables with parameters significant at the 10% level appear in the final specifications presented in the tables - see section 1.5.4. The adjusted R2 measures the proportion of the total variation in the dependent variable that is explained by variation in the independent variables, after adjusting for the number of independent variables retained in the regression. After obtaining the final specifications using the regression where all variables are significant at the 10% level, the variables were standardised, i.e. the difference between each observation and the mean of the variable was divided by the standard deviation of the variable. The final specification was then re-run with the standardised variables. As all variables have a variance of one, running this standardised regression allowed us to assess which of the independent variables has a greater effect on the dependent variable. This is done by computing an index of the relative importance of each coefficient, known from now on as the relative importance index. This index was computed by dividing the absolute value of a coefficient by the sum of the absolute values of all coefficients in the regression. This piece of information was conveyed graphically by the use of histograms. Table 5 presents the dependent variables used in this study. The first group refers to the actions that the facilities have implemented in order to respond to the introduction of environmental regulations. The results from these regressions are presented in Chapter 4. The second group of variables refers to the environmental expenditure sustained by the facility (plant). The results from the regressions are presented in Chapter 5. The remaining groups of dependent variables describe the consequences of environmental regulations, the effects of which are arguably influenced by the environmental expenditure and responses of the facilities mentioned above. The results from these regressions are presented in Chapter 6.

Qualitative analysis: empirical approach and variables
Sectoral Costs of Environmental Policy 68
In particular among the consequences we distinguish between the impact on: - resource efficiency (either caused by environmental expenditure or not; - financial benefits and competitiveness; - administrative costs and taxes; - unit production costs; and, - reductions of emissions.
The statements from which the dependent variables have been built can be seen in the chapters describing the results from the regressions. Table 5: Dependent variables used in this study.
Type Description 1. Significant investments in end-of-pipe technology in response to
the introduction of environmental regulations 2. Significant changes to production processes in response to the
introduction of environmental regulations 3. Significant changes in product formulation in response to the
introduction of environmental regulations 4. Significant changes in product development in response to the
introduction of environmental regulations
Response
5. Significant proportion of production activities relocated in response to the introduction of environmental regulations
1. Investment in end-of-pipe technology relative to total investment
2. Investment in process integrated technology relative to total investment
3. Operating environmental expenditures relative to total operating expenditure
4. Investment expenditure on environmental protection relative to total investment
Expenditure
5. Operating environmental expenditures relative to total operating expenditure
1. Significant reduction in the level of energy consumption per unit of output
2. Significant reduction in the level of water consumption per unit of output
Efficiency
3. Significant reduction in the level of waste generation per unit of output
1. Significant reduction in the level of energy consumption per unit of output due to environmental expenditure
2. Significant reduction in the level of water consumption per unit of output due to environmental expenditure
Efficiency due to expenditure
3. Significant reduction in the level of waste generation per unit of output due to environmental expenditure
Benefits 1. Significant reduction in operating costs per unit output due to a
reduction in energy consumption due to environmental expenditure
Qualitative analysis: empirical approach and variables
Sectoral Costs of Environmental Policy 69
Type Description 2. Significant reduction in operating costs per unit output due to a
reduction in water consumption due to environmental expenditure
3. Significant reduction in operating costs per unit output due to a reduction in waste generation due to environmental expenditure
4. Positive effect of environmental expenditure on competitiveness 1. Size of administrative cost due to environmental policy relative
to companies in the EU15 2. Size of administrative burden due to environmental policy
relative to competitors in the EU New Member States 3. Size of administrative cost due to environmental policy relative
to competitors outside the EU
Administration Costs
4. Size of environmental taxes relative to competitors outside the EU
1. Effect of environmental regulation on unit production costs relative to competitors in the EU-15
2. Effect of environmental regulation on unit production costs relative to competitors in the new Member States
Production Costs
3. Effect of environmental regulation on unit production costs relative to competitors outside EU
1. Significant reduction in the level of greenhouse gas emissions per unit of product
2. Significant reduction in the level of other air pollutants per unit of product
Emissions
3. Significant reduction in the level of water pollutants per unit of product
3.2 Independent variables
Table 6 gives a short overview of the different variables that will be taken into account. As one can see in the table, the variables can be grouped into 3 clusters: (i) Sectoral and location characteristics, (ii) Plant/company characteristics, and, (iii) Policies.

Qualitative analysis: empirical approach and variables
Sectoral Costs of Environmental Policy 70
Table 6: Independent variables used in this study The text between parentheses indicates if the variable is measured at the level of the facility or the parent company.
Type Description Member States (Facility) – 4 groups: Northern, Southern and Central Europe, and the New Member States
Location and sector
Sector (Facility) – 4 sectors: Oil, Metals, Power, and Textiles Scale (Parent company) Scale (Facility) Environmental Strategy (Parent company) Proactive Behaviour (Facility) Autonomy (Facility)
Plant / company characteristics
Environmental Management System (Facility) IPPC Directive ETS Directive NEC Directive Waste Framework Directive LCP Directive
Policies
Water Framework Directive
3.2.1 Sectoral variables A set of dummies was introduced to bring the sectors to which the facility belongs in the analysis. These dummies were meant to take into account, as far as possible, the sector characteristic mentioned in the underlying model shown in Figure 6. The sector has an influence on the variables we are trying to explain in the regression because of the characteristics of the production process and the market characteristics. This study collected data from facilities in four sectors: oil, electricity production, textiles and leather, and iron and other metals (see above). The electricity sector was used as a baseline against which the effect of the facility belonging to any other sector could be measured.
3.2.2 Location variables The location of the facility may also have an effect because of different cultural factors. More importantly, although the major share of environmental policy initiatives is nowadays decided at the European level, and despite the existence of a number of international environmental agreements, the implementation of environmental policies is still carried out to a large extent at the national and regional level. As a consequence, major differences continue to exist in the level or rigour of environmental regulation between European countries. A set of three dummy variables was used to indicate the region in which the plant operates, i.e. Northern, Southern and Central Europe, and the New Member States.

Qualitative analysis: empirical approach and variables
Sectoral Costs of Environmental Policy 71
3.2.3 Plant/company variables Parent company and plant scale For the parent company and the plant, scale is measured using an index variable (with six levels) constructed on the basis of information about the number of employees. Information for the turnover and the number of production facilities was also collected. The index on the number of employees has been selected as a proxy of the size as the other questions had a substantially lower response rate, i.e. about a quarter smaller. The average over five years was preferred to the yearly (2005) information as in theory less sensitive to sudden changes in the company. However, from a practical point of view many respondents input the same piece of information in the questions related to the number of employees in 2005 and to the 5-year average. The most frequent occurring number of employees (mode) in the parent companies is greater than 1 000, which is clearly shown in Figure 4 of Annex 3. This is the case for each of the four sectors. The median answer is 500 to 999 employees. The median and 25th percentile of each sector show that the respondents of the oil industry have relatively more large parent companies followed by the electricity sector, the metals industry and finally the textiles and leather industry. Concerning the facility scale, the mode for the oil industry, the textiles and leather industry and the metals industry is 100 to 499 employees (Figure 9). This is not surprisingly as mostly larger companies were invited to respond. Moreover, it could be expected that it is not straightforward for smaller companies with less specialized expertise to respond to the complex and sensitive areas investigated in the survey. The electricity sector has a larger spread of number of employees with a relatively substantial part of smaller facilities with a mode of 10 to 49 employees. The number of employees per facility in the metals industry and oil industry is skewed towards larger companies. The size of the facility and parent company is expected to have an effect on the environmental expenditure, abatement of emissions or improved efficiency in the use of resources through better access to information on technology and financial resources and through higher negotiation power with suppliers. On the other hand, the size of a facility can be an obstacle to vigorous and prompt action, as administrative constraints may increase with size and therefore limit the responsiveness of the facility.

Qualitative analysis: empirical approach and variables
Sectoral Costs of Environmental Policy 72
0
10
20
30
40
< 10 10-49 50-99 100-499 500-999 > 1000
Number of employees
Num
ber
of r
espo
nden
ts
Total Oil Power Textiles Metals
Figure 9: Distribution of the number of employees
Environmental strategy / proactive attitude / autonomy Environmental strategy and pro-active environmental attitude are generally expected to result in higher environmental expenditures, higher reduction of emissions and higher levels of resource efficiency. Autonomy can be important in case the approach to environmental issues of the facility is different from that of the parent company. However, the direction of the effect of autonomy, e.g. increasing or decreasing expenditure, is difficult to determine a priori. Environmental strategy is measured by a variable, constructed by averaging the responses to three statements. Respondents were asked about the importance of environmental performance in the marketing strategy, and whether the company has a policy to exceed minimum standards and anticipate societal demand for environmentally responsible behaviour. The attitude of the facility towards environmental regulation is measured by a variable measuring whether the facility aims to anticipate environmental regulation. The autonomy of the plant’s management over environmental matters is measured by a variable, constructed from averaging the responses to three statements. The statements from which the variables for Environmental strategy, Pro-active environmental attitude, and Autonomy were built are presented in (Box 2).

Qualitative analysis: empirical approach and variables
Sectoral Costs of Environmental Policy 73
Box 2: Questions related to the facilities’ environmental strategy, pro-active environmental attitude, and autonomy
The responses on the questions in Box 1 are depicted in the Figures 6 to 14 of Annex 3. The majority of respondents agree with the statements that indicate the presence of an environmental strategy. Only few respondents actually disagree with the statements. This is especially the case for the third question where it is stated that societal demand for environmentally responsible behaviour is anticipated. Most respondents also show a proactive attitude towards the environment as a large part of respondents agree to anticipate environmental regulation in their products and production methods. In the case of autonomy the picture is less consistent. On the one hand most respondents agree to have a lot of decision autonomy with respect to environmental investments and on the other hand a relatively large part of respondents agree that they have to ask the head office before they can do almost anything relating to environmental investment. In general however the variable AUTO constructed from the three statements indicates that most responding facilities slightly agree to have autonomy with respect to environmental decisions.
Please indicate to what extent you agree or disagree with the following statements 1: strongly disagree 2: disagree 3: slightly disagree 4: neither disagree nor agree 5: slightly agree 6: agree 7: strongly agree
Strategy
� Environmental performance is an important element of the marketing strategy of our (parent) company
� Our (parent) company has a policy to exceed minimum standards set by environmental regulation
� In our products and production methods we aim to anticipate societal demand for environmentally responsible behaviour
Autonomy
� Our facility has a lot of decision autonomy with respect to environmental investments
� Our head office involves our plant in decision making on environmental investments
� We have to ask our head office before we can do almost anything relating to environmental investments
Attitude
� In our products and production methods, we aim to anticipate environmental regulation

Qualitative analysis: empirical approach and variables
Sectoral Costs of Environmental Policy 74
Environmental management system (facility) The respondents were asked which type of environmental management system out of four options (none, a non accredited system, ISO 14001 or EMAS) is in place in their facility. Most responding facilities (62.5 %) prove to have ISO 14001 in place, 15.6 % use a non accredited system, 12.5 % EMAS and the remaining 9.4 % have no environmental management system in place. For the detailed analysis a dummy variable is used to indicate the presence of an accredited environmental management system at the facility, i.e. ISO14001 or EMAS.
3.3 Regulation variables For each sector studied, the most relevant European environmental (related) legislations were selected. An overview is presented in the Table below. Clearly, a prerequisite for the plant to respond and incur any expenditure depends on whether it is affected by the regulation. For some of the pre-selected regulations this may be known a priori. However, for others it may be less clear, and therefore the respondents were asked to confirm which of the pre-selected regulations are relevant to their operations and to what extent. The relevance of each individual environmental regulation / policy to the plant is measured on a five-point index scale, based on the respondent’s answer to the following question:
Please indicate on as scale of ‘1’ to ‘5’ (1: Totally disagree, 2: Disagree; 3: Neither agree/disagree; 4: Agree; 5 Totally agree) to what extent your facility is affected by the following policies or regulations:
� Policy/regulation 1
� Policy/regulation 2
� etc. While a total of twenty-eight environmental regulations / policies have been pre-identified for inclusion in the survey, respondents were only asked about those regulations that are pre-defined as being relevant to the sector in which the plant operates. For example, respondents in the Electricity sector were only asked about the impact of eleven regulations.11 For all of the remaining regulations (i.e. those excluded from its pre-defined list), the plant was assigned a score of “0” (i.e. “not applicable”).12
11 The number of environmental regulations / policies included in the question for each sector are: Textiles and leather (17); Electricity (11); Iron and steel (15); Oil (16). 12 It is necessary to do this because all four sectors are analysed together and hence values are required for all 28 regulations for all plants.

Qualitative analysis: empirical approach and variables
Sectoral Costs of Environmental Policy 75
Table 7: Selected regulations per sector
Regulation Electricity Oil chain Iron &
steel Textiles
and leather IPPC X X X X ETS X X X NEC X X X X LCP X X X X Water Framework X X X X Waste Framework X X X X Landfill of Waste X X X X Ambient Air Quality X X X X Habitats X X COMAH X X Nuclear safety X VOC X X X Sulphur content X Oil tankers X Waste oils X Auto oil X Environmental impact assessment X P(H)S X X IPP X X REACH X X Thematic strategy waste X Thematic strategy natural resources
X
Quality standards surface water X Biodical products X Dangerous substances X Brominated flame retardants X - Directive 96/91/EC on Integrated Pollution Prevention and Control (IPPC) - Directive 2003/87/EC on Emission Trading System (ETS) - Directive 2001/81/EC on National Emissions Ceilings (NEC) - Directive 2001/80/EC on the limitation of emissions of certain pollutants into the air from
large combustion plants (LCP Directive) - EU Water Framework Directive (Directive 2000/60/EC) - EU Waste Framework Directive (Directive 75/442/EEC as amended by Directive
91/156/EEC) - Directive 1999/31/EC on the Landfill of Waste - Framework Directive 96/62/EC on Ambient Air Quality - Habitats Directive (Directive 92/43/EEC on the Conservation of Natural Habitats and of Wild
Fauna and Flora) - Control of Major Accident Hazard Regulations 1999 (COMAH), EC Directive 96/82/EC - Council Regulation (EC, Euratom) 1605/2002, Commission Regulation (EC) 1635/2006 on
nuclear safety - Directive 1994/63/EC on the control of volatile organic compound (VOC) emissions (Stage I) - Directive 1999/13/EC on the limitation of emissions of volatile organic compounds due to the
use of organic solvents in certain activities and installations (VOC Solvents Directive) - Directive 1999/32/EC on reduction of sulphur content of certain liquid fuels - Regulation (EC) No 417/2002 on the accelerated phasing-in of double hull or equivalent
design requirements for single hull oil tankers

Qualitative analysis: empirical approach and variables
Sectoral Costs of Environmental Policy 76
- Directive 75/439/EEC on the “Disposal of waste oils” - Auto Oil I program resulted in Directive 98/70 - Directive 2001/42/EC on the “Assessment of certain Plans and Programmes on the
Environment” - Review of the Priority Substances (PS) and Priority Hazardous Substances (PHS) list - IPP: Integrated Product Policy - REACH: Registration, Evaluation and Authorisation of Chemicals - Thematic strategy on the prevention and recycling of waste - Thematic strategy on the sustainable use of natural resources - Directive on Environmental Quality standards for surface water - Directive 98/8/EC concerning the placing of biocidal products on the market - Directive 2003/53/EC amending for the 26th time Directive 76/769/EEC relating to
restrictions on the marketing and use of certain dangerous substances and preparations (nonylphenol ethoxylate and cement) and Directive 76/769/EEC relating to restrictions on the marketing and use of certain dangerous substances and preparations, and its amendments, especially Directive 2002/61/EC relating to azocolourants
- Legislative requirements for (brominated) flame retardants. From the replies, six policies were selected and used in the regression on the basis of the importance attributed by the respondents. The list of policies and regulations is presented in Table 6. It is worth mentioning that the policies listed in the table affect all the four sectors considered in this study, with the exception of the ETS Directive, which does not affect the textile and leather sector. The list of the policies assessed by respondents in the four sectors can be seen in Table 7. The frequencies of responses on the questions relating to the importance of policies are grouped per sector in part 2 of Annex 3. The extent to which the respondents from the sectors discussed are affected by the regulations is discussed below on the basis of the median value, the mode value, the 25th percentile value and the 75th percentile value. For the oil sector 3 out of the 16 considered policies show a median value of 4 (strongly affected). These policies are the COMAH Directive, which receives the highest overall rating, followed by ETS and IPPC. The regulations concerning NEC, Ambient Air Quality, Waste Oils, AUTO Oil I and Oil tankers can be considered of less importance to the respondents in the oil industry since they all show a median value and mode value of 1 (not at all affected) or 2 (slightly affected). In the electricity sector the ETS Directive is considered to be most important by respondents since the median and mode value are both 5 (very strongly affected). Also the IPPC Directive received a rather high rating (strongly affected). The Habitats Directive, COMAH Directive and Regulation on Nuclear Safety can be considered of less importance to the respondents in the oil industry since they all show a median value and mode value of 1 (not at all affected) or 2 (slightly affected). The respondents from the textiles and leather sector appear to consider the REACH Directive as most affecting them, showing a mode value of 5 (very strongly affected) and a median of 3 (affected). It is followed by the IPPC Directive which also shows a median of 3 but a mode value of 4 (strongly affected). The Dangerous Substances Directive, Water Framework Directive and the Waste Framework Directive also show a median of 3. In the case of the Dangerous Substances Directive there is a large spread in the numbers. The most frequent answer is 1 (not at all

Qualitative analysis: empirical approach and variables
Sectoral Costs of Environmental Policy 77
affected), but more than 25 % of respondents indicate to be strongly or very strongly affected by these regulations. The LCP Directive, VOC Solvents Directive and legislative requirements for brominated flame retardants can be considered of less importance to the respondents in the oil industry since they all show a median value and mode value of 1 (not at all affected). Out of the selected regulations, the IPPC Directive proves to affect the respondents from the metals industry the most. The REACH Directive ranks second and is closely followed by the Water Framework Directive, the Priority (Hazardous) Substances list, the Waste Framework Directive and the Environmental Quality Standards regulation. Due to multicollinearity problems and the relatively small sample, it was unfortunately impossible to include all independent variables that might affect a firms environmental behaviour simultaneously in one regression. The data revealed that companies whose activities were highly affected by the LCP Directive were also highly affected by the NEC Directive. Moreover, companies in the textile and leather sectors did not provide any information about the impact of ETS Directive on their activities. If we wanted to analyse the impact of the ETS directive we had to exclude all companies from the textile and leather sector and thus would considerable reduce the amount of observations in our sample. Therefore, it was decided to keep all textile and leather companies in our sample and exclude the variable capturing the ETS Directive from the analysis. Since companies whose activities were highly affected by the ETS Directive were also highly affected by the LCP directive justifies this approach even more.


Chapter 4:
Technological Responses to Environmental Policies
This chapter analyses how environmental policies affect a firm’s decision to relocate its activities, to invest in product or process innovations that reduce the quantity of pollutant emissions that are generated, or in end-of-pipe technologies that capture the pollutants that are generated and thus prevent them from getting into the environment.


Technological responses to environmental policies
Sectoral Costs of Environmental Policy 81
4 TECHNOLOGICAL RESPONSES TO ENVIRONMENTAL POLICIES
4.1 Contextual background
To the extent that environmental regulations reduce emissions, they necessarily induce technological change by producers. The OECD ‘Guidelines for Collecting and Interpreting Technological Innovation Data’ (1997b) distinguishes between technical and organisational innovations, with technical innovations being divided into product and process innovations:
- process innovations: enable the production of a given amount of output with less input;
- product innovations encompass the improvement of goods and services or the development of new goods;
- organisational innovations include new forms of management, such as total quality management.
Figure 10: Different types of innovative responses to environmental regulation
Typically, we distinguish between two different types of environmental investments that mitigate the environmental burden of production: cleaner production and end-of-pipe technologies. Cleaner production reduces resource use and/or pollution by using cleaner inputs and production methods directly within the production process. End-of-pipe technologies curb pollution emissions by implementing add-on measures. In this respect, cleaner production is often considered as being superior for both environmental and economic reasons. While the different approaches may achieve the desired environmental objectives, the economic impacts are likely to differ. In particular, only process-integrated responses and product innovation have the capability to provide the economic benefits envisaged by the Porter hypothesis (Porter and Van der Linde, 1995), through improving resource efficiency, increasing share of existing markets, or the opening up of new markets. However, a number of barriers, such as additional requirements for coordination, or lack of organisational support within companies often hampers investments in cleaner production. Additional barriers arise due to the nature of the environmental problem and the type of regulations involved (cf. command-and-control based regulation often entails standards that can only be met through end-of-pipe investments).
Product innovations
Process innovations
Organisational innovations
End-of-pipe technologies
Cleaner production technologies

Technological responses to environmental policies
Sectoral Costs of Environmental Policy 82
There has been little empirical analysis directed at the diffusion of specific types of environmental technologies (Frondel et al., 2007b). In particular, it is still unclear to what extent and why facilities shift from end-of-pipe solutions to cleaner production. The complete replacement of end-of-pipe techniques is unlikely - in practice there will always be a mix of end-of-pipe and cleaner production technologies. Nevertheless, there is a wide agreement on (Rennings et al., 2004a and 2004b):
- in the past, environmental regulations encouraged the use of end-of-pipe investments rather than cleaner production;
- these technologies are still dominant in OECD countries; and, - shifts to cleaner production would be environmentally and economically
beneficial. The type of technology response adopted will depend in part on the options that are available to the company, which are likely to vary between sectors. However, the type of implementation mechanism that is used for the regulation13 may also affect it. These mechanisms are not mutually exclusive and it is possible that several mechanisms may be used in combination to implement a particular regulation. The degree of prescription – and hence the certainty of the outcome – varies between the different mechanisms. However, each would be expected to promote different types of technological response; being more or less suitable to different stages of the “innovation process” for eco-technologies. A recent literature review in an OECD report (Vollebergh, 2007) gives the overall impression that environmental policy instruments, command-and-control (CAC) as well as market-based, have a clear impact on technological change. It has however to be noted that identification of effects on invention, innovation and diffusion is not always convincing. Moreover, the studies are difficult to compare because they each explicitly deal with specific environmental instruments and local circumstances with their own specific design features that determine their incentives which, in turn, is likely to have an impact in their effectiveness. Indicators used to measure technological change may differ as well. Several literature sources reveal that the application of environmental technologies becomes cheaper over time, due to technological improvement, economies of scale and learning effects (Oosterhuis, 2007). Figures from the Netherlands show that the reduction of unit costs of environmental technologies goes faster than the – comparable – technological progress factor that is incorporated in macro-economic models used by the Netherlands Central Planning Bureau (Oosterhuis, 2006). Environmental policy and regulation is seen as one of the main drivers of eco-industry markets that are essentially based on investment needs generated by these policies and regulations (Ernst and Young, 2006).
13 Cf. supra: Technology based, consent-based, contract-based, market-based, price-based, information-based

Technological responses to environmental policies
Sectoral Costs of Environmental Policy 83
4.2 Empirical analysis of a firm’s investment or relocation decision Five variables are used to assess the actions taken by the facilities in response to environmental regulations. In particular, we differentiate between end-of-pipe investments, process integrated investments, reformulation of existing products, development of completely new products and relocation of production. Respondents were asked to agree or disagree on whether these five modalities or responses had been significant in their facility in the last five years. The statements from which the variables used in the regression were built can be seen in Box 3.
Box 3: Statements related to the facilities’ responses to environmental regulations.
Please indicate to what extent you agree or disagree with the following statements (1: strongly disagree, 2: disagree, 3: slightly disagree, 4: neither disagree nor agree, 5: slightly agree, 6: agree, 7: strongly agree) � In response to the introduction of environmental regulations, we made significant
investments in “end-of-pipe” equipment to treat emissions generated by the production process over the past five years
� In response to the introduction of environmental regulations, we have made significant changes to our production process over the past five years, in order to reduce the amount of emissions generated
� In response to the introduction of environmental regulations, we have significantly reformulated pre-existing products over the past five years
� In response to the introduction of environmental regulations, we have developed completely new products over the past five years
� In response to the introduction of environmental regulations, a significant proportion of our production activities have been relocated to other countries over the past five years
4.2.1 Results and analysis This chapter reports the descriptive statistics and the results of the estimation for four regressions involving technological responses to the introduction of environmental regulations. In the regression explaining the relocation of production activities in response to environmental regulations, none of the independent variables that we included in the initial specification had a significant coefficient and therefore this regression was not depicted in Table 8. Overall the majority of respondents indicated that they implemented end-of-pipe equipment as well as process integrated technology in response to environmental. It is clear from Figure 11 that the spread is however larger in the case of end-of-pipe equipment compared to the process integrated investments. More respondents disagreed with the statement concerning the introduction of end-of-pipe technologies relative to the statement concerning process integrated technology. The results from the oil and the metals industry show that the respondents from this sector indicate that they invest relatively more in end-of-pipe technology, while respondents from the electricity and the textiles and leather industry invest more in process integrated technologies.

Technological responses to environmental policies
Sectoral Costs of Environmental Policy 84
More respondents slightly or strongly disagree to having reformulated pre-existing products in response to the introduction of environmental regulations than agree with this statement. The proportion of respondents agreeing is however still very large as can be seen in Figure 31 of Annex 3. Fewer respondents agree to having developed new products (see Figure 33 in Annex 3) and even fewer agree to have relocated production activities, 58 % of respondents even disagree strongly (see Figure 33 in Annex 3). a) End-of-pipe investments
0
2
4
6
8
10
12
14
16
StronglyDisagree
Disagree SlightlyDisagree
NeitherDisagree
Agree
SlightlyAgree
Agree StronglyAgree
Num
ber
of
resp
ond
ents
Total Oil Power Textiles Metals
b) Process integrated investments
0
5
10
15
20
25
StronglyDisagree
Disagree SlightlyDisagree
NeitherDisagree
Agree
SlightlyAgree
Agree StronglyAgree
Num
ber
of r
espo
nden
ts
Total Oil Power Textiles Metals
Figure 11: Significant investments in end-of-pipe and process integrated investment in response to the introduction of environmental regulations
The regression results in Table 8 and Figure 12 reveal that companies with an environmental strategy are more likely to invest in end-of-pipe equipment or to reformulate pre-existing products in response to the introduction of environmental regulations. Especially investment in end-of-pipe equipment is strongly driven by the environmental strategy of a company (>60% of variability explained) – see Figure 12. For the facilities that attribute importance to environmental strategy, environmental performance is likely to be an important marketing factor. Therefore, it is not surprising that environmental strategy has a high relative importance index, as end-of-pipe
Technological responses to environmental policies
Sectoral Costs of Environmental Policy 85
equipment allows companies to reduce emissions, which is needed for marketing purposes, without additional changes to the production process.
From the Figure 12, one can notice that in the case of end-of-pipe equipment (60% of variability explained), and the reformulation and development of products (>50% of variability explained if size of company and facility combined), the size variables play a very important role in explaining the variability in the dependent variables. Quite interestingly, the effect of the size of the parent company has an opposite sign to the effect of the size of the facility for product reformulation and development (Table 8). While an increased size of the facility contributes to the development or reformulation of products, an increased size of the parent company seems to impede these processes, probably due to the fact that products would be reformulated at the parent company rather than at the facility level14. In addition, higher administrative constraints on the responses of the facility are likely to be put in place by parent companies of a considerable size. This constraining effect of the parent company’s size cannot be observed in the regression related to the end-of-pipe equipment. With regard to the sectoral component only the textile dummy is retained (see the regression for product reformulation in Table 8), meaning that only in this instance have the sector peculiarities had an influence on responses to environmental regulations.
Among the policies, one can notice that the variable for the ETS Directive takes a negative coefficient. This implies that the policy has somewhat hindered the development of new products, i.e. more precisely the intensity of the effect of the ETS Directive on a facility has a negative effect on the agreement shown by that facility on the statement for product development in Box 3. It should be noticed that in the case of the regression explaining the changes to the production process, only one driver has been retained, namely the Water Framework Directive. The relatively low adjusted R2 can be seen at the bottom of the table, meaning that the statistical model is weak. The importance of the extent to which environmental policies have affected a certain facility in explaining significant responses implemented by that facility is unclear. The relative importance index for the policy variables in Figure 12 is about 130 out of 400 if the regression on changes to production process is taken into account. If the results for this regression are dropped, and on the basis of the low adjusted R2 mentioned above, the relative importance index is about 30 out of 300
Finally, the reason why Table 8 presents only four regressions rather than five is due to the fact that all variables were dropped in the regression explaining the relocation of production activities in response to environmental regulations. This is quite an interesting result as it suggests that relocation is not an issue in relation to the impact of environmental policies. This needs to be somewhat qualified. First of all, relocation could have caused the closure of the plant rather than the partial relocation of production activities. Clearly, the effect of plant closures cannot be observed in our sample. The timeframe should also be borne in mind, as the statement refers to relocation in the last five years. In other words, relocation occurring earlier than five years ago is not registered in the sample. 14 The web-based survey was conducted at the facility level so it is understood that respondents’ answers refer to the facility rather than any other higher level institution, i.e. the parent company.

Technological responses to environmental policies
Sectoral Costs of Environmental Policy 86
However, it is still worth noting that the average of the responses to the relocation statement, i.e. the last statement in Box 3, is the lowest average registered to all the questions asked in the web-survey. As the average is 1.84 the respondents to our survey, in average, disagreed that a significant proportion of the production activities have been relocated to other countries over the past five years because of the introduction of environmental regulations.
Table 8: Technological responses to the introduction of environmental regulations in the last five year.
End-of-
Pipe Production
Process Product
Reformulation Product
Development Size (Facility) 0.60 (3.08) 0.70 (4.19) 0.50 (2.79) Size (Parent) -0.57 (-3.16) -0.67 (-3.78) Environmental Strategy
0.46 (2.27) 0.48 (1.81)
Textile and Leather Sectors
1.49 (2.88)
NEC Directive 0.36 (2.30) Water Framework Directive
0.46 (3.20)
Adjusted R2 0.16 0.09 0.28 0.18 Notes: the numbers between parentheses denote the t-statistics for the coefficients shown in the table.
0%
10%
20%
30%
40%
50%
60%
70%
80%
90%
100%
End-of-Pipe Changes to productionprocess
Product Reformulation New Products
Size (Facility) Size (Parent) Strategy NEC Textile Water Framework
Figure 12: Responses. Relative importance index for the regression related to the facilities’ responses to the introduction of environmental regulations
Notes: indices of policy variables are shown by bars surrounded by a red broken line; indices of sector and location variables are shown by bars with a black pattern.

Technological responses to environmental policies
Sectoral Costs of Environmental Policy 87
4.2.2 Conclusions In the last five years environmental strategy and the size of the plant and the parent company have been important determinants of a facility’s response to the introduction of environmental regulations. Facilities with a good environmental strategy invested significantly more in end-of-pipe technologies to treat emissions generated and were more likely to reformulate pre-existing products. Environmental policies have not been a very important factor in explaining investments in end-of-pipe technologies, the reformulation of pre-existing products or the relocation of the facility to other countries. However, environmental policy seems to be considered as an important driver for developing new products and changing the production process to reduce the amount of emissions generated. We also notice that respondents to our survey disagreed with the fact that relocation to another country has been a significant modality of responding to environmental regulations in the last five years. None of the policy, location or plant/company variables used in this study explained the relocation of production activities in response to the introduction of environmental regulations. Hence, the analysis of the primary survey data indicate that the introduction of environmental regulations has not been a significant determinant for the relocation of economic activities in the sectors assessed in this study.
4.3 Cases-study on technological responses from the oil and electricity sectors
The present case studies on the mineral oil and electricity generation sectors15 focus on the impact of the legal framework on innovation behaviour. A special emphasis was given to atmospheric pollution, being considered both the most relevant field of pollution and the domain with the highest investments in environmental protection for the sectors alike. The theoretical background for the case studies is the Porter hypothesis, according to which, environmental regulation can lead to a competitive advantage for the affected firms (Wagner, 2003). Although the hypothesis has been formulated already in 1991, little research has been undertaken up to date and that mostly in the US. Hence, we need to rely on hypotheses rather than on statistical evidence. Thus the case studies build primarily on interviews with expert stakeholders. The most relevant Directives for the two sectors are: Volatile Organic Compounds (VOC, implemented 1995), Large Combustion Plants (LCP, implemented until 2003), Emissions Trading Scheme (ETS, implemented 2005), Integrated Pollution Prevention and Control (IPPC, implementation 2007), Volatile Organic Compounds II (VOC II, implemented 2007) and National Emissions Ceilings (NEC, implementation ongoing).16 Electricity – Combined Cycle Gas Turbine Power Plant While there are a number of Directives fostering reductions in emissions from power plants, it is rather difficult to implement these reductions as process-integrated innovations. The reasons for that lie first of all in the fact that research and development in
15 For the other sectors, case studies with a different perspective were carried out. 16 For a list of the most relevant Directives and their implementation, see full case study in Annex 4.

Technological responses to environmental policies
Sectoral Costs of Environmental Policy 88
the electricity sector are to a very large extent performed by technology suppliers. Thus the addressees of the regulation do not coincide with the relevant actors in the field. Of course, the electricity companies have the option to choose from the available technology and may even work in close co-operation with technology suppliers. Still, electricity suppliers act more or less as customers of turn-key-ready products instead of being developers of new power plant technology themselves. The hypothesis for the electricity sector is that electricity suppliers answer the need to curb a varied set of emissions by choosing a relatively new type of power plant, Combined Cycle Gas Turbine. CCGT power plants use part of the process heat generated by the first conventional combustion cycle to run a secondary steam powered cycle with considerably lower process temperatures. Thus total electric efficiency is increased to values above 60%, compared to 43-47% for conventional power plants, while at the same time keeping emissions at the lowest possible level of all combustion power plants. These values can be even increased to thermal efficiency values above 85% in case of cogeneration, where excess process heat is bled from the second cycle and used either in industrial applications or as district heating and cooling. Indeed, the share of CCGT electricity generation in total output has risen considerably throughout Europe from just 1% in 1990 to 8% in 2001. While the same trend can be observed in all old Member States, the UK and Italy stick out with respective shares in electricity production of 34% and 29% in 2005. Recent research estimates a CCGT share in the UK for 2010 of more than 60% (Bower, 2004). The technology looks to be a promising candidate for carbon capture and sequestration via Integrated Gasification technology. Thus, CCGT could play a role as a link between older conventional combustion technologies and the possible use of renewables in the future. They can bridge the technological gap between energy demand and renewables’ supply with their proven technology. Furthermore, CCGT type plants have a very short time span for development of only 10 years, while their lifetime is 20 years for the turbines and 40 years for the plant. Given that most renewables deliver an uncertain weather dependent supply, CCGT plants can be used to assure continuous electricity supply. The uncertain legal framework is the main obstacle for a further spread of CCGT and a hurdle for R&D in new CCGT plants offering possible electric efficiency well above 65%. Long-term planning safety together with stricter emission thresholds could be the pillars on which shareholders could base a higher commitment to R&D in CCGT. Thus, technology suppliers would welcome first of all a longer time horizon for environmental legislation and stricter environmental requirements. The main point of concern here is that the GHG Emissions Trading Scheme Directive has very short commitment periods of just 5 years, a very unclear future beyond 2013 and lastly a high uncertainty regarding the future carbon price. As the electricity market is not subject to open international competition, electricity suppliers can pass on any financial burden resulting from environmental regulation onto their customers. Hence, while the Directives may not cause a competitive distortion in the electricity market, they may very well lead to distortions in other, energy-intensive sectors, such as steel and base metals.

Technological responses to environmental policies
Sectoral Costs of Environmental Policy 89
Findings: Although the case study had a very limited scope and thus can not yield universally valid findings, a number of relevant issues have emerged. These can be grouped into issues related to the inherent structure of the market and those related to impasses in the legal framework. Firstly, the electricity market itself is only partially liberalised, resulting in little incentive to invest in innovation. Thus the main innovation drivers are not the electricity companies but the technology suppliers. The main impasse of the legal framework for the electricity sector is its ephemerality. Large scale investment in fundamentally new processes and new technologies needs first of all a reliable long-term planning horizon. A long-running credible timetable with emission thresholds would lower the risk of investment and thus encourage R&D. Despite the above mentioned findings, the rising prices for gas – when compared to lignite and hard coal – in the recent years has had a decisive influence on the spread of CCGT technology. This factor is difficult to separate from the influence of the legal framework and thus renders a final interpretation difficult. Oil – Fully Integrated Refinery Mineral oil companies are usually highly integrated companies, covering the entire oil chain from extraction to the refineries and the refined products retail market. As extraction is less important in the Member States, with the exception of Denmark and the UK, the case study focuses on the most complex step in the oil chain: the refining process. While the refining process itself cannot be fundamentally changed, thus limiting the scope of process-integrated innovation, there are two distinct areas where refineries can and have improved their environmental performance: firstly, by increasing their resource efficiency and secondly, by employing end-of-pipe technology. As the oil chain itself is already highly integrated, it is relatively straightforward to integrate all processes in the refineries as well, leading ultimately to the fully integrated refinery. According to the hypothesis, oil companies have answered the diverse environmental requirements by adopting the concept of the fully integrated refinery. The guiding theme is to use or sell all by-products, thus minimising total waste and pollution. A task that has not become easier to fulfil is that European gasoline standards require producers to deliver ever cleaner fuels. Particularly, the disposal of unwanted sulphur residuals causes a problem. Nevertheless, vast progress has been made, especially by integrating electricity generation and heat supply in cogeneration or combined heat and power plants on-site. Traditionally, excess refinery gas has been flared, causing high emissions of volatile organic compounds (VOC), NOx and SO2. By using this refinery gas as a combustible product, the plant can both reduce pollution and increase its resource efficiency, thus generating higher profits, which can be viewed as a win-win situation. Where possible, refineries employ CCGT and CHP technology to supply their installation with electricity and process heat. This development can be observed in all refineries in all Member States, except the New Member States. In the latter, flaring is still very common, although progress can be expected in the near future.

Technological responses to environmental policies
Sectoral Costs of Environmental Policy 90
It is understood that refineries have much more options to improve their environmental performance than could possibly be listed in the case study. The relevant IPPC BREF document for refineries (EIPPCB, 2003a) lists more than 600 best available technologies how to improve their environmental performance. Besides improved sealings and better insulation, emissions can considerably be lowered by end-of-pipe flue gas scrubbing. These measure are clearly benefiting the environment, are definitely not increasing resource efficiency. Thus it is in that field where direct regulation impacts most on investment decisions. Nevertheless, some firms chose to over comply with legal requirements when installing new flue gas scrubbing units. The main lesson to be learnt from the study is that refinery processes can only be improved up to a certain degree. Some by-products and emissions are inherent to the refining process and can not be circumvented as long as crude oil remains the resource. These can always technically be alleviated by end-of-pipe technologies, though only as long as the investment is economically viable. Although the oil chain is a highly international business, retail markets tend not to be subject to international competition and are mostly characterised by oligopolistic competition. Most refined oil products are retailed in relative proximity of the refineries, although some pipelines for final products exist. Thus, expenditures related to environmental requirements can be passed on to the end consumer without competitive distortion. The main point of critique from the industry is that Directives with different approaches coexist and may lead to reduced market efficiency. Most notably, the IPPC Directive calls for Europe-wide application of best available techniques for environmental protection, while the European Emission Trading Scheme for greenhouse gases, as a market-based instrument, promotes least cost abatement. A more clear-cut position of policy makers would allow industry to better allocate their financial resources. Findings: When looking at the oil industry, the picture is slightly different from the other sectors studied. Here the polluter and innovator coincide. Furthermore, investment cycles are considerably shorter than in the electricity sector. Yet, the situation can be improved. The main critique of some firms is that some Directives have different approaches and thus result in lower overall efficiency if applied together, as is the case with IPPC (a Best Available Techniques-based approach) and ETS (a market-based mechanism).

Chapter 5:
Environmental expenditures in response to environmental policies
This chapter investigates how environmental policies affect investment expenditures in process, product and end-of-pipe technologies. The empirical analysis of primary survey will be complemented with a comparative analysis of data on environmental expenditures.


Environmental expenditures in response to environmental policies
Sectoral Costs of Environmental Policy 93
5 ENVIRONMENTAL EXPENDITURES IN RESPONSE TO ENVIRONMENTAL POLICIES
5.1 Contextual background
5.1.1 Environmental expenditure in general
For the purpose of this study, environmental expenditure is defined17 as the spending incurred by companies where the primary aim is to prevent or reduce environmental pollution caused during normal operations. More specifically, that is, expenditure related to:
- reduce or prevent emissions to air or water; - dispose of waste materials; - protect land, soil and groundwater; - prevent noise and vibration; or - protect the natural environment.
Environmental expenditure includes:
- the purchase price of capital goods: investment expenditure on environmental protection;
- operating (running) costs of the company’s own ‘in-house’ environment management and control activities. This may include the operation and maintenance of environmental investments, and costs related to environmental related research;
- ‘external’ operating costs including payments to others for environmental protection services such as waste disposal, soil sanitation, auditing;
- ‘administrative’ costs (i.e. permitting, internal auditing, etc.); - interests on investments; - as ‘negative costs’: any revenues and cost savings resulting from environmental
expenditure e.g. savings from using alternative materials or income from selling by-products.
Environmental protection expenditure does not include: - costs of actions and activities that are beneficial to the environment that would
have been taken regardless of environmental protection considerations (e.g. a new production line that leads to lower unit production costs and at the same time leads to less pollution); measures that aim at health and safety of the workplace) ;
- depreciation/write-offs; - payments of environmental taxes (energy or carbon taxes, water extraction taxes,
landfill taxes); - VAT: expenditure should be reported exclusive of VAT; - expenditure relating to health and safety.
It is not straightforward to gather data on environmental expenditure of companies. Joshi et al. (2002) examined the extent to which accounting systems separately identify all the costs of environmental regulation. Typical accounting systems easily identify and hence separately capture and accumulate “visible” costs of environmental compliance, such as installation and maintenance of pollution-control equipment and end-of-pipe emission treatment costs. It becomes more difficult for integrated investments, where companies
17 Based on Eurostat (2006a) and Commission Regulation (EC) N° 1670/2003 of September 1, 2003

Environmental expenditures in response to environmental policies
Sectoral Costs of Environmental Policy 94
have to separate environmental part of the investment in a total investment, which can only be done by estimation, as criteria for separating integrated investments from total investments and for operational costs (administration, operation and maintenance of installations) are difficult to apply. Environmental compliance costs are usually measured as small. Across manufacturing they account for well under 1 percent of gross output, but vary across industries and depend on the definition used (Hitchens et al, 2000). A further literature review was used to determine threshold values in our survey. Jenkins et al. (2002) report several measurements to express the magnitude of the environmental expenditures made by different industries in different countries and time periods. Table 9 provides an overview of these with the magnitude of environmental expenditures ranging from 0.01% to 14.7%.
Table 9: Overview of magnitude of environmental expenditure
Country /
Region Industry Measurement Value
US cement pollution abatement operating cost to value of output
3.17 %
US printing & publishing
pollution abatement operating cost to value of output
0.01 %
Japan proportion of investment devoted to pollution control
3.5 %
Netherlands proportion of investment devoted to pollution control
4.5 %
US proportion of investment devoted to pollution control
5.5 %
Europe tanning environmental protection costs / costs of production
5 %
Europe tanning percent of the turnover 2-4 % Germany tanning environmental protection costs / total
cost of production 3-5 %
Germany tanning share of environmental protection investments in total investments
14.7 %
Germany chemicals share of environmental protection investments in total investments
12.6 %
Germany manufacturing share of environmental protection investments in total investments
4.6 %
Portugal tanning environmental control costs / turnover 2-3 % (1) (1) The cost was expected to double by 1998 with the forthcoming requirements for tertiary treatment and stricter EU regulation, among other things.” Defra (Department for Environment Food and Rural Affairs, UK) reported the results from the UK survey on 2004 environmental protection expenditure by industry in sector reports. The results for the four industries of our concern are summarised in Table 12, with the environmental expenditures as percentage of total overall spending/turnover ranging from 0.49% to 0.8%.

Environmental expenditures in response to environmental policies
Sectoral Costs of Environmental Policy 95
Table 10: Overview of magnitude of environmental expenditure in specific sectors
Environmental expenditure / turnover
Textiles, clothing & leather (1)
Coke, petroleum &
nuclear fuel (2)
Basic metals & fabricated
metal (3)
Electricity, gas & water
sector (4) Overall spending / turnover
0.5 % 0.49 % 0.8 % 0.5 %
Operating expenditure / turnover
0.5 % 0.5 % 0.6 % 0.4 %
Capital expenditure/ turnover
0.1 % 0.5 % 0.1 % 0.1 % (1) Defra (2006a) (2) Defra (2006b) (3) Defra (2006c) (4) Defra (2006d)
Eurostat (2005c) reports figures of 2002 expenditure on environmental expenditure in industry ranging from 1.50 % of gross value added in Spain to 5.41 % in Slovakia.
5.1.2 Environmental taxes, charges and other financial incentives to reduce pollution
All Member States use environmental taxes, charges and other financial incentives to enforce environmental measures and improvements. These financial instruments will also affect the selected sectors in this study and thus may affect total environmentally related expenditures of industry. There is a wide variety of taxes and charges that is applied, but by far most revenues are linked with the use of vehicles (road and vehicle tax, fuel excises) and energy (energy related taxes). The revenues of these so called environmental related taxes are in most cases not earmarked for environmental protection, but in general are used for the public budget. But apart from these taxes, many Members States have implemented a variety of more specific environmental taxes and charges (sometimes revenues are earmarked, sometimes not) for example on air pollution (CO2, NOx, SO2, particle matter), water pollution (waste water charges), waste management (landfill taxes), but also resource related taxes and charges (water extraction charges, energy taxes). These taxes and charges may affect the slected sectors in this study to a certain extend, as the taxes and charges may add to the production costs of the sectors in question. In some cases, the revenues of environmental taxes and charges are (partly) returned to the paying sectors, by application of environmental funds (mostly in the new Member States) or other subsidy schemes. Also, if the payments by industries are related to the level of air emissions, discharges to water or waste dumped on landfills, industries can influence their payments (and thus the burden of taxes and charges) by reducing pollution and cleaner technologies. Currently, the impression exists that the cost burden of these taxes and charges to industry is relatively low, compared to the costs industries make to comply with environmental regulations. But there are some signals that these external costs are increasing (see below).

Environmental expenditures in response to environmental policies
Sectoral Costs of Environmental Policy 96
Also the implementation of Kyoto (including carbon trade) will inevitably lead to increasing external environmental expenditures for industries. Detailed information on taxes related to the environment of OECD members can be found in the OECD/EEA database on instruments used for environmental policy and natural resources management. This database also contains information on other instruments, such as tradable permit systems, deposit refund systems, environmentally motivated subsidies and voluntary approaches used in environmental policy in OECD Member countries, EEA member countries and some other countries. (see: http://ec.europa.eu/environment/enveco/database_env_taxation.htm)
5.2 Empirical analysis of a company’s environmental expenditures
5.2.1 Introduction The scale of the environmental protection expenditure undertaken by a particular plant can be assessed in (i) absolute terms (such as in € etc.), (ii) as a percentage of some other financial value (such as turnover, value added, profits, or total investment (capital expenditure)), or (iii) as a perception of the relative magnitude of costs. The advantage of the second approach is that respondents may be more willing to divulge information on expenditures in percentage terms rather than absolute terms, which may be seen as being commercially sensitive information. The disadvantage is that the comparator measures may not always be available at the plant level, or that different measures may be required at different plants. Furthermore, the validity of dividing environmental expenditure (which is a mix of capital, operating costs, administrative costs, and taxes according to this study) by any of the potential financial comparators is open to question. The third approach has the advantage that when expenditure numbers are not available, either as an absolute number or as a percentage, there is still a measure for the dependent variable. While it is possible to have separate questions for the different types of expenditure (i.e. investments, current expenditures. etc.), it seems dubious whether respondents would be able to provide a reliable assessment at this level of detail. However, we considered it useful to at least to split administrative costs and taxes from production-related costs. In order to ensure responses on environmental expenditure questions we included most of the possible varieties discussed above in the questionnaire. The questions were ordered in a way that the least sensitive questions were asked first. In that way we still obtained data on the dependent variable even when a respondent dropped out when confronted with a sensitive issue. Respondents were asked about the relative size of four facets of environmental expenditure, namely end-of-pipe technology, process integrated technology, operating costs and investments as a whole. Two sets of questions were asked. In the case of the first, which is indicated with “QUAL” in the table and in the figure below, respondents answered on the basis of a qualitative scale (from very low to very high). In the other, indicated with “QUANT”, they had to select a percentage range – see Box 4. Information on end-of-pipe and process integrated technology was collected through qualitative questions; information on the investment as a whole was collected through quantitative

Environmental expenditures in response to environmental policies
Sectoral Costs of Environmental Policy 97
questions; information on operating costs was collected through both types of questions. Respondents were asked to assess the size of environmental investment and operating costs relative to the total investments and operating costs, respectively. The statements from which the variables used in the regression were built can be seen in Box 4. Box 4: Statements related to the facilities’ environmental expenditure
5.2.2 Results and analysis Five variables are used to measure the plant’s environmental investment and operating expenditure relative to total investment expenditures and operating costs. In a first set of questions, the respondents were asked to assess the magnitude of their environmental investment expenditure and environmental operating costs in a qualitative way. Average and high are the most frequent results (both 33 % of respondents) for the magnitude of the environmental investments into process integrated in comparison to total investment. In case of end-of-pipe investments the respondents most frequently estimate these as being high (30 %). In this case, however, the spread between answers is larger. 16 % of respondents assess their end-of pipe investments to be very low and 14 % as very high. For the process integrated investments these percentages represent 3 % and 11 %, relatively. The oil industry estimates their end-of pipe investments to be relatively higher, while the electricity sector estimates them to be lower than the process integrated environmental investments. For the metals and the textiles and leather industry the
From the following five options, please indicate which most closely represents the relative magnitude of your investment expenditure on environmental protection compared to total investment expenditure over the past five years: (1: Very low; 2: Low; 3: Average; 4: High; 5: Very High)
� Investment in pollution control (End-of-pipe technology) � Investment in pollution prevention (Process integrated technology)
From the following five options, please indicate which most closely represents the relative magnitude of your current (operational) expenditure on environmental protection compared to your total operating costs over the past five years: (1: Very low; 2: Low; 3: Average; 4: High; 5: Very High) From the following five options, please indicate which most closely represents your average annual investment expenditure on environmental protection as a percentage of total investment expenditure over the past five years (1: less than 1%; 2: 1% - 5%; 3: 5% - 10%; 4: 10% - 20%; 5: more than 20%): From the following five options, please indicate which most closely represents your average annual current expenditure on environmental protection as a percentage of total operating costs over the past five years: (1: less than 0.5%; 2: 0.5% -2.5%; 3: 2.5% - 5%; 4: 5% - 10%; 5%: more than 10%)

Environmental expenditures in response to environmental policies
Sectoral Costs of Environmental Policy 98
distribution of answers on the question relating to end-of-pipe investments and process integrated look generally the same. When comparing the magnitude of operating costs on environmental protection to total operating costs the most frequent answer is ‘average’, only the textiles and leather industry has a larger share of respondents choosing ‘low’. In the next set of questions the respondents were asked to assess their environmental expenditure in a more quantitative way. The distribution of the answers on this question is depicted in Figure 13. Overall respondents most frequently estimate their investment expenditure on environmental protection to be 1-5 % of total investments an their operating expenditure on environmental protection to be 0.5-2.5 % of total operating expenditure. Surprisingly, a relatively large proportion of respondents (21 %) estimate their environmental investment to be more than 20% of total investment. Especially the oil industry estimates both expenditures to be relatively higher. the electricity sector and the metals industry also give a high estimation of their investment expenditures with a mode of > 10 % and 2.5-5 % respectively. a) Investments in environmental protection as percentage of total investment
0
4
8
12
16
20
less than 1% 1% -5% 5% - 10% 10% - 20% more than 20%
Num
ber
of r
espo
nden
ts
Total Oil Power Textiles Metals
b) Current expenditure on environmental protection as a percentage of total operating costs
0
5
10
15
20
25
30
less than 0.5% 0.5% - 2.5% 2.5% - 5% 5% - 10% more than 10%
Num
ber
of r
espo
nden
ts
Total Oil Power Textiles Metals
Figure 13: Quantitative assessment of environmental expenditure by respondents
The regression results can be seen in Table 11. Environmental strategy and a pro-active attitude are important drivers for investment and operational expenditure on environmental protection. The coefficients on the former are significant and positive for investment

Environmental expenditures in response to environmental policies
Sectoral Costs of Environmental Policy 99
expenditures in end-of-pipe and process integrated technologies as well as for operational expenditures on environmental protection, while the coefficients on the latter are positive for operating costs but negative for end-of-pipe and process integrated investments. In other words, environmental strategy increases the size of both environmental investments and operational expenditures, while anticipating environmental regulation decreases the relative size of environmental investments and increases the size of the operational expenditures on environmental protection. In Figure 14 one can notice that the sum of the relative importance index for environmental strategy and pro-active attitude is higher than 60% in the case of investments in process integrated technology. Autonomy of the facility from the parent company increases the relative size of investment in end-of-pipe technology, although its effect is small, as the relative importance index is about 10% – see Figure 14. In the last five years plants located in Northern Europe experienced relatively smaller environmental investment and operational expenditure on environmental protection. This is probably due to the fact that the Northern European companies are among the leaders in investing in environmental friendly technologies so that in comparison with the other regions less investment and operational expenditures were needed to comply with the EU environmental. Probably it were particularly the new Member States that had to invest in environmental protection in order to catch up with the old Member States when joining the EU.
With regard to the policies affecting investment and operational expenditure on environmental protection, one can notice the relative uniformity of the coefficients across the columns of the table. The IPPC, the Waste Framework and the LCP Directives are the policies retained in the final specifications presented in Table 11. The LCP and Waste Framework Directive are important drivers of operational expenditures on environmental protection regardless of the format – qualitative or quantitative – in which the questions are asked. This testifies to the robustness of the results from the statistical analysis. These two policies – LCP and Waste Framework- were also significant determinants of investment expenditures in end-of-pipe technologies, while the IPPC Directive is an important driver of investment expenditure in process integrated technologies. Unfortunately, the same cannot be said about the dummies used to measure the importance of the sectors in explaining the relative size of environmental expenditure. In particular, the facilities in the Textile and Leather sector and those in the Metal sector seem to have a higher relative size of end-of-pipe investment (see second column in Table 11) when compared to the electricity sector, i.e. the sector used as baseline, but a lower relative size of the investments as a whole (see fifth column in Table 11). However, this result can be explained by the fact that the investment in the electricity sector is mainly of a process integrated nature. In the case of the oil sector one can notice the opposite sign of the coefficients on the sectoral dummy in the operating cost regression, i.e. negative when the question is framed in a qualitative and positive quantitative terms. These contrasting signs could be due to the fact that respondents felt somewhat reticent about disclosing the relative size of their environmental expenditure as a percentage and provided information of lower quality compared to the information provided to the qualitative questions. However, as this contrasting sign can be observed only in the case of the sectoral dummies, it could also be due to the relatively small number of observations in each sector. For the sectoral dummies one can also notice the difference in the relative

Environmental expenditures in response to environmental policies
Sectoral Costs of Environmental Policy 100
importance index. These dummies seem to be much more important in the case of the quantitative questions than in the qualitative questions. The reason for this difference is however unclear.
Table 11: Expenditure. Magnitude of environmental investments and operating costs compared to total investments and operating costs over the past five years.
Notes: the numbers between parentheses denote the t-statistics for the coefficients shown in the table.
End-of-pipe
(qual)
Process Integrated
(qual)
Operating Costs (qual)
Investments (quant)
Operating Costs
(quant) Environmental Strategy
0.56 (4.27) 0.55 (4.40) 0.17 (1.80) 0.21 (1.79)
Pro-active Attitude
-0.36 (-2.12) -0.22 (-1.96) 0.29 (3.45)
Autonomy 0.31 (1.83) Oil Sector 0.72 (2.16) -0.50 (-2.01) -0.52 (-1.99) 1.00 (3. 41) Metals 1.27 (3.37) -0.62 (-2.06) Textiles and Leather
0.67 (1.84) -0.37 (-2.19) -0.94 (-3.01)
Northern Europe
-0.68 (-2.02) -0.72 (-5.28)
IPPC Directive 0.28 (3.86) 0.35 (2.77) Waste Framework
0.38 (2.36) 0.33 (3.33) 0.24 (1.67)
LCP Directive 0.25 (2.78) 0.17 (2.15) 0.16 (1.85) Adjusted R2 0.28 0.26 0.34 0.26 0.15

Environmental expenditures in response to environmental policies
Sectoral Costs of Environmental Policy 101
0%
10%
20%
30%
40%
50%
60%
70%
80%
90%
100%
End-of-pipe (qual) ProcessIntegrated (qual)
Operating costs(qual)
Investments(quant)
Operating Costs(quant)
Attitude Strategy Autonomy NorthOil Metal Textile IPCCETS Waste Framework LCP
Figure 14: Expenditure. Relative importance index for the regression related to the facilities’ environmental investments and operating costs.
Notes: indices of policy variables are shown by bars surrounded by a red broken line; indices of sector and location variables are shown by bars with a black pattern.
5.2.3 Conclusions One can conclude that in the last five years facilities with an environmental strategy spent a considerable higher amount of investment expenditures and operational expenditures on environmental protection. Facilities with a pro-active attitude are more likely to have higher operational expenditures on environmental protection, while their investment expenditures on end-of-pipe and process integrated technologies will be smaller. Environmental policies such as the LCP, IPPC and the Waste Framework Directives are important drivers of investment and operational expenditures on environment protection. In some instances, the sector to which facilities belong was also an important factor.
5.3 Comparative analysis of Eurostat’s environmental protection expenditures
5.3.1 Data
Some of the National Statistical Offices started data collection on environmental expenditures as early as from the beginning of the 1980s (the Netherlands, Germany). Initiated by Eurostat, this experience was used at EU (and OECD) level to develop guidelines on data collection, in the beginning of the 1990s. This resulted in the

Environmental expenditures in response to environmental policies
Sectoral Costs of Environmental Policy 102
development of SERIEE, the European System for the collection of economic data on the environment (Eurostat (1994a/b)). From 1995 onwards, data have been collected by National Statistical Offices and submitted to Eurostat, which have published these data on their website. Although not available for all year from 1995 onwards, and not for all Member, the data published by Eurostat can be used to get an impression of the importance of Environmental Protection Expenditure (EPE) in the industry. From 1995 to 2000, Eurostat publishes only data on investments EPE in Member States, from 2001 onwards, also current EPE are published. In paragraph 5.3.3, a summary of these data is given for the EU average. To fill the gaps of lacking data for some years and some Member States, the available data on environmental expenditure have first been divided by total gross production values at Member State level. This results for each year in a certain number of observations of relative environmental expenditures. The number of available observations is presented in the graph below.
minimal
maximal
0
3
6
9
12
15
18
21
1995 1996 1997 1998 1999 2000 2001 2002 2003 2004 2005
number of observations
Figure 15: Number of minimal and maximal observations available at Eurostat databases on environmental protection investments in Member States
It can be seen that the number of Member States that submit data on environmental protection investments increased from 2 in 1995 to a maximum of 20 in 2004. The difference between the minimum and maximum number of observations is linked with the sectoral coverage, which is not the same in all Member States.
5.3.2 Analysis From the available observations, the relative annual environmental investment expenditures in the EU are calculated (broken lines) as the un-weighted sectoral averages of data for the Member States. For the current annual EPE (data available from 2001 onwards) for all of the Member States data have been estimated for all years, either by inter- or extra-polation, so as to avoid unlikely annual fluctuations, due to different Member States coverage of the sample. The resulting total environmental protection expenditures are shown by the full lines in Figure 16.

Environmental expenditures in response to environmental policies
Sectoral Costs of Environmental Policy 103
0,0%
0,5%
1,0%
1,5%
2,0%
2,5%
3,0%
1995 1996 1997 1998 1999 2000 2001 2002 2003 2004 2005
% of production value power investm
refineries investm
mining investm
base metals investm
textiles investm
power tot EPE
refineries tot EPE
mining tot EPE
base metals tot EPE
textiles tot EPE
Figure 16: Environmental Protection Expenditures (EPE), average for the EU, 1995 – 2005 (investments) and 2001 – 2005 (total EPE), as % of total sectoral production value, based on Eurostat EPE and EU klems
This graph shows the annual EPE in the 5 sectors studied for the period 1995 – 2005. Sector investments EPE show several peaks, but are never higher than 1.5% of sectoral production values. Investments EPE are higher in the sectors strongly related to energy policy (refineries, mining and power), EPE investments in the base metals (less than 0.25% of production value) and textile industry (lower than 0.15% of production value) are at a lower level. The graph also shows that the level of total annual EPE (shown for the period 2001 – 2005) is highly influenced by the pattern of EPE investments. Current expenditures (the difference between total and investment EPE) are more or less stable. Expressed as percentage of production values, no general upward or downward trend for the EPE can be recognised in the period 1995 – 2005. Relatively high levels of total EPE are typically the result of incidental peaks in EPE investments. After 2001 Eurostat not only started to collect information form Member States on current environmental expenditures, but also on the distinction between end-of-pipe and integrated investments EPE. Although surveying integrated investments requires more advanced statistical techniques, most Member States have been able in the last years to submit such information to Eurostat. This being the case, it is interesting to assess the share of integrated investments in total environmental investment expenditures, and also possible trends (although the period for surveying this information is relatively short). For each of the 5 sectors studied, the integrated investments have been summed to a European total and compared with the total environmental investments in the EU as recorded by Eurostat (Figure 17).

Environmental expenditures in response to environmental policies
Sectoral Costs of Environmental Policy 104
mining
textiles
refineries
base metals
power
total
0%
10%
20%
30%
40%
50%
60%
70%
80%
2001 2002 2003 2004 2005
Figure 17: Integrated investments as percentage of total environmental protection investments, EU weighted average, based on Eurostat EPE
Figure 17 shows the share of integrated investments in total environmental investments for the EU. On average, between 35% and 50% of environmental investments is classified as integrated. For some of the sectors an upward trend seems to be present: textile, refineries and the base metal sector. However, no firm conclusions can be drawn from this result, as for 2001 and 2005 the number of observations is much lower than for the years in-between. In the other sectors such a trend cannot be observed. For the oil and gas extraction (‘mining’) sector, it appears that integrated investments come down to between 20 – 35%, for the electricity sector integrated investments seem to fluctuate between 35% and almost 70% at EU level. The conclusion can be that integrated investments form an important part of all environmental investments in the EU, apparently leading to a more cost effective compliance than with the application of end-of-pipe technologies. Finally, the annual environmental protection expenditure are compared between the EU (average of 2001-2005), Australia and the US (Figure 18).

Environmental expenditures in response to environmental policies
Sectoral Costs of Environmental Policy 105
0,00%
0,25%
0,50%
0,75%
1,00%
1,25%
1,50%
1,75%
2,00%
2,25%
2,50%
text
i les E
U
texti
les
Austra
lia
texti
les U
S
refin
eries
EU
refin
eries
Austr
al ia
refin
eries
US
base
metal
EU
basemetal A
ustra lia
base
metal
US
power
EU
pow
er U
S
of production value
air water
waste other
Figure 18: Annualised environmental expenditures as percentage of gross production value for different sectors and per environmental domain for the European Union, Australia and United States of America
Source: based on Eurostat EPE statistics, Euklems (Average 2001-2005), EPA US (1999), and Australia Statistics (2001) In general, we can conclude that the environmental expenditure in the EU account for broadly similar levels of costs for firms operating in the EU, Australia and the United States. But as no recent data are available for the US (1999) and Australia (2001) this conclusion should be considered with care.
5.4 Comparative analysis of sectoral environmental expenditure at the level of Member States
5.4.1 Data
The comparative sectoral analysis further focuses on cost structure (environmental expenditures per domain) and on the relative level of expenditures compared to sectoral production or output. For the comparative sectoral analysis of environmental investments data were collected from Eurostat for 7 EU Member States for which some (short) time series are available on the Eurostat website. These countries are: the Netherlands, Slovenia, United Kingdom, Hungary, France, Czech Republic and Germany. All but Czech Republic were target

Environmental expenditures in response to environmental policies
Sectoral Costs of Environmental Policy 106
countries in our survey. In Chapter 1 the availability of data on environmental investments is already discussed. For some countries the whole period 2001 – 2005 is covered, for others only partial data are available. For the comparative sectoral analysis of annual environmental expenditures, data have been collected for 11 countries: 9 Member States of the EU (Austria, Czech Republic, Germany, Estonia, Spain, Netherlands, Poland, Sweden and United Kingdom) and the United States and Australia. In the majority of cases data have been obtained through the respective websites of the National Statistical Offices, whereas for Poland and Spain data of Eurostat have been used. In Table 12 the details of the data availability are presented.
Table 12: Data available from statistical offices on environmental expenditures by type of domain
Country Air Water Soil Waste Noise Nature Admin-istrative
Other/ Multi
domain Australia x x x x x x Austria x x x x Czech Rep x x x x x Germany x x x X Estonia x x x x X x x Spain x x x X x x Netherlands x x x x X x x Poland (x) x (x) x Sweden x x x x United Kingdom x x x x X x x United States x x x x x x x All countries present data on the three main domains of environment: air, water and waste18. For the other domains only about half of the 11 countries publish (detailed) data. Of the 9 EU Member States analysed, only 2 publish data on administrative costs (also Australia and the US present these costs). For other Member States, these costs are hidden in the general domain “other costs”. This makes it hard to analyse the possible development of these costs to industry. Despite the current focus of environmental policy on climate change, so far little to no information on expenditures linked with climate policy is available. The costs (if recorded) are probably hidden in the air pollution / emissions domain. A reason why these expenditures are not yet clearly recorded/published may be that it is not evident how to record costs of climate policy, as in many cases, the incremental investments will be paid back (at least partly) by revenues from energy savings19.
18 For Poland only water and all other domains together are published by the Polish Statistical Office, for Spain, in the national publication for current expenditures no distinction between domains is made. 19 In the Dutch annual survey on environmental expenditures in Industry, the following accounting rules are given: (1) assess the additional investment expenditures of the environmental friendly device, compared to the non environmental friendly device and (2) assess if the additional investment expenditures are NOT earned back within 3 years (if within 3 years, it is assumed to be a non environmental investments and should not be recorded as environmental) (CBS, 2006)

Environmental expenditures in response to environmental policies
Sectoral Costs of Environmental Policy 107
In Table 13, information is summarised on time series available, the detail level for the information on investments (as a total and/or also split up in end-of-pipe and integrated environmental investments), and details on the operational costs.
Table 13: Data available from statistical offices on environmental expenditures by years and category of expenditure
Country Years CAPEX Integrated Investm. OPEX External
expend. Revenues Annualised costs
Eurostat 2001-2005 x x X Australia 2001 x X Austria 2004 x x X Czech Republic (1985-)2005 x X x
Germany 1994-2003 x x X x Estonia 2004 x x X x x Spain 2004 x x X Netherlands 1990-2005 x X x x Poland 2000-2005 x Sweden 1999-2004 x X UK 2000-2004 x X United States 1999 x x X x
CAPEX: capital expenditures OPEX: operational expenditures Consistent long time series are only available for a few countries (Czech Republic, Germany and the Netherlands). It should be noted that the most recent data on environmental expenditures in Australia and the United States are already 6 to 8 years out of date. This makes it hard to make an analysis of the dynamics of environmental expenditures in the longer term, which would be representative for the EU (or OECD). Therefore, in this Chapter the analysis of these dynamics is only presented for 1 country (the Netherlands), which at least shows how dynamic environmental expenditures are. All countries publish data on capital expenditures (CAPEX = environmental investments), but only half of them detail these investments further to end-of-pipe and integrated in national statistics. At the same time, Eurostat publishes data on integrated investments for these countries. So sometimes, at a national level less detailed data is published than at the European level. All countries, except Poland, publish data on operational expenditures (OPEX) in national statistics. But only a very few countries provide more detailed information on the structure of the operational expenditures. Actually only 3 of the 11 sources referred to make a distinction between internal (costs of own personnel, energy, etc.) and external (environmental charges, waste disposal by contractors, waste water treatment by third parties, external advice, soil sanitation, etc.) environmental costs. This makes it in many cases impossible to analyse the dynamics of the different elements in operational costs. Only for the Netherlands such analysis could be made partly (not at sectoral level though, as for too many years data are classified as confidential in the reported tables). Also on

Environmental expenditures in response to environmental policies
Sectoral Costs of Environmental Policy 108
revenues of environmental activities little data is available, only Poland and Estonia report this explicitly. Finally, only two Member States (Germany and the Netherlands) report annualised environmental costs (in which investments are represented by the annual depreciation and interest, and summed with the annual operational costs). Annualised costs have the advantage over annual environmental CAPEX and OPEX expenditures that they better represent the average burden to industries and therefore enable a more representative analysis of the dynamics of environmental outlays. For the analysis, it is important to compare expenditures in a (more or less) harmonised way. This means that capital and operational expenditures need to be summed. As investments show large fluctuations, the average investment has been estimated, based on available information on time series for investments. Together with the annual operational expenditures (latest year available), this results is a proxy for annual costs. In Table 14 the sectoral coverage (NACE) of the data published by national statistical offices is given and compared with the sectoral coverage of economic data in the EUklems database (EU KLEMS, 2007).
Table 14: Data available from statistical offices on environmental expenditures by NACE sector
Country Extraction Oil drilling
Textile and leather
Refineries Base metal Electricity
EUklems 11,12 17-19 23 27,28 40,41 Australia 11 17-19 23,24 27,28 40 Austria 17 23 27 40,41 Czech Rep 11,12 17 23 27,28 40,41 Germany 11,12 17-22 23 27,28 40,41 Estonia 11,12 17 23 27 40 Spain 17 23 27,28 40,41 Netherlands 11,12 17-19 23 27 40 Poland 11 17 23 27 40 Sweden 17-19 23 27 40 United Kingdom 11,12 17 23 27 40 United States 11,12 17 23 27 40
Table 14 shows what was already noticed in Chapter 1: the sectoral coverage is not consistent with the sectors in this study. In most cases data are only available at a more aggregated level. Another complication is that economic data covered by the EUklems database, which has the advantage of a consistent set of economic information for almost all EU Member States and the United States, are also presented at a more aggregated level, than often the data on environmental expenditures. As one of the key elements in the analysis is the relation between economic performance and environmental expenditures, this pushes the analysis away from the originally desired level of detail. It can be concluded that the comparative analysis of sectoral environmental expenditures is limited by the way data are collected and presented. Frequency is still a large problem, but also the coverage of certain cost elements that might be important in the analysis makes it more difficult to come to general conclusions. The (lack of) sectoral detail also forces the analysis at a higher aggregation than wanted.

Environmental expenditures in response to environmental policies
Sectoral Costs of Environmental Policy 109
5.4.2 Extraction (mining) (NACE 11) This sector is included as part of the oil chain20. As only very few countries in the analysis have major oil drilling activities, the analysis is hardly representative for this part of the oil chain. Apart from that, the mining sector covers in most of the countries, more than just (mainly) oil extraction. Only for the Netherlands and the UK most mining activities are linked with oil and gas.
a) Investments Figure 19 shows the specific investments for environmental protection of the extraction sector in 4 countries for which times series are available. Environmental investments are limited to a maximum of 0.5% of production value (Netherlands in 2002), in the UK the level of investments is on average about 0.1% of production value. Both in the UK and Netherlands, integrated investments form often a significant part of environmental investments. On average, integrated investments form 38% of environmental investments, but there is no clear trend visible.
0,00%
0,10%
0,20%
0,30%
0,40%
0,50%
2001 2002 2003 2004
of production
NetherlandsNetherlands, intUKUK, integratedFranceFrance, integratedGermanyGermany, integratedAverageAverage, integrated
Figure 19: Annual environmental investments in the mining sector, as % of production value, 2001 – 2004
b) Annualised expenditures
For 8 of the 11 countries in this comparative analysis, the total annual environmental expenditures can be presented for the extraction sector. Again, it should be stressed that these expenditures relate to quite different extraction operations. For the Netherlands and the UK, the annualised costs more or less represent the costs for the “oil chain” (but also natural gas is included), for the other countries a wide range of extraction activities is included, which logically can result in different annual cost profiles.
20 Refineries are discussed in paragraph 5.3.5

Environmental expenditures in response to environmental policies
Sectoral Costs of Environmental Policy 110
In Figure 20 the annualised environmental expenditures in the extraction sector are shown, as a percentage of respectively total annual (gross) production value and the value added.
-0,50%
0,00%
0,50%
1,00%
1,50%
2,00%
2,50%
3,00%
3,50%
Austra
lia
Austri
a
Czech
Rep
Germ
any
Estoni
a
Spain
Nethe
rland
s
Polan
d
Sweden
United
Kingd
om
United
Stat
es
% of production
other
multi
admin
nature
noise
waste
soil
water
air-1,00%
0,00%
1,00%
2,00%
3,00%
4,00%
5,00%
6,00%
7,00%
8,00%
Austra
lia
Austria
Czech
Rep
Germ
any
Eston
ia
Spain
Nether
lands
Poland
Sweden
United
Kin
gdom
Unite
d Stat
es
% of value added other
multi
admin
nature
noise
waste
soil
water
air
Figure 20: Annualised environmental expenditures in the extraction sector, per environmental domain, as % of gross production value and as % of value added, latest year available
There is a large fluctuation between countries: in Australia and the US less than 0.5% of production value is spent on environment, whereas in the Czech Republic this is almost 3.5%. Poland reports net revenues for waste in this sector21. For the Netherlands and UK (coming closest to representing the oil chain), the annualised expenditures are some 0.7-0.8% of production value and 1% of value added.
c) Dynamics of costs To get an impression of how environmental expenditures have developed over a longer time period, for the Netherlands the environmental cost profile of the oil & gas sector is presented. In the figure the annual costs for the sector have been related to the amount of oil equivalents produced, but the sector actually is dominated by gas production.22
€ 0,0
€ 0,2
€ 0,4
€ 0,6
€ 0,8
€ 1,0
€ 1,2
€ 1,4
1990
1991
1992
1993
1994
1995
1996
1997
1998
1999
2000
2001
2002
2003
2004
2005
per tonne oil equivalent
air water soilwaste noise natureother
Figure 21: Environmental expenditures per tonne oil-equivalent in the Netherlands, 1990 – 2005 (price level 2006)
21 This implies that for waste, no net costs are made in Poland in the extraction sector. 22 In the Netherlands, the oil and gas sector is, measured in weight, dominated by gas production. Oil production represents only 1.3-2.7weight% of total energy products produced.

Environmental expenditures in response to environmental policies
Sectoral Costs of Environmental Policy 111
The graph does not show a clear upward trend in the period 1990 – 2005. Costs fluctuate between € 0.75 and € 1.1 per tonne oil equivalent. Some of the costs fluctuations can be explained due to an incidental drop or increase of expenditures (for example for soil, in 1993 a high amount has been spent; for waste, after 2002 costs decrease considerably). None of the environmental domains is dominant in cost terms. Costs in the different domains are more or less stable (except for the mentioned exception for waste and soil). Costs for waste and air are somewhat higher than for the other domains (for which costs are comparable). Overall, it can be seen that this sector in the Netherlands achieves the needed (and increasing) level of environmental protection at more or less stable costs of around € 1 per tonne oil equivalent. During the last 5 years, the sector was able to decrease specific costs by about € 0.3 per tonne oil equivalent. This may be due to internal pressure to increase efficiency of environmental measures (as the environmental costs for this sector are relatively high compared to the oil price and production costs23)
5.4.3 Textiles and leather (NACE 17-19) The textile sector (including leather) is present in all Member States that are considered. In most Member States, the sectoral production is stable or decreasing. In some of the new Member States, the textile and leathers industry is of growing economic importance.
a) Investments Environmental investments in this sector are small, compared to total production value. On average, 0.1% or less of production value is actually needed for environmental investments as is shown in Figure 22.
23 During the 1990ss, the oil price was about $ 20 per barrel, or about $ 140 per tonne. Production costs of crude oil in Europe are high compared to the Middle East. So any saving in production costs directly affects profitability of the oil sector.

Environmental expenditures in response to environmental policies
Sectoral Costs of Environmental Policy 112
0,00%
0,05%
0,10%
0,15%
0,20%
0,25%
0,30%
0,35%
2001 2002 2003 2004 2005
SloveniaSlovenia, integratedHungaryHungary, integratedCzech RepublicCzech Republic, integratedAverageAverage, integrated
0,00%
0,05%
0,10%
0,15%
0,20%
0,25%
0,30%
0,35%
2001 2002 2003 2004 2005
NetherlandsNetherlands, intUKUK, integratedFranceFrance, integratedGermanyGermany, integratedAverageAverage, integrated
Figure 22: Annual environmental investments in the textile industry, as % of production value, 2001 – 2005
Although it might be expected that in new Member States the level of environmental investments in the textile sector might be relative high24, the graph shows that this is not necessarily the case. In Hungary specific environmental investments are well below the average. In the Czech Republic only for one year the environmental investments are above average. In Slovenia environmental investments tend to the average. Environmental investments fluctuate and are irregular, this is for example clear for the Czech Republic, the UK and the Netherlands, in which cases the highest level of recorded environmental investments is sometimes more than 10 times the lowest recorded level. Moreover, there does not seem to be a general pattern (more or less similar trends in all Member States) of environmental investments25. It can also be seen, that integrated environmental investments make up a significant part (sometimes above 50%, on average 46%) of overall environmental investments in this sector. Figure 23 shows the structure of the environmental investments in the textiles industry in various Member States.
24 In new Member States one may expect higher environmental investments due to increasing capacity (sectoral growth) and due to updating old production facilities (to comply with EU regulations and to be more competitive). 25 Although a general pattern might be expected as investments partially follow the implementation of new EU legislation.

Environmental expenditures in response to environmental policies
Sectoral Costs of Environmental Policy 113
0,00%
0,05%
0,10%
0,15%
0,20%
0,25%
0,30%
0,35%
2001
2002
2003
2004
2001
2002
2003
2004
2005
2002
2003
2004
2001
2002
2003
2004
UK Netherlands France Germany
other int
other eop
waste int
waste eop
water int
water eop
air int
air eop
0,00%
0,05%
0,10%
0,15%
0,20%
0,25%
0,30%
0,35%
2001 2002 2003 2004 2002 2003 2004 2005 2002 2003 2004
Slovenia Hungary Czech Republic
other int
other eop
waste int
waste eop
water int
water eop
air int
air eop
Figure 23: Annual environmental investments in the textile industry, per environmental domain, end-of-pipe and integrated, as % of production value, 2001 – 2005
The focus of environmental investments in the textiles industry is quite differentiated. In the Czech Republic the focus is on investments for air as in the Netherlands. But in Slovenia, the UK and France, water related investments dominate overall investments. Investments for waste are relatively small.

Environmental expenditures in response to environmental policies
Sectoral Costs of Environmental Policy 114
In the textiles sector, integrated environmental investments occur in every domain and every Member State.
b) Annualised expenditures For all 11 countries in this analysis, the specific annualised environmental expenditures can be estimated. On average these are 0.31% of the production value, and the range is 0.72% (Sweden) to 0.04 % (Poland) (Figure 24)
0,00%
0,10%
0,20%
0,30%
0,40%
0,50%
0,60%
0,70%
0,80%
Austra
lia
Austria
Czech
Rep
Ger
man
y
Eston
ia
Spain
Nethe
rland
s
Poland
Sweden
United K
ingd
om
United
Sta
tes
Avera
ge
% of production
other
multi
admin
nature
noise
waste
soil
water
air
0,00%
0,25%
0,50%
0,75%
1,00%
1,25%
1,50%
1,75%
2,00%
Austra
lia
Austri
a
Czech
Rep
Germ
any
Estoni
a
Spain
Nethe
rland
s
Polan
d
Sweden
United
King
dom
United
Stat
es
Avera
ge
% of value added
other
multi
admin
nature
noise
waste
soil
water
air
Figure 24: Annualised environmental expenditures in the textiles industry, per environmental domain, as % of gross production value and as % of value added, latest year available
The highest specific environmental costs are recorded for Sweden, being about 2 times higher than the average. Also in the Netherlands the specific costs are significantly higher than the average. In 3 countries, Austria, Poland and the United States, the specific costs are less than 50% of the average. On average, about half of the specific costs are related to water. In all but one of the 11 countries the expenditures for water are dominant. Slightly more than half of expenditures is related to other domains. In most countries waste is the second domain for which expenditures are made. The share in total environmental expenditures for waste is about 30%. On air, the textiles sector expenditures are relatively low (15%). The specific costs expressed as percentage of value added are on average about 3 times higher than expressed as percentage of production value.
c) Dynamics of costs The development of specific environmental expenditures and the structure thereof in the textiles industry is presented in Figure 25.

Environmental expenditures in response to environmental policies
Sectoral Costs of Environmental Policy 115
€ 0,0
€ 1,0
€ 2,0
€ 3,0
€ 4,0
€ 5,0
€ 6,0
1990
1991
1992
1993
1994
1995
1996
1997
1998
1999
2000
2001
2002
2003
2004
2005
per 1000 € production
air water soil wastenoise nature other
Figure 25: Environmental expenditures in the textiles industry, per 1000 € gross production value, in the Netherlands. 1990 – 2005 (price level 2006)
The specific environmental expenditures in the textiles industry (per € 1000 prodcution value) increase from less than € 2 in the beginning of the 90-ties, to about € 5 after 1995. The last ten years, specific expenditures are relatively stable. The structure of expenditures has also shifted during the period. Whereas in 1990 the majority of costs were linked with waste, the focus shifted to air in the mid 1990ss, but also costs in the water domain developed rapidly. From 2000 onwards, costs for waste become again more important.
5.4.4 Oil refineries (NACE 23) The oil refining sector is a main player in the European industry, and in many countries refining capacity is present.
a) Investments The specific investments for environmental protection in the refining sector show that in most cases these are below € 2 per tonne oil refined.
€ 0,00
€ 0,50
€ 1,00
€ 1,50
€ 2,00
€ 2,50
€ 3,00
€ 3,50
€ 4,00
2001 2002 2003 2004 2005
per ton oil
NetherlandsNetherlands , intUKUK, integratedHungaryHungary, integratedFranceFrance, integratedGerm anyGerm any, integratedAverageAverage, integrated
Figure 26: Annual environmental investments in the oil refining industry, in € per tonne oil refined, 2001 – 2005

Environmental expenditures in response to environmental policies
Sectoral Costs of Environmental Policy 116
In a few cases there are peaks in investments (Hungary in 2003 and 2005, UK 2004). In the old Member States, specific annual investments are around € 1 per tonne. The high specific investments in Hungary are most likely linked to measures to comply with the EU environmental regulation. As Figure 27 shows, the investments in Member States are mostly linked with air and to a less extent to water.
€ -
€ 2,00
€ 4,00
€ 6,00
€ 8,00
€ 10,00
€ 12,00
€ 14,00
2002
2003
2004
2005
2001
2001
2003
2004
2001
2002
2003
2004
2005
2002
2003
2004
2001
2002
2003
2004
Hungary UK Netherlands France Germany
other int
other eop
waste int
waste eop
water int
water eop
air int
air eop
Figure 27: Annual environmental investments in the oil refining industry, per environmental domain, end-of-pipe and integrated in € per tonne oil refined 2001 – 2005
On average, the share of integrated investments in total environmental investments is some 25%, but there is a wide variation (one year with almost all investments integrated for a certain domain, next year end-of-pipe). For the 5 countries analysed, there is no clear trend is visible. At EU level, the trend appears to be upward (see Figure 17).
b) Annualised expenditures For 10 countries annualised expenditures can be estimated. On average, these specific expenditures are some € 3.30 per tonne oil, as shown in Figure 28.

Environmental expenditures in response to environmental policies
Sectoral Costs of Environmental Policy 117
€ 0,00
€ 0,50
€ 1,00
€ 1,50
€ 2,00
€ 2,50
€ 3,00
€ 3,50
€ 4,00
€ 4,50
€ 5,00
€ 5,50
€ 6,00
€ 6,50
Austra
lia
Austria
Cze
ch R
ep
German
y
Estonia
Spain
Nethe
rland
s
Poland
Swed
en
United King
dom
United States
Aver
age
per ton oilother
multi
admin
nature
noise
waste
soil
water
air
Figure 28: Annualised environmental expenditures in the oil refining industry, per environmental domain. in € per tonne oil refined, latest year available
Highest costs are recorded for Germany, where specific costs are twice the average. Also relatively high specific costs are recorded for the Netherlands, the United States and Australia. Austria, the Czech Republic and the UK form a group of countries with more or less average specific costs. For Spain, Poland and Sweden, specific costs are estimated between 2 times and 4 times lower than average. In general about 50% of environmental cost for refineries is related to air, 25% to water and the rest to other domains. This also roughly applied to the individual countries, with the exception of Australia, Sweden and the UK. It should be noted that in a sector for which long time (more or less) harmonised standards at the EU level exist, such large differences can still be observed in costs. This is even more surprising as the refining process is also relatively comparable in the different countries. There are a few explanations possible for these large differences:
- Different levels of environmental protection (i.e. in some countries EU standards are not achieved and in other countries EU standards are exceeded);
- Difference in local costs - making it much cheaper in one country to comply with a certain standard than in another;
- Different data collection methods, leading to a bias in results26. From the data used in the analysis, it is not possible to objectively answer this question, but the first two possible explanations would only partially explain the large differences. This makes it probable that data on environmental costs are to a certain extent biased.
c) Dynamics of costs The development of the specific environmental expenditures in the oil refining industry in the Netherlands is presented in Figure 29.
26 In one of the data sources, the difference between operational costs for several years is very large (> 10 times), whereas it is more likely that operational costs are developing regularly. The explanation by the data-provider given is that the samples differ substantially between years.

Environmental expenditures in response to environmental policies
Sectoral Costs of Environmental Policy 118
€ 0,0
€ 1,0
€ 2,0
€ 3,0
€ 4,0
€ 5,0
€ 6,0
1990
1991
1992
1993
1994
1995
1996
1997
1998
1999
2000
2001
2002
2003
2004
2005
per tonne oil
air watersoil wastenoise natureother
Figure 29: Environmental expenditures in the oil refining industry in € per tonne oil refined, in the Netherlands, 1990 – 2005 (price level 2006)
The specific costs increase from about € 3 per tonne oil in the beginning of the nineties, after 1997 a stepwise increase can be observed about doubling the environmental costs for the oil industry to over € 5. The increase in specific costs is linked with a doubling of costs for air, while other environmental expenditures remain quite stable during the 15 years time period.
5.4.5 Base metal (NACE 27) For the iron and steel industry, hardly any detailed data on environmental protection expenditures are available. But even at the level of the base metal industry (which also includes aluminium and other basic metal production), no comparable data are available. Therefore, data in this section refer to the base metal (NACE 27) and the metal products (NACE 28) industry.
a) Investments The Figure 30 shows that the level of environmental investments varies largely between Member States. On average in this sector, about 0.1% of annual production value is spent on environmental investments.

Environmental expenditures in response to environmental policies
Sectoral Costs of Environmental Policy 119
0,00%
0,05%
0,10%
0,15%
0,20%
0,25%
2001 2002 2003 2004 2005
Netherlands Netherlands, int
UK UK, integrated
France France, integrated
Germany Germany, integrated
Average Average, integrated
Figure 30: Annual environmental investments in the base metal and metal products industry as % of gross production value, 2001 – 2005
In Slovenia peaks in environmental investments can be observed, in other Member States the environmental investments in this sector are near or below the average and are quite comparable. On average, some 23% of total environmental investments are integrated. It seems as if the share of this kind of investments slowly increases, as also is shown in the analysis at the EU level (Figure 17), but whether this is a trend or coincidence is difficult to assess.
0,00%
0,05%
0,10%
0,15%
0,20%
0,25%
2001 2002 2003 2004 2005Slovenia Slovenia, integrated
Hungary Hungary, integrated
Czech Republic Czech Republic, integrated
Average Average, integrated

Environmental expenditures in response to environmental policies
Sectoral Costs of Environmental Policy 120
0,00%
0,10%
0,20%
0,30%
0,40%
0,50%20
01
2002
2003
2004
2001
2002
2003
2004
2005
2002
2003
2004
2001
2002
2003
2004
UK Netherlands France Germany
other int
other eop
waste int
waste eop
water int
water eop
air int
air eop
0,00%
0,10%
0,20%
0,30%
0,40%
0,50%
2001 2002 2003 2004 2002 2003 2004 2005 2002 2003 2004
Slovenia Hungary Czech Republic
other int
other eop
waste int
waste eop
water int
water eop
air int
air eop
Figure 31: Annual environmental investments in the base metal and metal products industry, per environmental domain, end-of-pipe and integrated, as % of gross production value, 2001 – 2005
In general, about half of environmental investments is linked with air. Water related investments are mainly recorded in Slovenia, Czech Republic, France and Germany. Investments for waste and for other environmental domains are mostly incidental and form the rest of environmental investments.

Environmental expenditures in response to environmental policies
Sectoral Costs of Environmental Policy 121
b) Annualised expenditures In all 11 countries analysed this sector is present, as is shown in Figure 32. On average, the environmental expenditures in this sector are 0.7% of the production value (maximal 1.05%, minimal 0.15%), and 2.1% of value added (maximal 3%, minimal 0.65%).
0,00%
0,10%
0,20%
0,30%
0,40%
0,50%
0,60%
0,70%
0,80%
0,90%
1,00%
1,10%
Austra
lia
Austria
Czech
Rep
German
y
Estonia
Spain
Nethe
rland
s
Poland
Sweden
United
Kingdo
m
United
State
s
Avera
ge
of Production
other
multi
admin
nature
noise
waste
soil
water
air
0,00%
0,25%
0,50%
0,75%
1,00%
1,25%
1,50%
1,75%
2,00%
2,25%
2,50%
2,75%
3,00%
Austra
lia
Austria
Czech
Rep
Germany
Eston
ia
Spain
Nethe
rland
s
Polan
d
Sweden
United
Kingdo
m
Unite
d Sta
tes
Averag
e
of Value added
other
multi
admin
nature
noise
waste
soil
water
air
Figure 32: Annualised environmental expenditures in the base metal and metal products industry, per environmental domain as % of gross production value and as % of value added, latest year available
In Austria, Germany and the Netherlands the annualised environmental expenditures are relatively high (up to 1.5 times the average). In Sweden, the UK, US and Czech Republic, the annual costs are near the average. In Spain, Australia, Poland and Estonia, the specific environmental costs are relatively low. There is no clear dominance of one of the 3 main environmental domains: on average, about the same is spent in each of the three domains.
c) Dynamics of costs To assess the specific environmental costs for the base metal industry, for the Netherlands the environmental costs of this sector have been linked to steel production. The results are shown in Figure 33. In the beginning of the 1990s, environmental costs were dominated by expenditures for air (about 75% of total), being a result from high investments for air protection before 1990. After 1990 little to no new environmental investments for air caused the annualised costs to gradually decrease from over € 25 per tonne steel in 1990 to slightly above € 15 in 1997. At the same time, expenditures in other domains became more important, by 1997 covering about 50% of total environmental costs. In the period 1997 – 2000, again large investments have been made for environmental protection, now covering next to air also water, soil and waste. This results in the peak of environmental costs in 2000 (again about €25 per tonne steel). After 2000, costs gradually decreased to about € 20 per tonne steel in 2005 (no high investments in this period).

Environmental expenditures in response to environmental policies
Sectoral Costs of Environmental Policy 122
€ 0
€ 5
€ 10
€ 15
€ 20
€ 25
€ 30
1990
1991
1992
1993
1994
1995
1996
1997
1998
1999
2000
2001
2002
2003
2004
2005
per tonne steel
air water soil wastenoise nature other
Figure 33: Environmental expenditures in the base metal industry in € per tonne steel produced, in the Netherlands, 1990 – 2005 (price level 2006)
5.4.6 Electricity (NACE 40)
For the electricity sector (NACE 40), it is possible to compare environmental costs with electricity production, enabling a comparison between countries of specific environmental costs. For a few countries (Austria, Czech Republic, Germany and Spain) the environmental expenditures also include the water production sector, thus overestimating (slightly) the specific costs.
a) Investments For the electricity sector, there is no large difference in average specific environmental investments, which are estimated at about € 1 per MWh produced. And although the investments fluctuate from year to year, the specific investments all are within a small bandwidth, with a maximum of about € 2 per MWh (Figure 34). Investments in the new Member States are in general higher than in the old Member States, which is likely linked with the ongoing implementation of EU regulation (Large Combustion Plants directive, IPPC). In old Member States such as France, Netherlands and the UK, in some of the years, the specific investments of the electricity sector are near to zero, and well below the average. It can also be seen that in the electricity sector, integrated investments form about 50% of total environmental investments, which is a high percentage (compared to the other sectors studied). This is probably due to the investments in sustainable electricity production (wind mills, (small) hydro power).

Environmental expenditures in response to environmental policies
Sectoral Costs of Environmental Policy 123
0,00
0,20
0,40
0,60
0,80
1,00
1,20
1,40
1,60
1,80
2,00
2001 2002 2003 2004 2005
Slovenia Slovenia, integratedHungary Hungary, integratedCzech Republic Czech Republic, integratedAverage Average, integrated
Figure 34: Annual environmental investments in the electricity sector, in € per MWh produced, 2001 – 2005
The period of the analysis is too short to clearly see a trend toward more integrated and less end-of-pipe investments, but it is reasonable to assume that in the coming years end-of-pipe investments will mainly be linked to completion of the approximation to EU in new Member States and investments in traditional thermal power plants throughout the EU. On the other hand, integrated investments will be linked with sustainable electricity production and with the commitments the EU has made and wants to make on climate change for the near future and the longer term. This makes it reasonable to assume a larger share of such investments in the overall environmental investments. In Figure 35 the environmental investments per country, are subdivided by domain. Again this picture clearly shows that in new Member States larger specific investments are needed during 2001 – 2005 than in old Member States. Moreover, it can be seen that especially in the domain air, which also constitutes the larges part of environmental investments, the share of integrated investments is in general large. Only in the Czech Republic high investments have been made for water in the period covered in the graph. In some countries, Slovenia, Hungary and the UK investments for waste have been significant. For France, the environmental investment structure is very different than in other Member States, due to the widespread use of nuclear reactors (leading to investments under the domain “other”).
0,00
0,20
0,40
0,60
0,80
1,00
1,20
1,40
1,60
1,80
2,00
2001 2002 2003 2004 2005Netherlands Netherlands, int
UK UK, integrated
France France, integrated
Average Average, integrated

Environmental expenditures in response to environmental policies
Sectoral Costs of Environmental Policy 124
0
0,5
1
1,5
2
2001
2002
*
2003
2004
2001
2002
2003
2004
2005
2002
2003
2004
UK Netherlands France
other int
other eop
waste int
waste eop
water int
water eop
air int
air eop
0
0,5
1
1,5
2
2001 2002 2003 2004 2002 2003 2004 2005 2002 2003 2004
Slovenia Hungary Czech Republic
other int
other eop
waste int
waste eop
water int
water eop
air int
air eop
Figure 35: Annual environmental investments in electricity sector, per environmental domain, end-of-pipe and integrated, in € per MWh produced, 2001 – 2005

Environmental expenditures in response to environmental policies
Sectoral Costs of Environmental Policy 125
b) Annualised expenditures The annualised expenditures of the electricity sector are estimated at being between roughly € 2.50 and € 4.50 per MWh, with 2 exceptions for Spain and the UK, where costs are significant lower than in other countries (Figure 36).
€ -
€ 0,50
€ 1,00
€ 1,50
€ 2,00
€ 2,50
€ 3,00
€ 3,50
€ 4,00
€ 4,50
€ 5,00
Austra
lia
Austri
a
Czech
Rep
Ger
man
y
Eston
ia
Spain
Nethe
rland
s
Polan
d
Sweden
Unite
d Kin
gdom
Unite
d Sta
tes
Avera
ge
per MWh
other
multi
admin
nature
noise
waste
soil
water
air
Figure 36: Annualised environmental expenditures in the electricity sector, per environmental domain in € per MWh produced, latest year available
The differences between the countries may result from real cost differences, but will also depend on the structure of the electricity sector. For example, in case a significant share of electricity is produced by hydro power plants, this will lead to lower costs for air, but higher costs for water. Although the production structure of the sector will affect the level and pattern of environmental expenditures, the specific costs in countries with a high share (> 70%) of thermal power in total electricity production (Estonia, the Netherlands, Poland, UK) do not necessarily have higher costs than countries with a more diversified structure (such as Austria, Germany, Czech Republic). Overall, costs for the air domain make 50% of the total. Costs for waste management are also quite important (some 15-20%) in the electricity sector (fly ash, gypsum). Other domains lead to less specific costs.
c) Dynamics of costs Figure 37 shows the development of annual environmental costs of the electricity sector in the Netherlands. The graph shows that annualised environmental costs are estimated between € 3 and € 4.80 per MWh, with a peak in 1995. The fluctuation in the costs during

Environmental expenditures in response to environmental policies
Sectoral Costs of Environmental Policy 126
the period 1990 - 2005 is for the largest part caused by the fluctuation of costs in the air-domain. Due to investments in emission reduction in the period 1992 – 1994, costs for air almost doubled, but after 1995 the electricity sector achieves large savings on the costs of the reduction of air pollution. Partly this will be due to the way annual costs are estimated (as depreciation and interest will depend on investments from the past, so an investment peak may first lead to increasing costs, but if after the peak the investments remain at a low level and the annualised capital costs will decrease). Another explanation of the decreasing costs can be that due to learning effects, the specific costs of emission reduction decrease (see Jantzen (1995), Oosterhuis (2006) and Oosterhuis (2007)). The costs in other domains than air remain about stable over the period. The costs of climate change policy are represented during the last 5 years, increasing from 0 to € 0.5 per MWh. These costs refer to (mainly) investments in wind turbines by the electricity sector (CBS, 2007b).
€ 0,0€ 0,5€ 1,0€ 1,5€ 2,0€ 2,5€ 3,0€ 3,5€ 4,0€ 4,5€ 5,0
1990
1991
1992
1993
1994
1995
1996
1997
1998
1999
2000
2001
2002
2003
2004
2005
per MWh
air water soilwaste noise natureother climate
Figure 37: Environmental expenditures in the electricity sector. in € per MWh produced, in the Netherlands, 1990 – 2005 (price level 2006)
5.4.7 Structure of environmental expenditures: internal and external
environmental expenditures The structure of environmental expenditures, with a focus on the distinction between internal and external environmental costs, over a longer period can only be studied for one Member State (the Netherlands). Figure 38 shows a few interesting developments of the environmental expenditures in the Dutch industry (NACE sectors 11 to 41 covered by the data on industries). First of all, in absolute terms, annualised environmental expenditures increased consistently until 2002 (with an average increase of 4.8% per year), after 2002 a slightly downward trend is visible (with an average decrease of 1.8% per year). The downward trend is due to the reduction of internal environmental costs in industry, but also external costs decrease. Only “other external costs” (that include amongst others: costs for soil sanitation, external advice and external water related services) increase after 2002.

Environmental expenditures in response to environmental policies
Sectoral Costs of Environmental Policy 127
environmental charges
waste disposal
other ext costs
internal costs
0
500
1.000
1.500
2.000
2.500
1997 1998 1999 2000 2001 2002 2003 2004 2005
mln €
Figure 38: Total annual environmental costs (for NACE 11-41), divided in internal and external costs, the Netherlands (current prices)
There are several explanations possible for the absolute decrease in costs after 2002:
- The stagnations of economic growth after 2001, which also caused a lower level of environmental investments and stabilisation of internal operational costs;
- Ongoing technological improvements that increased the cost effectiveness of measures to reduce pollution (more pollution can be abated at the same costs, or the same pollution at lower costs). This phenomena was already recognised in the 1990s (Jantzen et al., 1995) and is recently well documented in recent studies for the EU and the Dutch Environmental Agency (MNP) (Oosterhuis 2006 and 2007).
When comparing the development of internal and external costs, it appears that the external costs on average increased by 3.5% per year, and the internal costs by 2.3%. As a result, external costs have become more important in the period 1997 – 2005. The large variability in the share of environmental costs between sectors is shown in Figure 39. For some industries, external environmental costs may be higher than the costs of their own measures/equipment (for example, the paper industry). This may be of importance for some industries, as they may be able to influence costs of their own equipment, but influence on external environmental costs (public services and waste contractors) may be more difficult. For the sectors relevant to this study, the highest relative external costs are borne by the textiles industry.

Environmental expenditures in response to environmental policies
Sectoral Costs of Environmental Policy 128
0%
2%
4%
6%
8%
10%
12%
14%
16%
18%
min
ing, q
u arryi
ngfoo
d
text
i le, le
athe
rpa
per
printin
g
oil refi
neries
chem
i cal
indus
try
basic
met
als
met
al pr
od's,
mac
hiner
y
electr
otech
n pro
d' ss
t rans
port
equip
ment
power
indu
stry
external environm costinternal environm cost
Figure 39: Share of environmental costs in value added of manufacturing industries, the Netherlands
5.4.8 Conclusions of the comparative analysis
Although there are sometimes large differences in the specific expenditures between countries, in general results are quite comparable. For some differences of specific costs and the structure thereof, explanations are possible. For example, the production structure of sectors are not homogenous (electricity production is based on hydropower, (brown) coal, natural gas and nuclear, leading to different investment and cost profiles) or national standards are more strict than EU ones (for example for refineries in the Netherlands). Also the accession to EU has lead to a peak in environmental investments in the new Member States. But in certain cases it is hard to understand why in one country specific costs are up to 8 times higher than in another country. A possible explanation is the lack of consistency in the data sets used. National statistical offices use various different ways of collecting data on environmental expenditures in their surveys, leading from a basic to a more advanced representation of the environmental domains surveyed. Investments show large fluctuations, which is logical (implementation of EU law is linked to time schedules, and investments follow the investment cycle). But although EU legislation often has to be implemented in the same time framework in all Member States, no such investment patterns surface from the analysis. This may be due to the timing of investments and the short period for which data were available for analysis (2001-2005). Within EU, larger differences occur than in comparison with Australia and US. So in general environmental costs for industry outside the EU are of a comparable level to the EU average. A problem with this comparison is that data on environmental expenditures are not always comparable (sector (NACE) classification; availability of sufficient data etc.). There is no clear and general trend of increasing environmental expenditures. In some sectors (oil and gas, base metal and electricity) costs remain stable within a certain range,

Environmental expenditures in response to environmental policies
Sectoral Costs of Environmental Policy 129
for refineries and the textile industry, a clear increase in specific costs can be observed. As this trend analysis could only be done for one Member State (the Netherlands), no general conclusions can be drawn from this. However, a possible explanation of more or less stable costs (or costs that increase less than might be expected, based on the assumption of higher marginal abatement costs when reducing “marginal” pollution) is the decrease of ‘unit costs’ (which are comparable with the specific costs referred to in this analysis) due to technological developments (see for example Oosterhuis et al. 2006 and Oosterhuis, 2007). From the results, it looks as if environmental expenditures do not form a large cost driver for the sectors, and specific costs do not necessarily increase (even when standards become stricter). An indication that other factors (than environment) will have a larger influence on value added, profits and competitiveness of the sectors studied, is the sometimes quite large differences between value added as % of total gross production. Often these differences are much larger than the observed differences in specific environmental expenditures. This may lead to the conclusion that environmental concerns, as far as related to investment and operational and maintenance expenditures, have in the recent past not affected significantly the competitiveness of the reviewed sectors. This does however, not guarantee that in the future in certain sectors or Member States, due to specific circumstances, the competitiveness will be affected by further environmental legislation. Quality of data on environmental expenditure differs between OECD countries (sometimes very basic, sometimes very detailed), which makes comparison sometimes tricky. Moreover, the detail of data also differs substantial, making it for example hard to assess administrative costs related to environmental legislation and external environmental costs (which are less obviously influenced by enterprises).


Chapter 6:
Economic Consequences of Environmental Policies
This chapter aims to investigate how environmental policies affect the resource and cost efficiency of a company.


Economic consequences of environmental policies
Sectoral Costs of Environmental Policy 133
6 ECONOMIC CONSEQUENCES OF ENVIRONMENTAL POLICIES
6.1 Contextual background
Underlying model Figure 40 provides a schematic representation of the potential economic pathways and consequences due to environmental regulation.
Figure 40: Potential economic pathways and consequences due to environmental regulation
Essentially there are three pathways, depending on the nature of the company’s response to the introduction of the regulation.
� If it responds by relocating production overseas to avoid the regulation, then there will be a direct impact on the market share of its plant(s) in the regulated country and hence on the market share of the sector for that country. Note that it may not have any impact on the aggregate market share based on its global production.
Economic consequences
Effects
Response to regulation
Environmental expenditure
Relocation Production Products
Marketing / strategic benefits
Improved resource efficiency
Impact on unit production
costs
Competitiveness
Share of production
Profitability Share of trade (exports)

Economic consequences of environmental policies
Sectoral Costs of Environmental Policy 134
� If it responds by making changes to production processes (either end-of-pipe or process integrated) then the resultant expenditure will increase its unit production costs27. However, this might be offset by an improved resource. If the overall impact is to raise unit production costs (relative to its competitors in other countries), the company will suffer a loss of competitiveness, which may manifest itself in a loss of market share (local market/exports) and / or a deterioration in its profitability. If the overall impact is to reduce costs, then it will enjoy an improvement in competitiveness.
� If it responds by developing new products, then this may provide strategic / marketing benefits to the company (relative to its competitors in other countries), which improve its competitiveness. The R&D investment for these products has no impact on unit production costs, but only if they are not more expensive to produce than existing products. Changes to production processes may also provide strategic / marketing benefits (e.g. improving its “green image”), but these are likely to be less significant than those arising from new product development. For companies, these considerations support the implementation or expanding of proactive environmental strategies or furthermore improving the environmental performance faster than competitors in order to obtain first-mover advantages.
Ongoing debate on the relationship between environmental regulation and competitiveness In the literature, one can find a large amount of studies investigating the effects of environmental regulation on the competitive situation of nations/regions, sectors, companies and plants. Clearly, it is outside the scope of our study to give a state of play of this debate. Recent overviews of the literature can be found for example in reports from SQW (2006) and Ifo Instiute (2006). Essentially, there are two opposite views on the impact of environmental legislation on competitiveness. The conventional view fears that the private costs imposed by stringent environmental policy impair competitiveness and productivity (Palmer et al., 1995). In general terms, a negative impact on the output and employment of companies will be larger the greater the rise in costs following compliance; the greater the differential cost penalty relative to domestic and foreign competitors; the more significant the costs are in total costs; the greater the degree of price competition between companies and the greater the sensitivity of demand to price increases (OECD, 1993). On the other hand, industries which are characterised by higher rates of investment may be able to take advantage of cost-reducing clean technologies; consumer preferences may shift in favour of green products and cleaner production. Regulation may stimulate innovation and raise productivity, if policy provides the right incentive. Green products and environmental technology provide opportunities for early mover advantages in international markets. According to the “Porter hypothesis” or revisionist view it is argued that environmental regulation spurs innovation in a number of ways and that there are “win-win” opportunities available through environmental regulation, where simultaneously pollution is reduced and productivity increased (Porter and van der Linde, 1995).
27 Only operating expenditure has any affect on unit production costs – capital expenditure has no impact.
Economic consequences of environmental policies
Sectoral Costs of Environmental Policy 135
There is an ongoing debate on the Porter hypothesis. Some economists argue that although innovation offsets are possible, they are likely to be small. In addition they argue that the evidence cited to support the hypothesis is particular and not representative. They also doubt that where slack does exist, environmental policy is the right policy to improve efficiency. Overall, there is little evidence to support the hypothesis that environmental policy leads to loss of comparative advantage or industrial flight to pollution havens (Jaffe et al., 1995). In the European Union for example Hitchens et al. (2000) found in their case study approach no significant impact of environmental measures on the competitiveness of small and medium companies in a variety of countries and sectors. The main reason why environmental regulations have small effects on competitiveness, is probably that the costs of complying with regulations is a small fraction of total costs – sufficiently small to be overridden by differences in other more substantial costs such as labour, raw materials etc. A negative impact of environmental regulation on the output and employment of companies will be the larger the greater the rise in costs following compliance, the greater the differential cost penalty relative to domestic and foreign competitors, the more significant the compliance costs are in total costs and the greater the degree of price competition between companies and the greater the sensitivity of demand to price increases (OECD, 1993; Watkiss, 2004). There is also little empirical support for the revisionist view that regulation improves competitiveness and therefore should be tightened. However, there is evidence to suggest that environmental regulation has a positive impact on employment (OECD, 1997). A shortcoming of most studies is that there was not a systematic analysis undertaken of the impacts of the different types of environmental abatement measures on competitiveness. In most cases only the impacts of end-of-pipe technologies were measured, but not the process-integrated or clean technology responses (Ifo, 2006). In OECD (2006) it is argued that environmental regulations can increase concentration in the sector and raise barriers to entry, reducing competition in markets and possibly raising prices for consumers. Evidence suggests that the impact of environmental regulation is unequally distributed across companies with similar environmental characteristics. Larger local companies tend to be less affected than smaller companies, foreign companies and potential new entrants. Larger companies generally face lower per unit costs of compliance. These economies of scale can be expected to lead to increase concentration and decreased competition. It is frequently asserted that particular environmental regulations can give advantages to companies in an industry against companies that are outside, so raising barriers to entry. Environmental regulations can impact entry and exit conditions directly through:
1. increasing sunk (unrecoverable) costs associated with entry; 2. generating cost differentials between entrants and incumbents, putting prospective
entrants at an obvious competitive disadvantage; and, 3. slowing down the process of entry and exit (e.g. licensing or certification
procedures). Financial benefits of improved environmental performance can be the result of the application of integrated technologies that improve the economic and environmental performance of processes. Improved efficiency of, for example, refineries and power

Economic consequences of environmental policies
Sectoral Costs of Environmental Policy 136
plants lead to lower energy costs and also increase the efficiency of pollution abatement equipment, lowering the environmental costs per kWh or litre gasoline. A recent OECD study (2006) indicates that higher levels of environmental performance lead to greater financial returns. In contrast, the stringency of the environmental policy regime was associated with a reduction in companies’ financial opportunities, which is consistent with the traditional economic view. It appears however that regulatory pressures are critical to achieving greater environmental improvements and that while the stringency of the regulatory regime comes at a cost to the organisation, these costs may be offset if the facility took steps to reduce its impacts on the environment. The facilities in the seven countries evaluated by OECD appear to be reducing their environmental impacts and benefit substantially by increasing resource productivity and cost savings. As a conclusion, evidence suggests that the impact of environmental regulation does indeed depend on the individual sectors of the economy and that model specification and study design do play a decisive role. One important further direction of research would be to further improve data quality at the micro level (e.g. data collection not only through interviews. but also through supplementary survey work) and feed this into the wider sectoral analysis (see Ifo, 2006). Our study can be considered as another step to meet this call for further research. Relocation impacts The choice of location of a plant is closely linked to its competitive position. If environmental legislation is thought to have the potential to raise costs sufficiently to threaten significant changes in the market share and profitability of a company, that company might judge it best to move to a location where regulation is less stringent and so where these costs might be avoided. The theory behind the relocation of industry due to differing environmental standards has been dubbed the “pollution haven” hypothesis. The discussion on (re)location is relevant to two issues: (i) the movement out of EU countries to other countries with weaker environmental standards, and (ii) the movement within the EU due to changing environmental standards. This issue is contentious as the migration of “dirty” industry implies a distributional burden of the impact of such industry towards poorer countries, as well as the wider competitiveness impacts. The decision of where to locate a production facility involves a number of factors, including the cost of labour, the access to markets the social and political conditions, the infrastructure facilities, and the regulatory framework. The last factor includes environmental regulations but it is only one part of a set of regulations. A great deal of evidence exists that investors look not only at current regulations, but also at the stability of the regulatory framework (how frequently governments change the rules) (Watkiss, 2004). International studies from the mid 1990s have found out that the costs of environmental regulation are only of minor importance in the decision making process concerning the location of new production facilities (Ifo, 2006). A recent paper on the relation between foreign direct investments and environmental policies provides new insights into the “pollution haven” hypothesis. It suggests that more stringent environmental regulations in the investors’ country in comparison with those in the potential host country are positively

Economic consequences of environmental policies
Sectoral Costs of Environmental Policy 137
correlated with both the probability of an investment abroad and also with the volume of investment. This is observed even after taking into consideration other determinants of foreign investment such as corporate tax rates and labour market regulations. For example, the author indicates that, as the stringency in the source country increases from the level of Romania (lax) to the level of Switzerland (very stringent), the volume of investment goes up by between 5% and 13%. Furthermore, the author also argues that companies in industries with higher abatement costs invest more abroad. On the other hand, there is no evidence that companies operating in more polluting industries are more attracted to countries with weaker environmental standards than companies in less polluting industries (Spatareanu, 2007). A further specification in the recent literature is to examine whether domestic versus foreign plant location decisions are dependent on variations in the local environmental stringency. One study using a comprehensive data set that includes observations on both foreign and domestic plants has been carried out by List et al. (2004). They find the striking result that only new openings of domestic plants are influenced by environmental standards. Foreign owned companies are not deterred by stringent environmental regulations. This suggests a sort of double dividend: foreign owned companies provide an economic stimulus for the host country (e.g. creating additional jobs. increasing local wages) and are not unduly influenced by stringent environmental regulation. Foreign direct investment is also more likely to embody new technology and therefore adaptation to more stringent environmental standards might be easier for foreign than for domestic companies (Ifo, 2006). Level playing field European sectors and companies argue for a ‘level playing field’, an environment in which all companies in a given market must follow the same rules and are given an equal ability to compete. Clearly, differences in the ambition level of environmental targets exist comparing EU with non-EU competitors, but also within the EU as Member States face different targets and implement regulations differently. In terms of environmental policy, a level playing field typically refers to the ‘rules of play’. Obviously, a certain tension exists between the costs for businesses on the one hand and the benefits for the society on the other hand. Businesses strive for economic efficiency and plea for a level playing field for environmental policy. However, from a societal perspective, one can argue against this level playing field, as preferences for environmental quality or the impact of emissions may differ between countries and regions. As such, situations can occur where the competitive disadvantage caused by stringent environmental regulation for businesses do not outweigh the benefits of an improved environmental quality (Brink et al., 2007).
6.2 Empirical analysis of the economic consequences of environmental policies
While the above section clearly shows that environmental policies may affect a firm’s actions and thus its competitiveness and profitability, this section will now empirically analyse this relation. For that purpose, it would be ideal to obtain information on (changes in) a firm’s market share or profitability due to the introduction or presence of certain economic policies. However, it seemed unlikely that respondents would be able / willing

Economic consequences of environmental policies
Sectoral Costs of Environmental Policy 138
to provide information on market shares or profitability in an on-line survey. Therefore, we decided to focus in this empirical analysis on the impact of environmental policies on a number of intermediate variables:
- changes in resource efficiency which are specifically due to environmental expenditures;
- overall changes in resource efficiency; - changes in unit production costs which are specifically due to resource efficiency
improvements; - overall changes unit production costs relative to competitors; - administrative costs.
6.2.1 Independent variables
a) Changes in resource efficiency due to environmental expenditures
Respondents were asked to agree or disagree on whether environmental expenditure has caused a significant reduction in the level of energy and water consumption, and waste generation per unit of product at the facility over the last five years. The statements from which the variables used in the regression analysis were built can be seen in the box below. Box 5: Statements related to the facilities’ resource efficiency caused by environmental expenditure
b) Overall changes in resource efficiency
Increased efficiency in the use of natural resources is not necessarily related to environmental expenditure. In fact, increased efficiency can also be due to the management restructuring of the production process or increased attention to environmental issues. Therefore, three additional questions were asked in relation to overall changes in resource efficiency, i.e. changes which are not only due to environmental expenditures but also to by other factors. In this set of statements, respondents were asked to agree or disagree on whether a significant reduction in the level of energy and water consumption, and waste generation per unit of product had occurred at the facility over the last five years. The statements from which the variables used in the regression were built can be seen in Box 6.
Please indicate the extent to which you agree or disagree with the following statements (1: strongly disagree, 2: disagree, 3: slightly disagree, 4: neither disagree nor agree, 5: slightly agree, 6: agree, 7: strongly agree) � Environmental expenditures over the past five years have significantly reduced
water consumption per unit output in our facility � Environmental expenditures over the past five years have significantly reduced
energy consumption per unit output in our facility � Environmental expenditures over the past five years have significantly reduced
waste generation per unit output in our facility

Economic consequences of environmental policies
Sectoral Costs of Environmental Policy 139
Box 6: Statements related to the facilities’ resource efficiency
c) Changes in operating costs due to resource efficiency improvements
Improvements in resource efficiency (water, energy and waste) can generate monetary benefits to companies. In addition, environmental expenditure can increase the competitiveness of a company because of reputational issues and other factors that are not necessarily related to increased resource efficiency. The extent to which increased efficiency has led to reductions in unit production costs has been measured by three variables. Respondents were asked to agree or disagree on whether a reduction in water and energy consumption, and waste generation due to environmental expenditure over the past five years had significantly reduced operating costs per unit of output (Box 8). In addition, respondents were asked to agree or disagree on two statements related to their competitive advantage. In particular they were asked whether they perceived that their environmental expenditures allowed them to compete more effectively in the market place and whether these expenditures resulted in a strategic advantage relative to their competitors. The responses these two statements were averaged to proxy to overall comparative advantage of the firm..
Please indicate the extent to which you agree or disagree with the following statements (1: strongly disagree, 2: disagree, 3: slightly disagree, 4: neither disagree nor agree, 5: slightly agree, 6: agree, 7: strongly agree) � Over the past five years, there has been a significant reduction in the level of
specific water consumption per unit produced resulting from production at this facility
� Over the past five years, there has been a significant reduction in the level of specific energy consumption per unit produced resulting from production at this facility.
� Over the past five years, there has been a significant reduction in the level of specific waste generation per unit produced resulting from production at this facility

Economic consequences of environmental policies
Sectoral Costs of Environmental Policy 140
Box 7: Statements related to the facilities’ competitive advantage and reductions in unit production costs caused by resource efficiency improvements.
d) Overall changes in unit production costs relative to competitors
While it is worthwhile investigating to what extent resource efficiency improvements affect the absolute change in unit production costs, it might be even more important to see how environmental policies affect the firm’s unit production costs relative to its competitors. Therefore, three independent variables were created based on the responses to the statements listed in Box 9. These statements measure whether the production costs decreased or increased and how severe these changes were relative to competitors in three different regions, i.e. EU-15 Member States, New Member States, and the Rest of the World. Box 8: Statements related to the impact of environmental regulations facilities’ unit production costs
e) Administrative costs Environmental policies do not only affect a firms’ resource efficiency and unit production costs, but also its administrative costs and burden (see section 6.1.1). While the absolute value of these administrative costs might be interesting, it is particular the magnitude of these costs relative to costs faced by the competitions that will affect a firm’s long-run competitive advantage. Therefore, respondents were asked to assess the administrative and environmental tax burden experienced by their facility relative to the burden experienced
Please indicate the extent to which you agree or disagree with the following statements (1: strongly disagree, 2: disagree, 3: slightly disagree, 4: neither disagree nor agree, 5: slightly agree, 6: agree, 7: strongly agree) � A reduction in energy consumption due to environmental expenditure in the past five
years has significantly reduced our overall operating costs per unit output � A reduction in waste generation due to environmental expenditure over the past five
years has significantly reduced our overall operating costs per unit output � A reduction in water consumption due to environmental expenditure over the past
five years has significantly reduced our overall operating costs per unit output � The environmental expenditures we have made over the past five years have enabled
us to compete more effectively in the marketplace � The environmental expenditures we have made over the past five years have resulted
in strategic advantages over our competitors
Please indicate the effect that environmental regulations have had on your facility’s unit production costs over the past five years relative to your competitors (1: significantly decreased; 2: decreased; 3: slightly decreased; 4: not changed; 5: slightly increased; 6: increased; 7: significantly increased) � in EU-15 Member States � in new EU Member States � outside the EU

Economic consequences of environmental policies
Sectoral Costs of Environmental Policy 141
by competitors in the EU-15, the EU new Member States and outside the EU. In the empirical analysis, the responses to five statements in Box 8 were used to assess the impact of environmental policies on a firm’s administrative costs. Box 9: Statements related to the facilities’ administrative burden and environmental taxes
6.2.2 Results and analysis
a) Changes in resource efficiency due to environmental expenditures The answers on the questions related to resource efficiency due to environmental expenditure are shown in Figure 34 to Figure 36 of Annex 3. The graph related to water efficiency is repeated in Figure 41. In general the picture looks about the same for water, energy and waste efficiency with most respondents agreeing that resource efficiency is increased due to environmental regulations. One exception is that in the case of waste efficiency more people choose to ‘slightly agree’ than ‘agree’. Figure 41 gives the example of water where a comparison is made between the increases in resource efficiency due to environmental expenditures with the general increase in resource efficiency. We see that respondents tend to agree more on the statements involving increase of resource efficiency due to environmental expenditure. This can possibly mean that increases in resource efficiency are more driven by environmental regulation than by other economical considerations.
From the following five options, please indicate which most closely represents the relative magnitude of your administrative burden and environmental taxes compared to producers in EU-15 Member States: (1: Much lower; 2: Slightly lower; 3: About the same; 4: Slightly Higher; 5: Much Higher) � Administrative costs related to environmental policy From the following five options, please indicate which most closely represents the relative magnitude of your administrative burden and environmental taxes compared to producers in new EU Member States (1: Much lower; 2: Slightly lower; 3: About the same; 4: Slightly Higher; 5: Much Higher) � Administrative costs related to environmental policy From the following five options, please indicate which most closely represents the relative magnitude of your administrative burden and environmental taxes compared to producers outside of the EU (1: Much lower; 2: Slightly lower; 3: About the same; 4: Slightly Higher; 5: Much Higher) � Administrative costs related to environmental policy � Environmental taxes

Economic consequences of environmental policies
Sectoral Costs of Environmental Policy 142
a) Significant reduction in water consumption per unit output due to environmental expenditures
0
4
8
12
16
20
StronglyDisagree
Disagree SlightlyDisagree
NeitherDisagree
Agree
SlightlyAgree
Agree StronglyAgree
Num
ber
of r
espo
nden
ts
Total Oil Power Textiles Metals
b) Significant reduction in water consumption per unit output
0
4
8
12
16
20
StronglyDisagree
Disagree SlightlyDisagree
NeitherDisagree
Agree
SlightlyAgree
Agree StronglyAgree
Num
ber
of r
espo
nden
ts
Total Oil Power Textiles Metals
Figure 41: Impacts of environmental expenditure on efficiency in water consumption
As one can notice in Table 15 the number of variables retained in the final specification is smaller than those retained in Table 16 which shows the results for the more general issue of changes in efficiency regardless of their source. In Table 15, pro-active attitude and environmental strategy have a positive effect in the case of water and waste generation. The strategy variable was found significant also in the waste generation regression. The relative importance of the strategy variable is particularly high as can be observed in Table 15. The size of the facility takes a negative coefficient in the regressions related to energy and water consumption. This confirms the results in Table 16. The importance of the sectoral component is less strong than in the previous section. Only the dummy for the oil sector is retained in the regression for water consumption. Like in Table 16, the dummy has a negative coefficient. The relative importance of the variable is rather small (<10%) – see Figure 42. Facilities in Southern Europe seem to have experienced a smaller increases in energy efficiency due to environmental expenditure than the facilities in the other countries. One can notice that in the case of the regression for energy consumption, the relative index for the Southern Europe dummy is about 30%. With regard to the policies,. one can notice however that the variable describing the impact of the LCP and NEC Directives has been dropped, while the Water Framework Directive is effective in reducing energy and water consumption in response to environmental expenditures.

Economic consequences of environmental policies
Sectoral Costs of Environmental Policy 143
Table 15: Efficiency due to environmental expenditure. Reductions in the level of energy and water consumption, and waste generation per unit of output caused by environmental expenditure over the last five years.
Energy
Consumption Water
Consumption Waste
Generation Environmental Strategy 0.60 (3.43) Pro-active Attitude 0.39 (2.81) Size (Facility) -0.50 (-3.83) -0.51 (-4.43) Southern Europe -1.11 (-2.56) Oil Sector -0.90 (-2.80) NEC Directive -0.21 (-1.83) Water Framework Directive 0.48 (3.00) 0.65 (6.03) Adjusted R2 0.19 0.32 0.15
Notes: the numbers between parentheses denote the t-statistics for the coefficients shown in the table.
0%
10%
20%
30%
40%
50%
60%
70%
80%
90%
100%
Energy Consumption Water Consumption Waste Generation
Size (Facility) Attitude Strategy Oil South NEC Water Framework
Figure 42: Efficiency due to environmental expenditure Relative importance index for the regression related to the facilities’ reduction in the level of energy and water consumption, and waste generation per unit of output caused by environmental expenditure.
Notes: indices of policy variables are shown by bars surrounded by a red broken line; indices of sector and location variables are shown by bars with a black pattern.
b) Overall changes in resource efficiency Changes in resource efficiency, as mentioned above, were measured on a 7-point Likert scale ranging from ‘strongly disagree’ to ‘strongly agree’. The frequency of responses is shown in Figures 45 to 47 in Annex 3.

Economic consequences of environmental policies
Sectoral Costs of Environmental Policy 144
The most frequent answer on each of the questions relating to resource efficiency is ‘slightly agree’. The spread of answers is however slightly higher for the questions relating to energy and water than the one relating to waste generation. The oil sector companies are an exception disagreeing relatively more with the statements on energy and water. The first conclusion one can draw from Table 16 and Figure 43 is that in the last five years the efficiency of the use of natural resources of the facilities which took part in our survey has been influenced by a very high number of drivers, especially in the case of energy. As expected, a pro-active attitude in environmental issues has significantly reduced energy consumption per unit of output over the last five years.. However, a negative sign can be seen in the regression related to the waste generation. The strategy variable has also a positive coefficient, but it is retained only in the regression model for waste generation. Furthermore, larger facilities were less effective in reducing their energy and water consumption per unit of output over the last five years. In other words, bigger companies have been using these two resources less efficient. Conversely, the larger the size of the parent company, the more likely the facility will reduce its energy consumption. A strong sectoral component can be noticed in Table 16. Facilities in the metal and textile and leathers sectors were more likely to reduce their energy consumption, while facilities from the oil sector were less effective in reducing its water consumption and waste generation. Only one dummy related to the location of the facilities has been retained. The regressions indicate that facilities in Northern Europe were more effective in reducing their energy consumption in Table 16 The relative importance index for this variable is the lowest in Table 16. Environmental regulations have been important drivers to increase the resource efficiency of a company. The relative importance index on the Water Framework Directive is about 40% in the case of water consumption and somewhat lower in the case of energy consumption. Thus, the Water Framework Directive has a positive impact in the case of energy consumption and, more importantly, in the case of water consumption. It should be mentioned that the NEC Directive is retained with a negative sign in the case of energy consumption, i.e. the resource which is more strictly related to the aims of the policy. On the other hand, in the same regression, the coefficient on the LCP Directive is positive, therefore showing quite an interesting side-effect benefit to its intended aim of reducing emissions of acidifying pollutants, particles, and ozone precursors. Finally, one can notice the difference in terms of adjusted R2 between the regressions for energy and water consumption on one side (adjusted R2 > 0.20) and waste generation (adjusted R2 < 0.10) on the other.

Economic consequences of environmental policies
Sectoral Costs of Environmental Policy 145
Table 16: Efficiency. Reductions in the level of energy and water consumption and waste generation per unit of output over the last five years.
Energy Consumption
Water Consumption
Waste Generation
Strategy 0.55 (2.51) Pro-active Attitude 0.28 (1.88) -0.20 (-1.74) Size (Facility) -0.43 (-3.51) -0.42 (-3.33) Size (Parent) 0.43 (3.88) Northern Europe 0.81 (2.52) Oil -1.51 (-4.49) -0.82 (-1.88) Textile and Leathers 1.68 (5.15) Metals 1.61 (5.76) NEC -0.27 (-2.05) LCP 0.35 (2.36) Water Framework 0.37 (2.60) 0.47 (3.09) Adjusted R2 0.30 0.21 0.09
Notes: the numbers between parentheses denote the t-statistics for the coefficients shown in the table.
0%
10%
20%
30%
40%
50%
60%
70%
80%
90%
100%
Energy Consumption Water Consumption Waste Generation
Size (Facility) Size (Parent) Attitude North Strategy Oil Metal Textile NEC LCP Water
Figure 43: Efficiency. Relative importance index for the regression related to the facilities’ reduction in the level of energy and water consumption, and waste generation per unit of output.
Notes: indices of policy variables are shown by bars surrounded by a red broken line; indices of sector and location variables are shown by bars with a black pattern.
c) Changes in operating costs due to resource efficiency improvements The regressions in Table 17 investigate whether the higher efficiency due to environmental expenditure discussed in Table 15 contributes to decreasing operating

Economic consequences of environmental policies
Sectoral Costs of Environmental Policy 146
costs. In the case of the regression for Waste Generation, one can notice the very low value of the adjusted R2 in Table 17. For this reason, the results from this regression are not discussed. The size of the facility takes a negative coefficient in the energy and water consumption regression; while the size of the parent companies has a negative impact on the reduction in operating costs in the energy consumption regression. In this regression, the relative importance of the two size variables is about 50% - see Figure 44. This means that larger facilities were more likely to reduce their operating costs as a result of the reduced consumption of water and energy, while the opposite holds for facilities with a larger parent company. Sectoral differences are important to explain the changes in operating costs. For example, reductions in water and energy consumption were probably too limited for companies in the oil sector to reduce their operating cost. In the regression for the competitive advantage, the dummy for the textile and leather sector is retained. This means that firms in the textile and leathers sector perceived that their environmental expenditures allowed them to compete more effectively in the marketplace and that these expenditures resulted in strategic advantages over their competitors. The dummy for Southern Europe displays a negative coefficient in the energy consumption regression, confirming the results from Table 16. This indicates that facilities in Southern Europe were less effective in reducing their energy consumption so that this reduction did not allow them to decrease their operating costs. Facilities whose activities were highly affected by the LCP and Water Framework Directives were more effective in reducing their operating cost as a result of a reduced energy and water consumption, while facilities affected by the NEC Directive were less able to reduce their operating costs as a result of a reduction in their energy or water consumption. Therefore, it is not surprising that facilities who were affected by the LCP and Water Framework Directives were more likely to have a comparative advantage due resource efficiency improvements, while the opposite holds for companies affected by the NEC Directive.
Finally it is noteworthy that firms with an environmental management system (EMS) are more likely to perceive that they have a comparative advantage due to improvements in resource use. However, EMS was never a significant determinant in the regressions in Table 16. The presence of environmental management systems probably helps companies transform the environmental expenditure into a competitive advantage. In the case of the policy variables, the sum of the relative importance indices of the variable with a positive coefficient and with a negative coefficient is very similar – see Figure 44.

Economic consequences of environmental policies
Sectoral Costs of Environmental Policy 147
Table 17: Benefits of environmental expenditure The first three columns show the results for reductions in operating costs per unit output due to a reduction in energy and water consumption, and waste generation over the last five years. The last column shows the results for the existence of competitive advantages caused by environmental expenditures. Notes: the numbers between parentheses denote the t-statistics for the coefficients shown in the table.
Energy
Consumption Water
Consumption Waste
Generation Competitive Advantage
Strategy 0.41 (3.54) Size (Facility) -0.83 (-5.28) -0.39 (-2.92) Size (Parent) 0.53 (3.63) EMS 0.48 (1.94) Southern Europe -1.03 (-2.77) 0.78 (1.67) 0.60 (2.20) Oil Sector -1.13 (-4.11) -0.97 (-2.80) Textile and leather Sector
0.54 (2.28)
NEC -0.36 (-2.57) -0.33 (-1.84) -0.24 (-1.97) -0.34 (-3.48) LCP 0.31 (2.26) 0.28 (2.35) Water Framework 0.39 (2.02) 0.45 (2.70) 0.25 (1.74) 0.36 (2.28) Adjusted R2 0.27 0.17 0.03 0.28
0%
20%
40%
60%
80%
100%
Energy Consumption Water Consumption Waste Generation Competitive Advantage
Size (Facility) Size (Parent) Strategy EMS Oil South Textile NEC Water Framework LCP
Figure 44: Benefits of environmental expenditure. Relative importance index for the regression related to the facilities’ competitive advantages caused by environmental expenditures and the reductions in operating costs per unit output caused by a reduction in energy and water consumption.
Notes: indices of policy variables are shown by bars surrounded by a red broken line; indices of sector and location variables are shown by bars with a black pattern.

Economic consequences of environmental policies
Sectoral Costs of Environmental Policy 148
d) Overall changes in unit production costs relative to competitors As one can see in Table 18, all policy variables retained in the final specification have a positive coefficient pointing to the proposition that the introduction of environmental regulation tends to increase rather than decrease unit operating costs relative to their competitors. Figure 45 confirms the importance of the policy variables: the sum of their relative importance index being on average about 50%. In the regression for the EU new Member States, the sum of the relative importance indices for the policies variable is somewhat lower than the level observed in the other regressions. The fact that the variable for the Waste Directive and the NEC Directive are retained in the regressions in Table 18 is hardly surprising. In fact, the former always had a negative effect on the responses from the survey on resource efficiency and benefits from environmental expenditure – see Table 15, 16 and 17, while the latter was never found to be a significant factor in these regressions. The presence in Table 18 of the variable for the LCP directive and the Water Framework Directive, which had a positive effect on benefits from environmental expenditure and resource efficiency in some of the regressions in Table 15, 16 and 17, is probably related to the way in which the Directive has been implemented in different Member States. A number of non-policy drivers contract the apparent negative effect of environmental regulations on unit operating costs. Among these variables, size is an important factor. The variable for the size of the parent company is retained in all regressions in Table 18, the relative importance index of the coefficients being about 20% - see Figure 45. As pointed out by the negative coefficient, the change in the unit production costs relative to competitors is more likely to decrease when the facility is owned by a parent company of considerable size. A similar effect can be observed for the autonomy variable when unit costs are assessed relatively to competitors in the EU’s new Member States. This points to the fact that an independent facility can find a way to attenuate the negative effect of environmental regulations on the unit production costs. With regard to the location of the facilities, those from Southern Europe seem to be more positive on the effect of environmental regulations on their unit production costs compared to facilities located in the EU’s new Member States and Outside the EU. A considerable value for the relative importance index for this variable can be observed in Figure 45. The dummy variable for Northern Europe takes a negative coefficient in relation to competitors in the EU-15.

Economic consequences of environmental policies
Sectoral Costs of Environmental Policy 149
Table 18: Unit Production Costs. Change in the facility’s unit production costs due to environmental regulations over the past five years relative to facilities in the EU-15, in the EU new Member States and outside the EU. Notes: the numbers between parentheses denote the t-statistics for the coefficients shown in the table.
EU15 EU (New MS) Outside EU Autonomy -0.25 (-2.34) Northern Europe -0.54 (-2.12) Size (Parent) -0.21 (-2.65) -0.23 (-2.43) -0.18 (-1.92) Southern Europe -0.70 (-2.02) -0.81 (-1.79) NEC 0.17 (1.94) Waste Framework 0.31 (3.69) 0.31 (2.05) LCP 0.25 (3.77) Water Framework 0.31 (2.93) Adjusted R2 0.2 0.14 0.08
0%
20%
40%
60%
80%
100%
EU15 EU New MS Outisde the EU
Size (Parent) Autonomy North South NEC LCP Waste Framework Water Framework
Figure 45: Unit Production Costs. Relative importance index for the regression related to the changes in the facilities’ unit production costs due to environmental regulations.
Notes: indices of policy variables are shown by bars surrounded by a red broken line; indices of sector and location variables are shown by bars with a black pattern.
e) Administrative costs and taxes
The Figure below shows how the respondents perceive their administrative costs related to environmental regulation. The graph shows that most frequently respondents perceive their administrative costs to be about the same as those of competitors within the EU-15. Only a very few (5 %) estimate their administrative costs to be lower than those of

Economic consequences of environmental policies
Sectoral Costs of Environmental Policy 150
competitors. Compared to the new Member States and even more to outside of the EU respondents most frequently asses their administrative costs to be much higher. The picture for the environmental tax in the Figures 20, 22 and 24 in Annex 3 looks about the same.
a) EU-15
0
5
10
15
20
25
30
Much lower Slightly lower About thesame
Slightly Higher Much Higher
Num
ber
of r
espo
nden
ts
Total Oil Power Textiles Metals
b) EU New Member States
0
5
10
15
20
25
30
Much lower Slightly lower About thesame
Slightly Higher Much Higher
Num
ber
of r
espo
nden
ts
Total Oil Power Textiles Metals
c) non EU
0
5
10
15
20
25
30
35
Much lower Slightly lower About thesame
Slightly Higher Much Higher
Num
ber
of r
espo
nden
ts
Total Oil Power Textiles Metals
Figure 46: Administrative burden related to environmental policy compared to producers a) in the EU-15. b) in the new Member States and c) outside of the EU.

Economic consequences of environmental policies
Sectoral Costs of Environmental Policy 151
Table 19 shows that the policy variables have positive coefficients. This indicates that they increase the relative magnitude of the facilities’ administrative burden and environmental taxes compared to producers in EU-15, in the EU new Member States, and outside the EU. A number of other drivers however tend to decrease the administrative burden and environmental taxes and will in that sense buffer the impact of environmental policies. For example, the size of the facility has a negative effect on the magnitude of the administrative burden relative to producers in the EU-15, see second column of Table 19. In the same regression it is somewhat interesting to observe that facilities in Southern Europe tend to have a lower administrative burden than their competitors in the EU-15. This contrasts with the somewhat stereotypical description of governments in that region of being more bureaucratic. Unexpectedly, strategy has a positive effect in that regression. However, the regressions discussed in the previous chapters illustrated that facilities with an environmental strategy are more likely to invest in end-of-pipe technologies or to reformulate pre-existing products in response to the introduction of environmental regulations, and have higher investment expenditures and operational expenditures on environmental protection. Therefore, the higher administrative burden is probably proportional to the higher level of environmental activities of companies that adopt an environmental strategy. In the regression for the administrative burden relative to producers in the new Member States – see third column in Table 19, size is still an important factor. Its relative importance index being about 40%, although in this case the size of the parent company rather than that of the facility is retained in the final specification.
In the case of the other two regressions, the adjusted R2 takes very low values – see the bottom of the table – and will therefore not be discussed. Table 19: Administrative and Tax Burden. Size of administrative burden and environmental taxes compared to producers located in the EU-15, in the EU new Member States and outside the EU over the last five years. Notes: the numbers between parentheses denote the t-statistics for the coefficients shown in the table.
Administrative (EU-15)
Administrative (New MS)
Administrative (Outside EU)
Taxes (Outside EU)
Size (Facility) -0.24 (-2.93) Size (Parent) -0.19 (-4.49) Strategy 0.22 (2.02) Southern Europe
-0.49 (-2.03)
IPPC 0.26 (2.88) 0.20 (1.72) NEC 0.21 (3.58) Waste Framework
0.25 (2.73)
Water Framework
0.33 (5.48)
Adjusted R2 0.17 0.20 0.07 0.04

Economic consequences of environmental policies
Sectoral Costs of Environmental Policy 152
0%
10%
20%
30%
40%
50%
60%
70%
80%
90%
100%
Admin burden (EU15) Admin burden (NewMS)
Admin burden (outsideEU)
Environmental taxes(Outside EU)
Size (Facility) Size (Parent) Strategy South IPPC
ETS NEC Waste Framework Water Framework
Figure 47: Administrative and Tax Burden. Relative importance index for the regression related to the facilities’ benefits from environmental expenditure.
Notes: indices of policy variables are shown by bars surrounded by a red broken line; indices of sector and location variables are shown by bars with a black pattern
6.2.3 Conclusions Over the last five years, the size of a facility and its parent company have been important determinants of resource efficiency improvements and reductions in operating costs due to these resource efficiency improvements. Larger facilities are typically less likely to reduce their energy and water consumption and hence their operating costs due these resource efficiency improvements, while the opposite holds for facilities with a larger parent company. Moreover, larger facilities and facilities with larger parent companies perceive that administrative costs and environmental taxes related to as well as unit production due to environmental policies are smaller compared to their competitors. Overall resource efficiency improvements as well as resource efficiency improvements specifically in response to environmental expenditures differ regionally. Facilities in Southern Europe were significantly less efficient in reducing their energy consumption due to environmental expenditures and consequently they were also less efficient in reducing their operating costs. In contrary, facilities in Northern Europe were significantly better in reducing their energy consumption. However, facilities in Southern Europe perceived that the relative magnitude of their administrative costs and environmental taxes related to environmental policies are smaller compared to their competitors. Quite surprisingly, with the exception of the regression for energy consumption in Table 16, the sectors to which the facilities belong to do not seem to have had much influence on the regressions discussed in this section. Although environmental strategy and pro-active attitude are retained in a number of occasions, their importance seems to be rather small with the exception of efficiency related to waste generation. However, it should be

Economic consequences of environmental policies
Sectoral Costs of Environmental Policy 153
mentioned that environmental strategy and EMS are retained for the regression of the effect of environmental expenditure on competitive advantage. Finally, environmental policies are important drivers of resource efficiency improvements and hence of reductions in operating costs as a result of reduced energy and water consumption and waste generation. Unexpectedly, facilities whose activities were highly affected by the NEC Directive were less efficient in reducing its energy consumption and experienced a smaller reduction in operating costs due to resource efficiency improvements than those facilities that were not (or at least less) affected by the NEC Directive. On the other hand, facilities affected by the Water Framework Directive and the LCP Directive were able to realize a considerable reduction in their water and energy consumption which also allowed them to reduce their operating cost. Therefore, it is not surprising that these facilities also perceived to have a competitive advantage due to their expenditures on environmental protection. The different environmental polices also lead to an increase in administrative costs and environmental taxes, and unit production costs compared to their competitors.
6.3 Case study on impact on competitiveness - the leather industry Most of the steps of the tannery’s operations are performed in water. Consequently, water use, waste water effluent, and the waste disposal routes for waste water treatment sludge are major concerns in tanneries. Environmental regulation at the European and the national/regional level is designed to keep the environmental impact of these activities to a minimum by providing incentives to put into place cleaner production methods. Regarding water policy, a number of European initiatives potentially affect the tanning industry. They are regulating (i) the protection of the surface waters by establishing quality objectives, (ii) the promotion of the purification of urban waste water, (iii) the reduction of discharges of hazardous substances, and (iv) the protection of groundwater. In this case study, we focus on the effects of environmental legislation and investment decisions related to water issues on the competitiveness of the leather industry. Environmental costs in the European tanning industry are estimated at about 5 % of turnover. The largest part of these expenses relate to water issues (Ecologic, 2007). It can be said that environmental expenditure is substantial for the sector and in the following case we will address the impact of these expenditures on competitiveness taking into account differences between firms as explained below. The case study confirms that within Europe differences in environmental regulations and enforcement exist or at least existed. The general idea is however that other factors such as unfair competition supported by insufficient trade rules were far more important to explain the shift from the tanning industry from north to south and from west to east. The differences in environmental regulations have now largely being flattened out by legislation at the European level. Italian tanners were able to cope with stringent environmental regulations mainly through structural and organisational reasons which led to external economies of scale regarding environmental investment. German tanners on the other hand have generally lost out to

Economic consequences of environmental policies
Sectoral Costs of Environmental Policy 154
other competitors on the international markets and could not cope with the strict national environmental controls imposed on them. In the technological field the tanning industry has not yet experienced any important process-innovation and product innovation offsets as a consequence of environmental measures. Earlier environmental policies mainly stimulated end-of-pipe measures and more recently process changes also occur in response to environmental policy. On top of that, the succession of environmental regulations happened relatively fast in relation to the long investment cycles in the tanning industry. Further developments in the environmental area are possible according to the tanning sector but this requires a strong industrial policy and coordination between industrial, trade, internal market, environmental and health and safety policies. The tanneries in the new Member States generally come from a former command economy where pollution control was largely neglected. These companies have only had a short time to adapt to the European situation and for some countries the cost of compliance with EU environmental protection is seen as a threat to the local tanning industry. Although larger companies are generally better able to cope with the implementation of environmental regulation there are still valid reasons for the companies to remain small. The most important reasons are the opportunities to flexibly respond to customer requirements in the supply to smaller niche markets and the relatively small scale of the cattle herds and slaughterhouses supplying the raw material.. The tanning industry is one of the most globalised industrial sectors and the European tanners are highly dependent on the foreign supply of raw materials, which account for 50 % to 70 % of production costs. Tariff and non-tariff barriers for raw materials which emerging economies in developing countries use to protect and promote domestic downstream processing industries severely hinder the competitive access of European tanners to raw materials. Combined with the lower labour costs and the lower environmental costs these reasons are thought to be of much greater importance in the shift of the tanning industry to developing countries than just the environmental legislation pressures.

Chapter 7:
Environmental consequences of
environmental policies This chapter aims to investigate how environmental policies affect the emission of greenhouse gases, other air pollutants and water pollutants.


Environmental consequences of environmental policies
Sectoral Costs of Environmental Policy 157
7 ENVIRONMENTAL CONSEQUENCES OF ENVIRONMENTAL POLICIES
7.1 Contextual background
The reduction of emissions to air, land, water, etc for the sectors in the different Member States has an impact on the environmental quality. The benefits of the pollution reduction can be assessed in terms of health benefits (mortality, morbidity), ecosystem benefits, avoided climate change, etc. Producing the monetisation of both costs and benefits, by assessing the monetary value to society of these benefits, and by comparing both over time, would be very interesting but falls outside the scope of the study. In general, the industry in general and the selected sectors in particular show a track record of decreasing emissions and improved efficiency (see also the sector reports in Annex 1). The EPER database provides a sound basis to identify the time series of different pollutants. Commission Decision 200/479/EC of July 2000 on the implementation of a European Pollutant Emission Register (EPER) requests Member States to deliver data on emissions by industrial facilities of 53 pollutants, 37 of these concern emission to air and 26 emissions to water. All emission data collected through the EPER process are published on a website28. EPER is due to be replaced by the European pollutant release and transfer register (PRTR) in 2009. The EPER Review Report 2004 (EC, 2007) reveals that quite large changes have occurred between both reporting years. Overall, most emissions decreased. For 26 pollutants the change is less tan 10%, for 38 pollutants an increase of more than 10% is reported, whereas for 14 pollutants decreases of 10% or more are observed. Emissions on the rise include carbon dioxide, up by 5.5 per cent. Among improving trends, nitrogen released into water bodies decreased by 14.5 %, and emissions of dioxins/furans to air fell by 22.5%. In the EU-15, all air emissions increased except for NMVOC, ammonia, SOx and SF6. As an example, we explore some larger time series of emissions into the air. A recent review of the Protocol of Gothenborg (CIAM, 2007) revealed that during the past decades emissions of SO2, NOx, VOC and particulate matter (PM) have declined substantially, and are expected to decline further with progressing implementation of current legislation on emission controls. In contrast, only modest reductions have occurred for NH3. However, current levels of most emissions are two to three times higher than the pre-industrial levels. Parties that signed or ratified the Protocol exhibit much sharper emission reductions than the other Parties. On a sectoral basis, the largest declines in relative and absolute terms occurred for emissions from power generation, which cut SO2 emissions by 70% (or by more than 16 million tons) and NOx emissions by almost 50% (or by 2.8 million tons). The majority of these reductions were caused by the economic restructuring in central and eastern European countries after 1990, which led to substantially lower coal consumption. In the EU countries, the introduction of end-of-pipe emission control measures yielded significant emission cuts. Furthermore, SO2 emissions have been reduced in the domestic and industrial sectors as a consequence of the phase-out of coal. The transport sector,
28 see http://eper.cec.eu.int/eper
Environmental consequences of environmental policies
Sectoral Costs of Environmental Policy 158
despite substantially increased traffic volumes, reduced its NOx and VOC emissions by 28% and 66%, respectively. NH3 emissions from agriculture and VOC emissions from solvents declined 20-30% (CIAM, 2007). The above examples clearly indicate that considerable improvements have been achieved in terms of environmental quality. These achievements have been realized in a period of continued output growth in the European Economic Area. Since the improved environmental quality cannot be attributed to a decrease in output, new environment-friendly production technologies (or eco-innovation) must have been introduced leading to this positive evolution. Eco-innovations reduce the negative environmental impact and differ in that sense from ordinary innovations. The development and dissemination of eco-innovations may be policy or market driven. End-of-pipe technologies, which isolate or neutralize polluting substances after they have been formed tend to be policy driven. However, the introduction of such end-of-pipe technologies is often considered as undesirable because it leads to waste that has to be disposed of. Therefore, policy makers will search for instruments that improve environmental quality in another way. Clean or process-integrated technologies which lead to less pollution, resource and/or energy use by changing the process and production methods, as well as product innovations which lead to new products that contain less harmful substances, use less energy and produce less waste are often considered to be superior to end-of-pipe technologies. Companies will not only develop process-integrated and product innovations because of the environmental policy that is in place, but also because these innovations lead to cost reductions and improved process and/or better market opportunities. Therefore, they tend to be more often driven by the market or ‘normal’ business cycles than end-of-pipe technologies. There is a consensus that environmental policies do not have a negative impact on the development of eco-innovations and hence on the environmental quality. In contrary, they seem to play at least a steering and sometimes even a driving role in development and diffusion of eco-innovations (IVM, 2006). To what extent environmental policies affect eco-innovations and the environmental quality depends to a large extent on the choice, design and implementation of the policy instruments. First, the choice of the policy instruments matters. Direct regulations (or command-and- control instruments) are often thought to be inferior to economic instruments because the former do not provide any incentive to develop (additional) eco-innovations once the standards have been met. Well-designed economic instruments may provide a lasting financial incentive to look for eco-innovations, which improve environmental quality and therefore they tend to outperform direct regulations (Jaffe et al, 2002; Requate 2005; Johnstone, 2005). However, caution is needed when making such generalisations. For example, command-and-control instruments have shown to work very well under some very specific conditions (see e.g. Harrington et al. 2004 for a concrete example of the successful implementation of air emission standards in German power plants), while economic instruments may be less appropriate if the main factor blocking eco-innovation is not a financial one (Elzenga and Ros, 2004). Finally, others stress the importance of direct

Environmental consequences of environmental policies
Sectoral Costs of Environmental Policy 159
support for environment-orientated innovation besides economic instruments and direct regulations because of the positive externalities of R&D spill-overs (Ashford, 2005). Second, the way a certain policy is designed and implemented will be crucial for its success in achieving the desired environmental quality. The strong policy with clear, consistent and lasting sufficient financial incentives will be more likely to result effective eco-innovations and improved environmental quality (Kemp, 2000). In the remaining of this chapter we will investigate to what extent the environmental quality is determined by environmental policies using primary survey data. Reductions in the level of greenhouse gas, other air pollutants and water pollutant emissions will be regressed upon different policies and firm characteristics.
7.2 Empirical Analysis of the Environmental Consequences of Environmental Policies
7.2.1 Introduction
Ideally, in order to determine reductions in emissions occurring as a result of the regulations, operators would have been asked to provide data comparing mass releases before and after implementation of the legislation. However, other studies revealed that the response to this type of question would be very low (e.g. Defra, 2007). For this reason, respondents were asked to agree or disagree on whether a significant reduction in the emissions of GHGs, other air pollutant emissions (NOx, SOx , VOC, PM, etc.), and water pollutants has occurred in the last five years. The reductions are expressed per unit of output. In other words, a decrease of GHGs arising exclusively from a fall in the output would not be counted as a reduction in emissions. The statements from which the variables used in the regression were built can be seen in Box 10. Box 10: Statements related to the facilities’ emissions
Please indicate the extent to which you agree or disagree with the following statements (1: strongly disagree, 2: disagree, 3: slightly disagree, 4: neither disagree nor agree, 5: slightly agree, 6: agree, 7: strongly agree) � Over the past five years, there has been a significant reduction in the level of
greenhouse gas emissions per unit produced resulting from production at this facility.
� Over the past five years, there has been a significant reduction in the level of other air pollutant emissions (NOx, SOx, VOC, PM, …) per unit produced resulting from production at this facility.
� Over the past five years, there has been a significant reduction in the level of water pollutant emissions per unit produced resulting from production at this facility.

Environmental consequences of environmental policies
Sectoral Costs of Environmental Policy 160
7.2.2 Results and analysis With respect to the emission of greenhouse gasses per unit production respondents most frequently (27 % of respondents) agree that there was a significant reduction over the past five years. There is however a large spread of the answers. A large part of respondents (22 %) neither disagrees or agrees and a substantial part slightly disagrees or disagrees with the statement. The responses on the question relating to ‘other air pollutants’ are more concentrated and the most frequent response is ‘slightly agree’. Relating to water emissions the respondents most frequently neither agreed or disagreed to a significant reduction. A large part of respondents (>25%) however agreed with the statement.

Environmental consequences of environmental policies
Sectoral Costs of Environmental Policy 161
a) Greenhouse gas emissions
0
4
8
12
16
20
StronglyDisagree
Disagree SlightlyDisagree
NeitherDisagree
Agree
SlightlyAgree
Agree StronglyAgree
Nu
mbe
r of
resp
onde
nts
Total Oil Power Textiles Metals
b) Other air pollutant emissions
0
5
10
15
20
25
StronglyDisagree
Disagree SlightlyDisagree
NeitherDisagree
Agree
SlightlyAgree
Agree StronglyAgree
Num
ber o
f res
pond
ents
Total Oil Power Textiles Metals
c) Water pollutant emissions
0
4
8
12
16
20
StronglyDisagree
Disagree SlightlyDisagree
NeitherDisagree
Agree
SlightlyAgree
Agree StronglyAgree
Num
ber o
f res
pond
ents
Total Oil Power Textiles Metals
Figure 48: Presence of a significant per unit reduction in a) greenhouse gas emissions. b) other air pollutant emissions and c) water pollutant emissions
From Error! Reference source not found., one can observe the very low adjusted R2 of 0.04 for the regression for other air pollutants, and the fact that only one policy, which is not strictly related to these pollutants, is retained. The agreement with the statement related to other air pollutants does not seem to be influenced by any other of the drivers described. This could be explained by the fact that the majority of these reductions have been implemented earlier than the time period specified in the statement, i.e. the last five

Environmental consequences of environmental policies
Sectoral Costs of Environmental Policy 162
years (see sector reports). However, it seems more prudent not to give much importance to the results from this regression and focus on the other two presented in the table. In the case of the final specification for GHGs and Water, a number of non-policy drivers are present in the regression models. Quite interestingly, environmental strategy is among the non-policy variables retained in both regressions, its relative importance index being about 40% in the case of GHGs and about half that value in the case of water. Unexpectedly, pro-active attitude seems to decrease the agreement shown by the facilities on the statement related to GHGs’ reductions. In the same regression, size has a positive effect.
The regression for water pollutants presents a strong sectoral component with the index on two dummies, i.e. those for the textile and leather and the metal sectors, being higher 50%. The variable for the Water Framework Directive is retained in the final specification
Table 20: Emissions. Reduction in the facilities’ level of emissions of GHG, water pollutants and other air pollutants per unit of output over the past five years
Notes: the numbers between parentheses denote the t-statistics for the coefficients shown in the table.
Greenhouse Gases
Water Pollutants
Other Air Pollutants
Size (Facility) 0.31 (1.75) Metal Sector 0.59 (1.97) Textile and leather Sector 0.78 (2.16) 1.22 (3.35) Strategy 0.74 (2.97) 0.30 (1.89) Attitude -0.38 (-2.17) Water Framework 0.38 (2.61) 0.30 (1.84) Adjusted R2 0.14 0.18 0.04

Environmental consequences of environmental policies
Sectoral Costs of Environmental Policy 163
0%
10%
20%
30%
40%
50%
60%
70%
80%
90%
100%
Greenhouses Gases Water Pollutants Other Air Pollutants
Size (Facility) Attitude Strategy Water Framework Textile Metal
Figure 49: Emissions. Relative importance index for the regressions related to the facilities’ level of emissions of GHG, water pollutants and other air pollutants per unit of output.
Notes: indices of policy variables are shown by bars surrounded by a red broken line; indices of sector and location variables are shown by bars with a black pattern.
7.2.3 Conclusions In the regression explaining emissions of greenhouse gases, other air pollutants and water pollutants a surprisingly low number of drivers were retained. While the results for the reduction in emissions of other air pollutants need to be discarded because only a very small share of the variation could be explained, the other two regressions provide interesting insights. Greenhouse gases and water emissions have been influenced by a number of non-policy drivers over the last five years, such as the size and environmental strategy of the facility. The sectoral component has been particularly important for water pollutants as particularly facilities in the metals and textile and leathers sector were significantly better in reducing the emission of water pollutants.


Chapter 8:
Conclusions and Recommendations This last chapter gives the main conclusions of the report and some recommendations for policy makers.


Conclusions and recommendations
Sectoral Costs of Environmental Policy 167
8 CONCLUSIONS AND RECOMMENDATIONS
8.1 Conclusions 1. This study on 'Sectoral costs of environmental policy' aims to paint an integrated
picture of the drivers for environmental expenditures, their effects and their consequences for a number of industrial sectors that are highly affected by (European) environmental policy. Previous studies mainly focussed on specific aspects, for example the role of policy instruments, or investigated the individual impact of one Directive, but in this study we will assess the costs attributable to environmental policy in its entirety. The primary data to carry out the analysis were existing statistical data, an on-line survey responded to by individual companies, and sectoral case studies.
2. The four sectors analysed were the electricity sector, the oil chain sectors, the textiles
and leather sector and the iron and steel sector (extended to base metals). These are mature sectors faced with an increasingly global competition from mostly outside the European Union. Due to the nature of their activities these industries are pollution intensive, but they show an overall strong track record of environmental improvements in the past for many environmental domains.
3. To realise these environmental improvements, considerable expenditures were needed,
both in terms of investments and operational costs. As such information on environmental expenditures is critical for companies’ operations and for policy makers in order to identify the effect of key environmental regulations. Therefore, at the level of EU (Eurostat) and OECD databases are compiled with overviews of expenditure for the different countries, split up per environmental medium, per type of investment etc. Unfortunately, these data are sometimes of poor quality. The most obvious reason is of course that environmental expenses can not be directly taken from most accounting systems in companies. If information is available it is often commercially sensitive and regarded as being confidential. Therefore, Member States organise the data gathering process, for example by surveying a sample of companies. Although uniform questionnaires and definitions have been developed, lack of consistency in the data sets used seems to be the reality to some extent. It is not straightforward to understand why in one country specific costs are up to 8 times higher than in a comparable country. This makes reliable comparisons difficult.
4. The detail of data available also differs substantially, making it for example hard to
assess issues such as administrative costs related to environmental legislation, and ‘external’ environmental costs, which are less obviously influenced by enterprises. Finally, it should be noted that that despite the current focus of environmental policy on climate change, so far little to no information on expenditures linked with climate policy is available. The costs are probably (if at all recorded) hidden in costs attributed to emissions and air quality domains. A reason why these expenditures are not yet clearly recorded/published may be because it is not straightforward to specifically record the costs of climate policy, as in many cases, the incremental investments will be paid back (at least partly) by revenues from energy savings.
5. The analysis of statistical data on environmental expenditures in EU Member States
shows that the quality of data is varying, but also that there is a lack of consistent time

Conclusions and recommendations
Sectoral Costs of Environmental Policy 168
series, covering long enough periods to derive meaningful trends. Although there is harmonisation in the type of data published at EU level by Eurostat, at least covering expenditures for the most important environmental domains (air, water and waste), the ways in which these data are collected by Member States differ widely.
6. Despite the sometimes large differences in the specific expenditures between
countries, in general, in-depth analyses of the publicly available data result in conclusions that are quite comparable and reliable. From the results of our analyses, it seems that environmental expenditures do not form a large cost driver for the sectors, and specific costs do not necessarily increase, even when standards become stricter. An indication that other factors than environment will have a larger influence on value added, profits and competitiveness of the sectors studied, is the sometimes quite large differences between value added as % of total gross production. Often these differences are much larger than the observed differences in specific environmental expenditures.
7. Despite the limited size of the sample of ‘primary’ data we gathered, we could
identify a number of factors influencing technological responses, environmental expenditures, and economic and environmental consequences resulting from environmental policies. The methodology used in the analysis and the way in which the questions were framed in the survey has proved to be helpful in order to obtain a clearer picture of the impacts of environmental regulations. Clearly, our results are strictly valid only for the sample we assessed. Considering the somewhat small size of the sample, the extent to which the results can be generalised is limited.
8. Investments show large fluctuations, which is logical: implementation of EU law is
linked to time schedules, and investments follow the investment cycle. But although EU legislation often has to be implemented in the same time framework in all Member States, no such investment patterns surface from the analysis. This may be due to the timing of investments and the short period for which data were available for analysis (2001-2005).
9. Within EU, larger differences occur than in comparison with Australia and US. So in
general environmental costs for industry outside the EU are of a comparable level to the EU average. A problem with this comparison is that data on environmental expenditures are not always comparable (sector (NACE) classification; availability of sufficient data).
10. The costs of environmental policy since the 1990s vary between the studied sectors,
with the environmental costs for the electricity producers and the mining sector tending to fall, while the environmental costs for the refineries generally increasing. A possible explanation of more or less stable costs, or costs that increase less than might be expected, based on the assumption of higher marginal abatement costs when reducing “marginal” pollution, is the decrease of ‘unit costs’ which are comparable with the specific costs referred to in this analysis) due to technological developments. Therefore, innovation could be viewed as one of the important factors that stabilising the unit costs of environmental protection.
11. Gathering primary data at the company level on confidential/commercial/sensitive
issues was one of the major challenges to overcome in this study. For this purpose we

Conclusions and recommendations
Sectoral Costs of Environmental Policy 169
used an extensive on-line survey based on qualitative perception questions to obtain an integrated picture on how companies view the impact of environmental policies on their businesses. In the end, we received 64 completed surveys, representing 170 plants, mostly larger ones, from the selected sectors in 14 Member States. This dataset was used to carry out a statistical analysis.
12. Despite the limited size of the sample, we could identify a number of factors
influencing the results from environmental policy. The methodology used in the analysis and the way in which the questions were framed in the survey has proved to be helpful in order to obtain a clearer picture of the impacts of environmental regulations. Clearly, our results are strictly valid only for the sample we assessed. Considering the somewhat small size of the sample, the extent to which the results can be generalised is limited.
13. From our survey, we learned that the IPPC Directive 96/61/EC is overall considered
as the Directive that substantially affects the plants in all selected sectors and as such is a key regulatory driver for recent and current expenditure. This is not a surprise as the Directive had its deadline for implementation for existing installations of October 30, 2007. The influence of the Directive most probably is also one of the explanations why investments gradually shift from end-of-pipe towards more process integrated approaches. This conclusion gives some counterweight to the worries the Commission recently expressed about the effect of the implementation of the Directive so far and might be an element in the ongoing discussion on the review of the Directive.
14. In this study, we were not able to identify the separate effect of one Directive on the
investment decisions and the expenditure of the plants. Moreover, the analysis learned that it is simply not possible to ‘extract’ one driving factor out of the complex interplay of regulation at different levels, implementing policy instruments, business cycles and strategic considerations of companies.
15. The statistical analysis did neither allow us to fully demonstrate add-on effects of
implementation of different pieces of legislation. However, for most of the regressions, several explanatory variables were retained, which indicates that expenditure and behaviour cannot be explained by a single driver or regulation.
16. The limited case studies we carried out provide some interesting insights. The drive
for synergies generally is an important element in the negotiations between (local) authorities and companies, e.g. on a permit review. This is particular the case for different regulations affecting one environmental medium (for example, air emissions combining IPPC and NEC requirements into a single permit review).
17. One should be very careful in processes assessing the expected effects of (new)
regulation, for example in impact assessments. Typically, one considers the stand-alone consequences of a regulation, underestimating the synergetic effects. This could lead to the recommendation to give more weight in this kind of analyses to the add-on effects. However, it will be far from straightforward to identify and quantify these effects, as they –once again- largely depend on the complex interplay of implementation.

Conclusions and recommendations
Sectoral Costs of Environmental Policy 170
18. From an industry perspective, these add-on effects will be questioned, for a number of possible reasons. First, there are sometimes many environmental regulations that affect their operations, from different perspectives. Second, what appear as adds-on for competent authorities (e.g. IPPC combined with NEC) might be considered as threatening the level playing field for plants (e.g. obliged to take measures beyond BAT to contribute to achieve stringent national emission ceilings). In this respect, the Water Framework Directive can be considered as a comprehensive or holistic approach as it replaces several older Directives and it sets a framework for Member States to implement. This leads to the recommendation to further streamline the several Directives affecting industrial emissions (IPPC, LCP, …) into a single framework Directive.
19. Over the last five years, environmental strategy has been a considerable influence on
the impacts of environmental regulations, especially when evaluating the responses, the expenditure and the emissions abatement of the facilities. Strategy has a somewhat smaller influence in the case of efficiency, unit production costs and administrative burden, although it influences, alongside the presence of Environmental Management Systems, the competitive advantage resulting from environmental expenditure. It should be noticed that strategy has always had a positive effect on the impact of regulations, i.e. increasing expenditure, increasing emission abatements and increasing responses. Bearing this in mind, policies aimed at increasing the advantages from environmental strategy, e.g. labels for goods produced according to state-of-the-art environmentally responsible production technologies, can contribute to increasing the impact of environmental regulations, and ultimately, deliver emission abatements or increased resource efficiency.
20. The size of facility and the parent company have been found to be two other factors
influencing the impact of environmental regulations over the last five years. Size has had a negative effect on the efficiency and benefits from environmental expenditure but a positive effect on the facilities’ administrative and environmental tax burden, and unit production costs compared to other producers, i.e. facilities of a bigger size have done better in the last five years. The size of the facility had a positive effect on emission abatement and responses to regulations. The importance of size in the facilities’ responses is an important result, which should be borne in mind in the national implementation of European Directives. Tailored advice or complementary support schemes could be offered to those facilities, with a size which is apparently discouraging effective responses to environmental regulations.
21. The sectors, to which facilities belong, have not had much effect on the impacts of
environmental regulation with the notable exception of environmental expenditure and, in some instances, efficiency. Over the last five years, the regions where facilities are located had a considerable effect on the impact of regulations on unit production costs and benefits from environmental expenditure with facilities in Southern Europe being clearly different from the other facilities in our sample. This confirms that the way in which European Directives have been implemented can have a clear effect on their impact.
22. Quite surprisingly, the extent to which a facility had been affected by environmental
regulations over the last five years did not much influence the responses undertaken by the facility. On the other hand, policy variables had a considerable effect on the

Conclusions and recommendations
Sectoral Costs of Environmental Policy 171
expenditure, resource efficiency, administrative burden, unit production costs, abatement of emission and benefits from environmental expenditure. It should be stressed that the NEC and the ETS Directive have displayed a negative effect on the efficiency and benefits from environmental expenditure. This finding can be observed across a number of regressions and should be further assessed.
23. Finally, over the past five years environmental regulations have increased unit
production costs relative to the facilities’ competitors, pointing at the fact that regulations per se have a negative effect on competitiveness. However, a number of factors mitigate this adverse effect, including the location of the facility and the size of the parent company. Once again the way in which European Directives are implemented is an important factor and complementary policy instruments could be offered to those facilities with a size which is apparently discouraging effective responses to environmental regulations.
24. The outcome of the statistical analysis confirms the conclusion of the comparative
analysis of the officially published expenditure data, that environmental concerns, as far as related to investment and operational and maintenance expenditures, have in the near past not affected significantly the competitiveness of the reviewed sectors. This does however, not guarantee that in the future in certain sectors or Member States, due to specific circumstances, the competitiveness will be affected by further going environmental legislation.
25. The analysis reveals that the relocation of production activities in response to
environmental regulations is very limited. This is quite an interesting result although it should be somewhat qualified. First of all, relocation could have caused the closure of the plant rather than the partial relocation of production activities. Clearly, the effect of plant closures cannot be observed in our sample. The timeframe should also be borne in mind, as the statement refers to relocation in the last five years. In other words, relocation occurring earlier than five years ago is not registered in the sample.
26. We presented many of these results at a stakeholder meeting – two key issues
emerged. Firstly, many of the environmental improvements for heavy industry were carried out during the late 1980s prior to many of the data collected during the study – so some of the indications of environmental costs as a percentage of total costs could be misleading. Secondly, if the results today show that environmental costs do not have a serious impact on competitiveness, this does not mean that this will be the case in the future as industry can foresee more stringent controls on the horizon – in particular the upcoming review of the NEC Directive in 2008. From these comments a recommendation could be that future studies should take into account a longer time period of environmental policy and also to look to the future on possible policy changes.
Conclusions and recommendations
Sectoral Costs of Environmental Policy 172
8.2 Recommendations 1. It is worthwhile to consider further streamlining the gathering process of reliable and
harmonised data on environmental expenditure. Of course, it is up to the Member States to organise the data collection, but the different ways of working lead to data that can hardly be used for analysis as their basis differs too much. Even more important is the need to avoid substantial gaps in the data for many years and in many countries. Reliable time series would be extremely interesting to identify to some extent the impact of key pieces of legislation on the expenditures in certain environmental domains, as shown by the example of the Netherlands. An important caveat in this respect is the need to ensure consistency in the data series and to avoid changing the rules during the process.
2. Data collection on environmental expenditures ideally should satisfy the following
standards: - data collected should be representative of the population sampled, this could be
done by applying a stratified sampling. A stratification strategy could be to divide the population in several groups (e.g. large, medium and small companies), and survey all or most of the large companies and do a sample of the medium and smaller companies. In combination with turn over data on industries the collected information can be “blown up” to the whole population;
- data should be collected on a regular basis, preferably annually if possible. If this is not feasible then questions on investments should cover more than one year. It is advisable to have the same larger companies in the sample, for smaller companies some rotation will not be a (statistical) problem;
- questionnaires should be as straight forward as possible, but also aim at asking only essential information which is relatively easy for companies to specify (for example external payments and expenditures for end-of-pipe investments are normally easily specified as these are probably administered separately in the companies accounts). Examples should be given of what is understood by certain types of expenditures, for example how integrated investments should be assessed. If needed clear accounting rules could be stipulated (for example, in which cases are investments seen as environmental ones, and in which cases are investments considered to be business as usual);
- it should be possible to check the reliability of the answers. For example, not only the amount of money spent should be asked for, but also a short description of the type of investments/expenditures;
- follow up some of the outstanding environmental investments/expenditures reported by companies, and ask additional specific questions to help understand the background to these expenditures.
3. It can be anticipated that in the coming decades, environmental expenditures to
combat climate change will be an important issue, so clear guidelines should be developed on how to monitor these expenditures. The EU needs to discuss this issue urgently with Member States as currently there is no to little statistical data available, whereas expenditures are often quoted in as being in the order of hundreds of billions of euros!. We view that simply including these expenditures under the traditional domain of air will not be enough to allow for an assessment of environmental policy.

Conclusions and recommendations
Sectoral Costs of Environmental Policy 173
4. Reliable time series would be extremely interesting to identify to some extent the impact of key pieces of legislation on the expenditures in certain environmental domains, as shown by the example of the Netherlands. An important caveat in this respect is the need to ensure consistency in the data series and to avoid changing the rules during the process. A recommendation in terms of the issue of confidentiality expressed by National Statistical Offices is to make it a contractual obligation that analysts do not publish raw data, but describe the data in terms of ranges, averages and variability, thereby respecting the current issues of company confidentiality.
5. Due to the small sample size of the on-line survey it would seem advisable to
replicate the analysis discussed here with a larger sample and also for other sectors. When doing so, information could be gathered as a part of established business surveys done by National Statistical Offices so as to increase the response rate and, ultimately, the size of the sample. Including every three years a limited number of additional close ended questions (similar to the ones used in this study) to gather qualitative information could substantially improve the indications to find the drivers and stories behind the figures, without imposing too much burden on responding companies. Another possibility would be to attach qualitative questions to the process of gathering information through the European Pollutant Emission Register (EPER) and the European Pollutant Release and Transfer Register (E-PRTR). Although not statistically representative it would allow responses to be assessed in terms of the location of major industries and the environmental implications for the region in question. Our questionnaire included in the Annexes of this report could be the starting point for considering relevant qualitative close ended questions.


Bibliogaphy
Sectoral Costs of Environmental Policy 175
9 BIBLIOGRAPHY An. (2006), European textiles and clothing in a quota free environment – High Level Group follow-up report and recommendations, 19/09/200 Available at: http://trade.ec.europa.eu/doclib/docs/2006/september/tradoc_130234.pdf Angerer, G., Nordbeck, R., and C. Sartorius (2007), Impacts on industry of Europe’s emerging chemicals policy REACH, Journal of Environmental Management, doi:10.1016/j.jenvman.2006.12.020 Ashford, N. (2005), Government and Environmental Innovation in Europe and North America, in Weber, M. & Hemmelskamp, J. (Eds.), Towards Environmental Innovation Systems, p. 159-174, Springer, Berlin/Heidelberg/New York Australian Bureau of Statistics (2003), Environment Protection Mining and Manufacturing Industries, Australia, 2000–2001, by Susan Linacre, Canberra, Australia Available at: http://www.ausstats.abs.gov.au/ausstats/subscriber.nsf/0/463E9041D2E972EACA256C2A00063C1F/$File/4603.0_2000-01.pdf Basque Government (2004), Contribución Ambiental de las empresas del Sector de Fundición Férrea y no Férrea y Metalurgia No Férrea de la Comunidad Autónoma del País Vasco (Environmental impact of the installations of the Ferrous and non Ferrous Foundries and non Ferrous Metallurgy sector in the Basque Country), Basque Government, Department of Environment and Regional Planning Basque Government (2005), Avances y retos de los Acuerdos Ambientales Voluntarios en la comunidad Autónoma del País Vasco (Benefits and disadvantages of the Voluntary Environmental Agreements in the Basque Country), Basque Government, Department of Environment and Regional Planning Bex, P.M.H.H., Van Vliet , O.P.R. (2003), Actal III, Administratieve lasten NOx-regelgeving en emissiehandel en doorkijk naar CO2-emissiehandel, SIRA Consulting study for Ministry of Housing, Spatial Planning and the Environment
BMU - Federal Ministry for the Environment, Nature Conservation and Nuclear Safety Germany (2001), The German Water Sector – Policies and Experiences, 2001, Bonn, Germany Available at: http://www.umweltdaten.de/publikationen/fpdf-l/2752.pdf Bower, John (2004), The UK Energy Policy Accident: Diriving into a Wall?, Oxford Institue for Energy Studies, UK Available at: http://www.oxfordenergy.org/articles/UK%20Energy%20Policy.pdf Brendow, K. (2002), Global oil shale issues and perspectives, Synthesis of the Symposium on Oil Shale held in Tallin (Estonia) on 18 and 19 November 2002, World Energy Council, Geneva Brink, C., Thomas, R. and W. Smeets (2007), Milieubeleid en concurrentiepositie, Milieu en Natuur Planbureau – MNP. Available at: http://www.mnp.nl/bibliotheek/rapporten/500091002.pdf Bundesarbeitskammer Österreich (2004), Antrag auf Durchführung einer europaweiten Branchenuntersuchung betreffend das Wettbewerbsverhalten der Mineralölkonzerne, Letter to Commissioner Mario Monti dated 30 September 2004. Available at: http://eu.arbeiterkammer.at/pictures/d19/Mineraloel_Brief_Monti.pdf

Bibliogaphy
Sectoral Costs of Environmental Policy 176
Cambridge Econometrics and AEA Technology (2003), The Benefits of Greener Business, final report submitted to the Environment Agency by Cambridge Econometrics and AEA Technology, UK. Available at: http://www.wwflearning.org.uk/data/files/benifits-of-a-greener-business-162.pdf Campos J., Ericsson N. and D. Hendry (2005), General-to-Specific Modelling, Cheltenham, Edward Elgar Publishing CBS (2006), “Enquête ‘Milieu-uitgaven 2005’”, Centraal Bureau voor de Statistiek, Sector Waarneming en statistiekproductie bedrijven, Voorburg, The Netherlands CBS (2007a), Milieukosten van bedrijven (Environmental expenditures of Dutch enterprises), Update 11 July, 2007 Available at: http://statline.cbs.nl/StatWeb/table.asp?STB=G1&LA=nl&DM=SLNL&PA=60019&D1=0,58&D2=a&D3=a&D4=3,l&HDR=T,G3,G2 CBS (2007b), Milieulasten bedrijven verdubbeld, Jaap van Riesen, Voorburg, 11 juli 2007, published in CBS webmagazine, the Netherlands. Available at: http://www.cbs.nl/nl-NL/menu/themas/natuur-milieu/publicaties/artikelen/archief/2007/2007-2235-wm.htm Commission Decision 200/479/EC of 17 July 2000 on the implementation of a European pollutant emission register (EPER) according to Article 15 of Council Directive 96/61/EC concerning Integrated Pollution Prevention and Control (IPPC); Official Journal of the European Communities, L192/36. Available at: http://eper.ec.europa.eu/eper/documents/comission_17072000.pdf Cotance (2002), The European Tanning Industry Sustainability Review, Prepared by COTANCE as a contribution to the World Summit on Sustainable Development. Available at: http://www.uneptie.org/outreach/wssd/docs/further_resources/related_initiatives/COTANCE/COTANCE.pdf Cotance (2007), Personal communication by Cotance, November 13, 2007 CSU – Czech Statistical Office (2007), Environmental Protection Expenditure in the Czech Republic in 2005 – 2006; February 2007. Available at: http://www.czso.cz/csu/2006edicniplan.nsf/engp/2005-06 Defra (2006a), Key results from the 2004 Government Survey of Environmental Protection Expenditure by UK Industry – Sector Report Summary for: “Textiles, clothing and leather products” sector, July 2006. Available at: http://www.defra.gov.uk/environment/statistics/envsurvey/expn2004/sic17-19-2004.pdf Defra (2006b), Key results from the 2004 Government Survey of Environmental Protection Expenditure by UK Industry – Sector Report Summary for: “Coke, petroleum and nuclear fuel” sector, UK Available at: http://www.defra.gov.uk/environment/statistics/envsurvey/expn2004/sic23-2004.pdf Defra (2006c), Key results from the 2004 Government Survey of Environmental Protection Expenditure by UK Industry – Sector Report Summary for: “Basic metals and fabricated metal products” sector, UK. Available at: http://www.defra.gov.uk/environment/statistics/envsurvey/expn2004/sic27-28-2004.pdf

Bibliogaphy
Sectoral Costs of Environmental Policy 177
Defra (2006d), Key results from the 2004 Government Survey of Environmental Protection Expenditure by UK Industry – Sector Report Summary for: “Electricity, gas and water” sector, July 2006. Available at: http://www.defra.gov.uk/environment/statistics/envsurvey/expn2004/sic40-41-2004.pdf Defra (2007a), Mid-term review of the UK’s implementation of the Pollution Prevention and Control Regulations, UK. Available at: http://www.defra.gov.uk/environment/ppc/background/pdf/ppcregs-review.pdf Defra (2007b), Operating Expenditure (OPEX) and Capital Expenditure (CAPEX) by Environmental Media for 2000 - 2004, UK Environmental Protection Expenditure by Industry Survey. Available at: http://www.defra.gov.uk/environment/statistics/envsurvey/index.htm Deloitte Research (2006), Regime Change in the Oil and Gas Industry: How disruption and value migration could undermine the dominance of today’s leading firms. Available at: http://www.deloitte.com/dtt/cda/doc/content/us_er_regimechange_oilandgas_051706.pdf Demailly et al. (2007), Differentiation and dynamics of EU ETS competitiveness impacts, Climate Strategies, University of Cambridge, UK Available at: http://www.climatestrategies.org/uploads/Compet_report_070530.pdf Destatis, Fachserie 19 Reihe 3.1, Available at: http://www.destatis.de, September 21, 2007 Deutsche Bank Research, 2004. EU Monitor. Reports on European integration. The steel industry: enlargement creates opportunities for EU mills. EU Monitor No11, January 2004 EBRD - European Bank for Reconstruction and Development, Sub-sectoral Environmental Guidelines: Apparel and Other Textile Products (Clothes Making - Tanneries and leather products - Textile manufacture ,publication data unknown. Available at: http://www.ebrd.com/about/policies/enviro/sectoral/textile.pdf Ecolas (2005), Assessing the economic impacts of the specific control measures for priority substances and priority hazardous substances regulated under Article 16 of the Water Framework Directive, European Commission DG ENV, Brussels. Available at: http://circa.europa.eu/Public/irc/env/wfd/library?l=/framework_directive/i-priority_substances/supporting_background/ecolas_reportpdf/_EN_1.0_&a=d Ecolas and VITO (2005), Opstellen en uitwerken van een methodologie voor een intersectorale afweging van de haalbaarheid en kostenefficiëntie van mogelijke maatregelen voor de reductie van diverse polluentemissies naar de lucht, Study for LNE, Brussels. Available at: http://www.lne.be/themas/luchtverontreiniging/informatie-studies/Eindrapport%20Intersectorale%20afweging.pdf Ecologic (2007), EU Water saving potential , ENV.D.2/ETU/2007/0001r, European Commission, Brussels. Available at:http://www.ecologic.de/download/projekte/900-949/917/917_water_saving_2.pdf EEA (2000), Environment Signals 2000, Environmental Assessment Report No 6. European Environment Agency, Copenhagen, Denmark. Available at: http://reports.eea.europa.eu/signals-2000/en/page013.html EEA (2002), Energy and environment in the European Union, EEA Environmental issue report No. 31. European Environment Agency, Copenhagen, Denmark.

Bibliogaphy
Sectoral Costs of Environmental Policy 178
Available at: http://reports.eea.europa.eu/environmental_issue_report_2002_31/en/eni-env.pdf EEA (2005a), The European Environment: State and Outlook 2005, European Environment Agency, Copenhagen, Denmark. Available at: http://reports.eea.europa.eu/state_of_environment_report_2005_1/en EEA (2005b), Use of freshwater resources (CSI 018), - Assessment published Nov 2005, European Environment Agency, Copenhagen, Denmark. Available at: http://themes.eea.europa.eu/IMS/ISpecs/ISpecification20041007131848/IAssessment1116497549252/view_content EIPPCB (2001), Best Available Techniques Reference document on the production of iron and steel, European Commission IPPC Bureau, Sevilla, Spain. Available at: http://eippcb.jrc.es/pages/FActivities.htm EIPPCB (2003a), Integrated Pollution Prevention and Control (IPPC) Reference Document on Best Available Techniques for Mineral Oil and Gas Refineries, European Commission IPPC Bureau, Sevilla, Spain. Available at: http://eippcb.jrc.es/pages/FActivities.htm EIPPCB (2003b), Integrated Pollution Prevention and Control (IPPC), Reference Document on Best Available Techniques for the Tanning of Hides and Skins, European Commission IPPC Bureau, Sevilla, Spain. Available at: http://eippcb.jrc.es/pages/FActivities.htm EIPPCB (2003c), Integrated Pollution Prevention and Control (IPPC), Reference Document on Best Available Techniques for the Textiles Industry, European Commission IPPC Bureau, Sevilla, Spain. Available at: http://eippcb.jrc.es/pages/FActivities.htm EIPPCB (2005), Reference Document on Best Available Techniques in the Smitheries and Foundries Industry, European Commission IPPC Bureau, Sevilla, Spain. Available at: http://eippcb.jrc.es/pages/FActivities.htm EIPPCB (2006), Reference Document on Best Available Techniques for Large Combustion Plants, European Commission IPPC Bureau, Sevilla, Spain. Available at: http://eippcb.jrc.es/pages/FActivities.htm EMCC - European Monitoring Centre on Change (2004a), Sector Futures - Textiles and leather in Europe: the end of an era or a new beginning?, European Foundation for the Improvement of Living and Working Conditions, Dublin, 2004 Available at: http://www.eurofound.europa.eu/emcc/publications/2004/sf_lt_1.pdf Elzenga, H. & Ros, J. (2004), MEI-Energie: RIVM’s energiebesparingsmodel, the Netherlands EMCC - European Monitoring Centre on Change (2004b), Knitting the future of the textiles and leather sector: Four scenarios, European Foundation for the Improvement of Living and Working Conditions, Dublin, Ireland. Available at: http://www.eurofound.europa.eu/emcc/publications/2004/ef0466en.pdf EMCC - European Monitoring Centre on Change (2004c), Trends and drivers of change in the EU textiles and leather sector: Mapping report, European Foundation for the Improvement of Living and Working Conditions, Dublin, Ireland. Available at: http://www.eurofound.europa.eu/emcc/publications/2004/ef0485en.pdf

Bibliogaphy
Sectoral Costs of Environmental Policy 179
Enviro Tex GmbH (2005), Private Institute for Product Safety and Environment, Cast Consulting (2005), Analysis of the Potential Impacts of Reach on European Textile Supply Chains, 16 December 2005, pp. 132 Available at: http://ec.europa.eu/enterprise/reach/docs/reach/text_final_report_051216.pdf Ernst & Young Environment and Sustainability Services (2006), Eco-industry, its size, employment, perspectives and barriers to growth in an enlarged EU, European Commission DG Environment, Brussels Available at:http://www.ec.europa.eu/environment/enveco/industry_employment/ecoindustry2006.pdf EUklems Database March 2007 (2007), EU KLEMS Growth and productivity accounts. Available at: http://www.euklems.net Euratex (2006), Strategic Research Agenda of the European Technology Platform for the future of textiles and clothing, Euratex, Brussels. Available at: http://www.textile-platform.org/documents/Key%20Documents/SRA/TextileETP_SRA_final.pdf EURELECTRIC (2007), A competitive internal energy market: full liberalisation of the EU electricity and gas market, Brussels. Available at: http://public.eurelectric.org/Content/Default.asp?PageID=504 Eurofer (2006), European Confederation of Iron and Steel Industries. Annual report 2005, Brussels European Commission (2001a), Commission Staff Working Paper – Report on the promotion of competitiveness and employment in the European leather and tanning industry, EC, Brussels, 16.10.2001, pp. 61 Available at: http://ec.europa.eu/enterprise/leather/documents/sec2001_1644en.pdf ) European Commission (2001b), Green Paper – Towards a European strategy for the security of energy supply: Technical Document. European Commission, Office for Official Publications of the European Communities, Luxemburg. Available at: http://ec.europa.eu/comm/energy_transport/doc-technique/doctechlv-en.pdf European Commission (2003a), Commission Staff Working Paper – Economic and Competitiveness analysis of the European textile and Clothing Sector in support of the Communication “The future of the textiles and clothing sector in the enlarged Europe”, EC, Brussels, 21.11.2003, pp. 55 Available at: http://ec.europa.eu/enterprise/textile/documents/sec2003_1345en.pdf European Commission (2003b), Commission Staff Working Paper – “Regulation of the European Parliament and of the Council concerning the Registration, Evaluation, Authorisation and Restrictions of Chemicals (REACH), establishing a European Chemicals Agency an emending Directive 1999/45/EC and Regulation (EC) on Persistent Organic Pollutants – Extended Impact Assessment, EC, Brussels, 29/10/2006, pp. 33 Available at: http://ec.europa.eu/enterprise/reach/docs/reach/eia-sec-2003_1171.pdf European Commission (2004a), EPER Review Report 2001, Brussels 2004 Available at: http://www.eper.cec.eu.int/eper/documents/EPER%20Review%20report,%20final.pdf

Bibliogaphy
Sectoral Costs of Environmental Policy 180
European Commission (2004b), Summary Conclusions –“The European leather and tanning industry and sustainable development”, European Commission DG Enterprise, 27 May 2004, Albert Borschette Conference Centre, Brussels, pp. 2 Available at: http://ec.europa.eu/enterprise/leather/documents/conf_2004_conclusion_en.pdf ) European Commission (2004c), Towards a competitive and regulated European electricity and gas market: Opening of the Internal Energy Market: progress so far, European Commission, DG Trade, Brussels. Available at: http://ec.europa.eu/energy/gas/publications/doc/2004_07_09_memo_en.pdf European Commission (2006a), Analysis of economic indicators of the EU metals industry: the impact of raw materials and energy supply on competitiveness, European Commission DG Enterprise, SEC (2006) 1069, 2.8.2006, Brussels. Available at http://ec.europa.eu/enterprise/steel/index_en.htm on 17/01/2007 European Commission (2006b), An EU Strategy for Biofuels. Communication from the Commission, COM 2006, 34 final, Brussels 8.02.2006, Commission of the European Communities. Available at: http://ec.europa.eu/agriculture/biomass/biofuel/com2006_34_en.pdf European Commission (2006c), Energy, Transport and Environment Indicators. Pocketbook: Data 1990-2004, 2006 Edition. Office for Official Publications of the European Communities, Luxemburg. Available at: http://epp.eurostat.ec.europa.eu/cache/ITY_OFFPUB/KS-DK-05-001/EN/KS-DK-05-001-EN.PDF European Commission (2006d), European Energy and Transport. Trends to 2030 – update 2005, Office for Official Publications of the European Communities, Brussels. Available at: http://ec.europa.eu/dgs/energy_transport/figures/trends_2030_update_2005/energy_transport_trends_2030_update_2005_en.pdf European Commission (2006e), EU ETS Review. Report on International Competitiveness, McKinsey & Company and Ecofys, European Commission DG Environment, Brussels. Available at: http://ec.europa.eu/environment/climat/emission/pdf/etsreview/061222compreport.pdf European Commission (2006f) European Steel Technology Platform: From a strategic research agenda to implementation. A vision for the future of the steel sector. Short version, European Commission Community research 60p, Brussels. European Commission (2006g), European Steel Technology Platform: From a strategic research agenda to implementation. A vision for the future of the steel sector. Full version, European Commission Community research, 120p, Brussels. Available at: ftp://ftp.cordis.lu/pub/estep/docs/sra_en.pdf European Commission (2006h), Gas and electricity market statistics: Data 1990 – 2006, Office for Official Publications of the European Communities, Luxemburg. Available at: http://epp.eurostat.ec.europa.eu/cache/ITY_OFFPUB/KS-71-05-392/EN/KS-71-05-392-EN.PDF European Commission (2006i), Public Consultation “The competitiveness of the european metals industry: the impact of raw materials and energy supply”, European Commission DG Enterprise, Brussels. Available at http://ec.europa.eu/enterprise/steel/index_en.htm on 17/01/2007

Bibliogaphy
Sectoral Costs of Environmental Policy 181
European Commission (2006j), Slovenia’s report in accordance with Article 16(1) and (3) of council Directive of 24 September 1996 concerning integrated pollution prevention and control answers to the commission’s questionnaire of 26 March 2003, European Commission DG Environment, Brussels. Available at: http://eea.eionet.europa.eu/Public/irc/eionet-circle/reporting/library?l=/ippc/implementation_2003-2005&vm=compact&sb=Title European Commission (2006k), Streamlining and Simplification of Environment related Regulatory Requirements for Companies, DG Enterprise and Industry, Final report for the BEST Project Expert Group, Brussels. Available at: http://ec.europa.eu/enterprise/environment/index_home/best_project/best_2006_simplification_final_report.pdf European Commission (2007a), EPER Review report 2004, Brussels. Available at: http://www.eper.cec.eu.int/eper/documents/Executive%20Summary_EPER_Review_2004_version16May2007.pdf European Commission (2007b), Communication from the Commission to the Council, the European Parliament, the European Economic and Social Committee and the Committee of the Regions; Action Programme for Reducing Administrative Burdens in the European Union, EC, Brussels, January 24th 2007. Available at: http://ec.europa.eu/enterprise/regulation/better_regulation/docs/com_2007_23_en.pdf European Environment Agency (2005), The European environment. State and outlook 2005, EEA, Copenhagen, Denmark. Available at: http://reports.eea.europa.eu/state_of_environment_report_2005_1/en Eurostat databases, available at: http://epp.eurostat.ec.europa.eu Eurostat (1994a), SERIEE: European System for the collection of economic data on the environment, 1994 version, Eurostat statistical document, Luxemburg Eurostat (1994b), Environmental Protection Expenditure: Data Collection Methods in Industry. Industry Report, by Jochem Jantzen, The Hague/Luxemburg Eurostat (2005a), Environmental expenditure statistics: industry data collection handbook, Eurostat, Luxemburg. Available at: http://circa.europa.eu/Public/irc/dsis/pip/library?l=/environmental_expenditur/environmental_expenditur/handbooks_manuals/ks-ec-05-002-en-npdf/_EN_1.0_&a=d Eurostat (2005b), OECD/ Eurostat Environmental Protection Expenditure and Revenue Joint Questionnaire/ SERIEE Environmental Protection Expenditure Account Conversion Guidelines, Eurostat, Luxemburg. Available at: http://epp.eurostat.ec.europa.eu/pls/portal/docs/PAGE/PGP_DS_ENVACC/PGE_DS_ENVACC/TAB63667842/5.PDF Eurostat (2005c), Statistics in focus: Environmental protection expenditure by industry in the European Union, Eurostat, Luxemburg. Available at: http://epp.eurostat.ec.europa.eu/cache/ITY_OFFPUB/KS-NQ-05-009/EN/KS-NQ-05-009-EN.PDF Eurostat (2006a), European business - Facts and figures, 2006 edition. Available at: http://epp.eurostat.cec.eu.int/

Bibliogaphy
Sectoral Costs of Environmental Policy 182
Eurostat (2006b), NACE 40.10 Production and distribution of electricity, Metadata: Statistical Classification of Economic Activities in the European Community, Rev. 1.1 (2002)—NACE Rev 1.1. Available online at http://ec.europa.eu/eurostat/ramon/nomenclatures/index.cfm Eurostat (2006c), Statistics in Focus, Environment and Energy, 6/2006 “European electricity market indicators of the liberalisation process 2004-2005”. Available at: http://epp.eurostat.cec.eu.int/cache/ITY_OFFPUB/KS-NQ-06-006/EN/KS-NQ-06-006-EN.PDF Eurostat (2007a), Environment, Environmental accounts, Environmental protection expenditure (by environmental domains, NACE Rev.1 C to E, from 2001 onwards), Luxembourg. Available at: http://epp.eurostat.ec.europa.eu/portal/ Eurostat (2007b), Structural Business Statistics: Annual detailed enterprise statistics on electricity, gas and water (part of Annex 2) - (NACE : E). Available at http://epp.eurostat.ec.europa.eu/portal/page?_pageid=2293,59872848,2293_61474748&_dad=portal&_schema=PORTAL#OPEN
Eurostat (2007c), Structural Business Statistics - Eurostat Metadata in SDDS format: Base Page, update April 30, 2007.
Available at: http://epp.eurostat.ec.europa.eu/portal/page?_pageid=0,1136195,0_45572097&_dad=portal&_schema=PORTAL
EuroStrategy Consultants, 2005. Global steel industry outlook to 2014. Available at http://ec.europa.eu/enterprise/steel/index_en.htm Fairbrother, P., et al. (2005), Equal opportunities and diversity. Changing employment patterns in the European electricity industry, A Report for EPSU, EMCEF and EURELECTRIC. Volume One – Main Report, January 2005. GPE – Cardiff School of Social Sciences/Global Political Economy, Cardiff University, UK FAO (1998), Trade in hides and skins and environment, Food and Agriculture Organization of the United Nations, Committee on Commodity Problems, Cape Town, South Africa, 9-11 November 1998. Available at: http://www.fao.org/unfao/bodies/ccp/hs/98/w9790e.htm FAO (2001), Trade, sanitary and environmental policy linkages in the hides, skins and leather processing sector, Food and Agriculture Organization of the United Nations , Committee on Commodity Problems, Rome 4-6 June 2001. Available at: http://www.fao.org/DOCREP/MEETING/003/Y0018E.HTM FAO (2003), Linkages between trade and environmental policies in the hides and skins and leather sector, Food and Agriculture Organization of the United Nations, Committee on commodity problems Rome, 18-19 December 2003 pp.10. Available at: http://www.fao.org/DOCREP/MEETING/007/J0732E.HTM FAO (2005), World statistical compendium for raw hides and skins, leather and leather footwear 1986-2004, Food and Agriculture Organization of the United Nations – Commodities and Trade Division, Rome, 2005. Available at: ftp://ftp.fao.org/docrep/fao/006/y5068T/y5068T00.pdf

Bibliogaphy
Sectoral Costs of Environmental Policy 183
Favazzi, A. (2002), Study of the impact of the main policies and environment protections measures in Africa’s leather industry; UNIDO Available at: http://www.unido.org/file-storage/download/?file_id=10203 Fritsch, Walter, Senior Vice President, OMV, e-mail conversation, August 6 – 16, 2007 Frondel, M., Horbach, J. and K. Rennings (2004a), End-of-Pipe or Cleaner Production? An Empirical Comparison of Environmental Innovation Decisions Across OECD Countries, ZEW Discussion Paper 04-82 Available at: http://www.zew.de/en/publikationen/publikationen.php3 Frondel, M, Horbach, J. and K. Rennings (2004b), What Triggers Environmental Management and Innovation? Empirical Evidence for Germany, RWI Discussion paper No. 15, RWI Essen, Germany. Available at: http://www.rwi-essen.de/ Galanis (2005), Les infrastructures de transport de pétrole et de raffinage, Presentation given at the 2005 Berlin Fossil Fuel Forum, Berlin, 19 October 2005 Gouldson, A. and J. Murphy (1998), Regulatory Realities – The Implementation and Impact of Industrial Environmental Regulation, Earthscan Publications, London, UK Grzesiak, M. and W. Domańska (edit.) (2006), Ochrona Środowiska 2006, Environment 2006, Warsaw, Poland. Available at: http://www.stat.gov.pl/cps/rde/xbcr/gus/PUBL_ochrona_srodowiska_2006.pdf Hall, D. (2003), Privatisation, corruption, oligopoly, Public Services International Research Unit, University of Greenwich, UK. Available at: http://www.epoc.uni-bremen.de/publications/pup2003/files/Berlin_Hall_Privatisation.PDF Harrington, W., Morgenstern, R. and Sterner, T. (Eds.) (2004). Choosing Environmental Policy. Comparing Instruments and Outcomes in the United States and Europe. Resources for the Future, Washington DC, US, pp. 206-221. Henriques, I. and P. Sadorsky (2007), Environmental Management Systems and Practices: An International Perspective, in: Johnstone N. (Ed.) Environmental Policy and Corporate Behaviour, Edward Elgar Publishing Hildegunn Kyvik Nordås (2004), Discussion Paper No 5 – The Global Textile and Clothing Industry post the Agreement on Textiles and Clothing, World Trade Organization, Geneva, Switzerland. Available at: http://www.wto.org/english/res_e/booksp_e/discussion_papers5_e.pdf Hitchens, D., Birnie, E., Thompson, W., Triebswetter, U., Bertossi. P. and L. Messori (2000), Environmental Regulation and Competitive Advantage, Edward Elgar Publishing IEA (2004), World Energy Outlook 2004, International Energy Agency, Paris Ifo Institute for Economic Research i.c.w. Carl Bro Group (2006), Assessment of different approaches to implementation of the IPPC Directive and their impacts on competitiveness. Study commissioned by the European Commission, DG Environment, Brussels. Available at: http://ec.europa.eu/environment/ippc/pdf/ippc_competitiveness.pdf

Bibliogaphy
Sectoral Costs of Environmental Policy 184
IHOBE (2007c), Voluntary Agreements – Voluntary Environmental Agreements between industries and Basque Government, IHOBE, Bilbao, Spain. Available at: http://www.ihobe.net/Pags/Ingles/Empresa/Servicios/Acuerdos/Index.asp?cod=7169B532-D9A6-4AC9-BB11-1E94762B3C93 IISI (2005), Steel: The foundation of a sustainable future - Sustainability report of the world steel industry 2005, International Iron and Steel Institute. Available at: http://www.worldsteel.org/pictures/publicationfiles/SR2005.pdf IISI (2006), World steel in figures 2006, International Iron and Steel Institute. Available at: http://www.worldsteel.org/pictures/newsfiles/WSIF06.pdf Institute for Environmental Studies (2006), Innovation dynamics induced by environmental policy, IVM Report E-07/05, the Netherlands INE (2006), Encuesta del gasto de las empresas en proteccion ambiental 2004, Boletin Mensual Estadistica (BME), Madrid, Spain Jaffe, A., Peterson, S. Portney, P. and R. Stavins (1995), Environmental Regulation and Competitiveness of US Manufacturing: what does the Evidence tell us ?, Journal of Economic Literature, 33, 132-163, 1995 Jaffe, A.B., Newell, R.G. & Stavins, R.N. (2002), Environmental Policy and Technological Change, Environmental and Resource Economics 22, 41-69. Jamasb, T. and M. Pollit (2005), Electricity Market Reform in the European Union: Review of Progress toward Liberalization & Integration, Centre for Energy and Environmental Policy Research. Available at: http://web.mit.edu/ceepr/www/2005-003.pdf Jantzen, J.et al (1995), Technische vooruitgang en milieukosten, aanzet tot methodiekontwikkeling (Technological progress and environmental costs, initiative for methodological development), TME, The Hague, the Netherlands Jenkins, R. , Barton, J., Bartzokas, A., Hesselberg, J. and H. Knutsen (2002), Environmental Regulation in the New Global Economy – The Impact on Industry and Competitiveness, Edward Elgar Publishing Jones, G., Pye, S., Boyd, R., Bogaert, S. and P. Watkiss (2007), Impact of Ambitious International Emission Reduction Goals on the Level Playing Field and Competitiveness of Enterprises, LNE, Brussels Johnstone, N. (2005). The Innovation Effects of Environmental Policy Instruments. In Horbach (Ed.). p. 21-41 Johnstone, N. (ed.) (2007), Environmental Policy and Corporate Behaviour, OECD, Edward Elgar Publishing Joshi S, Krishnan R., and L. Lave (2002), Estimating the hidden costs of environmental regulation, Centre for Economic Studies, Washington, May 2002 pp. 46. Available at: http://www.ces.census.gov/index.php/ces/1.00/cespapers?down_key=101644 Kemp, R. (2000), Technology and Environmental Policy: Innovation Effects of Past Policies and Suggestions for Improvement, In: OECD, Innovation and the Environment, Paris, p. 35-61

Bibliogaphy
Sectoral Costs of Environmental Policy 185
Kraus, H.H., (1998), Environment policy in Slovenia – Briefing No.6, European Commission DG Research Division for the environment, energy and research, STOA. List, J., McHone, W. and D. Millimet (2004), Effects of environmental regulation on foreign and domestic plant births: is there a home field advantage?, Journal of Urban Economics, Volume 56, Issue 2, p. 303-326 Livar d.d. (2007), Company website: Available at http://193.95.248.21/internet_ang/index.php?vsebina=046 Maasoumi, E., Prowse, S. and Slottje, D., 2002. Measuring market power in the steel industry. Mariën, K., Duerinck, J. and H. Van Rompaey (2003), Evaluatie van het reductiepotentieel voor diverse polluentemissies naar het compartiment lucht voor de ijzer- en staalindustrie in Vlaanderen, LNE, Brussels Mirko I., and R. Knez (1996), Country Reports: Slovenia, Approximation of European Union Environmental Legislation, Regional Environmental Center for Central and Eastern Europe (REC), Budapest, Hungary. Available at: http://www.rec.org/REC/Publications/EUlaw/FeeBased/EULawReport.pdf Nederlandse Emissie Authoriteit, Personal communication, November 7, 2007 OECD (1993), Environmental Policies and Industrial Competitiveness, Organization for Economic Co-operation and Development, Paris OECD (1997a), Environmental Policies and Employment, Organization for Economic Co-Operation and Development, Paris OECD (1997b), Oslo Manual: Proposed Guidelines for collecting and Interpreting Technological Innovation, Organization for Economic Co-Operation and Development, Paris. Available at: http://www.oecd.org/dataoecd/35/61/2367580.pdf OECD (2003a), Pollution Abatement and Control Expenditure in OECD Countries, OECD, Environment Policy Committee, Working Group on Environmental Information and Outlooks, July 17th 2003 Available at: http://www.oecd.org/dataoecd/41/57/4704311.pdf OECD (2003b), Analysis of Non-Tariff Measures: The Case of Export Duties, Working Party of the Trade Committee, TD/TC/WP(2002)54/Final. Available at: http://www.olis.oecd.org/olis/2002doc.nsf/43bb6130e5e86e5fc12569fa005d004c/233f10f9868ee7f3c1256cbf00361ac7/$FILE/JT00138512.PDF OECD (2005), Environmental Policy and Corporate Behaviour: Background Report and Overview of the Data, Conference on public environmental policy and the private company, Washington D.C., 14-15 June 2005, pp. 53 OECD (2006), Environmental Regulation and Competition, OECD, Directorate for Financial and Enterprise Affairs, Competition Committee, November 17th 2006 Available at: http://www.oecd.org/dataoecd/39/15/37981581.pdf OECD (2007), Instrument mixes for environmental policy, Organization for Economic Co-Operation and Development, OECD Publishing

Bibliogaphy
Sectoral Costs of Environmental Policy 186
Oosterhuis F, (ed.) (2006), Ex-post estimates of costs to business of EU environmental legislation, Final report), European Commission Available at: http://www.ecologic.de/download/projekte/1750-1799/1750/1750-01_final_report.pdf Oosterhuis, F. (2007), Cost decreases in environmental technology, Evidence from four case studies, Amsterdam, The Netherlands Available at: http://www.ivm.falw.vu.nl/images_upload/980AF8D1-9F1B-77FF-FEE06B6AEA80DFB4.pdf Palmer, K., Burtraw, D., and J. Shih (2007), The benefits and costs of reducing emissions from the electricity sector, Journal of Environmental Management, 83, 115-130 Porter, M. E. , 1979. How competitive forces shape strategy. Originally published in the Harvard Business Review (March-April, 1979). Reprinted with deletions by permission of the Harvard Business Review Porter, M.E. (1990), The competitive Advantage of Nations, Free Press, New York Porter, M.E., and C. van der Linde (1995), Towards a new conception of the environment-competitiveness relationship, Journal of Economic Perspectives, 9(4), 97-118 Radonjic, G. and P. Tominc (2007), The role of environmental management system on introduction of new technologies in the metal and chemical/paper/plastics industries, Journal of cleaner production 15:1482-1493 Reinaud, J., 2005. Industrial competitiveness under the European emission trading scheme. IEA Information paper, International Energy Agency, Paris. In Ifo Institute (2006) Requate, T. (2005), Dynamic incentives by environmental policy instruments – a survey, Ecological Economics, 54(2-3), 75-195 Reuters (2007), Reuters Industry Profiles. Available at: http://www.reuters.com/business/industries Roediger-Schluga T. (2004), The Porter Hypothesis and the Economic Consequences of Environmental Regulation, Edward Elgar Publishing Smale et al. (2006), The impact of CO2 emissions trading on firm profits and market prices, Climate Policy 6 (2006) 29-46 Available at: http://www.climatestrategies.org/uploads/smale.pdf Spatareanu, M. (2007), Searching for pollution heavens, The Journal of Environment & Development, Vol. 16, No. 2, 161-182 Statistical office of the Republic of Slovenia (2007a), Gross investments and current expenditure for environment protection and revenues for the environmental protection activities, Slovenia, 2005, Statistical office of the Republic of Slovenia Available at: http://www.stat.si/eng/novica_prikazi.aspx?ID=1022 Statistical office of the Republic of Slovenia (2007b), Gross Fixed Capital Formation and Current Expenditure for Environmental Protection and Revenues from the Environmental Protection Related Activities – Gross fixed capital formation in industry (mio SIT), Slovenia, annual., Statistical office of the Republic of Slovenia

Bibliogaphy
Sectoral Costs of Environmental Policy 187
Available at: http://www.stat.si/pxweb/Database/Environment/27_environment/06_protection/27118_environm_protection/27118_environm_protection.asp Statistik Austria (2007), Umweltschutzaufwendungen im Produzierenden Bereich 2004, Projektbericht, Alexandra Aichinger, Eva Milota, Statistik Austria, Direktion Raumwirtschaft, Austria Available at: http://www.statistik.at/web_de/static/projektbericht_umweltschutzaufwendungen_im_produzierenden_bereich_2004_023478.pdf Statistisches Bundesamt (2006), Umweltökonomische Gesamtrechnungen, Ausgaben für Umweltschutz, Fachserie 19 Reihe 6, Wiesbaden, Germany Statistical Office of Estonia (2006), Environment Protection Expenditures 2004, compiled by Kersti Salu, edited by Maie Koorep, Talinn, Estonia Available at: http://www.stat.ee/files/evaljaanded/2006/KK000403.pdf Statistics Sweden (2007), Environmental protection expenditure statistics, extraction 2007-07-17. Available at: http://www.scb.se/ Steel Business Briefing (2005), Developments in world steel “Markets and industrial change”. Available at: http://www.steelbb.com/ Stengg W. (2001), The textile and clothing industry in the EU – A survey, Enterprise Papers No 2 -2001, European Communities, June 2001 pp.58 Available at: http://ec.europa.eu/enterprise/library/enterprise-papers/pdf/enterprise_paper_02_2001.pdf SQW (2006), Exploring the relationship between environmental regulation and competitiveness – Literature Review (Final Report to the Department for Environment Food and Rural Affairs), London, UK. Available at: http://www.sqw.co.uk/file_download/7 TME (2007), Environmental Cost model for the Netherlands, Outcomes of the model for the year 2007, Nootdorp, the Netherlands UBS (2005), Hatch Beddows in Steel Business Briefing Available at: http://www.steelbb.com/ UNIC (2003), Environmental Report 2003, Unione Nazionale Industria Conciaria (Italian National Tanning Industry Union), 2003 Available at: http://www.euroleather.com/doc/UNIC_environmental_report.pdf USCENSUSBUREAU (2002), Pollution Abatement Costs and Expenditures: 1999, Current Industrial Reports, MA200(99), U.S. Government Printing Office, Washington, United States of America Available at: http://www.census.gov/prod/2002pubs/ma200-99.pdf US Department of Energy (DoE) (2007), International Energy Annual 2003 (May-July 2005), published by EIA Energy Information Administration (EIA). Available at: http://www.eia.doe.gov/iea Vattenfall (2005), Vattenfall Annual Report 2005. The energy market / The competition. Available at: http://www3.vattenfall.com/annual_report_2005/filter.asp?filename=page_012.html

Bibliogaphy
Sectoral Costs of Environmental Policy 188
Vollebergh, H. (2007), Impacts of environmental policy instruments on technological change, Joint Meetings of Tax and Environment Experts, OECD, Paris, France. Available at: http://www.olis.oecd.org/olis/2006doc.nsf/43bb6130e5e86e5fc12569fa005d004c/eda1894b7dadcb17c125727b005e5ffb/$FILE/JT03221359.PDF Vortmeyer, Nicolas, CTO Siemens Power Generation, private conversation, July 30, 2007 VROM (2001), Cost effectiveness of environmental measures, InfoMil, The Hague, The Netherlands VROM (2006), Voorevaluatie NOx emissiehandel, Van der kolk Advies, The Hague, The Netherlands. Available at: http://www.vrom.nl/pagina.html?id=2706&sp=2&dn=7410 Wagner M. (2003), The Porter Hypothesis Revisited: A Literature Review of Theoretical Models and Empirical Tests, Centre for Sustainability Management, December 2003, Lüneburg, Germany. Available at: http://129.3.20.41/eps/pe/papers/0407/0407014.pdf WIIW (2001), Competitiveness of Industry in Candidate Countries – Leather and Footwear sector (in the framework of contract PSE/99/502333), The Vienna Institute for International Economic Studies (WIIW), Vienna, Austria. Available at: http://ec.europa.eu/enterprise/footwear/documents/leather_footwear_candidate.pdf Zittel, W. and J. Schindler (2004), The Countdown for the Peak of Oil Production has Begun - but what are the Views of the Most Important International Energy Agencies, Energy Bulletin, 12 October 2004. Available at: http://www.energybulletin.net/2544.html