economic evaluation of sectoral emission reduction...
TRANSCRIPT

Economic Evaluation of SectoralEmission Reduction Objectives for
Climate Change
Top-down Analysis of Greenhouse GasEmission Reduction Possibilities
in the EU
Final ReportMarch 2001
Prof. P. Capros, N. Kouvaritakis and Dr. L. MantzosNational Technical University of Athens
Iroon Polytechniou 9, Athens 157 73, GreecePhone 00-30-1-7723641, 29
Fax 00-30-1-7723630e-mail: [email protected]
Contact: Chris [email protected]
http://europa.eu.int/comm/environment/enveco
http://europa.eu.int/comm/environment/enveco/climate_change/sectoral_objectives.htm
Contribution to a Study for DG Environment, European Commission byEcofys Energy and Environment, AEA Technology Environment and
National Technical University of Athens
Table of Contents
PREFACE.................................................................................................................................................................................I
EXECUTIVE SUMMARY.................................................................................................................................................II
1. INTRODUCTION........................................................................................................................................................1
2. INTERACTION BETWEEN DEMAND AND POWER GENERATION ...................................................4
3. REDUCTION OF CO2 FROM INDUSTRY.........................................................................................................6
3.1. IRON AND STEEL SECTOR.......................................................................................................................................6
3.1.1. Is the current PRIMES baseline still valid in relation to short run trends? .......................................6
3.1.2. What is the basic mechanism reflected in the PRIMES baseline scenario towards 2010?..............6
3.1.3. Sector adjustment under Kyoto according to PRIMES ..........................................................................7
3.2. ALUMINIUM AND OTHER NON-FERROUS METALS PRODUCTION.....................................................................10
3.2.1. Is the current PRIMES baseline still valid in relation to short run trends? .................................... 11
3.2.2. Basic assumptions reflected in the PRIMES baseline scenario towards 2010? ............................. 11
3.2.3. Sector adjustment under the Kyoto commitment .................................................................................. 12
3.3. CEMENT AND OTHER NON-METALLIC MINERALS.............................................................................................14
3.3.1. Is the current PRIMES baseline still valid in relation to short run trends? .................................... 14
3.3.2. Basic assumptions reflected in the PRIMES baseline scenario to 2010 .......................................... 15
3.3.3. Adjustment of the sector under the Kyoto target .................................................................................. 16
3.4. CHEMICAL SECTOR...............................................................................................................................................18
3.4.1. Short run trends.......................................................................................................................................... 18
3.4.2. Basic assumptions in the PRIMES baseline scenario towards 2010................................................ 19
3.4.3. Adjustment of the sector under the Kyoto target .................................................................................. 19
3.5. PAPER AND PULP PRODUCTION...........................................................................................................................21
3.5.1. Is the current PRIMES baseline still valid in relation to short run trends? .................................... 21
3.5.2. Basic assumptions driving the PRIMES baseline scenario towards 2010....................................... 22
3.5.3. How does the sector adjust to meet the Kyoto target in the PRIMES analysis?............................. 22
3.6. OTHER INDUSTRIAL SECTORS..............................................................................................................................23
3.6.1. Is the current PRIMES baseline still valid in relation to short run trends? .................................... 24
3.6.2. Basic assumptions in the PRIMES baseline scenario towards 2010................................................ 24
3.6.3. How does the sector adjust to meet the Kyoto target in the PRIMES analysis?............................. 24
3.7. CONCLUSIONS........................................................................................................................................................26
4. REDUCTION OF CO2 FROM PRIVATE AND PUBLIC SERVICES, HOUSEHOLDS ANDAGRICULTURE................................................................................................................................................................. 28
4.1. TERTIARY SECTOR (PRIVATE AND PUBLIC SERVICES, AGRICULTURE).........................................................28
4.1.1. Is the current PRIMES baseline still valid in relation to short run trends? .................................... 28
4.1.2. Basic assumptions in the baseline scenario .......................................................................................... 29
ii
4.1.3. How does the sector adjust to meet the Kyoto target in the PRIMES analysis?............................. 31
4.2. HOUSEHOLDS.........................................................................................................................................................33
4.2.1. Is the current PRIMES baseline still valid in relation to short run trends? .................................... 33
4.2.2. Basic assumptions reflected in the PRIMES baseline scenario towards 2010 ............................... 34
4.2.3. How does the sector adjust to meet the Kyoto target in the PRIMES analysis?............................. 35
5. TRANSPORT SECTOR .......................................................................................................................................... 39
5.1. OVERVIEW AND RECENT TRENDS.......................................................................................................................39
5.2. SECTOR EVOLUTION IN THE BASELINE PROJECTION ........................................................................................41
5.2.1. The effect of including the ACEA agreement in the baseline............................................................. 43
5.2.2. Impact of most recent update (November 2000) .................................................................................. 44
5.3. SECTOR ADJUSTMENT FOR DIFFERENT EMISSION REDUCTION TARGETS....................................................44
6. CO2 REDUCTION FROM ELECTRICITY AND STEAM GENERATION.......................................... 49
6.1. RENEWABLE ENERGY FORMS IN ELECTRICITY AND STEAM GENERATION....................................................50
6.1.1. Is the current PRIMES baseline still valid in relation to short-run trends?.................................... 50
6.1.2. What is the basic mechanism reflected in the PRIMES baseline scenario towards 2010?........... 52
6.1.3. How does the sector adjust when the system meets the Kyoto target for 2010?............................. 53
6.2. NUCLEAR ENERGY IN ELECTRICITY AND STEAM GENERATION......................................................................57
6.2.1. Is the current PRIMES baseline still valid in relation to short-run trends?.................................... 57
6.2.2. What is the basic mechanism reflected in the PRIMES baseline scenario towards 2010?........... 58
6.2.3. How does the sector adjust when the system meets the Kyoto target for 2010?............................. 59
6.3. CHANGES IN THE FUEL MIX AND COGENERATION ...........................................................................................59
6.3.1. Sector coverage in PRIMES..................................................................................................................... 59
6.3.2. Foundations of the baseline scenario..................................................................................................... 60
6.3.3. Is the current PRIMES baseline still valid?.......................................................................................... 61
6.3.4. How does the sector adjust when the system meets the Kyoto target for 2010?............................. 65
6.4. CONCLUSION .........................................................................................................................................................69
7. ALLOCATION OF EFFORT AMONG SECTORS AND EMISSIONS ................................................... 70
7.1. INTRODUCTION .....................................................................................................................................................70
7.2. METHODOLOGY ....................................................................................................................................................70
7.3. RESULTS OF THE META-MODEL ..........................................................................................................................71
7.4. IMPACTS ON POWER GENERATION SECTOR .......................................................................................................77
APPENDIX I........................................................................................................................................................................ 81
THE PRIMES ENERGY SYSTEM MODEL........................................................................................................................81
History ........................................................................................................................................................................... 81
Scope and Objectives .................................................................................................................................................. 81
Features of Sub Models .............................................................................................................................................. 82
Technology.................................................................................................................................................................... 83
Environment ................................................................................................................................................................. 83
iii
Policy Instruments....................................................................................................................................................... 84
The PRIMES Model Application for the European Union................................................................................... 85
The Power and Steam Generation Sub Model of PRIMES................................................................................... 87
General Structure of the Demand Side Sub Models .............................................................................................. 89
APPENDIX II....................................................................................................................................................................... 90
TRANSFORMATION OF EUROSTAT ENERGY BALANCE SHEETS INTO PRIMES DATA...........................................90
APPENDIX III..................................................................................................................................................................... 92
CORRESPONDENCE BETWEEN NACE CODING AND EUROSTAT ENERGY BALANCE SHEETS...............................92
APPENDIX IV..................................................................................................................................................................... 95
LIST OF PARTICIPANTS IN EXPERT WORKSHOPS.............................................................................................................95
APPENDIX V....................................................................................................................................................................... 99
LIST OF REPORTS................................................................................................................................................................99
APPENDIX VI...................................................................................................................................................................101
SECTORAL ANALYSIS OF IMPACTS OF ALTERNATIVE EMISSION REDUCTION OBJECTIVES IN THE EU ENERGYSYSTEM ..............................................................................................................................................................................101
APPENDIX VII.................................................................................................................................................................102
META-MODEL ANALYSIS RESULTS FOR THE EU ..........................................................................................................102
PrefaceThis report is a contribution to the study “Economic Evaluation of Sectoral EmissionReduction Objectives for Climate Change” launched by the Environment DG of theEuropean Commission in 1999. The analysis presented in this report is based on theenergy system model PRIMES, developed and maintained at NTUA (seewww.e3mlab.ntua.gr). However, the analysis has been complemented by the results ofthe analysis of non-CO2 greenhouse gases carried out by AEA Technology and Ecofys.Earlier versions of this report were presented in three workshops organised by DGEnvironment in November 1999 and March 2000, as well as subsequent commentsreceived bilaterally. The lists of participants of the workshops are given in Appendix IV.Efforts have been made to include the comments of workshop participants and someadditional reviewers. As sometimes it has not been able to resolve the divergences ofopinion, such issues are flagged in footnotes.
The contents, conclusions and recommendations of this study are made by the projectteam and do not necessarily reflect the views of the European Commission, or the expertsthat gave their comments to draft versions of the study.
ii
Executive summaryAs part of the “Economic Evaluation of Sectoral Emission Reduction Objectives forClimate Change” study, launched by the Environment DG, the PRIMES model has beenused to provide insight on the contribution of energy producers and users to reduce CO2
emissions in the EU. The results obtained from PRIMES model show the reductionpotential of each sector under a system-wide analysis.
The PRIMES model includes all energy related CO2 emissions and allocates them eitherto the energy production or consumption side. PRIMES model allocates emissions fromelectricity steam and district heat production to the supply side.1 Thus, the emissions ofthe use of electricity, industrial heat or district heating are all allocated to the energysupply sector in the PRIMES model. Emissions in the energy user side include thecombustion of fossil fuels. Thus, the use of natural gas to heat a home or gasoline todrive a car is allocated to households and transport sectors respectively. 2
The PRIMES model baseline (i.e. “business-as-usual”) emission until 2010 were agreedupon in the “Shared Analysis” project, which was concluded under the auspices of theDG Transport and Energy in 1999. The Shared Analysis baseline included the policiesand measures that were in place at the end of 1997. However, the effect of theenvironmental agreement with between European, Japanese and Korean carmanufacturers (the “ACEA Agreement”) to reduce fuel consumption of cars to 140grams CO2 per km has been included in the baseline.
The results obtained from PRIMES model have been combined to the results obtainedfrom the bottom up analysis performed by ECOFYS and AEA Technology3. The purposewas to define the least-cost optimum to reduce greenhouse gas emissions in each sectorin the EU. Table i summarises these results assuming that the EU Member States achievethe –8% reduction target jointly.
The role of non-CO2 greenhouse gases emissions in achieving the Kyoto target issignificant. Under baseline conditions the emissions of non-CO2 gases are projected tochange by -6.8% from 1990 levels. CO2 emissions, on the other hand increase at thesame period by 4.1% (or 6.7% without the ACEA Agreement). The compliance to theKyoto target in 2010 is achieved through a reduction of 271 Mt CO2 for CO2 emissionsand 112 Mt CO2 equivalent for non-CO2 greenhouse gases.4
1 These include industrial boilers and industrial autoproducers of electricity and steam but the emissions fromindustrial boilers can be allocated to the industry where the activity takes place.2 The PRIMES model can analyse shifts due to changes in technology in energy demand side (e.g. if a diesellocomotive is replaced by electricity, the model allocates the emissions from transport to energy supply andthe emissions from energy supply demand on the fuel mix that is used to generate electricity. In addition, thePRIMES model can show the emissions due to electricity and steam use in such a way that they are allocatedto the energy demand sectors.3 C. Hendriks, D. de Jager, K. Blok et al. (2001): Bottom-up Analysis of Emission Reduction Potentials andCosts for Greenhouse Gases in the EU, Ecofys and AEA Technology, Utrecht, March 20014 The " ACEA Agreement” is according to PRIMES projected to reduce CO2 emissions by more than 80 MtCO2 in 2010. Consequently, the achievement of the Kyoto target for the EU becomes easier.
iii
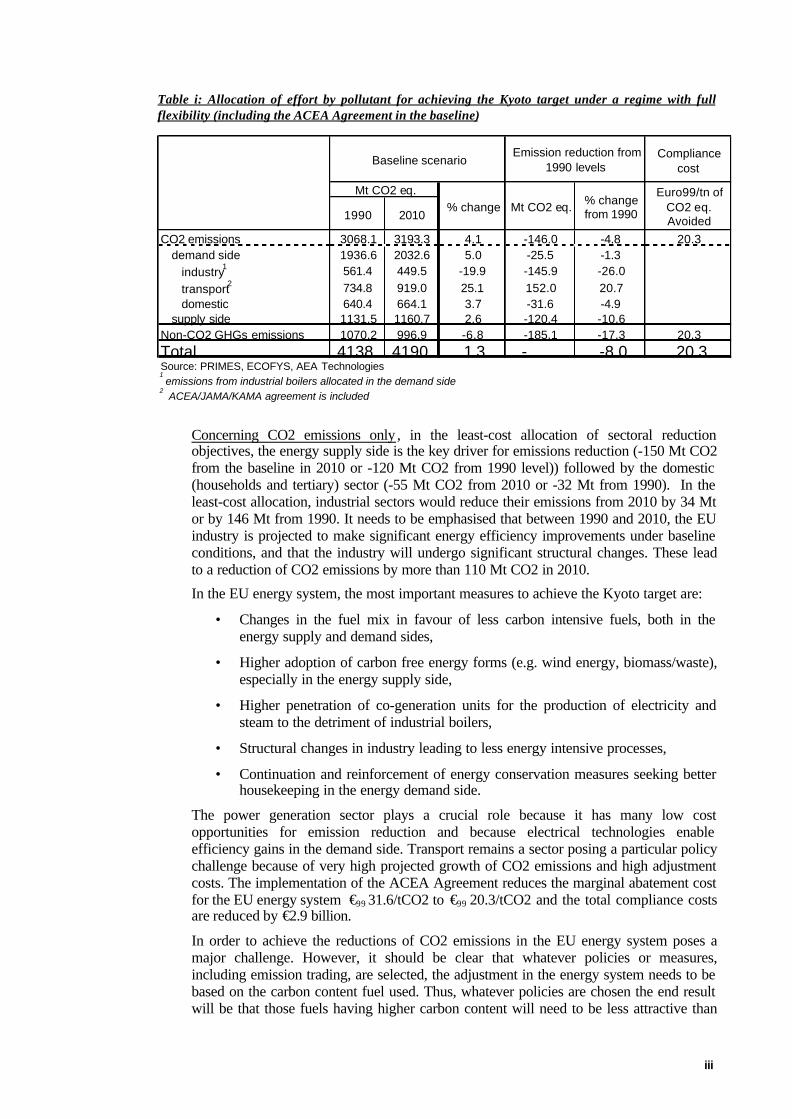
Table i: Allocation of effort by pollutant for achieving the Kyoto target under a regime with fullflexibility (including the ACEA Agreement in the baseline)
Compliancecost
1990 2010
CO2 emissions 3068.1 3193.3 4.1 -146.0 -4.8 20.3demand side 1936.6 2032.6 5.0 -25.5 -1.3
industry1 561.4 449.5 -19.9 -145.9 -26.0transport2 734.8 919.0 25.1 152.0 20.7domestic 640.4 664.1 3.7 -31.6 -4.9
supply side 1131.5 1160.7 2.6 -120.4 -10.6Non-CO2 GHGs emissions 1070.2 996.9 -6.8 -185.1 -17.3 20.3Total 4138. 4190. 1.3 - -8.0 20.3Source: PRIMES, ECOFYS, AEA Technologies1
emissions from industrial boilers allocated in the demand side2
ACEA/JAMA/KAMA agreement is included
Euro99/tn ofCO2 eq.Avoided
Baseline scenarioEmission reduction from
1990 levels
% changeMt CO2 eq.
Mt CO2 eq. % changefrom 1990
Concerning CO2 emissions only , in the least-cost allocation of sectoral reductionobjectives, the energy supply side is the key driver for emissions reduction (-150 Mt CO2from the baseline in 2010 or -120 Mt CO2 from 1990 level)) followed by the domestic(households and tertiary) sector (-55 Mt CO2 from 2010 or -32 Mt from 1990). In theleast-cost allocation, industrial sectors would reduce their emissions from 2010 by 34 Mtor by 146 Mt from 1990. It needs to be emphasised that between 1990 and 2010, the EUindustry is projected to make significant energy efficiency improvements under baselineconditions, and that the industry will undergo significant structural changes. These leadto a reduction of CO2 emissions by more than 110 Mt CO2 in 2010.
In the EU energy system, the most important measures to achieve the Kyoto target are:
• Changes in the fuel mix in favour of less carbon intensive fuels, both in theenergy supply and demand sides,
• Higher adoption of carbon free energy forms (e.g. wind energy, biomass/waste),especially in the energy supply side,
• Higher penetration of co-generation units for the production of electricity andsteam to the detriment of industrial boilers,
• Structural changes in industry leading to less energy intensive processes,
• Continuation and reinforcement of energy conservation measures seeking betterhousekeeping in the energy demand side.
The power generation sector plays a crucial role because it has many low costopportunities for emission reduction and because electrical technologies enableefficiency gains in the demand side. Transport remains a sector posing a particular policychallenge because of very high projected growth of CO2 emissions and high adjustmentcosts. The implementation of the ACEA Agreement reduces the marginal abatement costfor the EU energy system €99 31.6/tCO2 to €99 20.3/tCO2 and the total compliance costsare reduced by €2.9 billion.
In order to achieve the reductions of CO2 emissions in the EU energy system poses amajor challenge. However, it should be clear that whatever policies or measures,including emission trading, are selected, the adjustment in the energy system needs to bebased on the carbon content fuel used. Thus, whatever policies are chosen the end resultwill be that those fuels having higher carbon content will need to be less attractive than
iv
fuels with low or no carbon content. One EU wide policy to comply with the Kyototarget would be to charge the carbon content of fuels either directly or indirectly.According to the PRIMES calculations, with an increase of the price of the carboncontent by €75 per tonne (which is about €20/tCO2) the EU would reach the Kyototarget, assuming that the emissions or non-CO2 gases would be reduced by other policiesand measures.
There are two drawbacks in a charge based on the carbon content of the fuel. One relatesto the political difficulties in gaining EU-wide acceptance. The second is that there is noguarantee that the tax will lead to –8% reduction: if the tax is “too low”, the target willnot be attained and if it is “too high”, there would be an overshoot of the target. Becauseof these inherent difficulties, it is recommended that other EU-wide policies andmeasures are considered to reach the Kyoto target.
Both national and EU-wide cap-and-trade of greenhouse gas emissions offers a newopportunity to reach the Kyoto target in such a manner that those wishing to over-complywould get compensated for their ambitions. Such dynamic incentives are one importantreason why emission trading should be seriously considered. The least-cost allocation ofobjectives, as presented in this study, offers a starting point for allocating the emissionreduction targets for participating sectors. Such targets should be seen as the bestestimates, based on current knowledge.
In addition to emission trading, some other policies and measures could also assist inreducing energy related CO2 emissions. Setting sector specific energy efficiencymeasures (in e.g. energy production or consumption) would reduce CO2 emissions. Thisstudy shows the effects of reduction in energy consumption in terms of CO2 emissions.Further, as de-carbonising of the energy system needs to occur in order to reduce CO2emissions, this could be targeted by specifically supporting low (e.g. natural gas as wellas CHP) or no (renewables) carbon energy sources. This support could be direct (i.e.subsidies) or indirect (i.e. setting minimum shares of energy production from low or no-carbon sources e.g. through a Green Certificate scheme).
Based on the least-cost allocation of emission reduction objectives, the compliance costsof the EU would be €3.7 billion per annum during the first commitment period (2008-2012) of the Kyoto Protocol. This represents 0.06% of the projected GDP of the EU in2010. It should be noted that due to the current EU energy market liberalisation,electricity prices for both industrial users and households have declined substantiallyover the last years. Thus, a least cost achievement of the Kyoto target would not place anunbearable burden on the European industry and citizens.
This study has not looked at the effect of the “flexibility mechanisms” of the KyotoProtocol. Thus, the reduction target for all greenhouse gases for the EU as a whole hasbeen chosen to be –8% throughout this study.
There are still a lot of uncertainties surrounding the developments in non-energy relatedCO2 emissions as well as the non-CO2 greenhouse gases (methane, nitrous oxides, HFCs,PFCs and SF6). The development of the non-energy related greenhouse gas emissions,which amounted to 1070 Mt CO2 equivalent (or about 25% of all emissions in the EU) in1990, play a crucial role. As this study has used the results of the reduction potential ofthese non-energy related greenhouse gases, the uncertainties contained in the analysis ofthose gases, affect the results of this study as well.
During the validation of this study by industrial experts, a lot of comments were given tothe forecasts of sectoral production. As these forecasts influence the projections of CO2emissions, it would be beneficial to undertake sensitivity analysis with the forecasts ofhow industrial sectors see their production develop up to 2010. Unfortunately, there wasno time or resources to carry out such important, but time consuming, sensitivityanalysis. Finally, it should be emphasised, that some policies and measures that have

v
been approved after 1997 either in the EU (e.g. the Integrated Pollution Prevention andControl Directive) or the Member States (increased support to renewable energy) havenot been included in this study. Thus, additional work is required to update the baseline.Such additional work could be complemented by the in-depth knowledge of industryspecific sectoral forecasts of production.
1. IntroductionThe PRIMES model5 and its use within the Shared Analysis project6 quantified a set ofscenarios for the European energy demand and supply system. The purpose of this reportis to build on this work and to present the results of an analysis showing how muchdifferent sectors would need to reduce their greenhouse gas emissions so that theEuropean Union would reach its target of reducing greenhouse gas emissions by 2008-2012 by 8% from 1990 level. For analytical purposes the year of 2010 is representingthese years.
This reports describes the main elements of the PRIMES model and discusses how validthe baseline of the Shared Analysis project is. It also shows the likely mechanism in eachsector to adjust so that the EU would reach the Kyoto target. In addition, the likelyimportance of the environmental agreement between European, Japanese and Korean carmanufacturers to present to the market more fuel efficient vehicles (agreement notincluded in the baseline for Shared Analysis project) is also examined. The baselineconstructed in this report is used as the basis for a bottom-up analysis that is carried outon energy related CO2 emissions by ECOFYS.
The projections for the demand and supply sectors were designed to be consistent withthe rest of the energy system. The exact of definition of sectors is given in Appendix III.Scenarios that reduce emissions are assumed to simulate a response of the entire energysystem to globally imposed emission constraints. In this sense, the scenarios are top-down oriented, since the model simulates the allocation to the sectors of the collectiveemission reduction effort. The model follows an explicit representation of technologies,engineering constraints and plants. It should be qualified as an engineering economicmodel.
For each energy demand sector, the model answers to the following question: what is theoptimal least cost configuration of the sector so as to generate a certain level of valueadded, while satisfying constraints that represent technical, fuel availability and emissionrestrictions. It is assumed that a representative agent of the sector performs a stepwise setof decisions to configure production and energy use in the sector. He has to definephysical production, recycling if applicable, possible structural changes in sub-sectorsand production processes; he has to choose the technology for each energy use, managethe capital replacement procedure and select the fuel. This is considered to be asimultaneous decision taking into account fuel and energy form prices as given fromother sub-models of PRIMES. The sector addresses then to these other sub-modelsdemand for derived and primary energy forms.
The energy demand sectors are to a considerable extent decomposed into several sub-sectors. Industry is subdivided into nine main sectors and several sub-sectors. Residentialdemand is broken down into five typical households. The tertiary sector is split into fivesub-sectors. Finally transportation identifies categories of means and transport mode.
5 PRIMES is a partial equilibrium model for the European Union energy system developed and maintained atthe National Technical University of Athens, E3M-Laboratory led by Prof. Capros. The most recent versionof the model used in this study covers all EU Member States, based on data from EUROSTAT, has a five-year periodicity and uses 1995 as the base year. PRIMES is a result of collaborative research under a seriesof projects supported by the programme Joule of Directorate-General Research of the European Commission.See Appendix I for a short description of PRIMES.6 See Capros P. et al. (1999) “European Union Energy Outlook to 2020”, European Commission –Directorate General for Energy (DG-XVII), special issue of ”Energy in Europe”, catalogue number CS-24-99-130-EN-C, ISBN 92-828-7533-4.
2
For the electricity and steam generation system, the model answers to the followingquestion: what is the optimal least cost operation and configuration (including newinvestment) of the system that produces electricity and steam, separately and/or jointly,so as to meet the demand, while satisfying technical, fuel availability and emissionrestriction constraints.
The following sections use the results of the PRIMES model coming from a large seriesof scenarios and sensitivity analysis runs to analyse how the energy system reacts todifferent emission limitation objectives for 2010. The purpose is to assess the differentsectors adjustment capability as a first step to setting appropriate sectoral objectives inthe EU.
The sections present this analysis per sub-sector both for the demand side (industry,residential, etc.) and the supply side (renewables, cogeneration, etc.). It is worth noting atthe outset that the results are obtained by running the entire PRIMES model and not fromthe utilisation of sectoral models. Given the high uncertainties regarding the evolution oftotal greenhouse gas emissions and in order to obtain a better understanding of thesectoral potential and reaction to emission constraints, besides the sectoral adjustments inthe context of the Kyoto target two additional scenarios are examined, namely the twotimes Kyoto (i.e. –16% in 2010 from 1990 levels) and four times Kyoto (i.e. –32% in2010 from 1990 levels).7 All scenarios describe the reduction of CO2 emissions withouttaking into account other greenhouse gases emissions. In other words, it is assumed inthese sections that the overall reduction of CO2 would be 8% from 1990 levels by 2010.In the last section of this study, this assumption is relaxed.
In the last section of the report, the results obtained from the PRIMES model arecombined with the analysis of non-CO2 greenhouse gases (carried out by Ecofys andAEA Technology). In this analysis the potential contribution of the different MemberStates and sectors in achieving the Kyoto targets are assessed. For this purpose a “meta-model” was constructed. This model combines the marginal abatement cost curves ofCO2 and non-CO2 greenhouse gas emissions. Using the “meta-model” three scenarios toreach the –8% reduction target were examined: (i) the flexibility scenario (assuming allMember States achieve the EU-wide reduction target of –8% jointly) including the“ACEA Agreement”, (ii) the flexibility scenario excluding the ”ACEA Agreement” and(iii) the Burden Sharing scenario (assuming that each Member State achieves its BurdenSharing Target alone) including the “ACEA Agreement”.8
During the validation process of the study, industry experts complained that they wereunable to relate the CO2 emission data and projections of PRIMES to their own estimatesor to EUROSTAT numbers. The reason for the discrepancy is that PRIMES allocatesCO2 emissions of industrial boilers to energy supply, while EUROSTAT (and industries)allocate these emissions to the industrial sector concerned. In order to make the numberscompatible, two sets of tables have been prepared: one set of tables shows the resultsbased on PRIMES classification of industrial boilers (to energy supply sector) and theother set based on EUROSTAT classification (to industry). Total emission are naturallynot affected, only the sectoral allocation. Finally, all tables also show the emissions fromenergy supply sector would be reallocated to industry, households and services based on
7 The discussion of the two additional scenarios provides detailed insights of sectoral adjustments required ifthe reduction target would be more demanding than the one set in the Kyoto Protocol. Therefore, thesesections with additional information can be left unread if the focus of the reader is the first commitmentperiod (2008-2012) of the Kyoto Protocol.8 The case “excluding the ACEA Agreement “ was not analysed because this was not thought to add muchfurther insight and because this was not considered policy relevant.

3
their energy consumption. These “indirect” emissions should be helpful when the effectsof changes in energy demand are analysed.
Greenhouse gas emissions of industry sector in 1990 and in 2010, as well the costeffective objectives are given in Appendix V. Thus, to conserve space, tables on CO2 orother greenhouse gases are not shown in the text, except in the summary tables inChapter 7 “Conclusions”.
4
2. Interaction between demand and power generationThe PRIMES model covers the energy sector as a system. When imposing a globalemission constraint, a final demand sector might prefer undertaking electricity savings toallow for lower carbon emissions than reducing emissions from combustion taking placedirectly in the sector. The model computes a least-cost allocation of the collective effortto the sectors. Conclusions about the emission reduction possibilities of a sector aredrawn as a result of system-wide analysis, through the model. This is not comparable toengineering approaches that usually consider the sectors disconnected from each other.
The basic source of data for energy consumption by sector and fuel is EUROSTAT(detailed energy balance sheets). By using additional information (surveys ofcogeneration operation and capacities and surveys on boilers), the balance sheets havebeen modified in order to represent explicitly the production of steam. According toPRIMES definitions, steam includes industrial steam and distributed heat (at small orlarge scale). It should be noted that in the balance sheets, EUROSTAT reports steamproduction in the transformation input/output only if the producer sells that steam. If thesteam, irrespectively of the way it is produced (e.g. a boiler or a CHP plant), is used forself-consumption only, EUROSTAT accounts only for the fuels used to produce thatsteam and includes these fuels at the level of final energy consumption. The PRIMESdatabase departs from EUROSTAT practice by introducing that steam (for self-consumption) in the final energy consumption tables of the balance sheets and insertingthe fuels used to produce it in the table of transformation input and output. This isnecessary for the model to calibrate to a base year that properly accounts for the existingcogeneration activities (even if they are used for self-generation of steam) and to fullyexploit the potential contribution of cogeneration to electricity and steam production.
The PRIMES model includes only direct carbon emissions in the final demand sectors.Emissions from steam and electricity production are included in the supply sectors,which generate steam and electricity. It is possible to allocate these supply side emissionsto those sectors that use energy. Seen from the point of view of energy consumption, theemissions arising from the use of electricity, steam and district heating are “indirect”emissions.
Emission reduction constraints have been applied as global constraints in solving thePRIMES model in order to obtain an allocation of energy and emissions reduction, as themodel itself would suggest. Given the technical features and design of PRIMES theimposition of global emissions constraint is equivalent to the inclusion of a variable,which reflects all the economic costs imposed by the global constraint.
The mechanism through which the carbon constraint is attained involves the attributionof an appropriate economic value to the reduction of emissions of carbon. Equivalently,the ability to emit carbon obtains a scarcity value and is allocated an implicit price.Correspondingly economic agents are faced with changes in the relative prices, reflectingthe carbon emissions that each commodity or activity involves. This, of course, leads toadjustments in the behaviour of producers and consumers of energy that tend to shiftaway from activities that involve emissions.
In other words, in the scenarios examined, the EU energy system has been treated as oneeconomic unit without any a priori allocation of emissions reductions to any sector orcountry. Thus, in principle, the model could allocate all required reductions in emissionsto a single sector or a single country, if this were economically more efficient,irrespectively of any political or social considerations. The results obtained from theanalysis showed that the power and steam generation system is the most responsive to theintroduction of small to medium emission reduction objectives while the potential
5
improvement from the demand side is activated principally when higher emissionreduction targets are set.
The contribution of a final demand sector to collective emission reduction can vary whenvarying the level of the collective emission reduction effort. At a lower emissionreduction objective, the systems-wide analysis might indicate more cost-effectivemeasures in the power and steam generation sector. On the other hand, when thecollective emission reduction effort is higher, cost-effective measures in power and steamtend to become exhausted, so some sectors, depending on their structure, are obliged todo more emission abatement in a direct way.9
It should be noted that due to the approach described above (allocation of fuels used inindustrial boilers as well as of corresponding CO2 emissions on the supply side,allocation of produced steam as demanded fuel on the demand side) the structure ofenergy requirements and, correspondingly, direct CO2 emissions in industrial sectors arealtered compared to EUROSTAT data. Appendix II discusses these differences in detail.The impact measured following this approach is more significant in sectors such aschemicals, paper and pulp and food drink and tobacco industries, which involve highutilisation of steam in their production processes. In that sense, the analysis, partlyunderestimates the potential contribution of industrial sectors in reducing CO2 emissionsexamining only the changes that occur at the level of direct energy uses, while changesregarding production of steam are allocated to the supply side.
It is also important to note that the reporting requirements of National Communicationsunder the UN Framework Convention on Climate Change – as specified by theIntergovernmental Panel of Climate Change (IPCC) – are different from the coverage inthis report. The main differences are: (a) under Primes, industrial generation of powerand steam (referred to as “autoproduction”) is allocated under power generation sector(according to EUROSTAT definition) while under IPCC guidelines such powergeneration is under “industry”), and (b) international aviation emissions are included inthe Primes (and EUROSTAT) numbers while they are reported as a memo item underUNFCCC. In terms of CO2 emissions the differences between sectors are important, asthe emissions from “autoproduction” were 109 Mt of CO2 in 1998. This represents about12% of conventional thermal power emissions of the EU. International aviationcontributed 74 Mt of CO2 emissions in the EU Member States.
9 Direct emissions include those emissions that arise from the combustion of fossil fuel in thesector (e.g. heating a furnace with gas). Indirect emissions refer to those emissions that arise in theenergy supply sector due to the use of energy (e.g. the emissions of a coal-fired power plant due tothe use of electricity when using an electric arc.
6
3. Reduction of CO2 from industryIn this section the results of the attainment if an EU-wide –8% reduction target are shownfor each main energy consuming industrial sector. Each section has a short discussion ofhow valid the Shared Analysis baseline is followed by a description of the main featuresof the baseline. Then the results of how the sector would react when the energy systemsas a whole would reach the –8% target are given. The boxes “additional information”give further insights of how sensitive the sector is if the Kyoto target was moredemanding, i.e. if the target was “two times Kyoto” or -16% from 1990 or “four timesKyoto” or –32% from 1990. Section 3.7 concludes what the least-cost emission reductionpotential industrial sectors would be according to the PRIMES model.
3.1. Iron and steel sectorThe production of the iron and steel sector (as modelled in PRIMES) is divided into twosub-sectors, the traditional "integrated steelworks" sub-sector (using mainly coke andiron ore as raw materials) and the "electric arc furnace" (EAF) sub-sector, which usesscrap as its basic raw material. In the model projections for steel production is related tothe evolution of sectoral value added. The model allows for the possibility of reflectingsituations in which higher value added may be obtained with relatively lower productionin physical units, for example by improving product quality.
3.1.1. Is the current PRIMES baseline still valid in relation to short runtrends?
According to the latest data available from the International Iron and Steel Institute(IISI), steel production in the EU increased from 153 Mt in 1995 to 155 Mt in 1999 (160Mt in 1998). The PRIMES projection for 2000 production is 158 Mt of steel, whichseems in broad agreement with the latest data available.
The share of EAF production in the EU increased from 32.5% in 1995 (about 27% in1990) to 38.2% in 1998. The corresponding figure in the PRIMES baseline for the year2000 is 38%.
Integrated steelworks using blast-furnace plants are very energy-intensive, in fact about 3times more than EAF, and therefore even small shifts from the one process to the othercan lead to significant changes of the overall energy intensity of the sector. Between1990 and 1997 the overall specific energy consumption of the iron and steel sector(mainly because of the effect of shifting from integrated steelworks to EAF) improved bymore than 10% (or 1.5% per year). The projected specific energy consumptionimprovement in PRIMES from 1995 to 2000 is about 1% per year, while for the sameperiod technological progress at the process level has been limited. However, the lack ofdisaggregated data as regards energy consumption by process does not allow for acomparison with technical progress as observed in the near past.
On the basis of the above comparisons it can be argued that PRIMES results for the shortrun are consistent with recent trends in iron and steel sector.
3.1.2. What is the basic mechanism reflected in the PRIMES baselinescenario towards 2010?
The key assumption regarding the PRIMES projection to 2010 for iron and steel is that inthe context of the EU single market integrated steelworks will become concentrated insome major basic steel producing countries and companies. A certain basic processingcapacity will remain active in those major poles in the EU, while smaller factories will

7
specialise and further shift towards EAF. More specifically the following are included inthe baseline scenario:
• Sectoral value added is assumed to increase by 6.5% from 1995 to 2010.Because of product quality improvement, production of steel in 2010 isprojected to increase by only 4% from its 1995 level (1% from 2000) reaching159.5 Mt of steel.
• According to IISI medium-term projections, steel demand in 2005 will increasefrom 2000 levels by about 2 Mt (or 1.5%) in the EU. Historical trends haveshown that growth rates of steel demand in the EU are similar to those of steelproduction. If historical trends continue in the near future then the production ofsteel for 2010 is underestimated in the PRIMES baseline scenario.
• According to baseline projections about 47% of steel production in 2010 will bederived from EAF. Requirements for scrap steel as raw material are projected toreach 100 Mt in 2010. In 1997, about 87 Mt of scrap steel was consumed by ironand steel industries (from 73 Mt in 1990, i.e. an increase of about 14 Mt or 8%in 7 years). In that sense, the additional scrap requirements for 2010 (+13 Mtfrom 1997) seem feasible.
• Overall specific energy consumption in iron and steel is projected to improve by7.2% between 2000 and 2010 again due mainly to restructuring. Limitedtechnology improvement is projected at the specific process level. As a result ofproduct quality improvement a more significant progress is projected forsectoral energy intensity in terms of value added (+12% in 2000-2010).
3.1.3. Sector adjustment under Kyoto according to PRIMESThe projected evolution of the iron and steel sector under baseline conditions leads to asubstantial decrease (by almost 25% 10) in sectoral CO2 emissions in 2010 compared to1990 levels. Under a global emission restriction, the PRIMES model estimates a least-cost allocation of the emission reduction effort to the various demand and supply sectorsof EU Member State. As a result, the imposition of the Kyoto emission reductionconstraint leads to a further reduction of CO2 emissions also in the iron and steel sector.
In order to reach the Kyoto target, the sector is predicted to undergo the followingchanges:
• The iron and steel sector shifts more aggressively into EAF, the share of whichincreases to 52% of steel production in 2010 (47% in baseline). Besidesefficiency gains this shift is also driven by the relative ease with which theelectricity generation system reduces emissions via the improvement of carbonintensity.
• Overall steel production is also affected decreasing to 154 Mt of steel in 2010(compared to 159.5 Mt under baseline conditions). This reduction does not affectthe sectoral value added, i.e. product quality is further improved compared tobaseline.
• Scrap requirements in 2010 reach 105 Mt (a small change from baseline wherethey stood at 100 Mt of scrap). 11
10 Emissions for electricity production are included in the electricity sector11 A reviewer of this report has suggested that there might not be enough scrap metal to satisfied this demand.This issue cannot be resolved as part of this study, though.
8
• Specific energy consumption in 2010 improves by 5% on top of baseline. Theimprovement is due to the structural shift towards EAF and not to technologicalprogress in specific processes or equipment. The corresponding energy intensityimprovement reaches 8% on top of baseline.
• CO2 emissions in iron and steel decrease by more than 15% from baseline in2010 (or 36% from 1990 levels).
The projected evolution of the iron and steel sector under the imposition of the Kyotoemission reduction target for the EU energy system seems to be reasonable. However,there are two issues that need to be clarified. First, the increased share of EAF may leadto the need of imports of specific products (e.g. steel for heavy construction uses).Second, the production cost of steel is projected to increase by 10% from baseline levels.If iron and steel industries in other Annex B Parties12 would not face the Kyotoconstraint, the competitiveness of EU iron and steel industry would be affectednegatively. However, if the other Parties would face a relatively higher constraint (i.e. ifthe target for the competitors would be tougher), the EU iron and steel producers wouldgain in competitiveness.
How the sector adjusts to allow for higher emission abatement?(This section contains additional information and can be ignored if the focus is the firstcommitment period (2008-2012) of the Kyoto Protocol)
For higher levels of emission reduction targets, there are no additionalpotential gains from shifting into EAF. To abate more it is necessary to adoptmore efficient technologies, especially in integrated steelworks, that couldlead to significant improvements in terms of specific energy consumption.However, given the long lead times of energy related equipment in thesector, the existing overcapacity and the fact that in recent years the sectorhas undergone a considerable investment program for renovation andrestructuring, the adoption of new technologies in the horizon to 2010 willrequire the premature replacement of existing equipment. This involves highcosts and explains the inertia of the sector, regarding technologyimprovement, in the context of the baseline and the emission reductionscenarios.
More specifically, the analysis of cases involving high emission reductioneffort can be summarised as follows:
• The imposition of a global emission reduction target of –20% from1990 for the EU energy system makes the adoption of directsmelting and direct reduction technologies (allowing for a decreaseof the use of coke in blast furnaces and reducing the need for orepreparation) cost effective. Energy intensity of integrated steelworksimproves by 8% from baseline while the efficiency of blast furnaceprocessing in integrated steelworks improves by more than 10%.However, unit production costs increase by almost 18% frombaseline levels. Potential improvement of blast furnace processingdue to this technology can reach up to 35%.
• A global emission reduction target of at least –30% from 1990 levelsfor the EU energy system would be required before adopting hotconnection techniques and mainly near-net-shape casting thatreplace continuous slab casting and hot rolling. In this caseefficiency improvement in casting and rolling operations reaches
12 These are mainly OECD countries.
9
15% and 20% as compared to baseline for integrated steelworks andEAF respectively. In addition, blast furnace processing efficiencyfurther improves up to 30% from baseline levels. As a result thecumulative energy intensity improvement in integrated steelworksexceeds 20%, while that of EAF reaches 13%. The unit productioncosts of steel increases, however, by 22%.
• Scrap pre-heating and other techniques that contribute in making theelectric arc processes more efficient become cost effective only forvery high emission reduction targets (at least -35% from 1990 CO2
emissions for the EU energy system).
In total, potential efficiency improvement in integrated steelworks can reachup to 35% while that for EAF can reach up to 20%. However, in the mediumterm horizon of 2010, this will lead to substantial increases in productioncosts (more than 30% from baseline levels) seriously affecting thecompetitiveness of the EU iron and steel sector.
10
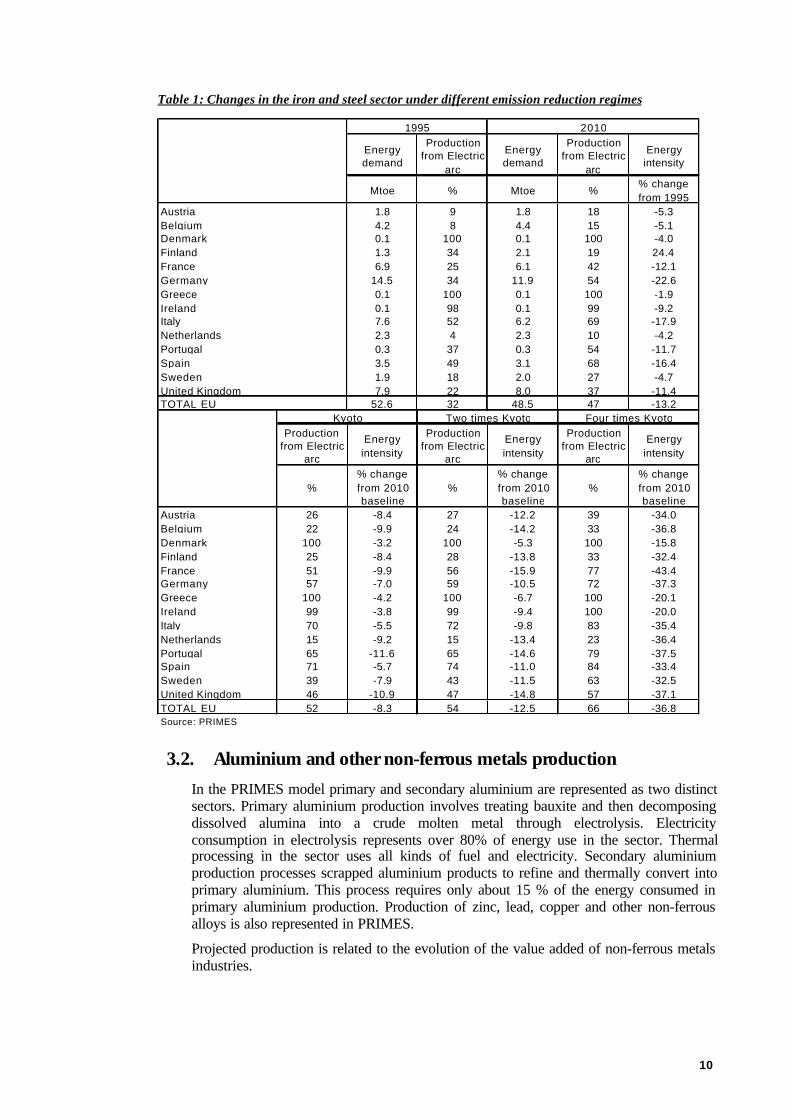
Table 1: Changes in the iron and steel sector under different emission reduction regimes
Energy demand
Production from Electric
arc
Energy demand
Production from Electric
arc
Energy intensity
Mtoe % Mtoe %% change from 1995
Austria 1.8 9 1.8 18 -5.3Belgium 4.2 8 4.4 15 -5.1Denmark 0.1 100 0.1 100 -4.0Finland 1.3 34 2.1 19 24.4France 6.9 25 6.1 42 -12.1Germany 14.5 34 11.9 54 -22.6Greece 0.1 100 0.1 100 -1.9Ireland 0.1 98 0.1 99 -9.2Italy 7.6 52 6.2 69 -17.9Netherlands 2.3 4 2.3 10 -4.2Portugal 0.3 37 0.3 54 -11.7Spain 3.5 49 3.1 68 -16.4Sweden 1.9 18 2.0 27 -4.7United Kingdom 7.9 22 8.0 37 -11.4TOTAL EU 52.6 32 48.5 47 -13.2
Production from Electric
arc
Energy intensity
Production from Electric
arc
Energy intensity
Production from Electric
arc
Energy intensity
%% change from 2010 baseline
%% change from 2010 baseline
%% change from 2010 baseline
Austria 26 -8.4 27 -12.2 39 -34.0Belgium 22 -9.9 24 -14.2 33 -36.8Denmark 100 -3.2 100 -5.3 100 -15.8Finland 25 -8.4 28 -13.8 33 -32.4France 51 -9.9 56 -15.9 77 -43.4Germany 57 -7.0 59 -10.5 72 -37.3Greece 100 -4.2 100 -6.7 100 -20.1Ireland 99 -3.8 99 -9.4 100 -20.0Italy 70 -5.5 72 -9.8 83 -35.4Netherlands 15 -9.2 15 -13.4 23 -36.4Portugal 65 -11.6 65 -14.6 79 -37.5Spain 71 -5.7 74 -11.0 84 -33.4Sweden 39 -7.9 43 -11.5 63 -32.5United Kingdom 46 -10.9 47 -14.8 57 -37.1TOTAL EU 52 -8.3 54 -12.5 66 -36.8Source: PRIMES
Two times Kyoto Four times Kyoto
1995 2010
Kyoto
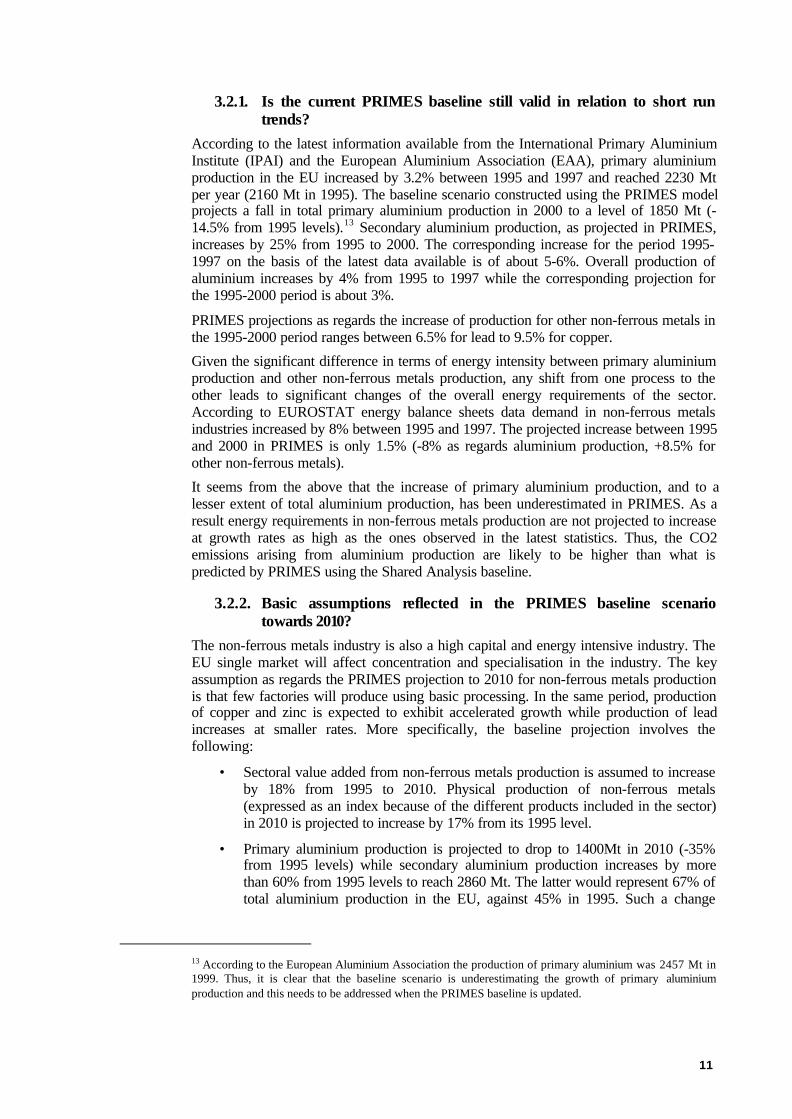
3.2. Aluminium and other non-ferrous metals productionIn the PRIMES model primary and secondary aluminium are represented as two distinctsectors. Primary aluminium production involves treating bauxite and then decomposingdissolved alumina into a crude molten metal through electrolysis. Electricityconsumption in electrolysis represents over 80% of energy use in the sector. Thermalprocessing in the sector uses all kinds of fuel and electricity. Secondary aluminiumproduction processes scrapped aluminium products to refine and thermally convert intoprimary aluminium. This process requires only about 15 % of the energy consumed inprimary aluminium production. Production of zinc, lead, copper and other non-ferrousalloys is also represented in PRIMES.
Projected production is related to the evolution of the value added of non-ferrous metalsindustries.
11
3.2.1. Is the current PRIMES baseline still valid in relation to short runtrends?
According to the latest information available from the International Primary AluminiumInstitute (IPAI) and the European Aluminium Association (EAA), primary aluminiumproduction in the EU increased by 3.2% between 1995 and 1997 and reached 2230 Mtper year (2160 Mt in 1995). The baseline scenario constructed using the PRIMES modelprojects a fall in total primary aluminium production in 2000 to a level of 1850 Mt (-14.5% from 1995 levels).13 Secondary aluminium production, as projected in PRIMES,increases by 25% from 1995 to 2000. The corresponding increase for the period 1995-1997 on the basis of the latest data available is of about 5-6%. Overall production ofaluminium increases by 4% from 1995 to 1997 while the corresponding projection forthe 1995-2000 period is about 3%.
PRIMES projections as regards the increase of production for other non-ferrous metals inthe 1995-2000 period ranges between 6.5% for lead to 9.5% for copper.
Given the significant difference in terms of energy intensity between primary aluminiumproduction and other non-ferrous metals production, any shift from one process to theother leads to significant changes of the overall energy requirements of the sector.According to EUROSTAT energy balance sheets data demand in non-ferrous metalsindustries increased by 8% between 1995 and 1997. The projected increase between 1995and 2000 in PRIMES is only 1.5% (-8% as regards aluminium production, +8.5% forother non-ferrous metals).
It seems from the above that the increase of primary aluminium production, and to alesser extent of total aluminium production, has been underestimated in PRIMES. As aresult energy requirements in non-ferrous metals production are not projected to increaseat growth rates as high as the ones observed in the latest statistics. Thus, the CO2emissions arising from aluminium production are likely to be higher than what ispredicted by PRIMES using the Shared Analysis baseline.
3.2.2. Basic assumptions reflected in the PRIMES baseline scenariotowards 2010?
The non-ferrous metals industry is also a high capital and energy intensive industry. TheEU single market will affect concentration and specialisation in the industry. The keyassumption as regards the PRIMES projection to 2010 for non-ferrous metals productionis that few factories will produce using basic processing. In the same period, productionof copper and zinc is expected to exhibit accelerated growth while production of leadincreases at smaller rates. More specifically, the baseline projection involves thefollowing:
• Sectoral value added from non-ferrous metals production is assumed to increaseby 18% from 1995 to 2010. Physical production of non-ferrous metals(expressed as an index because of the different products included in the sector)in 2010 is projected to increase by 17% from its 1995 level.
• Primary aluminium production is projected to drop to 1400Mt in 2010 (-35%from 1995 levels) while secondary aluminium production increases by morethan 60% from 1995 levels to reach 2860 Mt. The latter would represent 67% oftotal aluminium production in the EU, against 45% in 1995. Such a change
13 According to the European Aluminium Association the production of primary aluminium was 2457 Mt in1999. Thus, it is clear that the baseline scenario is underestimating the growth of primary aluminiumproduction and this needs to be addressed when the PRIMES baseline is updated.
12
implicitly assumes higher imports of primary aluminium into the EU, since itcannot be solely attributed to higher recycling of aluminium.
• Copper production increases in 2010 by 24% from 1995 levels, followed by zinc(+18%) while a moderate increase is projected for lead and other non-ferrousalloys (around +15%).
The restructuring of the sector, reducing basic processing, explains the spectacular dropin overall energy intensity (both in terms of physical production and sectoral valueadded) in the baseline (-14 and -15% respectively in the 1995-2010 period).Technological progress at specific industrial processes is shown to be very limited in thebaseline projection with the exception of copper production where an improvement of amaximum of 5% is obtained.
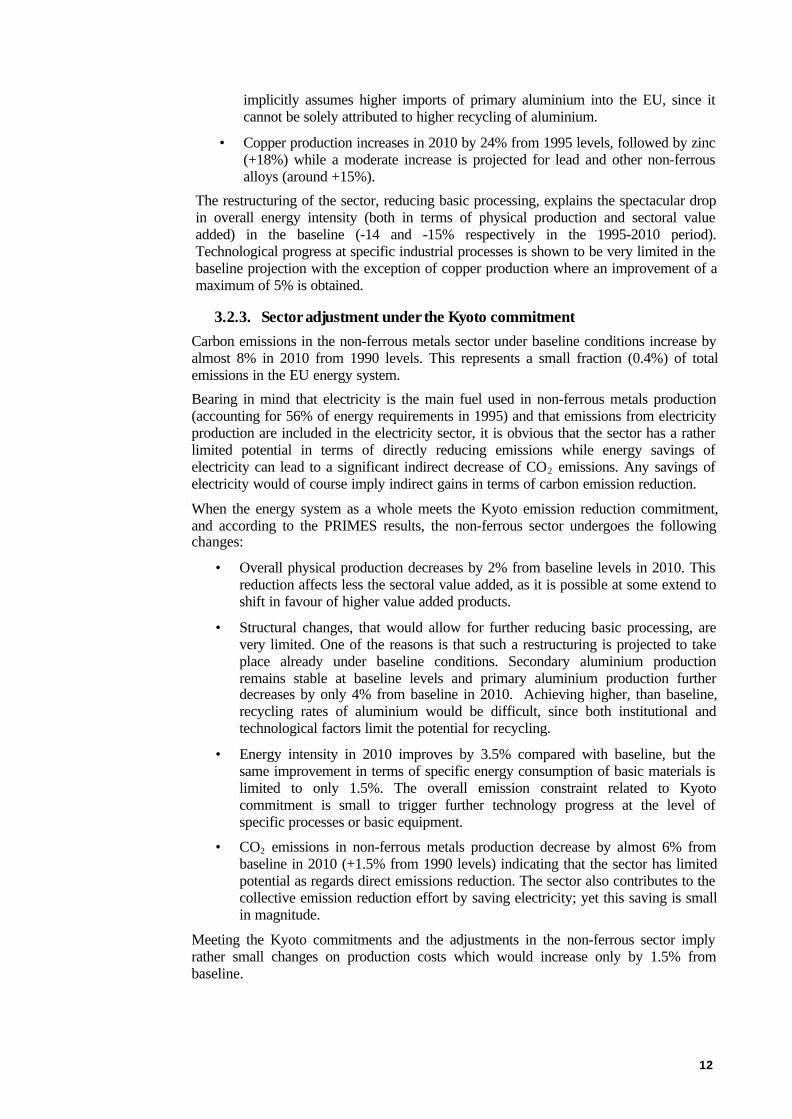
3.2.3. Sector adjustment under the Kyoto commitmentCarbon emissions in the non-ferrous metals sector under baseline conditions increase byalmost 8% in 2010 from 1990 levels. This represents a small fraction (0.4%) of totalemissions in the EU energy system.
Bearing in mind that electricity is the main fuel used in non-ferrous metals production(accounting for 56% of energy requirements in 1995) and that emissions from electricityproduction are included in the electricity sector, it is obvious that the sector has a ratherlimited potential in terms of directly reducing emissions while energy savings ofelectricity can lead to a significant indirect decrease of CO2 emissions. Any savings ofelectricity would of course imply indirect gains in terms of carbon emission reduction.
When the energy system as a whole meets the Kyoto emission reduction commitment,and according to the PRIMES results, the non-ferrous sector undergoes the followingchanges:
• Overall physical production decreases by 2% from baseline levels in 2010. Thisreduction affects less the sectoral value added, as it is possible at some extend toshift in favour of higher value added products.
• Structural changes, that would allow for further reducing basic processing, arevery limited. One of the reasons is that such a restructuring is projected to takeplace already under baseline conditions. Secondary aluminium productionremains stable at baseline levels and primary aluminium production furtherdecreases by only 4% from baseline in 2010. Achieving higher, than baseline,recycling rates of aluminium would be difficult, since both institutional andtechnological factors limit the potential for recycling.
• Energy intensity in 2010 improves by 3.5% compared with baseline, but thesame improvement in terms of specific energy consumption of basic materials islimited to only 1.5%. The overall emission constraint related to Kyotocommitment is small to trigger further technology progress at the level ofspecific processes or basic equipment.
• CO2 emissions in non-ferrous metals production decrease by almost 6% frombaseline in 2010 (+1.5% from 1990 levels) indicating that the sector has limitedpotential as regards direct emissions reduction. The sector also contributes to thecollective emission reduction effort by saving electricity; yet this saving is smallin magnitude.
Meeting the Kyoto commitments and the adjustments in the non-ferrous sector implyrather small changes on production costs which would increase only by 1.5% frombaseline.
13
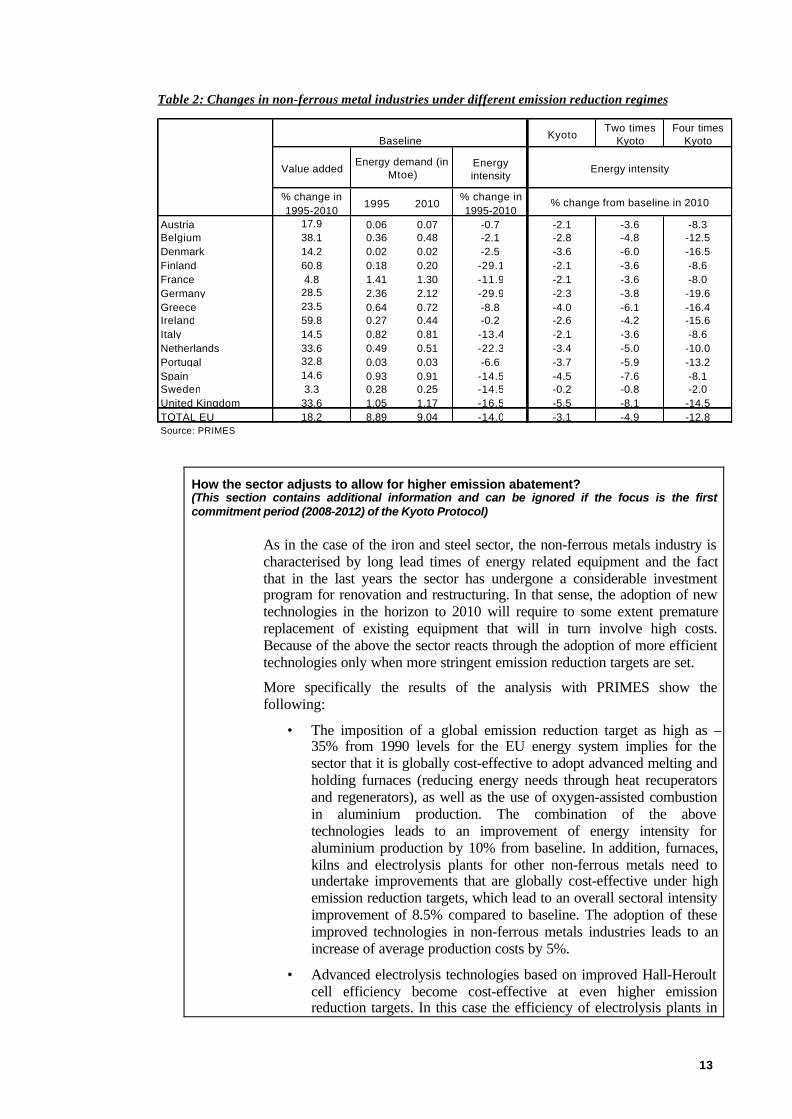
Table 2: Changes in non-ferrous metal industries under different emission reduction regimes
KyotoTwo times
KyotoFour times
Kyoto
Value added Energy intensity
% change in 1995-2010
1995 2010% change in 1995-2010
Austria 17.9 0.06 0.07 -0.7 -2.1 -3.6 -8.3Belgium 38.1 0.36 0.48 -2.1 -2.8 -4.8 -12.5Denmark 14.2 0.02 0.02 -2.5 -3.6 -6.0 -16.5Finland 60.8 0.18 0.20 -29.1 -2.1 -3.6 -8.6France 4.8 1.41 1.30 -11.9 -2.1 -3.6 -8.0Germany 28.5 2.36 2.12 -29.9 -2.3 -3.8 -19.6Greece 23.5 0.64 0.72 -8.8 -4.0 -6.1 -16.4Ireland 59.8 0.27 0.44 -0.2 -2.6 -4.2 -15.6Italy 14.5 0.82 0.81 -13.4 -2.1 -3.6 -8.6Netherlands 33.6 0.49 0.51 -22.3 -3.4 -5.0 -10.0Portugal 32.8 0.03 0.03 -6.6 -3.7 -5.9 -13.2Spain 14.6 0.93 0.91 -14.5 -4.5 -7.6 -8.1Sweden 3.3 0.28 0.25 -14.5 -0.2 -0.8 -2.0United Kingdom 33.6 1.05 1.17 -16.5 -5.5 -8.1 -14.5TOTAL EU 18.2 8.89 9.04 -14.0 -3.1 -4.9 -12.8Source: PRIMES
% change from baseline in 2010
Baseline
Energy intensityEnergy demand (in
Mtoe)
How the sector adjusts to allow for higher emission abatement?(This section contains additional information and can be ignored if the focus is the firstcommitment period (2008-2012) of the Kyoto Protocol)
As in the case of the iron and steel sector, the non-ferrous metals industry ischaracterised by long lead times of energy related equipment and the factthat in the last years the sector has undergone a considerable investmentprogram for renovation and restructuring. In that sense, the adoption of newtechnologies in the horizon to 2010 will require to some extent prematurereplacement of existing equipment that will in turn involve high costs.Because of the above the sector reacts through the adoption of more efficienttechnologies only when more stringent emission reduction targets are set.
More specifically the results of the analysis with PRIMES show thefollowing:
• The imposition of a global emission reduction target as high as –35% from 1990 levels for the EU energy system implies for thesector that it is globally cost-effective to adopt advanced melting andholding furnaces (reducing energy needs through heat recuperatorsand regenerators), as well as the use of oxygen-assisted combustionin aluminium production. The combination of the abovetechnologies leads to an improvement of energy intensity foraluminium production by 10% from baseline. In addition, furnaces,kilns and electrolysis plants for other non-ferrous metals need toundertake improvements that are globally cost-effective under highemission reduction targets, which lead to an overall sectoral intensityimprovement of 8.5% compared to baseline. The adoption of theseimproved technologies in non-ferrous metals industries leads to anincrease of average production costs by 5%.
• Advanced electrolysis technologies based on improved Hall-Heroultcell efficiency become cost-effective at even higher emissionreduction targets. In this case the efficiency of electrolysis plants in
14
aluminium production can improve by up to 20% from baselinelevels. This improvement combined with the further penetration ofthe above-mentioned technologies leads to an overall energyintensity gain of 12% from baseline. The increase in terms ofaverage production cost is 7%.14
The top-down analysis indicates that to a short-term horizon such as 2010,the non-ferrous industry has limited possibilities to improve efficiency andsubstantially contribute to a reduction of carbon emissions. In cases when theenergy system is faced with tougher emission restrictions and hence isobliged to deal with higher costs the non-ferrous metals industry is forced toadopt efficient processing technologies, at the expense of prematurereplacement of capital and higher average production costs.
In such a short-term horizon and given the pressures in a very globalisedmarket, such as that for non-ferrous metals, it seems more cost-effective toimprove recycling on the demand-side and directly link renewables tosupplying the few major primary aluminium factories of Europe. Furtheranalysis on these two issues is necessary.
3.3. Cement and other non-metallic mineralsThe sector of building materials includes the production of cement, glass, ceramics andother non-metallic minerals. Cement is produced in special kilns that reduce raw materialthrough fossil fuels that keep up the high temperature required for the process. ThePRIMES model considers only energy fuels as being usable in cement kilns. There ishowever experiences (e.g. in France) in which waste materials of various kinds are burntin the kilns. This option has not been considered in the analysis.
In general, pyro-processing assuring a chemical reaction constitutes the basic processingfor building materials. Melting silica sand produces glass. Bricks and ceramics is justclay until fired. All sub-sectors are very energy-intensive and are separately modelled inPRIMES.
Due to the significant diversity in sectoral products, the physical production is expressedby means of an indicator (index number). It is related to the evolution of the value addedof non-metallic minerals industries with variable sub-sector proportions.
3.3.1. Is the current PRIMES baseline still valid in relation to short runtrends?
The PRIMES projection for 1995-2000 shows an increase in cement production by 7%.According to the latest data available from the Global Cement Information system,production in the EU remained stable between 1995 and 1997. However, more recentinformation available from CEMNET indicates an increase in production in 1999 by 4%(from 1995) for three major cement producers in the EU (Germany, Italy and Spain) thataccount for more than 50% of EU production. It is expected that the current growthprospects for the EU will also involve higher demand for cement.
The PRIMES baseline projects an increase of production of glass by almost 10% in theperiod 1995-2000. Recycled glass processing increases by 17.5%, while the results showan increase of 2.5% for primary glass production. As a result, the share of recycled glassin total glass production increases to 52% in 2000 from 48.5% in 1995. Production ofceramics and other non-metallic minerals is projected to increase by 10% between 1995
14 Not including any costs from stranded investment.
15
and 2000. No recent data were found to check these trends concerning glass andceramics.
The overall specific energy consumption of the sector of building materials improvesunder baseline assumptions by 1.5% in the period 1995-2000. The corresponding energyrequirements are projected to increase by 7.5% in the same period. According toEUROSTAT recent energy balances, the demand by the sector decreased by 1.8%between 1995 and 1997 mainly as a result of stagnation of material production.
Because of the lack of detailed production data and the wide range of products includedin the sector it can not be argued whether PRIMES projections for the short run are inline with recent information.
3.3.2. Basic assumptions reflected in the PRIMES baseline scenario to 2010A key assumption of the baseline scenario is that within the EU single market theconcentration in few large factories will mainly take place in the Southern Member States(Greece, Italy, Spain and Portugal). However, significant levels of domestic productionwill persist in all Member States because it is more cost effective to have the high-bulk/low-value materials produced domestically rather than transported over longdistances. The expansion of the sector in the South is driven partly by high growth ininternal demand and by exports. It is also assumed that higher recycled glass processingwill take place, but at different degrees across EU Member States reflecting differentlocal markets and possibilities. For example the glass market is very specific in MemberStates such as Portugal and Spain that produce high quality glass products.
More details about the baseline scenario are given below:
• The sectoral value added of non-metallic minerals production is assumed toincrease by 29% in 2010 from 1995 levels. Physical production of non-metallicminerals (expressed in terms of an index number) is projected to increase by23% in 2010 compared to 1995.
• Cement production is projected to increase by 13.5% between 1995 and 2010(from 173 Mt to 196 Mt of cement).15 However production patterns varyconsiderably: in the South the rise is 32.5% while in other EU Member Statesthere is a drop (-4%) on average. Technological progress in cement productionis rather modest in the baseline projection (-3.5% in terms of specific energyconsumption in 2010 from 1995).
• The production of glass is projected to increase by 32% in 1995-2010. The shareof recycled glass in total glass production is projected to reach 59% in 2010(48.5% in 1995). Here also technological progress is modest: specific energyconsumption is lower in 2010 by 6% and 5% for primary and recycled glassprocessing. But this progress combined with the structural shift in favour ofrecycled glass leads to an overall improvement of energy intensity in the glasssector of 8.5% in 2010 compared to 1995, in the baseline scenario.
• The production of ceramics and other non-metallic minerals increases by 23 and30% respectively. The improvement of specific energy consumption in the
15 It should be noted that CEMBUREAU projects that cement production will reach 1990 levels (185 Mt ofcement) by 2010 consistent with a long-term decline in average annual cement production in the EU(CEMBUREAU’s note: “Potential CO2 Emission Savings in the Cement Industry of EU (15) from 1990 to2010”). The projection retained for this study incorporates a secular decline in most of northern Europe butassumes a more buoyant market in the South hence resulting in slight overall growth.
16
production of ceramics is of the order of 8% (in 2010 from 1995) and only 2.5%in other non-metallic minerals.
For the overall buildings material sector, the baseline projection shows relatively highenergy intensity gains: final energy needs of the sector expressed as a ratio to thesector’s value added, improves by 8.5% in the period 1995 to 2010. This is a combinedresult of specific processing technological progress, some material recycling and therestructuring of the sector in favour of higher value added varieties of the products.
3.3.3. Adjustment of the sector under the Kyoto targetThe emissions of carbon from direct energy combustion16 in the sector of buildingmaterials decrease in the baseline by almost 7.5% in 2010 from 1990. For variousreasons this reduction mostly takes place in the period 1990 to 1995. The baselinescenario shows a steady increase in emissions (11.5% in 2010) from 1995.
Under the Kyoto obligations for the EU, the top-down analysis indicates the followingchanges for the building materials sector:
• The index of physical production decreases roughly by 2% in 2010 compared tobaseline. The reduction in terms of the sector’s value added is smaller, becauseof shifts towards higher value added products.
• Cement production bears the strongest pressure and decreases by 3.5% in 2010compared to baseline. The improvement (relative to baseline) in specific energyconsumption of cement production is rather modest: 1.5% in 2010.
• The production of glass is less affected, decreasing by only 1% compared tobaseline. This drop is higher in primary glass processing (-3% from baseline),while secondary processing is unaffected. The share of recycled glass ismarginally higher than in the baseline (roughly at a level of 60%). The analysisassumes that the low-cost potential of further increase of glass recycling (on topof what is already incorporated in thye baseline scenario) is rather limitedbecause of technical limitations, the diversity of glass products and the lack ofscrap material (practically only bottles are recycled). However, depending on thestructure of the glass industry, some countries may experience higher recyclingrates (e.g. 80% in the Netherlands). The Kyoto emission reduction target is notenough to trigger significant improvements in specific energy consumption ofglass processing. The improvement is rather modest: 1.5% on top of baseline inprimary glass production, +2% in secondary glass processing.
• The production of ceramics and other non-metallic minerals decreases by lessthan 2% from baseline levels. Again, technological progress is found to bemodest (roughly 1.5% on top of the baseline scenario).
Under the Kyoto commitment, the energy intensity (ratio of energy needs over valueadded) of the sector improves in total by 3.5%, also reflecting structural changes infavour of higher value added production. Carbon emissions from energy combustion inthe sector decrease by 5 percentage points in 2010 compared to baseline (-12% from1990). Production costs in the sector increase on average by 4%.
16 Carbon emissions from non-combustion are not considered in this analysis.

17
How the sector adjusts to allow for higher emission abatement?(This section contains additional information and can be ignored if the focus is the firstcommitment period (2008-2012) of the Kyoto Protocol)
The manufacturing of some non-metallic minerals (especially cement andbasic processing of glass) is highly capital intensive and needs long lead-times for factory reconstruction.
Because energy costs are a high proportion of total production costs and acompetitive market environment, the European cement industry is veryefficient in energy terms and yet improving in the baseline scenario. Thepotential for glass recycling in the horizon to 2010 is exploited to aconsiderable extent in the baseline scenario. The energy use in theproduction of many non-metallic minerals is mainly related to kilntechnology, for which technological progress prospects are evolving slowly.For these reasons, before undergoing deep emission reduction in the sector,the system should be highly constrained in terms of carbon emissions (inother words it must be faced relatively high costs). In these cases the sectorundergoes premature replacement of capital equipment enablingconsiderable improvements in average specific energy consumption. Thetop-down analysis quantified several cases. Two are illustrated below:
• The imposition of an emission reduction target of –25% from 1990levels at the level of the whole EU energy system leads to animprovement of specific energy consumption in building materialsof more than 8% from baseline. This is the combined effect of theintroduction of advanced kiln technologies and advanced electricaltechnologies (for mixing, grinding and milling) in cement industries(specific energy consumption decreases by 6% from baseline), theuse of advanced burners in oxy-fuel process glass furnaces (specificenergy consumption decreases by 8% from baseline) and thereplacement of tunnel kilns with roller kilns in ceramics and othernon-metallic minerals production (leading to a decrease of specificenergy consumption by 6 and 8% respectively). The adoption ofthese technologies leads to an increase of average production cost of7.5%.
A global emission reduction target of –35% (from 1990) triggers, amongothers, the introduction of dual batch/cullet pre-heaters in glass processing,leading to lower energy requirements of up to 30%. Combined with thefurther penetration of other efficient technologies, specific energyconsumption of glass processing is reduced by roughly 20% from baseline.The unit production costs of non-metallic minerals increase by about 12%compared to baseline.
According to the top-down systems analysis, the potential efficiencyimprovement in non-metallic minerals production can reach up to 25%(ranging from 15% in cement production to 30% in glass production).However, in the medium term horizon of 2010, this will lead to substantialincrease of production costs (more than 20% from baseline levels) seriouslyaffecting the competitiveness of the sector.
18
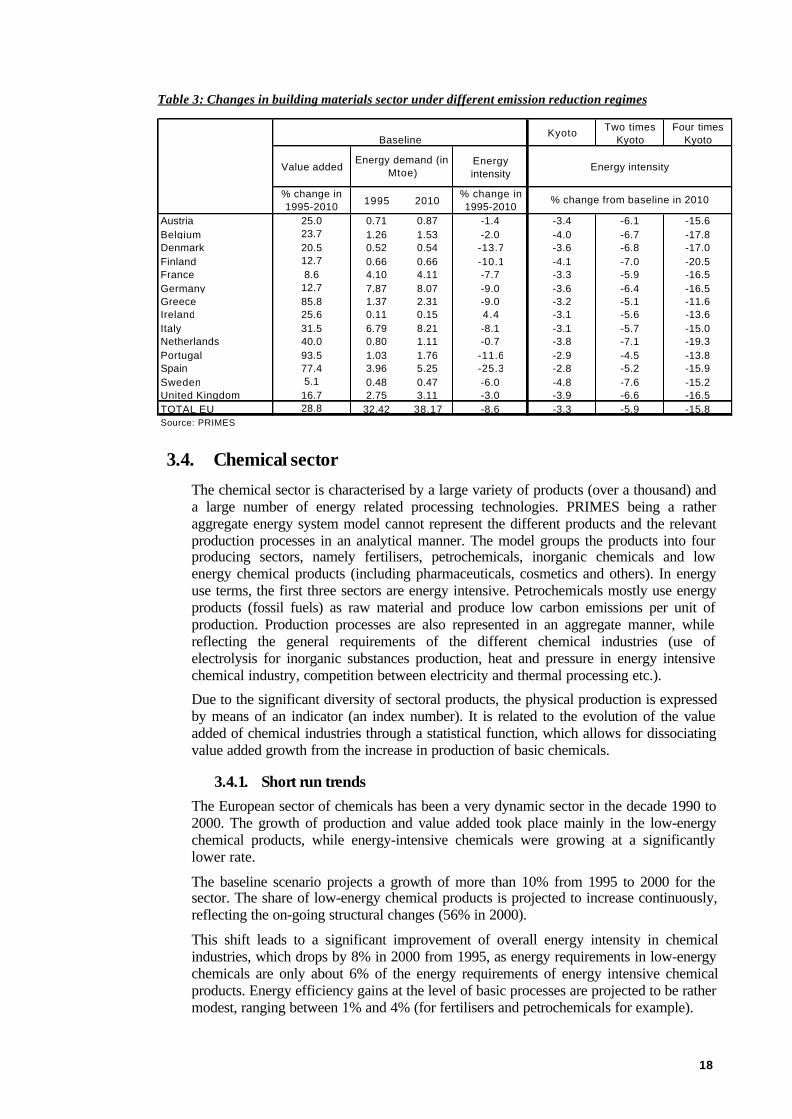
Table 3: Changes in building materials sector under different emission reduction regimes
Kyoto Two times Kyoto
Four times Kyoto
Value added Energy intensity
% change in 1995-2010 1995 2010
% change in 1995-2010
Austria 25.0 0.71 0.87 -1.4 -3.4 -6.1 -15.6Belgium 23.7 1.26 1.53 -2.0 -4.0 -6.7 -17.8Denmark 20.5 0.52 0.54 -13.7 -3.6 -6.8 -17.0Finland 12.7 0.66 0.66 -10.1 -4.1 -7.0 -20.5France 8.6 4.10 4.11 -7.7 -3.3 -5.9 -16.5Germany 12.7 7.87 8.07 -9.0 -3.6 -6.4 -16.5Greece 85.8 1.37 2.31 -9.0 -3.2 -5.1 -11.6Ireland 25.6 0.11 0.15 4.4 -3.1 -5.6 -13.6Italy 31.5 6.79 8.21 -8.1 -3.1 -5.7 -15.0Netherlands 40.0 0.80 1.11 -0.7 -3.8 -7.1 -19.3Portugal 93.5 1.03 1.76 -11.6 -2.9 -4.5 -13.8Spain 77.4 3.96 5.25 -25.3 -2.8 -5.2 -15.9Sweden 5.1 0.48 0.47 -6.0 -4.8 -7.6 -15.2United Kingdom 16.7 2.75 3.11 -3.0 -3.9 -6.6 -16.5TOTAL EU 28.8 32.42 38.17 -8.6 -3.3 -5.9 -15.8Source: PRIMES
% change from baseline in 2010
Baseline
Energy intensityEnergy demand (in
Mtoe)
3.4. Chemical sectorThe chemical sector is characterised by a large variety of products (over a thousand) anda large number of energy related processing technologies. PRIMES being a ratheraggregate energy system model cannot represent the different products and the relevantproduction processes in an analytical manner. The model groups the products into fourproducing sectors, namely fertilisers, petrochemicals, inorganic chemicals and lowenergy chemical products (including pharmaceuticals, cosmetics and others). In energyuse terms, the first three sectors are energy intensive. Petrochemicals mostly use energyproducts (fossil fuels) as raw material and produce low carbon emissions per unit ofproduction. Production processes are also represented in an aggregate manner, whilereflecting the general requirements of the different chemical industries (use ofelectrolysis for inorganic substances production, heat and pressure in energy intensivechemical industry, competition between electricity and thermal processing etc.).
Due to the significant diversity of sectoral products, the physical production is expressedby means of an indicator (an index number). It is related to the evolution of the valueadded of chemical industries through a statistical function, which allows for dissociatingvalue added growth from the increase in production of basic chemicals.
3.4.1. Short run trendsThe European sector of chemicals has been a very dynamic sector in the decade 1990 to2000. The growth of production and value added took place mainly in the low-energychemical products, while energy-intensive chemicals were growing at a significantlylower rate.
The baseline scenario projects a growth of more than 10% from 1995 to 2000 for thesector. The share of low-energy chemical products is projected to increase continuously,reflecting the on-going structural changes (56% in 2000).
This shift leads to a significant improvement of overall energy intensity in chemicalindustries, which drops by 8% in 2000 from 1995, as energy requirements in low-energychemicals are only about 6% of the energy requirements of energy intensive chemicalproducts. Energy efficiency gains at the level of basic processes are projected to be rathermodest, ranging between 1% and 4% (for fertilisers and petrochemicals for example).
19
According to EUROSTAT energy balances, energy requirements in chemical industries(excluding fuel input as raw material in the petrochemical sector) decreased by 2.3% inthe period 1995 to 1997. The PRIMES projection for the short run indicates an increaseof energy demand in chemicals by 2.5% between 1995 and 2000 primarily because thescenario assumes a recovery of growth after 1997.
3.4.2. Basic assumptions in the PRIMES baseline scenario towards 2010The key assumption in the PRIMES baseline projection to 2010 as regards chemicalsproduction is that the demand driven shift towards low-energy chemical products(pharmaceuticals, cosmetics etc.) will be further accelerated. In addition, in the context ofthe EU single market, production of energy intensive chemical products will becomeconcentrated in some major producing countries and companies. More details are givenin the following:
• The sectoral value added of the chemical sector is assumed to increase byalmost 44% from 1995 to 2010. The sector is characterised by the shift towardslow-energy chemicals production, the share of which reaches 60% in 2010 (53%in 1995).
• At the level of basic processing, the baseline scenario projects relatively modesttechnology progress in terms of specific energy consumption (energy pervolume of material). In the production of fertilisers and low-energy chemicalsthe specific energy consumption drops by 2% in 1995-2010. A relatively biggerimprovement is projected for petrochemicals (7.5%) and inorganic chemicals(4%).
The shift towards low-energy chemicals is the key factor that explains the considerableimprovement of the overall energy intensity of the sector. The ratio of energy demandper value added improves by 20% in 2010 from 1995.
3.4.3. Adjustment of the sector under the Kyoto targetThe above changes in the structure of the chemicals industry, among other factors,explain the considerable drop of carbon emissions in the sector. A drop of CO2 emissionsof roughly 20% is already observed for the period 1990 to 1997. The baseline scenarioprojects a stability of direct emissions from 2000 to 2010. Energy demand will increaseby roughly 1% per year during this period, but this is mostly covered by electricity andsteam the emissions of which are accounted for in the power and steam generation sector.
The global emission restriction to meet Kyoto commitments also drives adjustments inthe chemicals sector. The sector undergoes the following changes:
• Sectoral production decreases by 0.5% in 2010 compared to baseline. Fertilisersand inorganic chemicals decrease more than petrochemicals and low-energychemicals. Because of the significant economic restructuring of the sector infavour of low-energy products which characterises the baseline, there is littleroom for further restructuring.
• The higher penetration of heat pumps in heat processing in the chemical sectorleads to an improvement of efficiency of energy use by about 15% compared tothe baseline. Heat pumps allow for savings of electricity in the use of heat andcooling and indirectly (through the power sector) contribute to emission

20
reductions. The share of heat pumps increases to 12% from 3% in the baselinefor 2010. 17
• The specific energy consumption ratios improve roughly by 5% on top ofbaseline levels. The improvement is equally distributed across the different sub-sectors and is mainly due to the adoption of heat pumps and other electro-technologies. In addition, the introduction of pinch analytical techniques, whichoptimise heat recovery in thermal processes and allow for energy savings, leadsto an improvement of thermal processing equipment efficiency by 5%.
• The sector reduces its CO2 emissions by 15% on top of baseline reductions in2010 (-30% from 1990 levels). This result is due to the combined effect oftechnology progress and fuel shift towards electricity and steam, the emissions ofwhich are included in the power sector.
The implications on average production costs in the chemical sector are small: 2% higherthan baseline.
Table 4: Changes in the chemical sector under different emission reduction regimes
KyotoTwo times
KyotoFour times
Kyoto
Value addedEnergy intensity
% change in 1995-2010 1995 2010
% change in 1995-2010
Austria 35.2 0.55 0.61 -18.7 -2.2 -4.6 -12.9Belgium 39.3 2.53 3.15 -10.7 -5.0 -8.2 -22.8Denmark 22.0 0.27 0.28 -16.5 -5.0 -7.5 -16.0Finland 37.2 0.59 0.69 -13.9 -4.5 -6.8 -17.6France 40.0 4.60 5.29 -17.8 -2.3 -3.6 -7.4Germany 52.8 12.64 13.65 -29.3 -7.0 -10.1 -24.3Greece 37.5 0.20 0.40 46.6 -2.8 -5.5 -12.9Ireland 146.4 0.24 0.57 -4.9 -3.7 -6.7 -17.7Italy 23.6 5.46 6.02 -10.9 -3.8 -6.0 -15.3Netherlands 50.6 4.40 5.81 -12.3 -6.4 -10.2 -22.2Portugal 44.1 0.46 0.58 -13.7 -5.1 -7.5 -17.9Spain 39.3 4.00 4.87 -12.6 -5.1 -8.4 -18.7Sweden 35.6 1.01 1.09 -20.2 -1.6 -2.5 -6.8United Kingdom 43.4 4.41 5.35 -15.5 -5.3 -8.0 -19.4TOTAL EU 43.6 41.37 48.34 -18.6 -5.2 -8.0 -18.9Source: PRIMES
% change from baseline in 2010
Baseline
Energy intensityEnergy demand (in
Mtoe)
How the sector adjusts to allow for higher emission abatement?(This section contains additional information and can be ignored if the focus is the firstcommitment period (2008-2012) of the Kyoto Protocol)
There is a big range of technology possibilities that may be applied toimprove energy efficiency and save energy, in particular electricity. As aresult the sector is more responsive than other industrial sectors to theimposition of higher emission restrictions at a global scale.
A collective emission reduction effort corresponding to two-times the Kyotocommitments could trigger significant further progress in the chemical sectoras regards energy efficiency and savings. The sectoral specific energyconsumption can improve by more than 10% on top of baseline
17 According to a consultant of the Commission (Mr. Kemna –VHK) heat pumps are not seen as a cost-effective solution in the horizon of 2010. However, PRIMES model results indicate that heat pumps (and notelectrical heating equipment (i.e. simple resistance heaters) could be a cost-effective options in the context ofadjusting to the Kyoto targets.
21
improvements. This is due to the combined effect of the following: furtherpenetration of heat pumps which have large implications in terms ofefficiency gains (up to 75%); larger use of pinch analytical techniques (10%efficiency gains); penetration of improved electrical technologies mainly inreaction and separation processes (efficiency improves by 10% on top ofbaseline). These changes lead in an indirect way to considerable reduction ofcarbon emissions, via the adjustments effected in the power and steamgeneration system. The cost implications (average production cost) are rathersmall: 4.5%. The potential efficiency improvement in chemicals productioncan reach up to 25%. The corresponding change of production costs is inaverage 10% higher than baseline.
3.5. Paper and pulp productionThe manufacturing of paper requires that a fibre source (e.g. wood) is chipped, digested,bleached and then formed as slurry (pulping) from which paper is produced. Largeamounts of steam (for thermal processing) and electricity (for mechanical processing) arenecessary to debark and chip the wood, digest the wood, bleach the pulp and dry thepaper product. Use of waste paper, instead of wood, reduces energy requirementsavoiding the initial processing, which is energy-intensive.
3.5.1. Is the current PRIMES baseline still valid in relation to short runtrends?
According to the latest data available from the Confederation of European PaperIndustries (CEPI) and the European Topic Centre on Waste (ETCW) paper production inthe EU increased by about 8% between 1995 and 1997. According to PRIMESprojections under baseline assumptions, paper production involving pulp production willincrease by 11% in 2000 from 1995, which seems in accordance to latest data available.Secondary paper processing (i.e. not involving pulping) in the EU increased by 11% inthe 1995-1997 period. The corresponding figure in the PRIMES baseline for the period1995-2000 is 15%.
The shift towards secondary paper processing characterised by specific energyconsumption which is about half of that for basic paper processing (including pulping)results in an improvement of overall specific energy consumption18 (-2% in 2000 from1995 levels) while for the same period technological progress at the process level hasbeen rather limited.
According to EUROSTAT energy balance sheet data19, energy demand in the paper andpulp industry increased by 4.5% in 1995-1997. According to PRIMES projections energydemand in paper and pulp production will increase by 9.5% between 1995 and 2000under baseline assumptions.
18 CEPI recommends that energy requirements be considered according to the pulping processconsidered and the required final product characteristics, since the pulp and paper sector is nothomogeneous as regards energy consumption.19 CEPI highlights that the principle of allocating on-site emissions resulting from steam and electricityproduction to the energy sector is not consistent with the IPCC guidelines, which provide a commonframework for the assessment of GHG emissions and facilitates comparison between studies. In particular,the emissions of industrial CHP are allocated differently in EUROSTAT energy balances and in the NationalCommunications. Further, it should be noted that the paper and pulp numbers also include the emissionsfrom printing industry.
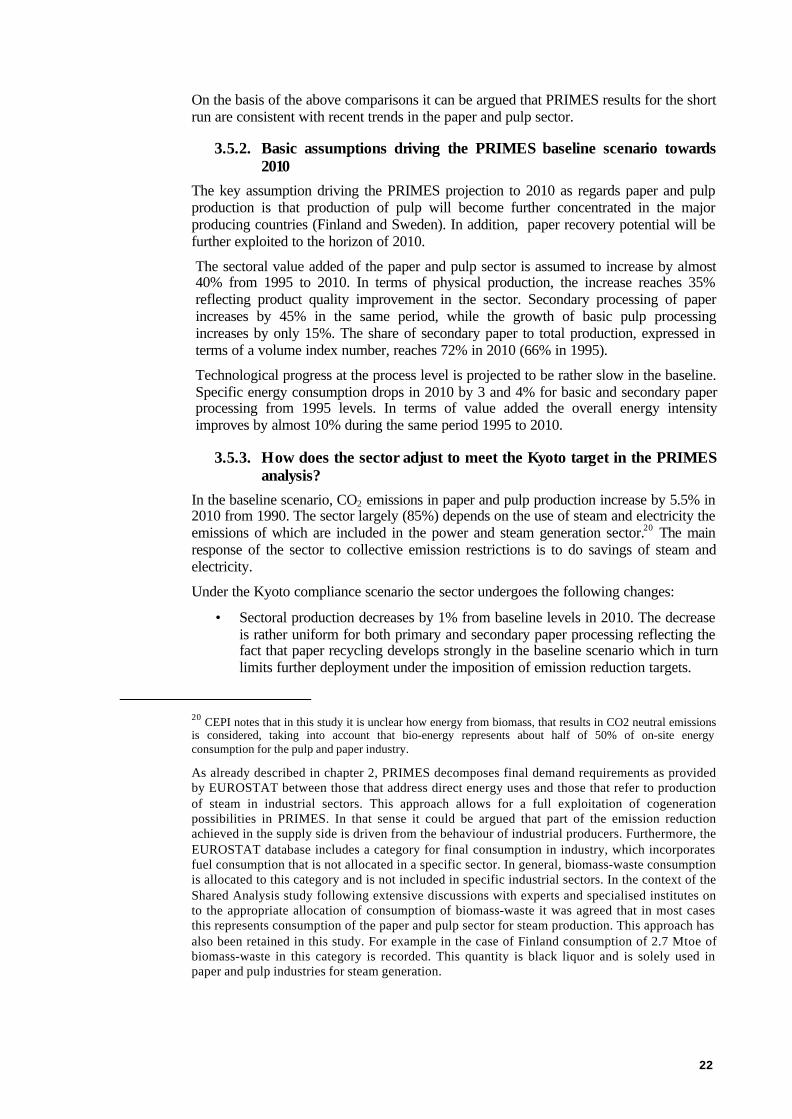
22
On the basis of the above comparisons it can be argued that PRIMES results for the shortrun are consistent with recent trends in the paper and pulp sector.
3.5.2. Basic assumptions driving the PRIMES baseline scenario towards2010
The key assumption driving the PRIMES projection to 2010 as regards paper and pulpproduction is that production of pulp will become further concentrated in the majorproducing countries (Finland and Sweden). In addition, paper recovery potential will befurther exploited to the horizon of 2010.
The sectoral value added of the paper and pulp sector is assumed to increase by almost40% from 1995 to 2010. In terms of physical production, the increase reaches 35%reflecting product quality improvement in the sector. Secondary processing of paperincreases by 45% in the same period, while the growth of basic pulp processingincreases by only 15%. The share of secondary paper to total production, expressed interms of a volume index number, reaches 72% in 2010 (66% in 1995).
Technological progress at the process level is projected to be rather slow in the baseline.Specific energy consumption drops in 2010 by 3 and 4% for basic and secondary paperprocessing from 1995 levels. In terms of value added the overall energy intensityimproves by almost 10% during the same period 1995 to 2010.
3.5.3. How does the sector adjust to meet the Kyoto target in the PRIMESanalysis?
In the baseline scenario, CO2 emissions in paper and pulp production increase by 5.5% in2010 from 1990. The sector largely (85%) depends on the use of steam and electricity theemissions of which are included in the power and steam generation sector.20 The mainresponse of the sector to collective emission restrictions is to do savings of steam andelectricity.
Under the Kyoto compliance scenario the sector undergoes the following changes:
• Sectoral production decreases by 1% from baseline levels in 2010. The decreaseis rather uniform for both primary and secondary paper processing reflecting thefact that paper recycling develops strongly in the baseline scenario which in turnlimits further deployment under the imposition of emission reduction targets.
20 CEPI notes that in this study it is unclear how energy from biomass, that results in CO2 neutral emissionsis considered, taking into account that bio-energy represents about half of 50% of on-site energyconsumption for the pulp and paper industry.
As already described in chapter 2, PRIMES decomposes final demand requirements as providedby EUROSTAT between those that address direct energy uses and those that refer to productionof steam in industrial sectors. This approach allows for a full exploitation of cogenerationpossibilities in PRIMES. In that sense it could be argued that part of the emission reductionachieved in the supply side is driven from the behaviour of industrial producers. Furthermore, theEUROSTAT database includes a category for final consumption in industry, which incorporatesfuel consumption that is not allocated in a specific sector. In general, biomass-waste consumptionis allocated to this category and is not included in specific industrial sectors. In the context of theShared Analysis study following extensive discussions with experts and specialised institutes onto the appropriate allocation of consumption of biomass-waste it was agreed that in most casesthis represents consumption of the paper and pulp sector for steam production. This approach hasalso been retained in this study. For example in the case of Finland consumption of 2.7 Mtoe ofbiomass-waste in this category is recorded. This quantity is black liquor and is solely used inpaper and pulp industries for steam generation.
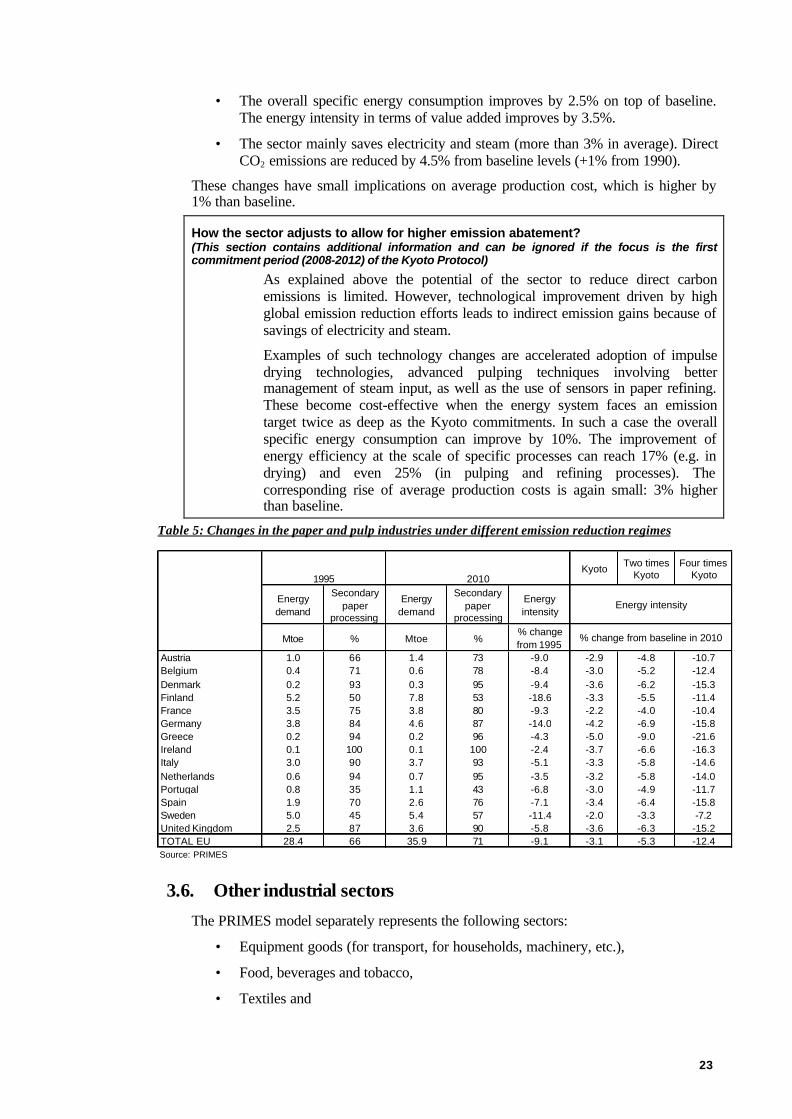
23
• The overall specific energy consumption improves by 2.5% on top of baseline.The energy intensity in terms of value added improves by 3.5%.
• The sector mainly saves electricity and steam (more than 3% in average). DirectCO2 emissions are reduced by 4.5% from baseline levels (+1% from 1990).
These changes have small implications on average production cost, which is higher by1% than baseline.
How the sector adjusts to allow for higher emission abatement?(This section contains additional information and can be ignored if the focus is the firstcommitment period (2008-2012) of the Kyoto Protocol)
As explained above the potential of the sector to reduce direct carbonemissions is limited. However, technological improvement driven by highglobal emission reduction efforts leads to indirect emission gains because ofsavings of electricity and steam.
Examples of such technology changes are accelerated adoption of impulsedrying technologies, advanced pulping techniques involving bettermanagement of steam input, as well as the use of sensors in paper refining.These become cost-effective when the energy system faces an emissiontarget twice as deep as the Kyoto commitments. In such a case the overallspecific energy consumption can improve by 10%. The improvement ofenergy efficiency at the scale of specific processes can reach 17% (e.g. indrying) and even 25% (in pulping and refining processes). Thecorresponding rise of average production costs is again small: 3% higherthan baseline.
Table 5: Changes in the paper and pulp industries under different emission reduction regimes
Kyoto Two times Kyoto
Four times Kyoto
Energy demand
Secondary paper
processing
Energy demand
Secondary paper
processing
Energy intensity
Mtoe % Mtoe %% change from 1995
Austria 1.0 66 1.4 73 -9.0 -2.9 -4.8 -10.7Belgium 0.4 71 0.6 78 -8.4 -3.0 -5.2 -12.4Denmark 0.2 93 0.3 95 -9.4 -3.6 -6.2 -15.3Finland 5.2 50 7.8 53 -18.6 -3.3 -5.5 -11.4France 3.5 75 3.8 80 -9.3 -2.2 -4.0 -10.4Germany 3.8 84 4.6 87 -14.0 -4.2 -6.9 -15.8Greece 0.2 94 0.2 96 -4.3 -5.0 -9.0 -21.6Ireland 0.1 100 0.1 100 -2.4 -3.7 -6.6 -16.3Italy 3.0 90 3.7 93 -5.1 -3.3 -5.8 -14.6Netherlands 0.6 94 0.7 95 -3.5 -3.2 -5.8 -14.0Portugal 0.8 35 1.1 43 -6.8 -3.0 -4.9 -11.7Spain 1.9 70 2.6 76 -7.1 -3.4 -6.4 -15.8Sweden 5.0 45 5.4 57 -11.4 -2.0 -3.3 -7.2United Kingdom 2.5 87 3.6 90 -5.8 -3.6 -6.3 -15.2TOTAL EU 28.4 66 35.9 71 -9.1 -3.1 -5.3 -12.4Source: PRIMES
Energy intensity
% change from baseline in 2010
1995 2010
3.6. Other industrial sectorsThe PRIMES model separately represents the following sectors:
• Equipment goods (for transport, for households, machinery, etc.),
• Food, beverages and tobacco,
• Textiles and
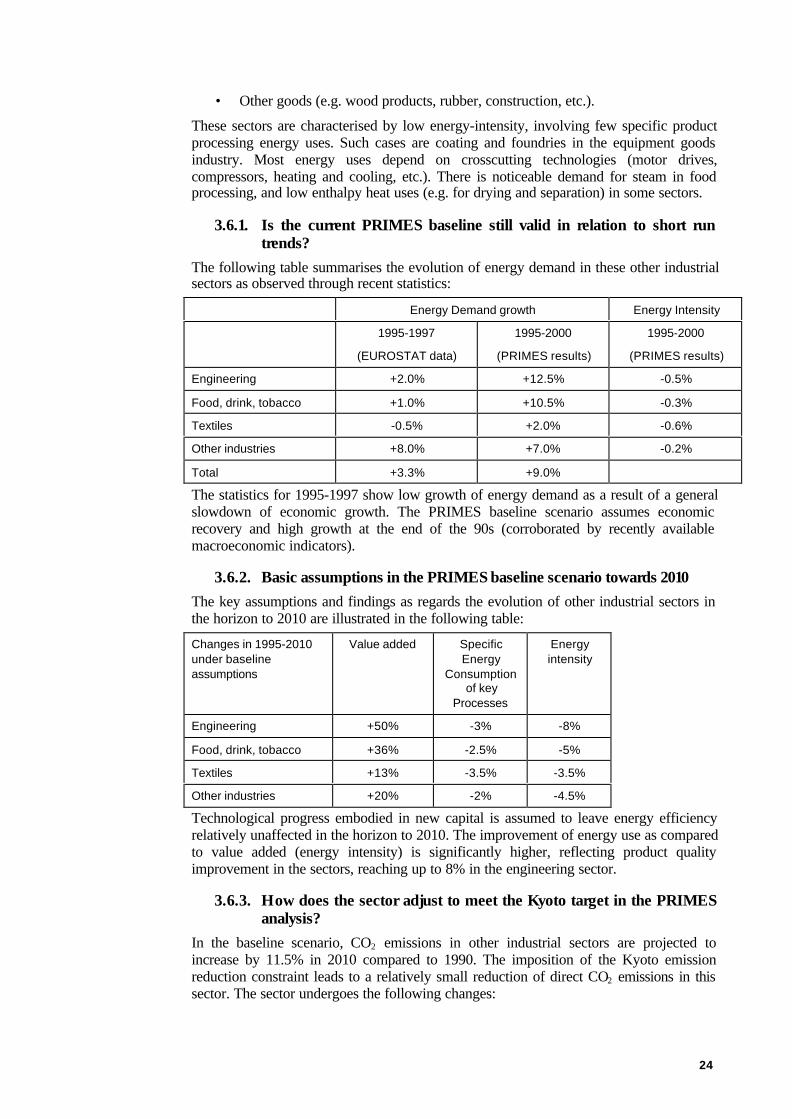
24
• Other goods (e.g. wood products, rubber, construction, etc.).
These sectors are characterised by low energy-intensity, involving few specific productprocessing energy uses. Such cases are coating and foundries in the equipment goodsindustry. Most energy uses depend on crosscutting technologies (motor drives,compressors, heating and cooling, etc.). There is noticeable demand for steam in foodprocessing, and low enthalpy heat uses (e.g. for drying and separation) in some sectors.
3.6.1. Is the current PRIMES baseline still valid in relation to short runtrends?
The following table summarises the evolution of energy demand in these other industrialsectors as observed through recent statistics:
Energy Demand growth Energy Intensity
1995-1997
(EUROSTAT data)
1995-2000
(PRIMES results)
1995-2000
(PRIMES results)
Engineering +2.0% +12.5% -0.5%
Food, drink, tobacco +1.0% +10.5% -0.3%
Textiles -0.5% +2.0% -0.6%
Other industries +8.0% +7.0% -0.2%
Total +3.3% +9.0%
The statistics for 1995-1997 show low growth of energy demand as a result of a generalslowdown of economic growth. The PRIMES baseline scenario assumes economicrecovery and high growth at the end of the 90s (corroborated by recently availablemacroeconomic indicators).
3.6.2. Basic assumptions in the PRIMES baseline scenario towards 2010The key assumptions and findings as regards the evolution of other industrial sectors inthe horizon to 2010 are illustrated in the following table:
Changes in 1995-2010under baselineassumptions
Value added SpecificEnergy
Consumptionof key
Processes
Energyintensity
Engineering +50% -3% -8%
Food, drink, tobacco +36% -2.5% -5%
Textiles +13% -3.5% -3.5%
Other industries +20% -2% -4.5%
Technological progress embodied in new capital is assumed to leave energy efficiencyrelatively unaffected in the horizon to 2010. The improvement of energy use as comparedto value added (energy intensity) is significantly higher, reflecting product qualityimprovement in the sectors, reaching up to 8% in the engineering sector.
3.6.3. How does the sector adjust to meet the Kyoto target in the PRIMESanalysis?
In the baseline scenario, CO2 emissions in other industrial sectors are projected toincrease by 11.5% in 2010 compared to 1990. The imposition of the Kyoto emissionreduction constraint leads to a relatively small reduction of direct CO2 emissions in thissector. The sector undergoes the following changes:
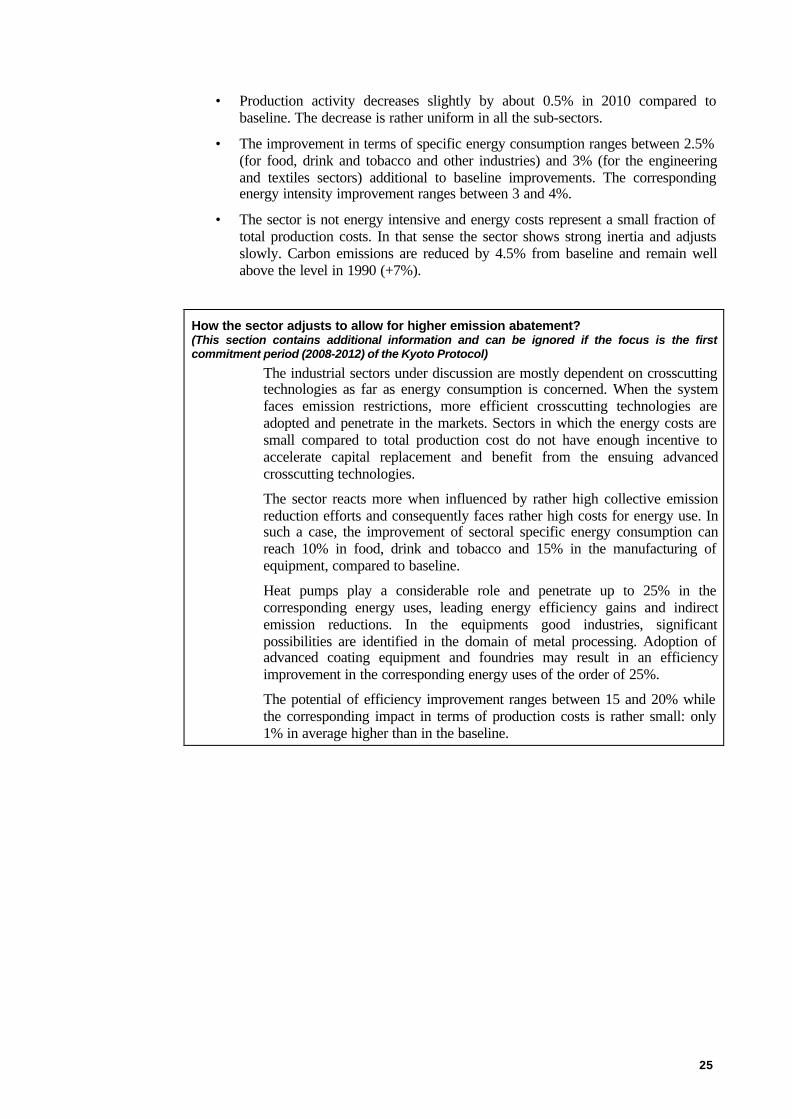
25
• Production activity decreases slightly by about 0.5% in 2010 compared tobaseline. The decrease is rather uniform in all the sub-sectors.
• The improvement in terms of specific energy consumption ranges between 2.5%(for food, drink and tobacco and other industries) and 3% (for the engineeringand textiles sectors) additional to baseline improvements. The correspondingenergy intensity improvement ranges between 3 and 4%.
• The sector is not energy intensive and energy costs represent a small fraction oftotal production costs. In that sense the sector shows strong inertia and adjustsslowly. Carbon emissions are reduced by 4.5% from baseline and remain wellabove the level in 1990 (+7%).
How the sector adjusts to allow for higher emission abatement?(This section contains additional information and can be ignored if the focus is the firstcommitment period (2008-2012) of the Kyoto Protocol)
The industrial sectors under discussion are mostly dependent on crosscuttingtechnologies as far as energy consumption is concerned. When the systemfaces emission restrictions, more efficient crosscutting technologies areadopted and penetrate in the markets. Sectors in which the energy costs aresmall compared to total production cost do not have enough incentive toaccelerate capital replacement and benefit from the ensuing advancedcrosscutting technologies.
The sector reacts more when influenced by rather high collective emissionreduction efforts and consequently faces rather high costs for energy use. Insuch a case, the improvement of sectoral specific energy consumption canreach 10% in food, drink and tobacco and 15% in the manufacturing ofequipment, compared to baseline.
Heat pumps play a considerable role and penetrate up to 25% in thecorresponding energy uses, leading energy efficiency gains and indirectemission reductions. In the equipments good industries, significantpossibilities are identified in the domain of metal processing. Adoption ofadvanced coating equipment and foundries may result in an efficiencyimprovement in the corresponding energy uses of the order of 25%.
The potential of efficiency improvement ranges between 15 and 20% whilethe corresponding impact in terms of production costs is rather small: only1% in average higher than in the baseline.
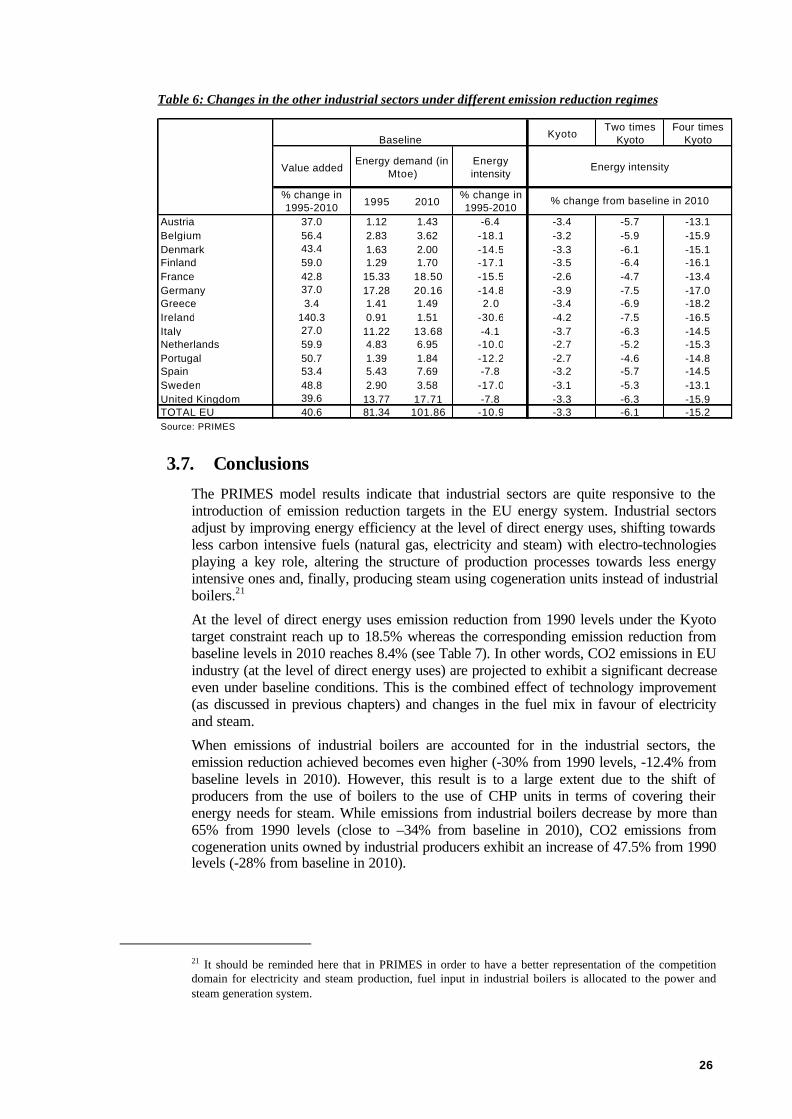
26
Table 6: Changes in the other industrial sectors under different emission reduction regimes
KyotoTwo times
KyotoFour times
Kyoto
Value addedEnergy intensity
% change in 1995-2010 1995 2010
% change in 1995-2010
Austria 37.0 1.12 1.43 -6.4 -3.4 -5.7 -13.1Belgium 56.4 2.83 3.62 -18.1 -3.2 -5.9 -15.9Denmark 43.4 1.63 2.00 -14.5 -3.3 -6.1 -15.1Finland 59.0 1.29 1.70 -17.1 -3.5 -6.4 -16.1France 42.8 15.33 18.50 -15.5 -2.6 -4.7 -13.4Germany 37.0 17.28 20.16 -14.8 -3.9 -7.5 -17.0Greece 3.4 1.41 1.49 2.0 -3.4 -6.9 -18.2Ireland 140.3 0.91 1.51 -30.6 -4.2 -7.5 -16.5Italy 27.0 11.22 13.68 -4.1 -3.7 -6.3 -14.5Netherlands 59.9 4.83 6.95 -10.0 -2.7 -5.2 -15.3Portugal 50.7 1.39 1.84 -12.2 -2.7 -4.6 -14.8Spain 53.4 5.43 7.69 -7.8 -3.2 -5.7 -14.5Sweden 48.8 2.90 3.58 -17.0 -3.1 -5.3 -13.1United Kingdom 39.6 13.77 17.71 -7.8 -3.3 -6.3 -15.9TOTAL EU 40.6 81.34 101.86 -10.9 -3.3 -6.1 -15.2Source: PRIMES
% change from baseline in 2010
Baseline
Energy intensityEnergy demand (in Mtoe)
3.7. ConclusionsThe PRIMES model results indicate that industrial sectors are quite responsive to theintroduction of emission reduction targets in the EU energy system. Industrial sectorsadjust by improving energy efficiency at the level of direct energy uses, shifting towardsless carbon intensive fuels (natural gas, electricity and steam) with electro-technologiesplaying a key role, altering the structure of production processes towards less energyintensive ones and, finally, producing steam using cogeneration units instead of industrialboilers.21
At the level of direct energy uses emission reduction from 1990 levels under the Kyototarget constraint reach up to 18.5% whereas the corresponding emission reduction frombaseline levels in 2010 reaches 8.4% (see Table 7). In other words, CO2 emissions in EUindustry (at the level of direct energy uses) are projected to exhibit a significant decreaseeven under baseline conditions. This is the combined effect of technology improvement(as discussed in previous chapters) and changes in the fuel mix in favour of electricityand steam.
When emissions of industrial boilers are accounted for in the industrial sectors, theemission reduction achieved becomes even higher (-30% from 1990 levels, -12.4% frombaseline levels in 2010). However, this result is to a large extent due to the shift ofproducers from the use of boilers to the use of CHP units in terms of covering theirenergy needs for steam. While emissions from industrial boilers decrease by more than65% from 1990 levels (close to –34% from baseline in 2010), CO2 emissions fromcogeneration units owned by industrial producers exhibit an increase of 47.5% from 1990levels (-28% from baseline in 2010).
21 It should be reminded here that in PRIMES in order to have a better representation of the competitiondomain for electricity and steam production, fuel input in industrial boilers is allocated to the power andsteam generation system.
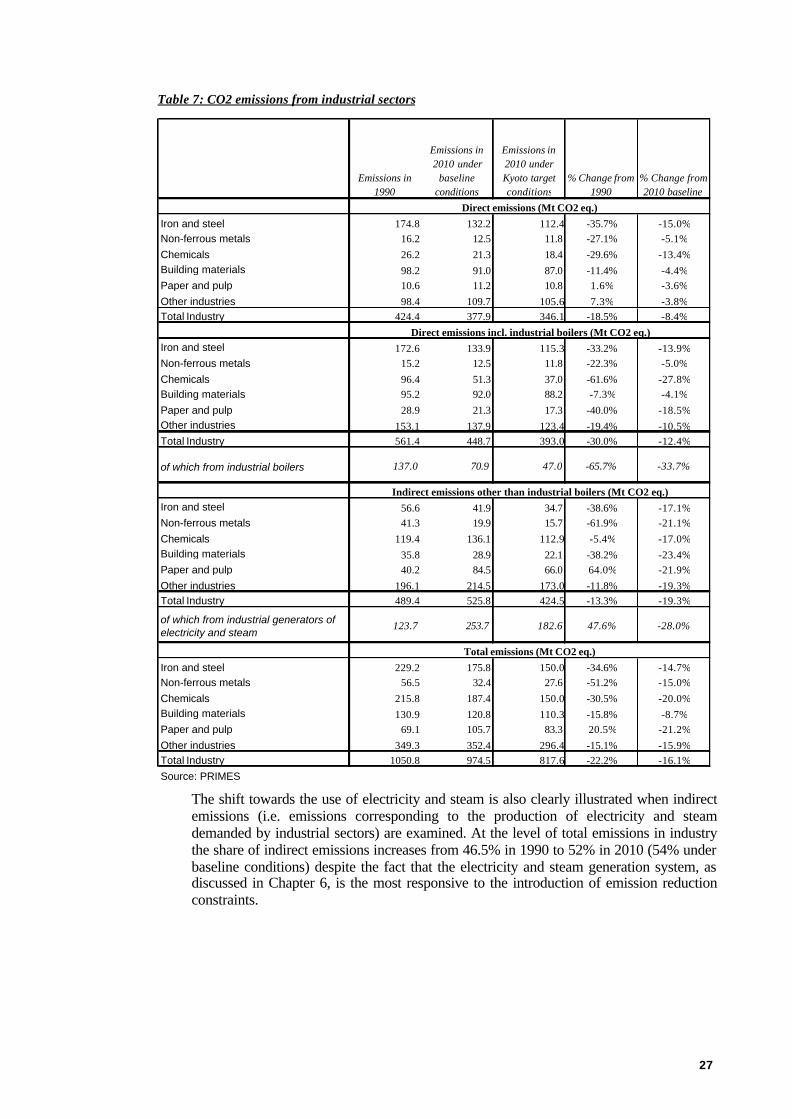
27
Table 7: CO2 emissions from industrial sectors
Emissions in 1990
Emissions in 2010 under
baseline conditions
Emissions in 2010 under Kyoto target conditions
% Change from 1990
% Change from 2010 baseline
Iron and steel 174.8 132.2 112.4 -35.7% -15.0%Non-ferrous metals 16.2 12.5 11.8 -27.1% -5.1%Chemicals 26.2 21.3 18.4 -29.6% -13.4%Building materials 98.2 91.0 87.0 -11.4% -4.4%Paper and pulp 10.6 11.2 10.8 1.6% -3.6%Other industries 98.4 109.7 105.6 7.3% -3.8%Total Industry 424.4 377.9 346.1 -18.5% -8.4%
Iron and steel 172.6 133.9 115.3 -33.2% -13.9%Non-ferrous metals 15.2 12.5 11.8 -22.3% -5.0%Chemicals 96.4 51.3 37.0 -61.6% -27.8%Building materials 95.2 92.0 88.2 -7.3% -4.1%Paper and pulp 28.9 21.3 17.3 -40.0% -18.5%Other industries 153.1 137.9 123.4 -19.4% -10.5%Total Industry 561.4 448.7 393.0 -30.0% -12.4%
of which from industrial boilers 137.0 70.9 47.0 -65.7% -33.7%
Iron and steel 56.6 41.9 34.7 -38.6% -17.1%Non-ferrous metals 41.3 19.9 15.7 -61.9% -21.1%Chemicals 119.4 136.1 112.9 -5.4% -17.0%Building materials 35.8 28.9 22.1 -38.2% -23.4%Paper and pulp 40.2 84.5 66.0 64.0% -21.9%Other industries 196.1 214.5 173.0 -11.8% -19.3%Total Industry 489.4 525.8 424.5 -13.3% -19.3%
of which from industrial generators of electricity and steam
123.7 253.7 182.6 47.6% -28.0%
Iron and steel 229.2 175.8 150.0 -34.6% -14.7%Non-ferrous metals 56.5 32.4 27.6 -51.2% -15.0%Chemicals 215.8 187.4 150.0 -30.5% -20.0%Building materials 130.9 120.8 110.3 -15.8% -8.7%Paper and pulp 69.1 105.7 83.3 20.5% -21.2%Other industries 349.3 352.4 296.4 -15.1% -15.9%Total Industry 1050.8 974.5 817.6 -22.2% -16.1%Source: PRIMES
Total emissions (Mt CO2 eq.)
Direct emissions (Mt CO2 eq.)
Direct emissions incl. industrial boilers (Mt CO2 eq.)
Indirect emissions other than industrial boilers (Mt CO2 eq.)
The shift towards the use of electricity and steam is also clearly illustrated when indirectemissions (i.e. emissions corresponding to the production of electricity and steamdemanded by industrial sectors) are examined. At the level of total emissions in industrythe share of indirect emissions increases from 46.5% in 1990 to 52% in 2010 (54% underbaseline conditions) despite the fact that the electricity and steam generation system, asdiscussed in Chapter 6, is the most responsive to the introduction of emission reductionconstraints.
28
4. Reduction of CO2 from Private and Public Services,Households and AgricultureThe structure of energy demand in private and public services as well as households isquite similar because the bulk of energy consumption takes place in buildings (like officeblocks, hospitals, schools, dwellings etc) and for the same reasons, namely heating,cooling, cooking, lighting and the use of appliances. There are important statisticalproblems regarding the split of energy consumption in these sectors. The energy balancesusually determine energy consumption in the domestic sector as a difference betweentotal supply and the demand in industry and transport. Data to split between services,households, etc. are even more problematic.
In recent years, EUROSTAT and the national statistical services made a substantial effortto improve on this issue and determined such a split on the basis of several cross-sectional surveys about energy consumption carried out in Member States. The surveysfor households have taken place twice, and are more reliable. The survey on the tertiarysector has not finished yet. PRIMES has used these surveys as much as possible, togetherwith national data and other information (e.g. MURE, IKARUS, ODYSSEE data bases).Nevertheless the statistical basis, especially regarding the split in sub-sectors, remainspoor. Consequently, many of the detailed numbers presented below both for the past andfuture energy uses should be seen as indicative of actual trends rather than as precise dataand forecasts.
The technologies determining energy efficiency in services and households areeffectively the same. However, differences in terms of energy related equipment size,especially for heating and cooling purposes, results in significant differences as regardsconsumers’ behaviour. The average size of this equipment for a government building oran office block is likely to be significantly larger than that for a dwelling. Consequently,technologies that facilitate economies of scale in energy use are much more likely to beadopted by the services sector than by households. In addition, decisions to invest inenergy efficiency are taken by firms in the tertiary sector and by individual people (orhouse builders) in the households sectors. Their perception of capital costs andopportunity costs of capital naturally differ, in a way that investment in efficiency iseasier to be adopted by firms than by individuals.
4.1. Tertiary sector (Private and public services, Agriculture)
4.1.1. Is the current PRIMES baseline still valid in relation to short runtrends?
The current baseline scenario for the years 1995 to 2000 is compared to the revisedenergy balance sheets of EUROSTAT, latest data available for 1997. Table 8 shows thiscomparison.
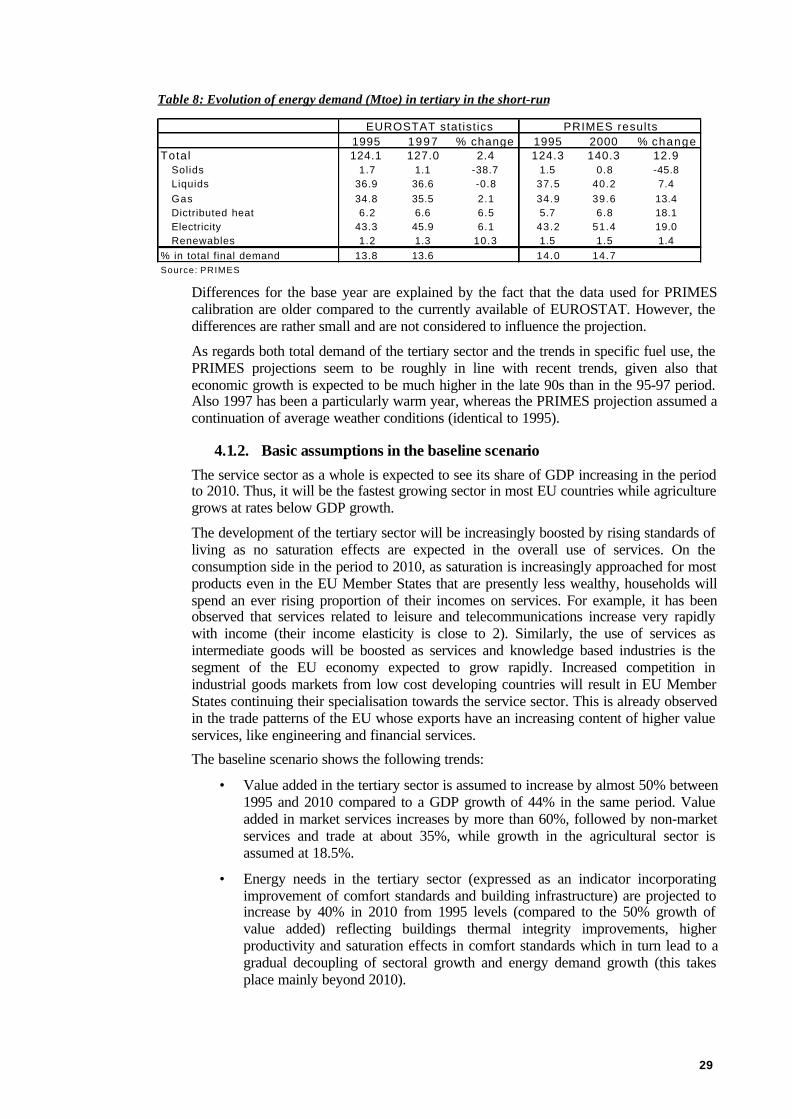
29
Table 8: Evolution of energy demand (Mtoe) in tertiary in the short-run
1995 1997 % change 1995 2000 % changeTotal 124.1 127.0 2.4 124.3 140.3 12.9
Solids 1.7 1.1 -38.7 1.5 0.8 -45.8Liquids 36.9 36.6 -0.8 37.5 40.2 7.4Gas 34.8 35.5 2.1 34.9 39.6 13.4Dictributed heat 6.2 6.6 6.5 5.7 6.8 18.1Electricity 43.3 45.9 6.1 43.2 51.4 19.0Renewables 1.2 1.3 10.3 1.5 1.5 1.4
% in total final demand 13.8 13.6 14.0 14.7Source: PRIMES
EUROSTAT statist ics PRIMES results
Differences for the base year are explained by the fact that the data used for PRIMEScalibration are older compared to the currently available of EUROSTAT. However, thedifferences are rather small and are not considered to influence the projection.
As regards both total demand of the tertiary sector and the trends in specific fuel use, thePRIMES projections seem to be roughly in line with recent trends, given also thateconomic growth is expected to be much higher in the late 90s than in the 95-97 period.Also 1997 has been a particularly warm year, whereas the PRIMES projection assumed acontinuation of average weather conditions (identical to 1995).
4.1.2. Basic assumptions in the baseline scenarioThe service sector as a whole is expected to see its share of GDP increasing in the periodto 2010. Thus, it will be the fastest growing sector in most EU countries while agriculturegrows at rates below GDP growth.
The development of the tertiary sector will be increasingly boosted by rising standards ofliving as no saturation effects are expected in the overall use of services. On theconsumption side in the period to 2010, as saturation is increasingly approached for mostproducts even in the EU Member States that are presently less wealthy, households willspend an ever rising proportion of their incomes on services. For example, it has beenobserved that services related to leisure and telecommunications increase very rapidlywith income (their income elasticity is close to 2). Similarly, the use of services asintermediate goods will be boosted as services and knowledge based industries is thesegment of the EU economy expected to grow rapidly. Increased competition inindustrial goods markets from low cost developing countries will result in EU MemberStates continuing their specialisation towards the service sector. This is already observedin the trade patterns of the EU whose exports have an increasing content of higher valueservices, like engineering and financial services.
The baseline scenario shows the following trends:
• Value added in the tertiary sector is assumed to increase by almost 50% between1995 and 2010 compared to a GDP growth of 44% in the same period. Valueadded in market services increases by more than 60%, followed by non-marketservices and trade at about 35%, while growth in the agricultural sector isassumed at 18.5%.
• Energy needs in the tertiary sector (expressed as an indicator incorporatingimprovement of comfort standards and building infrastructure) are projected toincrease by 40% in 2010 from 1995 levels (compared to the 50% growth ofvalue added) reflecting buildings thermal integrity improvements, higherproductivity and saturation effects in comfort standards which in turn lead to agradual decoupling of sectoral growth and energy demand growth (this takesplace mainly beyond 2010).
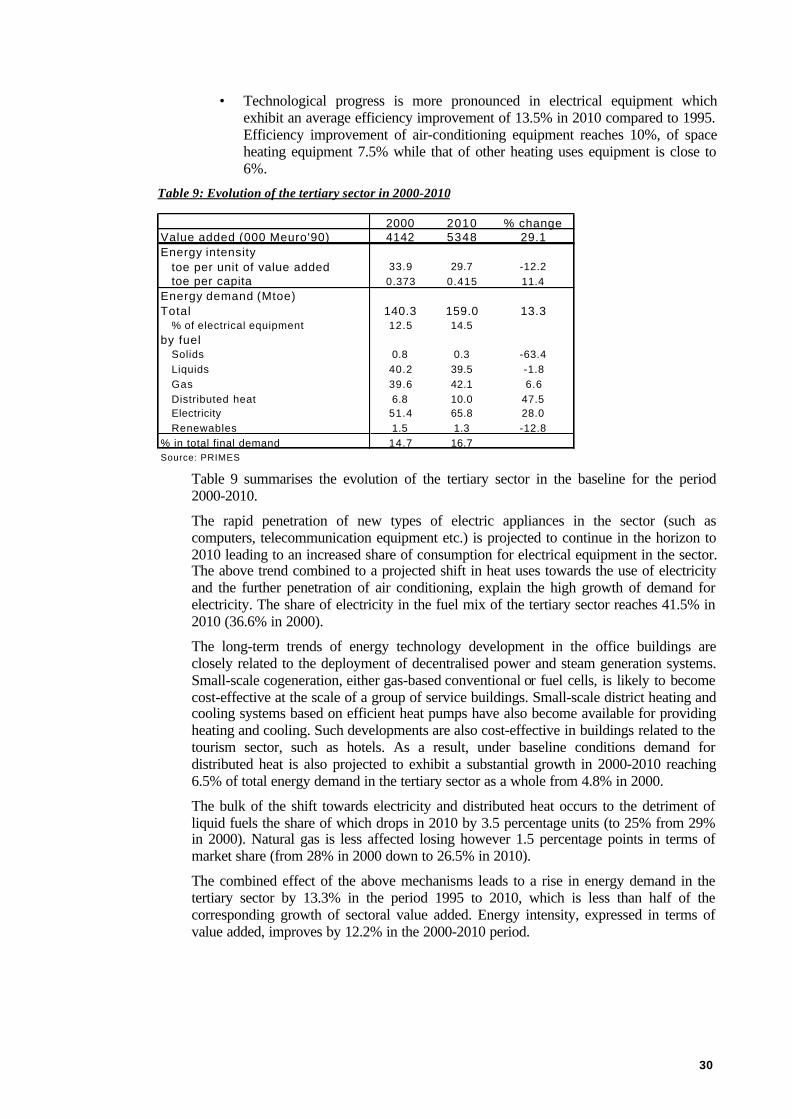
30
• Technological progress is more pronounced in electrical equipment whichexhibit an average efficiency improvement of 13.5% in 2010 compared to 1995.Efficiency improvement of air-conditioning equipment reaches 10%, of spaceheating equipment 7.5% while that of other heating uses equipment is close to6%.
Table 9: Evolution of the tertiary sector in 2000-2010
2000 2010 % changeValue added (000 Meuro'90) 4142 5348 29.1Energy intensity
toe per unit of value added 33.9 29.7 -12.2toe per capita 0.373 0.415 11.4
Energy demand (Mtoe)Total 140.3 159.0 13.3
% of electrical equipment 12.5 14.5by fuel
Solids 0.8 0.3 -63.4Liquids 40.2 39.5 -1.8Gas 39.6 42.1 6.6Distributed heat 6.8 10.0 47.5Electricity 51.4 65.8 28.0Renewables 1.5 1.3 -12.8
% in total final demand 14.7 16.7Source: PRIMES
Table 9 summarises the evolution of the tertiary sector in the baseline for the period2000-2010.
The rapid penetration of new types of electric appliances in the sector (such ascomputers, telecommunication equipment etc.) is projected to continue in the horizon to2010 leading to an increased share of consumption for electrical equipment in the sector.The above trend combined to a projected shift in heat uses towards the use of electricityand the further penetration of air conditioning, explain the high growth of demand forelectricity. The share of electricity in the fuel mix of the tertiary sector reaches 41.5% in2010 (36.6% in 2000).
The long-term trends of energy technology development in the office buildings areclosely related to the deployment of decentralised power and steam generation systems.Small-scale cogeneration, either gas-based conventional or fuel cells, is likely to becomecost-effective at the scale of a group of service buildings. Small-scale district heating andcooling systems based on efficient heat pumps have also become available for providingheating and cooling. Such developments are also cost-effective in buildings related to thetourism sector, such as hotels. As a result, under baseline conditions demand fordistributed heat is also projected to exhibit a substantial growth in 2000-2010 reaching6.5% of total energy demand in the tertiary sector as a whole from 4.8% in 2000.
The bulk of the shift towards electricity and distributed heat occurs to the detriment ofliquid fuels the share of which drops in 2010 by 3.5 percentage units (to 25% from 29%in 2000). Natural gas is less affected losing however 1.5 percentage points in terms ofmarket share (from 28% in 2000 down to 26.5% in 2010).
The combined effect of the above mechanisms leads to a rise in energy demand in thetertiary sector by 13.3% in the period 1995 to 2010, which is less than half of thecorresponding growth of sectoral value added. Energy intensity, expressed in terms ofvalue added, improves by 12.2% in the 2000-2010 period.

31
4.1.3. How does the sector adjust to meet the Kyoto target in the PRIMESanalysis?
Following the significant growth of energy demand in the tertiary sector, as projected inthe PRIMES baseline CO2 emissions are also projected to increase. They rise by 14.5%from 1990 to 2010. The carbon intensity, given the shift in favour of electricity anddistributed heat (for which emissions are included in the supply side) shows a spectacularimprovement in the period 1995 to 2010.
The systems analysis of the Kyoto commitments shows that the tertiary sector mayundertake emission reduction in priority because it seems to be one of the mostresponsive sectors to emission restrictions. There are two factors that may explain thisfinding: first in the tertiary sector energy is a luxury good, certainly related to comfort sorelatively high responsiveness should be expected if energy prices start risingsignificantly (because of emission charges, for example); second, the energy equipmentand the buildings are of a sufficient size to profit from economies of scale thusfacilitating the acceptability of measures that may have longer pay-back times thanacceptable by individual consumers. The prospects about the development of energyservice companies also strengthen the above arguments.
Under the collective effort to meet the Kyoto commitments, the analysis with PRIMESforecasts that the tertiary sector will undergo the following changes:
• The improvement of the thermal integrity of buildings, the reconsideration ofcomfort standards and the more rational use of energy lead to a decrease of totalenergy needs up to 5% from baseline. About half of this change is due toimprovements in thermal integrity. Since the stock of buildings has a very slowturnover, the improvement that is taking place mainly in new constructions willshow up in the longer term.
• Efficiency improvement in electrical equipment can reach up to 40% on top ofbaseline gains. The introduction of high efficiency standards for lighting intertiary sector buildings is one example of this type of improvement.
• Heating and cooling equipment in the tertiary sector can also obtain significantefficiency gains (15% better than in baseline). Further adoption of electricheating equipment (including heat pumps) is the key driver for this achievement.It is expected that 30% of energy needs in space heating can be converted toelectric heating equipment under a Kyoto emission restriction.
• Technology progress in other heating uses (water heating etc.) and airconditioning equipment is less significant (6 and 5% on top of baseline in 2010).
The share of electricity in total demand in the tertiary sector therefore increases andreaches 46.5% (from 41.5% in the baseline) displacing liquid fuels and natural gas in thedirect energy uses. The overall energy intensity of the tertiary sector improves by 14% inaddition to the significant progress observed in the baseline.
As a result of the above changes, CO2 emissions in the tertiary sector decrease by morethan 24% in 2010 compared to baseline levels (-13% from 1990 levels). The energyrelated costs for the service sectors increase by 12%, which however imply a very smallincrease in total production costs for the sector.
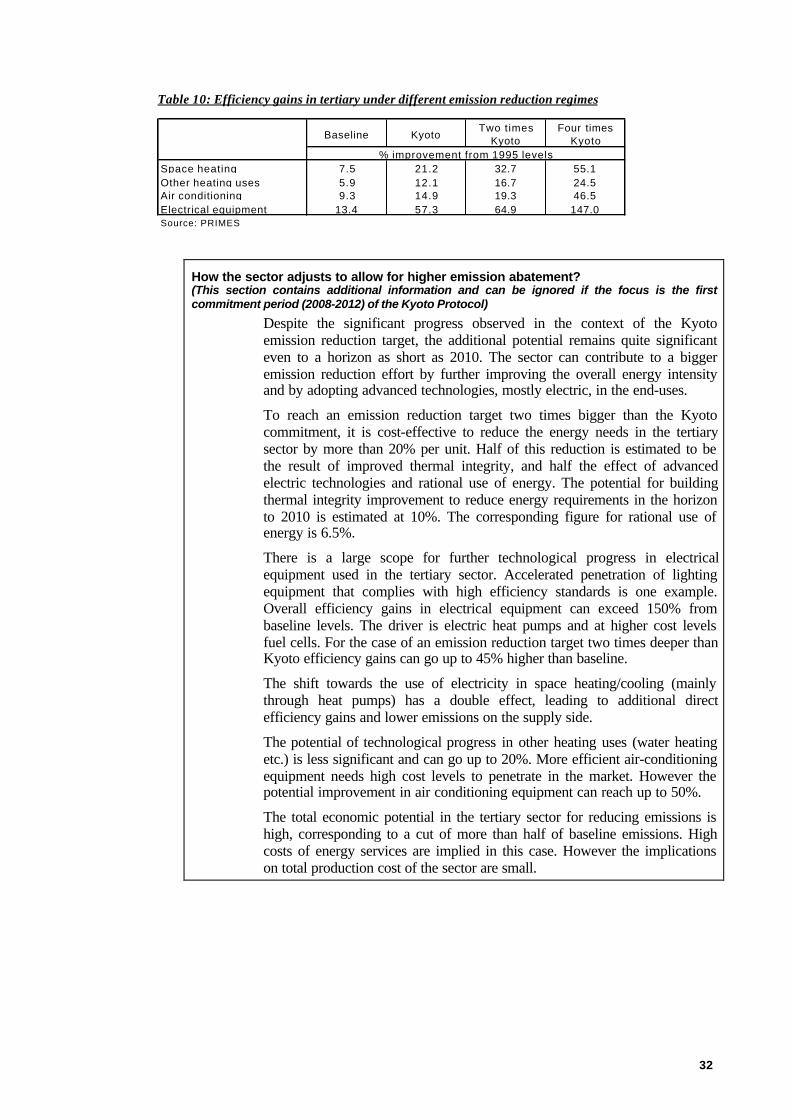
32
Table 10: Efficiency gains in tertiary under different emission reduction regimes
Baseline KyotoTwo times
KyotoFour times
Kyoto
Space heating 7.5 21.2 32.7 55.1Other heating uses 5.9 12.1 16.7 24.5Air conditioning 9.3 14.9 19.3 46.5Electrical equipment 13.4 57.3 64.9 147.0Source: PRIMES
% improvement from 1995 levels
How the sector adjusts to allow for higher emission abatement?(This section contains additional information and can be ignored if the focus is the firstcommitment period (2008-2012) of the Kyoto Protocol)
Despite the significant progress observed in the context of the Kyotoemission reduction target, the additional potential remains quite significanteven to a horizon as short as 2010. The sector can contribute to a biggeremission reduction effort by further improving the overall energy intensityand by adopting advanced technologies, mostly electric, in the end-uses.
To reach an emission reduction target two times bigger than the Kyotocommitment, it is cost-effective to reduce the energy needs in the tertiarysector by more than 20% per unit. Half of this reduction is estimated to bethe result of improved thermal integrity, and half the effect of advancedelectric technologies and rational use of energy. The potential for buildingthermal integrity improvement to reduce energy requirements in the horizonto 2010 is estimated at 10%. The corresponding figure for rational use ofenergy is 6.5%.
There is a large scope for further technological progress in electricalequipment used in the tertiary sector. Accelerated penetration of lightingequipment that complies with high efficiency standards is one example.Overall efficiency gains in electrical equipment can exceed 150% frombaseline levels. The driver is electric heat pumps and at higher cost levelsfuel cells. For the case of an emission reduction target two times deeper thanKyoto efficiency gains can go up to 45% higher than baseline.
The shift towards the use of electricity in space heating/cooling (mainlythrough heat pumps) has a double effect, leading to additional directefficiency gains and lower emissions on the supply side.
The potential of technological progress in other heating uses (water heatingetc.) is less significant and can go up to 20%. More efficient air-conditioningequipment needs high cost levels to penetrate in the market. However thepotential improvement in air conditioning equipment can reach up to 50%.
The total economic potential in the tertiary sector for reducing emissions ishigh, corresponding to a cut of more than half of baseline emissions. Highcosts of energy services are implied in this case. However the implicationson total production cost of the sector are small.
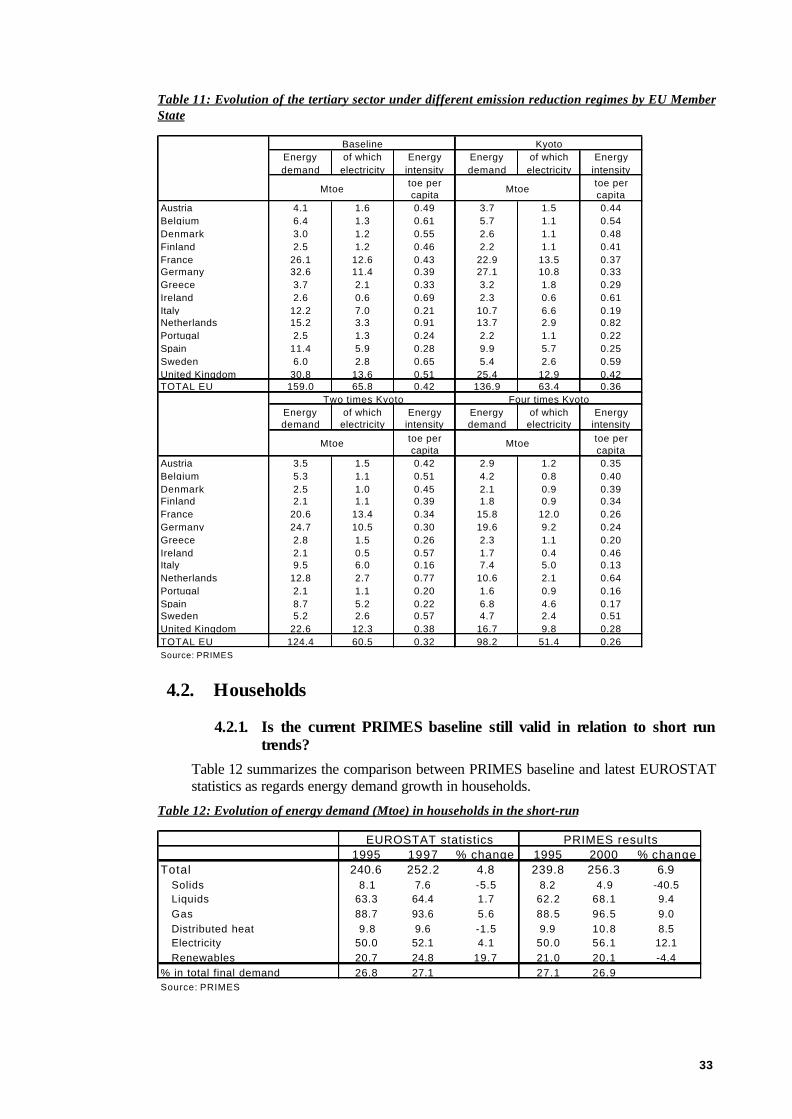
33
Table 11: Evolution of the tertiary sector under different emission reduction regimes by EU MemberState
Energy demand
of which electricity
Energy intensity
Energy demand
of which electricity
Energy intensity
toe per capita
toe per capita
Austria 4.1 1.6 0.49 3.7 1.5 0.44Belgium 6.4 1.3 0.61 5.7 1.1 0.54Denmark 3.0 1.2 0.55 2.6 1.1 0.48Finland 2.5 1.2 0.46 2.2 1.1 0.41France 26.1 12.6 0.43 22.9 13.5 0.37Germany 32.6 11.4 0.39 27.1 10.8 0.33Greece 3.7 2.1 0.33 3.2 1.8 0.29Ireland 2.6 0.6 0.69 2.3 0.6 0.61Italy 12.2 7.0 0.21 10.7 6.6 0.19Netherlands 15.2 3.3 0.91 13.7 2.9 0.82Portugal 2.5 1.3 0.24 2.2 1.1 0.22Spain 11.4 5.9 0.28 9.9 5.7 0.25Sweden 6.0 2.8 0.65 5.4 2.6 0.59United Kingdom 30.8 13.6 0.51 25.4 12.9 0.42TOTAL EU 159.0 65.8 0.42 136.9 63.4 0.36
Energy demand
of which electricity
Energy intensity
Energy demand
of which electricity
Energy intensity
toe per capita
toe per capita
Austria 3.5 1.5 0.42 2.9 1.2 0.35Belgium 5.3 1.1 0.51 4.2 0.8 0.40Denmark 2.5 1.0 0.45 2.1 0.9 0.39Finland 2.1 1.1 0.39 1.8 0.9 0.34France 20.6 13.4 0.34 15.8 12.0 0.26Germany 24.7 10.5 0.30 19.6 9.2 0.24Greece 2.8 1.5 0.26 2.3 1.1 0.20Ireland 2.1 0.5 0.57 1.7 0.4 0.46Italy 9.5 6.0 0.16 7.4 5.0 0.13Netherlands 12.8 2.7 0.77 10.6 2.1 0.64Portugal 2.1 1.1 0.20 1.6 0.9 0.16Spain 8.7 5.2 0.22 6.8 4.6 0.17Sweden 5.2 2.6 0.57 4.7 2.4 0.51United Kingdom 22.6 12.3 0.38 16.7 9.8 0.28TOTAL EU 124.4 60.5 0.32 98.2 51.4 0.26Source: PRIMES
Mtoe Mtoe
Two times Kyoto Four times Kyoto
Mtoe Mtoe
Baseline Kyoto
4.2. Households
4.2.1. Is the current PRIMES baseline still valid in relation to short runtrends?
Table 12 summarizes the comparison between PRIMES baseline and latest EUROSTATstatistics as regards energy demand growth in households.
Table 12: Evolution of energy demand (Mtoe) in households in the short-run
1995 1997 % change 1995 2000 % changeTotal 240.6 252.2 4.8 239.8 256.3 6.9
Solids 8.1 7.6 -5.5 8.2 4.9 -40.5Liquids 63.3 64.4 1.7 62.2 68.1 9.4Gas 88.7 93.6 5.6 88.5 96.5 9.0Distributed heat 9.8 9.6 -1.5 9.9 10.8 8.5Electricity 50.0 52.1 4.1 50.0 56.1 12.1Renewables 20.7 24.8 19.7 21.0 20.1 -4.4
% in total final demand 26.8 27.1 27.1 26.9Source: PRIMES
EUROSTAT statistics PRIMES results
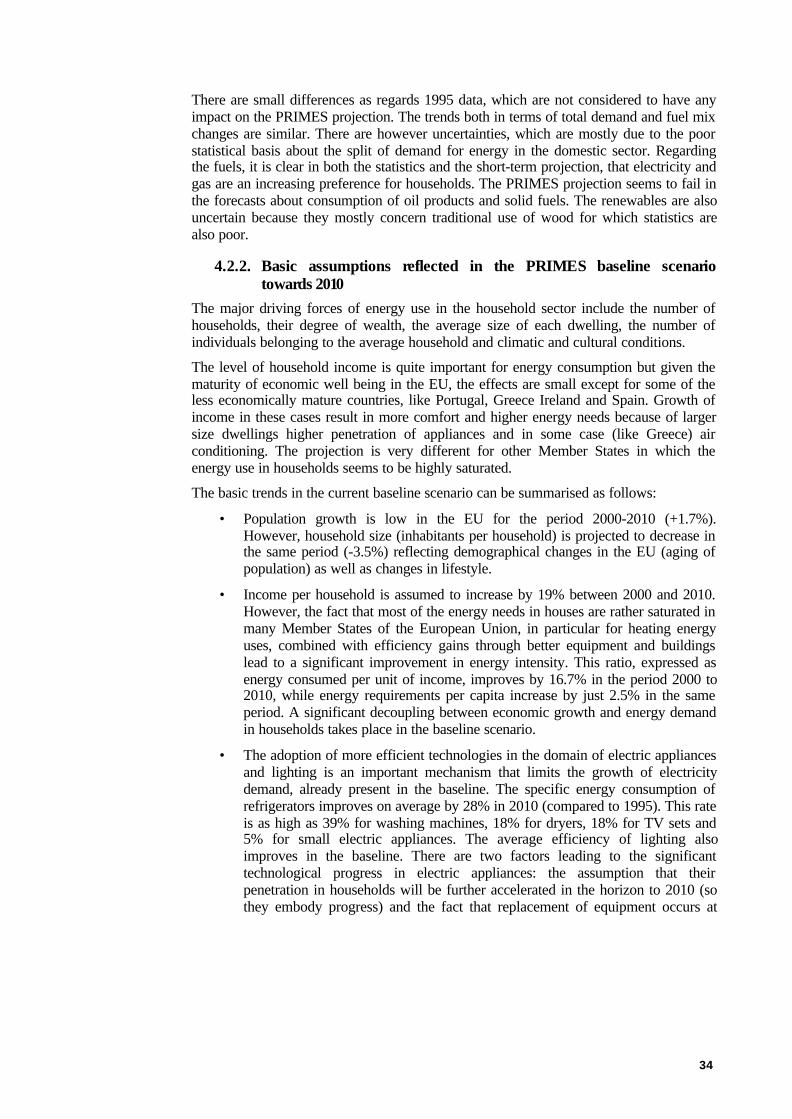
34
There are small differences as regards 1995 data, which are not considered to have anyimpact on the PRIMES projection. The trends both in terms of total demand and fuel mixchanges are similar. There are however uncertainties, which are mostly due to the poorstatistical basis about the split of demand for energy in the domestic sector. Regardingthe fuels, it is clear in both the statistics and the short-term projection, that electricity andgas are an increasing preference for households. The PRIMES projection seems to fail inthe forecasts about consumption of oil products and solid fuels. The renewables are alsouncertain because they mostly concern traditional use of wood for which statistics arealso poor.
4.2.2. Basic assumptions reflected in the PRIMES baseline scenariotowards 2010
The major driving forces of energy use in the household sector include the number ofhouseholds, their degree of wealth, the average size of each dwelling, the number ofindividuals belonging to the average household and climatic and cultural conditions.
The level of household income is quite important for energy consumption but given thematurity of economic well being in the EU, the effects are small except for some of theless economically mature countries, like Portugal, Greece Ireland and Spain. Growth ofincome in these cases result in more comfort and higher energy needs because of largersize dwellings higher penetration of appliances and in some case (like Greece) airconditioning. The projection is very different for other Member States in which theenergy use in households seems to be highly saturated.
The basic trends in the current baseline scenario can be summarised as follows:
• Population growth is low in the EU for the period 2000-2010 (+1.7%).However, household size (inhabitants per household) is projected to decrease inthe same period (-3.5%) reflecting demographical changes in the EU (aging ofpopulation) as well as changes in lifestyle.
• Income per household is assumed to increase by 19% between 2000 and 2010.However, the fact that most of the energy needs in houses are rather saturated inmany Member States of the European Union, in particular for heating energyuses, combined with efficiency gains through better equipment and buildingslead to a significant improvement in energy intensity. This ratio, expressed asenergy consumed per unit of income, improves by 16.7% in the period 2000 to2010, while energy requirements per capita increase by just 2.5% in the sameperiod. A significant decoupling between economic growth and energy demandin households takes place in the baseline scenario.
• The adoption of more efficient technologies in the domain of electric appliancesand lighting is an important mechanism that limits the growth of electricitydemand, already present in the baseline. The specific energy consumption ofrefrigerators improves on average by 28% in 2010 (compared to 1995). This rateis as high as 39% for washing machines, 18% for dryers, 18% for TV sets and5% for small electric appliances. The average efficiency of lighting alsoimproves in the baseline. There are two factors leading to the significanttechnological progress in electric appliances: the assumption that theirpenetration in households will be further accelerated in the horizon to 2010 (sothey embody progress) and the fact that replacement of equipment occurs at

35
short intervals (about 5 years on average) accelerating the purchase of moreefficient equipment.22
• Efficiency gains in space heating equipment is, in 2010, 3.5% higher than in1995, mainly as a consequence of shifting towards electric heating equipment(including heat pumps) that gain an additional market share of 4%. Efficiencygains are also obtained in the domains of water heating (+17.5% in 2010 from1995 levels), air-conditioning equipment (2%), and cooking equipment (4%).
The evolution of households’ energy demand over the period 2000-2010 in the baselineis illustrated in Table 13. The emergence of new uses of electricity and the higherpenetration of electric appliances overcompensate the efficiency gains of equipmentleading to high demand for electricity. Electricity use, being more efficient, and better-insulated houses explain the rather spectacular improvement in average energy intensityof the households sector. Distributed heat and gas gain in market share terms in thedomain of heating.
Table 13: Evolution of energy demand in households in 2000-2010
2000 2010 % changeIncome per households (Euro'90) 24974 29694 18.9Energy intensity
toe per unit of income 69.2 57.7 -16.7toe per capita 0.681 0.698 2.5
Energy demand (Mtoe)Total 256.3 267.4 4.3
% of electrical equipment 9.6 10.0by fuel
Solids 4.9 1.4 -70.4Liquids 68.1 67.4 -0.9Gas 96.5 100.6 4.3Distributed heat 10.8 13.0 20.6Electricity 56.1 64.3 14.6Renewables 20.1 20.7 2.9
% in total final demand 26.9 28.0Source: PRIMES
4.2.3. How does the sector adjust to meet the Kyoto target in the PRIMESanalysis?
The changes in the fuel mix, in favour of electricity, gas and distributed heat, explain thecontinuous drop of carbon intensity of the households sector. The direct sectoralemissions of CO2 are projected to remain rather stable in 2010 relative to the level of1990, in the baseline scenario.
Under the collective effort to reach the Kyoto commitments, the households sectorimproves in terms of energy efficiency, but the adjustment possibilities are rather smallcompared to other sectors and in particular the tertiary sector. The households havesignificantly lower potential compared to the tertiary sector, because of lower economiesof scale, the inability to handle high capital costs at the scale of an individual and thebaseline trends that already show a significant improvement.
The additional changes that occur in the sector under Kyoto are the following:
22 It has been commented by Mr. Kemna (VHK) that the replacement rate of equipment is rather unrealisticas most large energy consuming appliances have a product life of 12-15 years. However, recent trends showa higher rate of replacement of appliances because of increased comfort standards of new equipmenttechnologies.

36
• The energy intensity (i.e. consumption per unit of income) in households isprojected to improve further by 5.5% in 2010 from baseline. A similarimprovement is projected for energy consumption per capita. About one third ofthis improvement is due to improved thermal insulation of new constructions (nosignificant improvements are observed for existing buildings because of highcosts).23 Better housekeeping, including variation of standards of comfort andmore rational use of energy, contributes another third.
• Accelerated adoption of more efficient technologies is rather limited in the caseof households (compared to the tertiary sector). Progress is observed in thedomain of lighting and water heating equipment for which an improvement of9% on top of baseline is projected. Keeping in mind that the efficiencyimprovement of electric appliances for home use was impressive already in thebaseline (25% in 2010 from 1995), the additional improvement in the context ofKyoto restrictions is rather small.
• As regards the fuel mix, a substitution of liquid fuels by electricity is projected toaccelerate in the case of the Kyoto emission reduction scenario. The market shareof electricity increases to 25.3% (+1.3 percentage points from baseline). Theshares of other energy forms remain rather stable.
As a combined effect of the above changes overall energy demand in householdsincreases by only 5% in 2010 from 1995 (-5.5% from baseline in 2010), while CO2
emissions decrease by 11% from 1990 (-10% from baseline in 2010). The Kyotoemission reduction target for the EU energy system, results in an increase of energyrelated expenditure of households by 4% (or about 150 € per household) compared to thebaseline scenario.
Table 14: Efficiency gains in households under different emission reduction regimes
Baseline KyotoTwo times
KyotoFour times
Kyoto
Space heating 3.5 5.0 6.8 22.9Water heating 16.8 27.5 35.9 45.4Other heating uses 4.0 5.3 6.0 8.3Air conditioning 1.8 3.1 5.4 39.8Electrical equipment (average)
24.5 26.2 27.7 41.5
Source: PRIMES
% improvement from 1995 levels
How the sector adjusts to allow for higher emission abatement?(This section contains additional information and can be ignored if the focus is the firstcommitment period (2008-2012) of the Kyoto Protocol)
Behavioural changes related to energy use in the sector of households are animportant driver of their adjustment to ambitious emission restrictions. Ofcourse forecasting such changes is highly uncertain. Regarding energyrelated equipment the expected additional efficiency gains are rather modest,because in some domains the baseline scenario has involved high progress.There exist, however, significant additional possibilities in some domains, asfor example for lighting and water heating.
The potential reduction of energy requirements as a result of improving
23 Note that the option of improving thermal integrity in existing building constructions is available inPRIMES model, however it is not found to be a cost effective one.

37
buildings thermal integrity can reach up to 8.5% in a short-term perspectivelike the horizon to 2010. Due to the high costs involved in improving thermalintegrity for existing houses, the technical potential is exploitable only athigh emission restrictions, and only beyond a certain threshold regardingmarginal abatement costs.
The potential for technology progress in electric appliances is limited due tothe high level of adoption of advanced technologies already incorporated inthe baseline. It is assumed that for the short horizon to 2010 no technologicalbreakthrough is possible in the domain of electric appliances. The totaladditional efficiency gains are estimated as high as 15% on top of baseline.
In heating and cooling energy uses, the efficiency gains in space heating andwater heating can be higher by 26% compared to baseline, 6% in cookingand up to 55% in air conditioning. However, these efficiency gainscorrespond to high marginal costs and become cost-effective in the contextof considerably severe emission restrictions.
Theoretically, half the baseline CO2 emissions in households can be reduced(46% from 1990) in which case the households will face an increase ofenergy related costs by roughly 20% compared to baseline (about 600 € perhousehold per year).
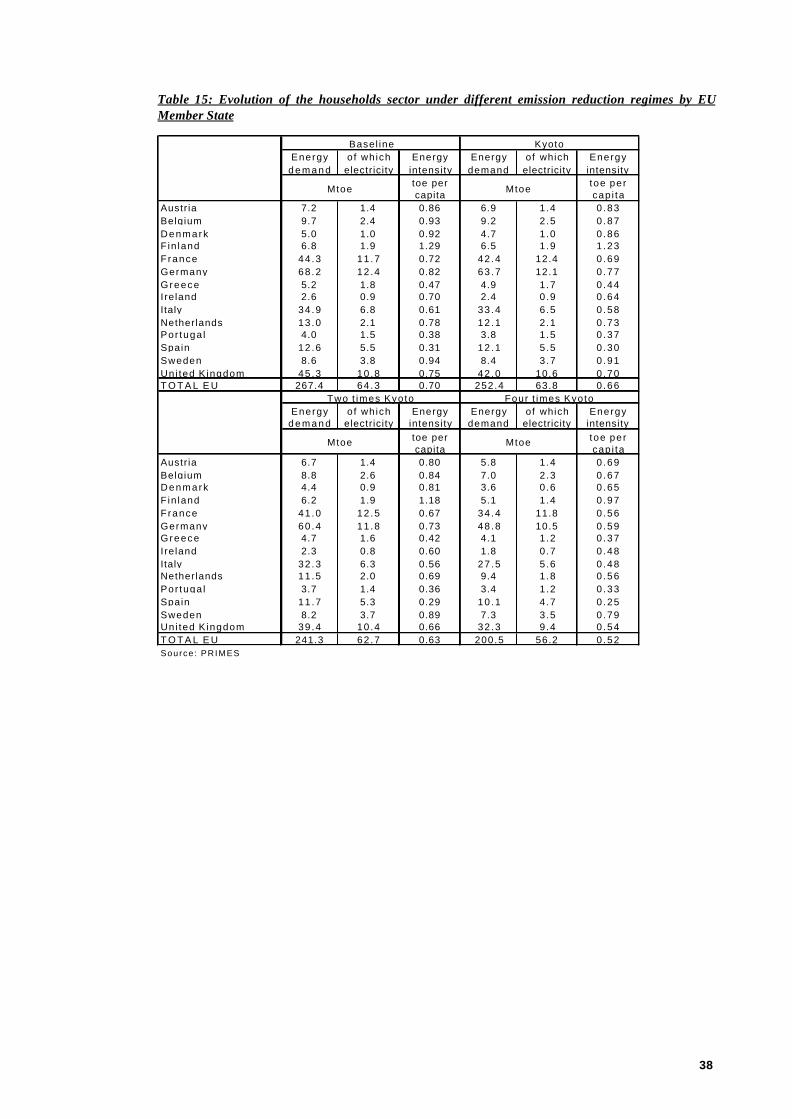
38
Table 15: Evolution of the households sector under different emission reduction regimes by EUMember State
Energy d e m a n d
of which electricity
Energy intensity
Energy demand
of which electricity
Energy intensity
toe per capita
toe per cap i ta
Austr ia 7.2 1.4 0.86 6.9 1.4 0 .83Belgium 9.7 2.4 0.93 9.2 2.5 0 .87Denmark 5.0 1.0 0.92 4.7 1.0 0 .86Fin land 6.8 1.9 1.29 6.5 1.9 1 .23France 44 .3 11 .7 0.72 42 .4 12.4 0 .69Germany 68 .2 12 .4 0.82 63 .7 12.1 0 .77Greece 5.2 1.8 0.47 4.9 1.7 0 .44Ire land 2.6 0.9 0.70 2.4 0.9 0 .64Italy 34 .9 6.8 0.61 33 .4 6.5 0 .58Netherlands 13 .0 2.1 0.78 12 .1 2.1 0 .73Por tuga l 4.0 1.5 0.38 3.8 1.5 0 .37Spain 12 .6 5.5 0.31 12 .1 5.5 0 .30Sweden 8.6 3.8 0.94 8.4 3.7 0 .91Uni ted K ingdom 45.3 10 .8 0.75 42 .0 10.6 0 .70T O T A L E U 267.4 64 .3 0.70 252.4 63.8 0 .66
Energy d e m a n d
of which electricity
Energy intensity
Energy demand
of which electricity
Energy intensity
toe per capita
toe per cap i ta
Austr ia 6.7 1.4 0.80 5.8 1.4 0 .69Belgium 8.8 2.6 0.84 7.0 2.3 0 .67Denmark 4.4 0.9 0.81 3.6 0.6 0 .65Fin land 6.2 1.9 1.18 5.1 1.4 0 .97France 41 .0 12 .5 0.67 34 .4 11.8 0 .56Germany 60 .4 11 .8 0.73 48 .8 10.5 0 .59Greece 4.7 1.6 0.42 4.1 1.2 0 .37Ire land 2.3 0.8 0.60 1.8 0.7 0 .48Italy 32 .3 6.3 0.56 27 .5 5.6 0 .48Netherlands 11 .5 2.0 0.69 9.4 1.8 0 .56Por tuga l 3.7 1.4 0.36 3.4 1.2 0 .33Spain 11 .7 5.3 0.29 10 .1 4.7 0 .25Sweden 8.2 3.7 0.89 7.3 3.5 0 .79Uni ted K ingdom 39.4 10 .4 0.66 32 .3 9.4 0 .54T O T A L E U 241.3 62 .7 0.63 200.5 56.2 0 .52Source : PRIMES
Mtoe Mtoe
Two t imes Kyoto Four t imes Kyoto
Mtoe Mtoe
Basel ine Kyoto
39
5. Transport sector
5.1. Overview and recent trendsThe transportation sector is one of the most important sectors from the point of view ofboth energy consumption and environmental implications. Transportation accounted formore than 30% of the EU total final energy demand in 1995. It has been consistently thefastest growing final energy demand sector in the EU growing by 3.2% pa between 1985and 1995, compared to 1% pa growth in total energy use. From an environmental pointof view, transported accounted for 26.5% of CO2 emissions in the European Union in1995. The near complete dependence of the sector on oil products generates two sorts ofconcern:
• given the overall insensitivity of the sector to taxes and price changesand the absence of easily available substitutes, at least in the mediumterm, there is concern over meeting overall greenhouse gases targets byEuropean countries, and
• since a significant amount of transportation takes place within citycentres, a number of urban pollution issues arise, some of which havepublic health implications.
In order to capture better the different driving forces of transportation energy demand,the sector has been divided into:
a) passenger transportation, or the activity involving primarily the movement of peopleexpressed in passenger-kilometres, and
b) freight transport, or the activity involving primarily the movement of goodsexpressed in ton-kilometres.
Passenger transportation represented about 70% of total transport energy consumption in1995. Cars and motorcycles consume close to 75% of passenger transport consumptionfollowed by aviation24 (17%). In terms of mobility in passenger transport, cars andmotorcycles accounted for more than 80% in the EU while public road transportaccounted for only 9%. On average, each citizen of the EU travelled about 12300 km peryear (in 1995). Road transport based on trucks dominated freight transport in the EU(29% of total energy for transportation, 70% of tonne-kilometres transported in the EU).Train transport follow in importance in terms of freight activity (18%), while inlandnavigation represented 12% of freight activity. Consumption by trains and inlandnavigation25 generally represents a small fraction of total energy demand in the sector.
Travel needs in passenger transport can be satisfied by a number of different travelmeans (transport modes) such as private car, bus, airplanes, trains etc. Consumerundertake travel on the basis of a number of different reasons:
24 Within the PRIMES model, aviation includes both national and international flights from the EU, withoutdistinguishing between the two (data on the split between domestic and international aviation is not currentlyavailable). Consequently total CO2 emissions from aviation are accounted for at the level of each MemberState. However, according to the Guidelines for National Greenhouse Gas Inventories of theIntergovernmental Panel on Climate Change (IPCC), emissions based upon fuel sold to aircraft engaged ininternational transport should not be included in national totals, but reported separately.25 Consumption of international maritime bunkers is excluded from the analysis because according toEUROSTAT conventions it is not accounted for in national CO2 emissions.
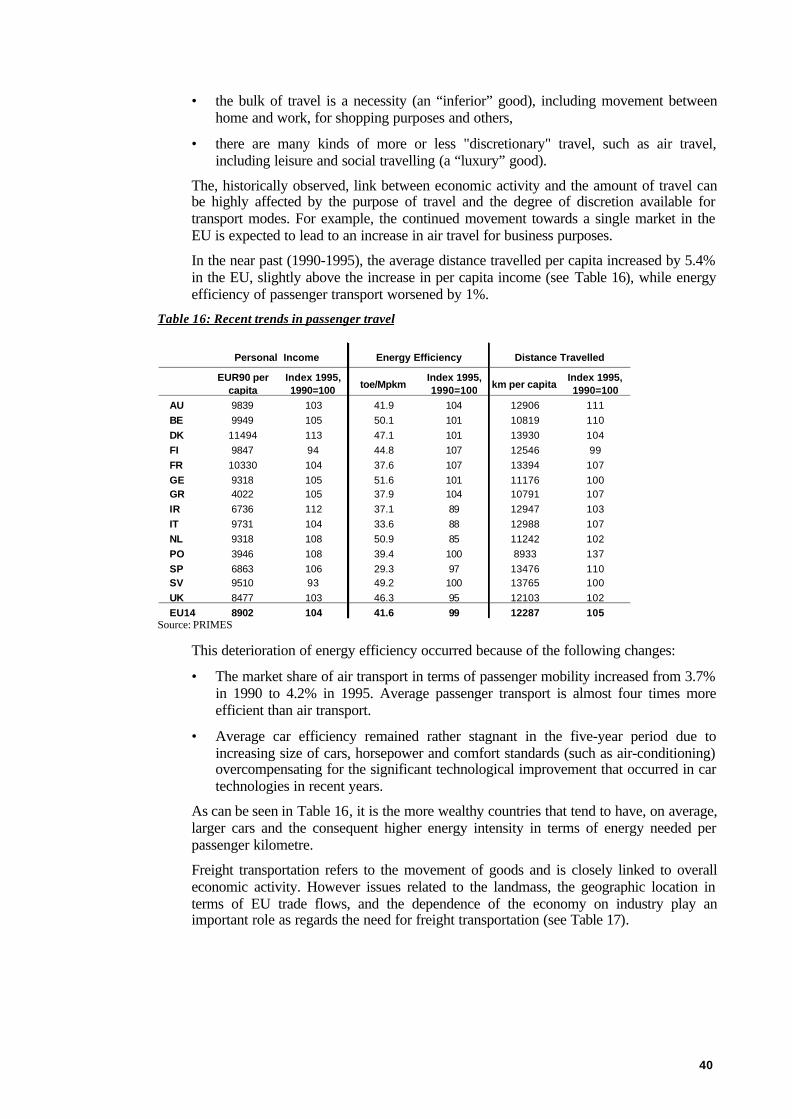
40
• the bulk of travel is a necessity (an “inferior” good), including movement betweenhome and work, for shopping purposes and others,
• there are many kinds of more or less "discretionary" travel, such as air travel,including leisure and social travelling (a “luxury” good).
The, historically observed, link between economic activity and the amount of travel canbe highly affected by the purpose of travel and the degree of discretion available fortransport modes. For example, the continued movement towards a single market in theEU is expected to lead to an increase in air travel for business purposes.
In the near past (1990-1995), the average distance travelled per capita increased by 5.4%in the EU, slightly above the increase in per capita income (see Table 16), while energyefficiency of passenger transport worsened by 1%.
Table 16: Recent trends in passenger travel
EUR90 per capita
Index 1995, 1990=100 toe/Mpkm
Index 1995, 1990=100 km per capita
Index 1995, 1990=100
AU 9839 103 41.9 104 12906 111BE 9949 105 50.1 101 10819 110DK 11494 113 47.1 101 13930 104FI 9847 94 44.8 107 12546 99FR 10330 104 37.6 107 13394 107GE 9318 105 51.6 101 11176 100GR 4022 105 37.9 104 10791 107IR 6736 112 37.1 89 12947 103IT 9731 104 33.6 88 12988 107NL 9318 108 50.9 85 11242 102PO 3946 108 39.4 100 8933 137SP 6863 106 29.3 97 13476 110SV 9510 93 49.2 100 13765 100UK 8477 103 46.3 95 12103 102EU14 8902 104 41.6 99 12287 105
Personal Income Energy Efficiency Distance Travelled
Source: PRIMES
This deterioration of energy efficiency occurred because of the following changes:
• The market share of air transport in terms of passenger mobility increased from 3.7%in 1990 to 4.2% in 1995. Average passenger transport is almost four times moreefficient than air transport.
• Average car efficiency remained rather stagnant in the five-year period due toincreasing size of cars, horsepower and comfort standards (such as air-conditioning)overcompensating for the significant technological improvement that occurred in cartechnologies in recent years.
As can be seen in Table 16, it is the more wealthy countries that tend to have, on average,larger cars and the consequent higher energy intensity in terms of energy needed perpassenger kilometre.
Freight transportation refers to the movement of goods and is closely linked to overalleconomic activity. However issues related to the landmass, the geographic location interms of EU trade flows, and the dependence of the economy on industry play animportant role as regards the need for freight transportation (see Table 17).
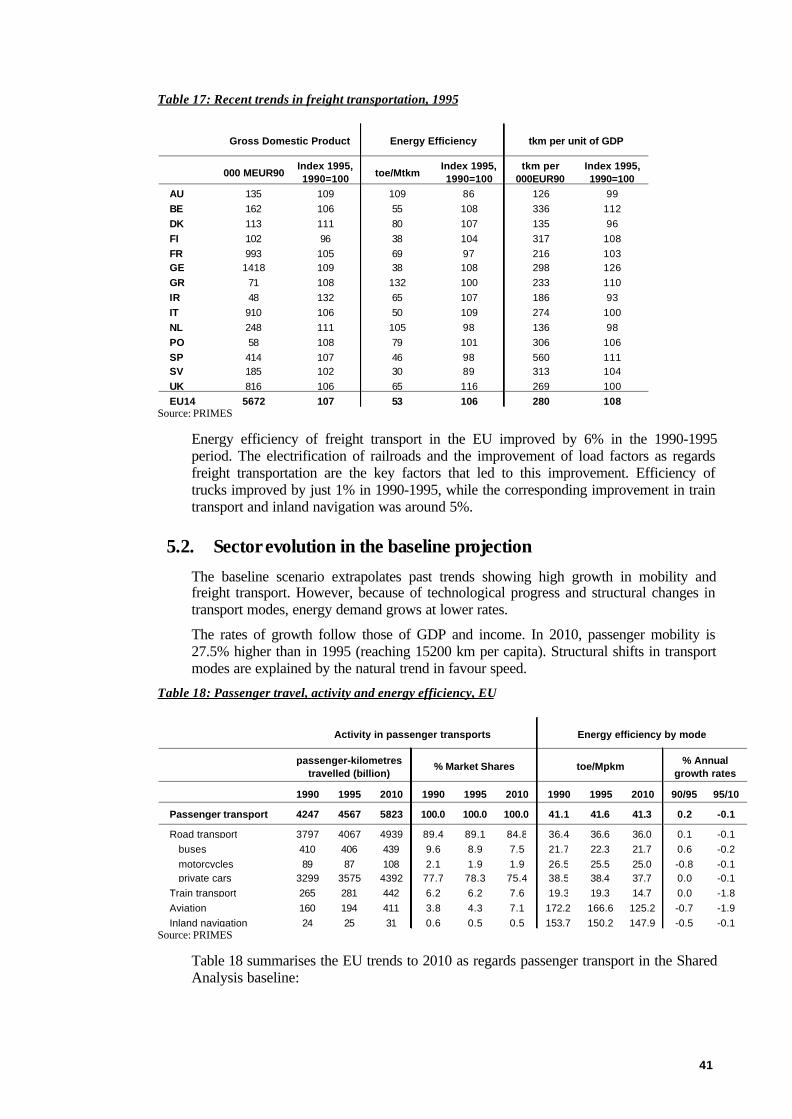
41
Table 17: Recent trends in freight transportation, 1995
000 MEUR90 Index 1995, 1990=100 toe/Mtkm
Index 1995, 1990=100
tkm per 000EUR90
Index 1995, 1990=100
AU 135 109 109 86 126 99BE 162 106 55 108 336 112DK 113 111 80 107 135 96FI 102 96 38 104 317 108FR 993 105 69 97 216 103GE 1418 109 38 108 298 126GR 71 108 132 100 233 110IR 48 132 65 107 186 93IT 910 106 50 109 274 100NL 248 111 105 98 136 98PO 58 108 79 101 306 106SP 414 107 46 98 560 111SV 185 102 30 89 313 104UK 816 106 65 116 269 100EU14 5672 107 53 106 280 108
Energy EfficiencyGross Domestic Product tkm per unit of GDP
Source: PRIMES
Energy efficiency of freight transport in the EU improved by 6% in the 1990-1995period. The electrification of railroads and the improvement of load factors as regardsfreight transportation are the key factors that led to this improvement. Efficiency oftrucks improved by just 1% in 1990-1995, while the corresponding improvement in traintransport and inland navigation was around 5%.
5.2. Sector evolution in the baseline projectionThe baseline scenario extrapolates past trends showing high growth in mobility andfreight transport. However, because of technological progress and structural changes intransport modes, energy demand grows at lower rates.
The rates of growth follow those of GDP and income. In 2010, passenger mobility is27.5% higher than in 1995 (reaching 15200 km per capita). Structural shifts in transportmodes are explained by the natural trend in favour speed.
Table 18: Passenger travel, activity and energy efficiency, EU
1990 1995 2010 1990 1995 2010 1990 1995 2010 90/95 95/10
Passenger transport 4247 4567 5823 100.0 100.0 100.0 41.1 41.6 41.3 0.2 -0.1
Road transport 3797 4067 4939 89.4 89.1 84.8 36.4 36.6 36.0 0.1 -0.1buses 410 406 439 9.6 8.9 7.5 21.7 22.3 21.7 0.6 -0.2motorcycles 89 87 108 2.1 1.9 1.9 26.5 25.5 25.0 -0.8 -0.1private cars 3299 3575 4392 77.7 78.3 75.4 38.5 38.4 37.7 0.0 -0.1
Train transport 265 281 442 6.2 6.2 7.6 19.3 19.3 14.7 0.0 -1.8Aviation 160 194 411 3.8 4.3 7.1 172.2 166.6 125.2 -0.7 -1.9Inland navigation 24 25 31 0.6 0.5 0.5 153.7 150.2 147.9 -0.5 -0.1
passenger-kilometres travelled (billion)
Activity in passenger transports
% Annual growth rates
% Market Shares toe/Mpkm
Energy efficiency by mode
Source: PRIMES
Table 18 summarises the EU trends to 2010 as regards passenger transport in the SharedAnalysis baseline:
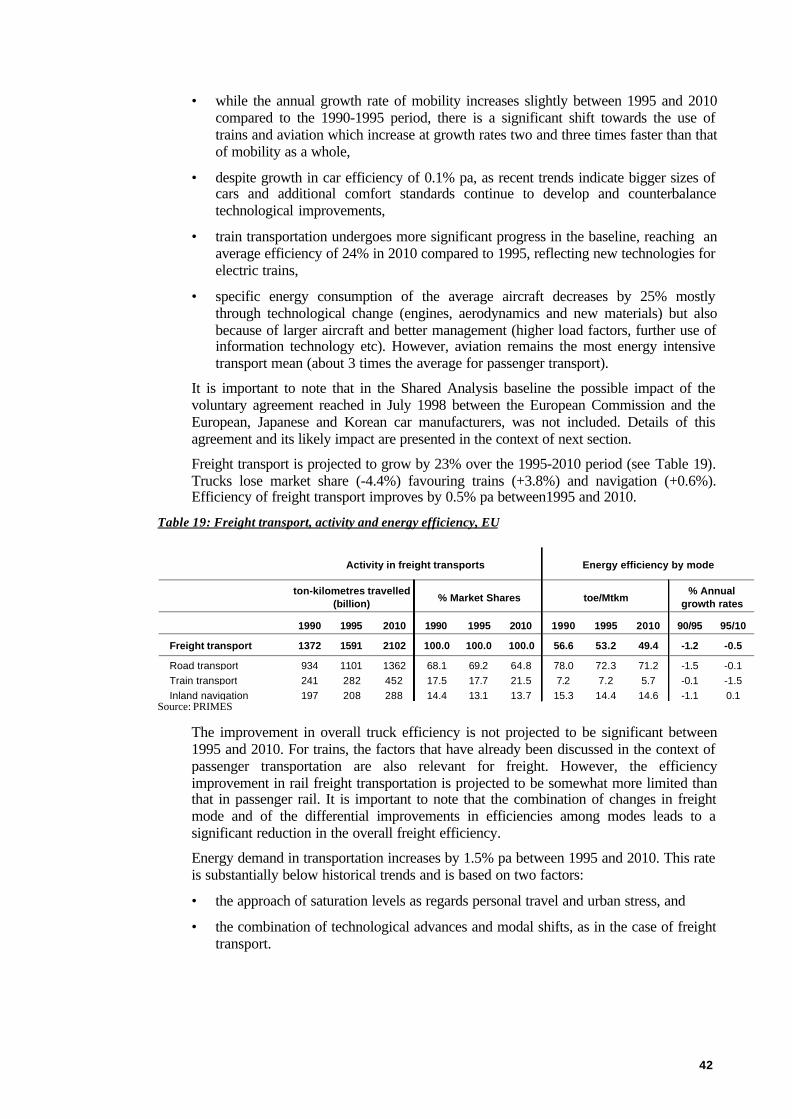
42
• while the annual growth rate of mobility increases slightly between 1995 and 2010compared to the 1990-1995 period, there is a significant shift towards the use oftrains and aviation which increase at growth rates two and three times faster than thatof mobility as a whole,
• despite growth in car efficiency of 0.1% pa, as recent trends indicate bigger sizes ofcars and additional comfort standards continue to develop and counterbalancetechnological improvements,
• train transportation undergoes more significant progress in the baseline, reaching anaverage efficiency of 24% in 2010 compared to 1995, reflecting new technologies forelectric trains,
• specific energy consumption of the average aircraft decreases by 25% mostlythrough technological change (engines, aerodynamics and new materials) but alsobecause of larger aircraft and better management (higher load factors, further use ofinformation technology etc). However, aviation remains the most energy intensivetransport mean (about 3 times the average for passenger transport).
It is important to note that in the Shared Analysis baseline the possible impact of thevoluntary agreement reached in July 1998 between the European Commission and theEuropean, Japanese and Korean car manufacturers, was not included. Details of thisagreement and its likely impact are presented in the context of next section.
Freight transport is projected to grow by 23% over the 1995-2010 period (see Table 19).Trucks lose market share (-4.4%) favouring trains (+3.8%) and navigation (+0.6%).Efficiency of freight transport improves by 0.5% pa between1995 and 2010.
Table 19: Freight transport, activity and energy efficiency, EU
1990 1995 2010 1990 1995 2010 1990 1995 2010 90/95 95/10
Freight transport 1372 1591 2102 100.0 100.0 100.0 56.6 53.2 49.4 -1.2 -0.5
Road transport 934 1101 1362 68.1 69.2 64.8 78.0 72.3 71.2 -1.5 -0.1Train transport 241 282 452 17.5 17.7 21.5 7.2 7.2 5.7 -0.1 -1.5Inland navigation 197 208 288 14.4 13.1 13.7 15.3 14.4 14.6 -1.1 0.1
ton-kilometres travelled (billion)
Activity in freight transports
% Annual growth rates% Market Shares toe/Mtkm
Energy efficiency by mode
Source: PRIMES
The improvement in overall truck efficiency is not projected to be significant between1995 and 2010. For trains, the factors that have already been discussed in the context ofpassenger transportation are also relevant for freight. However, the efficiencyimprovement in rail freight transportation is projected to be somewhat more limited thanthat in passenger rail. It is important to note that the combination of changes in freightmode and of the differential improvements in efficiencies among modes leads to asignificant reduction in the overall freight efficiency.
Energy demand in transportation increases by 1.5% pa between 1995 and 2010. This rateis substantially below historical trends and is based on two factors:
• the approach of saturation levels as regards personal travel and urban stress, and
• the combination of technological advances and modal shifts, as in the case of freighttransport.
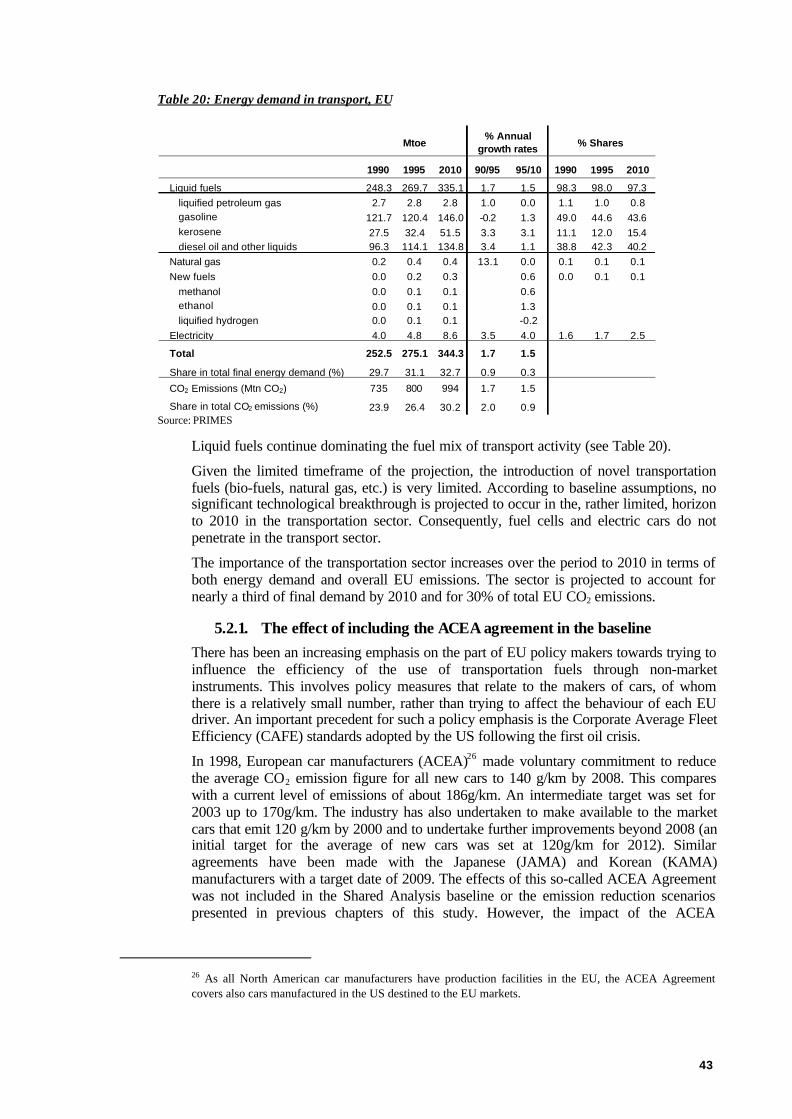
43
Table 20: Energy demand in transport, EU
1990 1995 2010 90/95 95/10 1990 1995 2010
Liquid fuels 248.3 269.7 335.1 1.7 1.5 98.3 98.0 97.3liquified petroleum gas 2.7 2.8 2.8 1.0 0.0 1.1 1.0 0.8gasoline 121.7 120.4 146.0 -0.2 1.3 49.0 44.6 43.6kerosene 27.5 32.4 51.5 3.3 3.1 11.1 12.0 15.4diesel oil and other liquids 96.3 114.1 134.8 3.4 1.1 38.8 42.3 40.2
Natural gas 0.2 0.4 0.4 13.1 0.0 0.1 0.1 0.1New fuels 0.0 0.2 0.3 0.6 0.0 0.1 0.1
methanol 0.0 0.1 0.1 0.6ethanol 0.0 0.1 0.1 1.3liquified hydrogen 0.0 0.1 0.1 -0.2
Electricity 4.0 4.8 8.6 3.5 4.0 1.6 1.7 2.5
Total 252.5 275.1 344.3 1.7 1.5
Share in total final energy demand (%) 29.7 31.1 32.7 0.9 0.3
CO2 Emissions (Mtn CO2) 735 800 994 1.7 1.5
Share in total CO2 emissions (%) 23.9 26.4 30.2 2.0 0.9
% Shares % Annual
growth ratesMtoe
Source: PRIMES
Liquid fuels continue dominating the fuel mix of transport activity (see Table 20).
Given the limited timeframe of the projection, the introduction of novel transportationfuels (bio-fuels, natural gas, etc.) is very limited. According to baseline assumptions, nosignificant technological breakthrough is projected to occur in the, rather limited, horizonto 2010 in the transportation sector. Consequently, fuel cells and electric cars do notpenetrate in the transport sector.
The importance of the transportation sector increases over the period to 2010 in terms ofboth energy demand and overall EU emissions. The sector is projected to account fornearly a third of final demand by 2010 and for 30% of total EU CO2 emissions.
5.2.1. The effect of including the ACEA agreement in the baselineThere has been an increasing emphasis on the part of EU policy makers towards trying toinfluence the efficiency of the use of transportation fuels through non-marketinstruments. This involves policy measures that relate to the makers of cars, of whomthere is a relatively small number, rather than trying to affect the behaviour of each EUdriver. An important precedent for such a policy emphasis is the Corporate Average FleetEfficiency (CAFE) standards adopted by the US following the first oil crisis.
In 1998, European car manufacturers (ACEA)26 made voluntary commitment to reducethe average CO2 emission figure for all new cars to 140 g/km by 2008. This compareswith a current level of emissions of about 186g/km. An intermediate target was set for2003 up to 170g/km. The industry has also undertaken to make available to the marketcars that emit 120 g/km by 2000 and to undertake further improvements beyond 2008 (aninitial target for the average of new cars was set at 120g/km for 2012). Similaragreements have been made with the Japanese (JAMA) and Korean (KAMA)manufacturers with a target date of 2009. The effects of this so-called ACEA Agreementwas not included in the Shared Analysis baseline or the emission reduction scenariospresented in previous chapters of this study. However, the impact of the ACEA
26 As all North American car manufacturers have production facilities in the EU, the ACEA Agreementcovers also cars manufactured in the US destined to the EU markets.
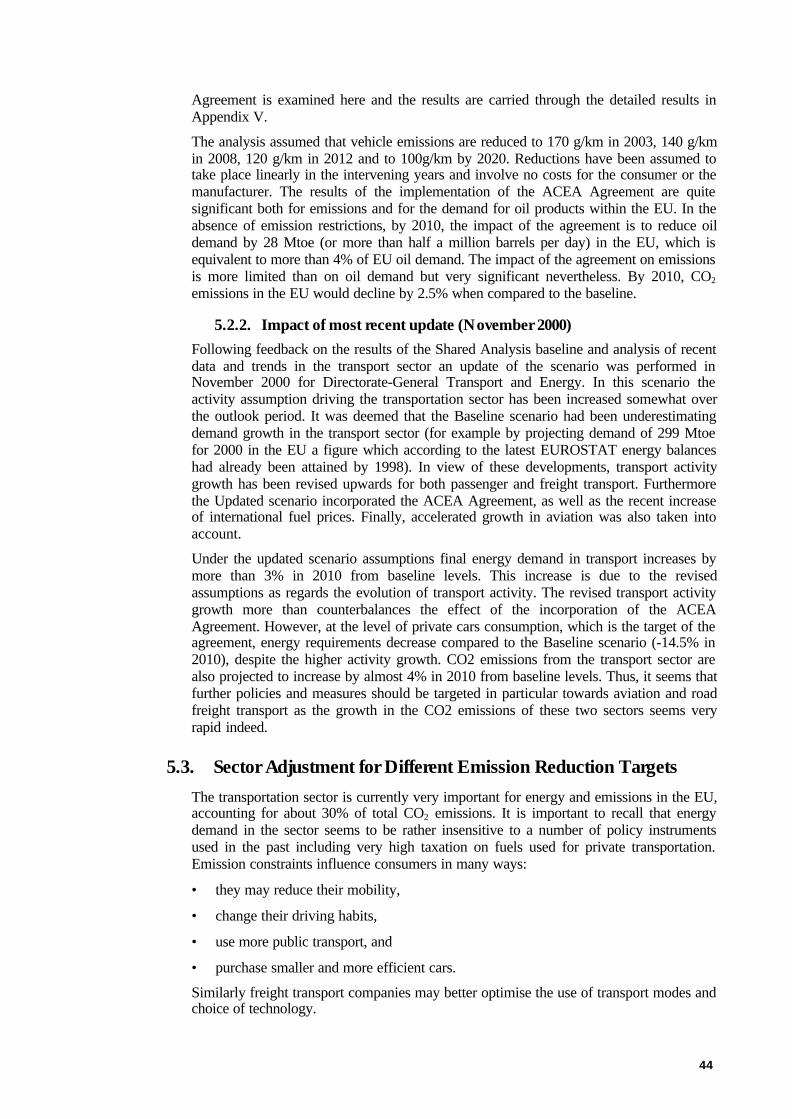
44
Agreement is examined here and the results are carried through the detailed results inAppendix V.
The analysis assumed that vehicle emissions are reduced to 170 g/km in 2003, 140 g/kmin 2008, 120 g/km in 2012 and to 100g/km by 2020. Reductions have been assumed totake place linearly in the intervening years and involve no costs for the consumer or themanufacturer. The results of the implementation of the ACEA Agreement are quitesignificant both for emissions and for the demand for oil products within the EU. In theabsence of emission restrictions, by 2010, the impact of the agreement is to reduce oildemand by 28 Mtoe (or more than half a million barrels per day) in the EU, which isequivalent to more than 4% of EU oil demand. The impact of the agreement on emissionsis more limited than on oil demand but very significant nevertheless. By 2010, CO2
emissions in the EU would decline by 2.5% when compared to the baseline.
5.2.2. Impact of most recent update (November 2000)Following feedback on the results of the Shared Analysis baseline and analysis of recentdata and trends in the transport sector an update of the scenario was performed inNovember 2000 for Directorate-General Transport and Energy. In this scenario theactivity assumption driving the transportation sector has been increased somewhat overthe outlook period. It was deemed that the Baseline scenario had been underestimatingdemand growth in the transport sector (for example by projecting demand of 299 Mtoefor 2000 in the EU a figure which according to the latest EUROSTAT energy balanceshad already been attained by 1998). In view of these developments, transport activitygrowth has been revised upwards for both passenger and freight transport. Furthermorethe Updated scenario incorporated the ACEA Agreement, as well as the recent increaseof international fuel prices. Finally, accelerated growth in aviation was also taken intoaccount.
Under the updated scenario assumptions final energy demand in transport increases bymore than 3% in 2010 from baseline levels. This increase is due to the revisedassumptions as regards the evolution of transport activity. The revised transport activitygrowth more than counterbalances the effect of the incorporation of the ACEAAgreement. However, at the level of private cars consumption, which is the target of theagreement, energy requirements decrease compared to the Baseline scenario (-14.5% in2010), despite the higher activity growth. CO2 emissions from the transport sector arealso projected to increase by almost 4% in 2010 from baseline levels. Thus, it seems thatfurther policies and measures should be targeted in particular towards aviation and roadfreight transport as the growth in the CO2 emissions of these two sectors seems veryrapid indeed.
5.3. Sector Adjustment for Different Emission Reduction TargetsThe transportation sector is currently very important for energy and emissions in the EU,accounting for about 30% of total CO2 emissions. It is important to recall that energydemand in the sector seems to be rather insensitive to a number of policy instrumentsused in the past including very high taxation on fuels used for private transportation.Emission constraints influence consumers in many ways:
• they may reduce their mobility,
• change their driving habits,
• use more public transport, and
• purchase smaller and more efficient cars.
Similarly freight transport companies may better optimise the use of transport modes andchoice of technology.
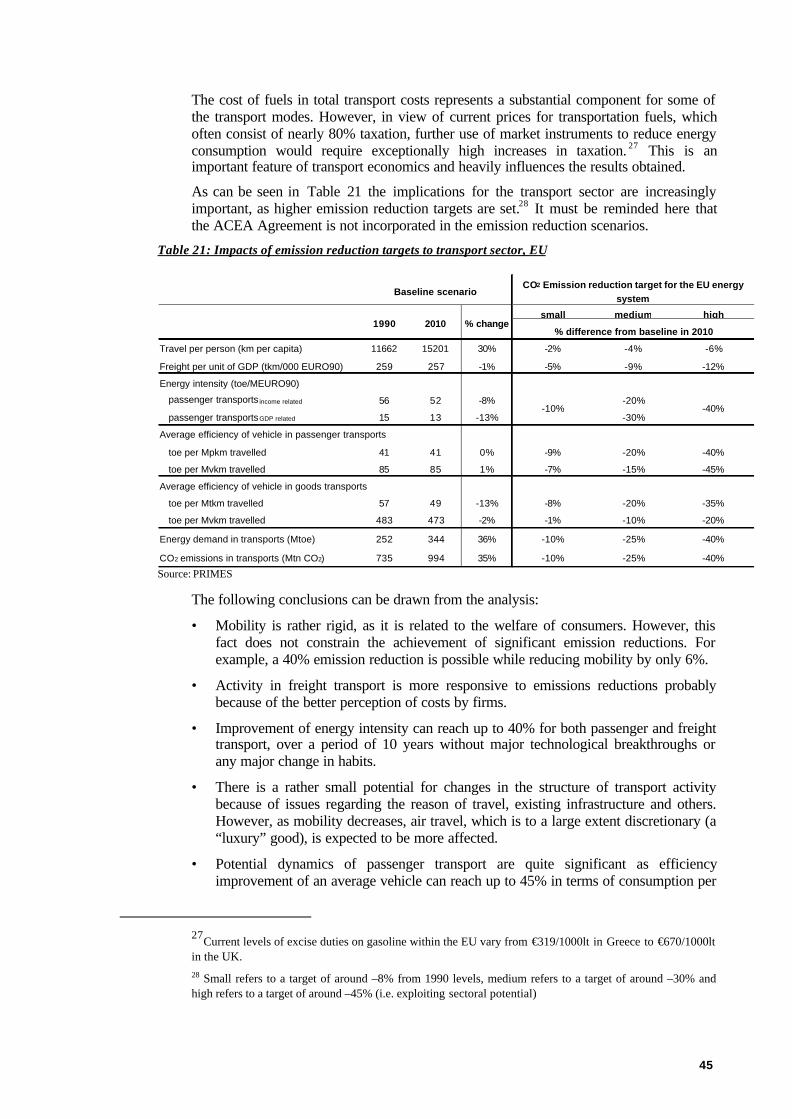
45
The cost of fuels in total transport costs represents a substantial component for some ofthe transport modes. However, in view of current prices for transportation fuels, whichoften consist of nearly 80% taxation, further use of market instruments to reduce energyconsumption would require exceptionally high increases in taxation. 27 This is animportant feature of transport economics and heavily influences the results obtained.
As can be seen in Table 21 the implications for the transport sector are increasinglyimportant, as higher emission reduction targets are set.28 It must be reminded here thatthe ACEA Agreement is not incorporated in the emission reduction scenarios.
Table 21: Impacts of emission reduction targets to transport sector, EU
small medium high
Travel per person (km per capita) 11662 15201 30% -2% -4% -6%
Freight per unit of GDP (tkm/000 EURO90) 259 257 -1% -5% -9% -12%
Energy intensity (toe/MEURO90)
passenger transports income related 56 52 -8% -20%
passenger transportsGDP related 15 13 -13% -30%
Average efficiency of vehicle in passenger transports
toe per Mpkm travelled 41 41 0% -9% -20% -40%
toe per Mvkm travelled 85 85 1% -7% -15% -45%
Average efficiency of vehicle in goods transports
toe per Mtkm travelled 57 49 -13% -8% -20% -35%
toe per Mvkm travelled 483 473 -2% -1% -10% -20%
Energy demand in transports (Mtoe) 252 344 36% -10% -25% -40%
CO2 emissions in transports (Mtn CO2) 735 994 35% -10% -25% -40%
-10% -40%
Baseline scenario
1990 2010 % change
CO2 Emission reduction target for the EU energy system
% difference from baseline in 2010
Source: PRIMES
The following conclusions can be drawn from the analysis:
• Mobility is rather rigid, as it is related to the welfare of consumers. However, thisfact does not constrain the achievement of significant emission reductions. Forexample, a 40% emission reduction is possible while reducing mobility by only 6%.
• Activity in freight transport is more responsive to emissions reductions probablybecause of the better perception of costs by firms.
• Improvement of energy intensity can reach up to 40% for both passenger and freighttransport, over a period of 10 years without major technological breakthroughs orany major change in habits.
• There is a rather small potential for changes in the structure of transport activitybecause of issues regarding the reason of travel, existing infrastructure and others.However, as mobility decreases, air travel, which is to a large extent discretionary (a“luxury” good), is expected to be more affected.
• Potential dynamics of passenger transport are quite significant as efficiencyimprovement of an average vehicle can reach up to 45% in terms of consumption per
27Current levels of excise duties on gasoline within the EU vary from €319/1000lt in Greece to €670/1000ltin the UK.28 Small refers to a target of around –8% from 1990 levels, medium refers to a target of around –30% andhigh refers to a target of around –45% (i.e. exploiting sectoral potential)
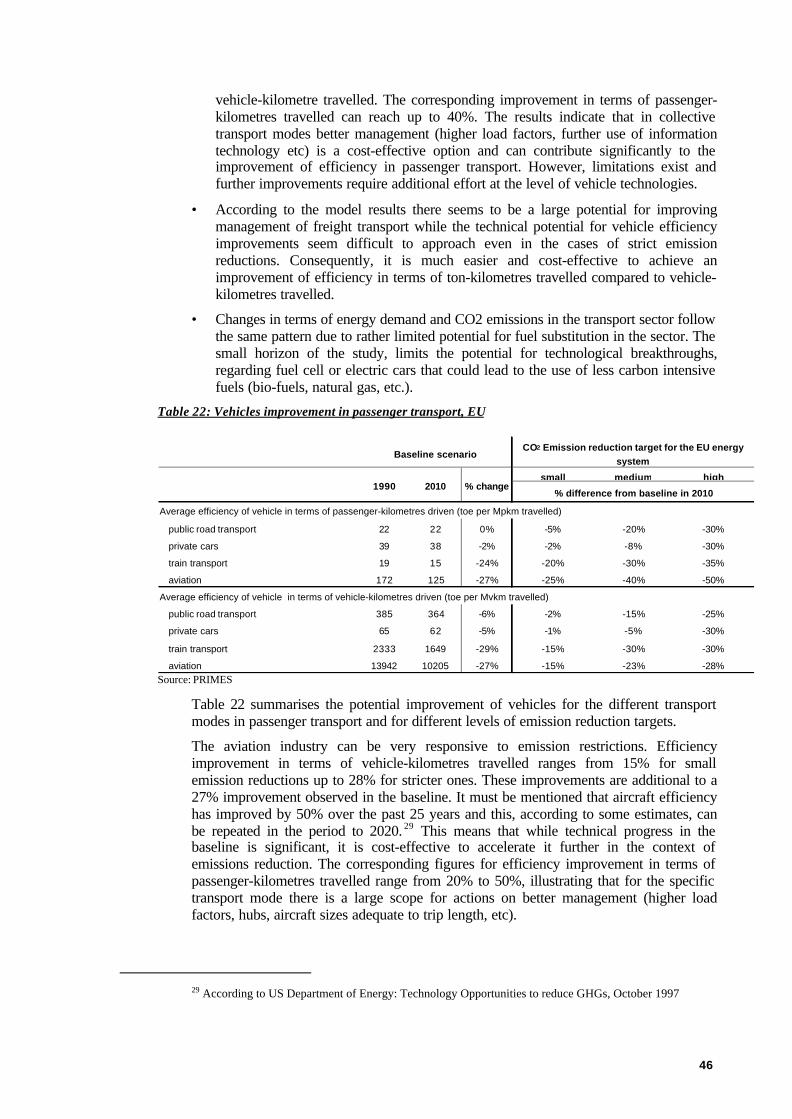
46
vehicle-kilometre travelled. The corresponding improvement in terms of passenger-kilometres travelled can reach up to 40%. The results indicate that in collectivetransport modes better management (higher load factors, further use of informationtechnology etc) is a cost-effective option and can contribute significantly to theimprovement of efficiency in passenger transport. However, limitations exist andfurther improvements require additional effort at the level of vehicle technologies.
• According to the model results there seems to be a large potential for improvingmanagement of freight transport while the technical potential for vehicle efficiencyimprovements seem difficult to approach even in the cases of strict emissionreductions. Consequently, it is much easier and cost-effective to achieve animprovement of efficiency in terms of ton-kilometres travelled compared to vehicle-kilometres travelled.
• Changes in terms of energy demand and CO2 emissions in the transport sector followthe same pattern due to rather limited potential for fuel substitution in the sector. Thesmall horizon of the study, limits the potential for technological breakthroughs,regarding fuel cell or electric cars that could lead to the use of less carbon intensivefuels (bio-fuels, natural gas, etc.).
Table 22: Vehicles improvement in passenger transport, EU
small medium high
Average efficiency of vehicle in terms of passenger-kilometres driven (toe per Mpkm travelled)
public road transport 22 22 0% -5% -20% -30%
private cars 39 38 -2% -2% -8% -30%
train transport 19 15 -24% -20% -30% -35%
aviation 172 125 -27% -25% -40% -50%
Average efficiency of vehicle in terms of vehicle-kilometres driven (toe per Mvkm travelled)
public road transport 385 364 -6% -2% -15% -25%
private cars 65 62 -5% -1% -5% -30%
train transport 2333 1649 -29% -15% -30% -30%
aviation 13942 10205 -27% -15% -23% -28%
CO2 Emission reduction target for the EU energy system
% difference from baseline in 2010
Baseline scenario
1990 2010 % change
Source: PRIMES
Table 22 summarises the potential improvement of vehicles for the different transportmodes in passenger transport and for different levels of emission reduction targets.
The aviation industry can be very responsive to emission restrictions. Efficiencyimprovement in terms of vehicle-kilometres travelled ranges from 15% for smallemission reductions up to 28% for stricter ones. These improvements are additional to a27% improvement observed in the baseline. It must be mentioned that aircraft efficiencyhas improved by 50% over the past 25 years and this, according to some estimates, canbe repeated in the period to 2020. 29 This means that while technical progress in thebaseline is significant, it is cost-effective to accelerate it further in the context ofemissions reduction. The corresponding figures for efficiency improvement in terms ofpassenger-kilometres travelled range from 20% to 50%, illustrating that for the specifictransport mode there is a large scope for actions on better management (higher loadfactors, hubs, aircraft sizes adequate to trip length, etc).
29 According to US Department of Energy: Technology Opportunities to reduce GHGs, October 1997
47
The findings are similar for train transport. Further technology improvement is possibleon top of the significant improvement already registered in the baseline. However, thereseems to be some saturation as regards the potential of high efficiency gains in thehorizon to 2010. The structure of costs of train transport shows less dependence onenergy costs than in other transport modes. Technology improvements are driven fromcompetition with other modes and the introduction of new services rather than from costchanges due to energy and emissions. Because of that, efficiency improvement in termsof vehicle-kilometres travelled remains rather stable at around 30% over the range ofemission reductions tested.
Improvement of public road transport is cost-effective and can reach up to 25% in termsof vehicle technology and 30% in terms of activity.
Energy efficiency improvements for cars are of course possible. The analysis shows thathigh economic incentives related to the cost of using energy are needed to obtainsignificant changes. Without the active participation of automobile manufacturers, whocan re-optimise the design of the cars at rather low additional costs, it is unlikely toexpect consumers to change their habits in car use except under conditions of veryconsiderable additional fuel charges. The potential, if effectively exploited throughadequate policy measures, is significant even in the horizon of almost one cycle of carpark renewal. Without technological change, originating from vehicle suppliers, thebehaviour of consumers can lead to up to 30% of energy efficiency improvement,measured either in mobility terms or in vehicle terms. The scope and effectiveness ofmeasures in the context of urban mobility with cars should be stressed. In this domain,there are considerable benefits, besides CO2 related, to be derived from using less thecars and driving smaller and more efficient cars. These benefits (arising from thereduction of urban stress, local pollution, congestion, etc.) justify in their own rightmeasures and incentives in favour of increasing the occupancy rates of cars in cities,combining transport modes, etc. These can have considerable effects on the averageenergy efficiency of mobility with cars, significantly reducing CO2 emissions.
Important technological change in cars in a short-term horizon (such as 2010) seemsunlikely, except if automobile manufacturers as a whole introduce re-optimised car typesin the market (as shown to be the case in the ACEA Agreement). The structure of costsof the use of cars and the highly subjective discount rates prevailing in this domain implythat consumers need very high incentives (or taxes on fuels) to prematurely replace theircars. Therefore, the life cycle of changes is aligned to the normal life cycle of the averagecar (see Pattas, 1997).
No technological breakthrough is expected before 2010, both as regards fuel cells andelectric cars. However, the very high, energy efficiency of fuel cells by 2020 (assumed tobe close to 3lt/100km), may lead to some penetration in the transportation market beyond2010 but their initial application is more likely to occur in trains rather than trucks, and intrucks rather than cars. The first commercial prototypes are expected to be available inthe Californian market before 2005. Similarly, the electric car, and a related breakthroughin batteries, represents a major potential uncertainty.
The major difference between transport modes, that is mainly responsible for theirdifferent behaviour as described above, is related to the size of vehicles and their relationto economies of scale. In addition, technologies that facilitate economies of scale inenergy use are much more likely to be adopted by firms (as in the case of aviation,railroads and public road transport) than by individuals (owners of private cars). Theperception of capital costs and opportunity costs of capital naturally differ, in a way thatinvestment in efficiency is easier to be adopted by firms.
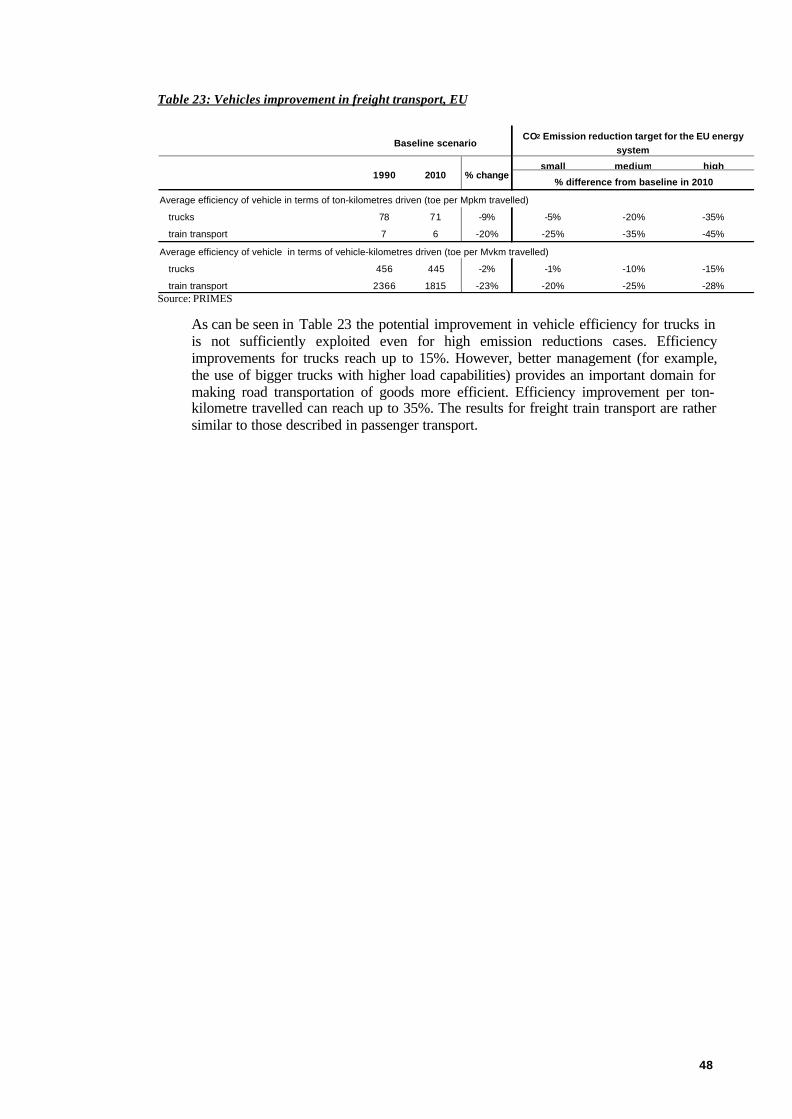
48
Table 23: Vehicles improvement in freight transport, EU
small medium high
Average efficiency of vehicle in terms of ton-kilometres driven (toe per Mpkm travelled)
trucks 78 71 -9% -5% -20% -35%
train transport 7 6 -20% -25% -35% -45%
Average efficiency of vehicle in terms of vehicle-kilometres driven (toe per Mvkm travelled)
trucks 456 445 -2% -1% -10% -15%
train transport 2366 1815 -23% -20% -25% -28%
CO2 Emission reduction target for the EU energy system
% difference from baseline in 2010
Baseline scenario
1990 2010 % change
Source: PRIMES
As can be seen in Table 23 the potential improvement in vehicle efficiency for trucks inis not sufficiently exploited even for high emission reductions cases. Efficiencyimprovements for trucks reach up to 15%. However, better management (for example,the use of bigger trucks with higher load capabilities) provides an important domain formaking road transportation of goods more efficient. Efficiency improvement per ton-kilometre travelled can reach up to 35%. The results for freight train transport are rathersimilar to those described in passenger transport.
49
6. CO2 Reduction from Electricity and Steam GenerationThe PRIMES model as used within the Shared Analysis project quantified a set ofscenarios for the electricity and steam generation sector.
The projections for the sectors were designed to be consistent with the rest of the energysystem. Scenarios that reduce emissions are assumed to simulate a response of the entireenergy system to globally imposed emission constraints. In this sense, the scenarios aretop-down oriented, since the model suggests how to allocate to the sectors the globalemission reduction effort. The model follows an explicit representation of technologies,engineering constraints and plants. It should be qualified as an engineering economicmodel.
For the electricity and steam generation system, the model answers to the followingquestion: what is the least total cost operation and configuration (including newinvestment) for the system that produces electricity and steam, separately and/or jointly,so as to meet the demand, while satisfying represent technical, fuel availability andemission restrictions constraints.
The following sections use the results of the PRIMES model emanating from a largeseries of scenarios and sensitivity analysis runs performed to analyse how the power andsteam generation sector reacts to different emission limitation targets for 2010. Thepurpose is to assess the sector’s adjustment possibilities in view of exploring appropriatesectoral objectives in the EU. The sections present this analysis per sub-sector(renewables, cogeneration, etc.). It needs to be emphasised that the results are obtainedusing the entire PRIMES model and not just from sectoral models.
The PRIMES model is fairly detailed and incorporates the following mechanisms:
a) Multiple time periods and capital vintages.
b) Time variation (typical days per season) synchronisation for the following: demandfor electricity and steam, availability of renewable energy sources, fuel prices (ifprices differ by load), operation of plants and imports/exports.
c) Many existing and new technologies for power generation, steam production andcogeneration.
d) Varying technical-economic characteristics of technologies according to plant size,time (technical progress), cogeneration type and optionally learning-by-doing.
e) Multiple fuels represented in spot market conditions or contracts. Multiple renewablesources with time-varying availability constraints.
f) Time variability of imports/exports of electricity under spot market or contractconditions.
g) Three stylised companies (utilities, industrial auto-producers, middle-sizeindependent power producers) with customisable and distinct plant ownership,customer accessibility and distribution possibilities.
h) Emission of several pollutants and representation of abatement technologies.
i) Several policy instruments including: taxes, subsidies, emission constraints,renewable generation constraints, cogeneration constraints etc.
j) Multiple discount rates (according to company type and over time), parameters thatreflect institutional arrangements for the opening of the market and coefficients thatreflect pricing regimes (marginal cost pricing, average cost pricing or mixtures).
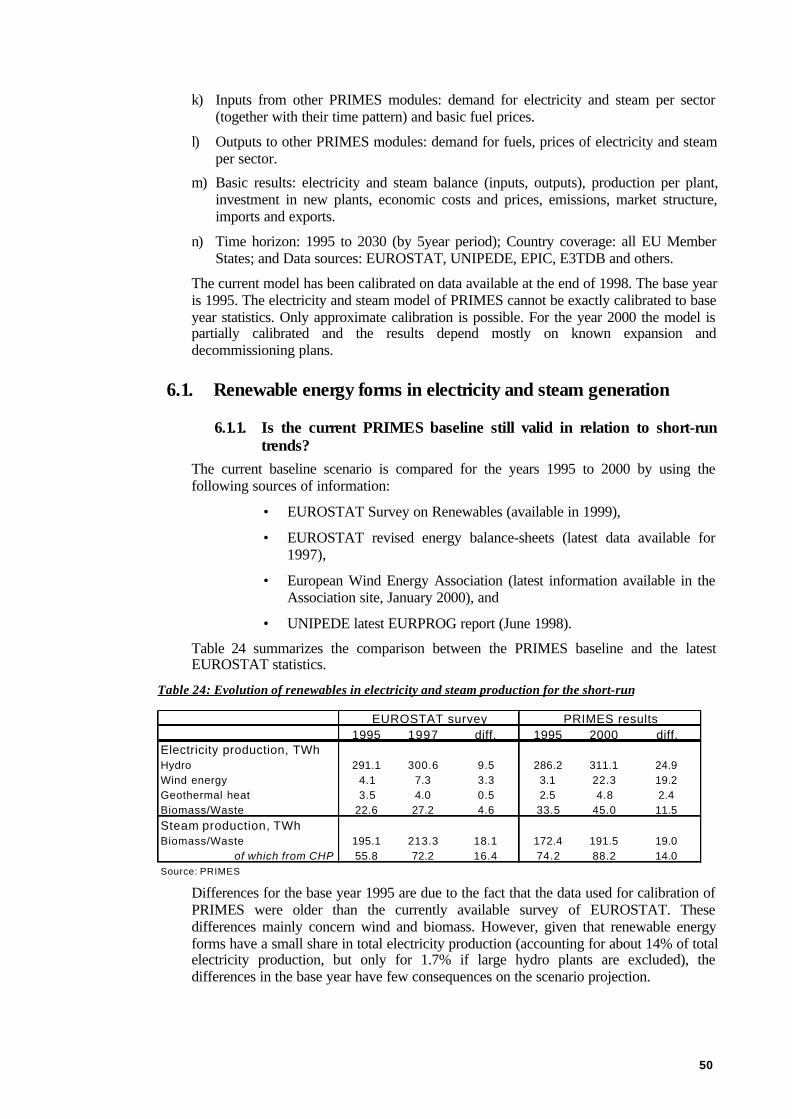
50
k) Inputs from other PRIMES modules: demand for electricity and steam per sector(together with their time pattern) and basic fuel prices.
l) Outputs to other PRIMES modules: demand for fuels, prices of electricity and steamper sector.
m) Basic results: electricity and steam balance (inputs, outputs), production per plant,investment in new plants, economic costs and prices, emissions, market structure,imports and exports.
n) Time horizon: 1995 to 2030 (by 5year period); Country coverage: all EU MemberStates; and Data sources: EUROSTAT, UNIPEDE, EPIC, E3TDB and others.
The current model has been calibrated on data available at the end of 1998. The base yearis 1995. The electricity and steam model of PRIMES cannot be exactly calibrated to baseyear statistics. Only approximate calibration is possible. For the year 2000 the model ispartially calibrated and the results depend mostly on known expansion anddecommissioning plans.
6.1. Renewable energy forms in electricity and steam generation
6.1.1. Is the current PRIMES baseline still valid in relation to short-runtrends?
The current baseline scenario is compared for the years 1995 to 2000 by using thefollowing sources of information:
• EUROSTAT Survey on Renewables (available in 1999),
• EUROSTAT revised energy balance-sheets (latest data available for1997),
• European Wind Energy Association (latest information available in theAssociation site, January 2000), and
• UNIPEDE latest EURPROG report (June 1998).
Table 24 summarizes the comparison between the PRIMES baseline and the latestEUROSTAT statistics.
Table 24: Evolution of renewables in electricity and steam production for the short-run
1995 1997 diff. 1995 2000 diff.Electricity production, TWhHydro 291.1 300.6 9.5 286.2 311.1 24.9Wind energy 4.1 7.3 3.3 3.1 22.3 19.2Geothermal heat 3.5 4.0 0.5 2.5 4.8 2.4Biomass/Waste 22.6 27.2 4.6 33.5 45.0 11.5Steam production, TWhBiomass/Waste 195.1 213.3 18.1 172.4 191.5 19.0
of which from CHP 55.8 72.2 16.4 74.2 88.2 14.0Source: PRIMES
EUROSTAT survey PRIMES results
Differences for the base year 1995 are due to the fact that the data used for calibration ofPRIMES were older than the currently available survey of EUROSTAT. Thesedifferences mainly concern wind and biomass. However, given that renewable energyforms have a small share in total electricity production (accounting for about 14% of totalelectricity production, but only for 1.7% if large hydro plants are excluded), thedifferences in the base year have few consequences on the scenario projection.

51
In the period 1995 to 2000, the fastest growth is observed for wind energy. The otherrenewable energy forms grow at more moderate rates.
The comparison of PRIMES results with recent information on short run trends gives riseto the following remarks:
• The trend in production form hydro plants is adequately captured by PRIMES;1996 and 1997 as surveyed by EUROSTAT were statistically dry years, whereasPRIMES assumes “normal” hydraulic conditions.
• The trends concerning the use of biomass and waste for electricity production arealso adequately captured in the model run; however, probably the increase in theuse of biomass and waste in steam production and cogeneration is slightlyunderestimated in PRIMES.
• According to PRIMES results the installed capacity of wind turbines will reach atotal of 8.4 GW in 2000 (compared to only 1.9 GW in operation in 1995). Thisprojection is slightly lower (by 536 MW) compared to the recent estimation ofEuropean Wind Energy Association (EWEA), according to which the wind parktotalled 8.9 GW at the end of 1999.
Table 25 decomposes this difference by Member State.
Table 25: Wind turbines capacity – Differences between EWEA data and PRIMES results
Country
Tota l MW instal led by end
of 1999PRIMES resul ts
for 2000 DifferenceAustria 4 2 189 -147Belgium 9 139 -130Denmark 1700 1 2 5 0 4 5 0Fin land 3 8 76 -38France 1 9 324 -305G e r m a n y 4444 3 9 6 9 4 7 5Greece 121 141 -20Ire land 6 8 165 -97Italy 281 583 -302Luxemburg 1 0 10Nether lands 409 342 67Portugal 5 7 30 27Spain 1180 566 6 1 4Sweden 195 67 1 2 9Uni ted Kingdom 343 539 -196T O T A L E U 8916 8 3 8 0 5 3 6Source: PRIMES
This table shows how sensitive is the deployment of wind (and the probable forecastingerror) on the development of wind promotion policies. Countries that developed activewind promotion policies experienced fast growth in wind power and the modelunderestimated this development (see the cases of Denmark, Germany and Spain). Othercountries that did not develop such policies still face stagnation and the model over-estimated the evolution (e.g. Austria, Belgium, France, Italy, United Kingdom).
In brief, the scenario needs to revisit some renewables cases for the short run projection,in particular for wind power. However, the implications on CO2 and total energy will bevery small given the small share of renewable energy forms in total electricityproduction. The trends in the short-run are well captured by PRIMES, but the exacttiming of the development largely depends on the amplitude and the effectiveness ofcurrent policies promoting renewables, which substantially differ by country.
52
6.1.2. What is the basic mechanism reflected in the PRIMES baselinescenario towards 2010?
The PRIMES model simulates an economic “private” behaviour of electricity/steamproducers under progressively competitive markets. Under this context, the modelprojects the future use and investment in renewable energies. Public policies to promoterenewables are represented through subsidisation of capital costs for renewable plantsand through obligations applicable on electricity market regulation.
The baseline scenario assumes the following:
• Renewable technologies progress over time (lower capital cost) at rather smoothrates, without experiencing any major technological breakthrough.
• The electricity market liberalisation advances in the short-run and reachescomplete amplitude towards the end of the next decade.
• Current policies promoting renewables (e.g. subsidisation) continue and apply inall Member States.
• The baseline scenario does not assume public authorities imposing strongconstraints favouring renewables (e.g. emission control, non fossil fuelsobligation, etc.) in electricity market regulation.
• Prices of fossil fuels grow very smoothly 30, electricity prices drop (lowermarginal costs) and generation technologies using fossil fuels also progress atsubstantial rates (lower capital costs, improved efficiency).
Under the circumstances described above, the baseline scenario shows a rather limiteddeployment of renewable energies, except for wind energy, and more moderately for theuse of waste. Regarding wind energy, there is significant growth but its contribution fallswell short of potential. The combination of pressures under the competitive market andthe low prices of fossil fuels largely explain these baseline trends. More detailed remarksabout baseline trends are as follows:
• The development of hydro concerns only small-scale run-of-river hydro, which islimited in volume. It is assumed that large hydro is about totally exploited in theEU.
• The deployment of wind energy is noticeable, reaching 22 GW in 2010 (from 8.4GW in 2000). This is in line with previous targets of the EWEA (25 GW), butwell below targets they set recently (60 GW).31 As mentioned earlier, theuncertainty surrounding wind power largely depends on public policies becausethe pressures in the increasingly competitive environment will tend to limit thegrowth of wind power.
• The baseline projection shows a rather significant exploitation of the potential ofelectricity production from waste (landfill gas and others) but no development ofnew biomass (energy crops). This is related to conservative expectations aboutinfrastructure and agricultural policies that could support new biomass.
30 The present rise in oil prices has not been included in the baseline used in this report.31 In the context of the updated baseline scenario, (Scenarios Related to the Security of Supply of theEuropean Union, Report for EU15. Report prepared for the DG Transport and Energy of the EuropeanCommission, November 2000), in which energy prices were revised to reflect recent trends, installedcapacity of wind turbines in 2010 is projected to reach 48 GW. Thus, under the new baseline conditions 80%of the target set by EWEA would be met. Due to lack of time, it was not possible to use this updated baselineas the basis for the analysis in this report, though.

53
Table 26: Evolution of renewables as projected in PRIMES baseline (EU14)
2000 2010increment from 2000
Electricity production, TWhTotal renewables 383.2 440.8 57.5Hydro 311.1 308.6 -2.5Wind energy 22.3 60.3 38.1Geothermal heat 4.8 5.5 0.7Biomass/Waste 45.0 66.3 21.3
of which from new biomass 0.7 0.4 -0.2% in total electricity production 15.0 14.6Steam production, TWhBiomass/Waste 191.5 210.3 18.8
of which from new biomass 1.2 2.1 0.9% in total steam production 17.1 16.2Installed capacities, GWTotal renewables 123.6 138.4 14.8
Biomass-Waste 4.4 4.7 0.3Hydro 109.8 110.7 0.9Wind Turbines 8.4 21.9 13.5Geothermal 1.0 1.1 0.1Solar 0.0 0.0 0.0Tidal 0.0 0.0 0.0
% in total installed capacity 20.2 19.3Source: PRIMES
Table 26 illustrates the evolution of renewable energy forms in power and steamgeneration under baseline conditions between 2000 and 2010. The table shows that therenewable energies remain a small part of overall energy in the EU, despite the fastgrowth in wind power and, to a lesser extent, waste and biomass. Furthermore the growthof renewable energy forms in power and steam generation is slightly lower than totalelectricity and steam production. Consequently, renewable energy forms lose in terms ofmarket shares both as regards electricity and steam generation and as regards installedgeneration capacities (this result is heavily influenced by the preponderance of largehydro-electric plants in the renewables category).
6.1.3. How does the sector adjust when the system meets the Kyoto targetfor 2010?
In this section we draw conclusions by observing how the sector adjusts when the wholeenergy system reduces CO2 emissions to meet the Kyoto commitment. At a system-widelevel, the PRIMES model simulates a least cost allocation of the emission reductioneffort to the various sectors.
The results show that, in order to comply with Kyoto targets in 2010, the power andsteam generation system of the EU undergoes the biggest changes. It is more cost-effective to undertake relatively pronounced emission reduction in power generation thanin just about any other energy consuming sector. The adjustments span a variety ofdomains, including changes in fuel mix (more natural gas), reorientation of investmentchoices, changes of dispatching priorities, and the high use of carbon-free sources suchas renewables and nuclear. For the latter the additional possibilities are very small giventhe short-term horizon of the Kyoto target (2010).
Regarding renewable energy forms, the results show a relatively important contributionto emissions reduction in the power and steam sector.
There are three categories of renewable energies that are by and large not affected by theemission reduction effort. These are large hydropower, geothermal generation andtraditional biomass (wood). These energy forms are constrained by supply and their
54
expansion possibilities are limited further by local considerations (includingenvironmental problems). It should be remembered that large hydropower and traditionalbiomass represent a large fraction of total renewables currently exploited in the EuropeanUnion. For this reason the results as aggregated for the whole of renewables show littlechange from baseline.
Under the emission reduction effort in a short-term horizon, such as 2010, the followingmechanisms become apparent in the model results.
a) Demand for electricity and steam is reduced from baseline, due to demand-sidemeasures.
b) Carbon free sources, such as renewables, are used as much as possible, at giveninstalled capacities. Therefore, their share in electricity production increases. This isalso the case for large hydropower.
c) On top of the baseline trends, additional investment is undertaken in those renewableenergy forms for which expansion under economic and market competitiveconditions is possible. To this respect, the results show a significant development ofwind energy, additional to the baseline.
d) In the Kyoto scenario, the capacity of wind power is projected to reach 38.5 GW in2010 (5% of total capacity), which is in correspondence with the new target ofEWEA (40GW). In that sense it can be argued that the updated EWEA targets wereset considering the context of the Kyoto commitment for the EU. Under thesecircumstances, wind electricity increases by 71% compared to the baseline,representing 3.5% of total electricity production (2% in baseline).
e) Under emission constraints it is cost-effective to further exploit waste and biomass.For the Kyoto target it is not cost effective to develop new biomass (energy crops)but to further exploit existing biomass and waste sources. This goes far beyond thebaseline: 80% higher electricity production from biomass/waste in 2010,representing 4% of total electricity produced (2.2% in baseline). Similarly steamgeneration from existing biomass and waste increases from baseline levels (25%more). The transformation input of biomass-waste increases by 48% compared tobaseline, reaching 45 Mtoe in 2010 (31 Mtoe in baseline).
In total, according to the model results, adjusting to the Kyoto target leads to a highershare of renewable electricity: 18% in 2010 instead of 14% in the baseline. This isobtained under market competition conditions. The high use of renewables correspondsto 13% of CO2 emission reduction in the power and steam generation sector.
How the sector adjusts to allow for higher emission abatement?(This section contains additional information and can be ignored if the focus is the firstcommitment period (2008-2012) of the Kyoto Protocol)
The conclusions about further emission abatement through this sector aredrawn from a large series of model runs varying according to the severity ofthe total emission reduction target. For each such target a least-costallocation of the abatement effort is analysed through the PRIMES model.
We observe how the results concerning renewables change when varying thetotal emission reduction target. This is an indication of the economicpotential of the sector in the context of collective emission abatement efforts.This evaluation is the result of system-wide analysis.
The analysis for the sector of renewable energies in electricity/steamproduction shows that the potential can be seen under three categories:
1. Renewable forms that are already largely exploited in the baselinecannot further expand to contribute to emission reduction. This is the
55
case for large hydro and high enthalpy geothermal heat. In terms ofannual electricity production the potential seems to be up to 310 TWhand 7-8 TWh, respectively.
2. Renewable forms that are nearly competitive under baselineconditions and for which the analysis indicates that it is cost-effectiveto expand at almost linear proportion to the emission reduction target.This is the case for wind power, small hydro and traditionalbiomass/waste energy.
2.1. It is cost-effective to linearly increase the deployment of windenergy when seeking higher total emission reduction. To reachKyoto, wind power is expected to produce 71% more than inthe baseline, where as to reach an emission reduction target twotimes stricter than Kyoto, wind is asked to produce 120% to140% more than in the baseline. The economic potential ofcontribution from wind seems to reach an upper bound thatcorresponds roughly to 150 TWh (6-7% of total electricityproduction) and 55 GW for 2010. The technical potential is ofcourse much higher. Both potentials depend on the assumptionconcerning the characteristics and possibilities of offshore windfor which the assumptions for 2010 are rather conservative.
2.2. Small hydro plants also expand linearly to contribute to emissionreductions. In the context of the Kyoto target production fromsmall hydro increases by 50% from baseline levels while if anemission reduction target two times stricter than Kyoto isimposed the increase from baseline reaches 115%. However,the technical potential of small hydro is rather limited in theEU. Consequently the economic potential contribution fromsmall hydro does not exceed 10 TWh (0.5% of total electricityproduction) and 5.5 GW for 2010.
2.3. It is also cost-effective, within systems analysis to increaseexploiting the potential from traditional biomass/waste energyto produce electricity and steam. Electricity production fromthis energy form can reach a level higher by 50-60 % comparedto baseline (up to 110 TWh) while the corresponding increaseas regards steam production does not exceed 25% (up to 250TWh of steam).
3. Renewable energy forms that are novel and commercially immatureat present. They show a significant growth only beyond a certainthreshold. Such a threshold comes from the fact that the system facesa high emission reduction target and is facing high compliance costs.The technical potential of renewables in these cases starts to beexploited when the marginal cost approximates the overall marginalabatement cost. Once penetration has started deployment could befast according to the mechanisms of the model. Such cases are: newbiomass, solar and tidal electricity.
3.1. The development of new biomass energy forms can be considerablein theory, but it depends on supply conditions (infrastructure,agriculture policy, etc.). In any case, it is necessary to operateat significantly higher electricity production costs beforeallowing the development of new biomass on economicgrounds. The potential for 2010 is rather limited, because of theshort-term horizon: electricity production from new biomass
56
(energy crops) is estimated to reach up to 70 TWh, starting tobe significant at costs corresponding to “double Kyoto”emission reduction targets. This result could be different ifpublic policies acting in favour of biomass infrastructure andagriculture were developed. The model runs do not consider theimplementation of such policies. Also regarding the use ofbiomass to produce biofuels (to be used concurrently to oilproducts), the scenarios take a conservative point of view formany reasons: in a short-run (2010) perspective the refinerieswould face excessively high stranded costs as they haverecently invested to meet Auto-oil requirements; large upstreaminvestments are needed in the domain of biomass production,as mentioned above; pollution problems (in the cities) whenusing biofuels are still a matter of controversy.
3.2. Solar and tidal electricity also need high overall electricitygeneration costs to develop in the short term. The estimationsas regards the economic potential of these energy forms in thehorizon to 2010 are conservative: 4.5 and 1.5 TWhrespectively.
In the presence of high emission reduction targets, the economic potential ofrenewables in total electricity production is estimated to grow by up to 27%.This is the combined effect of the increased penetration of emergingrenewable energy forms (with a significant unexploited potential in thebaseline), the maximum utilisation of renewable energy forms that are highlyexploited even under baseline conditions and the decrease in electricity andsteam demand because of the adoption of demand-side measures. Up to 22%of CO2 emission reduction in power and steam generation sector can beachieved through the increased use of renewable energies in the sector, in ahorizon to 2010.
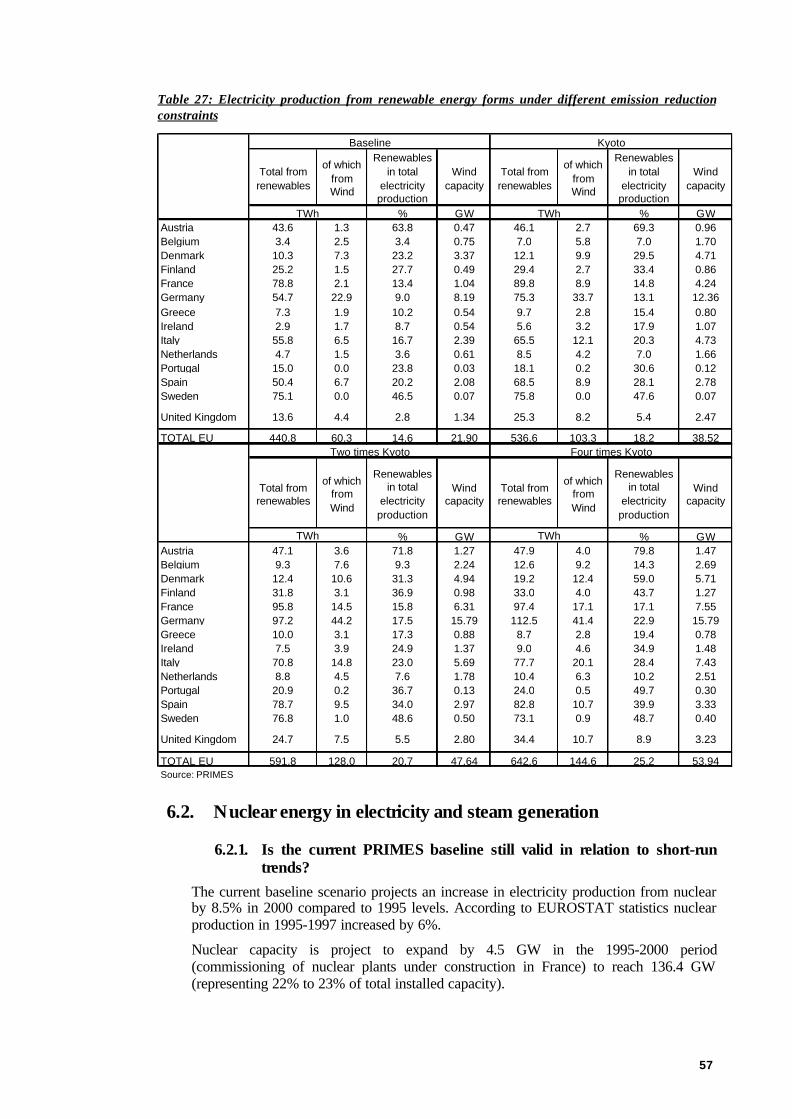
57
Table 27: Electricity production from renewable energy forms under different emission reductionconstraints
Total from renewables
of which from Wind
Renewables in total
electricity production
Wind capacity
Total from renewables
of which from Wind
Renewables in total
electricity production
Wind capacity
% GW % GWAustria 43.6 1.3 63.8 0.47 46.1 2.7 69.3 0.96Belgium 3.4 2.5 3.4 0.75 7.0 5.8 7.0 1.70Denmark 10.3 7.3 23.2 3.37 12.1 9.9 29.5 4.71Finland 25.2 1.5 27.7 0.49 29.4 2.7 33.4 0.86France 78.8 2.1 13.4 1.04 89.8 8.9 14.8 4.24Germany 54.7 22.9 9.0 8.19 75.3 33.7 13.1 12.36Greece 7.3 1.9 10.2 0.54 9.7 2.8 15.4 0.80Ireland 2.9 1.7 8.7 0.54 5.6 3.2 17.9 1.07Italy 55.8 6.5 16.7 2.39 65.5 12.1 20.3 4.73Netherlands 4.7 1.5 3.6 0.61 8.5 4.2 7.0 1.66Portugal 15.0 0.0 23.8 0.03 18.1 0.2 30.6 0.12Spain 50.4 6.7 20.2 2.08 68.5 8.9 28.1 2.78Sweden 75.1 0.0 46.5 0.07 75.8 0.0 47.6 0.07
United Kingdom 13.6 4.4 2.8 1.34 25.3 8.2 5.4 2.47
TOTAL EU 440.8 60.3 14.6 21.90 536.6 103.3 18.2 38.52
Total from renewables
of which from Wind
Renewables in total
electricity production
Wind capacity
Total from renewables
of which from Wind
Renewables in total
electricity production
Wind capacity
% GW % GWAustria 47.1 3.6 71.8 1.27 47.9 4.0 79.8 1.47Belgium 9.3 7.6 9.3 2.24 12.6 9.2 14.3 2.69Denmark 12.4 10.6 31.3 4.94 19.2 12.4 59.0 5.71Finland 31.8 3.1 36.9 0.98 33.0 4.0 43.7 1.27France 95.8 14.5 15.8 6.31 97.4 17.1 17.1 7.55Germany 97.2 44.2 17.5 15.79 112.5 41.4 22.9 15.79Greece 10.0 3.1 17.3 0.88 8.7 2.8 19.4 0.78Ireland 7.5 3.9 24.9 1.37 9.0 4.6 34.9 1.48Italy 70.8 14.8 23.0 5.69 77.7 20.1 28.4 7.43Netherlands 8.8 4.5 7.6 1.78 10.4 6.3 10.2 2.51Portugal 20.9 0.2 36.7 0.13 24.0 0.5 49.7 0.30Spain 78.7 9.5 34.0 2.97 82.8 10.7 39.9 3.33Sweden 76.8 1.0 48.6 0.50 73.1 0.9 48.7 0.40
United Kingdom 24.7 7.5 5.5 2.80 34.4 10.7 8.9 3.23
TOTAL EU 591.8 128.0 20.7 47.64 642.6 144.6 25.2 53.94Source: PRIMES
TWh TWh
Two times Kyoto Four times Kyoto
TWh TWh
Baseline Kyoto
6.2. Nuclear energy in electricity and steam generation
6.2.1. Is the current PRIMES baseline still valid in relation to short-runtrends?
The current baseline scenario projects an increase in electricity production from nuclearby 8.5% in 2000 compared to 1995 levels. According to EUROSTAT statistics nuclearproduction in 1995-1997 increased by 6%.
Nuclear capacity is project to expand by 4.5 GW in the 1995-2000 period(commissioning of nuclear plants under construction in France) to reach 136.4 GW(representing 22% to 23% of total installed capacity).
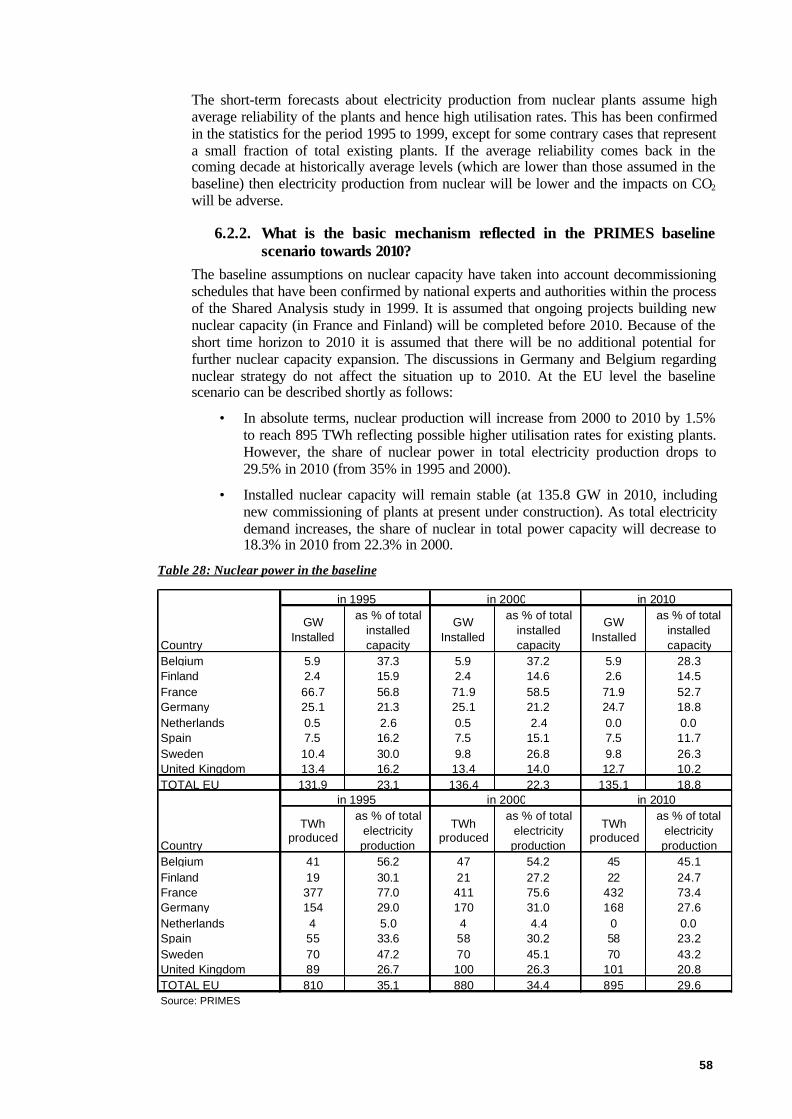
58
The short-term forecasts about electricity production from nuclear plants assume highaverage reliability of the plants and hence high utilisation rates. This has been confirmedin the statistics for the period 1995 to 1999, except for some contrary cases that representa small fraction of total existing plants. If the average reliability comes back in thecoming decade at historically average levels (which are lower than those assumed in thebaseline) then electricity production from nuclear will be lower and the impacts on CO2
will be adverse.
6.2.2. What is the basic mechanism reflected in the PRIMES baselinescenario towards 2010?
The baseline assumptions on nuclear capacity have taken into account decommissioningschedules that have been confirmed by national experts and authorities within the processof the Shared Analysis study in 1999. It is assumed that ongoing projects building newnuclear capacity (in France and Finland) will be completed before 2010. Because of theshort time horizon to 2010 it is assumed that there will be no additional potential forfurther nuclear capacity expansion. The discussions in Germany and Belgium regardingnuclear strategy do not affect the situation up to 2010. At the EU level the baselinescenario can be described shortly as follows:
• In absolute terms, nuclear production will increase from 2000 to 2010 by 1.5%to reach 895 TWh reflecting possible higher utilisation rates for existing plants.However, the share of nuclear power in total electricity production drops to29.5% in 2010 (from 35% in 1995 and 2000).
• Installed nuclear capacity will remain stable (at 135.8 GW in 2010, includingnew commissioning of plants at present under construction). As total electricitydemand increases, the share of nuclear in total power capacity will decrease to18.3% in 2010 from 22.3% in 2000.
Table 28: Nuclear power in the baseline
GW Installed
as % of total installed capacity
GW Installed
as % of total installed capacity
GW Installed
as % of total installed capacity
Belgium 5.9 37.3 5.9 37.2 5.9 28.3Finland 2.4 15.9 2.4 14.6 2.6 14.5France 66.7 56.8 71.9 58.5 71.9 52.7Germany 25.1 21.3 25.1 21.2 24.7 18.8Netherlands 0.5 2.6 0.5 2.4 0.0 0.0Spain 7.5 16.2 7.5 15.1 7.5 11.7Sweden 10.4 30.0 9.8 26.8 9.8 26.3United Kingdom 13.4 16.2 13.4 14.0 12.7 10.2TOTAL EU 131.9 23.1 136.4 22.3 135.1 18.8
TWh produced
as % of total electricity production
TWh produced
as % of total electricity production
TWh produced
as % of total electricity production
Belgium 41 56.2 47 54.2 45 45.1Finland 19 30.1 21 27.2 22 24.7France 377 77.0 411 75.6 432 73.4Germany 154 29.0 170 31.0 168 27.6Netherlands 4 5.0 4 4.4 0 0.0Spain 55 33.6 58 30.2 58 23.2Sweden 70 47.2 70 45.1 70 43.2United Kingdom 89 26.7 100 26.3 101 20.8TOTAL EU 810 35.1 880 34.4 895 29.6Source: PRIMES
Country
in 1995 in 2000 in 2010
Country
in 1995 in 2000 in 2010
59
6.2.3. How does the sector adjust when the system meets the Kyoto targetfor 2010?
Emission constraints in a short horizon, like that of 2010, cannot significantly affectnuclear energy. Capacity expansion is not possible given the long lead-times needed fornuclear commissioning. Nuclear energy being free of carbon has to be used as much aspossible to comply with the emission reduction target at least cost. Therefore underemission restrictions nuclear capacities are utilised at maximum rates, despite the relativedecrease of total electricity production due to the adoption of demand–side electricitysaving measures in emission limitation scenarios. Under baseline conditions there is alsointerest to maximise the use of existing nuclear capacity, for economic reasons (lowvariable operating costs).
Therefore, within the horizon to 2010 and under the Kyoto emission reduction constraint,nuclear electricity generation remains stable at the level of the baseline. As totalelectricity demand decreases, the share of nuclear electricity increases, so nuclear energycontributes to CO2 emissions reduction. Under the Kyoto constraint, the contribution ofnuclear energy to CO2 emissions reduction in the power and steam generation sector isabout 17%.
How the sector adjusts to allow for higher emission abatement?(This section contains additional information and can be ignored if the focus is the firstcommitment period (2008-2012) of the Kyoto Protocol)
For the reasons mentioned above the system facing higher emissionreduction targets cannot readily affect nuclear electricity in the short horizonto 2010. Within such a horizon the potential for nuclear production mayreach TWh per year, which represents roughly a share of 30% that may beeven higher when total electricity production decreases because of demand-side saving measures.
6.3. Changes in the fuel mix and Cogeneration
6.3.1. Sector coverage in PRIMESBecause of the importance of power generation in meeting future energy needs, thepossible development of cogeneration of heat and power and the possible emergence ofvarious types of new players (generators) in the market, the PRIMES model representsthe whole power and steam/heat production sector in the same sub-model. The modellingincludes the following cases:
• Power generation by utilities and independent power producers
• Cogeneration in large plants belonging to utilities, usually through abackpressure technology; possibility to deliver steam/heat to industrial users orto district heating networks
• Cogeneration of industrial steam through various technologies (extracting-condensing) that may vary in their heat-to-power ratio; competition withgeneration using industrial boilers with or without heat recovery from industrialprocessing plants
• Steam and power units of refineries
• Cogeneration and boilers that produce heat distributed in district heatingnetworks; consideration of large and small district heating or cooling networksfor both the residential and the tertiary sectors.
60
6.3.2. Foundations of the baseline scenarioStarting from 1999, the European Union has established a progressive liberalisation ofthe electricity market. Although probably not reflected in the official statistics that areavailable for the period 1995 to 1997, there is evidence that the electricity market playershave anticipated the liberalisation developments even before 1999. They have thereforeundergone changes in their choices about fuel and technology of plants. Under the newmarket conditions, the investors seek a higher return on capital than public utilities havein the past and generally prefer choices involving lower capital expenditure in responseto increased perceived risks associated with the more competitive market environment.
These market developments coincide with the spectacular progress in the gas turbinetechnologies and the ensuing dramatic improvement of the efficiency of gas turbinecombined cycle plants.
As has been analysed in detail in the recently published “European Union EnergyOutlook to 2020”, the drivers of change in the liberalised electricity market are mainlythe gas-firing power technologies. The gas turbine combined cycle technologies, thesimple gas turbines, the steam-injection CHP gas turbines and similar technologies atdifferent plant sizes; they have all exhibited considerable progress over the recent yearsin both their costs and efficiency. In addition these technologies have enabled closing thegap in cost terms between small and large generators, a gap that has contributed to highlycentralised generation in the past. Under market conditions such cost-efficienttechnologies, with small cost-size gradient, enable the emergence of new players in themarket, including small generators, auto-producers, middle-size independent producers,etc. It is assumed that these factors drive diversification in power generation,decentralisation of conversion and the emergence of a variety of new generatorsexploiting the economic opportunities.
These factors (technology and market) also drive the development of cogeneration underbaseline conditions. It should be stressed that the baseline scenario assumes low naturalgas prices in the coming decade. If gas prices evolved differently (for example because ofhigh oil prices driving gas prices up) the development of cogeneration would be muchlower than projected in the current analysis. Similarly, high gas prices would have aconsiderable impact on the fuel mix, offsetting the expected shifts in favour of gas and tothe detriment of solid fuels. The analysis has identified that the power sector will be verysensitive to the price of natural gas and its competitiveness vis-à-vis solid fuels in thecoming two decades.
Regarding cogeneration of power and steam, three cases are considered:
• Small-scale cogeneration that exploit a niche market. There are many examples:cogeneration using landfill gas and waste also justified in terms of the costs ofwaste management; specific industrial processes that use high volume and base-load steam; large complexes of office buildings that may cover high demand forheating, cooling and electricity through cogeneration. Those cases of small-scalecogeneration might not have been exploited in the past for many reasons rangingfrom technology availability to monopolistic market protection. It is expectedthat such cases will develop strongly in the context of liberalised markets.
• Medium-scale cogeneration (mostly industrial). Its development can be partlyjustified because of auto-consumption of steam/electricity but certainly needsattractive electricity market prices to develop. These cases become economicallyattractive when the generator can build bigger cogeneration plants than the sizeof his needs in order to be competitive and sell substantial excess quantities ofelectricity to the market. The success of these cases in the market is uncertainand will depend on many factors, including market prices and market power. Forexample, if powerful market players decrease the electricity market prices and
61
use in excess their old reserve capacities, middle size cogeneration could sufferbecause its success largely depends on its competitiveness in the electricitymarket. This explains why cogeneration effectively suffers in some MemberStates, at present.
• Large-scale cogeneration based on the massive waste heat of large powergeneration plants of utilities. Except some small-scale niche-marketopportunities, there are few chances to observe development of these cases underthe liberalised market. Massive investments in district heating networks areneeded to develop large-scale cogeneration, which are unlikely to be financedunder market liberalisation conditions.
The cost-effectiveness of gas powered technologies in enabling conversiondecentralisation and cogeneration also depends on the relative price of natural gas whencomparing gas contracts of large utilities to prices for small generators and co-generators.To facilitate the deployment of the latter in the liberalised markets, the differential of gasprices relative to the size of the consumer has to decrease. Gas market liberalisation, gas-to-gas competition and the establishment of multiple gas trading transactions in Europecould greatly drive fair pricing in the gas supply market. This is the aim of the gas marketliberalisation, also established by the European Union, as an essential complement to theelectricity market liberalisation.
The baseline scenario assumes that these joint expected developments will succeed. Theanalysis showed that a fundamental condition is that primary gas supply prices remainrelatively competitive allowing for substantial fuel mix shifts in favour of gas (and to thedetriment of solid fuels, mostly hard coal), the decentralisation of generation, theexploitation of the economic potential of cogeneration (both for industrial steam anddistrict heating) and the general lowering of prices. Evidently such developments arefavourable to the environment, regarding both acidification and climate change.
6.3.3. Is the current PRIMES baseline still valid?All recent information and statistics confirm the rapid penetration of natural gas in powergeneration and cogeneration. Generation from solid fuels is reduced, especially from hardcoal (generation from lignite is rather stable). Also generation from oil is reduced.
A comparison between latest EUROSTAT statistics and the PRIMES projection for theshort run regarding the evolution of fossil fuels in power and steam generation isprovided in Table 29.The PRIMES projection for the short-term horizon to 2000 seemsin line with the evolution of transformation input in the 1995-1997 period.
As projected by PRIMES, the growth of electricity produced from natural gas between1995 and 2000 (+72%) is well above the corresponding growth in steam produced bynatural gas. This is due to the fact that the commissioning of new GTCC plants iscurrently the main cause for the rapid penetration of natural gas.
Capacity in GTCC plants more than doubles in 2000 reaching 59 GW (10% of totalinstalled capacity) compared to 24.5 GW in 1995 (4.5% of total installed capacity).Capacity of other thermal power plants decreases by more than 10 GW in the sameperiod. For the limited time horizon to 2000 both capacity expansion anddecommissioning have been crosschecked with statistical information available at thelatest EURPROG report of UNIPEDE.
62
Table 29: Transformation input of fossil fuels in power and steam generation (in Mtoe) for the short-run
1995 1997 % change 1995 2000 % changeTotal fossil 269 264 -1.9 343 350 2.1
Solid fuels 164 150 -8.5 171 150 -12.5Liquid fuels 45 40 -10.8 89 78 -12.0Natural gas 61 75 22.8 77 116 50.7
Source: PRIMES
EUROSTAT statistics PRIMES results
The shift towards natural gas leads to an improvement of energy efficiency in electricityproduction by 3 percentage points between 1995 and 2000 (from 35% to 38%).
In 1995, about 9% of electricity production and 46.5% of steam production was producedby cogeneration (CHP) units. According to the latest EUROSTAT statistics steamproduction from CHP units increased by 13.5% between 1995 and 1997. The PRIMESprojection for 2000 indicates an increase of 8% in steam production from CHP unitssince 1995 (representing more than 48% of total steam produced in 2000).
A strong increase in electricity production from CHP units (+23.5% from 1995 to 2000accounting for more than 10% of total electricity production in 2000) is also projected.According to the latest information available from the European Association for thePromotion of Cogeneration (COGEN Europe) in 1999, effectively about 10% of totalelectricity production in the EU was from CHP units.
On the basis of capacity expansion and decommissioning plans as available at the latestreport EURPROG report of UNIPEDE and other statistical sources (e.g. EPIC) thecapacity of cogeneration units increases between 1995 and 2000 by 17 GW to reach13.5% of total installed capacity (11% in 1995). The bulk of the investment incogeneration plants concerns natural gas fired units (mainly commissioned byindependent producers) the capacity of which increases by 11 GW in 2000 from 1995levels. Total CHP capacity in the EU is at present around 82 GW.
Table 30: Evolution of electricity production from fossil fuels, EU 2000-2010
Electricity production, TWh (incl. Cogeneration) 1995 2000 2010% change 2000-2010
Total fossil 1171 1299 1688 44.2Solid fuels 670 575 499 -25.5Liquid fuels (excl. refinery gas) 179 170 105 -41.7Natural gas and other gas fuels 322 554 1085 237.1
% in total electricity production 50.8 50.7 55.8
Installed capacities, GW (incl. Cogeneration) 1995 2000 2010increment 2000-2010
Total thermal 325.1 352.6 443.6 91.0of which GTCC 24.5 59.0 208.6 149.5
% in total installed capacity 57.0 57.6 61.9Source: PRIMES
In some Member States there are signs that the drop in electricity market prices that isdue to market liberalisation caused a slowdown, even a closure, of some cogenerationprojects and plants. Reports (from COGEN Europe) indicate that this is more noticeablein Germany. The PRIMES results for the short-term do confirm such a trend. Forexample industrial steam produced with CHP is projected to decrease in Germany in2000 compared to 1995. This is due to the combined effect of abandoning backpressuretechnologies because gas-turbine techniques are more competitive in the context of theliberalised market, and the fall of electricity market prices. However, the PRIMESbaseline scenario, assumes that this is a temporary phenomenon and that in the longerterm, when there will be no more possibilities for drastically lower prices (since initial
63
rents will vanish), the economic opportunities for cogeneration will be exploited. As aconsequence the baseline scenario is optimistic about the development of cogeneration ina horizon to 2010, in all Member States including Germany.
The further penetration of natural gas is confirmed in the baseline scenario as shown inthe following (see also Table 30):
• Capacity of GTCC plants is projected to increase to 210 GW (30% of totalinstalled capacity) in 2010 (+150 GW from 2000 level). Installed capacities ofthermal power plants increase by 91 GW in the same period (capacities in otherthermal plants decreasing by more than 80 GW between 2000 and 2010). Thismeans that the GTCC technology remains the dominant choice in the EU powergeneration system in the horizon to 2010.
• Electricity production from natural gas reaches 36% of total electricity produced(21.5% in 2000) corresponding to a growth of 96% from 2000 to 2010 (+530TWh). Electricity production from coal decreases by 13% in 2010 while thatfrom oil products decreases by almost 40%.
In the baseline energy efficiency of electricity generation improves further as a result ofinvesting in GTCC power plants and reaches on average 43.5% in 2010 (38% in 2000),which is unprecedented in the history of power generation. At low gas prices, thisrestructuring also allows for unprecedented low electricity generation costs explainingwhy prices drop and technologies such as renewables and nuclear become economicallyless attractive and hardly penetrate the market in a horizon to 2010. Furthermore the shifttowards natural gas leads to an improvement of carbon intensity in power and steamgeneration by 11% from 2000 (20% better than 1995).
Table 31: Evolution of cogeneration under baseline, EU 2000-2010
2000 2010 % changeCogeneration production (TWh)
Electricity 259 478 84.2Steam 539 802 48.9
Shares in %Share of CHP in Electricity Generation 10.1 15.8Share of CHP in Steam Generation 48.1 61.9
Source: PRIMES
Table 32: Cogeneration capacities under baseline, EU 2000-2010
GW Installed
as % of total installed capacity
GW Installed
as % of total installed capacity
GW Installed
as % of total installed capacity
Austria 2.9 16.3 3.1 16.9 4.6 21.2Belgium 2.0 12.9 1.8 11.6 3.4 16.3Denmark 7.2 64.8 8.1 66.6 7.0 53.1Finland 5.9 39.3 6.5 39.9 8.6 47.0France 3.0 2.5 2.9 2.4 10.1 7.4Germany 18.6 15.8 22.4 19.0 23.6 17.9Greece 0.4 4.7 0.7 5.9 1.0 6.8Ireland 0.1 2.5 0.1 1.9 0.3 4.4Italy 6.7 9.8 10.9 14.0 10.2 12.0Netherlands 6.4 30.3 9.1 40.9 14.0 48.3Portugal 0.8 8.2 0.9 8.5 1.4 9.5Spain 2.1 4.6 2.4 4.8 6.4 9.9Sweden 3.5 10.1 5.6 15.3 8.1 21.7United Kingdom 5.1 6.2 7.3 7.6 36.6 29.4TOTAL EU 64.7 11.4 81.8 13.4 134.9 18.8Source: PRIMES
Country
in 1995 in 2000 in 2010
In terms of steam generation, the share of cogeneration increases steadily in the baselineand reaches 62% by 2010 (from 48% in 2000). Industrial steam remains the driver for
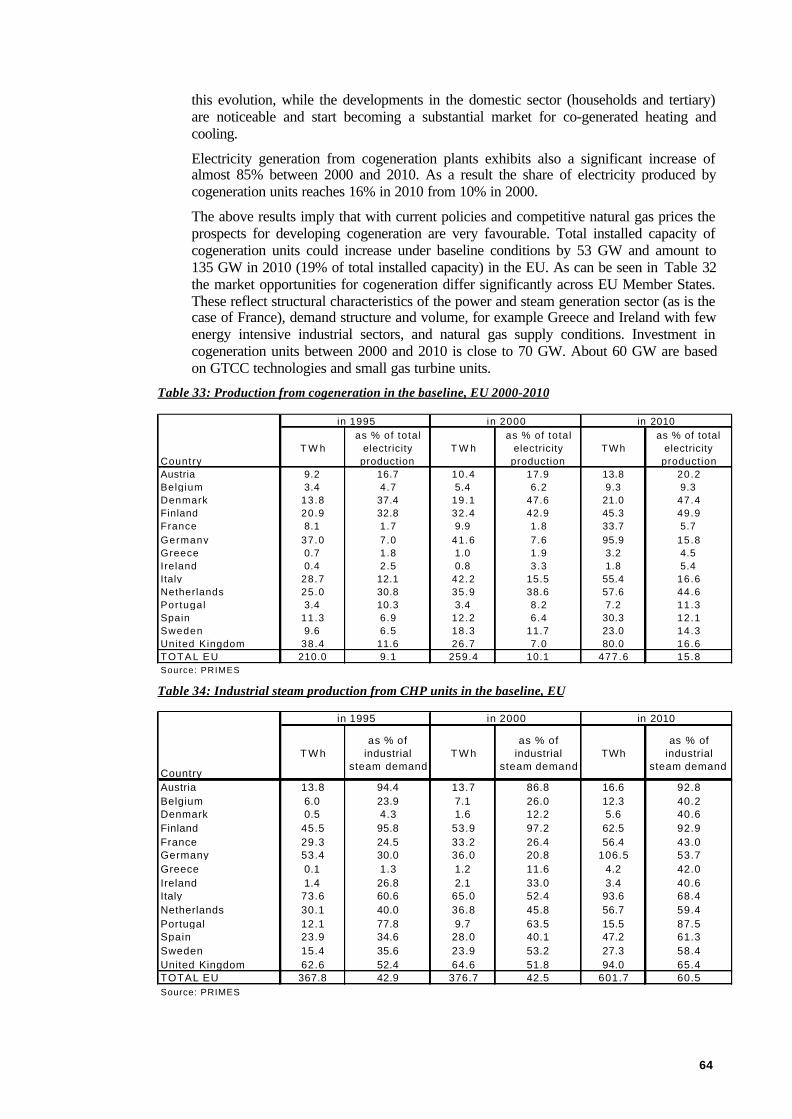
64
this evolution, while the developments in the domestic sector (households and tertiary)are noticeable and start becoming a substantial market for co-generated heating andcooling.
Electricity generation from cogeneration plants exhibits also a significant increase ofalmost 85% between 2000 and 2010. As a result the share of electricity produced bycogeneration units reaches 16% in 2010 from 10% in 2000.
The above results imply that with current policies and competitive natural gas prices theprospects for developing cogeneration are very favourable. Total installed capacity ofcogeneration units could increase under baseline conditions by 53 GW and amount to135 GW in 2010 (19% of total installed capacity) in the EU. As can be seen in Table 32the market opportunities for cogeneration differ significantly across EU Member States.These reflect structural characteristics of the power and steam generation sector (as is thecase of France), demand structure and volume, for example Greece and Ireland with fewenergy intensive industrial sectors, and natural gas supply conditions. Investment incogeneration units between 2000 and 2010 is close to 70 GW. About 60 GW are basedon GTCC technologies and small gas turbine units.
Table 33: Production from cogeneration in the baseline, EU 2000-2010
T W has % of total
electricity production
T W has % of total
electricity production
TWhas % of total
electricity production
Austria 9.2 16.7 10.4 17.9 13.8 20.2Belgium 3.4 4.7 5.4 6.2 9.3 9.3Denmark 13.8 37.4 19.1 47.6 21.0 47.4Finland 20.9 32.8 32.4 42.9 45.3 49.9France 8.1 1.7 9.9 1.8 33.7 5.7Germany 37.0 7.0 41.6 7.6 95.9 15.8Greece 0.7 1.8 1.0 1.9 3.2 4.5Ireland 0.4 2.5 0.8 3.3 1.8 5.4Italy 28.7 12.1 42.2 15.5 55.4 16.6Netherlands 25.0 30.8 35.9 38.6 57.6 44.6Portugal 3.4 10.3 3.4 8.2 7.2 11.3Spain 11.3 6.9 12.2 6.4 30.3 12.1Sweden 9.6 6.5 18.3 11.7 23.0 14.3United Kingdom 38.4 11.6 26.7 7.0 80.0 16.6TOTAL EU 210.0 9.1 259.4 10.1 477.6 15.8Source: PRIMES
Country
in 1995 in 2000 in 2010
Table 34: Industrial steam production from CHP units in the baseline, EU
T W has % of
industrial steam demand
T W has % of
industrial steam demand
TWhas % of
industrial steam demand
Austria 13.8 94.4 13.7 86.8 16.6 92.8Belgium 6.0 23.9 7.1 26.0 12.3 40.2Denmark 0.5 4.3 1.6 12.2 5.6 40.6Finland 45.5 95.8 53.9 97.2 62.5 92.9France 29.3 24.5 33.2 26.4 56.4 43.0Germany 53.4 30.0 36.0 20.8 106.5 53.7Greece 0.1 1.3 1.2 11.6 4.2 42.0Ireland 1.4 26.8 2.1 33.0 3.4 40.6Italy 73.6 60.6 65.0 52.4 93.6 68.4Netherlands 30.1 40.0 36.8 45.8 56.7 59.4Portugal 12.1 77.8 9.7 63.5 15.5 87.5Spain 23.9 34.6 28.0 40.1 47.2 61.3Sweden 15.4 35.6 23.9 53.2 27.3 58.4United Kingdom 62.6 52.4 64.6 51.8 94.0 65.4TOTAL EU 367.8 42.9 376.7 42.5 601.7 60.5Source: PRIMES
Country
in 1995 in 2000 in 2010
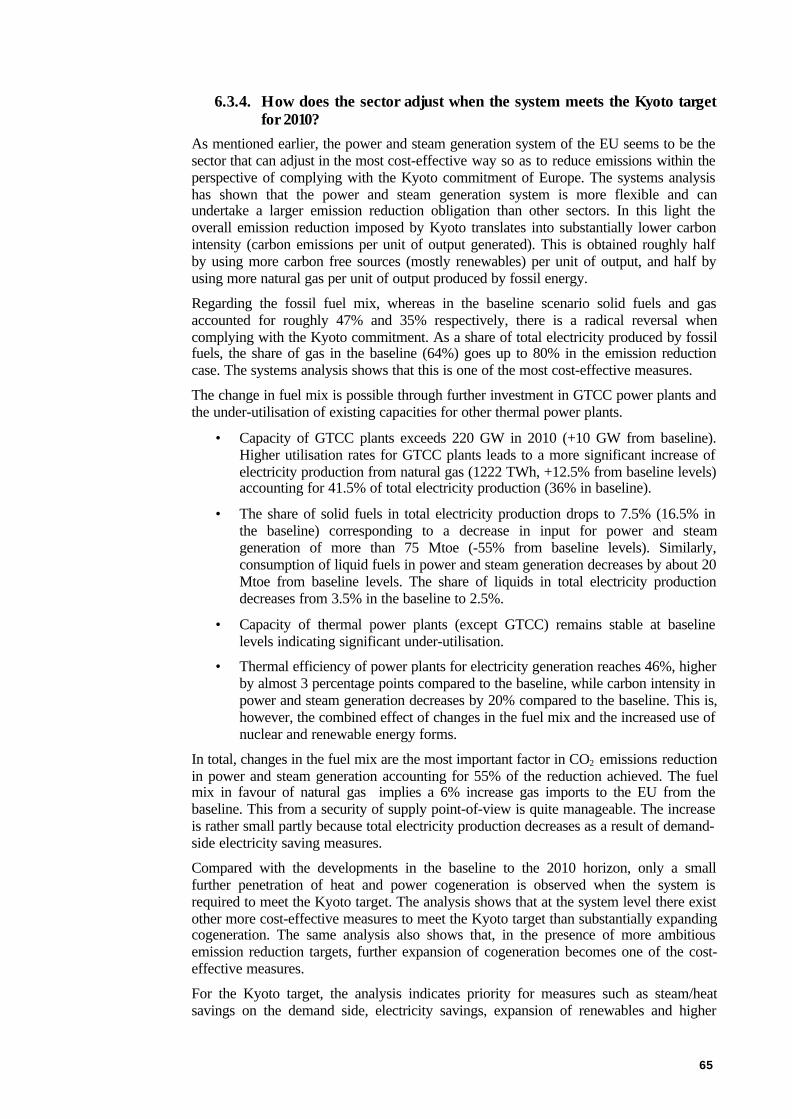
65
6.3.4. How does the sector adjust when the system meets the Kyoto targetfor 2010?
As mentioned earlier, the power and steam generation system of the EU seems to be thesector that can adjust in the most cost-effective way so as to reduce emissions within theperspective of complying with the Kyoto commitment of Europe. The systems analysishas shown that the power and steam generation system is more flexible and canundertake a larger emission reduction obligation than other sectors. In this light theoverall emission reduction imposed by Kyoto translates into substantially lower carbonintensity (carbon emissions per unit of output generated). This is obtained roughly halfby using more carbon free sources (mostly renewables) per unit of output, and half byusing more natural gas per unit of output produced by fossil energy.
Regarding the fossil fuel mix, whereas in the baseline scenario solid fuels and gasaccounted for roughly 47% and 35% respectively, there is a radical reversal whencomplying with the Kyoto commitment. As a share of total electricity produced by fossilfuels, the share of gas in the baseline (64%) goes up to 80% in the emission reductioncase. The systems analysis shows that this is one of the most cost-effective measures.
The change in fuel mix is possible through further investment in GTCC power plants andthe under-utilisation of existing capacities for other thermal power plants.
• Capacity of GTCC plants exceeds 220 GW in 2010 (+10 GW from baseline).Higher utilisation rates for GTCC plants leads to a more significant increase ofelectricity production from natural gas (1222 TWh, +12.5% from baseline levels)accounting for 41.5% of total electricity production (36% in baseline).
• The share of solid fuels in total electricity production drops to 7.5% (16.5% inthe baseline) corresponding to a decrease in input for power and steamgeneration of more than 75 Mtoe (-55% from baseline levels). Similarly,consumption of liquid fuels in power and steam generation decreases by about 20Mtoe from baseline levels. The share of liquids in total electricity productiondecreases from 3.5% in the baseline to 2.5%.
• Capacity of thermal power plants (except GTCC) remains stable at baselinelevels indicating significant under-utilisation.
• Thermal efficiency of power plants for electricity generation reaches 46%, higherby almost 3 percentage points compared to the baseline, while carbon intensity inpower and steam generation decreases by 20% compared to the baseline. This is,however, the combined effect of changes in the fuel mix and the increased use ofnuclear and renewable energy forms.
In total, changes in the fuel mix are the most important factor in CO2 emissions reductionin power and steam generation accounting for 55% of the reduction achieved. The fuelmix in favour of natural gas implies a 6% increase gas imports to the EU from thebaseline. This from a security of supply point-of-view is quite manageable. The increaseis rather small partly because total electricity production decreases as a result of demand-side electricity saving measures.
Compared with the developments in the baseline to the 2010 horizon, only a smallfurther penetration of heat and power cogeneration is observed when the system isrequired to meet the Kyoto target. The analysis shows that at the system level there existother more cost-effective measures to meet the Kyoto target than substantially expandingcogeneration. The same analysis also shows that, in the presence of more ambitiousemission reduction targets, further expansion of cogeneration becomes one of the cost-effective measures.
For the Kyoto target, the analysis indicates priority for measures such as steam/heatsavings on the demand side, electricity savings, expansion of renewables and higher
66
investment in base-load large GTCC plants. The baseline capacity cogeneration isalready considerable in 2010 because of market liberalisation, low gas prices andtechnological progress. Under these circumstances, cogeneration seems to exploit themost economical opportunities, in cases such as heavy users of steam, use of landfill gas,and other niche-type of markets. Expanding beyond that level does not seem a priority,unless ambitious emission reduction targets are set, implying the power and steamsystem having to face high costs.
The systems analysis reveals that there are some non-linearities in the expansion ofcogeneration under various emission reduction levels. There is slow development underlow emission targets, also due to the high development of cogeneration in the baseline,and then considerable acceleration beyond a certain threshold regarding emission targetsand costs. An engineering analysis on a project-by-project basis would show thatcogeneration is beneficial for emissions and very cost-effective. However, afterexploiting the most economic potential (as it already happens in the baseline), the cost-effectiveness of additional cogeneration projects may be obstructed by the followingfactors: a) cogeneration is also using fossil fuels, so carbon-free sources having higherpriority reduce the potential of cogeneration, b) demand-side saving of steam and heatalso reduces the potential of cogeneration, c) expanding further base-load GTCC plantsto gain maximum electricity generation efficiency also limits the market opportunities ofcogenerators to sell excess electricity to the grid.
How the sector adjusts to allow for higher emission abatement?(This section contains additional information and can be ignored if the focus is the firstcommitment period (2008-2012) of the Kyoto Protocol)
When the energy system, as a whole, is expected to reduce emissions ofcarbon more (for example to meet a target two or four times stricter thanKyoto), then the easy adjustment possibilities for the power generation sectorare rapidly exhausted. In the domain of fuel mix changes few additionalpossibilities exist.
High emission reduction targets induce a significant decrease of demand forelectricity and steam as a consequence of demand-side measures. The drop indemand can reach 22.5% and 20% respectively compared to baseline.Despite this decrease nuclear electricity experiences a slight increase whilethe penetration of renewable energy forms (especially wind energy) is alsoaccelerated. So priority is given to power generation by carbon free sources.The remaining load for thermal fossil power plants is significantly altered:the load is smaller in volume and different in shape (smaller part in base-load). This induces changes in the technology choices of generators. Thesystems analysis shows that under ambitious emission reduction targets, thefollowing changes in the domain of fossil fuels are cost-effective in thepower generation sector:
• Further contribution of GTCC technologies is not possible. GTCCplants have to operate close to base-load to obtain the high efficiencyof the combined cycle. If they operate more in load following mode,their efficiency decreases sharply, reaching that of simple gasturbines, which can be as low as 38%. As a result in the context ofhigh emission reduction targets they are not so attractive and losemarket share in terms of capacity, dropping down to less than 20%of total installed capacity for an emission reduction target four timeshigher than Kyoto (55 GW less than in baseline where GTCC plantsaccounted for 30% of total installed capacity).
67
• Fuel cells, despite their high cost, reach 20GW or 3% of the marketfrom almost zero in the context of the Kyoto target. Additionalinvestments are also projected for ultra-supercritical plants, thecapacity of which increases by 18GW from baseline levels. Ofcourse fuel cells at the same time provide efficient cogenerationwhich also contributes to emission reduction.
The share of electricity generation from fossil fuels drops to 40% of totalproduction (51.5% under Kyoto, 56% in baseline). The corresponding sharesfor natural gas are 32%, 41.5% and 36%.
The contribution of further changes in the fuel mix to total emissionsreduction in power and steam generation becomes more and more limited ashigher emission reduction targets are analysed at system-wide level. Whileunder the Kyoto constraint they are very cost-effective (accounting for 55%of CO2 emissions reduction in power and steam generation), in the case ofstricter emission reduction targets their economic potential becomes limited.For example in the case of an emission reduction target “four times Kyoto”the contribution of changes in the fuel mix to emissions reduction in powerand steam generation drops to 18%.
When the system faces ambitious emission reduction targets, the contributionof cogeneration becomes substantial and combines with progressivedecentralisation of generation. Further expansion of large GTCC technologyis not anymore a cost-effective priority; instead fuel cells and efficient gasturbines with steam injection expand more. These technologies are amenableto cogeneration applications and are also suitable for decentralised siting.Nevertheless the contribution of carbon free sources (mostly renewables) anddemand-side savings becomes more and more important, a trend that restrictsthe market domain for the development of cogeneration. However, despitethis market segment reduction, cogeneration expands substantially.
The above results are very sensitive with respect to the price and othersupply conditions of the fuels used in power and steam generation. Thefollowing elements are crucial:
• The expectations about secure supply of natural gas at low prices.Under pessimistic expectations, the above-mentioned role of naturalgas and GTCC technology could be neutralised.
• The development of infrastructure and agricultural measures toobtain a higher supply potential for biomass; this could greatlyfacilitate the development of cogeneration under carbon restrictionsand could lead to very different conclusions regarding the potentialof cogeneration in Europe.
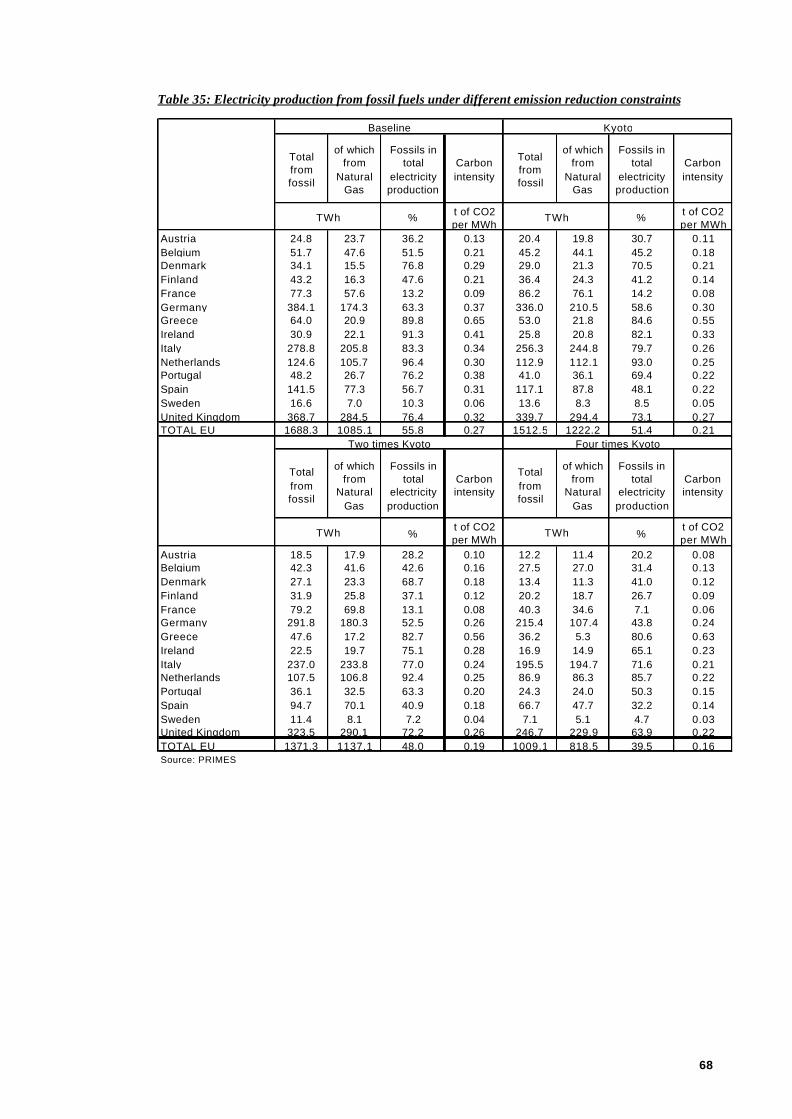
68
Table 35: Electricity production from fossil fuels under different emission reduction constraints
Total from fossil
of which from
Natural Gas
Fossils in total
electricity production
Carbon intensity
Total from fossil
of which from
Natural Gas
Fossils in total
electricity production
Carbon intensity
% t of CO2 per MWh
% t of CO2 per MWh
Austria 24.8 23.7 36.2 0.13 20.4 19.8 30.7 0.11Belgium 51.7 47.6 51.5 0.21 45.2 44.1 45.2 0.18Denmark 34.1 15.5 76.8 0.29 29.0 21.3 70.5 0.21Finland 43.2 16.3 47.6 0.21 36.4 24.3 41.2 0.14France 77.3 57.6 13.2 0.09 86.2 76.1 14.2 0.08Germany 384.1 174.3 63.3 0.37 336.0 210.5 58.6 0.30Greece 64.0 20.9 89.8 0.65 53.0 21.8 84.6 0.55Ireland 30.9 22.1 91.3 0.41 25.8 20.8 82.1 0.33Italy 278.8 205.8 83.3 0.34 256.3 244.8 79.7 0.26Netherlands 124.6 105.7 96.4 0.30 112.9 112.1 93.0 0.25Portugal 48.2 26.7 76.2 0.38 41.0 36.1 69.4 0.22Spain 141.5 77.3 56.7 0.31 117.1 87.8 48.1 0.22Sweden 16.6 7.0 10.3 0.06 13.6 8.3 8.5 0.05United Kingdom 368.7 284.5 76.4 0.32 339.7 294.4 73.1 0.27TOTAL EU 1688.3 1085.1 55.8 0.27 1512.5 1222.2 51.4 0.21
Total from fossil
of which from
Natural Gas
Fossils in total
electricity production
Carbon intensity
Total from fossil
of which from
Natural Gas
Fossils in total
electricity production
Carbon intensity
%t of CO2 per MWh %
t of CO2 per MWh
Austria 18.5 17.9 28.2 0.10 12.2 11.4 20.2 0.08Belgium 42.3 41.6 42.6 0.16 27.5 27.0 31.4 0.13Denmark 27.1 23.3 68.7 0.18 13.4 11.3 41.0 0.12Finland 31.9 25.8 37.1 0.12 20.2 18.7 26.7 0.09France 79.2 69.8 13.1 0.08 40.3 34.6 7.1 0.06Germany 291.8 180.3 52.5 0.26 215.4 107.4 43.8 0.24Greece 47.6 17.2 82.7 0.56 36.2 5.3 80.6 0.63Ireland 22.5 19.7 75.1 0.28 16.9 14.9 65.1 0.23Italy 237.0 233.8 77.0 0.24 195.5 194.7 71.6 0.21Netherlands 107.5 106.8 92.4 0.25 86.9 86.3 85.7 0.22Portugal 36.1 32.5 63.3 0.20 24.3 24.0 50.3 0.15Spain 94.7 70.1 40.9 0.18 66.7 47.7 32.2 0.14Sweden 11.4 8.1 7.2 0.04 7.1 5.1 4.7 0.03United Kingdom 323.5 290.1 72.2 0.26 246.7 229.9 63.9 0.22TOTAL EU 1371.3 1137.1 48.0 0.19 1009.1 818.5 39.5 0.16Source: PRIMES
TWh TWh
Two times Kyoto Four times Kyoto
TWh TWh
Baseline Kyoto
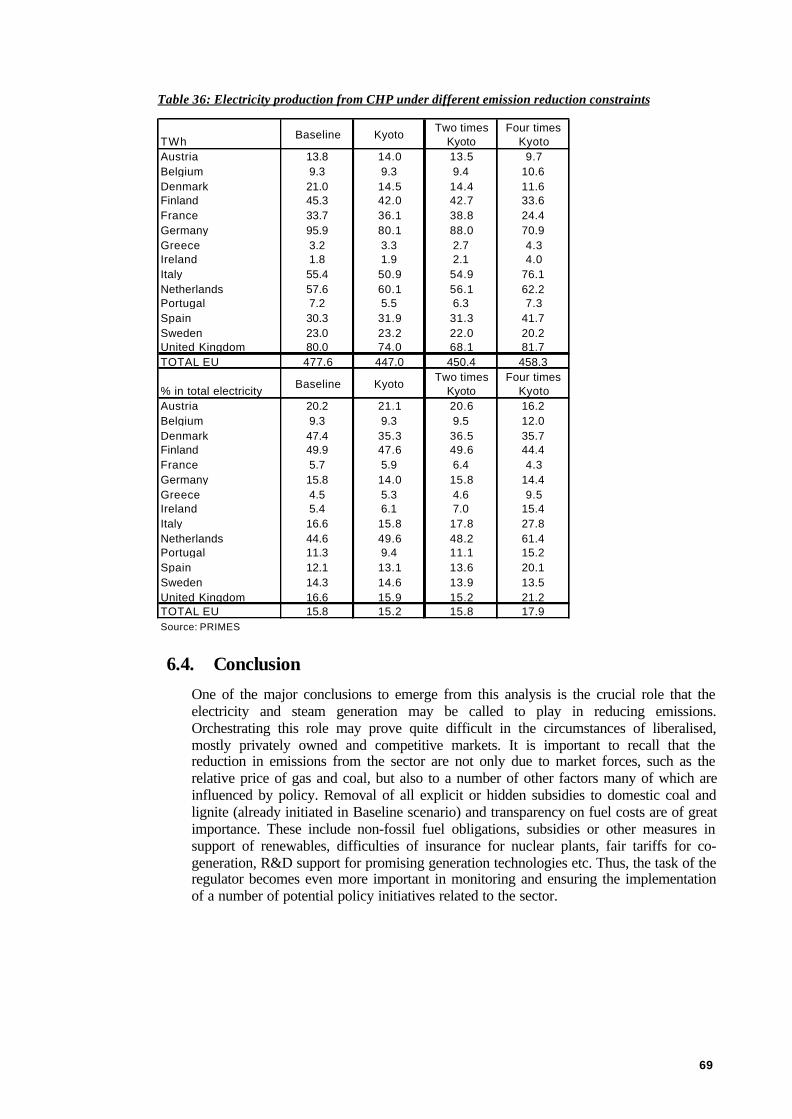
69
Table 36: Electricity production from CHP under different emission reduction constraints
TWhBaseline Kyoto
Two times Kyoto
Four times Kyoto
Austria 13.8 14.0 13.5 9.7Belgium 9.3 9.3 9.4 10.6Denmark 21.0 14.5 14.4 11.6Finland 45.3 42.0 42.7 33.6France 33.7 36.1 38.8 24.4Germany 95.9 80.1 88.0 70.9Greece 3.2 3.3 2.7 4.3Ireland 1.8 1.9 2.1 4.0Italy 55.4 50.9 54.9 76.1Netherlands 57.6 60.1 56.1 62.2Portugal 7.2 5.5 6.3 7.3Spain 30.3 31.9 31.3 41.7Sweden 23.0 23.2 22.0 20.2United Kingdom 80.0 74.0 68.1 81.7TOTAL EU 477.6 447.0 450.4 458.3
% in total electricityBaseline Kyoto
Two times Kyoto
Four times Kyoto
Austria 20.2 21.1 20.6 16.2Belgium 9.3 9.3 9.5 12.0Denmark 47.4 35.3 36.5 35.7Finland 49.9 47.6 49.6 44.4France 5.7 5.9 6.4 4.3Germany 15.8 14.0 15.8 14.4Greece 4.5 5.3 4.6 9.5Ireland 5.4 6.1 7.0 15.4Italy 16.6 15.8 17.8 27.8Netherlands 44.6 49.6 48.2 61.4Portugal 11.3 9.4 11.1 15.2Spain 12.1 13.1 13.6 20.1Sweden 14.3 14.6 13.9 13.5United Kingdom 16.6 15.9 15.2 21.2TOTAL EU 15.8 15.2 15.8 17.9Source: PRIMES
6.4. ConclusionOne of the major conclusions to emerge from this analysis is the crucial role that theelectricity and steam generation may be called to play in reducing emissions.Orchestrating this role may prove quite difficult in the circumstances of liberalised,mostly privately owned and competitive markets. It is important to recall that thereduction in emissions from the sector are not only due to market forces, such as therelative price of gas and coal, but also to a number of other factors many of which areinfluenced by policy. Removal of all explicit or hidden subsidies to domestic coal andlignite (already initiated in Baseline scenario) and transparency on fuel costs are of greatimportance. These include non-fossil fuel obligations, subsidies or other measures insupport of renewables, difficulties of insurance for nuclear plants, fair tariffs for co-generation, R&D support for promising generation technologies etc. Thus, the task of theregulator becomes even more important in monitoring and ensuring the implementationof a number of potential policy initiatives related to the sector.

70
7. Allocation of effort among sectors and emissions
7.1. IntroductionAccording to the undertakings in the Kyoto Protocol of December 1997, the EU iscommitted to reduce its greenhouse gas (GHGs) emissions in the 2008-12 period to alevel that is 8% below that of 1990. This is equivalent to a reduction of GHGs in 2010 byabout 316 Mt CO2 from their 3938 Mt CO2-equivalent level in 1990. 32 The GHGscovered are CO2 (energy and non-energy related emissions), methane, nitrous oxide,hydro-fluorocarbons, perfluorocarbons and sulphur hexafluoride. For the three syntheticgases the protocol gives countries the option of using 1995 as base year.
In the context of the study, a meta-model was constructed in order to evaluate thepotential contribution of the different Member States and sectors in achieving the Kyototargets. The analysis combined marginal abatement cost curves regarding both CO2(constructed by using the PRIMES model, i.e. following a top-down approach) and non-CO2 emissions (derived from the GENESIS bottom-up analysis33) by Member State.
7.2. MethodologyCarbon constraints have been applied as global constraints in solving the PRIMES modelin order to arrive at the preferred allocation of energy and emissions reduction, assuggested by the model itself.
The mechanism through which the carbon constraint is attained involves the attributionof an appropriate economic value to the reduction of emissions of carbon. Equivalently,the ability to emit carbon obtains a scarcity value and is allocated an implicit price. Thereare corresponding changes in the relative prices, reflecting the carbon emissions that eachcommodity or activity involves, and which economic agents, i.e. producers andconsumers of energy, have to face. This, of course, leads to adjustments in the behaviourof agents. The latter tend to shift away from activities that involve emissions.
The analysis starts from the baseline scenario, which reflects policies and trends withoutincluding specific efforts to reduce CO2 emissions. Starting from the baseline, for eachscenario the model was run in order to compute the least cost solution corresponding tothe level of CO2 emissions in 2010 that is implied by the constraint. The modeldetermines the allocation of effort by sector within each Member State that is necessaryto meet the global constraint, implicitly assuming the existence of a full trading regime ofemissions within the country.
The analysis focuses on the differences between the results of each emissions reductionscenario and the results of the baseline. These differences span the whole energy system,showing changes that are necessary to reach the lower emission level at least overall cost.Such changes, as already discussed in previous chapters may concern behaviour in usingenergy, structural changes in energy uses and processes, possible accelerated adoption ofnew technologies, changes in the fuel mix, etc. The exploration of the series of least costsolutions, varying according to the magnitude of the emission reduction level, providesan extensive set of information revealing the priority of changes that are cost effective by
32 All quantities of GHGs in this chapter refer to megatonnes (106) of CO2 equivalent.33 C. Hendriks, D. de Jager, K. Blok et al. (2001): Bottom-up Analysis of Emission Reduction Potentials andCosts for Greenhouse Gases in the EU, Ecofys and AEA Technology, Utrecht, March 2001
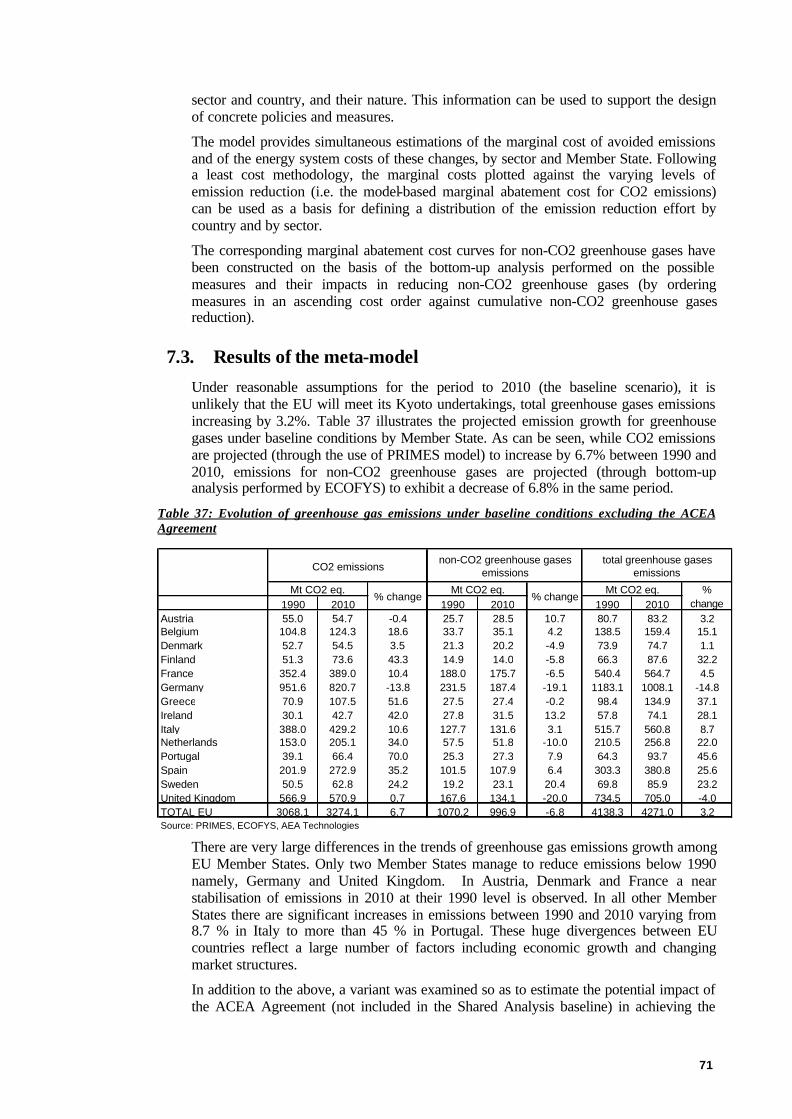
71
sector and country, and their nature. This information can be used to support the designof concrete policies and measures.
The model provides simultaneous estimations of the marginal cost of avoided emissionsand of the energy system costs of these changes, by sector and Member State. Followinga least cost methodology, the marginal costs plotted against the varying levels ofemission reduction (i.e. the model-based marginal abatement cost for CO2 emissions)can be used as a basis for defining a distribution of the emission reduction effort bycountry and by sector.
The corresponding marginal abatement cost curves for non-CO2 greenhouse gases havebeen constructed on the basis of the bottom-up analysis performed on the possiblemeasures and their impacts in reducing non-CO2 greenhouse gases (by orderingmeasures in an ascending cost order against cumulative non-CO2 greenhouse gasesreduction).
7.3. Results of the meta-modelUnder reasonable assumptions for the period to 2010 (the baseline scenario), it isunlikely that the EU will meet its Kyoto undertakings, total greenhouse gases emissionsincreasing by 3.2%. Table 37 illustrates the projected emission growth for greenhousegases under baseline conditions by Member State. As can be seen, while CO2 emissionsare projected (through the use of PRIMES model) to increase by 6.7% between 1990 and2010, emissions for non-CO2 greenhouse gases are projected (through bottom-upanalysis performed by ECOFYS) to exhibit a decrease of 6.8% in the same period.
Table 37: Evolution of greenhouse gas emissions under baseline conditions excluding the ACEAAgreement
1990 2010 1990 2010 1990 2010Austria 55.0 54.7 -0.4 25.7 28.5 10.7 80.7 83.2 3.2Belgium 104.8 124.3 18.6 33.7 35.1 4.2 138.5 159.4 15.1Denmark 52.7 54.5 3.5 21.3 20.2 -4.9 73.9 74.7 1.1Finland 51.3 73.6 43.3 14.9 14.0 -5.8 66.3 87.6 32.2France 352.4 389.0 10.4 188.0 175.7 -6.5 540.4 564.7 4.5Germany 951.6 820.7 -13.8 231.5 187.4 -19.1 1183.1 1008.1 -14.8Greece 70.9 107.5 51.6 27.5 27.4 -0.2 98.4 134.9 37.1Ireland 30.1 42.7 42.0 27.8 31.5 13.2 57.8 74.1 28.1Italy 388.0 429.2 10.6 127.7 131.6 3.1 515.7 560.8 8.7Netherlands 153.0 205.1 34.0 57.5 51.8 -10.0 210.5 256.8 22.0Portugal 39.1 66.4 70.0 25.3 27.3 7.9 64.3 93.7 45.6Spain 201.9 272.9 35.2 101.5 107.9 6.4 303.3 380.8 25.6Sweden 50.5 62.8 24.2 19.2 23.1 20.4 69.8 85.9 23.2United Kingdom 566.9 570.9 0.7 167.6 134.1 -20.0 734.5 705.0 -4.0TOTAL EU 3068.1 3274.1 6.7 1070.2 996.9 -6.8 4138.3 4271.0 3.2Source: PRIMES, ECOFYS, AEA Technologies
total greenhouse gases emissions
Mt CO2 eq.
CO2 emissionsnon-CO2 greenhouse gases
emissions
% change % change%
changeMt CO2 eq. Mt CO2 eq.
There are very large differences in the trends of greenhouse gas emissions growth amongEU Member States. Only two Member States manage to reduce emissions below 1990namely, Germany and United Kingdom. In Austria, Denmark and France a nearstabilisation of emissions in 2010 at their 1990 level is observed. In all other MemberStates there are significant increases in emissions between 1990 and 2010 varying from8.7 % in Italy to more than 45 % in Portugal. These huge divergences between EUcountries reflect a large number of factors including economic growth and changingmarket structures.
In addition to the above, a variant was examined so as to estimate the potential impact ofthe ACEA Agreement (not included in the Shared Analysis baseline) in achieving the
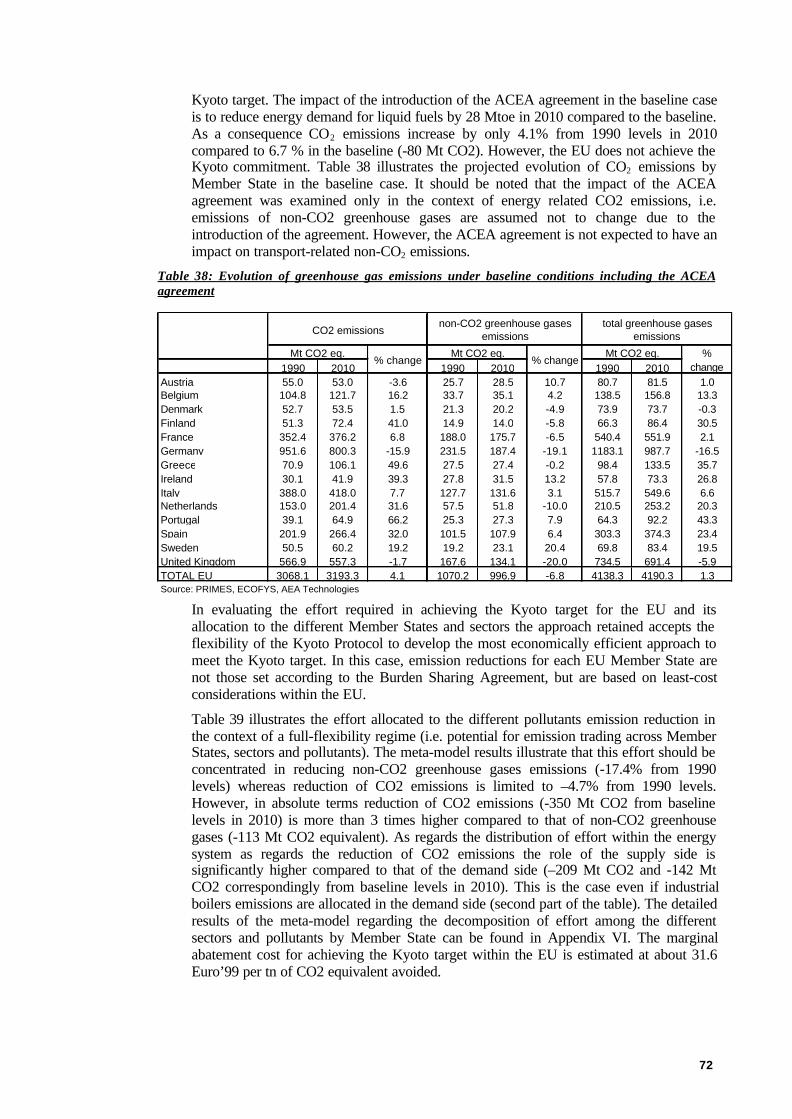
72
Kyoto target. The impact of the introduction of the ACEA agreement in the baseline caseis to reduce energy demand for liquid fuels by 28 Mtoe in 2010 compared to the baseline.As a consequence CO2 emissions increase by only 4.1% from 1990 levels in 2010compared to 6.7 % in the baseline (-80 Mt CO2). However, the EU does not achieve theKyoto commitment. Table 38 illustrates the projected evolution of CO2 emissions byMember State in the baseline case. It should be noted that the impact of the ACEAagreement was examined only in the context of energy related CO2 emissions, i.e.emissions of non-CO2 greenhouse gases are assumed not to change due to theintroduction of the agreement. However, the ACEA agreement is not expected to have animpact on transport-related non-CO2 emissions.
Table 38: Evolution of greenhouse gas emissions under baseline conditions including the ACEAagreement
1990 2010 1990 2010 1990 2010Austria 55.0 53.0 -3.6 25.7 28.5 10.7 80.7 81.5 1.0Belgium 104.8 121.7 16.2 33.7 35.1 4.2 138.5 156.8 13.3Denmark 52.7 53.5 1.5 21.3 20.2 -4.9 73.9 73.7 -0.3Finland 51.3 72.4 41.0 14.9 14.0 -5.8 66.3 86.4 30.5France 352.4 376.2 6.8 188.0 175.7 -6.5 540.4 551.9 2.1Germany 951.6 800.3 -15.9 231.5 187.4 -19.1 1183.1 987.7 -16.5Greece 70.9 106.1 49.6 27.5 27.4 -0.2 98.4 133.5 35.7Ireland 30.1 41.9 39.3 27.8 31.5 13.2 57.8 73.3 26.8Italy 388.0 418.0 7.7 127.7 131.6 3.1 515.7 549.6 6.6Netherlands 153.0 201.4 31.6 57.5 51.8 -10.0 210.5 253.2 20.3Portugal 39.1 64.9 66.2 25.3 27.3 7.9 64.3 92.2 43.3Spain 201.9 266.4 32.0 101.5 107.9 6.4 303.3 374.3 23.4Sweden 50.5 60.2 19.2 19.2 23.1 20.4 69.8 83.4 19.5United Kingdom 566.9 557.3 -1.7 167.6 134.1 -20.0 734.5 691.4 -5.9TOTAL EU 3068.1 3193.3 4.1 1070.2 996.9 -6.8 4138.3 4190.3 1.3Source: PRIMES, ECOFYS, AEA Technologies
total greenhouse gases emissions
Mt CO2 eq.
CO2 emissionsnon-CO2 greenhouse gases
emissions
% change % change%
changeMt CO2 eq. Mt CO2 eq.
In evaluating the effort required in achieving the Kyoto target for the EU and itsallocation to the different Member States and sectors the approach retained accepts theflexibility of the Kyoto Protocol to develop the most economically efficient approach tomeet the Kyoto target. In this case, emission reductions for each EU Member State arenot those set according to the Burden Sharing Agreement, but are based on least-costconsiderations within the EU.
Table 39 illustrates the effort allocated to the different pollutants emission reduction inthe context of a full-flexibility regime (i.e. potential for emission trading across MemberStates, sectors and pollutants). The meta-model results illustrate that this effort should beconcentrated in reducing non-CO2 greenhouse gases emissions (-17.4% from 1990levels) whereas reduction of CO2 emissions is limited to –4.7% from 1990 levels.However, in absolute terms reduction of CO2 emissions (-350 Mt CO2 from baselinelevels in 2010) is more than 3 times higher compared to that of non-CO2 greenhousegases (-113 Mt CO2 equivalent). As regards the distribution of effort within the energysystem as regards the reduction of CO2 emissions the role of the supply side issignificantly higher compared to that of the demand side (–209 Mt CO2 and -142 MtCO2 correspondingly from baseline levels in 2010). This is the case even if industrialboilers emissions are allocated in the demand side (second part of the table). The detailedresults of the meta-model regarding the decomposition of effort among the differentsectors and pollutants by Member State can be found in Appendix VI. The marginalabatement cost for achieving the Kyoto target within the EU is estimated at about 31.6Euro’99 per tn of CO2 equivalent avoided.
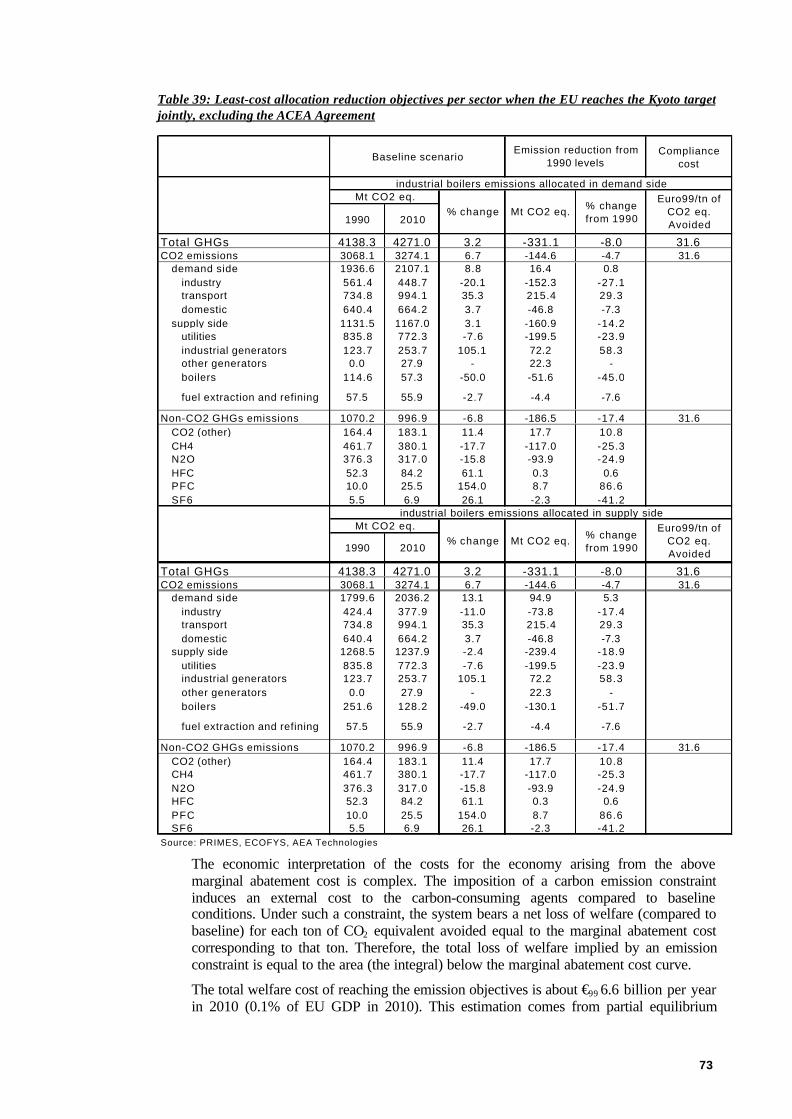
73
Table 39: Least-cost allocation reduction objectives per sector when the EU reaches the Kyoto targetjointly, excluding the ACEA Agreement
Compliance cost
1990 2010
Total GHGs 4138.3 4271.0 3.2 -331.1 -8.0 31.6CO2 emissions 3068.1 3274.1 6.7 -144.6 -4.7 31.6
demand side 1936.6 2107.1 8.8 16.4 0.8industry 561.4 448.7 -20.1 -152.3 -27.1transport 734.8 994.1 35.3 215.4 29.3domestic 640.4 664.2 3.7 -46.8 -7.3
supply side 1131.5 1167.0 3.1 -160.9 -14.2utilities 835.8 772.3 -7.6 -199.5 -23.9industrial generators 123.7 253.7 105.1 72.2 58.3other generators 0.0 27.9 - 22.3 -boilers 114.6 57.3 -50.0 -51.6 -45.0
fuel extraction and refining 57.5 55.9 -2.7 -4.4 -7.6
Non-CO2 GHGs emissions 1070.2 996.9 -6.8 -186.5 -17.4 31.6CO2 (other) 164.4 183.1 11.4 17.7 10.8CH4 461.7 380.1 -17.7 -117.0 -25.3N2O 376.3 317.0 -15.8 -93.9 -24.9HFC 52.3 84.2 61.1 0.3 0.6PFC 10.0 25.5 154.0 8.7 86.6SF6 5.5 6.9 26.1 -2.3 -41.2
1990 2010
Total GHGs 4138.3 4271.0 3.2 -331.1 -8.0 31.6CO2 emissions 3068.1 3274.1 6.7 -144.6 -4.7 31.6
demand side 1799.6 2036.2 13.1 94.9 5.3industry 424.4 377.9 -11.0 -73.8 -17.4transport 734.8 994.1 35.3 215.4 29.3domestic 640.4 664.2 3.7 -46.8 -7.3
supply side 1268.5 1237.9 -2.4 -239.4 -18.9utilities 835.8 772.3 -7.6 -199.5 -23.9industrial generators 123.7 253.7 105.1 72.2 58.3other generators 0.0 27.9 - 22.3 -boilers 251.6 128.2 -49.0 -130.1 -51.7
fuel extraction and refining 57.5 55.9 -2.7 -4.4 -7.6
Non-CO2 GHGs emissions 1070.2 996.9 -6.8 -186.5 -17.4 31.6CO2 (other) 164.4 183.1 11.4 17.7 10.8CH4 461.7 380.1 -17.7 -117.0 -25.3N2O 376.3 317.0 -15.8 -93.9 -24.9HFC 52.3 84.2 61.1 0.3 0.6PFC 10.0 25.5 154.0 8.7 86.6SF6 5.5 6.9 26.1 -2.3 -41.2
Source: PRIMES, ECOFYS, AEA Technologies
Euro99/tn of CO2 eq. Avoided
industrial boilers emissions allocated in demand sideMt CO2 eq.
% change Mt CO2 eq. % change from 1990
Baseline scenarioEmission reduction from
1990 levels
% changeMt CO2 eq.
industrial boilers emissions allocated in supply sideEuro99/tn of
CO2 eq. Avoided
% change from 1990
Mt CO2 eq.
The economic interpretation of the costs for the economy arising from the abovemarginal abatement cost is complex. The imposition of a carbon emission constraintinduces an external cost to the carbon-consuming agents compared to baselineconditions. Under such a constraint, the system bears a net loss of welfare (compared tobaseline) for each ton of CO2 equivalent avoided equal to the marginal abatement costcorresponding to that ton. Therefore, the total loss of welfare implied by an emissionconstraint is equal to the area (the integral) below the marginal abatement cost curve.
The total welfare cost of reaching the emission objectives is about €99 6.6 billion per yearin 2010 (0.1% of EU GDP in 2010). This estimation comes from partial equilibrium

74
analysis since PRIMES covers only the energy demand and supply system, the rest of theeconomy being considered unchanged under the imposition of emission reductiontargets. Consequently the above estimation does not include any macro-economicindirect effects resulting from the allocation of larger funds in energy demand and supplyto obtain higher efficiency and less carbon intensity. Furthermore, any deviation from aleast cost allocation, which as already described is assumed among the different demandand supply sectors, for example because of policy implementation failure, could entailhigher compliance costs.
The various economic sectors are affected differently by the imposition of the carbonconstraint in 2010. The costs differ among sectors depending on their energy intensity.The results of PRIMES show effects on costs, due to CO2 emissions reduction, varyingby sector. The average cost of sectoral output (industrial product) in 2010 increases by1.5-6% for energy intensive industries and by 0.2-0.7% for non-energy intensive sectors(compared to baseline scenario). The energy cost for the service sectors increases by1.2%, however implying a small increase in total cost of the sector. The cost oftransportation increases by 1.5% for passengers and by 2.3% for freight. Spending byhouseholds on energy fuel purchases and energy-using equipment increases by roughly8%. The total cost incurred by the average EU household for all kinds of energy servicesand related equipment increases by 4.5%. In absolute terms, this is equivalent to €99 78per household per year. However, it must be stressed out that that these costs do notinclude additional costs resulting from higher prices for e.g. industrial goods in othersectors. The costs incurred by the power and steam generation sector relate to highercapital expenditures (more expensive plant technology), the costs induced from strandedcapital, and the high fuel costs needed for fuel switching. The average power and steamgeneration cost increases by 15% compared to baseline. Despite this significant increaseproduction of electricity and steam decreases by just 2.0% from baseline levels in 2010.The cumulative investment expenditures for power and steam generation would also riseby about 4%.
As already discussed, the incorporation of the ACEA/JAMA/KAMA agreement in thebaseline scenario leads to a reduction of emissions by about 80 Mt CO2 from baselinelevels in 2010. Consequently, the achievement of the Kyoto target is facilitated leading toa reduction of the marginal abatement cost down to €99 20.3 per tn of CO2 equivalentavoided (-36%). The total welfare cost of reaching the emission targets is €99 3.7 billionper year in 2010 (0.06% of EU GDP in 2010). This means that the implementation of theACEA/JAMA/KAMA agreement results in a net benefit of €99 2.9 billion per year in2010 (assuming that agreement does not imply additional costs to consumers).Furthermore the implementation of the agreement has side effects on all sectors due tothe lower marginal abatement cost of achieving the Kyoto target. The average cost ofsectoral output (industrial product) in 2010 increases by 0.8-5% for energy intensiveindustries34 and by 0.1-0.5% for non-energy intensive sectors (compared to baselinescenario). The energy cost for the service sectors increases by 0.75%. The cost oftransportation increases by 1% for passengers and by 1.6% for freight. The additionalcost per household for all kinds of energy services and related equipment increases by €99
56 per household per year. The average power and steam generation cost increases by10% while production of electricity and steam decreases by 1.5% from baseline levels in2010. The cumulative investment expenditures for power and steam generation also riseby about 2.4%.
34 Iron and steel, building materials, non-ferrous metals, paper and pulp and chemicals.
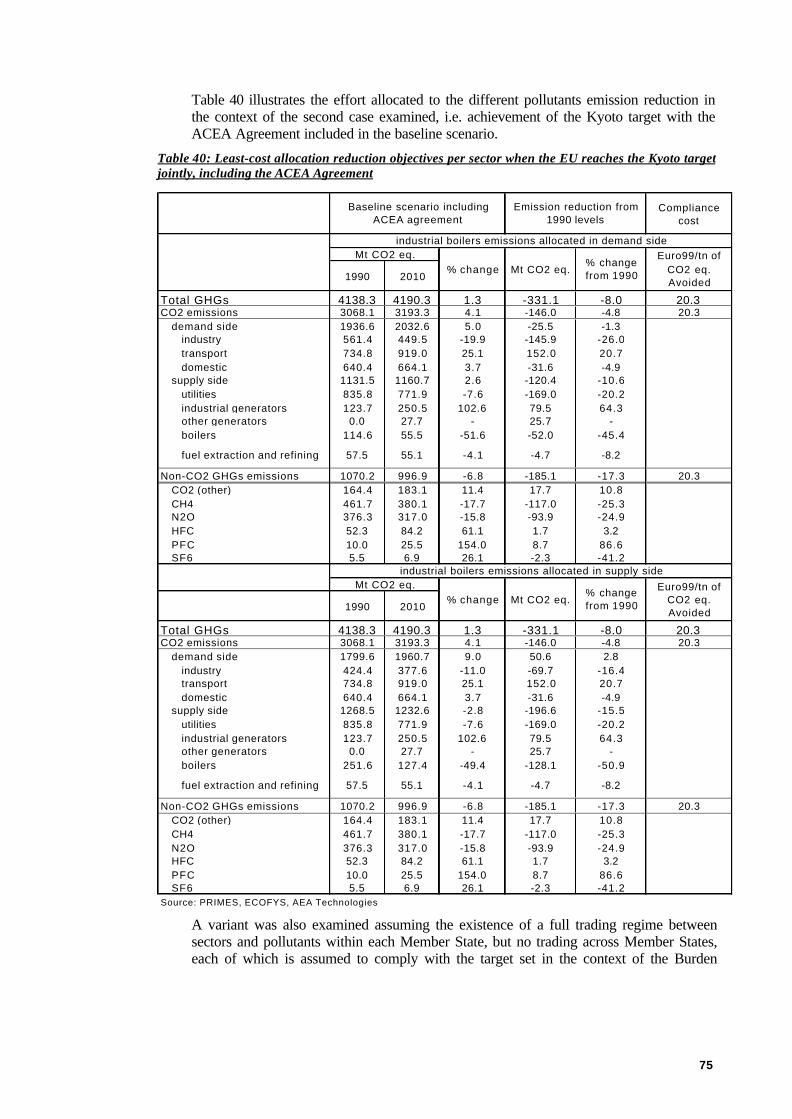
75
Table 40 illustrates the effort allocated to the different pollutants emission reduction inthe context of the second case examined, i.e. achievement of the Kyoto target with theACEA Agreement included in the baseline scenario.
Table 40: Least-cost allocation reduction objectives per sector when the EU reaches the Kyoto targetjointly, including the ACEA Agreement
Compliance cost
1990 2010
Total GHGs 4138.3 4190.3 1.3 -331.1 -8.0 20.3CO2 emissions 3068.1 3193.3 4.1 -146.0 -4.8 20.3
demand side 1936.6 2032.6 5.0 -25.5 -1.3industry 561.4 449.5 -19.9 -145.9 -26.0transport 734.8 919.0 25.1 152.0 20.7domestic 640.4 664.1 3.7 -31.6 -4.9
supply side 1131.5 1160.7 2.6 -120.4 -10.6utilities 835.8 771.9 -7.6 -169.0 -20.2industrial generators 123.7 250.5 102.6 79.5 64.3other generators 0.0 27.7 - 25.7 -boilers 114.6 55.5 -51.6 -52.0 -45.4
fuel extraction and refining 57.5 55.1 -4.1 -4.7 -8.2
Non-CO2 GHGs emissions 1070.2 996.9 -6.8 -185.1 -17.3 20.3CO2 (other) 164.4 183.1 11.4 17.7 10.8CH4 461.7 380.1 -17.7 -117.0 -25.3N2O 376.3 317.0 -15.8 -93.9 -24.9HFC 52.3 84.2 61.1 1.7 3.2PFC 10.0 25.5 154.0 8.7 86.6SF6 5.5 6.9 26.1 -2.3 -41.2
1990 2010
Total GHGs 4138.3 4190.3 1.3 -331.1 -8.0 20.3CO2 emissions 3068.1 3193.3 4.1 -146.0 -4.8 20.3
demand side 1799.6 1960.7 9.0 50.6 2.8industry 424.4 377.6 -11.0 -69.7 -16.4transport 734.8 919.0 25.1 152.0 20.7domestic 640.4 664.1 3.7 -31.6 -4.9
supply side 1268.5 1232.6 -2.8 -196.6 -15.5utilities 835.8 771.9 -7.6 -169.0 -20.2industrial generators 123.7 250.5 102.6 79.5 64.3other generators 0.0 27.7 - 25.7 -boilers 251.6 127.4 -49.4 -128.1 -50.9
fuel extraction and refining 57.5 55.1 -4.1 -4.7 -8.2
Non-CO2 GHGs emissions 1070.2 996.9 -6.8 -185.1 -17.3 20.3CO2 (other) 164.4 183.1 11.4 17.7 10.8CH4 461.7 380.1 -17.7 -117.0 -25.3N2O 376.3 317.0 -15.8 -93.9 -24.9HFC 52.3 84.2 61.1 1.7 3.2PFC 10.0 25.5 154.0 8.7 86.6SF6 5.5 6.9 26.1 -2.3 -41.2
Source: PRIMES, ECOFYS, AEA Technologies
Baseline scenario including ACEA agreement
Emission reduction from 1990 levels
% changeMt CO2 eq.
industrial boilers emissions allocated in supply side
Euro99/tn of CO2 eq. Avoided
Mt CO2 eq.% change from 1990
Euro99/tn of CO2 eq. Avoided
industrial boilers emissions allocated in demand sideMt CO2 eq.
% change Mt CO2 eq.% change from 1990
A variant was also examined assuming the existence of a full trading regime betweensectors and pollutants within each Member State, but no trading across Member States,each of which is assumed to comply with the target set in the context of the Burden
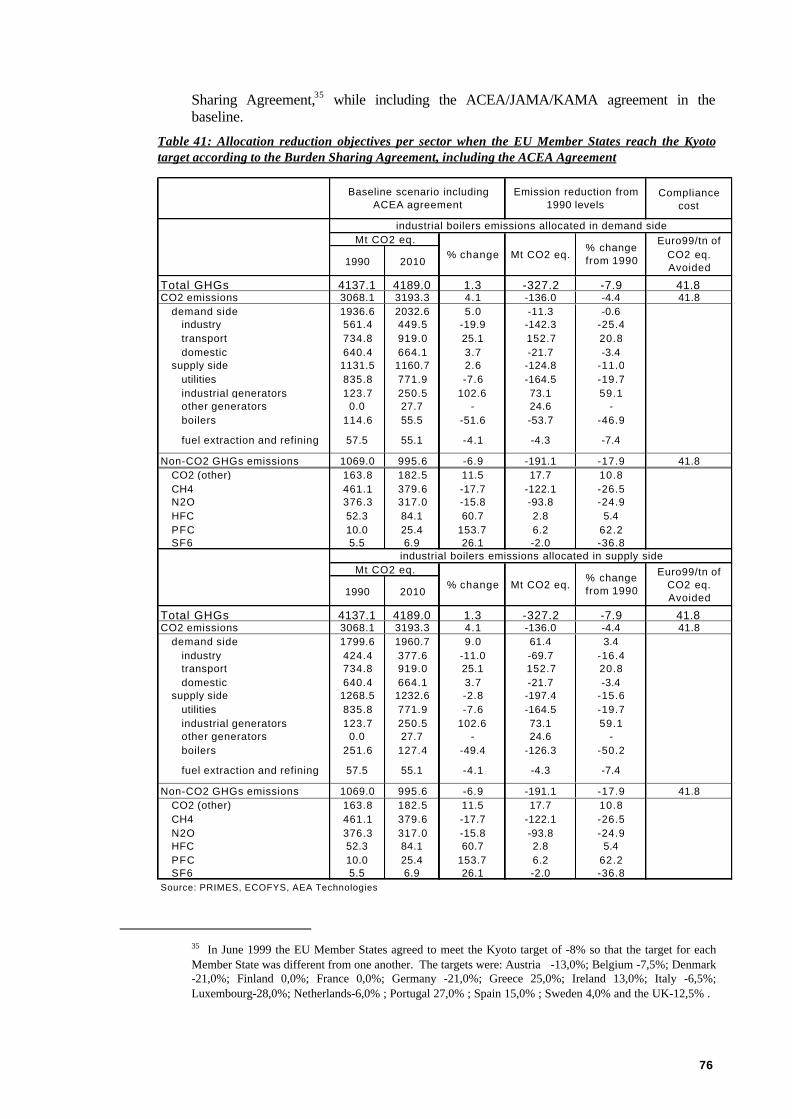
76
Sharing Agreement,35 while including the ACEA/JAMA/KAMA agreement in thebaseline.
Table 41: Allocation reduction objectives per sector when the EU Member States reach the Kyototarget according to the Burden Sharing Agreement, including the ACEA Agreement
Compliance cost
1990 2010
Total GHGs 4137.1 4189.0 1.3 -327.2 -7.9 41.8CO2 emissions 3068.1 3193.3 4.1 -136.0 -4.4 41.8
demand side 1936.6 2032.6 5.0 -11.3 -0.6industry 561.4 449.5 -19.9 -142.3 -25.4transport 734.8 919.0 25.1 152.7 20.8domestic 640.4 664.1 3.7 -21.7 -3.4
supply side 1131.5 1160.7 2.6 -124.8 -11.0utilities 835.8 771.9 -7.6 -164.5 -19.7industrial generators 123.7 250.5 102.6 73.1 59.1other generators 0.0 27.7 - 24.6 -boilers 114.6 55.5 -51.6 -53.7 -46.9
fuel extraction and refining 57.5 55.1 -4.1 -4.3 -7.4
Non-CO2 GHGs emissions 1069.0 995.6 -6.9 -191.1 -17.9 41.8CO2 (other) 163.8 182.5 11.5 17.7 10.8CH4 461.1 379.6 -17.7 -122.1 -26.5N2O 376.3 317.0 -15.8 -93.8 -24.9HFC 52.3 84.1 60.7 2.8 5.4PFC 10.0 25.4 153.7 6.2 62.2SF6 5.5 6.9 26.1 -2.0 -36.8
1990 2010
Total GHGs 4137.1 4189.0 1.3 -327.2 -7.9 41.8CO2 emissions 3068.1 3193.3 4.1 -136.0 -4.4 41.8
demand side 1799.6 1960.7 9.0 61.4 3.4industry 424.4 377.6 -11.0 -69.7 -16.4transport 734.8 919.0 25.1 152.7 20.8domestic 640.4 664.1 3.7 -21.7 -3.4
supply side 1268.5 1232.6 -2.8 -197.4 -15.6utilities 835.8 771.9 -7.6 -164.5 -19.7industrial generators 123.7 250.5 102.6 73.1 59.1other generators 0.0 27.7 - 24.6 -boilers 251.6 127.4 -49.4 -126.3 -50.2
fuel extraction and refining 57.5 55.1 -4.1 -4.3 -7.4
Non-CO2 GHGs emissions 1069.0 995.6 -6.9 -191.1 -17.9 41.8CO2 (other) 163.8 182.5 11.5 17.7 10.8CH4 461.1 379.6 -17.7 -122.1 -26.5N2O 376.3 317.0 -15.8 -93.8 -24.9HFC 52.3 84.1 60.7 2.8 5.4PFC 10.0 25.4 153.7 6.2 62.2SF6 5.5 6.9 26.1 -2.0 -36.8
Source: PRIMES, ECOFYS, AEA Technologies
Euro99/tn of CO2 eq. Avoided
Mt CO2 eq.% change from 1990
Euro99/tn of CO2 eq. Avoided
industrial boilers emissions allocated in demand sideMt CO2 eq.
% change Mt CO2 eq.% change from 1990
Baseline scenario including ACEA agreement
Emission reduction from 1990 levels
% changeMt CO2 eq.
industrial boilers emissions allocated in supply side
35 In June 1999 the EU Member States agreed to meet the Kyoto target of -8% so that the target for eachMember State was different from one another. The targets were: Austria -13,0%; Belgium -7,5%; Denmark-21,0%; Finland 0,0%; France 0,0%; Germany -21,0%; Greece 25,0%; Ireland 13,0%; Italy -6,5%;Luxembourg-28,0%; Netherlands-6,0% ; Portugal 27,0% ; Spain 15,0% ; Sweden 4,0% and the UK-12,5% .
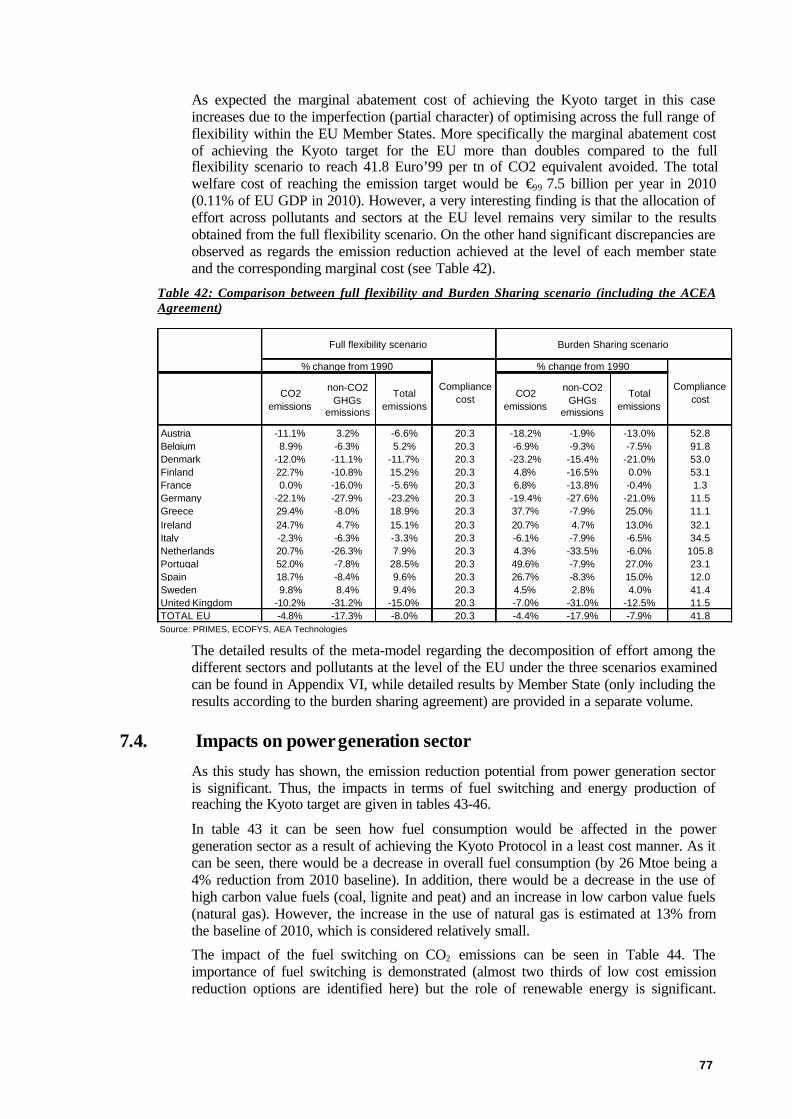
77
As expected the marginal abatement cost of achieving the Kyoto target in this caseincreases due to the imperfection (partial character) of optimising across the full range offlexibility within the EU Member States. More specifically the marginal abatement costof achieving the Kyoto target for the EU more than doubles compared to the fullflexibility scenario to reach 41.8 Euro’99 per tn of CO2 equivalent avoided. The totalwelfare cost of reaching the emission target would be €99 7.5 billion per year in 2010(0.11% of EU GDP in 2010). However, a very interesting finding is that the allocation ofeffort across pollutants and sectors at the EU level remains very similar to the resultsobtained from the full flexibility scenario. On the other hand significant discrepancies areobserved as regards the emission reduction achieved at the level of each member stateand the corresponding marginal cost (see Table 42).
Table 42: Comparison between full flexibility and Burden Sharing scenario (including the ACEAAgreement)
CO2 emissions
non-CO2 GHGs
emissions
Total emissions
CO2 emissions
non-CO2 GHGs
emissions
Total emissions
Austria -11.1% 3.2% -6.6% 20.3 -18.2% -1.9% -13.0% 52.8Belgium 8.9% -6.3% 5.2% 20.3 -6.9% -9.3% -7.5% 91.8Denmark -12.0% -11.1% -11.7% 20.3 -23.2% -15.4% -21.0% 53.0Finland 22.7% -10.8% 15.2% 20.3 4.8% -16.5% 0.0% 53.1France 0.0% -16.0% -5.6% 20.3 6.8% -13.8% -0.4% 1.3Germany -22.1% -27.9% -23.2% 20.3 -19.4% -27.6% -21.0% 11.5Greece 29.4% -8.0% 18.9% 20.3 37.7% -7.9% 25.0% 11.1Ireland 24.7% 4.7% 15.1% 20.3 20.7% 4.7% 13.0% 32.1Italy -2.3% -6.3% -3.3% 20.3 -6.1% -7.9% -6.5% 34.5Netherlands 20.7% -26.3% 7.9% 20.3 4.3% -33.5% -6.0% 105.8Portugal 52.0% -7.8% 28.5% 20.3 49.6% -7.9% 27.0% 23.1Spain 18.7% -8.4% 9.6% 20.3 26.7% -8.3% 15.0% 12.0Sweden 9.8% 8.4% 9.4% 20.3 4.5% 2.8% 4.0% 41.4United Kingdom -10.2% -31.2% -15.0% 20.3 -7.0% -31.0% -12.5% 11.5TOTAL EU -4.8% -17.3% -8.0% 20.3 -4.4% -17.9% -7.9% 41.8Source: PRIMES, ECOFYS, AEA Technologies
Burden Sharing scenario
% change from 1990
Compliance cost
Full flexibility scenario
Compliance cost
% change from 1990
The detailed results of the meta-model regarding the decomposition of effort among thedifferent sectors and pollutants at the level of the EU under the three scenarios examinedcan be found in Appendix VI, while detailed results by Member State (only including theresults according to the burden sharing agreement) are provided in a separate volume.
7.4. Impacts on power generation sectorAs this study has shown, the emission reduction potential from power generation sectoris significant. Thus, the impacts in terms of fuel switching and energy production ofreaching the Kyoto target are given in tables 43-46.
In table 43 it can be seen how fuel consumption would be affected in the powergeneration sector as a result of achieving the Kyoto Protocol in a least cost manner. As itcan be seen, there would be a decrease in overall fuel consumption (by 26 Mtoe being a4% reduction from 2010 baseline). In addition, there would be a decrease in the use ofhigh carbon value fuels (coal, lignite and peat) and an increase in low carbon value fuels(natural gas). However, the increase in the use of natural gas is estimated at 13% fromthe baseline of 2010, which is considered relatively small.
The impact of the fuel switching on CO2 emissions can be seen in Table 44. Theimportance of fuel switching is demonstrated (almost two thirds of low cost emissionreduction options are identified here) but the role of renewable energy is significant.
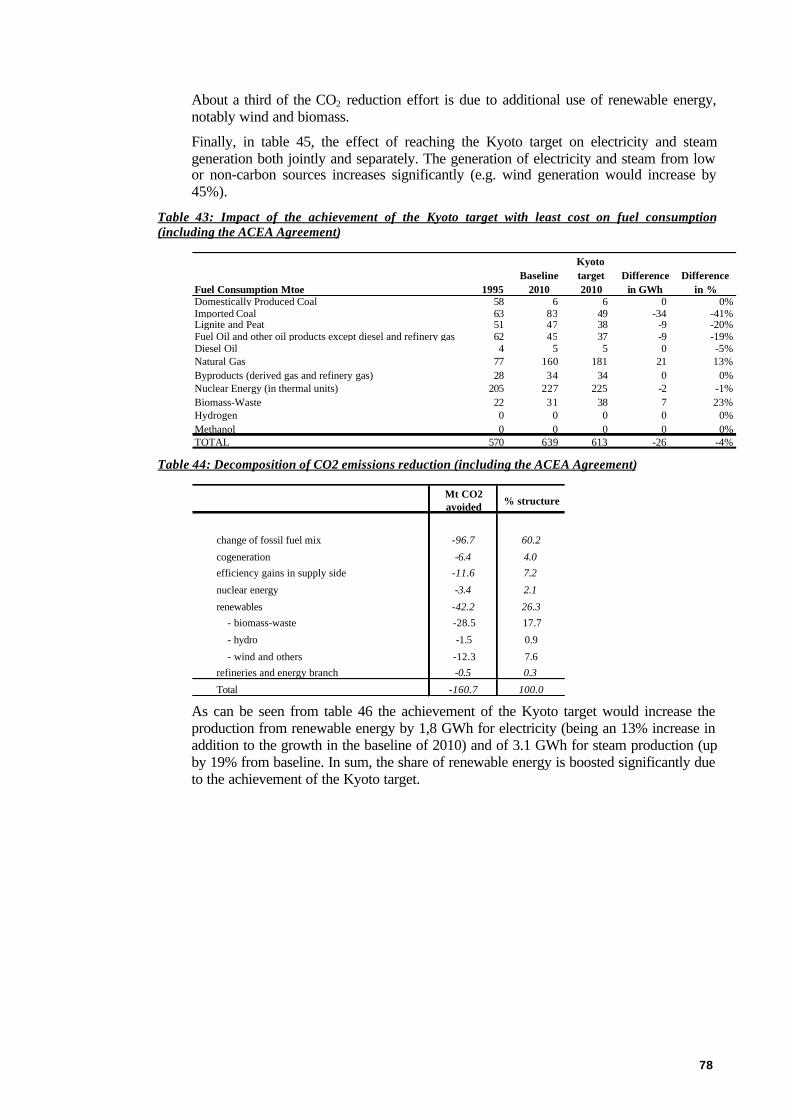
78
About a third of the CO2 reduction effort is due to additional use of renewable energy,notably wind and biomass.
Finally, in table 45, the effect of reaching the Kyoto target on electricity and steamgeneration both jointly and separately. The generation of electricity and steam from lowor non-carbon sources increases significantly (e.g. wind generation would increase by45%).
Table 43: Impact of the achievement of the Kyoto target with least cost on fuel consumption(including the ACEA Agreement)
Fuel Consumption Mtoe 1995 Baseline
2010
Kyoto target 2010
Difference in GWh
Difference in %
Domestically Produced Coal 58 6 6 0 0%Imported Coal 63 83 49 -34 -41%Lignite and Peat 51 47 38 -9 -20%Fuel Oil and other oil products except diesel and refinery gas 62 45 37 -9 -19%Diesel Oil 4 5 5 0 -5%Natural Gas 77 160 181 21 13%Byproducts (derived gas and refinery gas) 28 34 34 0 0%Nuclear Energy (in thermal units) 205 227 225 -2 -1%Biomass-Waste 22 31 38 7 23%Hydrogen 0 0 0 0 0%Methanol 0 0 0 0 0%TOTAL 570 639 613 -26 -4%
Table 44: Decomposition of CO2 emissions reduction (including the ACEA Agreement)
Mt CO2 avoided % structure
change of fossil fuel mix -96.7 60.2
cogeneration -6.4 4.0efficiency gains in supply side -11.6 7.2
nuclear energy -3.4 2.1
renewables -42.2 26.3- biomass-waste -28.5 17.7
- hydro -1.5 0.9
- wind and others -12.3 7.6refineries and energy branch -0.5 0.3
Total -160.7 100.0
As can be seen from table 46 the achievement of the Kyoto target would increase theproduction from renewable energy by 1,8 GWh for electricity (being an 13% increase inaddition to the growth in the baseline of 2010) and of 3.1 GWh for steam production (upby 19% from baseline. In sum, the share of renewable energy is boosted significantly dueto the achievement of the Kyoto target.
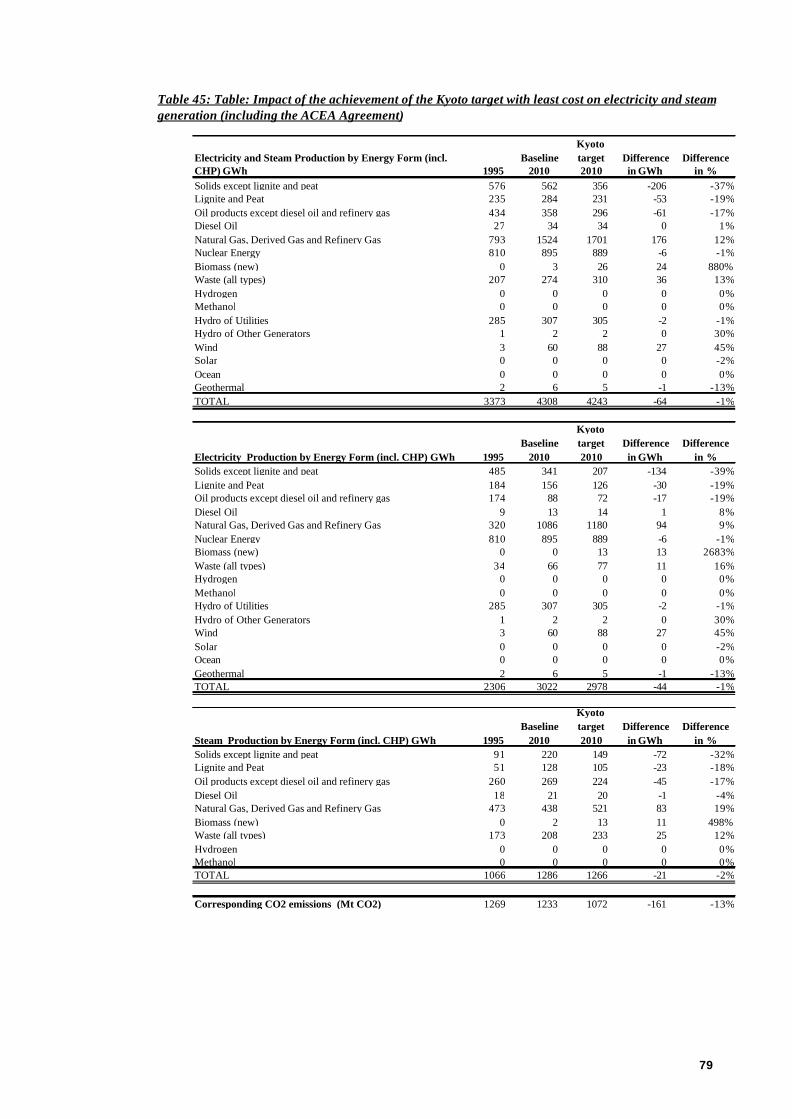
79
Table 45: Table: Impact of the achievement of the Kyoto target with least cost on electricity and steamgeneration (including the ACEA Agreement)
Electricity and Steam Production by Energy Form (incl. CHP) GWh 1995
Baseline 2010
Kyoto target 2010
Difference in GWh
Difference in %
Solids except lignite and peat 576 562 356 -206 -37%Lignite and Peat 235 284 231 -53 -19%Oil products except diesel oil and refinery gas 434 358 296 -61 -17%Diesel Oil 27 34 34 0 1%Natural Gas, Derived Gas and Refinery Gas 793 1524 1701 176 12%Nuclear Energy 810 895 889 -6 -1%Biomass (new) 0 3 26 24 880%Waste (all types) 207 274 310 36 13%Hydrogen 0 0 0 0 0%Methanol 0 0 0 0 0%Hydro of Utilities 285 307 305 -2 -1%Hydro of Other Generators 1 2 2 0 30%Wind 3 60 88 27 45%Solar 0 0 0 0 -2%Ocean 0 0 0 0 0%Geothermal 2 6 5 -1 -13%TOTAL 3373 4308 4243 -64 -1%
Electricity Production by Energy Form (incl. CHP) GWh 1995 Baseline
2010
Kyoto target 2010
Difference in GWh
Difference in %
Solids except lignite and peat 485 341 207 -134 -39%Lignite and Peat 184 156 126 -30 -19%Oil products except diesel oil and refinery gas 174 88 72 -17 -19%Diesel Oil 9 13 14 1 8%Natural Gas, Derived Gas and Refinery Gas 320 1086 1180 94 9%Nuclear Energy 810 895 889 -6 -1%Biomass (new) 0 0 13 13 2683%Waste (all types) 34 66 77 11 16%Hydrogen 0 0 0 0 0%Methanol 0 0 0 0 0%Hydro of Utilities 285 307 305 -2 -1%Hydro of Other Generators 1 2 2 0 30%Wind 3 60 88 27 45%Solar 0 0 0 0 -2%Ocean 0 0 0 0 0%Geothermal 2 6 5 -1 -13%TOTAL 2306 3022 2978 -44 -1%
Steam Production by Energy Form (incl. CHP) GWh 1995 Baseline
2010
Kyoto target 2010
Difference in GWh
Difference in %
Solids except lignite and peat 91 220 149 -72 -32%Lignite and Peat 51 128 105 -23 -18%Oil products except diesel oil and refinery gas 260 269 224 -45 -17%Diesel Oil 18 21 20 -1 -4%Natural Gas, Derived Gas and Refinery Gas 473 438 521 83 19%Biomass (new) 0 2 13 11 498%Waste (all types) 173 208 233 25 12%Hydrogen 0 0 0 0 0%Methanol 0 0 0 0 0%TOTAL 1066 1286 1266 -21 -2%
Corresponding CO2 emissions (Mt CO2) 1269 1233 1072 -161 -13%
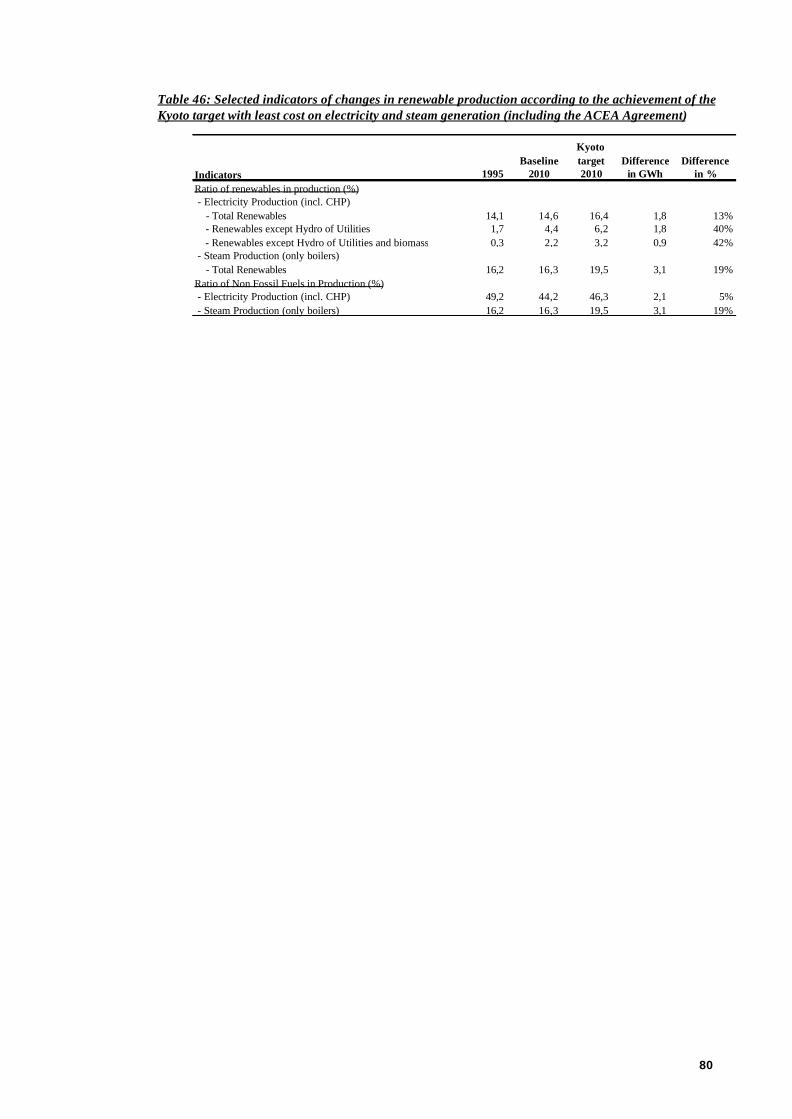
80
Table 46: Selected indicators of changes in renewable production according to the achievement of theKyoto target with least cost on electricity and steam generation (including the ACEA Agreement)
Indicators 1995 Baseline
2010
Kyoto target 2010
Difference in GWh
Difference in %
Ratio of renewables in production (%) - Electricity Production (incl. CHP) - Total Renewables 14,1 14,6 16,4 1,8 13% - Renewables except Hydro of Utilities 1,7 4,4 6,2 1,8 40% - Renewables except Hydro of Utilities and biomass 0,3 2,2 3,2 0,9 42% - Steam Production (only boilers) - Total Renewables 16,2 16,3 19,5 3,1 19%Ratio of Non Fossil Fuels in Production (%) - Electricity Production (incl. CHP) 49,2 44,2 46,3 2,1 5% - Steam Production (only boilers) 16,2 16,3 19,5 3,1 19%
81
APPENDIX I
The PRIMES Energy System Model
HistoryThe development of the PRIMES energy system model has been supported by a series ofresearch programmes of the European Commission. The model has been successfullypeer reviewed by the European Commission in 1997-1998.
The construction of the PRIMES energy model started in 1993 and from the beginningthe aim was to focus on market-related mechanisms influencing the evolution of energydemand and supply and the context for technology penetration in the market. ThePRIMES model also was designed to serve as an energy policy markets analysis toolincluding the relationships between energy policy and technology assessment. The needto represent the growing process of market liberalisation, also motivated PRIMES andother modellers to adopt market-oriented modelling approaches giving rise to modelsoften called “new generation models” like in the US the models IFFS and NEMS(US/DOE).
The model version 1 has been used in 1997 in the evaluation of the set of policies andmeasures envisaged by the European Commission in the negotiation phase for the Kyotoconference for climate change. The current version of the model (version 2 of PRIMES)formulated as a non-linear mixed complementarity (MCP) problem and solved underGAMS/CPLEX/PATH is fully operational and calibrated on 1995 data-set for allEuropean Union Member States. During the 1998-1999 period, version 2 of PRIMES hasbeen used to prepare the European Union Energy and Emissions Outlook for the SharedAnalysis project of the European Commission, DG XVII. It has been also extensivelyused for DG Environment and started to be used at government level in the EU.
Scope and ObjectivesPRIMES is a modelling system that simulates a market equilibrium solution for energysupply and demand in the European Union (EU) Member States. The model determinesthe equilibrium by finding the prices of each energy form such that the quantityproducers find best to supply match the quantity consumers wish to use. The equilibriumis static (within each time period) but repeated in a time-forward path, under dynamicrelationships.
The model is behavioural but also represent in an explicit and detailed way the availableenergy demand and supply technologies and pollution abatement technologies. Thesystem reflects considerations about market economics, industry structure,energy/environmental policies and regulation. These are conceived so as to influencemarket behaviour of energy system agents. The modular structure of PRIMES reflects adistribution of decision making among agents that decide individually about their supply,demand, combined supply and demand, and prices. Then the market integrating part ofPRIMES simulates market clearing.
PRIMES is a general purpose model. It is conceived for forecasting, scenarioconstruction and policy impact analysis. It covers a medium to long-term horizon. It ismodular and allows either for a unified model use or for partial use of modules to supportspecific energy studies.
The model can support policy analysis in the following fields:
? standard energy policy issues: security of supply, strategy, costs etc
82
? environmental issues
? pricing policy, taxation, standards on technologies
? new technologies and renewable sources
? energy efficiency in the demand-side
? alternative fuels
? energy trade and EU energy provision
? conversion decentralisation, electricity market liberalisation
? policy issues regarding electricity generation, gas distribution andrefineries.
A fundamental assumption in PRIMES is that producers and consumers both respond tochanges in price. The factors determining the demand for and the supply of each fuel areanalysed and represented, so they form the demand and/or supply behaviour of theagents. Through an iterative process, the model determines the economic equilibrium foreach fuel market. Price-driven equilibrium is considered in all energy and environmentmarkets, including Europe-wide clearing of oil and gas markets, as well as Europe-widenetworks, such as the Europe-wide power grid and natural gas network.
Although behavioural and price driven, PRIMES simulates in detail the technologychoice in energy demand and energy production. The model explicitly considers theexisting stock of equipment, its normal decommissioning and the possibility forpremature replacement. At any given point in time, the consumers or producer selectsthe technology of the energy equipment on an economic basis and can be influenced bypolicy (taxes, subsidies, regulation) market conditions (tariffs etc.) and technologychanges (including endogenous learning and progressive maturity on new technologies)
Due to the heterogeneity of the energy market no single methodology can adequatelydescribe all demand, supply and conversion processes. On the other hand, the economicstructure of the energy system itself facilitates its representation through largelyseparable individual units, each performing a number of individual functions.
Based on these principles, PRIMES is organised around a modular design representingin a different manner fuel supply, energy conversion and end-use of demand sectors.The individual modules vary in the depth of their structural representation. Themodularity feature allows each sector to be represented in the way consideredappropriate, highlighting the particular issues important for the sector, including the mostexpedient regional structure. The electricity module covers the whole Europe, whilerepresenting chronological load curves and dispatching at the national level. The naturalgas market also expands over the whole Europe. However, coal supply, refineries anddemand operate at the national level. Furthermore, the modularity allows any singlesector or group of sectors to be run independently for stand alone analysis.
Features of Sub ModelsThe supply modules simulate both the operation and the capacity expansion activities.The dynamic relationships involve stock-flow relations (for example capitalaccumulation), inertia in the penetration of new technologies, backward lookingexpectations (more formally, the model uses adaptive expectations) and consumer habits.Thus, the model integrates static and a dynamic solution under myopic anticipation.Also, the model fully integrates the national within the multinational energy system (foroil refinery, gas supply to Europe and generation and trade of electricity).
Demand is evaluated at a national level. Electricity dispatching and capacity expansionare determined at a national level, depending however on a complex market allocationmechanism, operating through the electricity grid, Europe-wide. The natural gas
83
distribution market clears at a multinational level, even wider than the European Union.The refinery sector operates at a national level, but capacities, market shares and pricesdepend heavily on Europe-wide competition. Primary energy supply, for example coaland lignite supply curves, has, on the other hand, a national-specific character. Finally,energy savings, technology progress in power generation, abatement technologies,renewables and alternative fuels (biomass, methanol, hydrogen) are determined at eachcountry-specific energy system.
Cost evaluation modules and price-setting mechanisms are at the core of the model. Theformers are attached to each energy supply module. The cost module considers totalrevenue requirements of the sector (based on total costs and other accounting costs) andallocates payments over the consumers, according to a general Ramsey pricing rules(parameters are user selected). The pricing parameters reflect alternative industrialeconomic circumstances and are linked to marginal and average values from the sector'soptimisation. For example, these rules consider a peak-synchronisation characterisationof consumers or average cost rating of energy demand by consumers. The allocation ofpayments is further determined, by also considering eventual cross-subsidisation policyor other distortions. In brief, the price-setting mechanism reflects the designconsiderations for the market clearing regimes. The value of parameters in these cost-pricing modules can be altered, in policy scenarios, to reflect structural change.
Prices of purchased fuels depend also on cost-supply curves that are exogenouslyspecified, but operate within the equilibrium process. Such curves are used for allprimary energy supply, including EU gas supply, coal, biomass and even renewablesources to reflect land availability constraints. They are also defined for imports.
TechnologyAs mentioned, PRIMES has been designed to support technology assessment at theenergy system level. The dynamics, as simulated by the model, influence the penetrationof new technologies.
Several parameters and formulations are built-in to represent non-economic factors thataffect the velocity of new technology penetration. For example, the modules includelearning by doing curves, parameters that represent subjective perception of technologycosts as seen by consumers, standards, etc. These can be used to represent market failuresor inertia that may deprive the system from cost-effective technology solutions.
In addition, market related factors, as represented within the optimisation modules, canalso explain the lack of decision for the most cost-effective solutions. These factors arerelated to the individual character of decision maker's optimality and this is representedin the model by design (different optimality conditions per module) and through the useof parameters, as for example by varying the discount rates with the consumer size.
Policy parameters can of course change the optimality conditions and influencetechnology choice and penetration. The model can in addition simulate accompanyingpolicies that aim at structural improvements that may maximise the effects of policymeasures. For example, true cost pricing, removal of barriers, new funding mechanismsetc. can be reflected to changes of parameters that will influence technology choices andpenetration.
EnvironmentThe mechanisms relating pollution with energy activities, also involving pollutionabatement choices, are fully integrated into PRIMES. The optimisation modulessimultaneously consider energy and environment costs. Constraints are built in torepresent environmental regulation. The technology choice mechanisms also considerabatement equipment. Policy measures dedicated to pollution can affect optimality and
84
can also be accompanied with policy aiming at structural change. Finally, a modulecomputes dispersion and deposition of emitted pollutants.
The main policy instruments for the environment, as considered in PRIMES, are:
? Regulation by sector (in the form of a constraint of emissions by sector);
? Regulation by country (in the form of a global constraint taking intoaccount emissions from all modules);
? Taxation for the environment. This can be either exogenously given (inwhich case the emissions are not explicitly limited) or endogenously (asthe shadow price of the constraint binding the emissions);
? Pollution permits. A separate market for pollution permits isimplemented in the model. The different sectors can therefore trade (sellor buy) permits based on their initial endowment;
? Subsidisation of abatement costs for electricity and steam.
Policy InstrumentsSpecial care has been devoted to the representation of various policy instruments in themodel. For some policy instruments, it is straightforward to build scenario variants and toevaluate the implications. For other instruments, the analysis is more sophisticated andhas to combine evaluations outside the model with results from model runs.
Economic and fiscal instruments constitute an obvious case of straightforward use of themodel. Taxes, excise, VAT, carbon etc., are explicitly represented for all energy formsand uses. Fully detailed tax scenarios can be assessed, including differentiation of ratesby sector, combination with subsidies and exemptions, harmonisation across MemberStates, etc. The consequences of higher taxation for costs of derived energy forms (e.g.steam, electricity) are endogenously treated.
Other economic instruments, like the tradable emission rights (pollution permits) are alsoformulated in PRIMES. Other measures such as new funding mechanisms for energytechnologies, information campaigns and measures aiming at removal of barriers, can beevaluated at the energy system level (regarding their total effects) through the built inmechanisms of PRIMES, like perceived costs, risk premium, etc.
Command and control regulation, that is the pursuit of objectives through administrativeprocesses, can be analysed through the use of constraints and binding within theoptimisation modules. The model can evaluate the effectiveness and compute proxies tothe shadow cost of regulation. Emission norms, efficiency norms, regulations such as the"Non Fossil Fuel Obligation" can be represented and analysed.
Voluntary agreements are one of the cases for which the model-based analysis must becombined with ad hoc evaluation. Voluntary agreements can be represented asconstraints within the optimisation modules. However, in reality, they are not necessarilyimperative constraints, since deviations may be possible, although involving higher costsfor the consumer. In such cases, voluntary agreements are possible when deviations arethreatened by the risk of considerably higher costs. PRIMES has not such a mechanismbuilt in. However, after evaluations outside the model, the analyst can formulateconstraints, do sensitivity analysis with the model and compare shadow prices to knownhigher cost threats.
Demand-side Management and Integrated Resource Planning is also another example forwhich the model is not entirely sufficient. PRIMES, being explicit in technologyrepresentations, includes electricity consumption technologies and uses in allconsumption modules. To each use, the model associates generic load patterns, theaggregation of which over the consumers' electricity uses gives the load shape faced by
85
electricity generation. A DSM measure can be simulated by a change either in the shapeor the area (efficiency) of a particular electricity use. This will alter the optimalityconditions of electricity generation and will probably imply cost savings. Externally tothe model, the analyst has to evaluate implementation costs of the measure and allocatethe bearing of the costs between the consumer and the generator. In such a way, he cancarry out cost-benefit analysis to evaluate DSM measures. The concept of IntegratedResource Planning seems now old fashioned within the on going liberalisation ofmarkets36. At the energy system level, PRIMES is a complete tool for IRP evaluations,but the model is totally inadequate if IRP is to be carried out at the generator level.
To study the general issue of internalisation of externalities one has to use an accountingframework for externalities37, consider internalisation through economic instruments(thus compare them for effectiveness, as mentioned before) or define a regulation schemethat will oblige the actors to take into account external costs. Total cost pricing wasrecently brought up in the debate as a means to regulate decision-making. Total cost (thatis including external costs) can be imposed in all optimisation modules of PRIMES. Thiswill influence technology choice and pricing throughout the system.
The PRIMES Model Application for the European Union
Model NomenclatureRegions: 15 European Union countries
Fuel types: 24 energy forms in total; Coal, Lignite and Peat, Crude-oil, Residual FuelOil, Diesel Oil, Liquefied Petroleum Gas, Kerosene, Gasoline, Naphtha, Otheroil products, Bio-fuels, Natural and derived gas, Thermal Solar (active),Geothermal low and high enthalpy, Steam (industrial and distributed heat),Electricity, Biomass and Waste, Hydrogen, Solar electricity, Wind, Hydro.
Demand Sectors:
Residential: The residential sector distinguishes five categories of dwelling. Theseare defined according to the main technology used for space heating. They mayuse secondary heating as well. At the level of the sub-sectors, the modelstructure defines the categories of dwellings, which are further subdivided inenergy uses. The electric appliances for non heating and cooling are consideredas a special sub-sector, which is independent of the type of dwelling. Fourenergy use types are defined per dwelling type.
Commercial: The commercial and agriculture sector distinguishes 4 sub-sectors. At the level of the sub-sectors, the model defines energy services, whichare further subdivided in energy uses defined according to the pattern oftechnology. In total 7 sub-sectors and more than 30 end-use technology types aredefined.
Industry: The industrial model separately formulates 9 industrial sectors,namely iron and steel, non ferrous, chemicals, building materials, paper andpulp, food drink tobacco, engineering, textiles, other industries other industries.For each sector different sub-sectors are defined (in total about 30 sub-sectors,including recycling of materials). At the level of each sub-sector a number ofdifferent energy uses are represented (in total about 200 types of energy usetechnologies are defined).
36 If the concept is limited to the obligation of generators to do IRP, instead of the society.37 For example, EXTERNE results.
86
Transports: The transport sector distinguishes passenger transport and goodstransport as separate sectors. They are further subdivided in sub-sectorsaccording to the transport mean (road, air, etc.). At the level of the sub-sectors,the model structure defines several technology types (car technology types, forexample), which correspond to the level of energy use.
Transport modes: for urban passengers car, public transport, motorcycle, non urbanpassengers: car, bus, rail, air, navigation; for freight transport truck, rail, air,navigation. 6 to 10 alternative technologies for each mode (car, bus, truck); morelimited number of alternatives for rail, air and navigation
Supply Sectors:
Electricity production: 148 different plant types per country for the existingthermal plants; 678 different plant types per country for the new thermal plants;3 different plant types per country for the existing reservoir plants; 30 differentplant types per country for the existing intermittent plants. Chronological loadcurves, interconnections, network representation; three typical companies percountry; Cogeneration of power and steam, district heating
Refineries: 4 refineries with typical refinery structure; 6 typical refining units(cracking, reforming etc.)
Natural gas: Regional supply detail (Europe, Russia, Middle Africa, North Seaetc.); Transportation, distribution network
Time HorizonPRIMES is a long-term model that is being set to consider the period 1990-2030, runningby period of 5 years.
Output (Dynamic Annual Projections in Specific Units)Full detailed EUROSTAT Energy Balance sheets per country and per year
Energy demand at the above mentioned classification
Energy costs, producer and consumer prices
Power generation park, load curves, load factors, investment and marginal costs(central systems, combined heat-power, exchanges)
Refining units, expansion, costs
Natural gas transport and distribution: flows, capacities, costs
Endogenous treatment of energy savings and new technologies
Atmospheric emissions (CO2, NO
x, SO
2, N2O, CH4, VOC, PM), abatement
equipment and standards
Case Studies and Planning ApplicationsEnergy and environment technology assessment
Energy system implications of policy instruments for the environment (taxation,abatement standards, pollution permits, ...)
All issues of energy policy, investment plans and energy pricing policy
European energy market integration, European networks
Energy system implications and forecasting for the penetration of new energytechnologies in energy savings, energy demand, power generation etc.

87
Energy supply to Europe: dependency and vulnerability analysis for natural gas andoil.
Required InfrastructureHardware: PC Pentium with Windows ‘95 or Alpha Digital Equipment running NT-Windows with 128MB RAM or higher
Software: GAMS Ver. 2.25 with PATH solver and Cplex (or OSL)
MS EXCEL ver. 7.0 or later
The Power and Steam Generation Sub Model of PRIMESThe aim of the electricity and steam sub-model of PRIMES is to simulate the behaviourof agents that use fuels and other energy forms to produce, transmit and distributeelectricity, industrial steam and district heating. This behaviour concerns the choice ofequipment and the fuel mix to satisfy demand, the setting of selling prices and thepurchase of fuels from the energy markets. The model design is adapted to the verynature of the energy forms produced in this sub-model, related to the impossibility to usestorage, the high degree of capital intensive equipment and the importance of technologychoice for energy strategy.
The emergence of heat and power cogeneration possibilities and the prospects forincreasing decentralisation of production led to the adoption of a unified modelling forpower and steam production. On the contrary, the previous version of PRIMES hasconsidered a separation between centralised electricity and the independent production ofsteam and electricity, the latter being modelled within the demand sub-models ofPRIMES. That design has put more emphasis on the self-supply character ofcogeneration, since such a situation has prevailed in the market for a long period of time.The emergence of efficient smaller scale technologies and the opening of the markets tocompetition created new prospects for cogeneration and independent production. Themodelling needs then to tightly integrate producers of different nature, regarding forexample economies of scale and market opportunities, into a single framework that willmimic the operation of the market.
The new version of PRIMES puts emphasis on the different nature of producers that willoperate in the market and the interaction between electricity and steam markets, asenabled by cogeneration. For example, it is necessary to distinguish producers accordingto their scale, but also according to the captive markets they might address. A utility canexploit high economies of scale, but can hardly benefit from the market of steam, assteam cannot be self-consumed. On the contrary, an industrial independent producer willoperate at smaller plant size, loosing competitiveness as far as the economies of scale areconcerned, but obtaining benefits from a high base load demand for steam that he cansupply. A company operating at the level of local authorities may obtain benefits fromniche markets (renewables, district heating), but it will face a highly fluctuating demandfor heat and electricity.
The representation of different technologies that are now available or will be available inthe future is a major focus of the model, as it is intended to also serve for strategicanalyses on technology assessment. To support such analyses, the model uses a large listof alternative technologies and differentiates their technical-economic characteristicsaccording to the plant size, the fuel types, the cogeneration techniques, the country andthe type of producer. A model extension is also designed aiming at representing a non-linear cycle of the penetration of new technologies, for which learning throughexperience (and other industrial economic features) relates penetration with thetechnology performance.
The differences between the producer types play an important role in their ability toobtain interesting natural gas supply contracts. This issue seems to become very
88
important in the future, as natural gas is emerging as the key fuel because of technologyprogress and environmental constraints. Again, a unified modelling approach isnecessary to analyse the differentiated effects of natural gas for producers that differ asdescribed above.
Both the market allocation from the producer perspective and the effects of natural gassupply conditions need a consideration of the time pattern of demand, production andfuel supply. In addition, the corresponding loads have to be considered in chronologicalterms, as serious limitations would arise if using load duration monotone curves, becauseof the need to analyse the synchronisation of the time patterns of electricity consumption,steam consumption and fuel supply (such as natural gas).
The consideration of intermittent energy sources, such as the renewables, also requires arepresentation of chronological curves, as the random availability of the source over timecan be approximated. Nevertheless, the correct modelling of intermittent production alsorequires a representation of geographical characteristics of production and transmissionand a modelling of congestion over the electricity networks. Obviously, such features arenecessary to adequately represent the market for steam and heat. Such features have notbeen yet introduced in PRIMES, as the model mainly aims to serve for integratedstrategic analyses. The algebraic coding of the electricity and steam sub-model ofPRIMES is enough generic and abstract, to provide a consistent framework for modelexpansion in the future, along the geographical or network congestion research lines.
The development of independent power and/or steam producers and their market forcesheavily depend on the prevailing institutional regime in the market. In the past, marketregulation, cross-subsidisation and the importance of returns to scale in power productionhas deprived small independent producers to enter the market. Exceptions have arisen inspecific cases in which the scale of self-consumption or the existence of by-product fuelshas permitted the survival of independent producers. The expectations for the future aredifferent. New technologies allow for competitive production at a smaller scale, while theinstitutional regime in the market is increasingly opening to competition.
To represent these market dynamics, the model design preferred the representation ofrepresentative companies operating under a market competitive regime. For example, theexchanges of electricity and steam between the companies are performed under marginalcost pricing in the model. This choice has a limitation, as it cannot represent transitoryphenomena of oligopolistic nature that might prevail in the market. However, a fullcompetitive regime has been preferred as PRIMES puts emphasis on strategic analysis.Constraints regarding for example the degree of opening of the market can be introducedin the model through parameters regulating market allocation to producers.
In addition, constraints that would increase the inertia of the market are introduced in theform of contracts. These apply to both the exchanges between the companies and theprovisions of fuels.
Decision-making by electric utilities (or steam producers) may be considered in threedifferent, yet interrelated, problems:
? the strategic capacity expansion problem which concerns the choice ofnew plants for construction, so as to meet future demand at a least long-run generation cost;
? the operational plant selection and utilisation problem which concernsthe choice of existing plants to be committed in the system, so as to meetload at a least operation cost;
? the cost evaluation and pricing policy that has to be in conformity bothwith the long-term financial objectives of the company and with the aimto influence demand load.
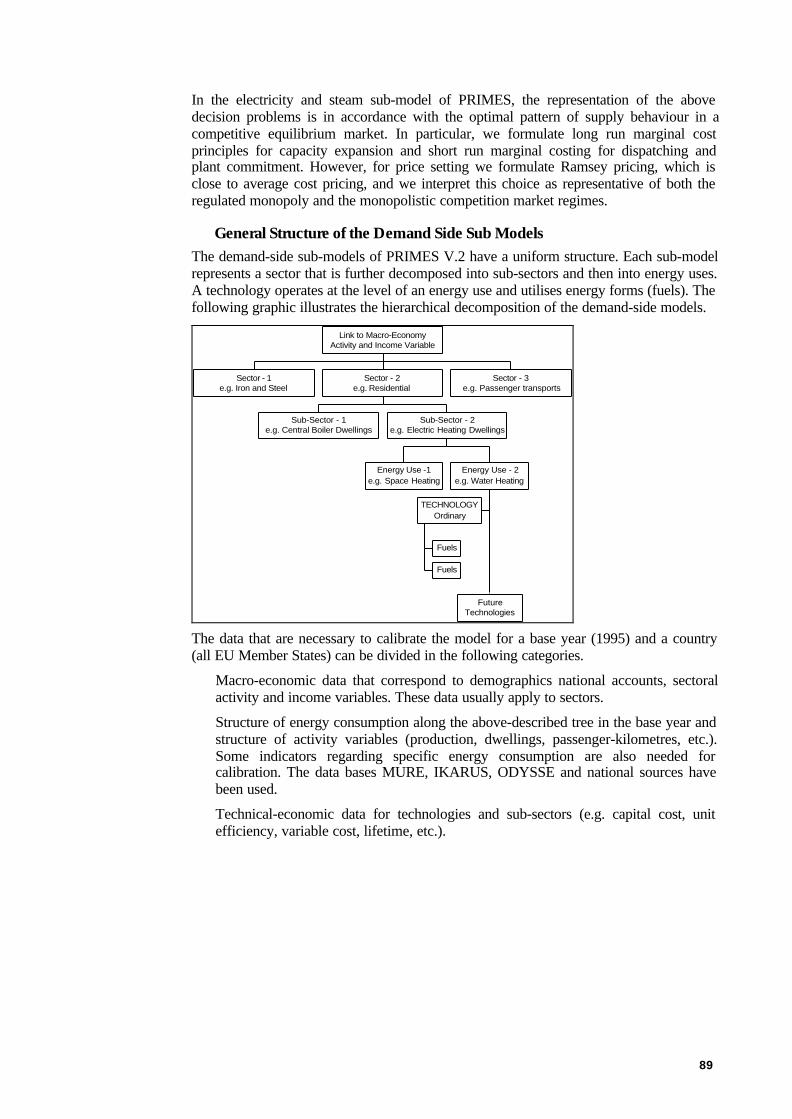
89
In the electricity and steam sub-model of PRIMES, the representation of the abovedecision problems is in accordance with the optimal pattern of supply behaviour in acompetitive equilibrium market. In particular, we formulate long run marginal costprinciples for capacity expansion and short run marginal costing for dispatching andplant commitment. However, for price setting we formulate Ramsey pricing, which isclose to average cost pricing, and we interpret this choice as representative of both theregulated monopoly and the monopolistic competition market regimes.
General Structure of the Demand Side Sub ModelsThe demand-side sub-models of PRIMES V.2 have a uniform structure. Each sub-modelrepresents a sector that is further decomposed into sub-sectors and then into energy uses.A technology operates at the level of an energy use and utilises energy forms (fuels). Thefollowing graphic illustrates the hierarchical decomposition of the demand-side models.
Sector - 1e.g. Iron and Steel
Sub-Sector - 1e.g. Central Boiler Dwellings
Energy Use -1e.g. Space Heating
Fuels
Fuels
TECHNOLOGYOrdinary
FutureTechnologies
Energy Use - 2e.g. Water Heating
Sub-Sector - 2e.g. Electric Heating Dwellings
Sector - 2e.g. Residential
Sector - 3e.g. Passenger transports
Link to Macro-EconomyActivity and Income Variable
The data that are necessary to calibrate the model for a base year (1995) and a country(all EU Member States) can be divided in the following categories.
Macro-economic data that correspond to demographics national accounts, sectoralactivity and income variables. These data usually apply to sectors.
Structure of energy consumption along the above-described tree in the base year andstructure of activity variables (production, dwellings, passenger-kilometres, etc.).Some indicators regarding specific energy consumption are also needed forcalibration. The data bases MURE, IKARUS, ODYSSE and national sources havebeen used.
Technical-economic data for technologies and sub-sectors (e.g. capital cost, unitefficiency, variable cost, lifetime, etc.).

90
APPENDIX II
Transformation of EUROSTAT energy balance sheets into PRIMESdata
The basic source of data for energy consumption by sector and fuel is EUROSTAT(detailed energy balance sheets). By using additional information (surveys ofcogeneration operation and capacities and surveys on boilers), the balance sheets havebeen modify in order to represent explicitly the production of steam.
According to PRIMES definitions, steam includes industrial steam and distributed heat(at small or large scale). In the balance sheets, EUROSTAT reports on steam productionin the transformation input/output only if the producers sell that steam. If the steam,irrespectively of the way it is produced (e.g. a boiler or a CHP plant), is used for self-consumption only, EUROSTAT accounts for only the fuels used to produce that steamand includes these fuels in final energy consumption. The PRIMES database consists inintroducing that steam (for self-consumption) in the final energy consumption tables ofthe balance sheets and inserting the fuels used to produce that steam in the table oftransformation input and output. This is necessary for the model to calibrate to a baseyear that properly accounts for the existing cogeneration activities (even if they are usedfor self-generation of steam).
The following table illustrates the differences between EUROSTAT energy balancesheets (as available in 1998) and data as used in PRIMES model after the re-allocation ofenergy requirements for steam production by industrial sectors, as well as in refineries, inpower and steam generation sector.
EUROSTAT
Final energy demand of which steam
Final energy demand of which steam
Input in industrial boilers
Total Industry 266026 3671 256931 55144 60568 571378 424285Iron and steel 55311 68 55293 189 139 175147 174748Non-ferrous metals 11304 0 11304 0 0 16240 16240Chemicals 51552 1571 48017 22564 24527 96675 26206Building materials 36417 0 36417 0 0 98142 98142Paper and pulp 29365 176 26454 13748 16482 29460 10586Food, drink, tobacco 22738 818 21103 11218 12035 46197 10677Textiles 9225 244 8529 4656 5108 42142 39278Engineering 25297 569 25167 1419 980 17190 2136Other industries 24819 225 24647 1351 1298 50185 46272Energy Branch 86520 55903 30617 129057 56840
Transformation input
Transformation input
of which in ind. Boilers
of which in ind. Boilers
Total power and steam generation 279706 365467 85761 991990 1211300 219310Utilities 237935 237935 859584 859584District heating 9880 9880 30860 30860Industrial Autoproducers 31892 117653 85761 101547 320857 219310Source: EUROSTAT, PRIMES
CO2 emissions 1990 (Mt CO2)
PRIMESEUROSTAT PRIMES
Energy balance 1990 (ktoe)
It should also be noted that EUROSTAT database includes a category for finalconsumption in industry, which incorporates fuel consumption that is not allocated in aspecific sector. In general, biomass-waste consumption is allocated in this category andnot in specific industrial sectors. In the context of Shared Analysis a discussion has beenmade with experts and institutes on where to allocate consumption of biomass-waste andit has been agreed that in most of the cases this is consumption of the paper and pulpsector for steam production. Finally, it should be mentioned that when calibrating thePRIMES model the split between agriculture and services was not available and therefore

91
it was based on assumptions, which, however, underestimate fuel consumption inagriculture.
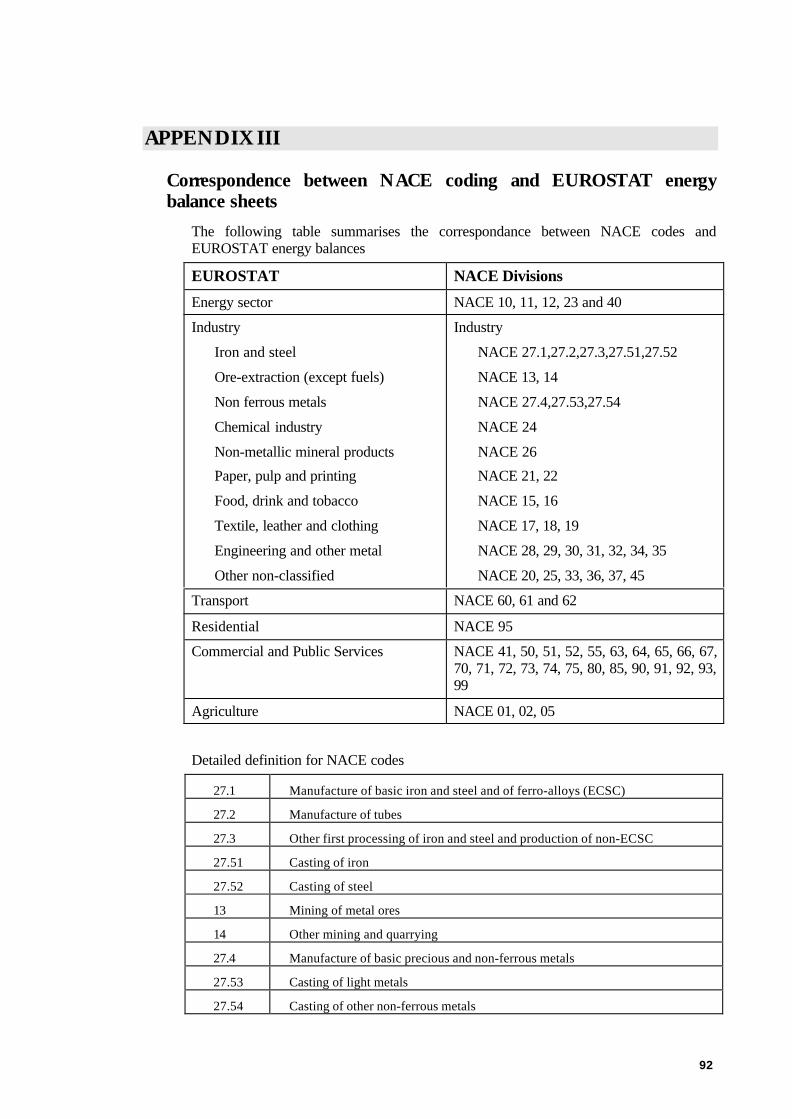
92
APPENDIX III
Correspondence between NACE coding and EUROSTAT energybalance sheets
The following table summarises the correspondance between NACE codes andEUROSTAT energy balances
EUROSTAT NACE Divisions
Energy sector NACE 10, 11, 12, 23 and 40
Industry
Iron and steel
Ore-extraction (except fuels)
Non ferrous metals
Chemical industry
Non-metallic mineral products
Paper, pulp and printing
Food, drink and tobacco
Textile, leather and clothing
Engineering and other metal
Other non-classified
Industry
NACE 27.1,27.2,27.3,27.51,27.52
NACE 13, 14
NACE 27.4,27.53,27.54
NACE 24
NACE 26
NACE 21, 22
NACE 15, 16
NACE 17, 18, 19
NACE 28, 29, 30, 31, 32, 34, 35
NACE 20, 25, 33, 36, 37, 45
Transport NACE 60, 61 and 62
Residential NACE 95
Commercial and Public Services NACE 41, 50, 51, 52, 55, 63, 64, 65, 66, 67,70, 71, 72, 73, 74, 75, 80, 85, 90, 91, 92, 93,99
Agriculture NACE 01, 02, 05
Detailed definition for NACE codes
27.1 Manufacture of basic iron and steel and of ferro-alloys (ECSC)
27.2 Manufacture of tubes
27.3 Other first processing of iron and steel and production of non-ECSC
27.51 Casting of iron
27.52 Casting of steel
13 Mining of metal ores
14 Other mining and quarrying
27.4 Manufacture of basic precious and non-ferrous metals
27.53 Casting of light metals
27.54 Casting of other non-ferrous metals
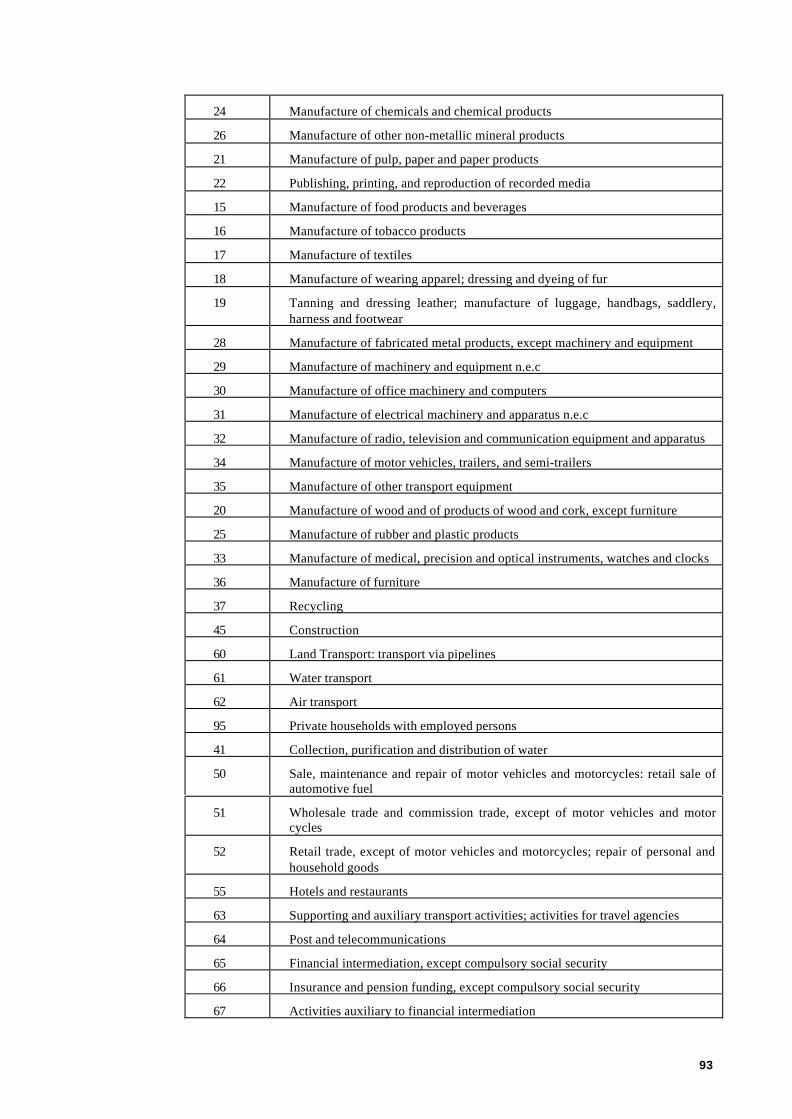
93
24 Manufacture of chemicals and chemical products
26 Manufacture of other non-metallic mineral products
21 Manufacture of pulp, paper and paper products
22 Publishing, printing, and reproduction of recorded media
15 Manufacture of food products and beverages
16 Manufacture of tobacco products
17 Manufacture of textiles
18 Manufacture of wearing apparel; dressing and dyeing of fur
19 Tanning and dressing leather; manufacture of luggage, handbags, saddlery,harness and footwear
28 Manufacture of fabricated metal products, except machinery and equipment
29 Manufacture of machinery and equipment n.e.c
30 Manufacture of office machinery and computers
31 Manufacture of electrical machinery and apparatus n.e.c
32 Manufacture of radio, television and communication equipment and apparatus
34 Manufacture of motor vehicles, trailers, and semi-trailers
35 Manufacture of other transport equipment
20 Manufacture of wood and of products of wood and cork, except furniture
25 Manufacture of rubber and plastic products
33 Manufacture of medical, precision and optical instruments, watches and clocks
36 Manufacture of furniture
37 Recycling
45 Construction
60 Land Transport: transport via pipelines
61 Water transport
62 Air transport
95 Private households with employed persons
41 Collection, purification and distribution of water
50 Sale, maintenance and repair of motor vehicles and motorcycles: retail sale ofautomotive fuel
51 Wholesale trade and commission trade, except of motor vehicles and motorcycles
52 Retail trade, except of motor vehicles and motorcycles; repair of personal andhousehold goods
55 Hotels and restaurants
63 Supporting and auxiliary transport activities; activities for travel agencies
64 Post and telecommunications
65 Financial intermediation, except compulsory social security
66 Insurance and pension funding, except compulsory social security
67 Activities auxiliary to financial intermediation
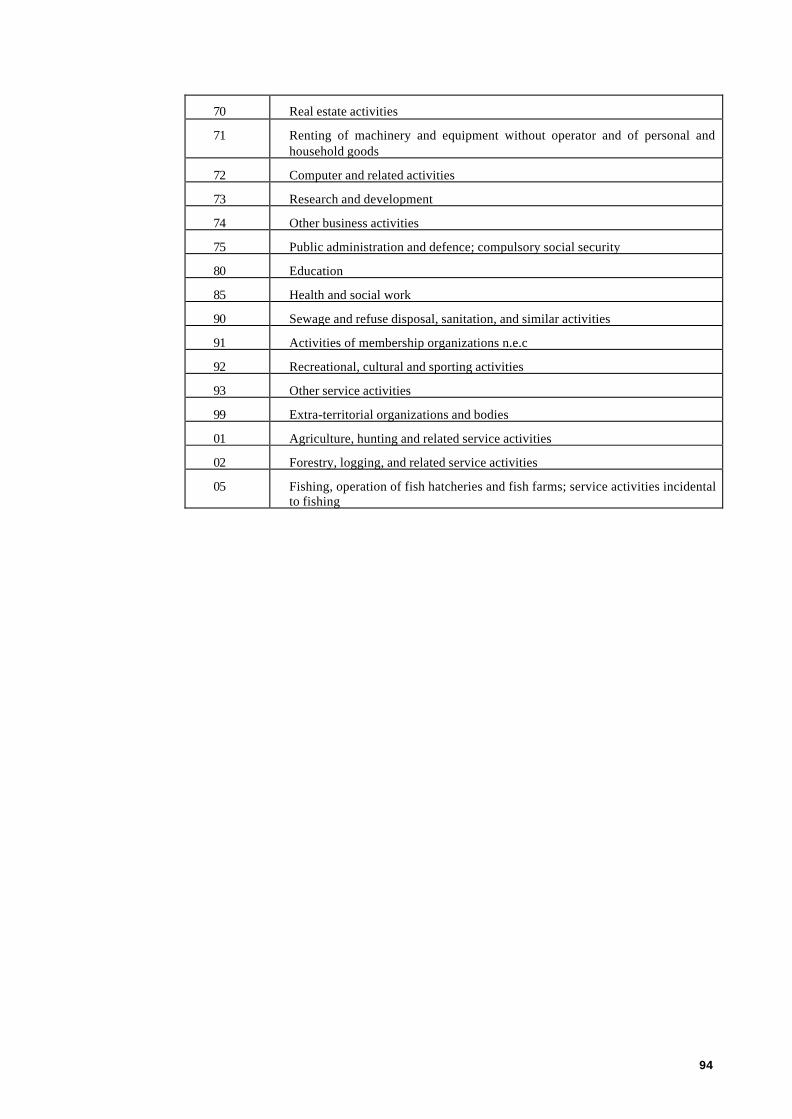
94
70 Real estate activities
71 Renting of machinery and equipment without operator and of personal andhousehold goods
72 Computer and related activities
73 Research and development
74 Other business activities
75 Public administration and defence; compulsory social security
80 Education
85 Health and social work
90 Sewage and refuse disposal, sanitation, and similar activities
91 Activities of membership organizations n.e.c
92 Recreational, cultural and sporting activities
93 Other service activities
99 Extra-territorial organizations and bodies
01 Agriculture, hunting and related service activities
02 Forestry, logging, and related service activities
05 Fishing, operation of fish hatcheries and fish farms; service activities incidentalto fishing
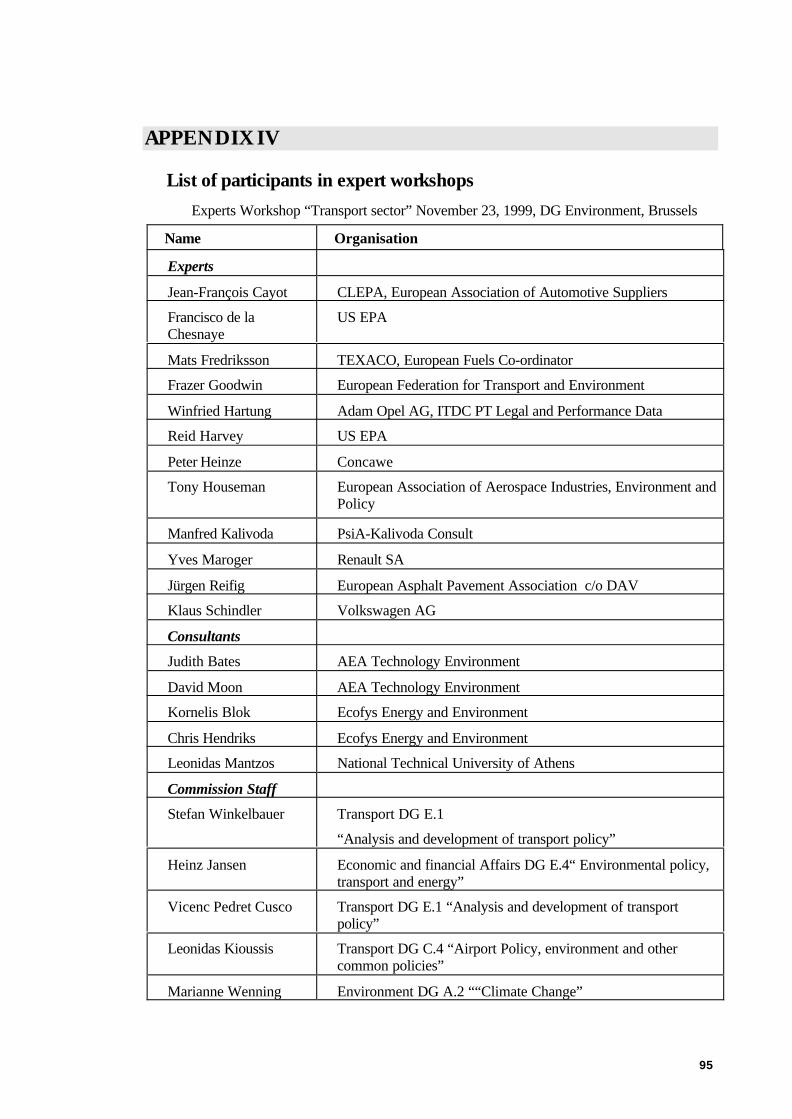
95
APPENDIX IV
List of participants in expert workshopsExperts Workshop “Transport sector” November 23, 1999, DG Environment, Brussels
Name Organisation
Experts
Jean-François Cayot CLEPA, European Association of Automotive Suppliers
Francisco de laChesnaye
US EPA
Mats Fredriksson TEXACO, European Fuels Co-ordinator
Frazer Goodwin European Federation for Transport and Environment
Winfried Hartung Adam Opel AG, ITDC PT Legal and Performance Data
Reid Harvey US EPA
Peter Heinze Concawe
Tony Houseman European Association of Aerospace Industries, Environment andPolicy
Manfred Kalivoda PsiA-Kalivoda Consult
Yves Maroger Renault SA
Jürgen Reifig European Asphalt Pavement Association c/o DAV
Klaus Schindler Volkswagen AG
Consultants
Judith Bates AEA Technology Environment
David Moon AEA Technology Environment
Kornelis Blok Ecofys Energy and Environment
Chris Hendriks Ecofys Energy and Environment
Leonidas Mantzos National Technical University of Athens
Commission Staff
Stefan Winkelbauer Transport DG E.1
“Analysis and development of transport policy”
Heinz Jansen Economic and financial Affairs DG E.4“ Environmental policy,transport and energy”
Vicenc Pedret Cusco Transport DG E.1 “Analysis and development of transportpolicy”
Leonidas Kioussis Transport DG C.4 “Airport Policy, environment and othercommon policies”
Marianne Wenning Environment DG A.2 ““Climate Change”

96
Suzanne Doschko Entreprise DG B.5 “Access to finance and Communityprogrammes”
Daniel Mailliet Environment DG A.2 “Climate change”
Günter Hörmandinger Environment DG D.3 “Air quality, urban environment, noise,transport and energy”
Thomas Verheye Environment DG B.2
Economic Analyses and Employment Unit
Matti Vainio Environment DG B.2
Economic Analyses and Employment Unit
Experts Workshop “Energy supply” March 29, 2000, DG Environment, Brussels
Name Organisation
Eivind Aarebrot Statoil
Rob Bradley Climate Network Europe
Marc Darras Gaz de France
Jürgen Engelhard Rheinbraun AG
Margot Loudon Eurogas (European Union of the Natural Gas Industry)
Mercedes Marin COGEN Europe
Bo Nelson Vattenfall
Nick Otter ABB Alstom Power
Beate Raabe International Association of Oil and Gas Producers
Stephan Singer WWF European Policy Office
Björn Sund Norsk Hydro, Research Technology
Helmut Warsch Siemens
Gerd Weber German Coal Mining Association
Arturos Zervos European Wind Energy Association
Consultants
Judith Bates AEA Technology Environment
Kornelis Blok Ecofys Energy and Environment
Pantelis Capros NTUA - E3M – Lab
David de Jager Ecofys Energy and Environment
Chris Hendriks Ecofys Energy and Environment
Commission staff
Timo Aaltonen TREN.B.1 Sectorial Economy
Jaime Garcia TREN.A.3 Environment
Marc Hayden ECFIN.E.4 Environmental policy, transport and energy
Peter Horrocks ENV.D.3 Air quality, urbain environement, noise, transport &

97
energy
Marco Loprieno ENV.A.2 Climate change
Aphrodite Mourelatou European Environment Agency
Matti Vainio ENV.B.2 Economic Analyses and Employment
Beatriz Yordi DG TREN.D.1 Promotion des énergies et maîtrise de lademande
Experts Workshop “Industry” and “Commercial and Residential sector”, March 30,2000, DG Environment, Brussels
Name Organisation
Experts
Paul Ashford Caleb Management Services Limited (EUROACE)
Rob Bradley Climate Network Europe
Valérie Callaud EUROPIA
Giovanni Cinti Italcementi Group, C.T.G. S.p.A
Christine De Laeter Dow Benelux NV Powerplant
Aymon de Reydellet Saint Gobain Isover, Environnement et risques industriels
Mats Fredriksson Texaco
Graham Funnell UK Steel Association
Anu Karessuo Finnish Forest Industries Federation Environmental Manager
Paul Laffont Saint Gobain Isover Dir. Environnement et Normalisation
Lars Nilsson Lund University Department of environmental and energysystems studies
Erik Nordheim European Aluminium Association
Stephan Singer WWF European Policy Office
Helmut Warsch Siemens
Consultants
Judith Bates AEA Technology Environment
Kornelis Blok Ecofys Energy and Environment
Pantelis Capros National Technical University of Athens
Jeroen de Beer Ecofys Energy and Environment
Chris Hendriks Ecofys Energy and Environment
Commission staff
Timo Aaltonen TREN.B.1
Suzanne Doschko ENTR.E.1
Marc Hayden ECFIN.E.4 Environmental policy, transport and energy
Peter Horrocks ENV.D.3, Air quality, urban environment, noise, transport &energy
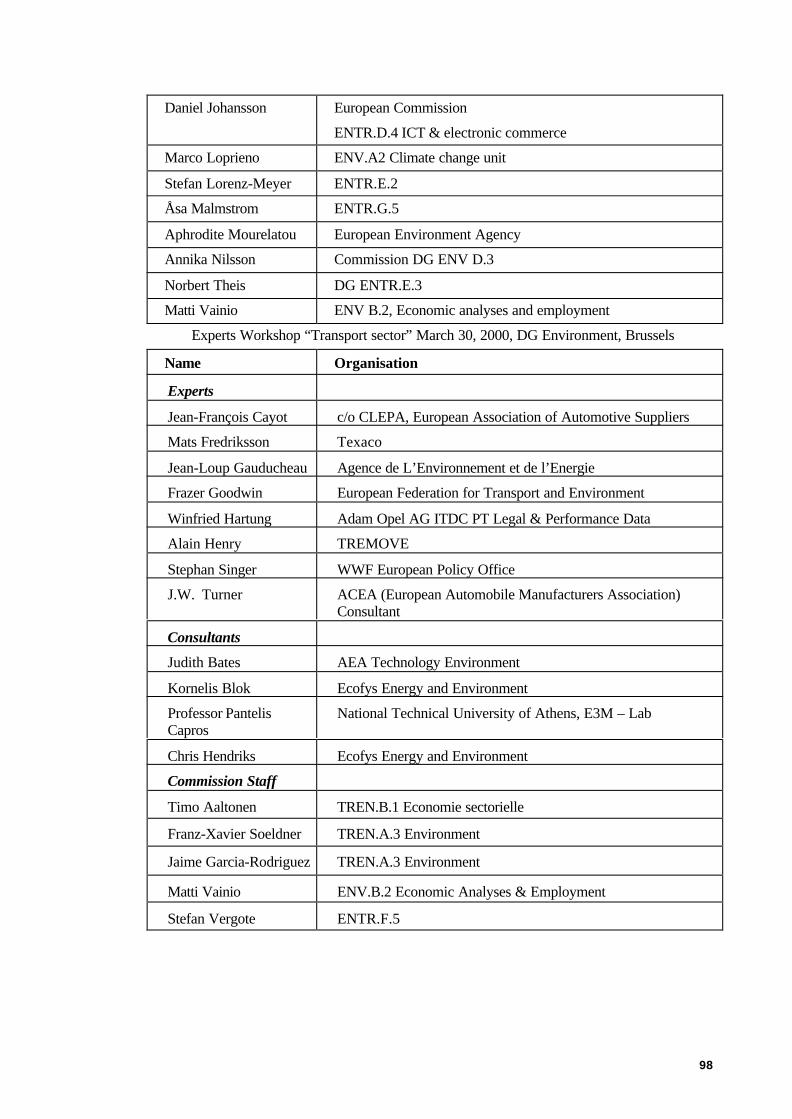
98
Daniel Johansson European Commission
ENTR.D.4 ICT & electronic commerce
Marco Loprieno ENV.A2 Climate change unit
Stefan Lorenz-Meyer ENTR.E.2
Åsa Malmstrom ENTR.G.5
Aphrodite Mourelatou European Environment Agency
Annika Nilsson Commission DG ENV D.3
Norbert Theis DG ENTR.E.3
Matti Vainio ENV B.2, Economic analyses and employment
Experts Workshop “Transport sector” March 30, 2000, DG Environment, Brussels
Name Organisation
Experts
Jean-François Cayot c/o CLEPA, European Association of Automotive Suppliers
Mats Fredriksson Texaco
Jean-Loup Gauducheau Agence de L’Environnement et de l’Energie
Frazer Goodwin European Federation for Transport and Environment
Winfried Hartung Adam Opel AG ITDC PT Legal & Performance Data
Alain Henry TREMOVE
Stephan Singer WWF European Policy Office
J.W. Turner ACEA (European Automobile Manufacturers Association)Consultant
Consultants
Judith Bates AEA Technology Environment
Kornelis Blok Ecofys Energy and Environment
Professor PantelisCapros
National Technical University of Athens, E3M – Lab
Chris Hendriks Ecofys Energy and Environment
Commission Staff
Timo Aaltonen TREN.B.1 Economie sectorielle
Franz-Xavier Soeldner TREN.A.3 Environment
Jaime Garcia-Rodriguez TREN.A.3 Environment
Matti Vainio ENV.B.2 Economic Analyses & Employment
Stefan Vergote ENTR.F.5
99
APPENDIX V
List of reports
Reports prepared in the framework of the project ‘Economic Evaluation of SectoralEmission Reduction Objectives for Climate Change’:
BOTTOM-UP METHODOLOGY GENESIS
Summary report
Chris Hendriks, David de Jager, Kornelis Blok et al.. 2001. ‘Economic Evaluation of SectoralEmission Reduction Objectives for Climate Change: Bottom-up Analysis of EmissionReduction Potentials and Costs for Greenhouse Gases in the EU’, ECOFYS Energy andEnvironment / AEA Technology, Utrecht, The Netherlands, March 2001.
Sector reports (engineering/economic analysis study)• S. Joosen & K. Blok. 2001. ‘Economic Evaluation of Sectoral Emission Reduction
Objectives for Climate Change Economic Evaluation of Carbon Dioxide Emission Reductionin the Household and Services Sectors in the EU’. ECOFYS Energy and Environment, TheNetherlands, January 2001.
• J. de Beer, D. Phylipsen, & J. Bates. 2001. ‘Economic Evaluation of Sectoral EmissionReduction Objectives for Climate Change. Economic Evaluation of Carbon Dioxide andNitrous Oxide Emission Reductions in Industry in the EU – Bottom-up Analysis’. ECOFYSEnergy and Environment, The Netherlands & AEA Technology Environment, Culham,United Kingdom. January 2001.
• C. Hendriks, D. de Jager, J. de Beer, M. van Brummelen, K. Blok & M. Kerssemeeckers.2001. ‘Economic Evaluation of Sectoral Emission Reduction Objectives for Climate Change.Economic Evaluation of Emission Reduction of Greenhouse Gases in the Energy Supplysector in the EU’. ECOFYS Energy and Environment, The Netherlands. March 2001.
• J. Bates, C. Brand, P. Davison & N. Hill. 2000. ‘Economic Evaluation of Sectoral EmissionReduction Objectives for Climate Change. Economic Evaluation of Emissions Reductions inthe Transport Sector of the EU’. AEA Technology Environment, Culham, United Kingdom.March 2001 (update).
• J. Bates. 2000. ‘Economic Evaluation of Sectoral Emission Reduction Objectives for ClimateChange. Economic Evaluation of Emission Reductions of Nitrous Oxides and Methane inAgriculture in the EU’. AEA Technology Environment, Culham, United Kingdom. February2001 (update).
• J. Bates & A. Haworth. 2000. ‘Economic Evaluation of Sectoral Emission ReductionObjectives for Climate Change Economic Evaluation of Emission Reductions of Methane inthe Waste Sector in the EU’. AEA Technology Environment, Culham, United Kingdom.March 2001 (update).
• C. Hendriks & D. de Jager. 2001. ‘Economic Evaluation of Sectoral Emission ReductionObjectives for Climate Change. Economic Evaluation of Methane Emission Reduction in theExtraction, Transport and Distribution of Fossil Fuels in the EU’. ECOFYS Energy andEnvironment, The Netherlands. January 2001.
• J. Harnisch & C. Hendriks. 2000. ‘Economic Evaluation of Sectoral Emission ReductionObjectives for Climate Change. Economic Evaluation of Emission Reductions of HFCs,PFCs and SF6 in Europe’. ECOFYS Energy and Environment, The Netherlands. April,2000.
100
TOP-DOWN METHODOLOGY PRIMES
P. Capros, N. Kouvaritakis & L. Mantzos. 2001. ‘Economic Evaluation of Sectoral EmissionReduction Objectives for Climate Change. Top-down Analysis of Greenhouse Gas EmissionReduction Possibilities in the EU’, National Technical University of Athens, Athens, March2001.
GENERAL/OVERVIEW REPORTS
K. Blok, D.de Jager & C. Hendriks. 2001. ‘Economic Evaluation of Sectoral EmissionReduction Objectives for Climate Change – Summary Report for Policy Makers , ECOFYSEnergy and Environment, AEA Technology, National Technical University of Athens,Utrecht, March 2001.
K. Blok, D. de Jager, C. Hendriks, N. Kouvaritakis & L. Mantzos. 2001. ‘Comparison of'Top-down' and 'Bottom-up' Analysis of Emission Reduction Opportunities for CO2 in theEuropean Union’ (Memorandum), ECOFYS Energy and Environment / National TechnicalUniversity of Athens, Utrecht, January 2001.
101
APPENDIX VI
Sectoral analysis of impacts of alternative emission reduction objectivesin the EU energy system
Results obtained from PRIMES Model Runs for energy related CO2 emissions in the EUcan be found on:
http://europa.eu.int/comm/environment/enveco/climate_change/sectoral_objectives.htm
in the following file:
TD App 6.pdf
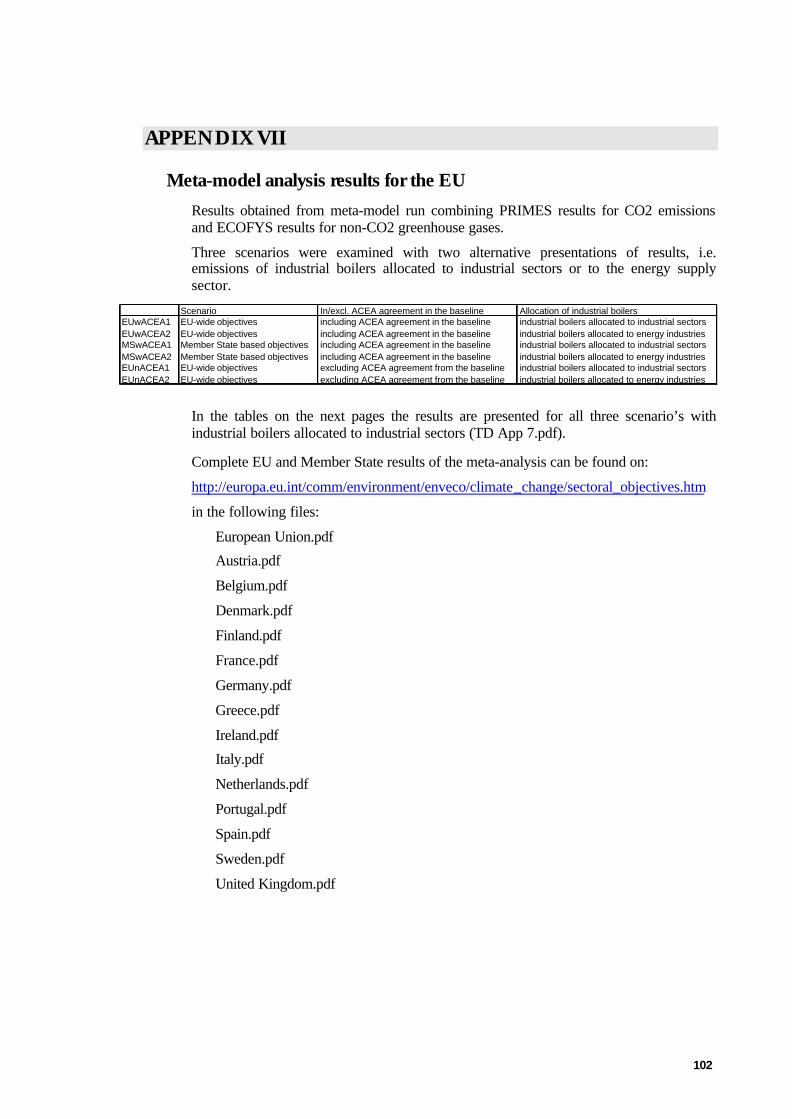
102
APPENDIX VII
Meta-model analysis results for the EUResults obtained from meta-model run combining PRIMES results for CO2 emissionsand ECOFYS results for non-CO2 greenhouse gases.
Three scenarios were examined with two alternative presentations of results, i.e.emissions of industrial boilers allocated to industrial sectors or to the energy supplysector.
Scenario In/excl. ACEA agreement in the baseline Allocation of industrial boilersEUwACEA1 EU-wide objectives including ACEA agreement in the baseline industrial boilers allocated to industrial sectorsEUwACEA2 EU-wide objectives including ACEA agreement in the baseline industrial boilers allocated to energy industriesMSwACEA1 Member State based objectives including ACEA agreement in the baseline industrial boilers allocated to industrial sectorsMSwACEA2 Member State based objectives including ACEA agreement in the baseline industrial boilers allocated to energy industriesEUnACEA1 EU-wide objectives excluding ACEA agreement from the baseline industrial boilers allocated to industrial sectorsEUnACEA2 EU-wide objectives excluding ACEA agreement from the baseline industrial boilers allocated to energy industries
In the tables on the next pages the results are presented for all three scenario’s withindustrial boilers allocated to industrial sectors (TD App 7.pdf).
Complete EU and Member State results of the meta-analysis can be found on:
http://europa.eu.int/comm/environment/enveco/climate_change/sectoral_objectives.htm
in the following files:
European Union.pdf
Austria.pdf
Belgium.pdf
Denmark.pdf
Finland.pdf
France.pdf
Germany.pdf
Greece.pdf
Ireland.pdf
Italy.pdf
Netherlands.pdf
Portugal.pdf
Spain.pdf
Sweden.pdf
United Kingdom.pdf
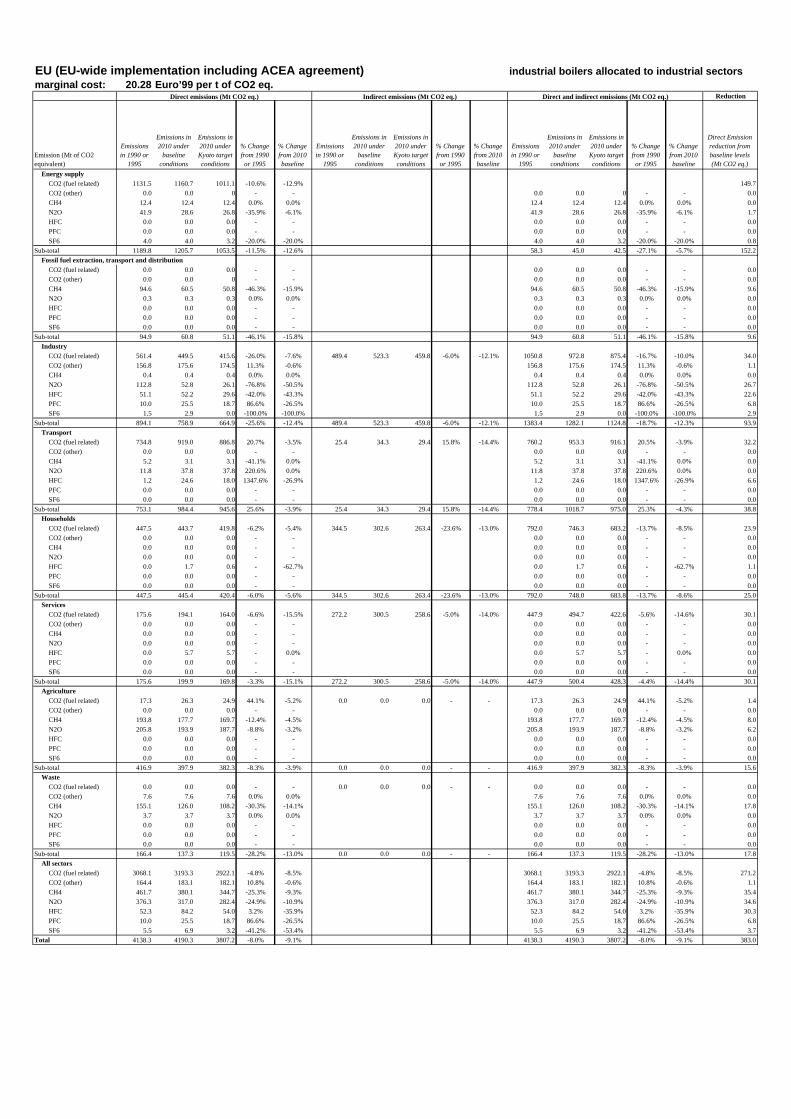
industrial boilers allocated to industrial sectorsmarginal cost: 20.28 Euro’99 per t of CO2 eq.
Reduction
Emission (Mt of CO2 equivalent)
Emissions in 1990 or
1995
Emissions in 2010 under
baseline conditions
Emissions in 2010 under Kyoto target conditions
% Change from 1990
or 1995
% Change from 2010 baseline
Emissions in 1990 or
1995
Emissions in 2010 under
baseline conditions
Emissions in 2010 under Kyoto target conditions
% Change from 1990
or 1995
% Change from 2010 baseline
Emissions in 1990 or
1995
Emissions in 2010 under
baseline conditions
Emissions in 2010 under Kyoto target conditions
% Change from 1990
or 1995
% Change from 2010 baseline
Direct Emission reduction from baseline levels (Mt CO2 eq.)
Energy supplyCO2 (fuel related) 1131.5 1160.7 1011.1 -10.6% -12.9% 149.7
CO2 (other) 0.0 0.0 0 - - 0.0 0.0 0 - - 0.0
CH4 12.4 12.4 12.4 0.0% 0.0% 12.4 12.4 12.4 0.0% 0.0% 0.0
N2O 41.9 28.6 26.8 -35.9% -6.1% 41.9 28.6 26.8 -35.9% -6.1% 1.7
HFC 0.0 0.0 0.0 - - 0.0 0.0 0.0 - - 0.0
PFC 0.0 0.0 0.0 - - 0.0 0.0 0.0 - - 0.0
SF6 4.0 4.0 3.2 -20.0% -20.0% 4.0 4.0 3.2 -20.0% -20.0% 0.8
Sub-total 1189.8 1205.7 1053.5 -11.5% -12.6% 58.3 45.0 42.5 -27.1% -5.7% 152.2
Fossil fuel extraction, transport and distributionCO2 (fuel related) 0.0 0.0 0.0 - - 0.0 0.0 0.0 - - 0.0
CO2 (other) 0.0 0.0 0 - - 0.0 0.0 0.0 - - 0.0
CH4 94.6 60.5 50.8 -46.3% -15.9% 94.6 60.5 50.8 -46.3% -15.9% 9.6
N2O 0.3 0.3 0.3 0.0% 0.0% 0.3 0.3 0.3 0.0% 0.0% 0.0
HFC 0.0 0.0 0.0 - - 0.0 0.0 0.0 - - 0.0
PFC 0.0 0.0 0.0 - - 0.0 0.0 0.0 - - 0.0
SF6 0.0 0.0 0.0 - - 0.0 0.0 0.0 - - 0.0
Sub-total 94.9 60.8 51.1 -46.1% -15.8% 94.9 60.8 51.1 -46.1% -15.8% 9.6
IndustryCO2 (fuel related) 561.4 449.5 415.6 -26.0% -7.6% 489.4 523.3 459.8 -6.0% -12.1% 1050.8 972.8 875.4 -16.7% -10.0% 34.0
CO2 (other) 156.8 175.6 174.5 11.3% -0.6% 156.8 175.6 174.5 11.3% -0.6% 1.1
CH4 0.4 0.4 0.4 0.0% 0.0% 0.4 0.4 0.4 0.0% 0.0% 0.0
N2O 112.8 52.8 26.1 -76.8% -50.5% 112.8 52.8 26.1 -76.8% -50.5% 26.7
HFC 51.1 52.2 29.6 -42.0% -43.3% 51.1 52.2 29.6 -42.0% -43.3% 22.6
PFC 10.0 25.5 18.7 86.6% -26.5% 10.0 25.5 18.7 86.6% -26.5% 6.8
SF6 1.5 2.9 0.0 -100.0% -100.0% 1.5 2.9 0.0 -100.0% -100.0% 2.9
Sub-total 894.1 758.9 664.9 -25.6% -12.4% 489.4 523.3 459.8 -6.0% -12.1% 1383.4 1282.1 1124.8 -18.7% -12.3% 93.9
TransportCO2 (fuel related) 734.8 919.0 886.8 20.7% -3.5% 25.4 34.3 29.4 15.8% -14.4% 760.2 953.3 916.1 20.5% -3.9% 32.2
CO2 (other) 0.0 0.0 0.0 - - 0.0 0.0 0.0 - - 0.0
CH4 5.2 3.1 3.1 -41.1% 0.0% 5.2 3.1 3.1 -41.1% 0.0% 0.0
N2O 11.8 37.8 37.8 220.6% 0.0% 11.8 37.8 37.8 220.6% 0.0% 0.0
HFC 1.2 24.6 18.0 1347.6% -26.9% 1.2 24.6 18.0 1347.6% -26.9% 6.6
PFC 0.0 0.0 0.0 - - 0.0 0.0 0.0 - - 0.0
SF6 0.0 0.0 0.0 - - 0.0 0.0 0.0 - - 0.0
Sub-total 753.1 984.4 945.6 25.6% -3.9% 25.4 34.3 29.4 15.8% -14.4% 778.4 1018.7 975.0 25.3% -4.3% 38.8
HouseholdsCO2 (fuel related) 447.5 443.7 419.8 -6.2% -5.4% 344.5 302.6 263.4 -23.6% -13.0% 792.0 746.3 683.2 -13.7% -8.5% 23.9
CO2 (other) 0.0 0.0 0.0 - - 0.0 0.0 0.0 - - 0.0
CH4 0.0 0.0 0.0 - - 0.0 0.0 0.0 - - 0.0
N2O 0.0 0.0 0.0 - - 0.0 0.0 0.0 - - 0.0
HFC 0.0 1.7 0.6 - -62.7% 0.0 1.7 0.6 - -62.7% 1.1
PFC 0.0 0.0 0.0 - - 0.0 0.0 0.0 - - 0.0
SF6 0.0 0.0 0.0 - - 0.0 0.0 0.0 - - 0.0
Sub-total 447.5 445.4 420.4 -6.0% -5.6% 344.5 302.6 263.4 -23.6% -13.0% 792.0 748.0 683.8 -13.7% -8.6% 25.0
ServicesCO2 (fuel related) 175.6 194.1 164.0 -6.6% -15.5% 272.2 300.5 258.6 -5.0% -14.0% 447.9 494.7 422.6 -5.6% -14.6% 30.1
CO2 (other) 0.0 0.0 0.0 - - 0.0 0.0 0.0 - - 0.0
CH4 0.0 0.0 0.0 - - 0.0 0.0 0.0 - - 0.0
N2O 0.0 0.0 0.0 - - 0.0 0.0 0.0 - - 0.0
HFC 0.0 5.7 5.7 - 0.0% 0.0 5.7 5.7 - 0.0% 0.0
PFC 0.0 0.0 0.0 - - 0.0 0.0 0.0 - - 0.0
SF6 0.0 0.0 0.0 - - 0.0 0.0 0.0 - - 0.0
Sub-total 175.6 199.9 169.8 -3.3% -15.1% 272.2 300.5 258.6 -5.0% -14.0% 447.9 500.4 428.3 -4.4% -14.4% 30.1
AgricultureCO2 (fuel related) 17.3 26.3 24.9 44.1% -5.2% 0.0 0.0 0.0 - - 17.3 26.3 24.9 44.1% -5.2% 1.4
CO2 (other) 0.0 0.0 0.0 - - 0.0 0.0 0.0 - - 0.0
CH4 193.8 177.7 169.7 -12.4% -4.5% 193.8 177.7 169.7 -12.4% -4.5% 8.0
N2O 205.8 193.9 187.7 -8.8% -3.2% 205.8 193.9 187.7 -8.8% -3.2% 6.2
HFC 0.0 0.0 0.0 - - 0.0 0.0 0.0 - - 0.0
PFC 0.0 0.0 0.0 - - 0.0 0.0 0.0 - - 0.0
SF6 0.0 0.0 0.0 - - 0.0 0.0 0.0 - - 0.0
Sub-total 416.9 397.9 382.3 -8.3% -3.9% 0.0 0.0 0.0 - - 416.9 397.9 382.3 -8.3% -3.9% 15.6
WasteCO2 (fuel related) 0.0 0.0 0.0 - - 0.0 0.0 0.0 - - 0.0 0.0 0.0 - - 0.0
CO2 (other) 7.6 7.6 7.6 0.0% 0.0% 7.6 7.6 7.6 0.0% 0.0% 0.0
CH4 155.1 126.0 108.2 -30.3% -14.1% 155.1 126.0 108.2 -30.3% -14.1% 17.8
N2O 3.7 3.7 3.7 0.0% 0.0% 3.7 3.7 3.7 0.0% 0.0% 0.0
HFC 0.0 0.0 0.0 - - 0.0 0.0 0.0 - - 0.0
PFC 0.0 0.0 0.0 - - 0.0 0.0 0.0 - - 0.0
SF6 0.0 0.0 0.0 - - 0.0 0.0 0.0 - - 0.0
Sub-total 166.4 137.3 119.5 -28.2% -13.0% 0.0 0.0 0.0 - - 166.4 137.3 119.5 -28.2% -13.0% 17.8
All sectorsCO2 (fuel related) 3068.1 3193.3 2922.1 -4.8% -8.5% 3068.1 3193.3 2922.1 -4.8% -8.5% 271.2
CO2 (other) 164.4 183.1 182.1 10.8% -0.6% 164.4 183.1 182.1 10.8% -0.6% 1.1
CH4 461.7 380.1 344.7 -25.3% -9.3% 461.7 380.1 344.7 -25.3% -9.3% 35.4
N2O 376.3 317.0 282.4 -24.9% -10.9% 376.3 317.0 282.4 -24.9% -10.9% 34.6
HFC 52.3 84.2 54.0 3.2% -35.9% 52.3 84.2 54.0 3.2% -35.9% 30.3
PFC 10.0 25.5 18.7 86.6% -26.5% 10.0 25.5 18.7 86.6% -26.5% 6.8
SF6 5.5 6.9 3.2 -41.2% -53.4% 5.5 6.9 3.2 -41.2% -53.4% 3.7
Total 4138.3 4190.3 3807.2 -8.0% -9.1% 4138.3 4190.3 3807.2 -8.0% -9.1% 383.0
EU (EU-wide implementation including ACEA agreement)
Direct emissions (Mt CO2 eq.) Indirect emissions (Mt CO2 eq.) Direct and indirect emissions (Mt CO2 eq.)
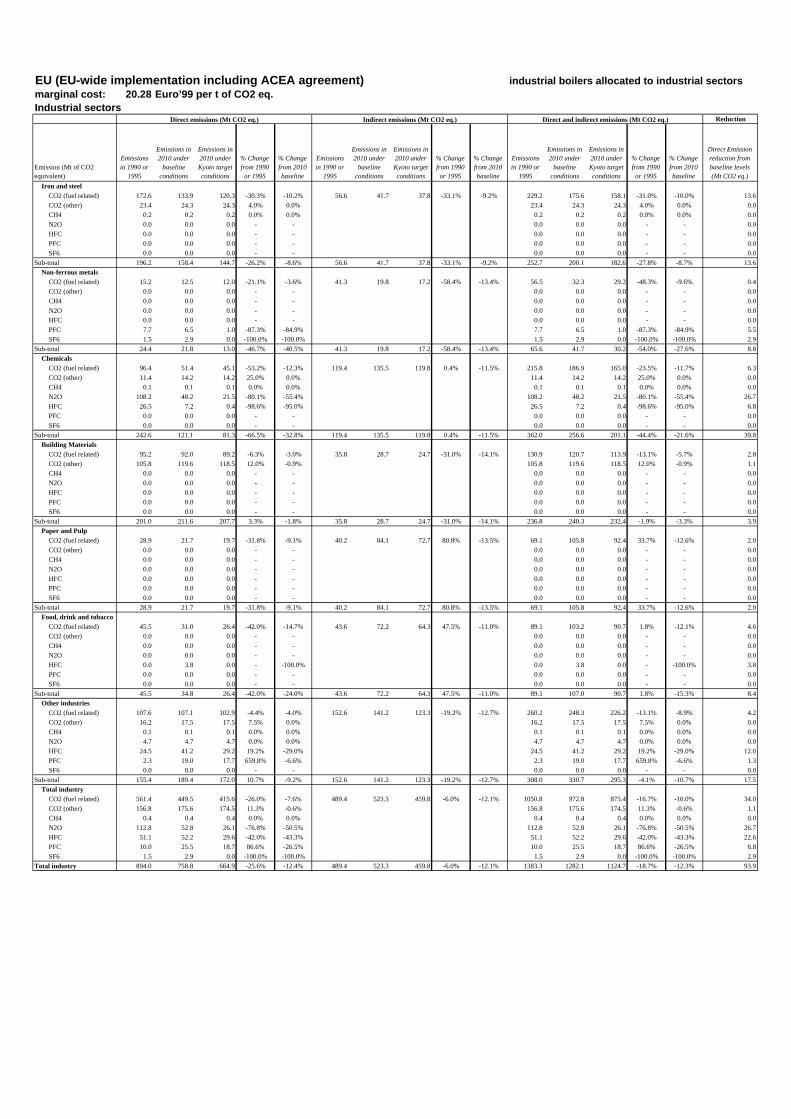
EU (EU-wide implementation including ACEA agreement) industrial boilers allocated to industrial sectorsmarginal cost: 20.28 Euro’99 per t of CO2 eq.Industrial sectors
Reduction
Emission (Mt of CO2 equivalent)
Emissions in 1990 or
1995
Emissions in 2010 under
baseline conditions
Emissions in 2010 under Kyoto target conditions
% Change from 1990
or 1995
% Change from 2010 baseline
Emissions in 1990 or
1995
Emissions in 2010 under
baseline conditions
Emissions in 2010 under Kyoto target conditions
% Change from 1990
or 1995
% Change from 2010 baseline
Emissions in 1990 or
1995
Emissions in 2010 under
baseline conditions
Emissions in 2010 under Kyoto target conditions
% Change from 1990
or 1995
% Change from 2010 baseline
Direct Emission reduction from baseline levels (Mt CO2 eq.)
Iron and steelCO2 (fuel related) 172.6 133.9 120.3 -30.3% -10.2% 56.6 41.7 37.8 -33.1% -9.2% 229.2 175.6 158.1 -31.0% -10.0% 13.6
CO2 (other) 23.4 24.3 24.3 4.0% 0.0% 23.4 24.3 24.3 4.0% 0.0% 0.0
CH4 0.2 0.2 0.2 0.0% 0.0% 0.2 0.2 0.2 0.0% 0.0% 0.0
N2O 0.0 0.0 0.0 - - 0.0 0.0 0.0 - - 0.0
HFC 0.0 0.0 0.0 - - 0.0 0.0 0.0 - - 0.0
PFC 0.0 0.0 0.0 - - 0.0 0.0 0.0 - - 0.0
SF6 0.0 0.0 0.0 - - 0.0 0.0 0.0 - - 0.0
Sub-total 196.2 158.4 144.7 -26.2% -8.6% 56.6 41.7 37.8 -33.1% -9.2% 252.7 200.1 182.6 -27.8% -8.7% 13.6
Non-ferrous metalsCO2 (fuel related) 15.2 12.5 12.0 -21.1% -3.6% 41.3 19.8 17.2 -58.4% -13.4% 56.5 32.3 29.2 -48.3% -9.6% 0.4
CO2 (other) 0.0 0.0 0.0 - - 0.0 0.0 0.0 - - 0.0
CH4 0.0 0.0 0.0 - - 0.0 0.0 0.0 - - 0.0
N2O 0.0 0.0 0.0 - - 0.0 0.0 0.0 - - 0.0
HFC 0.0 0.0 0.0 - - 0.0 0.0 0.0 - - 0.0
PFC 7.7 6.5 1.0 -87.3% -84.9% 7.7 6.5 1.0 -87.3% -84.9% 5.5
SF6 1.5 2.9 0.0 -100.0% -100.0% 1.5 2.9 0.0 -100.0% -100.0% 2.9
Sub-total 24.4 21.8 13.0 -46.7% -40.5% 41.3 19.8 17.2 -58.4% -13.4% 65.6 41.7 30.2 -54.0% -27.6% 8.8
ChemicalsCO2 (fuel related) 96.4 51.4 45.1 -53.2% -12.3% 119.4 135.5 119.8 0.4% -11.5% 215.8 186.9 165.0 -23.5% -11.7% 6.3
CO2 (other) 11.4 14.2 14.2 25.0% 0.0% 11.4 14.2 14.2 25.0% 0.0% 0.0
CH4 0.1 0.1 0.1 0.0% 0.0% 0.1 0.1 0.1 0.0% 0.0% 0.0
N2O 108.2 48.2 21.5 -80.1% -55.4% 108.2 48.2 21.5 -80.1% -55.4% 26.7
HFC 26.5 7.2 0.4 -98.6% -95.0% 26.5 7.2 0.4 -98.6% -95.0% 6.8
PFC 0.0 0.0 0.0 - - 0.0 0.0 0.0 - - 0.0
SF6 0.0 0.0 0.0 - - 0.0 0.0 0.0 - - 0.0
Sub-total 242.6 121.1 81.3 -66.5% -32.8% 119.4 135.5 119.8 0.4% -11.5% 362.0 256.6 201.1 -44.4% -21.6% 39.8
Building MaterialsCO2 (fuel related) 95.2 92.0 89.2 -6.3% -3.0% 35.8 28.7 24.7 -31.0% -14.1% 130.9 120.7 113.9 -13.1% -5.7% 2.8
CO2 (other) 105.8 119.6 118.5 12.0% -0.9% 105.8 119.6 118.5 12.0% -0.9% 1.1
CH4 0.0 0.0 0.0 - - 0.0 0.0 0.0 - - 0.0
N2O 0.0 0.0 0.0 - - 0.0 0.0 0.0 - - 0.0
HFC 0.0 0.0 0.0 - - 0.0 0.0 0.0 - - 0.0
PFC 0.0 0.0 0.0 - - 0.0 0.0 0.0 - - 0.0
SF6 0.0 0.0 0.0 - - 0.0 0.0 0.0 - - 0.0
Sub-total 201.0 211.6 207.7 3.3% -1.8% 35.8 28.7 24.7 -31.0% -14.1% 236.8 240.3 232.4 -1.9% -3.3% 3.9
Paper and PulpCO2 (fuel related) 28.9 21.7 19.7 -31.8% -9.1% 40.2 84.1 72.7 80.8% -13.5% 69.1 105.8 92.4 33.7% -12.6% 2.0
CO2 (other) 0.0 0.0 0.0 - - 0.0 0.0 0.0 - - 0.0
CH4 0.0 0.0 0.0 - - 0.0 0.0 0.0 - - 0.0
N2O 0.0 0.0 0.0 - - 0.0 0.0 0.0 - - 0.0
HFC 0.0 0.0 0.0 - - 0.0 0.0 0.0 - - 0.0
PFC 0.0 0.0 0.0 - - 0.0 0.0 0.0 - - 0.0
SF6 0.0 0.0 0.0 - - 0.0 0.0 0.0 - - 0.0
Sub-total 28.9 21.7 19.7 -31.8% -9.1% 40.2 84.1 72.7 80.8% -13.5% 69.1 105.8 92.4 33.7% -12.6% 2.0
Food, drink and tobaccoCO2 (fuel related) 45.5 31.0 26.4 -42.0% -14.7% 43.6 72.2 64.3 47.5% -11.0% 89.1 103.2 90.7 1.8% -12.1% 4.6
CO2 (other) 0.0 0.0 0.0 - - 0.0 0.0 0.0 - - 0.0
CH4 0.0 0.0 0.0 - - 0.0 0.0 0.0 - - 0.0
N2O 0.0 0.0 0.0 - - 0.0 0.0 0.0 - - 0.0
HFC 0.0 3.8 0.0 - -100.0% 0.0 3.8 0.0 - -100.0% 3.8
PFC 0.0 0.0 0.0 - - 0.0 0.0 0.0 - - 0.0
SF6 0.0 0.0 0.0 - - 0.0 0.0 0.0 - - 0.0
Sub-total 45.5 34.8 26.4 -42.0% -24.0% 43.6 72.2 64.3 47.5% -11.0% 89.1 107.0 90.7 1.8% -15.3% 8.4
Other industriesCO2 (fuel related) 107.6 107.1 102.9 -4.4% -4.0% 152.6 141.2 123.3 -19.2% -12.7% 260.2 248.3 226.2 -13.1% -8.9% 4.2
CO2 (other) 16.2 17.5 17.5 7.5% 0.0% 16.2 17.5 17.5 7.5% 0.0% 0.0
CH4 0.1 0.1 0.1 0.0% 0.0% 0.1 0.1 0.1 0.0% 0.0% 0.0
N2O 4.7 4.7 4.7 0.0% 0.0% 4.7 4.7 4.7 0.0% 0.0% 0.0
HFC 24.5 41.2 29.2 19.2% -29.0% 24.5 41.2 29.2 19.2% -29.0% 12.0
PFC 2.3 19.0 17.7 659.8% -6.6% 2.3 19.0 17.7 659.8% -6.6% 1.3
SF6 0.0 0.0 0.0 - - 0.0 0.0 0.0 - - 0.0
Sub-total 155.4 189.4 172.0 10.7% -9.2% 152.6 141.2 123.3 -19.2% -12.7% 308.0 330.7 295.3 -4.1% -10.7% 17.5
Total industryCO2 (fuel related) 561.4 449.5 415.6 -26.0% -7.6% 489.4 523.3 459.8 -6.0% -12.1% 1050.8 972.8 875.4 -16.7% -10.0% 34.0
CO2 (other) 156.8 175.6 174.5 11.3% -0.6% 156.8 175.6 174.5 11.3% -0.6% 1.1
CH4 0.4 0.4 0.4 0.0% 0.0% 0.4 0.4 0.4 0.0% 0.0% 0.0
N2O 112.8 52.8 26.1 -76.8% -50.5% 112.8 52.8 26.1 -76.8% -50.5% 26.7
HFC 51.1 52.2 29.6 -42.0% -43.3% 51.1 52.2 29.6 -42.0% -43.3% 22.6
PFC 10.0 25.5 18.7 86.6% -26.5% 10.0 25.5 18.7 86.6% -26.5% 6.8
SF6 1.5 2.9 0.0 -100.0% -100.0% 1.5 2.9 0.0 -100.0% -100.0% 2.9
Total industry 894.0 758.8 664.9 -25.6% -12.4% 489.4 523.3 459.8 -6.0% -12.1% 1383.3 1282.1 1124.7 -18.7% -12.3% 93.9
Direct emissions (Mt CO2 eq.) Indirect emissions (Mt CO2 eq.) Direct and indirect emissions (Mt CO2 eq.)

EU (EU-wide implementation including ACEA agreement) industrial boilers allocated to industrial sectorsmarginal cost: 20.28 Euro’99 per t of CO2 eq.Transport sector (CO2)
Reduction
Emission (Mt of CO2 equivalent)
Emissions in 1990 or
1995
Emissions in 2010 under
baseline conditions
Emissions in 2010 under Kyoto target conditions
% Change from 1990
or 1995
% Change from 2010 baseline
Emissions in 1990 or
1995
Emissions in 2010 under
baseline conditions
Emissions in 2010 under Kyoto target conditions
% Change from 1990
or 1995
% Change from 2010 baseline
Emissions in 1990 or
1995
Emissions in 2010 under
baseline conditions
Emissions in 2010 under Kyoto target conditions
% Change from 1990
or 1995
% Change from 2010 baseline
Direct Emission reduction from baseline levels (Mt CO2 eq.)
by transport meanroad 623.5 741.2 724.5 16.2% -2.3% 623.5 741.2 724.5 16.2% -2.3% 16.7
train 9.1 1.7 1.5 -83.1% -8.2% 25.4 34.3 29.4 15.8% -14.4% 34.5 36.0 30.9 -10.4% -14.1% 0.1
aviation 81.6 149.5 134.8 65.2% -9.8% 81.6 149.5 134.8 65.2% -9.8% 14.7
inl. navigation 20.6 26.5 26.0 26.3% -2.2% 20.6 26.5 26.0 26.3% -2.2% 0.6
by transport activity(base year: 1995)
passenger 545.2 608.8 588.9 8.0% -3.3% 545.2 608.8 588.9 8.0% -3.3% 19.9
freight 254.4 310.2 297.8 17.1% -4.0% 254.4 310.2 297.8 17.1% -4.0% 12.3
Sub-total 734.8 919.0 886.8 20.7% -3.5% 25.4 34.3 29.4 15.8% -14.4% 760.2 953.3 916.1 20.5% -3.9% 32.2
EU (EU-wide implementation including ACEA agreement) industrial boilers allocated to industrial sectorsmarginal cost: 20.28 Euro’99 per t of CO2 eq.Energy supply (CO2)
Reduction
Emission (Mt of CO2 equivalent)
Emissions in 1990 or
1995
Emissions in 2010 under
baseline conditions
Emissions in 2010 under Kyoto target conditions
% Change from 1990
or 1995
% Change from 2010 baseline
Emissions in 1990 or
1995
Emissions in 2010 under
baseline conditions
Emissions in 2010 under Kyoto target conditions
% Change from 1990
or 1995
% Change from 2010 baseline
Emissions in 1990 or
1995
Emissions in 2010 under
baseline conditions
Emissions in 2010 under Kyoto target conditions
% Change from 1990
or 1995
% Change from 2010 baseline
Direct Emission reduction from baseline levels (Mt CO2 eq.)
by generatorindustrial generators 123.7 250.5 203.2 64.3% -18.9% 47.3
other generators 0.0 27.7 25.7 - -7.2% 2.0
utilities 835.8 771.9 666.8 -20.2% -13.6% 105.0
boilers in 114.6 55.5 62.6 -45.4% 12.8% -7.1
industry 0.0 0.0 0.0 - - 0.0
refineries 73.8 42.4 50.7 -31.3% 19.4% -8.3
district heating 40.8 13.0 11.9 -70.9% -8.8% 1.2
fuel extraction and refining 57.5 55.1 52.8 -8.2% -4.3% 2.4
Sub-total 1131.5 1160.7 1011.1 -10.6% -12.9% 149.7
Direct emissions (Mt CO2 eq.) Indirect emissions (Mt CO2 eq.) Direct and indirect emissions (Mt CO2 eq.)
Direct emissions (Mt CO2 eq.) Indirect emissions (Mt CO2 eq.) Direct and indirect emissions (Mt CO2 eq.)
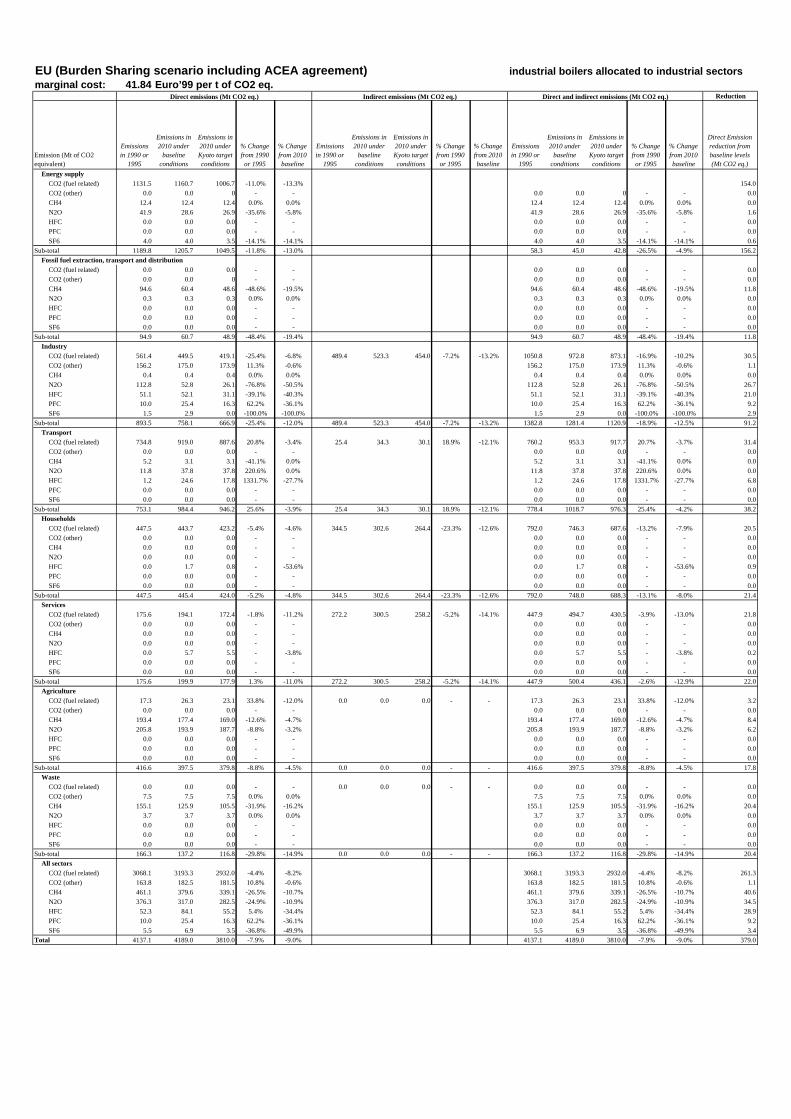
industrial boilers allocated to industrial sectorsmarginal cost: 41.84 Euro’99 per t of CO2 eq.
Reduction
Emission (Mt of CO2 equivalent)
Emissions in 1990 or
1995
Emissions in 2010 under
baseline conditions
Emissions in 2010 under Kyoto target conditions
% Change from 1990
or 1995
% Change from 2010 baseline
Emissions in 1990 or
1995
Emissions in 2010 under
baseline conditions
Emissions in 2010 under Kyoto target conditions
% Change from 1990
or 1995
% Change from 2010 baseline
Emissions in 1990 or
1995
Emissions in 2010 under
baseline conditions
Emissions in 2010 under Kyoto target conditions
% Change from 1990
or 1995
% Change from 2010 baseline
Direct Emission reduction from baseline levels (Mt CO2 eq.)
Energy supplyCO2 (fuel related) 1131.5 1160.7 1006.7 -11.0% -13.3% 154.0
CO2 (other) 0.0 0.0 0 - - 0.0 0.0 0 - - 0.0
CH4 12.4 12.4 12.4 0.0% 0.0% 12.4 12.4 12.4 0.0% 0.0% 0.0
N2O 41.9 28.6 26.9 -35.6% -5.8% 41.9 28.6 26.9 -35.6% -5.8% 1.6
HFC 0.0 0.0 0.0 - - 0.0 0.0 0.0 - - 0.0
PFC 0.0 0.0 0.0 - - 0.0 0.0 0.0 - - 0.0
SF6 4.0 4.0 3.5 -14.1% -14.1% 4.0 4.0 3.5 -14.1% -14.1% 0.6
Sub-total 1189.8 1205.7 1049.5 -11.8% -13.0% 58.3 45.0 42.8 -26.5% -4.9% 156.2
Fossil fuel extraction, transport and distributionCO2 (fuel related) 0.0 0.0 0.0 - - 0.0 0.0 0.0 - - 0.0
CO2 (other) 0.0 0.0 0 - - 0.0 0.0 0.0 - - 0.0
CH4 94.6 60.4 48.6 -48.6% -19.5% 94.6 60.4 48.6 -48.6% -19.5% 11.8
N2O 0.3 0.3 0.3 0.0% 0.0% 0.3 0.3 0.3 0.0% 0.0% 0.0
HFC 0.0 0.0 0.0 - - 0.0 0.0 0.0 - - 0.0
PFC 0.0 0.0 0.0 - - 0.0 0.0 0.0 - - 0.0
SF6 0.0 0.0 0.0 - - 0.0 0.0 0.0 - - 0.0
Sub-total 94.9 60.7 48.9 -48.4% -19.4% 94.9 60.7 48.9 -48.4% -19.4% 11.8
IndustryCO2 (fuel related) 561.4 449.5 419.1 -25.4% -6.8% 489.4 523.3 454.0 -7.2% -13.2% 1050.8 972.8 873.1 -16.9% -10.2% 30.5
CO2 (other) 156.2 175.0 173.9 11.3% -0.6% 156.2 175.0 173.9 11.3% -0.6% 1.1
CH4 0.4 0.4 0.4 0.0% 0.0% 0.4 0.4 0.4 0.0% 0.0% 0.0
N2O 112.8 52.8 26.1 -76.8% -50.5% 112.8 52.8 26.1 -76.8% -50.5% 26.7
HFC 51.1 52.1 31.1 -39.1% -40.3% 51.1 52.1 31.1 -39.1% -40.3% 21.0
PFC 10.0 25.4 16.3 62.2% -36.1% 10.0 25.4 16.3 62.2% -36.1% 9.2
SF6 1.5 2.9 0.0 -100.0% -100.0% 1.5 2.9 0.0 -100.0% -100.0% 2.9
Sub-total 893.5 758.1 666.9 -25.4% -12.0% 489.4 523.3 454.0 -7.2% -13.2% 1382.8 1281.4 1120.9 -18.9% -12.5% 91.2
TransportCO2 (fuel related) 734.8 919.0 887.6 20.8% -3.4% 25.4 34.3 30.1 18.9% -12.1% 760.2 953.3 917.7 20.7% -3.7% 31.4
CO2 (other) 0.0 0.0 0.0 - - 0.0 0.0 0.0 - - 0.0
CH4 5.2 3.1 3.1 -41.1% 0.0% 5.2 3.1 3.1 -41.1% 0.0% 0.0
N2O 11.8 37.8 37.8 220.6% 0.0% 11.8 37.8 37.8 220.6% 0.0% 0.0
HFC 1.2 24.6 17.8 1331.7% -27.7% 1.2 24.6 17.8 1331.7% -27.7% 6.8
PFC 0.0 0.0 0.0 - - 0.0 0.0 0.0 - - 0.0
SF6 0.0 0.0 0.0 - - 0.0 0.0 0.0 - - 0.0
Sub-total 753.1 984.4 946.2 25.6% -3.9% 25.4 34.3 30.1 18.9% -12.1% 778.4 1018.7 976.3 25.4% -4.2% 38.2
HouseholdsCO2 (fuel related) 447.5 443.7 423.2 -5.4% -4.6% 344.5 302.6 264.4 -23.3% -12.6% 792.0 746.3 687.6 -13.2% -7.9% 20.5
CO2 (other) 0.0 0.0 0.0 - - 0.0 0.0 0.0 - - 0.0
CH4 0.0 0.0 0.0 - - 0.0 0.0 0.0 - - 0.0
N2O 0.0 0.0 0.0 - - 0.0 0.0 0.0 - - 0.0
HFC 0.0 1.7 0.8 - -53.6% 0.0 1.7 0.8 - -53.6% 0.9
PFC 0.0 0.0 0.0 - - 0.0 0.0 0.0 - - 0.0
SF6 0.0 0.0 0.0 - - 0.0 0.0 0.0 - - 0.0
Sub-total 447.5 445.4 424.0 -5.2% -4.8% 344.5 302.6 264.4 -23.3% -12.6% 792.0 748.0 688.3 -13.1% -8.0% 21.4
ServicesCO2 (fuel related) 175.6 194.1 172.4 -1.8% -11.2% 272.2 300.5 258.2 -5.2% -14.1% 447.9 494.7 430.5 -3.9% -13.0% 21.8
CO2 (other) 0.0 0.0 0.0 - - 0.0 0.0 0.0 - - 0.0
CH4 0.0 0.0 0.0 - - 0.0 0.0 0.0 - - 0.0
N2O 0.0 0.0 0.0 - - 0.0 0.0 0.0 - - 0.0
HFC 0.0 5.7 5.5 - -3.8% 0.0 5.7 5.5 - -3.8% 0.2
PFC 0.0 0.0 0.0 - - 0.0 0.0 0.0 - - 0.0
SF6 0.0 0.0 0.0 - - 0.0 0.0 0.0 - - 0.0
Sub-total 175.6 199.9 177.9 1.3% -11.0% 272.2 300.5 258.2 -5.2% -14.1% 447.9 500.4 436.1 -2.6% -12.9% 22.0
AgricultureCO2 (fuel related) 17.3 26.3 23.1 33.8% -12.0% 0.0 0.0 0.0 - - 17.3 26.3 23.1 33.8% -12.0% 3.2
CO2 (other) 0.0 0.0 0.0 - - 0.0 0.0 0.0 - - 0.0
CH4 193.4 177.4 169.0 -12.6% -4.7% 193.4 177.4 169.0 -12.6% -4.7% 8.4
N2O 205.8 193.9 187.7 -8.8% -3.2% 205.8 193.9 187.7 -8.8% -3.2% 6.2
HFC 0.0 0.0 0.0 - - 0.0 0.0 0.0 - - 0.0
PFC 0.0 0.0 0.0 - - 0.0 0.0 0.0 - - 0.0
SF6 0.0 0.0 0.0 - - 0.0 0.0 0.0 - - 0.0
Sub-total 416.6 397.5 379.8 -8.8% -4.5% 0.0 0.0 0.0 - - 416.6 397.5 379.8 -8.8% -4.5% 17.8
WasteCO2 (fuel related) 0.0 0.0 0.0 - - 0.0 0.0 0.0 - - 0.0 0.0 0.0 - - 0.0
CO2 (other) 7.5 7.5 7.5 0.0% 0.0% 7.5 7.5 7.5 0.0% 0.0% 0.0
CH4 155.1 125.9 105.5 -31.9% -16.2% 155.1 125.9 105.5 -31.9% -16.2% 20.4
N2O 3.7 3.7 3.7 0.0% 0.0% 3.7 3.7 3.7 0.0% 0.0% 0.0
HFC 0.0 0.0 0.0 - - 0.0 0.0 0.0 - - 0.0
PFC 0.0 0.0 0.0 - - 0.0 0.0 0.0 - - 0.0
SF6 0.0 0.0 0.0 - - 0.0 0.0 0.0 - - 0.0
Sub-total 166.3 137.2 116.8 -29.8% -14.9% 0.0 0.0 0.0 - - 166.3 137.2 116.8 -29.8% -14.9% 20.4
All sectorsCO2 (fuel related) 3068.1 3193.3 2932.0 -4.4% -8.2% 3068.1 3193.3 2932.0 -4.4% -8.2% 261.3
CO2 (other) 163.8 182.5 181.5 10.8% -0.6% 163.8 182.5 181.5 10.8% -0.6% 1.1
CH4 461.1 379.6 339.1 -26.5% -10.7% 461.1 379.6 339.1 -26.5% -10.7% 40.6
N2O 376.3 317.0 282.5 -24.9% -10.9% 376.3 317.0 282.5 -24.9% -10.9% 34.5
HFC 52.3 84.1 55.2 5.4% -34.4% 52.3 84.1 55.2 5.4% -34.4% 28.9
PFC 10.0 25.4 16.3 62.2% -36.1% 10.0 25.4 16.3 62.2% -36.1% 9.2
SF6 5.5 6.9 3.5 -36.8% -49.9% 5.5 6.9 3.5 -36.8% -49.9% 3.4
Total 4137.1 4189.0 3810.0 -7.9% -9.0% 4137.1 4189.0 3810.0 -7.9% -9.0% 379.0
EU (Burden Sharing scenario including ACEA agreement)
Direct emissions (Mt CO2 eq.) Indirect emissions (Mt CO2 eq.) Direct and indirect emissions (Mt CO2 eq.)

EU (Burden Sharing scenario including ACEA agreement) industrial boilers allocated to industrial sectorsmarginal cost: 41.84 Euro’99 per t of CO2 eq.Industrial sectors
Reduction
Emission (Mt of CO2 equivalent)
Emissions in 1990 or
1995
Emissions in 2010 under
baseline conditions
Emissions in 2010 under Kyoto target conditions
% Change from 1990
or 1995
% Change from 2010 baseline
Emissions in 1990 or
1995
Emissions in 2010 under
baseline conditions
Emissions in 2010 under Kyoto target conditions
% Change from 1990
or 1995
% Change from 2010 baseline
Emissions in 1990 or
1995
Emissions in 2010 under
baseline conditions
Emissions in 2010 under Kyoto target conditions
% Change from 1990
or 1995
% Change from 2010 baseline
Direct Emission reduction from baseline levels (Mt CO2 eq.)
Iron and steelCO2 (fuel related) 172.6 133.9 120.7 -30.1% -9.9% 56.6 41.7 37.6 -33.5% -9.7% 229.2 175.6 158.3 -30.9% -9.9% 13.3
CO2 (other) 23.4 24.3 24.3 4.0% 0.0% 23.4 24.3 24.3 4.0% 0.0% 0.0
CH4 0.2 0.2 0.2 0.0% 0.0% 0.2 0.2 0.2 0.0% 0.0% 0.0
N2O 0.0 0.0 0.0 - - 0.0 0.0 0.0 - - 0.0
HFC 0.0 0.0 0.0 - - 0.0 0.0 0.0 - - 0.0
PFC 0.0 0.0 0.0 - - 0.0 0.0 0.0 - - 0.0
SF6 0.0 0.0 0.0 - - 0.0 0.0 0.0 - - 0.0
Sub-total 196.2 158.4 145.1 -26.0% -8.4% 56.6 41.7 37.6 -33.5% -9.7% 252.7 200.1 182.7 -27.7% -8.7% 13.3
Non-ferrous metalsCO2 (fuel related) 15.2 12.5 12.1 -20.6% -3.0% 41.3 19.8 17.6 -57.3% -11.2% 56.5 32.3 29.7 -47.4% -8.0% 0.4
CO2 (other) 0.0 0.0 0.0 - - 0.0 0.0 0.0 - - 0.0
CH4 0.0 0.0 0.0 - - 0.0 0.0 0.0 - - 0.0
N2O 0.0 0.0 0.0 - - 0.0 0.0 0.0 - - 0.0
HFC 0.0 0.0 0.0 - - 0.0 0.0 0.0 - - 0.0
PFC 7.7 6.5 1.0 -87.3% -84.9% 7.7 6.5 1.0 -87.3% -84.9% 5.5
SF6 1.5 2.9 0.0 -100.0% -100.0% 1.5 2.9 0.0 -100.0% -100.0% 2.9
Sub-total 24.4 21.8 13.1 -46.4% -40.1% 41.3 19.8 17.6 -57.3% -11.2% 65.6 41.7 30.7 -53.3% -26.4% 8.8
ChemicalsCO2 (fuel related) 96.4 51.4 45.6 -52.7% -11.4% 119.4 135.5 118.1 -1.0% -12.8% 215.8 186.9 163.7 -24.1% -12.4% 5.9
CO2 (other) 11.4 14.2 14.2 25.0% 0.0% 11.4 14.2 14.2 25.0% 0.0% 0.0
CH4 0.1 0.1 0.1 0.0% 0.0% 0.1 0.1 0.1 0.0% 0.0% 0.0
N2O 108.2 48.2 21.5 -80.1% -55.4% 108.2 48.2 21.5 -80.1% -55.4% 26.7
HFC 26.5 7.2 0.4 -98.6% -95.0% 26.5 7.2 0.4 -98.6% -95.0% 6.8
PFC 0.0 0.0 0.0 - - 0.0 0.0 0.0 - - 0.0
SF6 0.0 0.0 0.0 - - 0.0 0.0 0.0 - - 0.0
Sub-total 242.6 121.1 81.8 -66.3% -32.5% 119.4 135.5 118.1 -1.0% -12.8% 362.0 256.6 199.9 -44.8% -22.1% 39.3
Building MaterialsCO2 (fuel related) 95.2 92.0 89.2 -6.3% -3.1% 35.8 28.7 25.1 -30.0% -12.8% 130.9 120.7 114.2 -12.8% -5.4% 2.8
CO2 (other) 105.8 119.6 118.5 12.0% -0.9% 105.8 119.6 118.5 12.0% -0.9% 1.1
CH4 0.0 0.0 0.0 - - 0.0 0.0 0.0 - - 0.0
N2O 0.0 0.0 0.0 - - 0.0 0.0 0.0 - - 0.0
HFC 0.0 0.0 0.0 - - 0.0 0.0 0.0 - - 0.0
PFC 0.0 0.0 0.0 - - 0.0 0.0 0.0 - - 0.0
SF6 0.0 0.0 0.0 - - 0.0 0.0 0.0 - - 0.0
Sub-total 201.0 211.6 207.7 3.3% -1.8% 35.8 28.7 25.1 -30.0% -12.8% 236.8 240.3 232.8 -1.7% -3.1% 3.9
Paper and PulpCO2 (fuel related) 28.9 21.7 19.7 -31.8% -9.0% 40.2 84.1 69.2 71.9% -17.8% 69.1 105.8 88.9 28.6% -16.0% 2.0
CO2 (other) 0.0 0.0 0.0 - - 0.0 0.0 0.0 - - 0.0
CH4 0.0 0.0 0.0 - - 0.0 0.0 0.0 - - 0.0
N2O 0.0 0.0 0.0 - - 0.0 0.0 0.0 - - 0.0
HFC 0.0 0.0 0.0 - - 0.0 0.0 0.0 - - 0.0
PFC 0.0 0.0 0.0 - - 0.0 0.0 0.0 - - 0.0
SF6 0.0 0.0 0.0 - - 0.0 0.0 0.0 - - 0.0
Sub-total 28.9 21.7 19.7 -31.8% -9.0% 40.2 84.1 69.2 71.9% -17.8% 69.1 105.8 88.9 28.6% -16.0% 2.0
Food, drink and tobaccoCO2 (fuel related) 45.5 31.0 28.1 -38.3% -9.4% 43.6 72.2 63.2 45.1% -12.5% 89.1 103.2 91.3 2.5% -11.6% 2.9
CO2 (other) 0.0 0.0 0.0 - - 0.0 0.0 0.0 - - 0.0
CH4 0.0 0.0 0.0 - - 0.0 0.0 0.0 - - 0.0
N2O 0.0 0.0 0.0 - - 0.0 0.0 0.0 - - 0.0
HFC 0.0 3.8 0.4 - -88.5% 0.0 3.8 0.4 - -88.5% 3.4
PFC 0.0 0.0 0.0 - - 0.0 0.0 0.0 - - 0.0
SF6 0.0 0.0 0.0 - - 0.0 0.0 0.0 - - 0.0
Sub-total 45.5 34.7 28.5 -37.4% -18.0% 43.6 72.2 63.2 45.1% -12.5% 89.1 107.0 91.7 3.0% -14.3% 6.3
Other industriesCO2 (fuel related) 107.6 107.1 103.8 -3.5% -3.1% 152.6 141.2 123.2 -19.2% -12.8% 260.2 248.3 227.0 -12.7% -8.6% 3.3
CO2 (other) 15.7 16.9 16.9 7.8% 0.0% 15.7 16.9 16.9 7.8% 0.0% 0.0
CH4 0.1 0.1 0.1 0.0% 0.0% 0.1 0.1 0.1 0.0% 0.0% 0.0
N2O 4.7 4.7 4.7 0.0% 0.0% 4.7 4.7 4.7 0.0% 0.0% 0.0
HFC 24.5 41.1 30.3 23.5% -26.3% 24.5 41.1 30.3 23.5% -26.3% 10.8
PFC 2.3 18.9 15.3 556.2% -19.4% 2.3 18.9 15.3 556.2% -19.4% 3.7
SF6 0.0 0.0 0.0 - - 0.0 0.0 0.0 - - 0.0
Sub-total 154.8 188.7 170.9 10.4% -9.4% 152.6 141.2 123.2 -19.2% -12.8% 307.4 330.0 294.2 -4.3% -10.9% 17.8
Total industryCO2 (fuel related) 561.4 449.5 419.1 -25.4% -6.8% 489.4 523.3 454.0 -7.2% -13.2% 1050.8 972.8 873.1 -16.9% -10.2% 30.5
CO2 (other) 156.2 175.0 173.9 11.3% -0.6% 156.2 175.0 173.9 11.3% -0.6% 1.1
CH4 0.4 0.4 0.4 0.0% 0.0% 0.4 0.4 0.4 0.0% 0.0% 0.0
N2O 112.8 52.8 26.1 -76.8% -50.5% 112.8 52.8 26.1 -76.8% -50.5% 26.7
HFC 51.1 52.1 31.1 -39.1% -40.3% 51.1 52.1 31.1 -39.1% -40.3% 21.0
PFC 10.0 25.4 16.3 62.2% -36.1% 10.0 25.4 16.3 62.2% -36.1% 9.2
SF6 1.5 2.9 0.0 -100.0% -100.0% 1.5 2.9 0.0 -100.0% -100.0% 2.9
Total industry 893.4 758.0 666.8 -25.4% -12.0% 489.4 523.3 454.0 -7.2% -13.2% 1382.8 1281.3 1120.9 -18.9% -12.5% 91.2
Direct emissions (Mt CO2 eq.) Indirect emissions (Mt CO2 eq.) Direct and indirect emissions (Mt CO2 eq.)

EU (Burden Sharing scenario including ACEA agreement) industrial boilers allocated to industrial sectorsmarginal cost: 41.84 Euro’99 per t of CO2 eq.Transport sector (CO2)
Reduction
Emission (Mt of CO2 equivalent)
Emissions in 1990 or
1995
Emissions in 2010 under
baseline conditions
Emissions in 2010 under Kyoto target conditions
% Change from 1990
or 1995
% Change from 2010 baseline
Emissions in 1990 or
1995
Emissions in 2010 under
baseline conditions
Emissions in 2010 under Kyoto target conditions
% Change from 1990
or 1995
% Change from 2010 baseline
Emissions in 1990 or
1995
Emissions in 2010 under
baseline conditions
Emissions in 2010 under Kyoto target conditions
% Change from 1990
or 1995
% Change from 2010 baseline
Direct Emission reduction from baseline levels (Mt CO2 eq.)
by transport meanroad 623.5 741.2 726.8 16.6% -1.9% 623.5 741.2 726.8 16.6% -1.9% 14.4
train 9.1 1.7 1.6 -82.8% -6.7% 25.4 34.3 30.1 18.9% -12.1% 34.5 36.0 31.7 -8.1% -11.9% 0.1
aviation 81.6 149.5 133.2 63.3% -10.9% 81.6 149.5 133.2 63.3% -10.9% 16.3
inl. navigation 20.6 26.5 26.0 26.4% -2.1% 20.6 26.5 26.0 26.4% -2.1% 0.6
by transport activity(base year: 1995)
passenger 545.2 608.8 588.4 7.9% -3.4% 545.2 608.8 588.4 7.9% -3.4% 20.4
freight 254.4 310.2 299.2 17.6% -3.5% 254.4 310.2 299.2 17.6% -3.5% 11.0
Sub-total 734.8 919.0 887.6 20.8% -3.4% 25.4 34.3 30.1 18.9% -12.1% 760.2 953.3 917.7 20.7% -3.7% 31.4
EU (Burden Sharing scenario including ACEA agreement) industrial boilers allocated to industrial sectorsmarginal cost: 41.84 Euro’99 per t of CO2 eq.Energy supply (CO2)
Reduction
Emission (Mt of CO2 equivalent)
Emissions in 1990 or
1995
Emissions in 2010 under
baseline conditions
Emissions in 2010 under Kyoto target conditions
% Change from 1990
or 1995
% Change from 2010 baseline
Emissions in 1990 or
1995
Emissions in 2010 under
baseline conditions
Emissions in 2010 under Kyoto target conditions
% Change from 1990
or 1995
% Change from 2010 baseline
Emissions in 1990 or
1995
Emissions in 2010 under
baseline conditions
Emissions in 2010 under Kyoto target conditions
% Change from 1990
or 1995
% Change from 2010 baseline
Direct Emission reduction from baseline levels (Mt CO2 eq.)
by generatorindustrial generators 123.7 250.5 196.7 59.1% -21.5% 53.8
other generators 0.0 27.7 24.6 - -11.3% 3.1
utilities 835.8 771.9 671.3 -19.7% -13.0% 100.6
boilers in 114.6 55.5 60.8 -46.9% 9.7% -5.4
industry 0.0 0.0 0.0 - - 0.0
refineries 73.8 42.4 49.5 -32.9% 16.7% -7.1
district heating 40.8 13.0 11.4 -72.2% -12.9% 1.7
fuel extraction and refining 57.5 55.1 53.2 -7.4% -3.5% 1.9
Sub-total 1131.5 1160.7 1006.7 -11.0% -13.3% 154.0
Direct emissions (Mt CO2 eq.) Indirect emissions (Mt CO2 eq.) Direct and indirect emissions (Mt CO2 eq.)
Direct emissions (Mt CO2 eq.) Indirect emissions (Mt CO2 eq.) Direct and indirect emissions (Mt CO2 eq.)
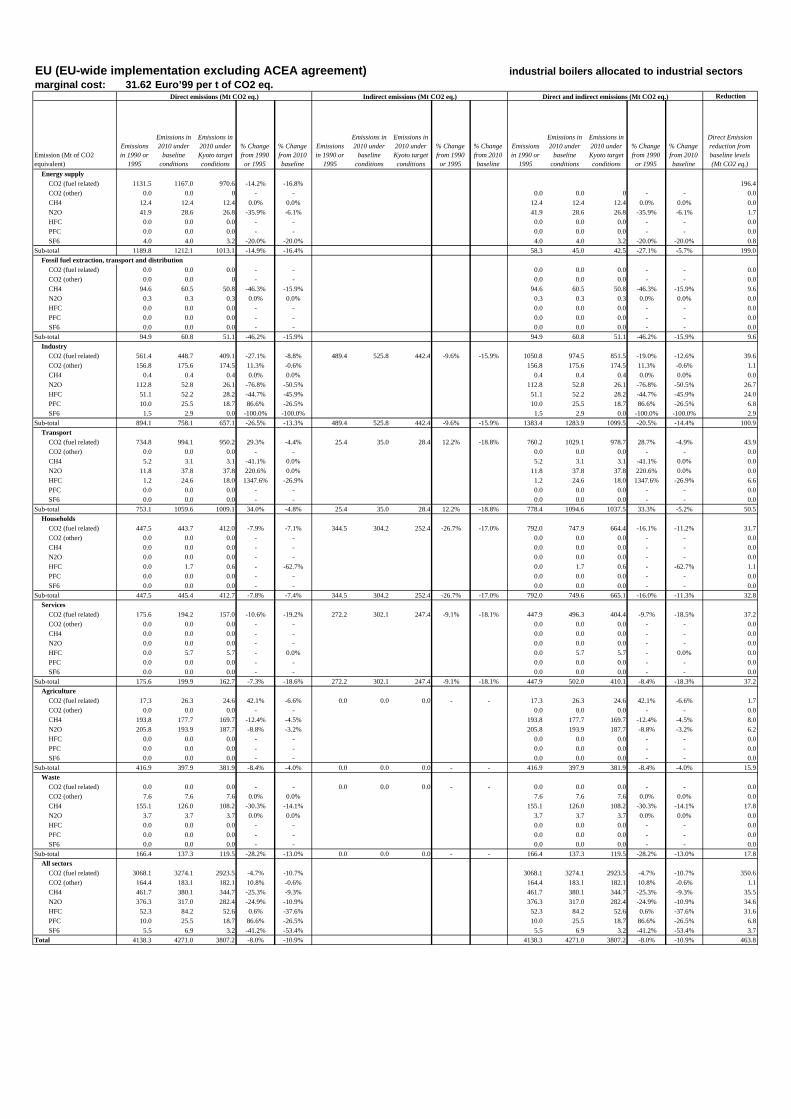
industrial boilers allocated to industrial sectorsmarginal cost: 31.62 Euro’99 per t of CO2 eq.
Reduction
Emission (Mt of CO2 equivalent)
Emissions in 1990 or
1995
Emissions in 2010 under
baseline conditions
Emissions in 2010 under Kyoto target conditions
% Change from 1990
or 1995
% Change from 2010 baseline
Emissions in 1990 or
1995
Emissions in 2010 under
baseline conditions
Emissions in 2010 under Kyoto target conditions
% Change from 1990
or 1995
% Change from 2010 baseline
Emissions in 1990 or
1995
Emissions in 2010 under
baseline conditions
Emissions in 2010 under Kyoto target conditions
% Change from 1990
or 1995
% Change from 2010 baseline
Direct Emission reduction from baseline levels (Mt CO2 eq.)
Energy supplyCO2 (fuel related) 1131.5 1167.0 970.6 -14.2% -16.8% 196.4
CO2 (other) 0.0 0.0 0 - - 0.0 0.0 0 - - 0.0
CH4 12.4 12.4 12.4 0.0% 0.0% 12.4 12.4 12.4 0.0% 0.0% 0.0
N2O 41.9 28.6 26.8 -35.9% -6.1% 41.9 28.6 26.8 -35.9% -6.1% 1.7
HFC 0.0 0.0 0.0 - - 0.0 0.0 0.0 - - 0.0
PFC 0.0 0.0 0.0 - - 0.0 0.0 0.0 - - 0.0
SF6 4.0 4.0 3.2 -20.0% -20.0% 4.0 4.0 3.2 -20.0% -20.0% 0.8
Sub-total 1189.8 1212.1 1013.1 -14.9% -16.4% 58.3 45.0 42.5 -27.1% -5.7% 199.0
Fossil fuel extraction, transport and distributionCO2 (fuel related) 0.0 0.0 0.0 - - 0.0 0.0 0.0 - - 0.0
CO2 (other) 0.0 0.0 0 - - 0.0 0.0 0.0 - - 0.0
CH4 94.6 60.5 50.8 -46.3% -15.9% 94.6 60.5 50.8 -46.3% -15.9% 9.6
N2O 0.3 0.3 0.3 0.0% 0.0% 0.3 0.3 0.3 0.0% 0.0% 0.0
HFC 0.0 0.0 0.0 - - 0.0 0.0 0.0 - - 0.0
PFC 0.0 0.0 0.0 - - 0.0 0.0 0.0 - - 0.0
SF6 0.0 0.0 0.0 - - 0.0 0.0 0.0 - - 0.0
Sub-total 94.9 60.8 51.1 -46.2% -15.9% 94.9 60.8 51.1 -46.2% -15.9% 9.6
IndustryCO2 (fuel related) 561.4 448.7 409.1 -27.1% -8.8% 489.4 525.8 442.4 -9.6% -15.9% 1050.8 974.5 851.5 -19.0% -12.6% 39.6
CO2 (other) 156.8 175.6 174.5 11.3% -0.6% 156.8 175.6 174.5 11.3% -0.6% 1.1
CH4 0.4 0.4 0.4 0.0% 0.0% 0.4 0.4 0.4 0.0% 0.0% 0.0
N2O 112.8 52.8 26.1 -76.8% -50.5% 112.8 52.8 26.1 -76.8% -50.5% 26.7
HFC 51.1 52.2 28.2 -44.7% -45.9% 51.1 52.2 28.2 -44.7% -45.9% 24.0
PFC 10.0 25.5 18.7 86.6% -26.5% 10.0 25.5 18.7 86.6% -26.5% 6.8
SF6 1.5 2.9 0.0 -100.0% -100.0% 1.5 2.9 0.0 -100.0% -100.0% 2.9
Sub-total 894.1 758.1 657.1 -26.5% -13.3% 489.4 525.8 442.4 -9.6% -15.9% 1383.4 1283.9 1099.5 -20.5% -14.4% 100.9
TransportCO2 (fuel related) 734.8 994.1 950.2 29.3% -4.4% 25.4 35.0 28.4 12.2% -18.8% 760.2 1029.1 978.7 28.7% -4.9% 43.9
CO2 (other) 0.0 0.0 0.0 - - 0.0 0.0 0.0 - - 0.0
CH4 5.2 3.1 3.1 -41.1% 0.0% 5.2 3.1 3.1 -41.1% 0.0% 0.0
N2O 11.8 37.8 37.8 220.6% 0.0% 11.8 37.8 37.8 220.6% 0.0% 0.0
HFC 1.2 24.6 18.0 1347.6% -26.9% 1.2 24.6 18.0 1347.6% -26.9% 6.6
PFC 0.0 0.0 0.0 - - 0.0 0.0 0.0 - - 0.0
SF6 0.0 0.0 0.0 - - 0.0 0.0 0.0 - - 0.0
Sub-total 753.1 1059.6 1009.1 34.0% -4.8% 25.4 35.0 28.4 12.2% -18.8% 778.4 1094.6 1037.5 33.3% -5.2% 50.5
HouseholdsCO2 (fuel related) 447.5 443.7 412.0 -7.9% -7.1% 344.5 304.2 252.4 -26.7% -17.0% 792.0 747.9 664.4 -16.1% -11.2% 31.7
CO2 (other) 0.0 0.0 0.0 - - 0.0 0.0 0.0 - - 0.0
CH4 0.0 0.0 0.0 - - 0.0 0.0 0.0 - - 0.0
N2O 0.0 0.0 0.0 - - 0.0 0.0 0.0 - - 0.0
HFC 0.0 1.7 0.6 - -62.7% 0.0 1.7 0.6 - -62.7% 1.1
PFC 0.0 0.0 0.0 - - 0.0 0.0 0.0 - - 0.0
SF6 0.0 0.0 0.0 - - 0.0 0.0 0.0 - - 0.0
Sub-total 447.5 445.4 412.7 -7.8% -7.4% 344.5 304.2 252.4 -26.7% -17.0% 792.0 749.6 665.1 -16.0% -11.3% 32.8
ServicesCO2 (fuel related) 175.6 194.2 157.0 -10.6% -19.2% 272.2 302.1 247.4 -9.1% -18.1% 447.9 496.3 404.4 -9.7% -18.5% 37.2
CO2 (other) 0.0 0.0 0.0 - - 0.0 0.0 0.0 - - 0.0
CH4 0.0 0.0 0.0 - - 0.0 0.0 0.0 - - 0.0
N2O 0.0 0.0 0.0 - - 0.0 0.0 0.0 - - 0.0
HFC 0.0 5.7 5.7 - 0.0% 0.0 5.7 5.7 - 0.0% 0.0
PFC 0.0 0.0 0.0 - - 0.0 0.0 0.0 - - 0.0
SF6 0.0 0.0 0.0 - - 0.0 0.0 0.0 - - 0.0
Sub-total 175.6 199.9 162.7 -7.3% -18.6% 272.2 302.1 247.4 -9.1% -18.1% 447.9 502.0 410.1 -8.4% -18.3% 37.2
AgricultureCO2 (fuel related) 17.3 26.3 24.6 42.1% -6.6% 0.0 0.0 0.0 - - 17.3 26.3 24.6 42.1% -6.6% 1.7
CO2 (other) 0.0 0.0 0.0 - - 0.0 0.0 0.0 - - 0.0
CH4 193.8 177.7 169.7 -12.4% -4.5% 193.8 177.7 169.7 -12.4% -4.5% 8.0
N2O 205.8 193.9 187.7 -8.8% -3.2% 205.8 193.9 187.7 -8.8% -3.2% 6.2
HFC 0.0 0.0 0.0 - - 0.0 0.0 0.0 - - 0.0
PFC 0.0 0.0 0.0 - - 0.0 0.0 0.0 - - 0.0
SF6 0.0 0.0 0.0 - - 0.0 0.0 0.0 - - 0.0
Sub-total 416.9 397.9 381.9 -8.4% -4.0% 0.0 0.0 0.0 - - 416.9 397.9 381.9 -8.4% -4.0% 15.9
WasteCO2 (fuel related) 0.0 0.0 0.0 - - 0.0 0.0 0.0 - - 0.0 0.0 0.0 - - 0.0
CO2 (other) 7.6 7.6 7.6 0.0% 0.0% 7.6 7.6 7.6 0.0% 0.0% 0.0
CH4 155.1 126.0 108.2 -30.3% -14.1% 155.1 126.0 108.2 -30.3% -14.1% 17.8
N2O 3.7 3.7 3.7 0.0% 0.0% 3.7 3.7 3.7 0.0% 0.0% 0.0
HFC 0.0 0.0 0.0 - - 0.0 0.0 0.0 - - 0.0
PFC 0.0 0.0 0.0 - - 0.0 0.0 0.0 - - 0.0
SF6 0.0 0.0 0.0 - - 0.0 0.0 0.0 - - 0.0
Sub-total 166.4 137.3 119.5 -28.2% -13.0% 0.0 0.0 0.0 - - 166.4 137.3 119.5 -28.2% -13.0% 17.8
All sectorsCO2 (fuel related) 3068.1 3274.1 2923.5 -4.7% -10.7% 3068.1 3274.1 2923.5 -4.7% -10.7% 350.6
CO2 (other) 164.4 183.1 182.1 10.8% -0.6% 164.4 183.1 182.1 10.8% -0.6% 1.1
CH4 461.7 380.1 344.7 -25.3% -9.3% 461.7 380.1 344.7 -25.3% -9.3% 35.5
N2O 376.3 317.0 282.4 -24.9% -10.9% 376.3 317.0 282.4 -24.9% -10.9% 34.6
HFC 52.3 84.2 52.6 0.6% -37.6% 52.3 84.2 52.6 0.6% -37.6% 31.6
PFC 10.0 25.5 18.7 86.6% -26.5% 10.0 25.5 18.7 86.6% -26.5% 6.8
SF6 5.5 6.9 3.2 -41.2% -53.4% 5.5 6.9 3.2 -41.2% -53.4% 3.7
Total 4138.3 4271.0 3807.2 -8.0% -10.9% 4138.3 4271.0 3807.2 -8.0% -10.9% 463.8
EU (EU-wide implementation excluding ACEA agreement)
Direct emissions (Mt CO2 eq.) Indirect emissions (Mt CO2 eq.) Direct and indirect emissions (Mt CO2 eq.)

EU (EU-wide implementation excluding ACEA agreement) industrial boilers allocated to industrial sectorsmarginal cost: 31.62 Euro’99 per t of CO2 eq.Industrial sectors
Reduction
Emission (Mt of CO2 equivalent)
Emissions in 1990 or
1995
Emissions in 2010 under
baseline conditions
Emissions in 2010 under Kyoto target conditions
% Change from 1990
or 1995
% Change from 2010 baseline
Emissions in 1990 or
1995
Emissions in 2010 under
baseline conditions
Emissions in 2010 under Kyoto target conditions
% Change from 1990
or 1995
% Change from 2010 baseline
Emissions in 1990 or
1995
Emissions in 2010 under
baseline conditions
Emissions in 2010 under Kyoto target conditions
% Change from 1990
or 1995
% Change from 2010 baseline
Direct Emission reduction from baseline levels (Mt CO2 eq.)
Iron and steelCO2 (fuel related) 172.6 133.9 118.0 -31.7% -11.9% 56.6 41.9 36.5 -35.5% -12.9% 229.2 175.8 154.4 -32.6% -12.2% 16.0
CO2 (other) 23.4 24.3 24.3 4.0% 0.0% 23.4 24.3 24.3 4.0% 0.0% 0.0
CH4 0.2 0.2 0.2 0.0% 0.0% 0.2 0.2 0.2 0.0% 0.0% 0.0
N2O 0.0 0.0 0.0 - - 0.0 0.0 0.0 - - 0.0
HFC 0.0 0.0 0.0 - - 0.0 0.0 0.0 - - 0.0
PFC 0.0 0.0 0.0 - - 0.0 0.0 0.0 - - 0.0
SF6 0.0 0.0 0.0 - - 0.0 0.0 0.0 - - 0.0
Sub-total 196.2 158.4 142.4 -27.4% -10.1% 56.6 41.9 36.5 -35.5% -12.9% 252.7 200.3 178.9 -29.2% -10.7% 16.0
Non-ferrous metalsCO2 (fuel related) 15.2 12.5 11.9 -21.7% -4.4% 41.3 19.9 16.5 -59.9% -17.0% 56.5 32.4 28.5 -49.6% -12.1% 0.5
CO2 (other) 0.0 0.0 0.0 - - 0.0 0.0 0.0 - - 0.0
CH4 0.0 0.0 0.0 - - 0.0 0.0 0.0 - - 0.0
N2O 0.0 0.0 0.0 - - 0.0 0.0 0.0 - - 0.0
HFC 0.0 0.0 0.0 - - 0.0 0.0 0.0 - - 0.0
PFC 7.7 6.5 1.0 -87.3% -84.9% 7.7 6.5 1.0 -87.3% -84.9% 5.5
SF6 1.5 2.9 0.0 -100.0% -100.0% 1.5 2.9 0.0 -100.0% -100.0% 2.9
Sub-total 24.4 21.8 12.9 -47.1% -40.9% 41.3 19.9 16.5 -59.9% -17.0% 65.6 41.8 29.4 -55.1% -29.5% 8.9
ChemicalsCO2 (fuel related) 96.4 51.3 43.7 -54.7% -14.8% 119.4 136.1 115.7 -3.1% -15.0% 215.8 187.4 159.4 -26.1% -14.9% 7.6
CO2 (other) 11.4 14.2 14.2 25.0% 0.0% 11.4 14.2 14.2 25.0% 0.0% 0.0
CH4 0.1 0.1 0.1 0.0% 0.0% 0.1 0.1 0.1 0.0% 0.0% 0.0
N2O 108.2 48.2 21.5 -80.1% -55.4% 108.2 48.2 21.5 -80.1% -55.4% 26.7
HFC 26.5 7.2 0.4 -98.6% -95.0% 26.5 7.2 0.4 -98.6% -95.0% 6.8
PFC 0.0 0.0 0.0 - - 0.0 0.0 0.0 - - 0.0
SF6 0.0 0.0 0.0 - - 0.0 0.0 0.0 - - 0.0
Sub-total 242.6 120.9 79.9 -67.1% -33.9% 119.4 136.1 115.7 -3.1% -15.0% 362.0 257.0 195.6 -46.0% -23.9% 41.0
Building MaterialsCO2 (fuel related) 95.2 92.0 88.6 -6.9% -3.6% 35.8 28.9 23.5 -34.4% -18.7% 130.9 120.8 112.1 -14.4% -7.2% 3.3
CO2 (other) 105.8 119.6 118.5 12.0% -0.9% 105.8 119.6 118.5 12.0% -0.9% 1.1
CH4 0.0 0.0 0.0 - - 0.0 0.0 0.0 - - 0.0
N2O 0.0 0.0 0.0 - - 0.0 0.0 0.0 - - 0.0
HFC 0.0 0.0 0.0 - - 0.0 0.0 0.0 - - 0.0
PFC 0.0 0.0 0.0 - - 0.0 0.0 0.0 - - 0.0
SF6 0.0 0.0 0.0 - - 0.0 0.0 0.0 - - 0.0
Sub-total 201.0 211.6 207.2 3.1% -2.1% 35.8 28.9 23.5 -34.4% -18.7% 236.8 240.4 230.6 -2.6% -4.1% 4.4
Paper and PulpCO2 (fuel related) 28.9 21.3 18.9 -34.6% -11.1% 40.2 84.5 69.7 73.1% -17.5% 69.1 105.7 88.6 28.1% -16.2% 2.4
CO2 (other) 0.0 0.0 0.0 - - 0.0 0.0 0.0 - - 0.0
CH4 0.0 0.0 0.0 - - 0.0 0.0 0.0 - - 0.0
N2O 0.0 0.0 0.0 - - 0.0 0.0 0.0 - - 0.0
HFC 0.0 0.0 0.0 - - 0.0 0.0 0.0 - - 0.0
PFC 0.0 0.0 0.0 - - 0.0 0.0 0.0 - - 0.0
SF6 0.0 0.0 0.0 - - 0.0 0.0 0.0 - - 0.0
Sub-total 28.9 21.3 18.9 -34.6% -11.1% 40.2 84.5 69.7 73.1% -17.5% 69.1 105.7 88.6 28.1% -16.2% 2.4
Food, drink and tobaccoCO2 (fuel related) 45.5 30.9 26.0 -42.9% -16.1% 43.6 72.5 62.3 42.9% -14.2% 89.1 103.5 88.2 -1.0% -14.7% 5.0
CO2 (other) 0.0 0.0 0.0 - - 0.0 0.0 0.0 - - 0.0
CH4 0.0 0.0 0.0 - - 0.0 0.0 0.0 - - 0.0
N2O 0.0 0.0 0.0 - - 0.0 0.0 0.0 - - 0.0
HFC 0.0 3.8 0.0 - -100.0% 0.0 3.8 0.0 - -100.0% 3.8
PFC 0.0 0.0 0.0 - - 0.0 0.0 0.0 - - 0.0
SF6 0.0 0.0 0.0 - - 0.0 0.0 0.0 - - 0.0
Sub-total 45.5 34.7 26.0 -42.9% -25.2% 43.6 72.5 62.3 42.9% -14.2% 89.1 107.3 88.2 -1.0% -17.8% 8.8
Other industriesCO2 (fuel related) 107.6 107.0 102.1 -5.1% -4.6% 152.6 142.0 118.3 -22.5% -16.7% 260.2 248.9 220.4 -15.3% -11.5% 4.9
CO2 (other) 16.2 17.5 17.5 7.5% 0.0% 16.2 17.5 17.5 7.5% 0.0% 0.0
CH4 0.1 0.1 0.1 0.0% 0.0% 0.1 0.1 0.1 0.0% 0.0% 0.0
N2O 4.7 4.7 4.7 0.0% 0.0% 4.7 4.7 4.7 0.0% 0.0% 0.0
HFC 24.5 41.2 27.9 13.6% -32.4% 24.5 41.2 27.9 13.6% -32.4% 13.3
PFC 2.3 19.0 17.7 659.8% -6.6% 2.3 19.0 17.7 659.8% -6.6% 1.3
SF6 0.0 0.0 0.0 - - 0.0 0.0 0.0 - - 0.0
Sub-total 155.4 189.3 169.8 9.3% -10.3% 152.6 142.0 118.3 -22.5% -16.7% 308.0 331.3 288.1 -6.5% -13.0% 19.5
Total industryCO2 (fuel related) 561.4 448.7 409.1 -27.1% -8.8% 489.4 525.8 442.4 -9.6% -15.9% 1050.8 974.5 851.5 -19.0% -12.6% 39.6
CO2 (other) 156.8 175.6 174.5 11.3% -0.6% 156.8 175.6 174.5 11.3% -0.6% 1.1
CH4 0.4 0.4 0.4 0.0% 0.0% 0.4 0.4 0.4 0.0% 0.0% 0.0
N2O 112.8 52.8 26.1 -76.8% -50.5% 112.8 52.8 26.1 -76.8% -50.5% 26.7
HFC 51.1 52.2 28.2 -44.7% -45.9% 51.1 52.2 28.2 -44.7% -45.9% 24.0
PFC 10.0 25.5 18.7 86.6% -26.5% 10.0 25.5 18.7 86.6% -26.5% 6.8
SF6 1.5 2.9 0.0 -100.0% -100.0% 1.5 2.9 0.0 -100.0% -100.0% 2.9
Total industry 894.0 758.0 657.1 -26.5% -13.3% 489.4 525.8 442.4 -9.6% -15.9% 1383.3 1283.8 1099.4 -20.5% -14.4% 100.9
Direct emissions (Mt CO2 eq.) Indirect emissions (Mt CO2 eq.) Direct and indirect emissions (Mt CO2 eq.)
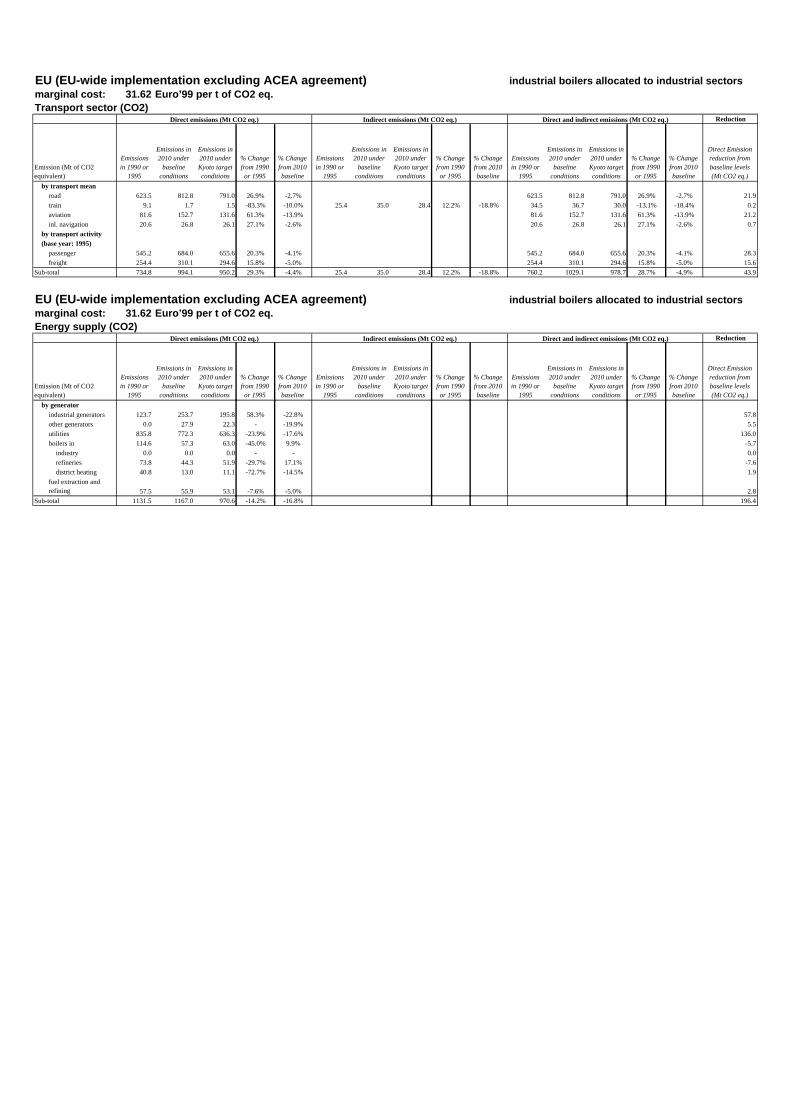
EU (EU-wide implementation excluding ACEA agreement) industrial boilers allocated to industrial sectorsmarginal cost: 31.62 Euro’99 per t of CO2 eq.Transport sector (CO2)
Reduction
Emission (Mt of CO2 equivalent)
Emissions in 1990 or
1995
Emissions in 2010 under
baseline conditions
Emissions in 2010 under Kyoto target conditions
% Change from 1990
or 1995
% Change from 2010 baseline
Emissions in 1990 or
1995
Emissions in 2010 under
baseline conditions
Emissions in 2010 under Kyoto target conditions
% Change from 1990
or 1995
% Change from 2010 baseline
Emissions in 1990 or
1995
Emissions in 2010 under
baseline conditions
Emissions in 2010 under Kyoto target conditions
% Change from 1990
or 1995
% Change from 2010 baseline
Direct Emission reduction from baseline levels (Mt CO2 eq.)
by transport meanroad 623.5 812.8 791.0 26.9% -2.7% 623.5 812.8 791.0 26.9% -2.7% 21.9
train 9.1 1.7 1.5 -83.3% -10.0% 25.4 35.0 28.4 12.2% -18.8% 34.5 36.7 30.0 -13.1% -18.4% 0.2
aviation 81.6 152.7 131.6 61.3% -13.9% 81.6 152.7 131.6 61.3% -13.9% 21.2
inl. navigation 20.6 26.8 26.1 27.1% -2.6% 20.6 26.8 26.1 27.1% -2.6% 0.7
by transport activity(base year: 1995)
passenger 545.2 684.0 655.6 20.3% -4.1% 545.2 684.0 655.6 20.3% -4.1% 28.3
freight 254.4 310.1 294.6 15.8% -5.0% 254.4 310.1 294.6 15.8% -5.0% 15.6
Sub-total 734.8 994.1 950.2 29.3% -4.4% 25.4 35.0 28.4 12.2% -18.8% 760.2 1029.1 978.7 28.7% -4.9% 43.9
EU (EU-wide implementation excluding ACEA agreement) industrial boilers allocated to industrial sectorsmarginal cost: 31.62 Euro’99 per t of CO2 eq.Energy supply (CO2)
Reduction
Emission (Mt of CO2 equivalent)
Emissions in 1990 or
1995
Emissions in 2010 under
baseline conditions
Emissions in 2010 under Kyoto target conditions
% Change from 1990
or 1995
% Change from 2010 baseline
Emissions in 1990 or
1995
Emissions in 2010 under
baseline conditions
Emissions in 2010 under Kyoto target conditions
% Change from 1990
or 1995
% Change from 2010 baseline
Emissions in 1990 or
1995
Emissions in 2010 under
baseline conditions
Emissions in 2010 under Kyoto target conditions
% Change from 1990
or 1995
% Change from 2010 baseline
Direct Emission reduction from baseline levels (Mt CO2 eq.)
by generatorindustrial generators 123.7 253.7 195.8 58.3% -22.8% 57.8
other generators 0.0 27.9 22.3 - -19.9% 5.5
utilities 835.8 772.3 636.3 -23.9% -17.6% 136.0
boilers in 114.6 57.3 63.0 -45.0% 9.9% -5.7
industry 0.0 0.0 0.0 - - 0.0
refineries 73.8 44.3 51.9 -29.7% 17.1% -7.6
district heating 40.8 13.0 11.1 -72.7% -14.5% 1.9
fuel extraction and refining 57.5 55.9 53.1 -7.6% -5.0% 2.8
Sub-total 1131.5 1167.0 970.6 -14.2% -16.8% 196.4
Direct emissions (Mt CO2 eq.) Indirect emissions (Mt CO2 eq.) Direct and indirect emissions (Mt CO2 eq.)
Direct emissions (Mt CO2 eq.) Indirect emissions (Mt CO2 eq.) Direct and indirect emissions (Mt CO2 eq.)