role of h2 in emission reduction
TRANSCRIPT

8/2/2019 Role of h2 in Emission Reduction
http://slidepdf.com/reader/full/role-of-h2-in-emission-reduction 1/15
Probir Kumar BoseDirector
Rahul Banerjee1
Assistant Professor
e-mail: [email protected]
Mechanical Engineering Department,
National Institute of Technology,
Agartala, Tripura 799055, India
An Experimental Investigationon the Role of Hydrogen in theEmission Reduction and
Performance Trade-Off Studiesin an Existing Diesel EngineOperating in Dual Fuel ModeUnder Exhaust Gas RecirculationWith emission legislations getting more stringent in order to comply with the responsibil-ities of environmental obligations, engine manufacturers are turning to explore new ave-nues to meet the paradox of curtailing particulate matter (PM) and NOx emissions onone hand and maintaining consumer expectations of reduced fuel consumption and increased thermal efficiency on the other. Studies dedicated in mitigating such paradoxi-
cal objectives have established novel emission reduction systems such as the diesel par-ticulate filter (DPF) and selective catalytic reduction (SCR) after treatment systems but at the expense of increased complexity of deployment and cost. The present work exploresthe emission and performance characteristics of an existing four stroke single cylinder engine operating with a predefined flow rate of hydrogen as a dual fuel. The hydrogenwas premixed with the incoming air and inducted during the duration of intake valveopening by means of an indigenously developed cam actuated electromechanical timed manifold injection technique. exhaust gas recirculation (EGR) (hot and cooled) techniquehas been implemented in the present work to reduce NOx emissions which were enriched with the same amount of hydrogen. Research studies carried out on the efficacy of EGRtechniques have reported the inherent penalty of increasing the common diesel pollutantsof smoke and particulate matter and fuel consumption at the expense of reducing NOxemissions. Trade-off studies in the present work revealed contrary results, where 20%cooled EGR under hydrogen enrichment registered a decrease of 9.2% and 12.3% in NOx emissions at 60% and 80% load as compared to diesel operation while simultane-ously retaining a reduction of 4.6% and 1.9% in brake specific energy consumption(BSEC) along with 10% and 8.33% corresponding decrease in smoke emissions and areduction of 11.30% and 12.31% in total unburnt hydrocarbon (TUHC) emissions. COemissions were simultaneously decreased by 26.6% and 20.0% while CO 2 emissionsdecreased by 24.5% and 29.1%, respectively, while maintaining 4.8% and 2% increasein brake thermal efficiency and a reduction of 23.3% and 18.95% in specific fuel con-sumption (SFC) (diesel) simultaneously at the respective loads. Similar trade-off poten-tial, as was evident in the 10% EGR strategies, provide a strong motivation to explorethe role of hydrogen as in situ dual fuel solution to counter the conflicting emission and performance requirements of contemporary diesel engines made to operate under EGR.[DOI: 10.1115/1.4005246]
Keywords: h ydrogen-diesel dual-fuel, EGR, smoke-NOx-SFC-BTH trade-off, smoke- NOx-CO-TUHC- CO 2 emission trade-off
1 Introduction
The important motivations for exploring alternative fuel resour-ces are energy security, air pollution, and climate change, prob-lems that are collectively calling into question the fundamentalsustainability of the current energy system. The European Com-mission‘s White Paper “European transport policy for 2010: time
to decide”, natural gas and bio fuels are seen as the most impor-tant short-term options for meeting these goals, whereas in thelong run, a substantial contribution is expected to be delivered byhydrogen which would facilitate the transition from limited nonre-newable stocks of fossil fuels to unlimited flows of renewablesources. Hydrogen fuelled internal combustion engines with near-zero emissions are a potential near-term option and a bridge tohydrogen fuel cell vehicles where fuel cell undergoes develop-ments to make it economically viable. With emission legislationsgetting more stringent [1], engine manufacturers in order to com-ply with the responsibilities of environmental obligations [2,3])are turning to explore new avenues [4,5] to meet the paradox of
1Corresponding author.Contributed by the Petroleum Division of ASME for publication in the JOURNAL
OF ENERGY RESOURCES TECHNOLOGY. Manuscript received February 12, 2011; finalmanuscript received September 22, 2011; published online January 30, 2012. Assoc.Editor: Prof. Nesrin Ozalp.
Journal of Energy Resources Technology MARCH 2012, Vol. 134 / 012601-1CopyrightVC 2012 by ASME
Downloaded 27 Feb 2012 to 180.151.33.69. Redistribution subject to ASME license or copyright; see http://www.asme.org/terms/Terms_Use.cfm

8/2/2019 Role of h2 in Emission Reduction
http://slidepdf.com/reader/full/role-of-h2-in-emission-reduction 2/15
curtailing particulate matter (PM) and NOx emissions on onehand and maintaining consumer expectations of superior perform-ance of reduced BSFC and increased thermal efficiency on theother. Research work dedicated in mitigating such paradoxicalobjectives have led to the development of novel emission reduc-tion systems [6 – 10]) such as the diesel particulate filter (DPF),lean NOx trap (LNT), and selective catalytic reduction (SCR) af-ter treatment systems but at the expense of increased complexityof deployment, cost and maintenance [11,12]. Studies on theapplication of hydrogen as a dual fuel in diesel engines [13,14]
offer the motivation to explore the potential in exploiting the in-herent superior combustion characteristics of hydrogen as an insitu solution to the emission and performance trade-off challengesof conventional diesel combustion with and without exhaust gasrecirculation (EGR).
1.1 The Hydrogen–Diesel Dual Fuel Advantage. Theunique combustion properties of hydrogen (see supplemental TableS-1 [67]) make it an ideal choice for its use in compression ignitionengine. The burning velocities of hydrogen-air mixture ranges from153 to 232 cm/s for its stoichiometric mixture [15]. This results in amore isochoric, thus thermodynamically more favorable combus-tion than conventional diesel engines which experience a pressurerise spread over several degrees of crank angle. The flammablerange is exceptionally wide for hydrogen in air which corresponds
to a lower equivalence ratio limit of about 0.24 as compared toabout 0.5 for most hydrocarbon fuels [16]. The importance of verylean equivalence ratios under which hydrogen sustains combustioncan be appreciated in the context of the potential benefits of reduced pollutant emissions that are offered under such conditionsconsidering the fact that the operation range of conventional DI die-sel engines are mainly constrained by excessive smoke and hydro-carbon emissions at equivalence ratios higher than 0.7–0.9 [16].Moreover, the high auto-ignition temperature of hydrogen encour-ages the use of higher compression ratios as prevalent in dieselengines. The hydrogen-diesel dual fuel concept method combinesthe advantages of the high part load efficiency, lower specific fuelconsumption of a diesel engine and the clean combustion character-istics of hydrogen. However, hydrogen with its cetane number being very low, are not directly suited to compression ignitionengines. Hydrogen has an auto-ignition temperature of about 571C and as such it is not possible to achieve ignition of hydrogen bycompression alone at the compression ratios prevalent in contempo-rary diesel engines. Some source of ignition has to be created insidethe combustion chamber to ensure ignition [17 – 20]. To this end, asmall amount of pilot diesel fuel is injected by means of the exist-ing fuel injection equipment near the end of the compression stroketo ignite the gaseous mixture. Diesel fuel auto ignites and createsignition sources for the surrounding air– high octane gaseous fuelmixture through a propagating flame front as per conventional SIengine combustion characteristics (Masood [21]). The pilot liquidfuel, normally contributes only a small fraction of the engine power output under dual fuel mode of operation. The advantage of thistype of engine is derived from the advantages distinct to both thetypes of combustion that can be derived by using the difference of flammability of two fuels at different stages of the combustion
process.
1.2 Hydrogen Induction: A Brief Perspective. Hydrogen asa fuel, has properties distinct from the conventional fossil fuels.The necessary ignition energy of a hydrogen-air mixture is verylow (0.02 mJ), especially at the stoichiometric condition. Thisenables the ignition of very lean mixtures and ensures immediateignition. Contact with hot spots or residual gas, can cause the mix-ture to ignite spontaneously [22]. This pre-ignition results in back-fire during which flame in the combustion chamber ignites themixture in the inlet manifold through the inlet port resulting insevere engine damage. The backfire phenomenon is also calledflashback and is one of the main issues of hydrogen fuelled inter-
nal combustion engines. Thus, if an existing engine were to befuelled by hydrogen, problems, such as backfire, pre-ignition,high pressure rise rate and even knock can occur [23]. So its fuelsupply system and combustion system need suitable modification.The prevalent modes of hydrogen induction were examined[24 – 27]) wherein timed manifold injection (TMI) systems wasadopted in the present study. It possesses the ability to initiate fueldelivery at a timing position sometimes after the beginning of intake stroke ensuring a precooling effect and thus rendering thepre-ignition sources ineffective. Furthermore, it helps to quench
and dilute any residual combustion products that could be presentin the compression space near TDC.
1.3 Hydrogen Induction Circuit Development. Consideringthe temperamental nature of hydrogen fuel as discussed in Sec.1.2, sufficient care was taken to incorporate redundant safetymeasures in the hydrogen induction circuit. To this effect, a spe-cial in-house developed intake manifold extension was designedwith inbuilt flame arrestor consisting of circular plates with perfo-rations of 0.064 cm diameter corresponding to the approximateminimum quenching diameter of hydrogen. A remotely operatedemergency shut off v/v with temperature relay from the inletmanifold, a flame trap, surge tank and interconnecting flamearrestors as depicted in the schematic Fig. 1 constituted the safetymeasures in the circuit. The hydrogen ( BOC India Ltd: UN 1049as per CAS: 1333-74-0; Purity !99.5% v/v) compressed at around205 bar, was routed to the solenoid injector via a two stage pres-sure reduction system comprising of the high pressure reducingstage provided by the pressure regulator/reducer of Concoa make,capable of 280/14 bar reduction and a low pressure reducing stagelocated after the surge tank to reduce the pressure manually to therequired working pressure of 1.2 bar at the solenoid injector of DYMCO make (Table 1). The injector was mounted onto the inletmanifold at a distance of 15 Di from the inlet port [28]. The dis-tance was chosen on the basis of a minimum window allowanceto the inducted hydrogen to form a homogenous mixture with theincoming charge and also to ensure at the same time that undesir-able preigniton induced flashback was dissuaded considering theeasily ignitable tendencies of a hydrogen-air mixture. The massflow rate of hydrogen was controlled at 0.15 kg/h by a mass flowcontroller (Table 2) in the circuit. The solenoid injector circuit
was permanently charged at its operating pressure with hydrogenwhile the injection commenced only when the (injector dedicated)12 V electric was closed with the contact of the rocker arm in theTMI circuit with the swiveling metal plate placed in position asdiscussed below.
Fig. 1 Timed manifold hydrogen induction circuit
012601-2 / Vol. 134, MARCH 2012 Transactions of the ASME
Downloaded 27 Feb 2012 to 180.151.33.69. Redistribution subject to ASME license or copyright; see http://www.asme.org/terms/Terms_Use.cfm
8/2/2019 Role of h2 in Emission Reduction
http://slidepdf.com/reader/full/role-of-h2-in-emission-reduction 3/15
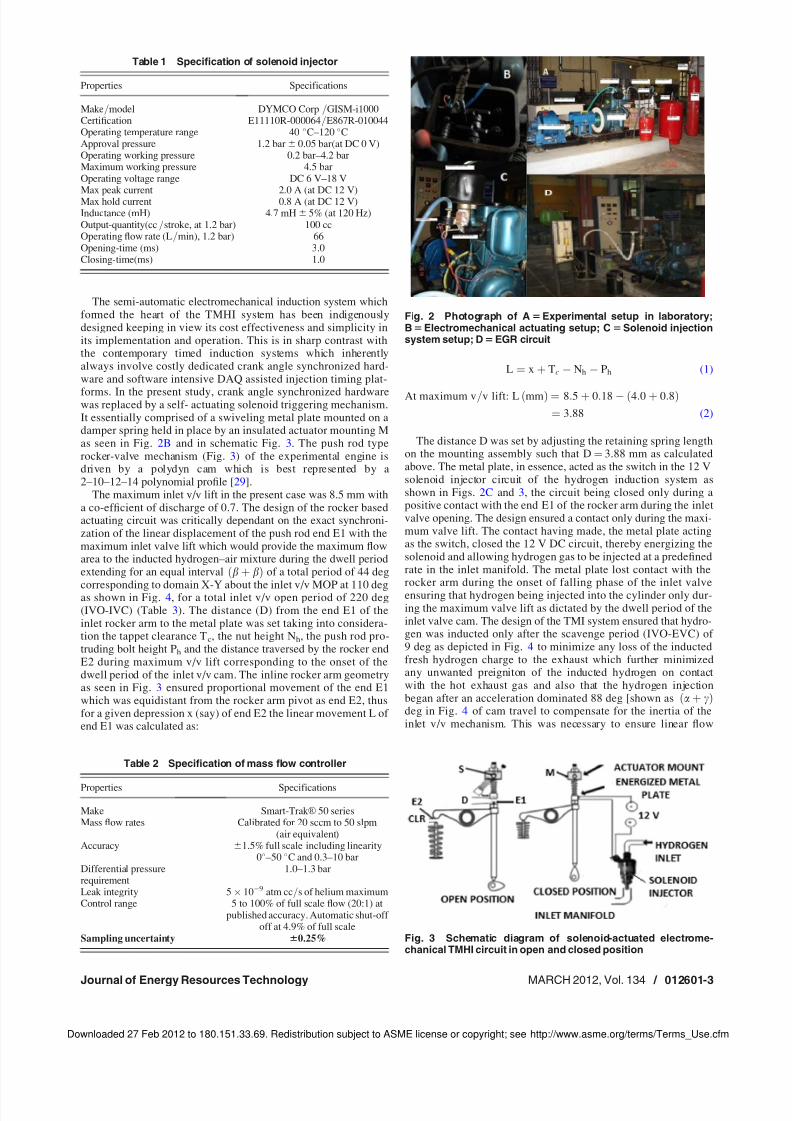
The semi-automatic electromechanical induction system whichformed the heart of the TMHI system has been indigenouslydesigned keeping in view its cost effectiveness and simplicity inits implementation and operation. This is in sharp contrast withthe contemporary timed induction systems which inherentlyalways involve costly dedicated crank angle synchronized hard-ware and software intensive DAQ assisted injection timing plat-
forms. In the present study, crank angle synchronized hardwarewas replaced by a self- actuating solenoid triggering mechanism.It essentially comprised of a swiveling metal plate mounted on adamper spring held in place by an insulated actuator mounting Mas seen in Fig. 2B and in schematic Fig. 3. The push rod typerocker-valve mechanism (Fig. 3) of the experimental engine isdriven by a polydyn cam which is best represented by a2–10–12–14 polynomial profile [29].
The maximum inlet v/v lift in the present case was 8.5 mm witha co-efficient of discharge of 0.7. The design of the rocker basedactuating circuit was critically dependant on the exact synchroni-zation of the linear displacement of the push rod end E1 with themaximum inlet valve lift which would provide the maximum flowarea to the inducted hydrogen–air mixture during the dwell periodextending for an equal interval ðb þ bÞ of a total period of 44 deg
corresponding to domain X-Y about the inlet v/v MOP at 110 degas shown in Fig. 4, for a total inlet v/v open period of 220 deg(IVO-IVC) (Table 3). The distance (D) from the end E1 of theinlet rocker arm to the metal plate was set taking into considera-tion the tappet clearance Tc, the nut height Nh, the push rod pro-truding bolt height Ph and the distance traversed by the rocker endE2 during maximum v/v lift corresponding to the onset of thedwell period of the inlet v/v cam. The inline rocker arm geometryas seen in Fig. 3 ensured proportional movement of the end E1which was equidistant from the rocker arm pivot as end E2, thusfor a given depression x (say) of end E2 the linear movement L of end E1 was calculated as:
L ¼ x þ Tc À Nh À Ph (1)
At maximum v=v lift: L ðmmÞ ¼ 8:5 þ 0:18 À ð4:0 þ 0:8Þ
¼ 3:88 (2)
The distance D was set by adjusting the retaining spring lengthon the mounting assembly such that D ¼ 3.88 mm as calculatedabove. The metal plate, in essence, acted as the switch in the 12 Vsolenoid injector circuit of the hydrogen induction system asshown in Figs. 2C and 3, the circuit being closed only during apositive contact with the end E1 of the rocker arm during the inletvalve opening. The design ensured a contact only during the maxi-mum valve lift. The contact having made, the metal plate actingas the switch, closed the 12 V DC circuit, thereby energizing thesolenoid and allowing hydrogen gas to be injected at a predefinedrate in the inlet manifold. The metal plate lost contact with therocker arm during the onset of falling phase of the inlet valveensuring that hydrogen being injected into the cylinder only dur-ing the maximum valve lift as dictated by the dwell period of theinlet valve cam. The design of the TMI system ensured that hydro-gen was inducted only after the scavenge period (IVO-EVC) of 9 deg as depicted in Fig. 4 to minimize any loss of the inductedfresh hydrogen charge to the exhaust which further minimizedany unwanted preigniton of the inducted hydrogen on contactwith the hot exhaust gas and also that the hydrogen injectionbegan after an acceleration dominated 88 deg [shown as ða þ cÞdeg in Fig. 4 of cam travel to compensate for the inertia of theinlet v/v mechanism. This was necessary to ensure linear flow
Table 1 Specification of solenoid injector
Properties Specifications
Make=model DYMCO Corp =GISM-i1000Certification E11110R-000064=E867R-010044Operating temperature range 40 C–120 CApproval pressure 1.2 bar 6 0.05 bar(at DC 0 V)Operating working pressure 0.2 bar–4.2 bar Maximum working pressure 4.5 bar Operating voltage range DC 6 V–18 VMax peak current 2.0 A (at DC 12 V)Max hold current 0.8 A (at DC 12 V)Inductance (mH) 4.7 mH6 5% (at 120 Hz)Output-quantity(cc=stroke, at 1.2 bar) 100 ccOperating flow rate (L=min), 1.2 bar) 66Opening-time (ms) 3.0Closing-time(ms) 1.0
Table 2 Specification of mass flow controller
Properties Specifications
Make Smart-TrakVR 50 seriesMass flow rates Calibrated for 20 sccm to 50 slpm
(air equivalent)Accuracy 61.5% full scale including linearity
0 –50 C and 0.3–10 bar Differential pressurerequirement
1.0–1.3 bar
Leak integrity 5 Â 10À9 atm cc=s of helium maximumControl range 5 to 100% of full scale flow (20:1) at
published accuracy. Automatic shut-off off at 4.9% of full scale
Sampling uncertainty 60.25%
Fig. 2 Photograph of A5Experimental setup in laboratory;B5Electromechanical actuating setup; C5Solenoid injectionsystem setup; D5EGR circuit
Fig. 3 Schematic diagram of solenoid-actuated electrome-chanical TMHI circuit in open and closed position
Journal of Energy Resources Technology MARCH 2012, Vol. 134 / 012601-3
Downloaded 27 Feb 2012 to 180.151.33.69. Redistribution subject to ASME license or copyright; see http://www.asme.org/terms/Terms_Use.cfm

8/2/2019 Role of h2 in Emission Reduction
http://slidepdf.com/reader/full/role-of-h2-in-emission-reduction 4/15
characteristics of the solenoid-actuated-injector which could onlybe captured during constant flow area proffered by the inlet v/vduring the cam dwell period. Moreover, the designed time ensuredthat hydrogen was injected only after a sufficient flow of cooler ambient air was inducted in the cylinder during the opening of theinlet valve, this being critical in quenching any residual hot spotsremaining in the cylinder thereby removing any possibility of flash back. For no-hydrogen operation, the metal plate was swungout of position of contact from the rocker end E1 by means of swivel S corresponding to the open position as seen in Fig. 3.
2 Methodology and Instrumentation
2.1 Experimental Apparatus
2.1.1 Experimental Engine Setup. The experiment was con-ducted on an existing single cylinder four stroke CI engine asdetailed in Table 4 and conforming to the Indian StandardsIS:11170-1985. The engine was coupled to an eddy current dyna-mometer model AG10 of Saj Test PlantVR make with integratedspeed sensing unit designed to run at a constant speed of 15006 10 rpm. The instrumentation as detailed in Table S-2 [67]was interfaced to a computer through a NI LabviewVR based cen-
tralized DAQ platform synchronized with a crank angle encoder onto a GUI based EngineSoft post processing software. The DAQwas programmed to acquire in-cylinder and fuel injection pressuredata at 1 deg crank intervals and present the data smoothened over 100 consecutive cycles to compensate for cyclic variations at aparticular case of engine operation. The exhaust gas temperature,cooling water inlet and outlet temperatures were also reported asan average value over the period of data acquisition while com-mon performance parameters were reported as calculated valuesfor the same period of sampling. The speed scanning interval of the dynamometer was set to 2000 ms to smoothen undesirable sig-
nal fluctuations. The specific fuel consumption of diesel fuel wascarried out in fuel burette of all tests were fuel consumption for atime interval of 60 s was recorded in a fuel burette of 12.4 mm di-ameter. Mass flow rate of inducted air, was recorded as a calcu-lated value (kg/h) from the sensed manometric depression in theintegrated air box. Extra care was taken in keeping the speed con-stant (610 rpm) during data acquisition at each case of engineload stepping by adjusting the screw given with the fuel pumprack. All procedure pertaining to experimental testing preparation,performance test and recording of test results conformed to the In-dian Standards specifications IS: 10,000 [30 – 32]. The average am-bient temperature, cooling water temperature and relativehumidity during experimentation was recorded at 25 C, 18 C,and 55%, respectively.
2.1.2 Emission Analysis Instrumentation. The exhaust gaseswere sampled by a 5 Gas analyzer (Make: AVL India, Model:444) fitted with DiGas sampler (Table S-3 [67]) conforming toARAI certification- ARAI/TA (4G-RV)/AVL/DiGas 444/0910-12to record the emissions of CO, CO2, O2 which were measured involume percentage, while total unburnt hydrocarbon TUHC wasmeasured in ppm (vol.) of n-hexane equivalent and NO was meas-ured in ppm (vol.) during each case of engine operation.
The analyzer was interfaced through its RS 232C communica-tion bus to an in-house developed emission data acquisition plat-form which recorded the emissions over a span of 120 s in 20 sconsecutive intervals, which was greater than the instrument
response time of 15 s, for each case of engine operation. Theexhaust gases were tapped from a T joint beyond the exhaust gascooler outlet and the opacimeter tapping point. A fine filter toremove advected particulates and a condensate trap were incorpo-rated after the main exhaust gas cooler in order that the exhaustinlet temperature to the analyzer was maintained 40 C as per the instruction manual. Stray condensate, if any, were tackled bythe condensate separator inbuilt in the analyzer which was flushedbefore every case of data recording. Leak Check , HC Residue Cal-ibration, Zero Adjustment and condensate purging of the analyzer were carried out before each case of observation. CO, CO2 andTUHC were measured on the Non-Dispersive-Infrared (NDIR)detection principle while O2 and NO emissions were measured byprecalibrated electrochemical sensors in the analyzer. It is to be
Fig. 4 Inlet valve timing diagram of experimental engine
Table 3 Specification of experimental engine valve train
Engine valve train properties Specification
Inlet and exhaust valve inner seat diameter (mm) 31Inlet and exhaust valve outer seat diameter (mm) 33Seat angle 45 degValve Tappet clearance (Inlet) 0.18 mmValve Tappet clearance (Exhaust) 0.20 mmBumping clearance 1.16–1.32 mmExhaust valve opening 35.5 deg BBDCExhaust valve closing 4.5 deg ATDCInlet valve opening 4.5 deg BTDCInlet valve closing 35.5 deg ABDCValve overlap period 9 degMax. v=v lift (mm) 8.5Co-efficient of discharge Cd @ max inlet v=v lift 0.7
Table 4 Experimental engine specifications
Experimental engine specifications
Make and type Kirloskar TV1—single cylinder,four stroke, water cooled
Bore and stroke 87.5 mm  110 mmType of ignition Compression ignitionCompression ratio 17.5:1Peak pressure 76 bar Cubic capacity 661 cu cmCon rod length (mm) 234Crank radius (mm) 55Rated output 5.2 kW (7.0 HP) @ 1500 rpm;
5.9 kW (8.0 HP) @ 1800 RPMMax. brake mean effectivepressure @1500 rpm
6.374 bar
Fuel injection Direct injectionFuel injection system Pump in line nozzle injectionFuel injector opening pressure(diesel)
210–220 bar
Needle lift (mm) 0.25Injection timing (diesel) 23 deg BTDC staticNo. of fuel orifices 3Nozzle protrusion (Mm) 2.5Angle of inclination of injector 15 degSpray angle 120 degPiston bowl HemisphericalNozzle orifice diameter (mm) 0.3Governing Class B1 as per is 10,000 (Part 7) 1989
012601-4 / Vol. 134, MARCH 2012 Transactions of the ASME
Downloaded 27 Feb 2012 to 180.151.33.69. Redistribution subject to ASME license or copyright; see http://www.asme.org/terms/Terms_Use.cfm

8/2/2019 Role of h2 in Emission Reduction
http://slidepdf.com/reader/full/role-of-h2-in-emission-reduction 5/15
noted that the analyzer was calibrated with the recommendedcalibration gas mixture before the start of the entire range of experimentation. The smoke emissions were measured by anpartial-flow sampling AVL (Austria) 437 opacimeter as detailedin Table S-4 [67] conforming to M.O.S.T. specifications (MOST/ CMVR/TAP-115/116) and certified as per ARAI/TA(SM-RV)/ AVL/437/1011-02. The operating principle is based on the attenu-ation of light beam caused by the exhaust gases in a measuringchamber of defined measuring length and nonreflecting surfacefilled homogeneously with the exhaust gas. The loss of light inten-
sity between the light source and a receiver is measured andreported in % opacity, the calculation being based on the Beer-Lambert law. The absorption coefficient “k” was also reported bythe opacimeter in accordance with ECE-R24/ISO 3173. Conden-sation inside the instrument is avoided, as the measuring chamber is thermostatically heat controlled at 10065 C. The exhaust tap-ping point for opacity calculation was made after the main circuitcooler condensate but before the five gas analyzer tapping point asshown in Fig. 5. To ensure accuracy and repeatability observa-tions were recorded, at each case of engine operation, for a spanof 120 s at intervals of 20 s, which was greater than the instrumentmeasurement value resolution time of 10 s.
2.1.3 EGR Circuit Setup. The EGR circuit essentially con-sisted of an EGR control valve, exhaust control valve and bypassvalve, EGR cooler (water-cooled; double pass), and exhaust
cooler (water-cooled), digital manometers, air box orifice metersalong with condensate traps as depicted in Fig. 2D and schematicFig. 6. The exhaust gas re-entry duct was designed to intersect theinlet duct at a downcoming angle of 60 deg with reference to theaxis of the inlet pipe at a distance !20 Di from the inlet entry tothe cylinder head.
This was in an attempt to aid the EGR gases to form a homoge-nous mixture with the incoming fresh air during EGR applications[33]. The EGR circuit being of the low pressure type, it wasdesigned to be of the shortest route [34] type so as to take maxi-mum advantage of the pressure differential between the exhaustgases and the suction in the inlet manifold during IVO in absenceof flow assisting devices such as a turbocharger in the circuit. For all hot EGR operations the exhaust gases were partially cooled tothe maximum allowable temperature of inlet to engine as per
engine manufacturer before allowing mixing with the incomingair while for cooled EGR operations the exhaust gases were routedthrough the double pass water cooler CL1 to ensure cooledexhaust gas temperatures at around 50 C. Condensation of water vapour in the exhaust gases which was unavoidable (this is not accounted for in the calculation of EGR fraction in Eq. (3)) due tothe cooling of the exhaust gas below the dew point temperaturecorresponding to their inlet temperatures and pressures to thecooler, was collected in the condensate traps and drained beforeeach case of observations of EGR operation. The desired percent-age of recirculation of the exhaust gases was obtained by manualcontrol of the control v/v C1 in the loop circuit such that readingson the digital manometer in the loop circuit and that in the maincircuit were in the same proportion to the desired fraction of recir-culation. Diaphragm air boxes were incorporated in both the cir-
cuits primarily to dampen out the flow pulsations which wouldhave caused erratic recordings on the manometer. The air boxeswere fitted with an orifice for flow rate measurements wherein theconnected manometer observations provided the necessary differ-ential pressure readings for calculations. The coefficient of dis-charge of the orifice was experimentally determined as 0.65. Inthe present study, the engine was run by using a constant 0.15 kg/ h hydrogen flow rate at 10% EGR and 20% EGR in hot and cold
conditions at the same loads. The EGR fraction was calculated asin Eq. (3) [35].
% EGR ¼m
airw=oEGRÀ m
airwithEGR
m
airw=oEGR
(3)
2.2 Test Cases Examined. For baseline diesel operation, theengine was initially fired at no load and subsequently taken to fullload through load steps of 20% increments. At each load stepping,the pertinent data were acquired only after steady state tempera-tures in corresponding cooling water outlet and lube oil tempera-tures. For hydrogen–diesel dual fuel operations, the engine wasinitially run at no load with the hydrogen circuit disengaged. Atthe very outset, the flame trap cum surge tank was filled up with
hydrogen @14 bar from the main storage cylinders which werethen manually shut off.
The actuator mounting was held swiveled away from contactwith the rocker arm end E1 at the open position as seen in Fig. 3.For hydrogen induction, before powering on the 12 V solenoidcircuit, the actuator mounting was swiveled onto position by rotat-ing the swivel S and ensuring that contact was being made by E1with the metal contact plate by hand cranking. Next, the massflow controller was set to the desired flow rate of hydrogen of 0.15 kg/h. The hydrogen from the surge tank was now led throughthe flame trap, mass flow controller and flame arrestor to the sole-noid injector circuit at a pressure of 1.2 bar after the low stage re-ducer and the data acquisition system was held standby until themass flow controller registered the desired flow rate. With the sol-enoid circuit now powered on, the hydrogen was inducted in the
cylinder during the designed period of contact as discussed in Sec1.3. In order to ensure hydrogen induction was actually achievedat the desired flow rate, the data acquisition was commenced onlyafter a time lag at each case of hydrogen enrichment at a loadstepping, this being necessary to compensate the response time of the solenoid injector opening. Observing the steady state lube oiland cooling water outlet temperature under each case of hydrogeninduction, the pertinent data were acquired for the same load step-pings as for baseline diesel operation. Under hydrogen enrich-ment, however, beyond the 80% loading point, persistent flashback and unstable engine behavior due to knocking dissuaded anyexperimentation at further higher loads.
The EGR operations enriched with hydrogen at the same flowrates were carried out at each of the corresponding load steppingFig. 5 Schematic of emission analysis instrument setup
Fig. 6 Schematic of EGR circuit
Journal of Energy Resources Technology MARCH 2012, Vol. 134 / 012601-5
Downloaded 27 Feb 2012 to 180.151.33.69. Redistribution subject to ASME license or copyright; see http://www.asme.org/terms/Terms_Use.cfm
8/2/2019 Role of h2 in Emission Reduction
http://slidepdf.com/reader/full/role-of-h2-in-emission-reduction 6/15
immediately upon the completion of data acquisition of hydrogen-diesel dual fuel operations without EGR. The hot EGR operationswere carried out first, at recirculation rates of 10% and 20% bycarefully setting the control v/v in the loop circuit in proportion tomain exhaust gas low in the main circuit. The cooled EGR opera-tions were then carried out keeping the EGR outlet temperaturefrom the cooler CL2 (Fig. 6) constant for both cases of operationat 10% and 20% recirculation by suitable adjustments of the cool-ing water flow rates in the cooler. Between intermittent engineoperations without EGR at each of the designated load stepping,
additional time was given before data recording of the hydrogen –diesel -only operations to ensure purging of stray EGR gases.The engine operating coordinates for all cases of operation alongwith their corresponding mean observations of engine variablesand emission parameters have been listed in Table S-5 [67] for ready reference. The emissions have been reported additionally inregulatory brake specific units in Table S-6 [67]. The conversionof the emission absolute values to its corresponding brake specificunits have been elaborated in detail in Appendix A (see supple-mental material [67]) for ready reference.
3 Measured Data Uncertainty Analysis
In order to identify and quantify the error arising in the experi-mental emission measurements and the derived engine perform-ance parameters on account of the employed instrumentation, its
calibration, observation accuracy and the methodology of experi-mentation in a given ambient condition [36,37] a comprehensivemeasurement uncertainty analysis has been carried out to deter-mine the repeatability of the experimental observations. For thepresent work, the experimental error analysis consists of twocomponents:
(i) Identification of the measuring accuracy of each deviceimplemented in the test bed installation:To this end, Table 3 (and Tables S-2, S-3, and S-4 [67]),enlist the % uncertainty expected during the sampling of the observed parameters by the corresponding componentsof engine and emission analysis instrumentation, asdeclared by their respective manufacturers.
(ii) Calculating the uncertainty of the computed values of the various parameters resulting from the postprocess-ing of the measured data:The combined uncertainty analysis for the performance pa-rameters have been has been carried out on the basis of theroot mean square method [38,39] in which the total uncer-tainty DU in the estimated value of a quantity Q, dependingon the independent variables x1,x2,…..,xn (i.e., Q ¼ f [x1,x2,….,xn]) having individual errors Dx1, Dx2,….,Dxn isgiven by Eq. (4). The combined uncertainty in computingthe performance parameters of BTHE, BSFC, BSFCequiva-
lent, brake specific energy consumption (BSEC) for theentire range of operation has been carried out by takinginto account the uncertainty of measurement of all the per-taining instrumentation necessary for the measurement of the respective variables. The calculation of the same as per this principle has been detailed in Table S-7 [67].
DU ¼
ffiffiffiffiffiffiffiffiffiffiffiffiffiffiffiffiffiffiffiffiffiffiffiffiffiffiffiffiffiffiffiffiffiffiffiffiffiffiffiffiffiffiffiffiffiffiffiffiffiffiffiffiffiffiffiffiffiffiffiffiffiffiffiffiffiffiffiffiffiffiffiffiffiffiffiffiffiffiffiffiffiffiffiffiffiffiffiffiffi@ U
@ x1
D x1
2
þ@ U
@ x2
D x2
2
þ::::::@ U
@ xn
D xn
2s
(4)
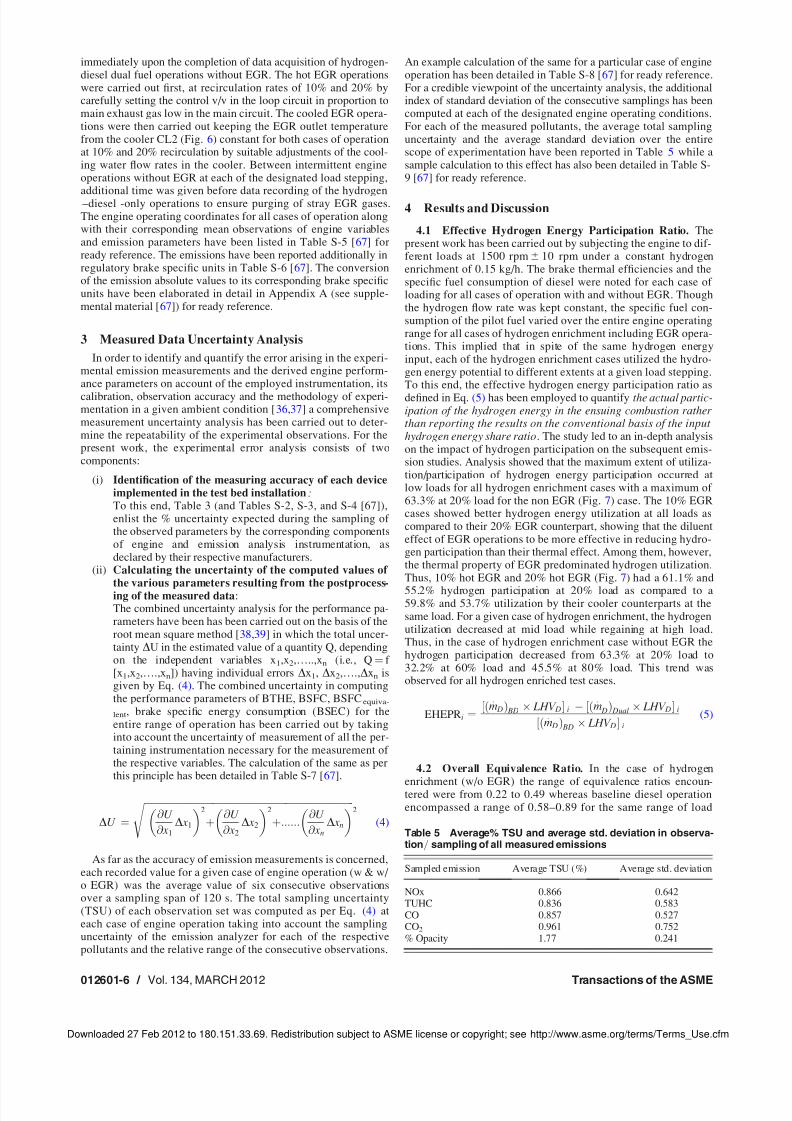
As far as the accuracy of emission measurements is concerned,each recorded value for a given case of engine operation (w & w/ o EGR) was the average value of six consecutive observationsover a sampling span of 120 s. The total sampling uncertainty(TSU) of each observation set was computed as per Eq. (4) ateach case of engine operation taking into account the samplinguncertainty of the emission analyzer for each of the respectivepollutants and the relative range of the consecutive observations.
An example calculation of the same for a particular case of engineoperation has been detailed in Table S-8 [67] for ready reference.For a credible viewpoint of the uncertainty analysis, the additionalindex of standard deviation of the consecutive samplings has beencomputed at each of the designated engine operating conditions.For each of the measured pollutants, the average total samplinguncertainty and the average standard deviation over the entirescope of experimentation have been reported in Table 5 while asample calculation to this effect has also been detailed in Table S-9 [67] for ready reference.
4 Results and Discussion
4.1 Effective Hydrogen Energy Participation Ratio. Thepresent work has been carried out by subjecting the engine to dif-ferent loads at 1500 rpm610 rpm under a constant hydrogenenrichment of 0.15 kg/h. The brake thermal efficiencies and thespecific fuel consumption of diesel were noted for each case of loading for all cases of operation with and without EGR. Thoughthe hydrogen flow rate was kept constant, the specific fuel con-sumption of the pilot fuel varied over the entire engine operatingrange for all cases of hydrogen enrichment including EGR opera-tions. This implied that in spite of the same hydrogen energyinput, each of the hydrogen enrichment cases utilized the hydro-gen energy potential to different extents at a given load stepping.To this end, the effective hydrogen energy participation ratio asdefined in Eq. (5) has been employed to quantify the actual partic-ipation of the hydrogen energy in the ensuing combustion rather than reporting the results on the conventional basis of the input hydrogen energy share ratio. The study led to an in-depth analysison the impact of hydrogen participation on the subsequent emis-sion studies. Analysis showed that the maximum extent of utiliza-tion/participation of hydrogen energy participation occurred atlow loads for all hydrogen enrichment cases with a maximum of 63.3% at 20% load for the non EGR (Fig. 7) case. The 10% EGRcases showed better hydrogen energy utilization at all loads ascompared to their 20% EGR counterpart, showing that the diluenteffect of EGR operations to be more effective in reducing hydro-gen participation than their thermal effect. Among them, however,the thermal property of EGR predominated hydrogen utilization.Thus, 10% hot EGR and 20% hot EGR (Fig. 7) had a 61.1% and
55.2% hydrogen participation at 20% load as compared to a59.8% and 53.7% utilization by their cooler counterparts at thesame load. For a given case of hydrogen enrichment, the hydrogenutilization decreased at mid load while regaining at high load.Thus, in the case of hydrogen enrichment case without EGR thehydrogen participation decreased from 63.3% at 20% load to32.2% at 60% load and 45.5% at 80% load. This trend wasobserved for all hydrogen enriched test cases.
EHEPRi ¼½ðm
: DÞ BD  LHV D i À ½ðm
:
DÞ Dual  LHV D i
½ðm:
DÞ BD Â LHV D i
(5)
4.2 Overall Equivalence Ratio. In the case of hydrogen
enrichment (w/o EGR) the range of equivalence ratios encoun-tered were from 0.22 to 0.49 whereas baseline diesel operationencompassed a range of 0.58–0.89 for the same range of load
Table 5 Average% TSU and average std. deviation in observa-tion= sampling of all measured emissions
Sampled emission Average TSU (%) Average std. deviation
NOx 0.866 0.642TUHC 0.836 0.583CO 0.857 0.527CO2 0.961 0.752% Opacity 1.77 0.241
012601-6 / Vol. 134, MARCH 2012 Transactions of the ASME
Downloaded 27 Feb 2012 to 180.151.33.69. Redistribution subject to ASME license or copyright; see http://www.asme.org/terms/Terms_Use.cfm

8/2/2019 Role of h2 in Emission Reduction
http://slidepdf.com/reader/full/role-of-h2-in-emission-reduction 7/15
variation manifesting the ultralean equivalence ratios under whichhydrogen participation is able to accommodate the entire range of engine operation as compared to diesel. The overall equivalenceratio was calculated according to Eq. (6) established in the worksof Sher et al. [41]. The exceptionally wide flammability limits of hydrogen complemented by its very low ignition energy and highdiffusivity giving its inherent tendency of forming a homogeneousmixture with air easily, empowers it with the exceptional abilityof sustaining combustion at the extreme polarities of equivalence
ratios much beyond the scope of conventional diesel engineoperation.As seen in Fig. 8, hydrogen enrichment was able to stretch the
lean limit of operation to an ultralean limit of 0.21 (diesel hydro-gen operation at 20% load) and to a rich limit of 1.05 (20% cooledEGR operation at 80% load) which was 62.3% (Zone 1) leaner and 18.2% (Zone 4) richer, respectively, than baseline diesel oper-ation at the same loads. Diesel hydrogen operation scored a 62.7%and 44.5% leaner operation than diesel at 20% and 80%load .Theleaning trend reduced to 35.3% and 28.9% (Zones 2 and 3) at40% and 60% loads due to a 2.2% and 3.7% reduction in fresh air induction .This trend persisted for all hydrogen enrichment caseswith the leaning effect reducing at 40% and 60% loading as com-pared to lower (20%) and high loads (80%), showing the suscepti-bility of equivalence ratios at mid loads to the slightest change thehydrogen energy participation. The greatest variation in equiva-lence ratios were observed during cooled 20% EGR operationswhere it registered a 10.3% leaner operation at 20% load whilemid to high loads were met with 52.6%, 45.9%, and 18.2% richer
equivalence ratios as compared to baseline diesel operation at40%, 60%, and 80% engine load, respectively.
/OVERALL ¼
m:
D= m
:
AIRÀ
m:
H
/ H ð ÞST
!/ Dð ÞST
(6)
4.3 Performance Characteristics. In the present study, theparameters of BTHE, BSFCequivalent (diesel) and BSEC have been
analyzed as the indices of the performance characteristics of thehydrogen dual fuel operations.
BSEC as defined in Eq. (7) represents the specific energy con-sumption in developing a given power requirement, the parameter thus gives an indication to the efficiency with which the inputenergy content of the fuels is utilized during combustion. In thepresent study, it was observed that there was a persistent trend of reduction of BSEC with increase in load for a given hydrogenenrichment strategy (w and w/o EGR). This is indicative of theenhanced combustion of conventional diesel combustion onaccount of high flame velocities and high calorific content of theparticipating hydrogen. For the hydrogen enrichment cases w/oEGR and the 10% EGR modes of operation the maximum reduc-tion for each category of enrichment was experienced between 20and 40% load stepping corresponding to the highest hydrogen
energy share. As seen from Fig. 9, hydrogen enrichment w/o EGRregistered a maximum of 13.6% reduction in BSEC (Zone 1) ascompared to diesel at 40% load. The gains in BSEC reduced atmid loads to 10.5% which again increased to 11.4% at 80% load.Among the EGR cases, 10% hot EGR showed the best gains inBSEC with corresponding reductions of 11% (Zone 2) and 10.4%as compared to diesel operation, respectively, at 20% and 40%load while for the 10% cooled EGR strategy(Zone 3), the corre-sponding reductions were 9.5% and 8.8%, respectively.
BSECð KJ = Kw À Hr Þ ¼m:
H Â LHV H þ m:
D Â LHV D
BP(7)
In order to gauge the effect of hydrogen on the specific fuel con-sumption of diesel, the parameter of BSFCequivalent (Eq. (8)) rather than BSFC has been incorporated in the present study primarily toaccount for the participation of two fuels of different calorific con-tent. BSFCequivalent represents the specific fuel consumption of thepilot diesel fuel that would be incurred at a given engine power by
Fig. 7 Variation of EHEPR with load
Fig. 8 Effect of EHEPR on the overall equivalence ratio for allhydrogen enrichment test cases with load as compared tobaseline diesel operation
Fig. 9 Effect of EHEPR on the BSEC for all hydrogen enrich-ment test cases with load as compared to baseline dieseloperation
Journal of Energy Resources Technology MARCH 2012, Vol. 134 / 012601-7
Downloaded 27 Feb 2012 to 180.151.33.69. Redistribution subject to ASME license or copyright; see http://www.asme.org/terms/Terms_Use.cfm

8/2/2019 Role of h2 in Emission Reduction
http://slidepdf.com/reader/full/role-of-h2-in-emission-reduction 8/15
taking into account the calorific content of the participating dualfuel and as such provides a basis of estimating the true gains inthe reduction of the pilot diesel fuel as calculated per Eq. (9).Observations in Fig. 10 yielded that the maximum reductions inpilot diesel consumption occurred at the 40% load stepping for each of the hydrogen enrichment cases (w and w/o EGR) implyingthe optimal diesel spray-air entrainment characteristics of the ex-perimental engine at that load. Hydrogen enrichment w/o EGRregistered the maximum reduction of 41.4% and 39.3% (Zone 1)in specific fuel consumption (SFC) of diesel at 20% and 40% load
stepping while among the EGR operation, 10% hot EGR regis-tered the best SFC reduction potential of 39.5% and 35.8% at thecorresponding loads as compared to baseline diesel operation. Ingeneral, BSFCequivalent decreased with increase of load for a givencategory of hydrogen enrichment. This behavior being consistentwith the fact that participation of hydrogen causes appreciableenhancement and completeness of conventional diesel combustionalong with reduced combustion duration resulting in progressivelylower BSEC and consequently lower diesel equivalent BSFC.
BSFC EQ ð Kg= Kw À Hr Þ ¼m HSð Þi LHV H þ ð1 À m HSÞi  LHV D
LHV D
! BSFCDIESEL½ i (8)
where m HS
ð Þi ¼m:
H
m:
H þ m
:
D i
 100
%SFCDIESEL REDUCTION ¼BSFCDIESEL À BSFC EQ
 Ãi
½BSFCDIESELi
 100 (9)
The observations of BTHE are in accordance with the trends inBSEC, indicative of the superior utilization of input energy owingthe participating hydrogen which tends to shorten the combustionduration with its very high flame velocities such that the maxi-mum share of the released energy during combustion takes placeover a fewer degrees of crank travel than baseline diesel. Themaximum gain of 15.7% in BTHE was registered by hydrogenenrichment w/o EGR at 40% load (Zone 1 in Fig. 10) whileamong the EGR cases 10% EGR operation (Zone 2) as comparedto the 20% EGR counterparts (Zone 3 and 4) registered higher
gains in BTHE on account of lower diluent effect of EGR viz;10% hot and cooled EGR scored a 12.4% and 10.5% gain at 20%load as compared to a corresponding 4.7% and 3.8% increase for the 20% EGR mode at the same load.
4.4 Emission Characteristics
4.4.1 Carbon Dioxide Emissions. In the present study, allcases of hydrogen enrichment exhibited significant reduction inCO2 emissions (Fig. 11) for all loads as compared to baseline die-sel operation. The best reductions were observed for diesel hydro-gen operation without EGR, (Zone 1) with 71%, 44.5%, and40.5% reductions at 20%, 40%, and 80% load, respectively.Among EGR operations the 10% category showed better gains(Zones 2 and 3) as compared to their 20% counterpart, as the dilu-ent effect of EGR operations is less in the 10% category. Among
themselves, however, hot EGR operations scored better gains atall load points thus, 10% hot EGR registered 50%, 31.5%, 39.2%at 20%, 40%, and 80% load as compared to 47.3%, 27.8%, 35%gains in 10% cooled EGR operations and 34.2%, 22.2%, 25.1% atthe same loads during the 20% cooled EGR operations (Zone 4).Closer inspection yields that the best reduction potential with allhydrogen enrichment cases occurred at low loads, this beingattributed to greater hydrogen energy participation in combustionat low loads (Fig. 8), thereby ushering in the benefits of a morecomplete combustion proceeding under lean equivalence ratios,high flame velocities and most pertinently increase of the H/Cratios under such conditions as hydrogen is devoid of any carbonatoms. Observation also yields that that the slightest decrease inhydrogen energy participation at low loads and high loads (except20% EGR operations) cause appreciable variations in the emission
reduction spectra of EGR operations. For example 10% hot EGRsuffers a loss of 19.6% in CO2 reductions as the load is increasedto 40% with only a reduction of 7% in hydrogen energy share.
4.4.2 Carbon Monoxide Emissions. In the present study, allcases of hydrogen enrichment (with and w/o EGR) registeredreductions in CO emissions at all load points as compared to die-sel operation. Hydrogen enrichment w/o EGR (zone 1) registereda remarkable 69.5% (Zone 1 in Fig. 12), 64.2% and 45.8% reduc-tion in CO emissions at 20%, 40%, and 80% load correspondingto 62.7%, 35.3%, and 44.5% leaner equivalence ratios, respec-tively, as compared to baseline diesel operation at the same loads.Moreover, due to the very high flame velocities of the flame frontproduced by the participating hydrogen the combustion durationis decreased and sufficient time is not available to reach equilib-
rium of oxidation of CO to CO2 [42], thereby increasing CO emis-sions in diesel hydrogen operation beyond 40% load.As for the EGR cases, the induction of CO2 and other inert ele-
ments during EGR operation cause inferior fuel air mixing thereby
Fig. 10 Effect of EHEPR on the BTHE and SFC (diesel) for allhydrogen enrichment test cases as compared to baseline dieseloperation
Fig. 11 Effect of EHEPR and overall equivalence ratio on CO2
emissions for all hydrogen enrichment test cases as comparedto baseline diesel operation
012601-8 / Vol. 134, MARCH 2012 Transactions of the ASME
Downloaded 27 Feb 2012 to 180.151.33.69. Redistribution subject to ASME license or copyright; see http://www.asme.org/terms/Terms_Use.cfm

8/2/2019 Role of h2 in Emission Reduction
http://slidepdf.com/reader/full/role-of-h2-in-emission-reduction 9/15
causing combustion to proceed at progressively higher equiva-lence ratios which is indicative of poorer utilization of oxygenand consequently increases fuel rich combustion zones promotingCO emissions. It is interesting to note that even with reducedhydrogen energy participation and equivalence ratios greater thanthat of pure diesel operation; the EGR cases still register an appre-ciable decrease in CO emissions than diesel operation at the sameloads as seen in Zone 3 in Fig. 12. For example, combustion in20% cooled EGR operation proceeds at 52.6%, 45.9%, and 18.2%richer equivalence ratios at 40%, 60%, and 80% load, respec-
tively, but still score a reduction of 46.4%, 26.7%, and 20% of COemissions as compared to pure diesel operation at the same loads.In each of the categories of 10% and 20% EGR operations, thethermal effect predominated, whereby the hot EGR cases scored abetter CO emission reduction characteristics than their cooledcounterparts owing to the better fuel air mixing ,leaner equiva-lence ratios and better combustion characteristics due to reduceddelay periods [43]. It was thus seen that 10% hot EGR (Zone 2)scored 8.7% and 13.3% less of CO emissions than 10% cooledEGR at 40% and 80% load, while 20% hot EGR had 10.7% and5.9% less CO emissions than 20% cooled EGR at the same pointsof loading.
4.4.3 Total Unburnt Hydro Carbon Emissions. Though dieselcombustion proceeds under an overall lean equivalence ratio glob-
ally, local equivalence ratios vary from rich at the fuel dropletcore to very lean at the outermost periphery. As fuel is injectedinto the charge air, it entrains air and diffuses, giving widely vary-ing equivalence ratios. Under such heterogeneous distribution of fuel air entrainment, there exist regions which are unable to initi-ate or sustain combustion and contribute to the phenomena of “over leaning” [44].
Present analysis as seen in Fig. 13 reflected that hydrogenenrichment w/o EGR showed 80%, 60.9% and 57.7% reductionsat 20%, 60%, and 80% load as compared to baseline diesel opera-tion. Gains in TUHC reductions were the greatest at low loads of 20–40% for all cases of hydrogen enrichment. This is attributed tothe exceptional lean burn characteristics of hydrogen which ismanifested more explicitly at low loads where a greater degree of hydrogen energy participation is seen in Fig. 8. Among EGRcases, the thermal quality predominated the reduction of TUHCemissions, this being attributed to the potential of better fuel air mixing and reduced ignition delay on account of higher initialtemperatures during the initial phases of pilot diesel combustion.
Thus, 10% and 20% hot EGR (Fig. 13) were capable of a 51.8%,24.3%, 24.6%, and 40%, 19.1%, 19.2% reduction in TUHC emis-sions as compared to diesel operation at 20, 60, and 80% load,respectively—an improvement of 4.5%, 4.3%, 8.3%, and 5.5%,7.8%, 6.9% over their respective counterparts of 10% and 20%cooled EGR at the same loads.
Hydrogen enrichment tackles the shortcomings of conventionalheterogeneity of typical diesel fuel droplet and air entrainment intwo ways, for one, due to its high diffusivity it overcomes the in-herent heterogeneity of fuel air entrainment of diesel spray andcreates a more homogeneous envelope of air and hydrogen mix-ture around the diesel droplets. Second, hydrogen with its excep-tionally wide flammability limits and low ignition energy,promotes a larger distribution of ignitable points in the entrain-ment during the delay period of the injected diesel pilot, therebyenabling initiation and sustenance of combustion in the zones of very lean or rich diesel droplet and air entrained pockets whichwould have hitherto would have remained as areas of too rich or too lean equivalence ratios to sustain combustion under typicaldiesel combustion. This fact has been corroborated in the worksof Masood et al. [21]. Hydrogen has exceptionally small quench-ing distance (Table S-1 [67]) due to which it can sustain combus-tion in the very small clearances of the crevice volumes andconsequently overcome the inherent limitations of flames pro-duced in engines employing conventional fossil fuels. Moreover the high combustion temperatures experienced during hydrogenenrichment helps oxidize post combustion or residual unburnthydrocarbons efficiently [45]. TUHC emissions encountered inhydrogen enriched combustion as in the present case, are mainlydue to combustion of lubricating oil and residual deposits on cyl-inder walls [46].
4.4.4 Smoke Emissions. In DI diesel engines, exhaust smokelimits the full-load equivalence ratio to about 0.7. This limits theexploitation of the advantages of a compression ignition engine toits fullest potential. Prolonged diffusion combustion periods aris-ing out of poor fresh air entrainment by the injected fuel spraycompounded with high C/O ratios during fuel dehydrogenationand combustion proceeding under rich equivalence ratios at highloads act as precursors to soot formation. Hydrogen enrichmentacts as a soot inhibitor in many ways. Firstly it increases the over-all H/C ratio during the dehydrogenation of the hydrocarbon fuelthereby inhibiting soot nucleation and the high combustion tem-peratures together with the abundance of OH radicals made
Fig. 12 Effect of EHEPR and overall equivalence ratio on COemissions for all hydrogen enrichment test cases as comparedto baseline diesel operation
Fig. 13 Effect of EHEPR on the TUHC emissions for all hydro-gen enrichment test cases with load as compared to baselinediesel operation
Journal of Energy Resources Technology MARCH 2012, Vol. 134 / 012601-9
Downloaded 27 Feb 2012 to 180.151.33.69. Redistribution subject to ASME license or copyright; see http://www.asme.org/terms/Terms_Use.cfm

8/2/2019 Role of h2 in Emission Reduction
http://slidepdf.com/reader/full/role-of-h2-in-emission-reduction 10/15
available through the hydrogen–oxygen reaction mechanism [23]under such hydrogen enrichment operation, act as potent soot oxi-dizers [47]. Hydrogen enrichment enabled a 28.9% and 44.5%leaner operation overall at 60% and 80% load scoring a 43.3%and 41.6% reduction in smoke emissions, respectively, and a max-imum of 64.28% reduction at 40% load compared to baseline die-sel operation as indicated by Zone 1 in Fig. 14. 20% EGRexhibited lesser gains in smoke emissions than the 10% EGRoperations thereby clearly showing the predominance of the dilu-tion effect of EGR [47 – 50]) than the thermal effect on smoke
emissions. Hot 10% EGR operations (Zone 2 in Fig. 14) with itshigher intake temperature of the charge, its ability to prepare abetter fuel air mixing for combustion and lower ignition delay[51] registered the best reduction characteristics among EGRoperations for the entire load range with a maximum of 33.4%reduction at 60% load as compared to baseline diesel but with adecrease of 17.6% at the same load as compared to non EGR die-sel hydrogen operation. The most interesting observation that canbe made in the present study is that even with the penalty of greatly reduced fresh air charge inducted during all EGR opera-tions which gets reflected in richer equivalence ratios than base-line diesel, as for example 20% cooled EGR had a 52.6% and45.9% richer equivalence ratio at 40% and 60% load than dieseloperation alone at the corresponding loads, hydrogen enrichmentstill influenced combustion under such conditions and helped toscore gains in smoke emissions with 7.1% and 10% reductions as
compared to neat diesel operation at the said loads as seen inZone 3 in Fig. 14, as in “smokeless rich diesel combustion” [52]providing a possibility of NOx reduction. Thus, even with EGRoperations under hydrogen enrichment, the range of diesel opera-tion could be extended beyond the equivalence ratios of 0.7–0.9which forms the smoke limited upper range of pure diesel opera-tion with a simultaneous reduction of smoke reduction as com-pared to diesel alone.
4.4.5 NOx Emissions. Ox emissions (which include both NOand NO2 emissions) is the single most dominant pollutant in a typ-ical diesel combustion. The present study showed a drasticincrease of NOx emissions in hydrogen enrichment during nonEGR operation for all load ranges as compared to baseline neatdiesel operation due to the prevalent high peak combustion tem-peratures of hydrogen combustion (as represented by the exhaustgas temperatures) and most pertinently the ultralean equivalenceratios under which the combustion is made to proceed during
hydrogen enrichment as compared to diesel operation is evident inFig. 15. The non EGR hydrogen enrichment case corresponding toZone 1 in Fig. 15 and Zones 1 and 2 in Fig. 16, registered a64.8%, 79.3%, 81.4%, and 49.5% increase at 20%, 40%, 60%,and 80% load complimented by a corresponding 63%, 35%, 29%,and 44% leaner operation and 99.3%, 110%, 108%, and 94.2%higher exhaust temperatures, respectively, as compared to base-line diesel at the same load steppings. In the present work, anattempt has been made to reduce the NOx emissions by the EGRtechnique. The EGR was varied both qualitatively (hot and cold)
and quantitatively to gauge their respective impacts on NOx emis-sions. Observations indicated that 20% EGR under cooled condi-tions (Zone 4 in Fig. 16) was the most effective in reducing theNOx emissions at all loads with a maximum of 12.35% reductionat 80% load as compared to diesel operation with a corresponding18% richer equivalence ratio and a 41.3% reduction as comparedto corresponding hydrogen enrichment w/o EGR.
Ten percentage cooled EGR (Zone 3 in Fig. 16) operation alsoregistered an appreciable decrease of NOx emissions for all loadranges with a maximum of 48.3% at 60% load. Extensive studiesof [47,53 – 57] on the NOx mechanism in hydrogen fuelled internalcombustion engines have unanimously agreed on the predomi-nance of the “thermal NOx” based on the extended Zeldovichmechanism [58]. However, the rate of hydrogen enrichment wasfixed in the present work, thereby providing an opportunity to seg-regate the effects of diesel and hydrogen energy participation on
the NOx emissions. Figure 17 explicitly indicates that at low loads(20–40%) hydrogen participation contributed a major part towardsNOx emissions as compared to the contribution from diesel com-bustion whereas in the medium to high load range it was the pre-mixed phase of diesel combustion that dominated NOx formation.Thus, the present work sheds new light on the possibility of thepredominance of the “ prompt NOx” mechanism in diesel hydro-gen dual fuel operation.
5 Trade-Off Studies
5.1 Opacity—NOx Trade-Off. The use of EGR is not newand studies [43,47,48,59 – 62] carried out on the efficacy of suchEGR techniques have reported the inherent penalty of increasingthe common diesel pollutants of smoke, particulate matter at theexpense of reducing NOx emissions.
The present study revealed contrary results where hydrogenenrichment overcame this inherent penalization and was able to
Fig. 14 Effect of EHEPR and overall equivalence ratio on %opacity for all hydrogen enrichment test cases as compared tobaseline diesel operation
Fig. 15 Effect of overall equivalence ratio and exhaust gastemperature on NOx emissions for all hydrogen enrichment testcases as compared to baseline diesel operation
012601-10 / Vol. 134, MARCH 2012 Transactions of the ASME
Downloaded 27 Feb 2012 to 180.151.33.69. Redistribution subject to ASME license or copyright; see http://www.asme.org/terms/Terms_Use.cfm

8/2/2019 Role of h2 in Emission Reduction
http://slidepdf.com/reader/full/role-of-h2-in-emission-reduction 11/15
score gains in smoke emissions simultaneously with its ability todecrease NOx emissions as compared to diesel operation. ThesmokeÀNOx tradeoff in the present work has been summarized inFigs. 18 and 19. The two frontiers of smoke–NOx tradeoff curveshave been duly labeled D and H for pure diesel and hydrogenenriched operation (w/o EGR) (Fig. 18), respectively, for eachpoint of loading. Upon comparing points REF H and D, the gainsin smoke abatement are quite obvious at low loads for non EGRhydrogen enrichment but with a corresponding drastic increase inNOx emissions (Zone A in Fig. 19) formed at the expense of theopportunity provided by the prevailing ultralean equivalenceratios. All EGR cases lie clustered in the vicinity of 20D exhibit-ing the efficacy of using EGR techniques in reducing NOx emis-sions but with the penalty of increase in smoke emissions asevident from points E20B. At and beyond the 40% loading pointthe tradeoff characteristics starts to show their dependence on thequantity and thermal characteristics of the EGR used. As observed20% EGR under cold conditions were successful in scoring lower smoke and NOx emissions simultaneously as compared to dieselat 40 D.
Inspection of the 60% loading point indicate definite gains inreducing both smoke and NOx emissions as indicated by the E60
A,B,C,D points corresponding to Zone B in Fig. 19. Promoted byricher equivalence ratio operation as compared to diesel 20%cooled EGR 60D was able to score a reduction of 9.2% in NOxalong with a 10% reduction in smoke emissions as compared todiesel operation at 60% load under 48.6% richer equivalence ratiowhile 10% cooled EGR scored a simultaneous reduction of 3.07%and 33.3% in NOx and smoke emissions at the same loads. At80% loading, 20% E80B showed the best reduction potential of a12.3% in NOx along with an 8.3% reduction in smoke emissionswith 49.5% richer equivalence ratio operation. All other EGR
operations were also effective in scoring a comparable NOx emis-sions but reduced smoke emissions at 80% load as compared tobaseline diesel as evident from the points E 80 B, C, D. The studybrings forth an important characteristic of hydrogen enrichment inthat the potential it promises in simultaneously reducing NOxemissions and thus providing opportunities in the exploration of smoke-NOx trade-off domains beyond the scope of normal dieseloperation under EGR operation.
5.2 Other Emission Reduction With Smoke-NOxTrade-Off. Research studies as discussed in Sec. 5.1 on theapplication of EGR in conventional diesel combustion havereported the potential benefits of reducing NOx due to contain-ment of higher peak temperatures and reduced oxygen content onaccount of the thermal and diluent effect of the recirculated
exhaust gases. But the very causes which have been found effec-tive in such NOx containment measures has been seen to inher-ently promote higher TUHC, CO and CO2 emissions than their corresponding diesel operation on account of degraded combus-tion characteristics. Hydrogen enrichment, owing to its superior combustion characteristics of high diffusivity, extremely wideflammability limits, very small quenching distance and high flamevelocities, unfolded new opportunities to address this seeminglyparadoxical objectives. In order to bring forth the trade-off poten-tial the entire emission spectra of TUHC, CO and CO2 have beensuperimposed on the smoke-NOx trade-off platform in Figs.20 – 22, respectively, to capture the potential of hydrogen in itsability to reduce emission even under EGR operation. Zone 1 inthe Figs. 20 – 22 correspond to the non EGR dual fuel operationswith hydrogen proceeding under extremely lean overall equiva-lence ratios and high hydrogen energy shares. Zones 2 in the cor-responding figures indicate the regions of operation under increasing equivalence ratios with reduced hydrogen energyshares as in the cases of 10% EGR operations while the zone 3 isindicative of the potential trade-off areas provided by the uniqueproperties of hydrogen under the 20% EGR operations. 20%cooled EGR was most effective in reducing the NOx emissions by12.3% at 80% load with a corresponding decrease of 12% in
Fig. 16 Effect of EHEPR and overall equivalence ratio on NOxemissions for all hydrogen enrichment test cases as comparedto baseline diesel operation
Fig. 17 Extent of diesel and hydrogen energy participation on NOx emissions for allcases of hydrogen enrichment
Journal of Energy Resources Technology MARCH 2012, Vol. 134 / 012601-11
Downloaded 27 Feb 2012 to 180.151.33.69. Redistribution subject to ASME license or copyright; see http://www.asme.org/terms/Terms_Use.cfm
8/2/2019 Role of h2 in Emission Reduction
http://slidepdf.com/reader/full/role-of-h2-in-emission-reduction 12/15
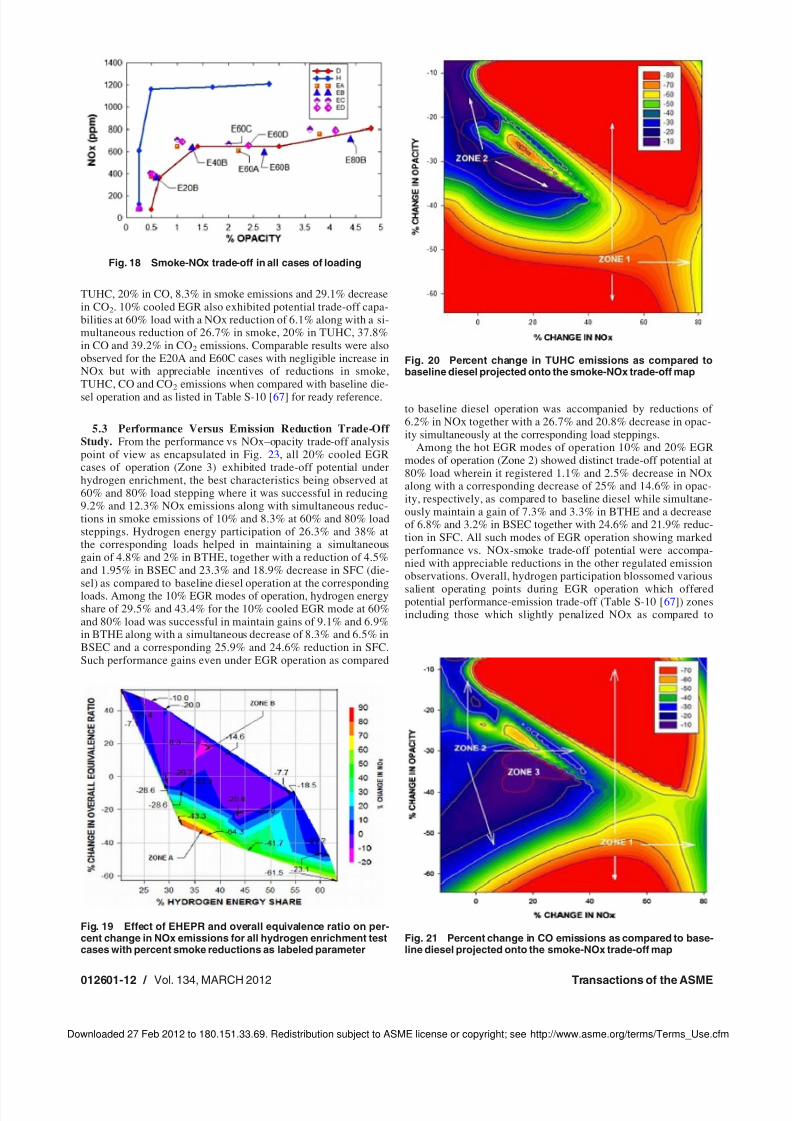
TUHC, 20% in CO, 8.3% in smoke emissions and 29.1% decreasein CO2. 10% cooled EGR also exhibited potential trade-off capa-bilities at 60% load with a NOx reduction of 6.1% along with a si-multaneous reduction of 26.7% in smoke, 20% in TUHC, 37.8%in CO and 39.2% in CO2 emissions. Comparable results were alsoobserved for the E20A and E60C cases with negligible increase inNOx but with appreciable incentives of reductions in smoke,TUHC, CO and CO2 emissions when compared with baseline die-sel operation and as listed in Table S-10 [67] for ready reference.
5.3 Performance Versus Emission Reduction Trade-Off Study. From the performance vs NOx–opacity trade-off analysispoint of view as encapsulated in Fig. 23, all 20% cooled EGRcases of operation (Zone 3) exhibited trade-off potential under hydrogen enrichment, the best characteristics being observed at60% and 80% load stepping where it was successful in reducing9.2% and 12.3% NOx emissions along with simultaneous reduc-tions in smoke emissions of 10% and 8.3% at 60% and 80% loadsteppings. Hydrogen energy participation of 26.3% and 38% atthe corresponding loads helped in maintaining a simultaneousgain of 4.8% and 2% in BTHE, together with a reduction of 4.5%and 1.95% in BSEC and 23.3% and 18.9% decrease in SFC (die-sel) as compared to baseline diesel operation at the correspondingloads. Among the 10% EGR modes of operation, hydrogen energyshare of 29.5% and 43.4% for the 10% cooled EGR mode at 60%and 80% load was successful in maintain gains of 9.1% and 6.9%in BTHE along with a simultaneous decrease of 8.3% and 6.5% inBSEC and a corresponding 25.9% and 24.6% reduction in SFC.Such performance gains even under EGR operation as compared
to baseline diesel operation was accompanied by reductions of 6.2% in NOx together with a 26.7% and 20.8% decrease in opac-ity simultaneously at the corresponding load steppings.
Among the hot EGR modes of operation 10% and 20% EGRmodes of operation (Zone 2) showed distinct trade-off potential at80% load wherein it registered 1.1% and 2.5% decrease in NOxalong with a corresponding decrease of 25% and 14.6% in opac-ity, respectively, as compared to baseline diesel while simultane-ously maintain a gain of 7.3% and 3.3% in BTHE and a decreaseof 6.8% and 3.2% in BSEC together with 24.6% and 21.9% reduc-tion in SFC. All such modes of EGR operation showing markedperformance vs. NOx-smoke trade-off potential were accompa-nied with appreciable reductions in the other regulated emissionobservations. Overall, hydrogen participation blossomed various
salient operating points during EGR operation which offeredpotential performance-emission trade-off (Table S-10 [67]) zonesincluding those which slightly penalized NOx as compared to
Fig. 18 Smoke-NOx trade-off in all cases of loading
Fig. 19 Effect of EHEPR and overall equivalence ratio on per-cent change in NOx emissions for all hydrogen enrichment testcases with percent smoke reductions as labeled parameter
Fig. 20 Percent change in TUHC emissions as compared tobaseline diesel projected onto the smoke-NOx trade-off map
Fig. 21 Percent change in CO emissions as compared to base-line diesel projected onto the smoke-NOx trade-off map
012601-12 / Vol. 134, MARCH 2012 Transactions of the ASME
Downloaded 27 Feb 2012 to 180.151.33.69. Redistribution subject to ASME license or copyright; see http://www.asme.org/terms/Terms_Use.cfm

8/2/2019 Role of h2 in Emission Reduction
http://slidepdf.com/reader/full/role-of-h2-in-emission-reduction 13/15
baseline diesel but offered appreciable gains in all other emissionand performance indices under study such as the 10CE20,10CE40, 10HE60, 20HE60 categories of EGR operation asdetailed in Table S-10 [67], thereby providing a unique opportu-nity to promote the use of EGR for the containment of NOx with-out suffering the penalization of higher smoke, hydrocarbon or carbon monoxide emissions as experienced in conventional dieseloperation subjected to similar NOx containment measures. Thepotential of hydrogen in enhancing conventional diesel combus-tion and establishing itself as a credible agent in providing a dis-tinct advantage under conventional EGR operation is thus evidentfrom the observations enlisted above.
6 Conclusion
The present study establishes an alternate and cost effectiveelectromechanical actuation system for hydrogen injection in lieu
of prevalent electronic crank angle synchronized injection sys-tems. Observations yielded that hydrogen enrichment operationswithout EGR provided high incentives of emission reductionunder all cases of loading along with sharp decrease in BSEC andappreciable gains in brake thermal efficiency. New light has beenshed on the role of hydrogen in NOx emissions with the findingsof the dominance of prompt NOx mechanism in mid to high loads.The parameter of EHEPR also gives a new insight to the actualhydrogen energy participation of such dual fuel operation at dif-ferent test case settings. 10% and 20% cooled EGR exhibited
strong potential in providing trade-off operating points with theincentives of reducing smoke and NOx simultaneously. Suchtrade-off was complimented with simultaneous reduction advant-age of TUHC, CO, CO2, BSEC along with sustained gains inBTHE as compared to baseline diesel operation. Experimentationthus revealed the potential of hydrogen enrichment as an efficientinstrument to overcome the inherent paradox of simultaneouslyreducing NOx and other emissions and penalization of perform-ance characteristics in conventional diesel operation under EGRand open up avenues to exploit the advantages of compressionignition engines to their fullest potential hitherto being con-strained by EGR operation.
Future Scope of Work
The present work has been carried out at a particular flow rateof hydrogen inducted of hydrogen induction and thus provides op-portunity to investigate and extend the findings of the present pilotstudy further under varying flow rates of hydrogen. Moreover, inthe present scope of experimentation, the injection of hydrogencommenced at a fixed crank angle with respect to IVO for a fixedduration of induction as dictated by the inlet cam profile and itsdwell period, respectively. Thus, the present study can beextended to an in-depth optimization study in finding the optimaltrade-off zones of the parameters under study by varying the SOItimings and induction period of hydrogen for different cam pro-files or dedicated electronic hydrogen injection systems.
Nomenclature
PM ¼ particulate matter DPF ¼ diesel particulate filter SCR ¼ selective catalytic reductionEGR ¼ exhaust gas recirculation
BSEC ¼ brake specific energy consumptionW and W/o ¼ with and without
LNT ¼ lean NOx trapDi ¼ inlet manifold diameter (INNER)
TMHI ¼ timed manifold hydrogen injectionV/V ¼ valve
MOP¼ maximum opening pointIVO¼ inlet valve openingIVC¼ inlet valve closing
DAQ ¼ data acquisitionGUI ¼ graphical user interface
BSFC ¼ brake specific fuel consumptionARAI ¼ Automotive Research Association of India *[*ISO9001:2008, ISO 14001:2004, OHSAS 18001:2007certified and NABL Accreditation as per (ISO/IEC17025:2005), (ISO/IEC 17025:2005), (ISO/IEC17025:2005), (ISO/IEC 17025:2005), (ISO/IEC17025:2005), (ISO/IEC 17025:2005), (ISO/IEC17025:2005)]
TUHC ¼ total unburnt hydrocarbonPPM ¼ parts per million
BTHE ¼ brake thermal efficiencyTSU ¼ total sampling uncertainty
EHEPR¼ effective hydrogen energy participation ratioC/O ¼ carbon to oxygen ratio
Fig. 22 Percent change in CO2 emissions as compared tobaseline diesel projected onto the smoke-NOx trade-off map
Fig. 23 Percent change in brake thermal efficiency as com-pared to baseline diesel with corresponding SFC reduction as alabeled parameter on the smoke-NOx trade-off map
Journal of Energy Resources Technology MARCH 2012, Vol. 134 / 012601-13
Downloaded 27 Feb 2012 to 180.151.33.69. Redistribution subject to ASME license or copyright; see http://www.asme.org/terms/Terms_Use.cfm
8/2/2019 Role of h2 in Emission Reduction
http://slidepdf.com/reader/full/role-of-h2-in-emission-reduction 14/15
H/C ¼ hydrogen to carbon ratioUHC¼ unburnt hydrocarbon
m:
D ¼ mass flow rate of diesel (kg/hr)BD ¼ baseline diesel operation
DUAL ¼ dual fuel operation with hydrogen enrichment LHV D ¼ lower heating value of diesel
i ¼ test case under consideration/ OVERALL ¼ overall equivalence ratio
m:
AIR¼ mass flow rate of air (kg/h)
m:
H ¼ mass flow rate of hydrogen (kg/hr)
/ H ð ÞST ¼ stoichiometric equivalence ratio of hydrogen in air / Dð ÞST ¼ stoichiometric equivalence ratio of diesel fuel inair
LHV H ¼ lower heating value of hydrogenBP ¼ brake power developed
m HS ¼ % mass share of inducted hydrogenBSFCDIESEL ¼ brake specific fuel consumption of diesel calcu-
lated as per the actual consumption rate reportedby the fuel burette
SFC ¼ specific fuel consumptionEMA ¼ electro mechanical actuator MFC ¼ mass flow controller
LPRR ¼ low pressure reducer regulator HPRR ¼ high pressure reducer regulator
CT ¼ condensate trapPF ¼ particulate filter
DH ¼ diesel hydrogen operation w/o EGREA ¼ E10C ¼ 10% Cooled EGR operationEB ¼ E20C ¼ 20% Cooled EGR operationEC ¼ E10H ¼ 10% Hot EGR operationED ¼ E20H ¼ 20% Hot EGR operation
References[1] Rexeis, M., and Hausberger, S., 2009, “Trend of Vehicle Emission Levels Until
2020—Prognosis Based on Current Vehicle Measurements and Future EmissionLegislation,” Atmos. Environ., 43(31), pp. 4689–4698.
[2] Int Panis, L., Beckx, C., Broekx, S., De Vlieger, I., Schrooten, L., Degraeuwe,B., and Pelkmans, L., 2011, “Pm, NOx and CO 2 Emission Reductions fromSpeed Management Policies in Europe,” Transp. Policy, 18(1), pp. 32–37.
[3] Goyal, P., Jaiswal, N., Kumar, A., Dadoo, J. K., and Dwarakanath, M., 2010,“Air Quality Impact Assessment of NOx and Pm Due to Diesel Vehicles inDelhi,” Transp. Res. Part D, 15(5), pp. 298–303.
[4] Alkemade, U. G., and Schumann, B., 2006, “Engines and Exhaust after Treat-
ment Systems for Future Automotive Applications,” Solid State Ionics,177(26–32), pp. 2291–2296.
[5] Skalska, K., Miller, J. S., and Ledakowicz, S., 2010, “Trends in NOx Abate-ment: A Review,” Sci. Total Environ., 408(19), pp. 3976–3989.
[6] Castoldi, L., Matarrese, R., Lietti, L., and Forzatti, P., 2006, “Simultaneous Re-moval of NOx and Soots on Pt-Ba/Al2O3 Nsr Catalysts,” Appl. Catal., B,
64(1–2), pp. 25–34.[7] Heeb, N. V., Zimmerli, Y., Czerwinski, J., Schmid, P., Zennegg, M., Haag, R.,
Seiler, C., Wichser, A., Ulrich, A., Honegger, P., Zeyer, K., Emmenegger, L.,Mosimann, T., Kasper, M., and Mayer, A., 2011, “Reactive Nitrogen Com-pounds (RNCS) in Exhaust of Advanced PM-NOx Abatement Technologies for Future Diesel Applications,” Atmos. Environ., 45(18), pp. 3203–3209.
[8] Ishida, M., Yamamoto, S., Ueki, H., and Sakaguchi, D., 2010, “RemarkableImprovement of NOx-Pm Trade-Off in a Diesel Engine by Means of Bioethanoland EGR,” Energy, 35(12), pp. 4572–4581.
[9] Song, C.-L., Bin, F., Tao, Z.-M., Li, F.-C., and Huang, Q.-F., 2009,“Simultaneous Removals of NOx, Hc and Pm from Diesel Exhaust Emissionsby Dielectric Barrier Discharges,” J. Hazard. Mater., 166(1), pp. 523–530.
[10] Liu, J., Zhao, Z., Xu, C.-M., Duan, A.-J., Meng, T., and Bao, X.-J., 2007,
“Simultaneous Removal of NOx and Diesel Soot Particulates over NanometricLa2-Xkxcuo4 Complex Oxide Catalysts,” Catal. Today, 119(1–4), pp.267–272.
[11] Sullivan, J. A., Keane, O., and Cassidy, A., 2007, “Beneficial and ProblematicInteractions between NOx Trapping Materials and Carbonaceous ParticulateMatter,” Appl. Catal., B, 75(1–2), pp. 102–106.
[12] Theinnoi, K., Tsolakis, A., Sitshebo, S., Cracknell, R. F., and Clark, R. H.,2010, “Fuels Combustion Effects on a Passive Mode Silver/Alumina HC-SCRCatalyst Activity in Reducing NOx,” Chem. Eng. J., 158(3), pp. 468–473.
[13] Szwaja, S., and Grab-Rogalinski, K., 2009, “Hydrogen Combustion in a Com-pression Ignition Diesel Engine,” Int. J. Hydrogen Energy, 34(10), pp.4413–4421.
[14] Lilik, G. K., Zhang, H., Herreros, J. M., Haworth, D. C., and Boehman, A. L.,2010, “Hydrogen Assisted Diesel Combustion,” Int. J. Hydrogen Energy, 35(9),pp. 4382–4398.
[15] Wallace, J. S., and Ward, C. A., 1983, “Hydrogen as a Fuel,” Int. J. HydrogenEnergy, 8(4), pp. 255–268.
[16] White, C. M., Steeper, R. R., and Lutz, A. E., 2006, “The Hydrogen-Fueled In-ternal Combustion Engine: A Technical Review,” Int. J. Hydrogen Energy,31(10), pp. 1292–1305.
[17] Haragopala Rao, B., Shrivastava, K. N., and Bhakta, H. N., 1983, “Hydrogenfor Dual Fuel Engine Operation,” Int. J. Hydrogen Energy, 8(5), pp. 381–384.
[18] Ikegami, M., Miwa, K., and Shioji, M., 1982, “A Study of HydrogenFuelled Compression Ignition Engines,” Int. J. Hydrogen Energy, 7(4), pp.341–353.
[19] Lee, C. S., Lee, K. H., and Kim, D. S., 2003, “Experimental and NumericalStudy on the Combustion Characteristics of Partially Premixed Charge Com-pression Ignition Engine With Dual Fuel,” Fuel, 82(5), pp. 553–560.
[20] Mansour, C., Bounif, A., Aris, A., and Gaillard, F., 2001, “Gas-Diesel (Dual-Fuel) Modeling in Diesel Engine Environment,” Int. J. Therm. Sci., 40(4), pp.
409–424.[21] Masood, M., Ishrat, M. M., and Reddy, A. S., 2007, “Computational Combus-
tion and Emission Analysis of Hydrogen-Diesel Blends With ExperimentalVerification,” Int. J. Hydrogen Energy, 32(13), pp. 2539–2547.
[22] Liu, Z., and Karim, G. A., 1995, “Knock Characteristics of Dual-FuelEngines Fuelled With Hydrogen Fuel,” Int. J. Hydrogen Energy, 20(11), pp.919–924.
[23] Das, L. M., 1996, “Hydrogen-Oxygen Reaction Mechanism and Its Implicationto Hydrogen Engine Combustion,” Int. J. Hydrogen Energy, 21(8), pp.703–715.
[24] Yi, H. S., Min, K., and Kim, E. S., 2000, “The Optimised Mixture Formationfor Hydrogen Fuelled Engines,” Int. J. Hydrogen Energy, 25(7), pp. 685–690.
[25] Das, L. M., Gulati, R., and Gupta, P. K., 2000, “Performance Evaluation of aHydrogen-Fuelled Spark Ignition Engine Using Electronically ControlledSolenoid-Actuated Injection System,” Int. J. Hydrogen Energy, 25(6), pp.569–579.
[26] Zhenzhong, Y., Jianqin, W., Zhuoyi, F., and Jinding, L., 2002, “An Investiga-tion of Optimum Control of Ignition Timing and Injection System in an in-Cylinder Injection Type Hydrogen Fueled Engine,” Int. J. Hydrogen Energy,
27(2), pp. 213–217.[27] Hari Ganesh, R., Subramanian, V., Balasubramanian, V., Mallikarjuna, J. M.,Ramesh, A., and Sharma, R. P., 2008, “Hydrogen Fueled Spark Ignition Engine
With Electronically Controlled Manifold Injection: An Experimental Study,”Renewable Energy, 33(6), pp. 1324–1333.
[28] Lilik, G, 2007, “Mixing Length of Hydrogen in an Air Intake,” Retrieved from:http://www.ems.psu.edu/~elsworth/courses/EGEE520/2007Deliverables/ Reports/Greg_Lilik_Final_EGEE_520v6.pdf - on 20th July 2011.
[29] Hirani, H., and Manjunatha, C. S., 2007, “Performance Evaluation of a Magne-torheological Fluid Variable Valve,” Proc. Inst. Mech. Eng., Part D (J. Auto-mob. Eng.), 221(1), pp. 83–93.
[30] IS 10000(Part 5):1980 (Reaffirmed Aug 2010; Amendments: 1): Methods of tests for internal combustion engines: Part 5 Preparation for tests and measure-ments for wear.
[31] IS 10000(Part 8):1980 (Reaffirmed Aug 2010; Amendments: 1): Methods of tests for internal combustion engines: Part 8 Performance tests.
[32] IS 10000(Part 6):1980 (Reaffirmed Aug 2010; Amendments:1):Methods of tests
for internal combustion engines: Part 6 Recording of test results.
[33] Kim, J. N., Kim, H. Y., Yoon, S. S., Sohn, J. H., and Kim, C. R., 2009,
“Numerical Studies on the Mixing Characteristics of Exhaust Gas RecirculationGases With Air, and Their Dependence on System Geometries in Four-Cylinder Engine Applications,” Proc. Inst. Mech. Eng., Part D (J. Automob.Eng.), 223(4), pp. 585–597.
[34] Agarwal, A. K., Singh, S. K., Sinha, S., and Shukla, M. K., 2004, “Effect of EGR on the Exhaust Gas Temperature and Exhaust Opacity in CompressionIgnition Engines,” Sadhana, 29, pp. 275–284.
[35] Pradeep, V., and Sharma, R. P., 2007, “Use of Hot EGR for NOx Control in a
Compression Ignition Engine Fuelled With Bio-Diesel from Jatropha Oil,”
Renewable Energy, 32(7), pp. 1136–1154.
[36] Mani, M., and Nagarajan, G., 2009, “Influence of Injection Timing on Perform-ance, Emission and Combustion Characteristics of a Di Diesel Engine Runningon Waste Plastic Oil,” Energy, 34(10), pp. 1617–1623.
[37] Devan, P. K., and Mahalakshmi, N. V., 2009, “Performance, Emission andCombustion Characteristics of Poon Oil and Its Diesel Blends in a Di DieselEngine,” Fuel, 88(5), pp. 861–867.
[38] Doebelin, E. O., 2004, Measurement Systems: Application and Design,McGraw-Hill.
[39] Rakopoulos, C. D., Dimaratos, A. M., Giakoumis, E. G., and Rakopoulos, D.
C., 2010, “Investigating the Emissions During Acceleration of a TurbochargedDiesel Engine Operating With Bio-Diesel or N-Butanol Diesel Fuel Blends,”
Energy, 35(12), pp. 5173–5184.[40] Calculation of Precision, Bias, and Method Detection Limit for Chemical and
Physical Measurements, Chap. 5[41] Sher, E., and Hacohen, Y., 1987, “On the Modeling of a Si 4-Stroke Cycle
Engine Fueled With Hydrogen-Enriched Gasoline,” Int. J. Hydrogen Energy,
12(11), pp. 773–781.[42] Abdel-Rahman, A. A., 1998, “On the Emissions from Internal-Combustion
Engines: A Review,” Int. J. Energy Res., 22(6), pp. 483–513.[43] Ladommatos, N., Abdelhalim, S., and Zhao, H., 1998, “Control of Oxides of
Nitrogen from Diesel Engines Using Diluents While Minimising the Impact on
Particulate Pollutants,” Appl. Therm. Eng., 18(11), pp. 963–980.[44] Sher, E., 1998, Handbook of Air Pollution from Internal Combustion Engines:
Pollutant Formation and Control, Academic Press, Chestnut Hill, MA.[45] Sahoo, B. B., Sahoo, N., and Saha, U. K., “Effect of Engine Parameters and
Type of Gaseous Fuel on the Performance of Dual-Fuel Gas Diesel Engines–a
012601-14 / Vol. 134, MARCH 2012 Transactions of the ASME
Downloaded 27 Feb 2012 to 180.151.33.69. Redistribution subject to ASME license or copyright; see http://www.asme.org/terms/Terms_Use.cfm
8/2/2019 Role of h2 in Emission Reduction
http://slidepdf.com/reader/full/role-of-h2-in-emission-reduction 15/15
Critical Review,” Renewable and Sustainable Energy Rev., 13(6–7), pp.1151–1184.
[46] Gomes Antunes, J. M., Mikalsen, R., and Roskilly, A. P., 2008, “An Investiga-tion of Hydrogen-Fuelled HCCI Engine Performance and Operation,” Interna-tional Journal of Hydrogen Energy, 33(20), pp. 5823–5828.
[47] Das, L. M., 1991, “Exhaust Emission Characterization of Hydrogen-OperatedEngine System: Nature of Pollutants and Their Control Techniques,” Int. J.Hydrogen Energy, 16(11), pp. 765–775.
[48] Abd-Alla, G. H., Soliman, H. A., Badr, O. A., and Abd-Rabbo, M. F., 2001,“Effects of Diluent Admissions and Intake Air Temperature in Exhaust GasRecirculation on the Emissions of an Indirect Injection Dual Fuel Engine,”Energy Convers. Manage., 42(8), pp. 1033–1045.
[49] Hountalas, D. T., Mavropoulos, G. C., and Binder, K. B., 2008, “Effect of Exhaust
Gas Recirculation (EGR) Temperature for Various EGR Rates on Heavy Duty DiDiesel Engine Performance and Emissions,” Energy, 33(2), pp. 272–283.
[50] Pirouzpanah, V., Khoshbakhti Saray, R., Sohrabi, A., and Niaei, A., 2007,“Comparison of Thermal and Radical Effects of EGR Gases on CombustionProcess in Dual Fuel Engines at Part Loads,” Energy Convers. Manage., 48(7),pp. 1909–1918.
[51] Angrill, O., Geitlinger, H., Streibel, T., Suntz, R., and Bockhorn, H., 2000,“Influence of Exhaust Gas Recirculation on Soot Formation in DiffusionFlames,” Proc. Combus. Inst., 28(2), pp. 2643–2649.
[52] Kazuhiro Akihama, Y. “Mechanism of the Smokeless Rich Diesel Combustionby Reducing Temperaturek,” SAE Paper No. 2001-01-0655.
[53] Frassoldati, A., Faravelli, T., and Ranzi, E., 2006, “A Wide Range ModelingStudy of NOx Formation and Nitrogen Chemistry in Hydrogen Combustion,”Int. J. Hydrogen Energy, 31(15), pp. 2310–2328.
[54] Heffel, J. W., 2003, “NOx Emission and Performance Data for a HydrogenFueled Internal Combustion Engine at 1500 Rpm Using Exhaust GasRecirculation,” Int. J. Hydrogen Energy, 28(8), pp. 901–908.
[55] Knop, V., Benkenida, A., Jay, S., and Colin, O., 2008, “Modelling of Combus-tion and Nitrogen Oxide Formation in Hydrogen-Fuelled Internal Combustion
Engines Within a 3D CFD Code,” Int. J. Hydrogen Energy, 33(19), pp.5083–5097.
[56] Sinclair, L. A., and Wallace, J. S., 1984, “Lean Limit Emissions of Hydrogen-Fueled Engines,” Int. J. Hydrogen Energy, 9(1–2), pp. 123–128.
[57] Skottene, M., and Rian, K. E., 2007, “A Study of NOx Formation in HydrogenFlames,” Int. J. Hydrogen Energy, 32(15), pp. 3572–3585.
[58] Zeldovich, Y. B., 1946, “The Oxidation of Nitrogen in Combustion andExplosions,” Acta Physicochim, URSS, 21, p. 577.
[59] Maiboom, A., Tauzia, X., and Hetet, J.-F., 2008, “Experimental Study of Var-ious Effects of Exhaust Gas Recirculation (EGR) on Combustion and Emis-sions of an Automotive Direct Injection Diesel Engine,” Energy, 33(1), pp.22–34.
[60] Safari, H., Jazayeri, S. A., and Ebrahimi, R., 2009, “Potentials of NOx EmissionReduction Methods in Si Hydrogen Engines: Simulation Study,” Int. J. Hydro-gen Energy, 34(2), pp. 1015–1025.
[61] Selim, M. Y. E., 2003, “Effect of Exhaust Gas Recirculation on Some CombustionCharacteristics of Dual Fuel Engine,” Energy Convers. Manage., 44(5), pp. 707–721.
[62] Subramanian, V., Mallikarjuna, J. M., and Ramesh, A., 2007, “Intake ChargeDilution Effects on Control of Nitric Oxide Emission in a Hydrogen Fueled SiEngine,” Int. J. Hydrogen Energy, 32(12), pp. 2043–2056.
[63] Kannan, G. R., and Anand, R., 2011, “Experimental Investigation on DieselEngine With Diestrol-Water Micro Emulsions,” Energy, 36(3), pp.1680–1687.
[64] Kannan, G. R., Karvembu, R., and Anand, R., 2011, “Effect of Metal BasedAdditive on Performance Emission and Combustion Characteristics of DieselEngine Fuelled With Biodiesel,” Appl. Energy, 88(11), pp. 3694–3703.
[65] Pandian, M., Sivapirakasam, S. P., and Udayakumar, M., 2011, “Investigationon the Effect of Injection System Parameters on Performance and EmissionCharacteristics of a Twin Cylinder Compression Ignition Direct InjectionEngine Fuelled With Pongamia Biodiesel-Diesel Blend Using Response Sur-face Methodology,” Appl. Energy, 88(8), pp. 2663–2676.
[66] Rehman, A., Phalke, D. R., and Pandey, R., 2011, “Alternative Fuel for GasTurbine: Esterified Jatropha Oil-Diesel Blend,” Renewable Energy, 36(10), pp.2635–2640.
[67] See supplemental material at http://dx.doi.org/10.1115/1.4005246 for tables andAppendix.
Journal of Energy Resources Technology MARCH 2012, Vol. 134 / 012601-15