securities and exchange...
TRANSCRIPT

UNITED STATESSECURITIES AND EXCHANGE COMMISSION
Washington, D.C. 20549
FORM 6-KReport of Foreign Private Issuer
Pursuant to Rule 13a-16 or 15d-16 of theSecurities Exchange Act of 1934
For the month of September, 2018
Commission File Number 001-36671
Atento S.A.(Translation of Registrant's name into English)
4, rue Lou Hemmer, L-1748 Luxembourg Findel
Grand Duchy of Luxembourg (Address of principal executive office)
Indicate by check mark whether the registrant files or will file annual reports under cover of Form 20-F or Form 40-F.Form 20-F: xForm 40-F: o Indicate by check mark if the registrant is submitting the Form 6-K in paper as permitted by Regulation S-T Rule 101(b)(1):Yes: oNo: x Note: Regulation S-T Rule 101(b)(1) only permits the submission in paper of a Form 6-K if submitted solely to provide an attached annual report to securityholders. Indicate by check mark if the registrant is submitting the Form 6-K in paper as permitted by Regulation S-T Rule 101(b)(7):Yes: oNo: x Note : Regulation S-T Rule 101(b)(7) only permits the submission in paper of a Form 6-K if submitted to furnish a report or other document that the registrantforeign private issuer must furnish and make public under the laws of the jurisdiction in which the registrant is incorporated, domiciled or legally organized (theregistrant’s “home country”), or under the rules of the home country exchange on which the registrant’s securities are traded, as long as the report or otherdocument is not a press release, is not required to be and has not been distributed to the registrant’s security holders, and, if discussing a material event, has alreadybeen the subject of a Form 6-K submission or other Commission filing on EDGAR.

ATENTO S.A.INDEX
Financial InformationFor the Three and Nine Months Ended September 30, 2018
PART I - PRESENTATION OF FINANCIAL AND OTHER INFORMATION 3SELECTED HISTORICAL FINANCIAL INFORMATION 6SUMMARY CONSOLIDATED HISTORICAL FINANCIAL INFORMATION 7MANAGEMENT’S DISCUSSION AND ANALYSIS OF FINANCIAL CONDITION AND RESULTS OF OPERATIONS 13UNAUDITED INTERIM CONDENSED CONSOLIDATED FINANCIAL INFORMATION FOR THE THREE AND NINE MONTHSENDED SEPTEMBER 30, 2018 32PART II - OTHER INFORMATION 6 4LEGAL PROCEEDINGS 64RISK FACTORS 64

PART I - PRESENTATION OF FINANCIAL AND OTHER INFORMATION
Atento S.A. (“Atento”, the “Company”, “we” or the “Organization”) was formed as a direct subsidiary of Atalaya Luxco Topco S.C.A. (“Topco”). InApril 2014, Topco also incorporated Atalaya Luxco PIKCo S.C.A. (“PikCo”) and on May 15, 2014 Topco contributed to PikCo: (i) all of its equity interests in itsthen direct subsidiary, Atalaya Luxco Midco S.à.r.l. (“Midco”), the consideration for which was an allocation to PikCo’s account “capital contributions notremunerated by shares” (the “Reserve Account”) equal to €2 million, resulting in Midco becoming a direct subsidiary of PikCo; and (ii) all of its debt interests inMidco (comprising three series of preferred equity certificates (the “Original Luxco PECs”)), the consideration for which was the issuance by PikCo to Topco ofpreferred equity certificates having an equivalent value. On May 30, 2014, Midco authorized the issuance of, and PikCo subscribed for, a fourth series of preferredequity certificates (together with the Original Luxco PECs, the “Luxco PECs”).
In connection with the completion of Atento’s initial public offering (the “IPO”) in October 2014, Topco transferred its entire interest in Midco (€31,000of share capital) to PikCo, the consideration for which was an allocation of €31,000 to PikCo’s Reserve Account. PikCo then contributed all of the Luxco PECs toMidco (the “Contribution”), the consideration for which was an allocation to Midco’s Reserve Account equal to the value of the Luxco PECs immediately prior tothe Contribution. Upon completion of the Contribution, the Luxco PECs were capitalized by Midco. PikCo then transferred the remainder of its interest in Midco(€12,500 of share capital) to the Company, in consideration for which the Company issued two new shares of its capital stock to PikCo. The difference between thenominal value of these shares and the value of Midco’s net equity will be allocated to the Company’s share premium account. As a result of this transfer, Midcobecame a direct subsidiary of the Company. The Company completed a share split (the “Share Split”) whereby it issued approximately 2,219.212 ordinary sharesfor each ordinary share outstanding as of September 3, 2014. The foregoing is collectively referred as the “Reorganization Transaction”.
On October 7, 2014, we completed our IPO and issued 4,819,511 ordinary shares at a price of $15.00 per share. As a result of the IPO, the Share Split andthe Reorganization Transaction, we had 73,619,511 ordinary shares outstanding and owned 100% of the issued and outstanding share capital of Midco, as ofNovember 9, 2015.
On August 4, 2015, our Board of Directors (“the Board”) approved a share capital increase and issued 131,620 shares, increasing the number ofoutstanding shares to 73,751,131.
On July 28, 2016, the Board approved a share capital increase and issued 157,925 shares, increasing the number of outstanding shares to 73,909,056.
AcquisitionandDivestmentTransactions
On August 4, 2016, the Company through its direct subsidiary Atento Teleservicios España entered into an agreement (the “Share Sale and PurchaseAgreement”) with Intelcia Group, S.A. for the sale of 100% of Atento Morocco S.A., encompassing Atento’s operations in Morocco providing services to theMoroccan and French markets (the “Morocco Transaction”). The Morocco Transaction was consummated on September 30, 2016, upon receipt of regulatoryapproval. Atento’s operations in Morocco, which provide services to the Spanish market, are excluded from the Morocco Transaction and will continue operatingas part of Atento Spain.
On September 2, 2016, the Company through its direct subsidiary Atento Brasil acquired 81.49%, the controlling interest of RBrasil Soluções S.A.(RBrasil).
On May 9, 2017, we announced an extended partnership with Itaú, a leading financial institution in Brazil, through which we will leverage the industry-leading capabilities of RBrasil and Atento Brasil S.A. (“Atento Brasil”) to serve Itaú’s increasing demand for end-to-end collections solutions, customer serviceand back office services.
On June 9, 2017, the Company, through its subsidiary, Atento Brasil, acquired 50 . 00002% of Interfile Serviços de BPO Ltda. and 50.00002% ofInterservicer – Serviços em Crédito Imobiliário Ltda. (jointly, “Interfile”), a leading provider of BPO services and solutions, including credit origination, for thebanking and financial services sector in Brazil. Through this acquisition, we expect to be able to expand our capabilities in the financial services segment,especially in credit origination, accelerate our penetration into higher value-added solutions, strengthen our leadership position in the Brazilian market and facilitatethe expansion of our credit origination segment into other Latin American markets.
3

On June 30, 2017, we announced the signing of a strategic partnership and the acquisition of a minority stake in Keepcon, a leading provider of semantictechnology-based automated customer experience management, through our subsidiary Contact US Teleservices Inc. The acquisition of a minority stake inKeepcon follows our overall strategy to develop and expand our digital capabilities. Our goal is to integrate all of our digital assets to generate additional value forclients and drive growth across verticals and geographies. We aim to turn the business disruption generated by the digital revolution into differentiated customerexperience solutions generating competitive advantages for customers. We expect that the investment in Keepcon will expand the artificial intelligence andautomatization capabilities of our omnichannel platform.
OtherTransactions
On August 10, 2017, Atento completed a renegotiation transaction of its financing structure throughout its subsidiary Atento Luxco 1. The new financingstructure implied an offering of US$400.0 million aggregate principal amount of 6.125% Senior Secured Notes due 2022 (the “Offering”). Atento used the netproceeds from the Offering, together with cash on hand, to redeem all of the Issuer’s outstanding 7.375% Senior Secured Notes due 2020 and all of the existingdebentures due 2019 of its subsidiary Atento Brasil. The Senior Secured Notes are guaranteed on a senior secured basis by certain of Atento’s wholly-ownedsubsidiaries on a joint and several basis.
On August 18, 2017, Atento filed a Form F-3 with the SEC, for up to $200,000,000 Ordinary Shares and 62,660,015 Ordinary Shares Offered by theselling shareholder. As a consequence, the selling shareholder may offer and sell from time to time up to 62,660,015 of Ordinary Shares, covered by the Form F-3.These Ordinary Shares will be offered in amounts, at prices and on terms to be determined at the time of their offering, if any.
On September 21, 2017, the Board of Directors approved a dividend policy for the Company with a goal of paying annual cash dividends pay-out in linewith industry peers and practices. The declaration and payment of any interim dividends will be subject to approval of Atento’s corporate bodies and will bedetermined based upon, amongst other things, Atento’s performance, growth opportunities, cash flow, contractual covenants, applicable legal requirements andliquidity factors. The Board of Directors intends to review the dividend policy regularly and so accordingly it is subject to change at any time.
On October 31, 2017, our Board of Directors declared a cash interim dividend with respect to the ordinary shares of $0.3384 per share paid on November28, 2017 to shareholders of record as of the close on November 10, 2017.
On November 13, 2017, Atento filed a Supplemental Prospectus with the SEC, for the sale of 12,295,082 ordinary shares within the Offer dated August18, 2017, through its selling shareholder PikCo. After the completion of this follow on Offer the selling shareholder owns 50,364,933 ordinary shares in Atento,representing 68.14% of its share stake.
Exchange Rate Information
In this Interim Report, all references to “U.S. dollar” and “$” (USD) are to the lawful currency of the United States and all references to “Euro” or “€” areto the single currency of the participating member states of the European and Monetary Union of the Treaty Establishing the European Community, as amendedfrom time to time. In addition, all references to Brazilian Reais or “R$” (BRL), Mexican Peso (MXN), Chilean Peso (CLP), Argentinean Peso (ARS), ColombianPeso (COP) and Peruvian Nuevos Soles (PEN) are to the lawful currencies of Brazil, Mexico, Chile, Argentina, Colombia and Peru, respectively.
The following table shows the exchange rates of the U.S. dollar to these currencies for the periods and dates indicated as reported by the relevant centralbanks of the European Union and each country, as applicable.
4

2017 2017 2018
Average FY December 31 Average Q3 Average nine
months September 30 Average Q3 Average nine months September 30
Euro (EUR) 0.89 0.83 0.85 0.90 0.85 0.86 0.84 0.86Brazil (BRL) 3.19 3.31 3.16 3.17 3.17 3.96 3.60 4.00
Mexico (MXN) 18.92 19.66 17.82 18.90 18.16 18.98 19.03 18.72Colombia (COP) 2,951.28 2,984.00 2,976.69 2,939.43 2,941.07 2,961.69 2,886.12 2,989.58Chile (CLP) 648.86 615.22 642.76 653.99 636.85 663.19 628.63 661.50Peru (PEN) 3.26 3.25 3.25 3.27 3.27 3.29 3.26 3.30Argentina (ARS) 16.56 18.65 17.28 16.23 17.31 32.09 25.11 41.25
5

SELECTED HISTORICAL FINANCIAL INFORMATION
The consolidated financial information of Atento are the consolidated results of operations of Atento for the three and nine months ended September 30,2017 and 2018.
We present our historical financial information under International Financial Reporting Standards (“IFRS”) as issued by the International AccountingStandards Board (the “IASB”). The unaudited interim condensed consolidated financial information for the three and nine months ended September 30, 2018 (the“interim condensed consolidated financial information”) have been prepared in accordance with International Accounting Standard (“IAS”) 34 - Interim FinancialReporting.
As described in Note 4 of the interim condensed consolidated financial information, included elsewhere in this document, the accounting policies adoptedin preparation of this interim condensed consolidated financial information are consistent with those followed in the preparation of the consolidated annualfinancial statements for the year ended December 31, 2017, except for IFRS 15 and IFRS 9 which were adopted on January 1, 2018.
Rounding
Certain numerical figures set out in this Interim Report, including financial data presented in millions or thousands and percentages, have been subject torounding adjustments, and, as a result, the totals of the data in this Interim Report may vary slightly from the actual arithmetic totals of such data. Percentages andamounts reflecting changes over time periods relating to financial and other data set forth in “Summary Consolidated Historical Financial Information” and“Management’s Discussion and Analysis of Financial Condition and Results of Operations” are calculated using the numerical data in the financial statements orthe tabular presentation of other data (subject to rounding) contained in this Interim Report, as applicable, and not using the numerical data in the narrativedescription thereof.
6

SUMMARY CONSOLIDATED HISTORICAL FINANCIAL INFORMATION
The following tables present a summary of the consolidated historical financial information for the periods as of the dates indicated and should be read inconjunction with the section of this document entitled “Management’s Discussion and Analysis of Financial Condition and Results of Operations” includedelsewhere in this document.
As of and for the threemonths ended September
30, Change (%)
Change
excluding FX (%)
As of and for the ninemonths ended September
30, Change (%)
Change
excluding FX (%)($ in millions) 2017 2018 2017 2018
(unaudited) (unaudited) Revenue 501.3 432.6 (13.7) 0.9 1,443.0 1,396.4 (3.2) 4.2(Loss)/profit for the period (10.1) 3.1 130.3 125.0 (4.7) 5.4 N.M. N.M.EBITDA (1) 54.4 46.9 (13.7) 2.4 150.8 145.8 (3.3) 5.2Adjusted EBITDA (1) 59.7 46.9 (21.4) (7.8) 165.8 145.8 (12.1) (4.3)Adjusted Earnings (2) 19.6 18.7 (4.4) 8.7 41.4 41.9 1.3 9.8Adjusted Earnings per share (in U.S. dollars) (3) 0.27 0.25 (6.1) 8.7 0.56 0.57 1.4 9.8Adjusted Earnings attributable to Owners of theparent (2) 17.6 18.4 4.3 17.3 39.1 40.5 3.5 11.3Adjusted Earnings per share attributable toOwners of the parent (in U.S. dollars) (3) 0.24 0.25 3.5 17.3 0.53 0.55 3.3 11.3Payments for acquisition of property, plant,equipment and intangible assets (4) (13.2) (9.6) (26.9) (31.4) (50.0) (38.5) (23.0) (20.7)Total Debt 505.7 458.0 (9.4) (5.2) 505.7 458.0 (9.4) (5.2)Cash and cash equivalents 162.8 97.7 (40.0) (32.0) 162.8 97.7 (40.0) (32.0)Net debt with third parties (5) 342.9 360.2 5.1 6.2 342.9 360.2 5.1 6.2Balance sheet data: Total assets 1,417.8 1,210.1 1,417.8 1,210.1 Equity 412.3 316.8 412.3 316.8 Capital stock 0.048 0.048 0.048 0.048 Number of shares 73,909,056 73,909,056 73,909,056 73,909,056 N.M. means not meaningful
(1) In considering the financial performance of the business, our management analyzes the financial performance measures of EBITDA and Adjusted EBITDAat a company and operating segment level, to facilitate decision-making. EBITDA is defined as profit/(loss) for the period from continuing operations beforenet finance expense, income taxes and depreciation and amortization. Adjusted EBITDA is defined as EBITDA adjusted to exclude certain acquisition andintegration related costs, restructuring costs, sponsor management fees, asset impairments, site relocation costs, financing fees, and other items not related toour core results of operations. EBITDA and Adjusted EBITDA are not measures defined by IFRS. The most directly comparable IFRS measure to EBITDAand Adjusted EBITDA is profit/(loss) for the year/period from continuing operations.
We believe EBITDA and Adjusted EBITDA are useful metrics for investors to understand our results of continuing operations and profitability because theypermit investors to evaluate our recurring profitability from underlying operating activities. We also use these measures internally to establish forecasts,budgets and operational goals to manage and monitor our business, as well as to evaluate our underlying historical performance. We believe EBITDAfacilitates comparisons of operating performance between periods and among other companies in industries similar to ours because it removes the effect ofvariances in capital structures, taxation, and non-cash depreciation and amortization charges, which may differ between companies for reasons unrelated tooperating performance. We believe Adjusted EBITDA better reflects our underlying operating performance because it excludes the impact of items whichare not related to our core results of continuing operations.
EBITDA and Adjusted EBITDA measures are frequently used by securities analysts, investors and other interested parties in their evaluation of companiescomparable to us, many of which present EBITDA-related performance measures when reporting their results.
7

EBITDA and Adjusted EBITDA have limitations as analytical tools. These measures are not presented in accordance with IFRS, are not measures offinancial condition or liquidity and should not be considered in isolation or as alternatives to profit or loss for the period from continuing operations or othermeasures determined in accordance with IFRS. EBITDA and Adjusted EBITDA are not necessarily comparable to similarly titled measures used by othercompanies. These non-GAAP measures should be considered supplemental in nature and should not be construed as being more important than comparableGAAP measures.
See below under the heading “Reconciliation of EBITDA and Adjusted EBITDA to profit/(loss)” for a reconciliation of profit/(loss) for the periods fromcontinuing operations to EBITDA and Adjusted EBITDA.
(2) In considering the Company’s financial performance, our management analyzes the performance measure of Adjusted Earnings. Adjusted Earnings isdefined as profit/(loss) for the periods from continuing operations adjusted for certain amortization of acquisition related intangible assets, restructuringcosts, asset impairments and other items not related to our core results of operations, site relocation costs, net foreign exchange impacts and their tax effects.Adjusted Earnings is not a measure defined by IFRS. The most directly comparable IFRS measure to Adjusted Earnings is profit/(loss) for the periods fromcontinuing operations.
We believe Adjusted Earnings is a useful metric for investors and is used by our management for measuring profitability because it represents a groupmeasure of performance which excludes the impact of certain non-cash charges and other charges not associated with the underlying operating performanceof the business, while including the effect of items that we believe affect shareholder value and in-year returns, such as income tax expense and net financecosts.
Our management uses Adjusted Earnings to (i) provide senior management with monthly reports of our operating results; (ii) prepare strategic plans andannual budgets; and (iii) review senior management’s annual compensation, in part, using adjusted performance measures.
Adjusted Earnings is defined to exclude items that are not related to our core results of operations. Adjusted Earnings measures are frequently used bysecurities analysts, investors and other interested parties in their evaluation of companies comparable to us, many of which present an Adjusted Earningsrelated performance measure when reporting their results.
Adjusted Earnings has limitations as an analytical tool. Adjusted Earnings is neither a presentation made in accordance with IFRS nor a measure of financialcondition or liquidity and should not be considered in isolation or as an alternative to profit or loss for the period from continuing operations or othermeasures determined in accordance with IFRS. Adjusted Earnings is not necessarily comparable to similarly titled measures used by other companies. Thesenon-GAAP measures should be considered supplemental in nature and should not be construed as being more important than comparable GAAP measures.
See below under the heading “Reconciliation of Adjusted Earnings to profit/(loss)” for a reconciliation of Adjusted Earnings to our profit/(loss) for theperiod from continuing operations.
(3) Adjusted Earnings per share is calculated based on weighted average number of ordinary shares outstanding (that exclude the treasury shares) of 73,909,056and 73,885,474 as of September 30, 2017 and 2018, respectively.
(4) Payments for acquisition of property, plant, equipment and intangible assets represent the cash disbursement for the period.
(5) In considering our financial condition, our management analyzes net debt with third parties, which is defined as total debt less cash, cash equivalents (net ofany outstanding bank overdrafts) and short-term financial investments.
Net debt with third parties has limitations as an analytical tool. Net debt with third parties is neither a measure defined by or presented in accordance withIFRS nor a measure of financial performance and should not be considered in isolation or as an alternative financial measure determined in accordance withIFRS. Net debt with third parties is not necessarily comparable to similarly titled measures used by other companies. These non-GAAP measures should beconsidered supplemental in nature and should not be construed as being more important than comparable GAAP measures.
See below under the heading “Financing Arrangements” for a reconciliation of total debt to net debt with third parties utilizing IFRS reported balancesobtained from the financial information included elsewhere in this Interim Report. The most directly comparable IFRS measure to net debt with third partiesis total debt.
8

Reconciliation of EBITDA and Adjusted EBITDA to profit/(loss):
For the three months ended September
30, For the nine months ended September
30,($ in millions) 2017 2018 2017 2018 (unaudited) (Loss)/profit for the period (10.1) 3.1 (4.7) 5.4
Net finance expense 37.7 18.3 68.8 59.8
Income tax expense (2.8) 3.8 8.3 8.9
Depreciation and amortization 29.6 21.8 78.4 71.7
EBITDA (non-GAAP) (unaudited) 54.4 46.9 150.8 145.8
Restructuring costs (a) 1.3 - 10.2 -
Other (b) 4.0 - 4.8 -
Total non-recurring items (*) 5.3 - 15.0 -Adjusted EBITDA (non-GAAP) (unaudited) 59.7 46.9 165.8 145.8
(*) We define non-recurring items as items that are limited in number, clearly identifiable, unusual, are unlikely to be repeated in the near future in the ordinarycourse of business and that have a material impact on the consolidated results of operations. Non-recurring items can be summarized as demonstrated below:
(a) Restructuring costs primarily included restructuring activities and other personnel costs that were not related to our core results of operations.Restructuring costs for the three and nine months ended September 30, 2017, primarily relate to the costs to adapt the organization in Argentina andBrazil to the lower level of activities and the investments made in Brazil, Mexico and Spain to implement a lower-cost operating model.
(b) Other non-recurring items for three and nine months ended September 30, 2017, mainly refer to consulting and other non-recurring costs.
9
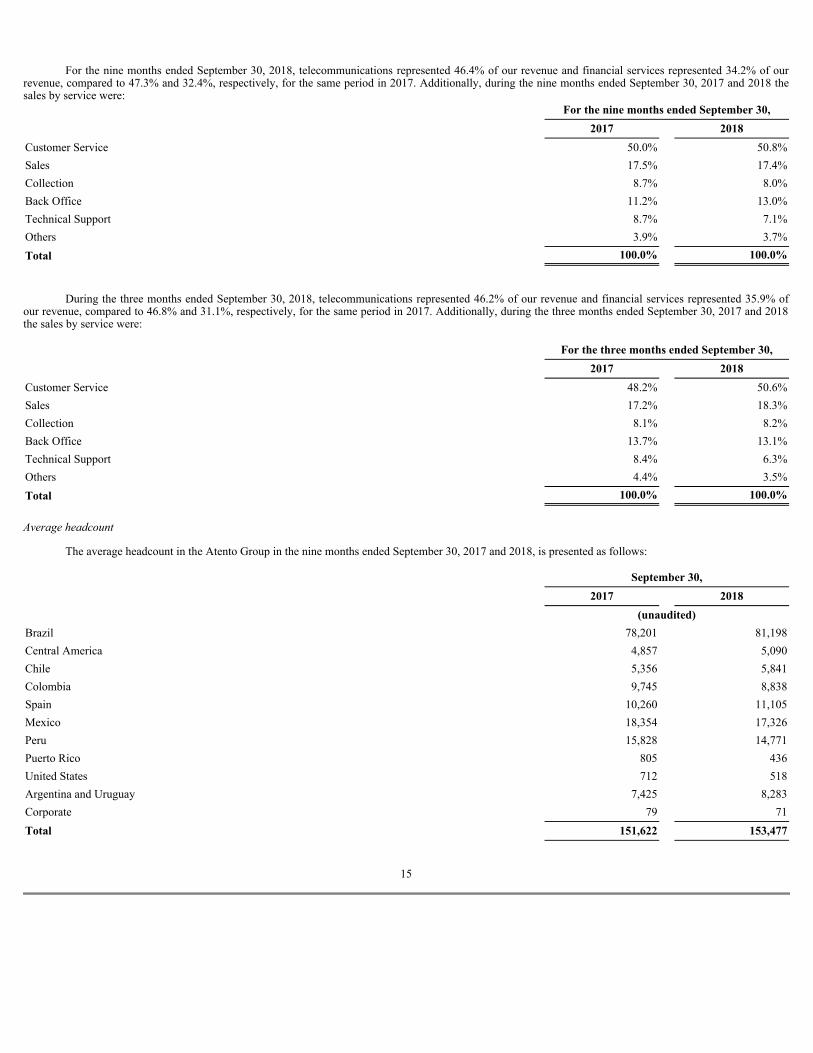
Reconciliation of Adjusted Earnings to profit/(loss):
For the three months ended September
30, For the nine months ended September
30,($ in millions) 2017 2018 2017 2018 (unaudited)(Loss)/profit for the period (10.1) 3.1 (4.7) 5.4
Amortization of acquisition related intangible assets (a) 5.7 5.1 16.8 16.1Restructuring costs (b) (*) 1.3 - 10.2 -Other (c) (*) 4.0 - 4.8 -Change in fair value of financial instruments (d) 2.4 5.9 2.6 -Net foreign exchange gain/(loss) 3.2 9.3 4.2 31.1Financial non-recurring (e) 17.7 - 17.7 -Depreciation non-recurring (f) 2.8 - 2.8 -Tax effect (g) (7.4) (4.6) (13.0) (10.7)Total of add-backs 29.7 15.7 46.1 36.5Adjusted Earnings (non-GAAP) (unaudited) 19.6 18.7 41.4 41.9
Adjusted Earnings per share (in U.S. dollars) (**) (unaudited) 0.27 0.25 0.56 0.57Adjusted Earnings attributable to Owners of the parent (non-GAAP)(unaudited) 17.6 18.4 39.1 40.5Adjusted Earnings per share attributable to Owners of the parent (inU.S. dollars) (**) (unaudited) 0.24 0.25 0.53 0.55
(*) We define non-recurring items as items that are limited in number, clearly identifiable, unusual, are unlikely to be repeated in the near future in the ordinarycourse of business and that have a material impact on the consolidated results of operations. Non-recurring items can be summarized as demonstrated below :
(a) Amortization of acquisition related intangible assets represents the amortization expense of customer base, recorded as intangible assets. This customerbase represents the fair value (within the business combination involving the acquisition of control of Atento Group) of the intangible assets arising fromservice agreements (tacit or explicitly formulated in contracts) with Telefónica Group and with other customers.
(b) Restructuring costs primarily included restructuring activities and other personnel costs that were not related to our core results of operations.Restructuring costs for the three and nine months ended September 30, 2017, primarily relate to the costs to adapt the organization in Argentina andBrazil to the lower level of activities and the investments made in Brazil, Mexico and Spain to implement a lower-cost operating model.
(c) Other non-recurring items for three and nine months ended September 30, 2017, mainly refer to consulting and other non-recurring costs.
(d) Since April 1, 2015, the Company designated the foreign currency risk on certain of its subsidiaries as net investment hedges using financial instrumentsas the hedging items. As a consequence, any gain or loss on the hedging instrument, related to the effective portion of the hedge is recognized in othercomprehensive income (equity) as from that date. The gains or losses related to the ineffective portion are recognized in the statements of operations andfor comparability, and those adjustments are added back to calculate Adjusted Earnings.
(e) Financial non-recurring relates to the costs incurred in the debt refinance process occurred in August 2017, which includes: (i) 2020 Senior Secured Notescall premium of $11.1 million and amortization of issuance costs of $4.9 million; (ii) Brazilian debentures due 2019 penalty fee of $0.7 million andremaining balance of the issuance cost of $1.0 million.
10

(f) Non-recurring depreciation relates to the provision for accelerated depreciation of fixed assets in Puerto Rico and Mexico, due to the natural disasters.
(g) The tax effect represents the impact of the taxable adjustments based on tax nominal rate by country. For the three months ended September 30, 2017 and2018, the effective tax rate after moving non-recurring items was 19.0% and 31.0%, respectively. For the nine months ended September 30, 2017 and2018, the effective tax rate after moving non-recurring items was 34.0% and 31.9%, respectively.
(**) Adjusted Earnings per share is calculated based on the weighted average number of ordinary shares outstanding (that exclude the treasury shares) of73,909,056 and 73,885,474 as of September 30, 2017 and 2018, respectively.
11

Financing Arrangements
Certain of our debt agreements contain financial ratios as instruments to monitor the Company’s financial condition and as preconditions to certaintransactions (e.g. the incurrence of new debt, permitted payments). The following is a brief description of the financial ratios.
1. Gross Leverage Ratio (applies to Atento S.A.) – measures the level of gross debt to EBITDA, as defined in the debt agreements. The contractualratio indicates that the gross debt should not surpass 2.8 times the EBITDA for the last twelve months. As of September 30, 2018, the current ratiowas 2.3 times. This financial covenant applies only as a restriction for certain actions (e.g. issue a new debt) and, if breached, will not trigger adefault or an event of default.
2. Fixed Charge Coverage Ratio (applies to Atento S.A.) – measures the Company’s ability to pay interest expenses and dividends (fixed charges) inrelation to EBITDA, as described in the debt agreements. The contractual ratio indicates that the EBITDA for the last twelve months shouldrepresent at least 2 times the fixed charge of the same period. As of September 30, 2018, the current ratio was 3.1 times. This financial covenantapplies only as a restriction for certain actions (e.g. issue a new debt) and, if breached, will not trigger a default or an event of default.
3. Net Debt Brazilian Leverage Ratio (applies only to Brazil) – measures the level of net debt (gross debt, less cash and cash equivalents) toEBITDA – each as defined in debt agreements. The contractual ratio indicates that Brazil net debt should not surpass 2.0 times the BrazilianEBITDA. As of September 30, 2018, the current ratio was 0.4 times.
The Company regularly monitors all financial ratios under the debt agreements. As of September 30, 2018, we were in compliance with the terms of ourcovenants.
Net debt with third parties as of September 30, 2017 and 2018 is as follow:
As of September 30,($ in millions, except Net Debt/Adj. EBITDA LTM) 2017 2018 (unaudited)Cash and cash equivalents 162.8 97.7Debt: Senior Secured Notes 393.8 393.3 Brazilian Debentures 22.5 16.2 BNDES 56.3 27.9 Finance Lease Payables 9.8 6.2 Other Borrowings 23.4 14.3Total Debt 505.7 458.0
Net Debt with third parties (1) (unaudited) 342.9 360.2
Adjusted EBITDA LTM (2) (non-GAAP) (unaudited) 224.4 200.9Net Debt/Adjusted EBITDA LTM (non-GAAP) (unaudited) 1.5x 1.8x
(1) In considering our financial condition, our management analyzes Net debt with third parties, which is defined as total debt less cash and cash equivalents.Net debt with third parties is not a measure defined by IFRS and it has limitations as an analytical tool. Net debt with third parties is neither a measuredefined by or presented in accordance with IFRS nor a measure of financial performance, and should not be considered in isolation or as an alternativefinancial measure determined in accordance with IFRS. Net debt is not necessarily comparable to similarly titled measures used by other companies.
(2) Adjusted EBITDA LTM (Last Twelve Months) is defined as EBITDA adjusted to exclude restructuring costs, site relocation costs and other items notrelated to our core results of operations.
12

CAUTIONARY NOTE REGARDING FORWARD LOOKING STATEMENTS
This Form 6-K providing quarterly and annual information contains “forward-looking statements” within the meaning of Section 27A of the Securities Actof 1933, Section 21E of the Securities Exchange Act of 1934, and the Private Securities Litigation Reform Act of 1995, relating to our operations, expectedfinancial position, results of operation, and other business matters that are based on our current expectations, assumptions, and projections with respect to thefuture, and are not a guarantee of performance. In this Report, when we use words such as “may,” “believe,” “plan,” “will,” “anticipate,” “estimate,” “expect,”“intend,” “project,” “would,” “could,” “target,” or similar expressions, or when we discuss our strategy, plans, goals, initiatives, or objectives, we are makingforward-looking statements.
We caution you not to rely unduly on any forward-looking statements. Actual results may differ materially from what is expressed in the forward-lookingstatements, and you should review and consider carefully the risks, uncertainties and other factors that affect our business and may cause such differences.
The forward-looking statements are based on information available as of the date that this Form 6-K furnished with the United States Securities andExchange Commission (“SEC”) and we undertake no obligation to update them. Such forward–looking statements are based on numerous assumptions anddevelopments that are not within our control. Although we believe these forward-looking statements are reasonable, we cannot assure you they will turn out to becorrect.
MANAGEMENT’S DISCUSSION AND ANALYSIS OF FINANCIAL CONDITION AND RESULTS OF OPERATIONS
The following discussion and analysis of our financial condition and the results of operations is based upon and should be read in conjunction with theconsolidated financial information of Atento.
Factors which could cause or contribute to such difference, include, but are not limited to, those discussed elsewhere in this Report, particularly under“Cautionary Statement with respect to Forward-Looking Statements” and the section entitled “Risk Factors” in the Form 20-F.
Overview
Atento is the largest provider of customer-relationship management and business-process outsourcing (“CRM BPO”) services and solutions in LatinAmerica (“LatAm”) and Spain, and the third largest provider by revenue globally. Atento’s tailored CRM BPO solutions are designed to enable our client’s abilityto deliver a high-quality product by creating a best-in-class experience for their customers, enabling our clients to focus on operating their core businesses. Atentoutilizes its industry expertise commitment to customer care, and consultative approach, to offer superior and scalable solutions across the entire value chain forcustomer care, customizing each solution to the individual client’s needs.
In the third quarter of 2016 we announced a refreshed strategy to drive long-term profitable growth and create shareholder value. Recent market trends,including the macroeconomic pull-back in Brazil (the largest CRM BPO market in Latin America), and the accelerating adoption of omni-channel and digitalcapabilities, prompted us to reexamine the priorities that support our long-term strategy. The ultimate goal of this exercise, or Strategy Refresh, was to ensure wehad the right focus and capabilities to capitalize on industry trends in Latin America and leverage our scale and financial strength to selectively broaden anddiversify in key verticals, countries, and solutions.
We offer a comprehensive portfolio of customizable, and scalable, solutions including front and back-end services ranging from sales, applications-processing, customer care and credit-management. We leverage our deep industry knowledge and capabilities to provide industry-leading solutions to our clients.We provide our solutions to over 400 clients via over 153,000 highly engaged customer care specialists facilitated by our best-in-class technology infrastructureand multi-channel delivery platform. We believe we bring a differentiated combination of scale, capacity for processing client’s transactions, and industry expertiseto our client’s customer care operations, which allow us to provide higher-quality and lower cost customer care services than our clients could deliver on their own.
13

We operate in 13 countries worldwide and organize our business into three geographic markets: (i) Brazil, (ii) Americas, excluding Brazil (“Americas”)and (iii) EMEA. For the nine months ended September 30, 2018, Brazil accounted for 47.6% of our revenue, Americas accounted for 40.0% of our revenue andEMEA accounted for 13.0% of our revenue (in each case, before holding company level revenue and consolidation adjustments). For the three months endedSeptember 30, 2018, Brazil accounted for 47.2% of our revenue, Americas accounted for 40.2% of our revenue and EMEA accounted for 12.9% of our revenue (ineach case, before holding company level revenue and consolidation adjustments).
Our number of workstations decreased from 91,750 as of September 30, 2017 to 91,717 as of September 30, 2018. Generally, our competitors have higherEBITDA and depreciation expense than us because we lease rather than own all of our call center facilities (e.g., buildings and related equipment), except for ITinfrastructure that is supported by Atento and depreciated.
The following table shows the number of workstations and delivery centers in each of the jurisdictions in which we operated as of September 30, 2017 and2018:
Number of Workstations Number of Service Delivery Centers (1)
2017 2018 2017 2018Brazil 48,052 49,076 33 34Americas 37,890 37,220 52 52
Argentina (2) 4,288 4,356 13 12
Central America (3) 2,342 2,358 4 4Chile 2,674 2,932 3 4Colombia 8,287 8,450 10 10Mexico 10,059 9,223 15 15Peru 8,930 8,548 4 4
United States (4) 1,310 1,353 3 3EMEA 5,808 5,421 14 15Spain 5,808 5,421 14 15Total 91,750 91,717 99 101
(1) Includes service delivery centers at facilities operated by us and those owned by our clients where we provide operations personnel and workstations.(2) Includes Uruguay.(3) Includes Guatemala and El Salvador.(4) Includes Puerto Rico.
For the three and nine months ended September 30, 2018, revenue generated from our 15 largest client groups represented 74.5% and 75.1% of ourrevenue, respectively, as compared to 73.3% and 76.4%, respectively, in the same period in the prior year. Excluding revenue generated from the Telefónica Group,for the three and nine months ended September 30, 2018 our next 15 largest client groups represented 37.6% and 37.7%, respectively, as compared to 36.2% and37.9%, respectively, in the same period in the prior year.
Our vertical industry expertise in telecommunications, financial services and multi-sector companies allows us to adapt our services and solutions for ourclients, further embedding us into their value chain while delivering effective business results and increasing the portion of our client’s services related to CRMBPO. For the nine months ended September 30, 2018, CRM BPO solutions and individual services comprised 26.2% and 73.8% of our revenue, respectively. Forthe same period in 2017, CRM BPO solutions and individual services comprised 26.4% and 73.6% of our revenue, respectively. For the three months endedSeptember 30, 2018, CRM BPO solutions and individual services comprised 27.1% and 72.9% of our revenue, respectively. For the three months ended September30, 2017, CRM BPO solutions and individual services comprised 27.0% and 73.0% of our revenue, respectively.
14
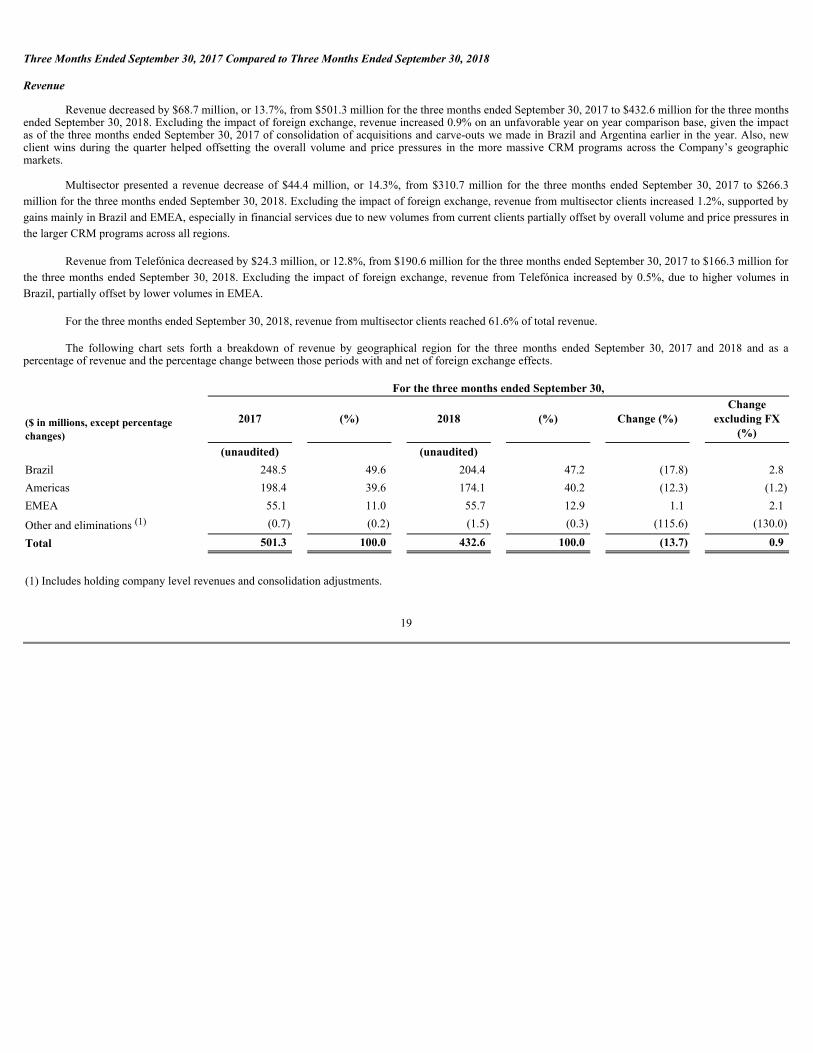
For the nine months ended September 30, 2018, telecommunications represented 46.4% of our revenue and financial services represented 34.2% of ourrevenue, compared to 47.3% and 32.4%, respectively, for the same period in 2017. Additionally, during the nine months ended September 30, 2017 and 2018 thesales by service were:
For the nine months ended September 30,
2017 2018Customer Service 50.0% 50.8%Sales 17.5% 17.4%Collection 8.7% 8.0%Back Office 11.2% 13.0%Technical Support 8.7% 7.1%Others 3.9% 3.7%Total 100.0% 100.0%
During the three months ended September 30, 2018, telecommunications represented 46.2% of our revenue and financial services represented 35.9% ofour revenue, compared to 46.8% and 31.1%, respectively, for the same period in 2017. Additionally, during the three months ended September 30, 2017 and 2018the sales by service were:
For the three months ended September 30,
2017 2018Customer Service 48.2% 50.6%Sales 17.2% 18.3%Collection 8.1% 8.2%Back Office 13.7% 13.1%Technical Support 8.4% 6.3%Others 4.4% 3.5%Total 100.0% 100.0% Averageheadcount
The average headcount in the Atento Group in the nine months ended September 30, 2017 and 2018, is presented as follows:
September 30,
2017 2018
(unaudited)Brazil 78,201 81,198Central America 4,857 5,090Chile 5,356 5,841Colombia 9,745 8,838Spain 10,260 11,105Mexico 18,354 17,326Peru 15,828 14,771Puerto Rico 805 436United States 712 518Argentina and Uruguay 7,425 8,283Corporate 79 71Total 151,622 153,477
15

Consolidated Statements of Operations for the Three and Nine Months Ended September 30, 2017 and 2018
($ in millions, except percentage changes)
For the three months ended September 30,
Change (%)
Change excluding
FX (%)
For the nine months ended September 30,
Change (%)
Change excluding
FX (%)2017 2018 2017 2018 (unaudited) (unaudited) Revenue 501.3 432.6 (13.7) 0.9 1,443.0 1,396.4 (3.2) 4.2Other operating income 4.8 7.2 50.6 139.2 13.9 15.1 8.9 33.1Operating expenses: Supplies (20.8) (19.5) (6.0) 20.6 (55.1) (54.2) (1.6) 9.6Employee benefit expenses (369.1) (321.5) (12.9) 1.6 (1,070.0) (1,046.3) (2.2) 5.1Depreciation (14.4) (12.3) (14.3) (3.1) (37.3) (31.8) (14.7) (8.8)Amortization (15.2) (9.4) (38.0) (27.1) (41.1) (39.8) (3.1) 3.5Changes in trade provisions - (0.3) N.M. N.M. - (0.4) N.M. N.M.Other operating expenses (61.8) (51.5) (16.6) (3.1) (181.0) (164.8) (8.9) (1.8)Total operating expenses (481.3) (414.7) (13.8) 0.7 (1,384.5) (1,337.4) (3.4) 4.0Operating profit 24.8 25.2 1.5 24.8 72.4 74.1 2.3 13.7Finance income 2.4 0.8 (66.1) (58.9) 6.0 2.2 (63.8) (59.9)Finance costs (34.5) (3.9) (88.7) (87.9) (68.0) (30.9) (54.6) (52.3)
Change in fair value of financial instruments (2.4) (5.9) 146.3 149.0 (2.6) - (100.0) (100.0)Net foreign exchange loss (3.2) (9.3) N.M. N.M. (4.2) (31.1) N.M. N.M.Net finance expense (37.7) (18.3) (51.4) (47.9) (68.8) (59.8) (13.1) (7.2)Profit before income tax (12.9) 6.9 N.M. 145.9 3.6 14.3 N.M. N.M.Income tax benefit/(expense) 2.8 (3.8) N.M. N.M. (8.3) (8.9) 6.7 7.6(Loss)/profit for the period (10.1) 3.1 130.3 125.0 (4.7) 5.4 N.M. N.M.(Loss)/profit attributable to: Owners of the parent (12.0) 2.7 122.4 119.4 (6.9) 4.0 N.M. (142.4)Non-controlling interest 1.9 0.4 (80.1) (76.1) 2.2 1.5 (33.9) (20.3)(Loss)/profit for the period (10.1) 3.1 130.3 125.0 (4.7) 5.4 N.M. N.M.Other financial data: EBITDA (1) (unaudited) 54.4 46.9 (13.7) 2.4 150.8 145.8 (3.3) 5.2Adjusted EBITDA (1) (unaudited) 59.7 46.9 (21.4) (7.8) 165.8 145.8 (12.1) (4.3) (1) For the reconciliation of these non-GAAP measures to the closest comparable IFRS measure, see section "Summary Consolidated Historical Financial Information -Reconciliation of EBITDA and Adjusted EBITDA to profit/(loss)".
N.M. means not meaningful
16

Consolidated Statements of Operations by Segment for the Three and Nine Months Ended September 30, 2017 and 2018
($ in millions, except percentage changes)
For the three months ended September 30,
Change (%)
ChangeExcluding
FX (%)
For the nine months ended September 30,
Change (%)
ChangeExcluding
FX (%)2017 2018 2017 2018 (unaudited)Revenue: Brazil 248.5 204.4 (17.8) 2.8 720.3 664.5 (7.8) 4.2Americas 198.4 174.1 (12.3) (1.2) 557.5 558.2 0.1 6.5EMEA 55.1 55.7 1.1 2.1 166.9 181.0 8.5 0.7Other and eliminations (1) (0.7) (1.5) (115.6) (130.0) (1.7) (7.3) N.M. N.M.Total revenue 501.3 432.6 (13.7) 0.9 1,443.0 1,396.4 (3.2) 4.2Operating expenses: Brazil (238.6) (196.0) (17.9) 2.6 (686.2) (645.2) (6.0) 6.2Americas (197.3) (172.8) (12.4) (1.5) (540.1) (540.8) 0.1 6.7EMEA (57.7) (54.5) (5.5) (4.5) (166.7) (177.9) 6.7 (0.7)Other and eliminations (1) 12.3 8.7 (29.4) (28.2) 8.5 26.5 N.M. N.M.Total operating expenses (481.3) (414.7) (13.8) 0.7 (1,384.5) (1,337.4) (3.4) 4.0Operating profit/(loss) : Brazil 11.4 10.9 (4.8) 22.5 43.5 22.0 (49.5) (43.1)Americas 7.8 5.7 (26.3) (1.2) 25.0 29.2 16.7 26.7EMEA (2.4) 1.5 N.M. N.M. 0.7 3.8 N.M. N.M.Other and eliminations (1) 8.0 7.1 (11.1) (9.1) 3.2 19.2 N.M. N.M.Total operating profit 24.8 25.2 1.5 24.8 72.4 74.1 2.3 13.7Net finance expense : Brazil (8.4) (8.4) 0.4 27.2 (25.7) (26.7) 3.8 18.1Americas (6.9) (7.9) 14.0 25.4 (10.3) (18.3) 77.3 96.1EMEA (11.0) (0.7) (93.7) (93.5) (16.7) (1.7) (89.9) (90.3)Other and eliminations (1) (11.4) (1.3) (88.4) (88.5) (16.1) (13.2) (18.1) (13.5)Total net finance expense (37.7) (18.3) (51.4) (47.9) (68.8) (59.8) (13.1) (7.2)Income tax benefit/(expense): Brazil - (1.1) N.M. N.M. (3.9) 2.0 N.M. N.M.Americas (1.8) (0.7) (62.2) (59.6) (9.1) (4.3) (53.3) (53.9)EMEA 4.2 - (100.3) (100.3) 3.6 (0.6) (117.1) (117.8)Other and eliminations (1) 0.4 (2.0) N.M. N.M. 1.1 (6.0) N.M. N.M.Total income tax benefit/(expense) 2.8 (3.8) N.M. N.M. (8.3) (8.9) 6.7 7.6Profit/(loss) for the period: Brazil 3.0 1.4 (54.8) (33.7) 13.9 (2.7) (119.1) (121.6)Americas (0.9) (2.8) N.M. (30.9) 5.5 6.7 21.2 48.5EMEA (9.2) 0.7 108.1 108.4 (12.4) 1.5 111.8 111.5Other and eliminations (1) (3.0) 3.8 N.M. N.M. (11.7) - 99.7 99.7(Loss)/profit for the period (10.1) 3.1 130.3 125.0 (4.7) 5.4 N.M. N.M.(Loss)/profit attributable to: Owners of the parent (12.0) 2.7 122.4 119.4 (6.9) 4.0 N.M. 143.6Non-controlling interest 1.9 0.4 (80.1) (76.1) 2.2 1.5 (33.9) (20.3)Other financial data: EBITDA (2) : Brazil 26.9 22.2 (17.4) 4.3 86.4 59.6 (31.0) (22.2)Americas 19.2 13.7 (28.5) (16.7) 53.1 55.2 4.0 9.4EMEA 0.1 3.8 N.M. N.M. 7.7 11.2 45.0 30.3Other and eliminations (1) 8.2 7.2 (12.0) (9.3) 3.6 19.8 N.M. N.M.Total EBITDA (unaudited) 54.4 46.9 (13.7) 2.4 150.8 145.8 (3.3) 5.2
17

Adjusted EBITDA (2) : Brazil 32.1 24.3 (24.1) (5.7) 95.1 69.8 (26.5) (17.2)Americas 23.7 19.7 (16.9) (8.6) 62.9 66.8 6.1 11.2EMEA 3.5 5.7 61.8 38.5 11.6 16.7 43.5 27.2Other and eliminations (1) 0.4 (2.8) N.M. N.M. (3.7) (7.5) (103.0) (48.3)Total Adjusted EBITDA (unaudited) 59.7 46.9 (21.4) (7.8) 165.8 145.8 (12.1) (4.3) (1) Included revenue and expenses at the holding-company level (such as corporate expenses and acquisition related expenses), as applicable, as well as consolidationadjustments.
(2) For the reconciliation of these non-GAAP measures to the closest comparable IFRS measure, see section "Summary Consolidated Historical Financial Information -Reconciliation of EBITDA and Adjusted EBITDA to profit/(loss)".
N.M. means not meaningful
18
Three Months Ended September 30, 2017 Compared to Three Months Ended September 30, 2018 Revenue
Revenue decreased by $68.7 million, or 13.7%, from $501.3 million for the three months ended September 30, 2017 to $432.6 million for the three monthsended September 30, 2018. Excluding the impact of foreign exchange, revenue increased 0.9% on an unfavorable year on year comparison base, given the impactas of the three months ended September 30, 2017 of consolidation of acquisitions and carve-outs we made in Brazil and Argentina earlier in the year. Also, newclient wins during the quarter helped offsetting the overall volume and price pressures in the more massive CRM programs across the Company’s geographicmarkets.
Multisector presented a revenue decrease of $44.4 million, or 14.3%, from $310.7 million for the three months ended September 30, 2017 to $266.3million for the three months ended September 30, 2018. Excluding the impact of foreign exchange, revenue from multisector clients increased 1.2%, supported bygains mainly in Brazil and EMEA, especially in financial services due to new volumes from current clients partially offset by overall volume and price pressures inthe larger CRM programs across all regions.
Revenue from Telefónica decreased by $24.3 million, or 12.8%, from $190.6 million for the three months ended September 30, 2017 to $166.3 million forthe three months ended September 30, 2018. Excluding the impact of foreign exchange, revenue from Telefónica increased by 0.5%, due to higher volumes inBrazil, partially offset by lower volumes in EMEA.
For the three months ended September 30, 2018, revenue from multisector clients reached 61.6% of total revenue.
The following chart sets forth a breakdown of revenue by geographical region for the three months ended September 30, 2017 and 2018 and as apercentage of revenue and the percentage change between those periods with and net of foreign exchange effects.
For the three months ended September 30,
($ in millions, except percentagechanges)
2017
(%)
2018
(%)
Change (%)
Changeexcluding FX
(%)
(unaudited) (unaudited) Brazil 248.5 49.6 204.4 47.2 (17.8) 2.8Americas 198.4 39.6 174.1 40.2 (12.3) (1.2)EMEA 55.1 11.0 55.7 12.9 1.1 2.1
Other and eliminations (1) (0.7) (0.2) (1.5) (0.3) (115.6) (130.0)
Total 501.3 100.0 432.6 100.0 (13.7) 0.9
(1) Includes holding company level revenues and consolidation adjustments.
19
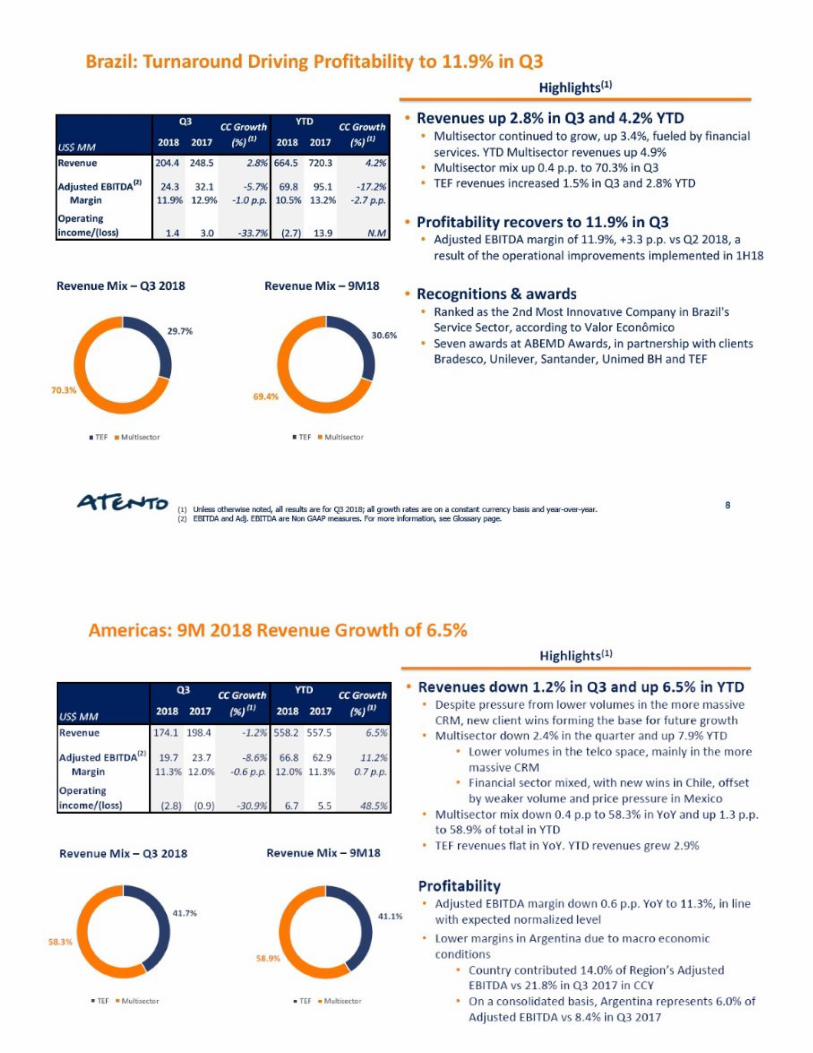
Brazil
Revenue in Brazil for the three months ended September 30, 2017 and 2018 was $248.5 million and $204.4 million, respectively, a decrease of $44.1million, or 17.8%. Excluding the impact of foreign exchange, revenue increased by 2.8%. Excluding the impact of foreign exchange, revenue from multisectorclients increased by 3.4%, supported mostly by new contracts with existing clients in the financial services vertical, leading the path for the Group in revenuediversification. Excluding the impact of foreign exchange, revenue from Telefónica increased by 1.5%, on higher volumes in the region, with Atento delivering thefirst digital solutions for the Telefónica Group.
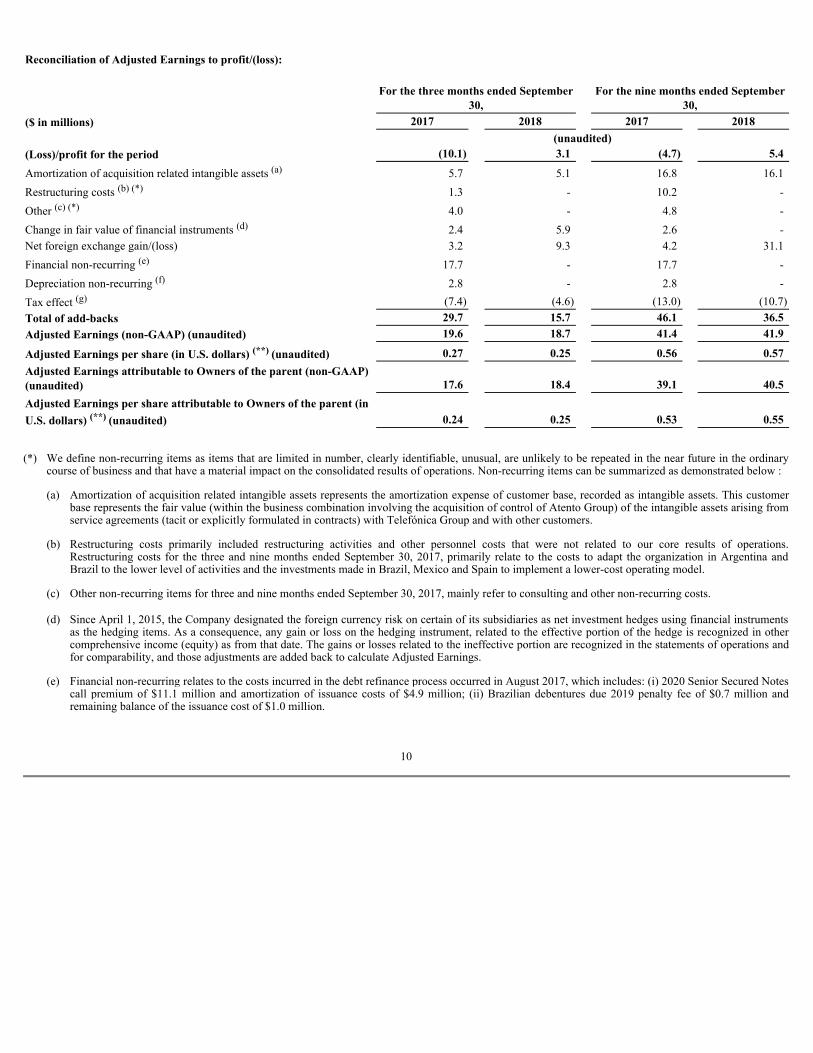
Americas
Revenue in Americas for the three months ended September 30, 2017 and 2018 was $198.4 million and $174.1 million, respectively, a decrease of $24.3million, or 12.3%. Excluding the impact of foreign exchange, revenue decreased 1.2%. Main impacts on revenues growth can be explained by weaker economicactivity in Argentina and lower volumes, mostly in the larger CRM programs, from telecom clients other than Telefónica in the region. Excluding the impact offoreign exchange, revenue from multisector clients decreased by 2.4%. Revenue from Telefónica increased by 0.2%, on higher volumes in the region.
EMEA
Revenue in EMEA for the three months ended September 30, 2017 and 2018 was $55.1 million and $55.7 million, respectively, an increase of $0.6million, or 1.1%. Excluding the impact of foreign exchange, revenue increased 2.1%, supported by multisector. Excluding the impact of foreign exchange, revenuefrom multisector clients increased by 6.8%, fueled by higher volumes from telecom clients other than Telefónica, offsetting the 0.9% decrease in revenue fromTelefónica.
Other operating income
Other operating income totaled $4.8 million for the three months ended September 30, 2017 and $7.2 million for the three months ended September 30,2018 , which includes in the third quarter of 2018 the amount of $3.6 million related to partial insurance indemnity from Puerto Rico, and also $2.1 million referredto the sale of a Brazil contract in the period.
Total operating expenses
Total operating expenses decreased by $66.6 million, or 13.8%, from $481.3 million for the three months ended September 30, 2017 to $414.7 million forthe three months ended September 30, 2018. Excluding the impact of foreign exchange, operating expenses increased by 0.7%, mainly due to higher activity andvolume increase in Brazil. As a percentage of revenue, operating expenses represented 96.0% and 95.9% for the three months ended September 30, 2017 and 2018,respectively.
Supplies: Supplies expenses decreased by $1.3 million, or 6.0%, from $20.8 million for the three months ended September 30, 2017 to $19.5 million forthe three months ended September 30, 2018. Excluding the impact of foreign exchange, supplies expenses increased by 20.6% mainly due to higher activity inBrazil and Spain. As a percentage of revenue, supplies represented 4.1% for the three months ended September 30, 2017 and 4.5% for the three months endedSeptember 30, 2018.
Employeebenefitexpenses: Employee benefit expenses decreased by $47.6 million, or 12.9%, from $369.1 million for the three months ended September30, 2017 to $321.5 million for the three months ended September 30, 2018. Excluding the impact of foreign exchange, employee benefit expenses increased by1.6%, mainly due to higher revenues in Brazil. As a percentage of revenue, employee benefit expenses represented 73.6% and 74.3% for the three months endedSeptember 30, 2017 and 2018, respectively.
Depreciationandamortization : Depreciation and amortization expenses decreased by $7.8 million, or 26.5%, from $29.6 million for the three monthsended September 30, 2017 to $21.8 million for the three months ended September 30, 2018. Excluding the impact of foreign exchange, depreciation andamortization expense decreased by 15.2%, due to reduction in the capital expenditure projects.
20

Changesintradeprovisions: Changes in trade provisions totaled a negative $0.3 million for the three months ended September 30, 2018.
Otheroperatingexpenses: Other operating expenses decreased by $10.3 million, or 16.6%, from $61.8 million for the three months ended September 30,2017 to $51.5 million for the three months ended September 30, 2018. Excluding the impact of foreign exchange, other operating expenses decreased by 3.1%mostly driven by lower expenses in Americas and Spain. As a percentage of revenue, other operating expenses totaled 12.3% and 11.9% for the three months endedSeptember 30, 2017 and 2018, respectively.
Brazil
Total operating expenses in Brazil decreased by $42.6 million, or 17.9%, from $238.6 million for the three months ended September 30, 2017 to $196.0million for the three months ended September 30, 2018. Excluding the impact of foreign exchange, operating expenses in Brazil increased by 2.6%, mainly drivenby higher employee benefit expenses in the period, reflecting increased volumes in the region . Operating expenses as a percentage of revenue slightly decreasedfrom 96.0% to 95.9%, for the three months ended September 30, 2017 and 2018, respectively .
Americas
Total operating expenses in Americas decreased by $24.5 million, or 12.4%, from $197.3 million for the three months ended September 30, 2017 to$172.8 million for the three months ended September 30, 2018. Excluding the impact of foreign exchange, operating expenses decreased by 1.5%, reflecting thelower volumes and decrease in revenues. Operating expenses as a percentage of revenue decreased from 99.4% to 99.3%, for the three months ended September 30,2017 and 2018, respectively.
EMEA
Total operating expenses in EMEA decreased by $3.2 million, or 5.5%, from $57.7 million for the three months ended September 30, 2017 to $54.5million for the three months ended September 30, 2018. Excluding the impact of foreign exchange, operating expenses decreased by 4.5%, impacted by an decreaseof 2.8% in employee benefit expenses, as well as reduction in other operating expenses. Operating expenses as a percentage of revenue decreased from 104.7% to97.8%, for the three months ended September 30, 2017 and 2018, respectively .
Operating profit
Operating profit increased by $0.4 million, from $24.8 million for the three months ended September 30, 2017 to $25.2 million for the three months endedSeptember 30, 2018. Excluding the impact of foreign exchange, operating profit increased 24.8%. Operating profit margin increased of 0.9 percentage points from4.9% for the three months ended September 30, 2017 to 5.8% for the three months ended September 30, 2018 mainly reflecting higher operating profit in Brazil .
Brazil
Operating profit in Brazil decreased by $0.5 million, from $11.4 million for the three months ended September 30, 2017 to $10.9 million for the threemonths ended September 30, 2018. Excluding the impact of foreign exchange, operating profit increased by 22.5%. Operating profit margin in Brazil increasedfrom 4.6% for three months ended September 30, 2017 to 5.3% for the three months ended September 30, 2018, reflecting increase in revenues and profitabilityfrom operation improvement plan, executed in the first half of 2018.
Americas
Operating profit in Americas decreased by $2.1 million, from $7.8 million for the three months ended September 30, 2017 to $5.7 million for the threemonths ended September 30, 2018. Excluding the impact of foreign exchange, operating profit decreased by 1.2%, reflecting lower volumes from multisectorclients. Operating profit margin decreased from 3.9% for the three months ended September 30, 2017 to 3.3% for the three months ended September 30, 2018.
EMEA
Operating profit in EMEA increased by $3.9 million, from a loss of $2.4 million for the three months ended September 30, 2017 to a gain of $1.5 millionfor the three months ended September 30, 2018. Excluding the impact of foreign exchange, operating profit margin improved from negative 4.4% to positive 2.6%,reflecting higher volumes from Multisector clients, especially telecom clients other than Telefónica.
21

Finance income
Finance income was $0.8 million for the three months ended September 30, 2018, compared to $2.4 million for the three months ended September 30,2017. Excluding the impact of foreign exchange, finance income decreased by 58.9% during the three months ended September 30, 2018 mainly due to loweraverage cash position .
Finance costs
Finance costs decreased by $30.6 million, or 88.7%, from $34.5 million for the three months ended September 30, 2017 to $3.9 million for the threemonths ended September 30, 2018. Excluding the impact of foreign exchange, finance costs decreased by 87.9% during the three months ended September 30,2018. The decrease in finance costs was mostly driven by the one-off negative effect in three months ended September 30, 2017 of $18. 5 million related to the debtrefinancing concluded in August 2017.
Change in fair value of financial instruments
Change in fair value of financial instruments altered by $3.5 million, from a loss of $2.4 million for the three months ended September 30, 2017 to a lossof $5.9 million for the three months ended September 30, 2018. This loss is related to negative mark-to-market adjustments on certain hedging instruments.
Net foreign exchange gain/(loss)
Net foreign exchange loss changed by $6.1 million, from a loss of $3.2 million for the three months ended September 30, 2017 to a loss of $9.3 million forthe three months ended September 30, 2018. This loss in the three months ended September 30, 2018 was mainly due to the Brazilian Real and Argentine Pesodepreciation against the U.S. dollar that impacted our intercompany balances and therefore has no cash impact.
Income tax expense
Income tax expense for the three months ended September 30, 2017 and 2018 was a benefit of $2.8 million and an expense of $3.8 million, respectively.This change is due to the positive profit before income tax in 2018.
Profit/(loss) for the period
Loss for the three months ended September 30, 2017 was a $10.1 million and, for the three months ended three months ended September 30, 2018, we hada profit of $3.1 million, as a result of the factors discussed above.
EBITDA and Adjusted EBITDA
EBITDA decreased by $7.5 million, or 13.7%, from $54.4 million for the three months ended September 30, 2017 to $46.9 million for the three monthsended September 30, 2018. Excluding the impact of foreign exchange, increased by 2.4% driven by improved margins in Brazil.
Brazil
Adjusted EBITDA decreased by $7.7 million, or 24.1%, from $32.1 million for the three months ended September 30, 2017 to $24.3 million for the threemonths ended September 30, 2018. Excluding the impact of foreign exchange, Adjusted EBITDA decreased by 5.7%, mainly driven by lower profitability inexisting contracts from lower volumes. Brazil’s operations remain at the forefront of Atento’s profitable growth strategy, with focus on evolving the value offer.Atento Brazil solutions factory is helping accelerate the Group’s move into digital services and leading the standardization and roll out of digital solutions (DataDriven Digital Sales, Data Driven Customer Care, Digital Back Office, Digital Collections), as well as Analytics and Business Process Consulting offering. Thedifference between EBITDA and Adjusted EBITDA for the three months ended September 30, 2018 is due to the exclusion of items that were not related to ourcore results of operation, most of them related to corporate charges among our subsidiaries, that are eliminated at consolidated level.
22

Americas
Adjusted EBITDA decreased by $4.0 million, or 16.9%, from $23.7 million for the three months ended September 30, 2017 to $19.7 million for the threemonths ended September 30, 2018. Excluding the impact of foreign exchange, Adjusted EBITDA decreased by $1.8 million, or 8.6% respectively. The decrease inAdjusted EBITDA was mostly driven by lower volumes in multisector, especially from lower volumes in the larger CRM programs with telecom clients other thanTelefónica and from a weaker economic activity in Argentina. The difference between EBITDA and Adjusted EBITDA for the three months ended September 30,2018 is due to the exclusion of items that were not related to our core results of operation, most of them related to corporate charges between the countries, that areeliminated at consolidated level.
EMEA
Adjusted EBITDA in EMEA increased by 61.8%, from $3.5 million for the three months ended September 30, 2017 to $5.7 million for the three monthsended September 30, 2018. Excluding the impact of foreign exchange, Adjusted EBITDA increased by $1.6 million, or 38.5%, reflecting higher volumes fromMultisector clients, especially telecom clients other than Telefónica. The difference between EBITDA and Adjusted EBITDA for the three months endedSeptember 30, 2018 is due to the exclusion of items that were not related to our core results of operation, most of them related to corporate charges between thecountries, that are eliminated at consolidated level.
23

Nine Months Ended September 30, 2017 Compared to Nine Months Ended September 30, 2018
Revenue
Revenue decreased by $46.6 million, or 3.2%, from $1,443.0 million for the nine months ended September 30, 2017 to $1,396.4 million for the ninemonths ended September 30, 2018. Excluding the impact of foreign exchange, revenue increased 4.2%.
Multisector presented a decrease of $22.2 million, or 2.5%, from $877.7 million for the nine months ended September 30, 2017 to $855.4 million for thenine months ended September 30, 2018. Excluding the impact of foreign exchange, revenue from multisector clients increased 6.1%, supported by gains in allregions, coming mostly from f inancial services on higher volume from current clients.
Revenue from Telefónica presented a decrease of $24.4 million, or 4.3%, to $540.9 million in revenue for the nine months ended September 30, 2018,against $565.3 million in the nine months ended September 30, 2017. Excluding the impact of foreign exchange, revenue from Telefónica clients increased by1.4%, due to higher volumes in Brazil and Americas, partially offset by lower volumes in EMEA.
For the nine months ended September 30, 2018, revenue from multisector clients was 61.3% of total revenue.
The following chart sets forth a breakdown of revenue by geographical region for the nine months ended September 30, 2017 and 2018 and as apercentage of revenue and the percentage change between those periods with and net of foreign exchange effects.
For the nine months ended September 30,
($ in millions, except percentagechanges)
2017
(%)
2018
(%)
Change (%)
Changeexcluding FX
(%)
(unaudited) (unaudited) Brazil 720.3 49.9 664.5 47.6 (7.8) 4.2Americas 557.5 38.6 558.2 40.0 0.1 6.5EMEA 166.9 11.6 181.0 13.0 8.5 0.7
Other and eliminations (1) (1.7) (0.1) (7.3) (0.5) N.M. N.M.
Total 1,443.0 100.0 1,396.4 100.0 (3.2) 4.2
(1) Includes holding company level revenues and consolidation adjustments.
24

Brazil
Revenue in Brazil for the nine months ended September 30, 2017 and 2018 totaled $720.3 million and $664.5 million, respectively, a decrease of $55.8million, or 7.8%. Excluding the impact of foreign exchange, revenue increased by 4.2%, while revenue from multisector clients increased by 4.9%, supported bynew contracts with existing clients in the financial services vertical and higher volumes with telecom clients other than Telefónica. Revenue from Telefónicaincreased by 2.8% driven by higher volumes in the nine months ended September 30, 2018 .
Americas
Revenue in Americas for the nine months ended September 30, 2017 and 2018 was $557.5 million and $558.2 million, respectively, an increase of $0.7million, or 0.1%. Excluding the impact of foreign exchange, revenue increased 6.5%. Excluding the impact of foreign exchange, revenue from multisector clientsincreased by 7.9%, supported by higher volumes in Argentina, Chile and Mexico, mostly from other Multisector clients. On the same way, revenue from Telefónicaincreased by 2.9%, also driven by higher volumes in Argentina, Chile and Mexico.
EMEA
Revenue in EMEA for the nine months ended September 30, 2017 and 2018 was $166.9 million and $181.0 million, respectively, an increase of $14.1million, or 8.5%, supported by multisector. Excluding the impact of foreign exchange, revenue from multisector clients increased by 8.9%, fueled by highervolumes from telecom clients other than Telefónica, offsetting the 4.0% decrease in revenue from Telefónica .
Other operating income
Other operating income totaled $13.9 million and $15.1 million for the nine months ended September 30, 2017 and 2018, respectively, which includes$8.7 million of partial insurance indemnity from Puerto Rico.
Total operating expenses
Total operating expenses decreased by $47.1 million, or 3.4%, from $1,384.5 million for the nine months ended September 30, 2017 to $1,337.4 millionfor the nine months ended September 30, 2018. Excluding the impact of foreign exchange, operating expenses increased by 4.0%, in line with revenue growth,mostly coming from employee benefit expenses, driven by Brazil and higher activity in Americas. As a percentage of revenue, operating expenses represented95.9% and 95.8% for the nine months ended September 30, 2017 and 2018, respectively.
Supplies: Supplies expenses decreased by $0.9 million, or 1.6%, from $55.1 million for the nine months ended September 30, 2017 to $54.2 million forthe nine months ended September 30, 2018. Excluding the impact of foreign exchange, supplies expenses increased by 9.6%, mainly due to higher activity inAmericas and Spain. As a percentage of revenue, supplies represented 3.8% and 3.9% for the nine months ended September 30, 2017 and 2018.
Employeebenefitexpenses: Employee benefit expenses decreased by $23.7 million, or 2.2%, from $1,070.0 million for the nine months ended September30, 2017 to $1,046.3 million for the nine months ended September 30, 2018. Excluding the impact of foreign exchange, employee benefit expenses increased by5.1%, mainly due to higher revenues in Brazil and Americas, partially offset by Spain. As a percentage of revenue, employee benefit expenses represented 74.2%and 74.9% for the nine months ended September 30, 2017 and 2018, respectively.
Depreciationandamortization : Depreciation and amortization expenses decreased by $6.7 million, or 8.6%, from $78.4 million for the nine monthsended September 30, 2017 to $71.7 million for the nine months ended September 30, 2018. Excluding the impact of foreign exchange, depreciation andamortization expense decreased by 2.4% driven by decrease in capital expenditures.
Changes in trade provisions:Changes in trade provisions increased by $0.4 million, from zero to a loss of $0.4 million for the nine months endedSeptember 30, 2017 and 2018 respectively.
Otheroperatingexpenses: Other operating expenses decreased by $16.2 million, or 8.9%, from $181.0 million for the nine months ended September 30,2017 to $164.8 million for the nine months ended September 30, 2018. Excluding the impact of foreign exchange, other operating expenses decreased by 1.8%. Asa percentage of revenue, other operating expenses were 12.5% and 11.8% for the nine months ended September 30, 2017 and 2018, respectively.
25

Brazil
Total operating expenses in Brazil decreased by $41.0 million, or 6.0%, from $686.2 million for the nine months ended September 30, 2017 to $645.2million for the nine months ended September 30, 2018. Excluding the impact of foreign exchange, operating expenses in Brazil increased by 6.2%, mainlyimpacted by increase in employee benefit expenses, as explained above. Operating expenses as a percentage of revenue increased from 95.3% to 97.1%, for thenine months ended September 30, 2017 and 2018, respectively .
Americas
Total operating expenses in Americas increased by $0.7 million, or 0.1%, from $540.1 million for the nine months ended September 30, 2017 to $540.8million for the nine months ended September 30, 2018. Excluding the impact of foreign exchange, operating expenses in Americas increased by 6.7%, mainlyimpacted by increase in employee benefit expenses and other operating expenses reflecting the higher operating activity in the region. Operating expenses as apercentage of revenue remained stable at 96.9%, for the nine months ended September 30, 2017 and 2018, respectively.
EMEA
Total operating expenses in EMEA increased by $11.2 million, or 6.7%, from $166.7 million for the nine months ended September 30, 2017 to $177.9million for the nine months ended September 30, 2018. Excluding the impact of foreign exchange, operating expenses in EMEA decreased by 0.7% mostly drivenby the reduction in employee benefit expenses in the period. Operating expenses as a percentage of revenue decreased from 99.9% to 98.3%, for the nine monthsended September 30, 2017 and 2018, respectively .
Operating profit
Operating profit increased by $1.7 million, from $72.4 million for the nine months ended September 30, 2017 to $74.1 million for the nine months endedSeptember 30, 2018, an increase of 2.3%. Excluding the impact of foreign exchange, operating profit increased 13.7%. Operating profit margin increased of 0.3percentage points from 5.0% for the nine months ended September 30, 2017 to 5.3% for the nine months ended September 30, 2018 mainly reflecting higheroperating profit in Americas.
Brazil
Operating profit in Brazil decreased by $21.5 million, from $43.5 million for the nine months ended September 30, 2017 to $22.0 million for the ninemonths ended September 30, 2018. Excluding the impact of foreign exchange, operating profit decreased by 43.1%, reflecting the lower profitability in the firsthalf of 2018 from certain clients’ programs . Operating profit margin in Brazil decreased from 6.0% for nine months ended September 30, 2017 to 3.3% for thenine months ended September 30, 2018 .
Americas
Operating profit in Americas increased by $4.2 million, from $25.0 million for the nine months ended September 30, 2017 to $29.2 million for the ninemonths ended September 30, 2018. Excluding the impact of foreign exchange, operating profit increased by 26.7%, reflecting higher volumes from multisectorclients, partially offset by higher operating expenses. Operating profit margin in Americas increased from 4.5% for the nine months ended September 30, 2017 to5.2% for the nine months ended September 30, 2018.
EMEA
Operating profit in EMEA increased by $3.1 million, from $0.7 million for the nine months ended September 30, 2017 to $3.8 million for the nine monthsended September 30, 2018. Excluding the impact of foreign exchange, operating profit increased by $2.7 million reflecting higher volumes from multisector,especially telecom clients other than Telefónica. Operating profit margin improved from 0.4% for the nine months ended September 30, 2017 to 2.1% for the ninemonths ended September 30, 2018.
26

Finance income
Finance income was $2.2 million for the nine months ended September 30, 2018, compared to $6.0 million for the nine months ended September 30, 2017.Excluding the impact of foreign exchange, finance income decreased by 59.9% during the nine months ended September 30, 2018 mainly due to lower averagecash position.
Finance costs
Finance costs decreased by $37.1 million, or 54.6%, from $68.0 million for the nine months ended September 30, 2017 to $30.9 million for the ninemonths ended September 30, 2018. Excluding the impact of foreign exchange, finance costs decreased by 52.3% during the nine months ended September 30,2018. The decrease in finance costs was mostly driven by the one-off negative effect in the nine months ended September 30, 2017 of $1 8 .5 million related to thedebt refinancing concluded in August 2017, combined with lower interest expenses from the new debt issued in 2017.
Change in fair value of financial instruments
Change in fair value of financial instruments altered by $2.6 million, from a loss of $2.6 million for the nine months ended September 30, 2017 to zero forthe nine months ended September 30, 2018. This change is mainly related to positive mark-to-market adjustments on certain hedging instruments.
Net foreign exchange gain/(loss)
Net foreign exchange loss increased by $26.9 million, from a loss of $4.2 million for the nine months ended September 30, 2017 to a loss of $31.1 millionfor the nine months ended September 30, 2018. This loss was mainly due to the Brazilian Real and Argentine Peso depreciation against the U.S. dollar thatimpacted our intercompany balances and therefore has no cash impact .
Income tax expense
Income tax expense for the nine months ended September 30, 2017 and 2018 totaled $8.3 million and $8.9 million, respectively. This change is due to thepositive profit before income tax in 2017 and 2018.
Profit/(loss) for the period
Profit/(loss) for the period changed from a loss of $4.7 million for the nine months ended September 30, 2017 to a profit of $5.4 million for the ninemonths ended September 30, 2018, as a result of the factors discussed above.
EBITDA and Adjusted EBITDA
EBITDA decreased by $5.0 million, or 3.3%, from $150.8 million for the nine months ended September 30, 2017 to $145.8 million for the nine monthsended September 30, 2018. Excluding the impact of foreign exchange, EBITDA increased by 5.2% mainly driven by lower volumes in Americas and higheroperating expenses in Brazil.
Brazil
Adjusted EBITDA decreased by $25.2 million, or 26.5%, from $95.1 million for the nine months ended September 30, 2017 to $69.8 million for the ninemonths ended September 30, 2018. Excluding the impact of foreign exchange, Adjusted EBITDA decreased by 17.2%. This decrease in Adjusted EBITDA reflectsthe lower profitability from certain clients’ programs. The difference between EBITDA and Adjusted EBITDA for the nine months ended September 30, 2018 isdue to the exclusion of items that were not related to our core results of operation, most of them related to corporate charges between the countries, that areeliminated at consolidated level.
Americas
Adjusted EBITDA increased by $3.8 million, or 6.1%, from $62.9 million for the nine months ended September 30, 2017 to $66.8 million for the ninemonths ended September 30, 2018. Excluding the impact of foreign exchange, Adjusted EBITDA increased $6.7 million, or 11.2%, respectively. The increase inAdjusted EBITDA reflects revenue growth specially from multisector clients. The difference between EBITDA and Adjusted EBITDA for the nine months endedSeptember 30, 2018 is due to the exclusion of items that were not related to our core results of operation, most of them related to corporate charges between thecountries, that are eliminated at consolidated level.
27

EMEA
Adjusted EBITDA increased by 5.1 or 43.5%, from $11.6 million for the nine months ended September 30, 2017 to $16.7 million for the nine monthsended September 30, 2018. Excluding the impact of foreign exchange, Adjusted EBITDA increased by $3.6 million, or 27.2% . The increase in Adjusted EBITDAreflects higher volumes from Multisector clients, especially telecom clients other than Telefónica as well as other multisector clients. The difference betweenEBITDA and Adjusted EBITDA for the nine months ended September 30, 2018 is due to the exclusion of items that were not related to our core results ofoperation, most of them related to corporate charges between the countries, that are eliminated at consolidated level.
Liquidity and Capital Resources
As of September 30, 2018, our outstanding debt was $458.0 million, which includes $393.3 million of our 6.125% Senior Secured Notes due 2022, $16.2million of Brazilian Debentures, $27.9 million of financing provided by BNDES, $6.2 million of finance lease payables and $14.3 million of other bankborrowings, especially short-term financing for working capital needs.
During the three months ended September 30, 2018, our cash flow provided by operating activities was $27.9 million, which includes interest paid of$18.6 million. Our cash flow from operating activities, before giving effect to the payment of interest, was $46.5 million.
During the nine months ended September 30, 2018, our cash flow provided by operating activities was $37.4 million, which includes interest paid of $45.1million. Our cash flow from operating activities, before giving effect to the payment of interest, was $82.5 million.
28

Consolidated Statements of Cash Flows for the Three and Nine Months Ended September 30, 2017 and 2018($ MILLIONS, UNLESS OTHERWISE INDICATED)
For the three months ended September
30, For the nine months ended September 30, 2017 2018 2017 2018 (unaudited)Operating activities (Loss)/profit before income tax (12.9) 6.9 3.6 14.3Adjustments to reconcile (loss)/profit before income tax to netcash flows: Amortization and depreciation 29.6 21.8 78.4 71.7Changes in trade provisions - (0.3) - (0.4)Share-based payment expense 1.6 2.0 3.3 5.0Change in provisions 5.8 (1.3) 10.2 7.4Grants released to income (0.1) (0.2) (0.3) (0.6)Losses on disposal of fixed assets (0.3) 0.3 0.8 0.4Losses on disposal of financial assets - - - 0.3Finance income (2.4) (0.8) (6.0) (2.2)Finance costs 34.5 3.9 68.0 30.9Net foreign exchange differences 3.2 9.3 4.2 31.1Change in fair value of financial instruments 2.4 5.9 2.6 -Changes in other (gains)/losses and own work capitalized (6.7) - (1.4) (0.3) 67.7 40.4 159.7 143.2Changes in working capital: Changes in trade and other receivables 16.1 1.4 (40.2) (63.9)Changes in trade and other payables 5.3 6.4 21.5 16.7Other assets/(payables) (7.4) (6.3) (25.1) (8.3) 14.0 1.5 (43.8) (55.5) Interest paid (37.2) (18.6) (69.1) (45.1)Interest received 46.3 0.2 49.7 0.5Income tax paid (4.8) (2.2) (14.9) (12.7)Other payments (3.3) (0.3) (14.1) (7.3) 1.0 (20.9) (48.4) (64.7)Net cash flows from operating activities 69.8 27.9 71.2 37.4Investing activities Payments for acquisition of intangible assets (3.6) (4.9) (23.6) (16.0)Payments for acquisition of property, plant and equipment (9.6) (4.7) (26.4) (22.5)Acquisition of subsidiaries, net of cash acquired - - (14.5) -Payments for financial instruments - - - (0.3)Proceeds from sale of PP&E and intangible assets 0.1 - 0.2 0.4Net cash flows used in investing activities (13.1) (9.6) (64.4) (38.3)Financing activities Proceeds from borrowing from third parties 401.3 - 467.3 51.1Repayment of borrowing from third parties (446.4) (18.0) (515.4) (74.4)Dividends paid to company's shareholders - (0.7) - (0.9)Acquisition of treasury shares - (5.3) - (5.3)Net cash flows used in financing activities (45.1) (24.0) (48.1) (29.5)Net increase/(decrease) in cash and cash equivalents 11.7 (5.7) (41.3) (30.5)Exchange differences 5.0 (3.0) 10.1 (13.6)Cash and cash equivalents at beginning of period 146.3 106.4 194.0 141.8Cash and cash equivalents at end of period 162.8 97.7 162.8 97.7
29

Cash Flow
As of September 30, 2018, we had cash and cash equivalents of $9 7 .7 million. We believe that our current cash flow used in operating activities andfinancing arrangements will provide us with sufficient liquidity to meet our working capital needs.
For the three months ended September
30, For the nine months ended September 30,($ in millions) 2017 2018 2017 2018
(unaudited)Cash flows from operating activities 69.8 27.9 71.2 37.4Cash flows used in investing activities (13.1) (9.6) (64.4) (38.3)Cash flows used in financing activities (45.1) (24.0) (48.1) (29.5)Net increase/(decrease) in cash and cash equivalents 11.7 (5.7) (41.3) (30.5)Effect of changes in exchanges rates 5.0 (3.0) 10.1 (13.6)
Cash Flows from Operating Activities
ThreeandNineMonthsEndedSeptember30,2017ComparedtoThreeandNineMonthsEndedSeptember30,2018
Cash provided by operating activities, which includes interest paid, was $27.9 million for the three months ended September 30, 2018 compared to $69.8million for the three months ended September 30, 2017. This change reflects (i) a $2 4 .8 million increase in working capital headwind from one-off positive impactin the three months ended September 30, 2017 and (ii) the net positive one-off effect of $2 7 .6 million related to the debt refinancing ($4 6 .1 million gain onhedging unwind and $1 8 .5 million of refinancing cost) during the three months ended September 30, 2017. For the nine months ended September 30, 2018 cashprovided by operating activities, which includes interest paid, was $37.4 million compared to cash provided by operating activities of $71.2 million for the sameperiod in the prior year.
Cash Flows used in Investing Activities
ThreeandNineMonthsEndedSeptember30,2017ComparedtoThreeandNineMonthsEndedSeptember30,2018
Cash used in investing activities was $ 9.6 million for the three months ended September 30, 2018 compared to cash used in investment activities of $ 13.1million for the three months ended September 30, 2017. For the nine months ended September 30, 2018 cash used in investing activities was $ 38.3 millioncompared to $ 64.4 million for the same period in the prior year. The variance is mainly due to the Interfile acquisition in 2017.
Cash Flows used in Financing Activities
ThreeandNineMonthsEndedSeptember30,2017ComparedtoThreeandNineMonthsEndedSeptember30,2018
Cash used in financing activities was $2 4 .0 million for the three months ended September 30, 2018 compared to a cash used in financing activities of$45.1 million for the three months ended September 30, 2017. For the nine months ended September 30, 2018 cash used in financing activities was $ 29 .5 millioncompared to $48.1 million for the same period in the prior year. This variance is mainly due to monthly contractual BNDES amortization, semi-annual contractualDebentures amortization and repayment of certain short-term loans for working capital needs.
30

Finance leases
The Company holds the following assets under finance leases:
As of September 30,
2017 2018
($ in millions) Net carryingamount of asset Net carrying
amount of assetFinance leases (unaudited) Plant and machinery 2.2 1.2 Furniture, tools and other tangible assets 1.3 5.3Total 3.5 6.5
The present value of future finance lease payments is as follow:
As of September 30,
2017 2018
($ in millions) Net carryingamount of asset Net carrying
amount of asset (unaudited) Up to 1 year 3.8 3.3 Between 1 and 5 years 5.3 3.0
Total 9.1 6.2
Capital Expenditure
Our business has significant capital expenditure requirements, including for the construction and initial fit-out of our service delivery centers;improvements and refurbishment of leased facilities for our service delivery centers; acquisition of various items of property, plant and equipment, mainlycomprised of furniture, computer equipment and technology equipment; and acquisition and upgrades of our software or specific customer’s software.
The funding of the majority of our capital expenditure is covered by existing cash and EBITDA generation. The table below shows our capital expenditureby segment for the three and nine months ended September 30, 2017 and 2018.
For the three months ended September30, For the nine months ended September 30,
2017 2018 2017 2018($ in millions) (unaudited) Brazil (*) 8.1 5.6 20.1 34.0Americas 6.9 7.2 13.6 28.5EMEA 1.4 1.5 2.1 4.8Other and eliminations - - (0.1) -Total capital expenditure 16.4 14.3 35.7 67.3
(*) For the nine months ended September 30, 2017 the amount invested by the Company's principal capital expenditures does not include Interfile acquisition andthe amount paid to extend the partnership with Itaú.
The capital expenditures for the nine months ended September 30, 2018 reflect mainly the acquisition by Atento of the rights to software’s use of $38.5million, the construction of a new site in Puerto Rico in the amount of $5.1 million, the construction of new sites in Mexico (Azafran and Centro Histórico) in theamount of $1.4 million, development of software Visibility and Control in Atento Brasil in the amount of $2.3 million and implementation of a new site in AtentoBrasil in the amount of $3.5 million. Refer to Notes 7 and 9 of the interim condensed consolidated financial information.
31
ATENTO S.A. AND SUBSIDIARIES
UNAUDITED INTERIM CONDENSED CONSOLIDATED FINANCIAL INFORMATION FOR THE THREE AND NINE MONTHS ENDED SEPTEMBER 30, 2018
32

ATENTO S.A. AND SUBSIDIARIESINTERIM CONDENSED CONSOLIDATED STATEMENTS OF FINANCIAL POSITION
As of December 31, 2017 and September 30, 2018(In thousands of U.S. dollars, unless otherwise indicated)
ASSETS
Notes
December 31, September 30,
2017 2018
(audited) (unaudited) NON-CURRENT ASSETS 764,127 675,299
Intangible assets 230,104 214,259Goodwill 153,144 128,656Property, plant and equipment 152,195 115,680Non-current financial assets 90,076 85,740Trade and other receivables 11 21,677 12,380Other non-current financial assets 11 60,222 62,458Derivative financial instruments 12 8,177 10,902Other taxes receivable 7,282 5,956Deferred tax assets 131,326 125,008
CURRENT ASSETS 566,178 534,823 Trade and other receivables 410,534 419,188Trade and other receivables 11 388,565 391,358Current income tax receivable 21,969 27,830Other taxes receivable 12,072 16,903Other current financial assets 11 1,810 1,008Cash and cash equivalents 11 141,762 97,724
TOTAL ASSETS 1,330,305 1,210,122 The accompanying notes are an integral part of the interim condensed consolidated financial information.
33

ATENTO S.A. AND SUBSIDIARIESINTERIM CONDENSED CONSOLIDATED STATEMENTS OF FINANCIAL POSITION
As of December 31, 2017 and September 30, 2018(In thousands of U.S. dollars, unless otherwise indicated)
EQUITY AND LIABILITIES
Notes December 31, September 30,
2017 2018
(audited) (unaudited)
TOTAL EQUITY 377,839 316,810
EQUITY ATTRIBUTABLE TO: NON-CONTROLLING INTEREST 9,476 9,250
OWNERS OF THE PARENT COMPANY 368,363 307,560 Share capital 10 48 48Reserve for acquisition of non-controlling interest 10 (23,531) (23,531)Share premium 639,435 615,288Treasury shares 10 - (5,337)Retained losses (94,535) (66,403)Translation differences (170,063) (227,179)Hedge accounting effects 9,594 3,203Stock-based compensation 7,415 11,471NON-CURRENT LIABILITIES 582,870 543,838 Deferred tax liabilities 43,942 33,348Debt with third parties 12 439,731 414,268Derivative financial instruments 12 5,140 2,241Provisions and contingencies 13 61,186 52,478Non-trade payables 8,094 18,597Option for the acquisition of non-controlling interest 23,752 19,624Other taxes payable 1,025 3,282 CURRENT LIABILITIES 369,596 349,474 Debt with third parties 12 46,560 43,711Derivative financial instruments 12 1,212 596Trade and other payables 302,756 291,109Trade payables 94,078 73,907Income tax payables 8,058 11,355Other taxes payables 86,166 90,281Other non-trade payables 114,454 115,566Provisions and contingencies 13 19,068 14,058TOTAL EQUITY AND LIABILITIES 1,330,305 1,210,122 The accompanying notes are an integral part of the interim condensed consolidated financial information.
34

ATENTO S.A. AND SUBSIDIARIESINTERIM CONDENSED CONSOLIDATED STATEMENTS OF OPERATIONS
For the nine months ended September 30, 2017 and 2018(In thousands of U.S. dollars, unless otherwise indicated)
For the three months ended September30,
For the nine months ended September30,
Notes 2017 2018 2017 2018
(unaudited) (unaudited) Revenue 501,284 432,614 1,442,994 1,396,384Other operating income 4,808 7,229 13,861 15,140Other gains and own work capitalized 27 - 66 22
Operating expenses: Supplies (20,767) (19,542) (55,070) (54,242)Employee benefit expenses (369,141) (321,549) (1,069,985) (1,046,292)Depreciation (14,413) (12,338) (37,290) (31,827)Amortization (15,156) (9,428) (41,082) (39,845)Changes in trade provisions 13 (266) (13) (406)Other operating expenses (61,802) (51,544) (181,096) (164,829)OPERATING PROFIT 24,853 25,176 72,385 74,105 Finance income 2,411 814 6,027 2,171Finance costs (34,544) (3,912) (68,005) (30,877)Change in fair value of financial instruments (2,374) (5,912) (2,642) -Net foreign exchange loss (3,197) (9,302) (4,155) (31,104)NET FINANCE EXPENSE (37,704) (18,312) (68,775) (59,810)PROFIT BEFORE INCOME TAX (12,851) 6,864 3,610 14,295Income tax benefit/(expense) 14 2,832 (3,801) (8,259) (8,856)(LOSS)/PROFIT FOR THE PERIOD (10,019) 3,063 (4,649) 5,439(LOSS)/PROFIT ATTRIBUTABLE TO: OWNERS OF THE PARENT (12,013) 2,684 (6,906) 3,985NON-CONTROLLING INTEREST 1,994 379 2,257 1,454(LOSS)/PROFIT FOR THE PERIOD (10,019) 3,063 (4,649) 5,439(LOSS)/EARNINGS PER SHARE: Basic (loss)/earnings per share (in U.S. dollars) 15 (0.16) 0.04 (0.09) 0.05Diluted (loss)/earnings per share (in U.S. dollars) 15 (0.16) 0.04 (0.09) 0.05
The accompanying notes are an integral part of the interim condensed consolidated financial information.
35

ATENTO S.A. AND SUBSIDIARIES
INTERIM CONDENSED CONSOLIDATED STATEMENTS OF COMPREHENSIVE INCOME/(LOSS)For the nine months ended September 30, 2017 and 2018
(In thousands of U.S. dollars, unless otherwise indicated)
For the three months ended September
30, For the nine months ended September
30, 2017 2018 2017 2018
(unaudited) (unaudited)(Loss)/profit for the period (10,019) 3,063 (4,649) 5,439
Other comprehensive income/(loss) Other comprehensive income/(loss) to be reclassified to profit and lossin subsequent periods Cash flow/net investment hedge (7,736) (4,492) (30,546) (6,391)Tax effect on hedge (251) - 403 -Translation differences 18,614 (12,344) 28,150 (58,796)Other comprehensive income/(loss) 10,627 (16,836) (1,993) (65,187)Total comprehensive income/(loss) 608 (13,773) (6,642) (59,748)Total comprehensive income/(loss) attributable to: Owners of the parent (2,513) (13,685) (10,029) (59,522)Non-controlling interest 3,121 (88) 3,387 (226)Total comprehensive income/(loss) 608 (13,773) (6,642) (59,748)
The accompanying notes are an integral part of the interim condensed consolidated financial information.
36

ATENTO S.A. AND SUBSIDIARIESINTERIM CONDENSED CONSOLIDATED STATEMENTS OF CHANGES IN EQUITY
For the nine months ended September 30, 2017 and 2018(In thousands of U.S. dollars, unless otherwise indicated)
Sharecapital
Sharepremium
Treasuryshares
Reservefor
acquisitionof non-
controllinginterest
Retainedlosses
Translationdifferences
Hedgeaccounting
effects Stock-based
compensation
Totalowners of
theparent
company
Non-controlling
interest Totalequity
Balance atJanuary 1, 2017 48 639,435 - (1,057) (53,598) (193,529) 35,521 4,101 430,921 (718) 430,203Comprehensiveincome/(loss) forthe period
-
-
-
-
(6,906)
27,020
(30,143)
-
(10,029)
3,387
(6,642)
Profit for theperiod - - - - (6,906) - - - (6,906) 2,257 (4,649)
Othercomprehensiveincome/(loss), netof taxes
-
-
-
-
-
27,020
(30,143)
-
(3,123)
1,130
(1,993)
Reserve foracquisition ofnon-controllinginterest
-
-
-
(22,474)
-
-
-
-
(22,474)
-
(22,474)
Stock-basedcompensation - - - - - - - 2,180 2,180 - 2,180
Non-controllinginterest
- - - - - - - - - 9,022 9,022
Balance atSeptember 30,2017 (*) 48 639,435 - (23,531) (60,504) (166,509) 5,378 6,281 400,598 11,691 412,289
37

Sharecapital
Sharepremium
Treasuryshares
Reservefor
acquisitionof non-
controllinginterest
Retainedlosses
Translationdifferences
Hedgeaccounting
effects Stock-based
compensation
Totalowners of
theparent
company
Non-controlling
interest Totalequity
Balance atJanuary 1, 2018 48 639,435 - (23,531) (94,535) (170,063) 9,594 7,415 368,363 9,476 377,839 Comprehensiveincome/(loss) forthe period
-
-
-
-
3,985
(57,116)
(6,391)
-
(59,522)
(226)
(59,748)
Profit/(loss) for theperiod - - - - 3,985 - - - 3,985 1,454 5,439
Othercomprehensiveincome/(loss), netof taxes
- - - - - (57,116) (6,391) -
(63,507)
(1,680)
(65,187)
Compensation ofretained losses - (24,147) - - 24,147 - - - - -
Stock-basedcompensation - - - - - - - 4,056 4,056 - 4,056
Aquisition oftreasury shares - - (5,337) - - - - - (5,337) - (5,337)
Balance atSeptember 30,2018 (*)
48 615,288 (5,337) (23,531) (66,403) (227,179) 3,203 11,471 307,560 9,250 316,810
(*) unauditedThe accompanying notes are an integral part of the interim condensed consolidated financial information.
38

ATENTO S.A. AND SUBSIDIARIESINTERIM CONDENSED CONSOLIDATED STATEMENTS OF CASH FLOWS
For the nine months ended September 30, 2017 and 2018(In thousands of U.S. dollars, unless otherwise indicated)
For the nine months ended September 30, 2017 2018 (unaudited)Operating activities Profit before income tax 3,610 14,295Adjustments to reconcile profit before income tax to net cash flows: Amortization and depreciation 78,372 71,672Changes in trade provisions 13 (406)Share-based payment expense 3,287 4,974Change in provisions 10,216 7,363Grants released to income (318) (629)Losses on disposal of fixed assets 826 402Losses on disposal of financial assets - 286Finance income (6,027) (2,171)Finance costs 68,005 30,877Net foreign exchange differences 4,155 31,104Change in fair value of financial instruments 2,642 -Changes in other (gains)/losses and own work capitalized (1,390) (259) 159,781 143,213Changes in working capital: Changes in trade and other receivables (40,201) (63,887)Changes in trade and other payables 21,502 16,717Other payables (25,097) (8,300) (43,796) (55,470) Interest paid (69,131) (45,101)Interest received 49,725 472Income tax paid (14,916) (12,692)Other payments (14,056) (7,335) (48,378) (64,656)Net cash flows from operating activities 71,217 37,382Investing activities Payments for acquisition of intangible assets (23,635) (15,978)Payments for acquisition of property, plant and equipment (26,440) (22,540)Acquisition of subsidiaries, net of cash acquired (14,512) -Payments for financial instruments - (264)Proceeds from sale of PP&E and intangible assets 159 437Net cash flows used in investing activities (64,428) (38,345)Financing activities Proceeds from borrowing from third parties 467,329 51,112Repayment of borrowing from third parties (515,394) (74,410)Dividends paid to company's shareholders - (880)Acquisition of treasury shares - (5,337)Net cash flows used in financing activities (48,065) (29,515)Net decrease in cash and cash equivalents (41,276) (30,478)Exchange differences 10,081 (13,560)Cash and cash equivalents at beginning of period 194,035 141,762Cash and cash equivalents at end of period 162,840 97,724 The accompanying notes are an integral part of the interim condensed consolidated financial information.
39

NOTES TO THE INTERIM CONDENSED CONSOLIDATED FINANCIAL INFORMATION FOR THE NINE MONTHS ENDED SEPTEMBER 30,2018
1. ACTIVITY OF ATENTO S.A. AND CORPORATE INFORMATION
(a) Description of business
Atento S.A., formerly Atento Floatco S.A. (hereinafter the “Company”), and its subsidiaries (hereinafter “Atento Group”) is a group of companies thatoffers customer relationship management services to its clients through contact centers or multichannel platforms.
The Company was incorporated on March 5, 2014 under the laws of the GrandDuchy of Luxembourg, with its registered office in Luxembourg at 4, RueLou Hemmer.
The Atento Group was acquired in 2012 by Bain Capital Partners, LLC (hereinafter “Bain Capital”). Bain Capital is a private investment fund that investsin companies with a high growth potential. Notable among its investments in the Customer Relationship Management (hereinafter “CRM”) sector is its holding inellsystem 24, a leader in customer service in Japan, and Genpact, the largest business management services company in the world.
In December 2012, Bain Capital entered into a final agreement with Telefónica, S.A. for the transfer of nearly 100% of the CRM business carried out byAtento Group (hereinafter the “Acquisition”), the parent company of which was Atento Inversiones y Teleservicios, S.A. (hereinafter “AIT”). The Venezuela basedsubsidiaries of the group headed by AIT, and AIT, except for some specific assets and liabilities, were not included in the Acquisition. Control was transferred forthe purposes of creating the consolidated Atento Group on December 1, 2012.
The majority direct shareholder of the Company, ATALAYA Luxco PIKCo, S.C.A. (Luxembourg), is a holding company incorporated under the laws ofthe Grand-Duchy of Luxembourg.
The Company’s corporate purpose is to hold investments in companies in Luxembourg and abroad, purchase and sell, subscribe or any other format, andtransfer through sale, swap or otherwise of securities of any kind, and administration, management, control and development of the investment portfolio.
The Company may also act as the guarantor of loans and securities, as well as assisting companies in which it holds direct or indirect interests or that formpart of its group. The Company may secure funds, with the exception of public offerings, through any kind of lending, or through the issuance of bonds, securitiesor debt instruments in general.
The Company may also carry on any commercial, industrial, financial, real estate business or intellectual property related activity that it deems necessaryto meet the aforementioned corporate purposes.
The corporate purpose of its subsidiaries, with the exception of the intermediate holding companies, is to establish, manage and operate CRM centersthrough multichannel platforms; provide telemarketing, marketing and “call center” services through service agencies or in any other format currently existing orwhich may be developed in the future by the Atento Group; provide telecommunications, logistics, telecommunications system management, data transmission,processing and internet services and to promote new technologies in these areas; offer consultancy and advisory services to clients in all areas in connection withtelecommunications, processing, integration systems and new technologies, and other services related to the above. The Company’s ordinary shares trade on NYSEunder the symbol “ATTO”.
The interim condensed consolidated financial information was approved by the Board of Directors on November 6, 2018.
(b) Seasonality
Our performance is subject to seasonal fluctuations, which is primarily due to (i) the initial costs to train and hire new employees at new service deliverycenters to provide additional services to our clients, and (ii) statutorily mandated minimum wage and salary increases of operators, supervisors and coordinators inmany of the countries in which we operate, whereas revenue increases related to inflationary adjustments and contracts negotiations generally take effect after thehalf year. These seasonal effects also cause differences in revenue and expenses among the various quarters of any financial year, which means that the individualquarters of a year should not be directly compared with each other or used to predict financial operations.
40

(c) Foreign currencies
In May 2018, the Argentine Peso underwent a severe devaluation resulting in an accumulated inflation rate of three years upper to 100% in Argentina. Forthe application of the inflationary accounting under Financial Reporting in Hyperinflationary Economies (IAS 29) the Company calculated the effects of thoseArgentine operations for the period ended September 2018 and concluded that the impact was not material, as the Argentine subsidiary is relatively not relevant forthe Company’s consolidated activities as a whole.
2. BASIS OF PRESENTATION OF THE INTERIM CONDENSED CONSOLIDATED FINANCIAL INFORMATION
The interim condensed consolidated financial information has been prepared in accordance with IAS 34 - Interim Financial Reporting as issued by theInternational Accounting Standards Board (“IASB”).
The information does not meet all disclosure requirements for the presentation of full annual financial statements and thus should be read in conjunctionwith the consolidated financial statements prepared in accordance with International Financial Reporting Standards (“IFRS”) for the year ended December 31,2017. The interim condensed consolidated financial information have been prepared on a historical costs basis, with the exception of derivative financialinstruments and financial liability related to the option for acquisition of non-controlling interest, which have been measured at fair value. The interim condensedconsolidated financial information is for the Atento Group.
The figures in this interim condensed consolidated financial information is expressed in thousands of dollars, unless indicated otherwise. U.S. Dollar is theAtento Group’s presentation currency.
3. COMPARATIVE INFORMATION
On June 9, 2017, the Company, through its subsidiary Atento Brasil, acquired control of Interfile Serviços de BPO Ltda. and of Interservicer – Serviçosem Crédito Imobiliário Ltda. (jointly, “Interfile”), a leading provider of BPO services and solutions, including credit origination, for the banking and financialservices sector in Brazil.
4. ACCOUNTING POLICIES
There were no significant changes in accounting policies and calculation methods used for the interim condensed consolidated financial information as ofSeptember 30, 2018 in relation to those presented in the annual financial statements for the year ended December 31, 2017 except for IFRS 15 and IFRS 9 whichwere adopted on January 1, 2018.
a) Critical accounting estimates and assumptions
The preparation of the interim condensed consolidated financial information under IAS 34 requires the use of certain assumptions and estimates that affectthe recognized amount of assets, liabilities, income and expenses, as well as the related disclosures.
Some of the accounting policies applied in preparing the accompanying interim condensed consolidated financial information required Management toapply significant judgments in order to select the most appropriate assumptions for determining these estimates. These assumptions and estimates are based onManagement experience, the advice of consultants and experts, forecasts and other circumstances and expectations prevailing at year end. Management’sevaluation takes into account the global economic situation in the sector in which the Atento Group operates, as well as the future outlook for the business. Byvirtue of their nature, these judgments are inherently subject to uncertainty. Consequently, actual results could differ substantially from the estimates andassumptions used. Should this occur, the values of the related assets and liabilities would be adjusted accordingly.
41

Although these estimates were made on the basis of the best information available at each reporting date on the events analyzed, events that take place inthe future might make it necessary to change these estimates in coming years. Changes in accounting estimates would be applied prospectively in accordance withthe requirements of IAS 8, “Accounting Policies, Changes in Accounting Estimates and Errors”, recognizing the effects of the changes in estimates in the relatedinterim condensed consolidated statements of operations.
An explanation of the estimates and judgments that entail a significant risk of leading to a material adjustment in the carrying amounts of assets andliabilities in the coming financial period is as follow:
Usefullivesofproperty,plantandequipmentandintangibleassets
The accounting treatment of items of property, plant and equipment and intangible assets entails the use of estimates to determine their useful lives fordepreciation and amortization purposes. In determining the useful life, it is necessary to estimate the level of use of assets as well as forecast technological trends inthe assets. Assumptions regarding the level of use, the technological framework and the future development require a significant degree of judgment, bearing inmind that these aspects are rather difficult to foresee. Changes in the level of use of assets or in their technological development could result in a modification oftheir useful lives and, consequently, in the associated depreciation or amortization.
Impairmentofgoodwill
The Atento Group tests goodwill for impairment annually, in accordance with the accounting principle disclosed in the consolidated financial statementsfor the year ended December 31, 2017. Goodwill is subject to impairment testing as part of the cash-generating unit to which it has been allocated. The recoverableamounts of cash-generating units defined in order to identify potential impairment in goodwill are determined on the basis of value in use, applying five-yearfinancial forecasts based on the Atento Group’s strategic plans, approved and reviewed by Management. These calculations entail the use of assumptions andestimates and require a significant degree of judgment. The main variables considered in the sensitivity analyses are growth rates, discount rates using the WeightedAverage Cost of Capital (“WACC”) and the key business variables.
Deferredtaxes
The Atento Group assesses the recoverability of deferred tax assets based on estimates of future earnings. The ability to recover these deferred amountsdepends ultimately on the Atento Group’s ability to generate taxable earnings over the period in which the deferred tax assets remain deductible. This analysis isbased on the estimated timing of the reversal of deferred tax liabilities, as well as estimates of taxable earnings, which are sourced from internal projections and arecontinuously updated to reflect the latest trends.
The appropriate classification of tax assets and liabilities depends on a series of factors, including estimates as to the timing and realization of deferred taxassets and the projected tax payment schedule. Actual income tax receipts and payments could differ from the estimates made by the Atento Group as a result ofchanges in tax legislation or unforeseen transactions that could affect the tax balances.
The Atento Group has recognized deferred tax assets corresponding to losses carried forward since, based on internal projections, it is probable that it willgenerate future taxable profits against which they may be utilized.
The carrying amount of deferred income tax assets is reviewed at each reporting date and reduced to the extent that it is no longer probable that sufficienttaxable profits will be available to allow all or part of that deferred tax asset to be utilized. Unrecognized deferred income tax assets are reassessed at each reportingdate and are recognized to the extent that it has become probable that future taxable profits will allow the deferred tax asset to be recovered.
Provisionsandcontingencies
Provisions are recognized when the Atento Group has a present obligation as a result of a past event, it is probable that an outflow of resources will berequired to settle the obligation and a reliable estimate can be made of the amount of the obligation. This obligation may be legal or constructive, deriving from,inter alia, regulations, contracts, customary practice or public commitments that would lead third parties to reasonably expect that the Atento Group will assumecertain responsibilities. The amount of the provision is determined based on the best estimate of the outflow of resources embodying economic benefit that will berequired to settle the obligation, taking into account all available information as of the reporting date, including the opinions of independent experts such as legalcounsel or consultants.
42

No provision is recognized if the amount of liability cannot be estimated reliably. In such cases, the relevant information is disclosed in the notes to theinterim condensed consolidated financial information.
Given the uncertainties inherent in the estimates used to determine the amount of provisions, actual outflows of resources may differ from the amountsrecognized originally on the basis of these estimates.
Fairvalueofderivatives
The Atento Group uses derivative financial instruments to mitigate risks, primarily derived from possible fluctuations in interest and exchange rates.Derivatives are recognized at the inception of the contract at fair value.
The fair values of derivative financial instruments are calculated on the basis of observable market data available, either in terms of market prices orthrough the application of valuation techniques. The valuation techniques used to calculate the fair value of derivative financial instruments include the discountingof future cash flow associated with the instruments, applying assumptions based on market conditions at the valuation date or using prices established for similarinstruments, among others. These estimates are based on available market information and appropriate valuation techniques. The fair values calculated could differsignificantly if other market assumptions and/or estimation techniques were applied.
b) New standards and interpretations not yet adopted
The reporting standards below were published and are mandatory for future annual reporting periods:
Title of standard IFRS 16 Leases
Nature of change
IFRS 16 was issued in January 2016. It will result in almost all leases being recognized on the balance sheet, as thedistinction between operating and finance leases is removed. Under the new standard, an asset (the right to use the leaseditem) and a financial liability to pay rentals are recognized. The only exceptions are short-term and low-value leases.
The accounting for lessors will not significantly change.
Impact The standard will affect primarily the accounting for the Group’s operating leases. As at the reporting date, the Group hasoperating lease commitments of 188,157 thousand U.S. dollars. However, the Group has not yet determined to what extentthese commitments will result in the recognition of an asset and a liability for future payments and how this will affect theGroup’s profit and classification of cash flows.
Some of the commitments may be covered by the exception for short-term and low-value leases and some commitmentsmay relate to arrangements that will not qualify as leases under IFRS 16.
Mandatory application date/Date of adoption by group
Mandatory for financial years commencing on or after January 1, 2019. At this stage, the Atento Group does not intend toadopt the standard before its effective date.
43

Title of standard
IFRIC Interpretation 23 Uncertainty over Income Tax Treatment
Key requirements
The Interpretation addresses the accounting for income taxes when tax treatments involve uncertainty that affects theapplication of IAS 12 and does not apply to taxes or levies outside the scope of IAS 12, nor does it specifically includerequirements relating to interest and penalties associated with uncertain tax treatments.
The Interpretation specifically addresses the following:
· Whether an entity considers uncertain tax treatments separately;
· The assumptions an entity makes about the examination of tax treatments by taxation authorities;
· How an entity determines taxable profit (tax loss), tax bases, unused tax losses, unused tax credits and tax rates;
· How an entity considers changes in facts and circumstances.
Mandatory application date/Date of adoption by group
An entity must determine whether to consider each uncertain tax treatment separately or together with one or more otheruncertain tax treatments. The approach that better predicts the resolution of the uncertainty should be followed.
The interpretation is effective for annual reporting periods beginning on or after January 1, 2019, but certain transition reliefsare available. The Group will apply interpretation from its effective date.
There are no other standards that are not yet effective and that would be expected to have a material impact on the Group in the current or future reportingperiods and on foreseeable future transactions.
5. MANAGEMENT OF FINANCIAL RISK
5.1 Financial risk factors
The Atento Group's activities are exposed to various types of financial risks: market risk (including currency risk, interest rate risk and country risk), creditrisk and liquidity risk. The Atento Group's global risk management policy aims to minimize the potential adverse effects of these risks on the Atento Group's resultsof operations. The Atento Group also uses derivative financial instruments to hedge certain risk exposures.
This unaudited interim condensed consolidated financial information does not include all financial risk management information and disclosures requiredin the annual financial statements and therefore they should be read in conjunction with the Atento Group’s consolidated financial statements as of and for the yearended December 31, 2017. For the nine months ended September 30, 2018 there have not been changes in any risk management policies.
Country Risk
To manage or mitigate country risk, we repatriate the funds generated in the Americas and Brazil that are not required for the pursuit of new profitablebusiness opportunities in the region and subject to the restrictions of our financing agreements.
Interest Rate Risk
Interest rate risk arises mainly as a result of changes in interest rates which affect: finance costs of debt bearing interest at variable rates (or short-termmaturity debt expected to be renewed), as a result of fluctuations in interest rates, and the value of non-current liabilities that bear interest at fixed rates. AtentoGroup’s finance costs are exposed to fluctuation in interest rates. As of September 30, 2018, 8.5% of Atento Group’s finance costs are exposed to fluctuations ininterest rates (excluding the effect of financial derivative instruments), compared to 12.8% as of December 31, 2017.
As of September 30, 2018, the estimated fair value of the interest rate hedging instruments related to the Brazilian Debentures totaled 596 thousand U.S.dollars (1,212 thousand U.S. dollars as of December 31, 2017), which was recorded as a financial liability. Based on our total indebtedness of 457,979 thousandU.S. dollars as of September 30, 2018 without taking into account the impact of our interest rate hedging instruments referred to above, a 1% change in interestrates would impact our net interest expense by 338 thousand U.S. dollars.
44

Foreign Currency Risk
Our foreign currency risk arises from our local currency revenues, receivables and payables while the U.S. dollar is our presentation currency. We benefitto a certain degree from the fact that the revenue we collect in each country, in which we have operations, is generally denominated in the same currency as themajority of the expenses we incur.
In accordance with our risk management policy, whenever we deem it appropriate, we manage foreign currency risk by using derivatives to hedge anyexposure incurred in currencies other than those of the functional currency of the countries.
As of September 30, 2018, the estimated fair value of the cross-currency swaps designated as hedging instruments totaled an asset of 8,661 thousand U.S.dollars (asset of 3,037 thousand U.S. dollars, as of December 31, 2017).
Credit Risk
The Atento Group seeks to conduct all of its business with reputable national and international companies and institutions established in their countries oforigin, to minimize credit risk. As a result of this policy, the Atento Group has no material adjustments to make to its credit accounts.
Credit risk arising from cash and cash equivalents is managed by placing cash surpluses in high quality and highly liquid money-market assets. Theseplacements are regulated by a master agreement revised annually on the basis of the conditions prevailing in the markets and the countries where Atento operate.The master agreement establishes: (i) the maximum amounts to be invested per counterparty, based on their ratings (long- and short-term debt rating); (ii) themaximum period of the investment; and (iii) the instruments in which the surpluses may be invested.
The Atento Group’s maximum exposure to credit risk is primarily limited to the carrying amounts of its financial assets. The Atento Group holds noguarantees as collection insurance. The Atento Group carries out significant transactions with the Telefónica Group, which amounted to 96,403 thousand U.S.dollars as of September 30, 2018 (207,173 thousand U.S. dollars as of December 31, 2017).
Liquidity Risk
The Atento Group seeks to match its debt maturity schedule to its capacity to generate cash flow to meet the payments falling due, factoring in a degree ofcushion. In practice, this has meant that the Atento Group’s average debt maturity must be longer than the length of time we required paying its debt (assuming thatinternal projections are met).
Capital Management
The Atento Group’s Finance Department, which is in charge of the capital management, takes various factors into consideration when determining theGroup’s capital structure.
The Atento Group’s capital management goal is to determine the financial resources necessary both to continue its recurring activities and to maintain acapital structure that optimizes own and borrowed funds.
The Atento Group sets an optimal debt level in order to maintain a flexible and comfortable medium-term borrowing structure in order to be able to carryout its routine activities under normal conditions and to address new opportunities for growth. Debt levels are kept in line with forecast future cash flows and withquantitative restrictions imposed under financing contracts.
In addition to these general guidelines, we take into account other considerations and specifics when determining our financial structure, such as countryrisk, tax efficiency and volatility in cash flow generation.
Among the restrictions imposed under financing arrangements, the debenture contract lays out certain general obligations and disclosures in respect of thelending institutions, specifically, the borrower Atento Brasil S.A. must comply with the quarterly net financial debt/EBITDA ratio set out in the contract terms.
45

In addition to these general guidelines, we take into account other considerations and specifics when determining our financial structure, such as countryrisk, tax efficiency and volatility in cash flow generation.
The contract also sets out additional restrictions, including limitations on dividends, payments and distributions to shareholders and capacity to incuradditional debt.
The Super Senior Revolving Credit Facility carries no financial covenant obligations regarding debt levels. However, the notes do impose limitations ofthe distributions on dividends, payments or distributions to shareholders, the incurring of additional debt, and on investments and disposal of assets.
As of the date of these interim condensed consolidated financial information, the Atento Group was in compliance with all restrictions established in theaforementioned financing contracts and does not foresee any future non-compliance. To that end, the Atento Group regularly monitors figures for net financial debtwith third parties and EBITDA.
5.2 Fair value estimation
a) Level 1: The fair value of financial instruments traded on active markets is based on the quoted market price at the reporting date.
b) Level 2: The fair value of financial instruments not traded in active market (i.e. OTC derivatives) is determined using valuation techniques.Valuation techniques maximize the use of available observable market data, and place as little reliance as possible on specific companyestimates. If all of the significant inputs required to calculate the fair value of financial instrument are observable, the instrument is classified inLevel 2. The Atento Group’s Level 2 financial instruments comprise interest rate swaps used to hedge floating rate loans and cross currencyswaps.
c) Level 3: If one or more significant inputs are not based on observable market data, the instrument is classified in Level 3.
The Atento Group’s assets and liabilities measured at fair value as of December 31, 2017 and September 30, 2018 are classified as Level 2. No transferswere carried out between the different levels during the period.
6. SEGMENT INFORMATION
The following tables present financial information for the Atento Group’s operating segments for the nine months ended September 30, 2017 and 2018 (inthousand U.S. dollars):
46

For the nine months ended September 30, 2017 Thousands of U.S. dollars
EMEA Americas Brazil Other and
eliminations Total Group
(unaudited)Sales to other companies 57,373 323,535 497,310 1 878,219Sales to Telefónica Group 109,560 232,227 222,988 - 564,775Sales to other group companies 1 1,707 - (1,708) -Other operating income and expense (159,269) (504,342) (633,938) 5,312 (1,292,237)EBITDA 7,665 53,127 86,360 3,605 150,757Depreciation and amortization (6,935) (28,173) (42,869) (395) (78,372)Operating profit/(loss) 730 24,954 43,491 3,210 72,385Financial results (16,748) (10,332) (25,722) (15,973) (68,775)Income tax 3,623 (9,147) (3,880) 1,145 (8,259)Profit/(loss) from continuing operations (12,395) 5,475 13,889 (11,618) (4,649)Profit/(loss) for the period (12,395) 5,475 13,889 (11,618) (4,649)EBITDA 7,665 53,127 86,360 3,605 150,757Restructuring costs 1,665 4,523 3,591 464 10,243Other 21 4,196 172 459 4,848Shared services expenses 2,237 1,023 4,952 (8,212) -Adjusted EBITDA (unaudited) 11,588 62,869 95,075 (3,684) 165,848Capital expenditure 2,055 13,556 20,113 (1) 35,723Intangible, Goodwill and PP&E (as of December 31, 2017) 49,101 178,485 306,672 1,185 535,443Allocated assets (as of December 31, 2017) 401,332 603,770 677,149 (351,946) 1,330,305Allocated liabilities (as of December 31, 2017) 126,575 280,575 499,670 45,646 952,466 For the nine months ended September 30, 2018 Thousands of U.S. dollars
EMEA Americas Brazil Other and
eliminations Total Group
(unaudited)Sales to other companies 68,951 325,251 459,940 1 854,143Sales to Telefónica Group 112,070 226,917 203,205 - 542,192Sales to other group companies - 6,010 1,326 (7,287) 49Other operating income and expense (169,859) (502,929) (604,866) 27,047 (1,250,607)EBITDA 11,162 55,249 59,605 19,761 145,777Depreciation and amortization (7,399) (26,068) (37,622) (583) (71,672)Operating profit/(loss) 3,763 29,181 21,983 19,178 74,105Financial results (1,680) (18,263) (26,680) (13,187) (59,810)Income tax (615) (4,251) 2,038 (6,028) (8,856)Profit/(loss) from continuing operations 1,468 6,667 (2,659) (37) 5,439Profit/(loss) for the period 1,468 6,667 (2,659) (37) 5,439EBITDA 11,162 55,249 59,605 19,761 145,777Shared services expenses 5,536 11,519 10,244 (27,299) -Adjusted EBITDA (unaudited) 16,698 66,768 69,849 (7,538) 145,777Capital expenditure 4,780 28,532 34,013 - 67,325Intangible, Goodwill and PP&E (as of September 30, 2018) 44,806 163,817 247,746 2,226 458,595Allocated assets (as of September 30, 2018) 396,982 579,312 588,285 (354,457) 1,210,122Allocated liabilities (as of September 30, 2018) 122,590 266,336 440,508 63,878 893,312
47

"Other and eliminations" includes activities of the intermediate holding in Spain (Atento Spain Holdco, S.L.U.), Luxembourg holdings, as well as inter-group transactions between segments.
7. INTANGIBLE ASSETS
Atento Brasil S.A. entered into Master Agreements regarding the acquisition of rights to use software licenses to Atento and its affiliates in Brazil, Chile,Colombia, El Salvador, Spain, Guatemala, Mexico, Peru, Puerto Rico and United States of America (“U.S.A.”) including the Company’s corporate structure areas.This agreement totaled 38,526 thousand U.S. dollars.
8. GOODWILL
The variations of amounts related to the period ended December 31, 2017 and September 30, 2018 are mainly related to exchange variance, due toBrazilian Real and Argentine Peso devaluation against the U.S. dollar.
9. PROPERTY, PLANT AND EQUIPMENT (PP&E)
The variations of amounts related to the period ended December 31, 2017 and September 30, 2018 are related mainly to (i) the negative impact ofexchange variance, due to Brazilian Real and Argentine Peso devaluation against the U.S. dollar and (ii) the positive impact of the construction of a new site inPuerto Rico in the amount of 5,11 9 thousand U.S. dollars, the construction of new sites in Mexico (Azafran and Centro Histórico) in the amount of 1,438 thousandU.S. dollars, development of software Visibility and Control in Atento Brasil in the amount of 2,32 4 thousand U.S. dollars and implementation of a new site inAtento Brasil in the amount of 3,54 0 thousand U.S. dollars.
10. EQUITY
Share capital
As of September 30, 2018, share capital was 48 thousand U.S. dollars (€33,304), divided into 73,909,056 shares. PikCo owns 68.14% of ordinary sharesof Atento S.A.
Share premium
The share premium refers to the difference between the subscription price that the shareholders paid for the shares and their nominal value. Since this is acapital reserve, it can only be used to increase capital, offset losses, redeem, reimburse or repurchase shares.
Reserve for acquisition of non-controlling interest
Refers to options attributable to the parent company in the acquisition of RBrasil and Interfile in amount of 23,531 thousand U.S. dollars.
Treasury shares
Atento S.A. repurchased 710,497 shares in the third quarter at a cost of 5,337 thousand of U.S. dollars and an average price of $7.51.
48

Dividends
On October 31, 2017, our Board of Directors declared a cash interim dividend of 24,147 thousand U.S. dollars with dividends declared per share of $0.33,paid on November 28, 2017.
Legal reserve
According to commercial legislation in Luxembourg, Atento S.A. must transfer 5% of its year profits to legal reserve until the amount reaches 10% ofshare capital. The legal reserve cannot be distributed.
At December 31, 2017 and September 30, 2018, no legal reserve had been established due to the losses incurred by Atento S.A.
Translation differences
Translation differences reflect the differences arising on account of exchange rate fluctuations when converting the net assets of fully consolidated foreigncompanies from local currency into Atento Group’s presentation currency (U.S. dollars).
Stock - based compensation
a) Description of share - based payment arrangements
In 2014, Atento granted the following two share-based payment arrangements to directors, officers and other employees, for the Company and itssubsidiaries. The share-based payments are Time Restricted Stock Units (“TRSUs”) and Performance Restricted Stock Units (“PRSU”). In 2016, Atento grantedtwo news share-based payment arrangements (both of them are Time Restricted Stock Units – “TRSUs”) to directors, officers and other employees, for theCompany and its subsidiaries. The reference for these share-based payment arrangements is made to the annual financial statements for December 31, 2017, for adescription of the arrangement and their vesting conditions.
On July 1, 2016, Atento granted the following share-based payment arrangement to directors, officers and other employees, for the Company and itssubsidiaries:
1. Time Restricted Stock Units (“RSU”) (equity settled)
· Grant date: July 1, 2016
· Amount: 1,384,982 RSUs
· Vesting period: 100% of the RSUs vest on January 4, 2019
· There are no other vesting conditions
On July 3, 2017, Atento granted a new share-based payment arrangement to directors, officers and other employees, for the Company and its subsidiaries.The share-based payment had the following arrangements:
1. Time Restricted Stock Units (“RSUs”) (equity settled)
· Grant date: July 3, 2017
· Amount: 886,187 RSUs
· Vesting period: 100% of the RSUs vests on January 2, 2020
· There are no other vesting conditions
49

On July 2, 2018, Atento granted a new share-based payment arrangement to directors, officers and other employees, for the Company and its subsidiaries.The share-based payment had the following arrangements:
1. Time Restricted Stock Units (“RSUs”) (equity settled)
· Grant date: July 2, 2018
· Amount: 1,065,220 RSUs
· Vesting period: 100% of the RSUs vests on January 4, 2021
· There are no other vesting conditions
b) Measurement of fair value
The fair value of the RSUs, for all arrangements, has been measured using the BlackScholes model. For all arrangements are equity settled and the fairvalue of RSUs is measured at grant date and not remeasured subsequently.
c) Outstanding RSUs
As of September 30, 2018 , there are 1,108,578 Time RSUs outstanding to the 2016 Grant , 815,693 Time RSUs outstanding to the 2017 Grant and1,065,220 time RSUs outstanding to the 2018 Grant . Holders of RSUs will receive the equivalent in shares of Atento S.A. without cash settlement of stock valueswhen the RSUs.
The2016Grant Time RSUOutstanding December 31, 2017 1,148,625
Forfeited (*) (40,047)
Outstanding September 30, 2018 1,108,578
(*) RSUs forfeited during the period due to employees failing to satisfy the service conditions. The2017Grant Time RSUOutstanding December 31, 2017 861,863
Forfeited (*) (46,170)
Outstanding September 30, 2018 815,693
(*) RSUs forfeited during the period due to employees failing to satisfy the service conditions. The2018Grant Time RSUOutstanding 1,065,220
Forfeited (*) -
Outstanding September 30, 2018 1,065,220
(*) RSUs forfeited during the period due to employees failing to satisfy the service conditions.
d) Impacts in Profit or Loss
In the nine months ended September 30, 2018, 4,974 thousand U.S. dollars related to stock-based compensation and the related social charges wererecorded as Employee benefit expenses.
11. FINANCIAL ASSETS
As of December 31, 2017 and September 30, 2018, all the financial assets of the Company are classified as loans and receivables, except for the derivativefinancial instruments that are categorized as fair value through profit or loss.
50

Credit risk arises from the possibility that the Atento Group might not recover its financial assets at the amounts recognized and in the established terms.Atento Group Management considers that the carrying amount of financial assets is similar to the fair value.
As of September 30, 2018, Atento Teleservicios España S.A., Atento Chile S.A., Atento Colombia S.A., Teleatento del Perú S.A.C, Atento Brasil S.A. andAtento El Salvador S.A. de C.V. have entered into factoring agreements without recourse, anticipating an amount of 162,615 thousand U.S. dollars, receiving cashnet of discount, the related trade receivables were realized and interest expenses were recognized in the statement of operations.
Details of other financial assets as of December 31, 2017 and September 30, 2018 are as follow:
Thousands of U.S. dollars
12/31/2017 9/30/2018
(audited) (unaudited)
Other non-current receivables (*) 11,125 11,090Non-current guarantees and deposits 49,097 51,368Total non-current 60,222 62,458
Other current receivables 806 49Current guarantees and deposits 1,005 959Total current 1,810 1,008
Total 62,032 63,466
(*) “Other non-current receivables” as of September 30, 2018 primarily comprise a loan granted by the subsidiary RBrasil to third parties. The effective annualinterest rate is CDI + 3.75% p.a., maturing up to five years beginning in May 4, 2017, when the value of the loan will be amortized in a single installment.
The breakdown of “Trade and other receivables” as of December 31, 2017 and September 30, 2018 is as follows:
Thousands of U.S. dollars
12/31/2017 9/30/2018
(audited) (unaudited)Non-current trade receivables 6,923 5,014
Other non-financial assets (*) 14,754 7,366
Total non-current 21,677 12,380Current trade receivables 358,311 350,044
Other receivables (**) 13,225 22,973Prepayments 7,849 4,777Personnel 9,180 13,564Total current 388,565 391,358Total 410,242 403,738
(*) “Other non-financial assets” as of September 30, 2018 primarily comprise the litigation underway with the Brazilian social security authority ( InstitutoNacionaldoSeguroSocial), recorded in Atento Brasil.
51

For the purpose of the interim condensed consolidated financial statements of cash flows, cash and cash equivalents are comprised of the following:
Thousands of U.S. dollars
12/31/2017 9/30/2018(audited) (unaudited)
Deposits held at call 111,495 76,895Short-term financial investments 30,267 20,829Total 141,762 97,724
“Short-term financial investments” comprises short-term fixed-income securities in Brazil, which mature in less than 90 days and accrue interest pegged tothe CDI.
12. FINANCIAL LIABILITIES
The breakdown of the Company’s financial liabilities by category as of December 31, 2017 and September 30, 2018 is as follows:
Debt with third parties as of December 31, 2017 and September 30, 2018 is as follows:
Thousands of U.S. dollars
12/31/2017 9/30/2018(audited) (unaudited)
Senior Secured Notes 388,818 389,932Brazilian bonds – Debentures 16,797 12,367Bank borrowing 27,878 8,987Finance lease payables 6,238 2,982Total non-current 439,731 414,268Senior Secured Notes 9,528 3,403Brazilian bonds – Debentures 4,258 3,882Bank borrowing 28,514 33,171Finance lease payables 4,260 3,255Total current 46,560 43,711TOTAL DEBT WITH THIRD PARTIES 486,291 457,979
Senior Secured Notes
On January 29, 2013, Atento Luxco 1 S.A. issued 300,000 thousand U.S. dollars aggregate principal amount of Senior Secured Notes that would matureon January 29, 2020. The 2020 Senior Secured Notes were senior secured obligations of Atento Luxco 1 and were guaranteed on a senior secured first-prioritybasis by Atento Luxco 1 and certain of its subsidiaries excluding Argentina and Brazil subsidiaries. The Senior Secured Notes were also guaranteed on anunsecured basis by Atento S.A. and Midco.
The indenture governing the 2020 Senior Secured Notes contained covenants that, among other things, restricted the ability of Atento Luxco 1 and certainof its subsidiaries to: incur or guarantee additional indebtedness; pay dividends or make distributions or redeem or repurchase capital stock; issue, redeem orrepurchase certain debt; issue certain preferred stock or similar equity securities; make loans and investments; sell assets; incur liens; enter into transaction withaffiliates; enter into agreements restricting certain subsidiaries’ ability to pay dividends; and consolidate, merge or sell all or substantially all of our assets. Thesecovenants were subject to a number of important exceptions and qualifications. In addition, in certain circumstances, if Atento Luxco 1 sell assets or experiencescertain changes of control, it must offer to purchase the 2020 Senior Secured Notes.
52

On August 19, 2017, in connection with the offering described below, Atento Luxco 1 redeemed all of the outstanding amount of the 2020 Senior SecuredNotes. The notes were called at a premium over face value of 103.688% per note, resulting in a total call cost of 11,064 thousand U.S. dollars recorded in financecosts during August 2017, along with the remaining balance of the 2020 Senior Secured Notes issuance amortized cost of 4,920 thousand U.S. dollars.
On August 10, 2017, Atento Luxco 1 S.A., closed an offering of 400,000 thousand U.S. dollars aggregate principal amount of 6.125% Senior SecuredNotes due 2022 in a private placement transaction. The notes are due on August 2022. The 2022 Senior Secured Notes are guaranteed on a senior secured basis bycertain of Atento’s wholly-owned subsidiaries. The issuance costs of 12,574 thousand U.S. dollars related to this new issuance are recorded at amortized cost usingthe effective interest method.
The terms of the Indenture, among other things, limit, in certain circumstances, the ability of Atento Luxco 1 and its restricted subsidiaries to: incur certainadditional indebtedness; make certain dividends, distributions, investments and other restricted payments; sell the property or assets to another person; incuradditional liens; guarantee additional debt; and enter into transaction with affiliates. As of September 30, 2018, we were in compliance with these covenants. Theoutstanding amount on September 30, 2018 is 393,335 thousand U.S. dollars.
All interest payments are made on a half yearly basis.
The fair value of the Senior Secured Notes, calculated on the basis of their quoted price at September 30, 2018, is 379,110 thousand U.S. dollars.
The fair value hierarchy of the Senior Secured Notes is Level 1 as the fair value is based on the quoted market price at the reporting date.
Debentures
There were no changes in the context of the note, and Company’s Management considers the variations of amounts related to the period ended December31, 2017 in relation to the period ended September 30, 2018, not relevant, except for the interest accrued and the contractual amortization (principal and interest) inthe period and the exchange rate impact . The outstanding amount on September 30, 2018 is 16,249 thousand U.S. dollars.
Bank borrowings
On February 3, 2014, Atento Brasil S.A. entered into a credit agreement with Banco Nacional de Desenvolvimento Econômico e Social – BNDES(“BNDES”) in an aggregate principal amount of 300,000 thousand Brazilian reais (the “BNDES Credit Facility”), equivalent to 7 4 ,917 thousand U.S. dollars as ofSeptember 30, 2018 .
The total amount of the BNDES Credit Facility is divided into five tranches subject to the following interest rates:
Tranche Interest Rate
Tranche A Long-Term Interest Rate ( TaxadeJurosdeLongoPrazo-TJLP) plus 2.5% per annumTranche B SELIC Rate plus 2.5% per annumTranche C 4.0% per yearTranche D 6.0% per yearTranche E Long-Term Interest Rate ( TaxadeJurosdeLongoPrazo-TJLP)
Each tranche intends to finance different purposes, as described below:
• Tranche A and B: investments in workstations, infrastructure, technology, services and software development, marketing and commercialization, withinthe scope of BNDES program – BNDES Prosoft.
53

• Tranche C: IT equipment acquisition, covered by law 8.248/91, with national technology, necessary to execute the project described on tranches “A” and“B”
• Tranche D: acquisitions of domestic machinery and equipment, within the criteria of FINAME, necessary to execute the project described on tranches “A”and “B”
• Tranche E: investments in social projects to be executed by Atento Brasil S.A.
BNDES releases amounts under the credit facility once the debtor met certain requirements in the contract including delivering the guarantee (stand-by
letter) and demonstrating the expenditure related to the project. Since the beginning of the credit facility, the following amounts were released:
(thousands of U.S. dollars) Date Tranche A Tranche B Tranche C Tranche D Tranche E TotalMarch 27, 2014 6,329 3,125 4,375 312 - 14,141April 16, 2014 2,631 1,315 1,841 132 - 5,919July 16,2014 - - - - 150 150
August 13, 2014 15,633 1,708 2,511 270 - 20,122Subtotal 2014 24,593 6,148 8,727 714 150 40,332March 26, 2015 4,586 1,146 1,627 133 - 7,492April 17, 2015 9,171 2,293 3,255 266 - 14,985December 21, 2015 7,212 1,797 - - 175 9,184
Subtotal 2015 20,969 5,236 4,882 399 175 31,661TOTAL 45,562 11,384 13,609 1,113 325 71,993
This facility should be repaid in 48 monthly installments. The first payment was made on March 15, 2016 and the last payment will be due on February15, 2020.
The BNDES Credit Facility contains covenants that restrict Atento Brasil S.A.’s ability to transfer, assign, change or sell the intellectual property rightsrelated to technology and products developed by Atento Brasil S.A. with the proceeds from the BNDES Credit Facility. As of September 30, 2018, Atento BrasilS.A. was in compliance with these covenants. The BNDES Credit Facility does not contain any other financial maintenance covenant.
The BNDES Credit Facility contains customary events of default including the following: (i) reduction of the number of employees without providingprogram support for outplacement, as training, job seeking assistance and obtaining pre-approval of BNDES; (ii) existence of unfavorable court decision against theCompany for the use of children as workforce, slavery or any environmental crimes and (iii) inclusion in the by-laws of Atento Brasil S.A. of any provision thatrestricts Atento Brasil S.A’s ability to comply with its financial obligations under the BNDES Credit Facility.
On September 26, 2016, Atento Brasil S.A. entered into a new credit agreement with BNDES in an aggregate principal amount of 22,000 thousandBrazilian Reais, equivalent to 5,706 thousand U.S. dollars as of September 30, 2018. The interest rate of this facility is Long-Term Interest Rate (Taxa de Juros deLongo Prazo - TJLP) plus 2.0% per annum. The facility should be repaid in 48 monthly installments. The first payment will be due on November 15, 2018 and thelast payment will be due on October 15, 2022. This facility is intended to finance an energy efficiency project to reduce power consumption by implementing newlightening, air conditioning and automation technology. On November 24, 2017, 6,500 thousand Brazilian Reais (equivalent to 1,686 thousand U.S. dollars) werereleased under this facility.
As of September 30, 2018, the outstanding amount under BNDES Credit Facility was 27,802 thousand U.S. dollars.
54

On August 10, 2017, Atento Luxco 1 S.A. entered into a new Super Senior Revolving Credit Facility (the “Super Senior Revolving Credit Facility”) whichprovides borrowings capacity of up to 50,000 thousand U.S. dollars and will mature on February 10, 2022. Banco Bilbao Vizcaya Argentaria, S.A., as the agent, theCollateral Agent and BBVA Bancomer, S.A., Institución de Banca Múltiple, Grupo Financiero BBVA Bancomer, Morgan Stanley Bank N.A. and Goldman SachsBank USA are acting as arrangers and lenders under the Super Senior Revolving Credit Facility.
The Super Senior Revolving Credit Facility may be utilized in the form of multi-currency advances for terms of one, two, three or six months. The SuperSenior Revolving Credit Facility bears interest at a rate per annum equal to LIBOR or, for borrowings in euro, EURIBOR or, for borrowings in Mexican Pesos,TIIE plus an opening margin of 4.25% per annum. The margin may be reduced under a margin ratchet to 3.75% per annum by reference to the consolidated seniorsecured net leverage ratio and the satisfaction of certain other conditions.
The terms of the Super Senior Revolving Credit Facility Agreement limit, among other things, the ability of the Issuer and its restricted subsidiaries to (i)incur additional indebtedness or guarantee indebtedness; (ii) create liens or use assets as security in other transactions; (iii) declare or pay dividends, redeem stockor make other distributions to stockholders; (iv) make investments; (v) merge, amalgamate or consolidate, or sell, transfer, lease or dispose of substantially all ofthe assets of the Issuer and its restricted subsidiaries; (vi) enter into transactions with affiliates; (vii) sell or transfer certain assets; and (viii) agree to certainrestrictions on the ability of restricted subsidiaries to make payments to the Issuer and its restricted subsidiaries. These covenants are subject to a number ofimportant conditions, qualifications, exceptions and limitations that are described in the Super Senior Revolving Credit Facility Agreement.
The Super Senior Revolving Credit Facility Agreement includes a financial covenant requiring the drawn super senior leverage ratio not to exceed0.35:1.00 (the “SSRCF Financial Covenant”). The SSRCF Financial Covenant is calculated as the ratio of consolidated drawn super senior facilities debt toconsolidated pro forma EBITDA for the twelve-month period preceding the relevant quarterly testing date and is tested quarterly on a rolling basis, subject to theSuper Senior Revolving Credit Facility being at least 35% drawn (excluding letters of credit (or bank guarantees), ancillary facilities and any related fees orexpenses) on the relevant test date. The SSRCF Financial Covenant only acts as a draw stop to new drawings under the Revolving Credit Facility and, if breached,will not trigger a default or an event of default under the Super Senior Revolving Credit Facility Agreement. The Issuer has four equity cure rights in respect of theSSRCF Financial Covenant prior to the termination date of the Super Senior Revolving Credit Facility Agreement, and no more than two cure rights may beexercised in any four consecutive financial quarters. As of September 30, 2018, we were in compliance with this covenant. On September 14, 2017, Atento Luxco 1S.A. and Atento Brasil S.A. entered into an Agreement for a Common Revolving Credit Facility Line with Santander Brasil, Estabelecimento Financeiro de CréditoS.A. in respect of a bi-lateral, multi-currency revolving credit facilities. Up to $30.0 million of commitments are available for the drawing of cash loans in Euro,Mexican Pesos (MXN) and Colombian Pesos (COP). The original borrowers under this facility are Atento Colombia S.A, Atento Teleservicios España, S.A.U andAtento Servicios, S.A. de C.V. This facility is guaranteed by Atento Luxco 1 S.A. and Atento Brasil S.A. on a joint-and-several basis. This facility matures oneyear after the date of the Agreement. As of September 30, 2018, the outstanding amount under this facility was zero.
On March 5, 2018, Atento Brasil S.A. entered into an agreement with Banco ABC Brasil for an amount of 10,092 thousand U.S. dollars maturing onSeptember 3, 2018 with an annual interest rate of 3.40%. In connection with the loan, Atento Brasil S.A. entered into a swap agreement through which it receivesfixed interest rates in U.S. dollars, in the same amount of the loan agreement, and pays variable interest rate at a rate per annum equal to the average daily rate ofthe one day “over extragroup” – DI – Interfinancial Deposits (as such rate is disclosed by CETIP in the daily release available on its web page), plus a spread of2.10% over 33,000 thousand Brazilian Reais. As of September 30, 2018, the outstanding balance was zero.
Derivatives
Details of derivative financial instruments as of December 31, 2017 and September 30, 2018 are as follows:
Thousands of U.S. dollars 12/31/2017 09/30/2018 Assets Liabilities Assets Liabilities Interest rate swaps - cash flow hedges - (1,212) - (596)Cross currency swaps - net investment hedges 7,429 (5,140) 1,650 (2,241)Cross currency swaps - that do not meet the criteria for hedgeaccounting 748 - 9,252 -Total 8,177 (6,352) 10,902 (2,837) Non-current portion 8,177 (5,140) 10,902 (2,241)Current portion - (1,212) - (596)
55
Derivatives held for trading are classified as current assets or current liabilities. The fair value of a hedging derivative is classified as a non-current asset ora non-current liability, as applicable, if the remaining maturity of the hedged item exceeds twelve months. Otherwise, it is classified as a current asset or liability.
In connection with the Refinancing process and the repayment of the first Brazilian Debentures, the hedge accounting for the interest rate swap wasdiscontinued and the OCI balance was transferred to finance cost. Thereafter, any changes in fair value will be directly recognized in statement of operations.
On March 5, 2018, Atento Brasil S.A. entered into a cross-currency swap to hedge a USD loan of 10,092 thousand U.S. dollars at a fixed rate of 3.40%exchanged to a 33,000 thousand Brazilian Reais with interest rate of the average daily rate of the one day “over extra-group” – DI – Interfinancial Deposits - plus aspread of 2.10% per annum. This swap was liquidated in September 3, 2018.
On April 1, 2015, the Company started a hedge accounting for net investment hedge related to exchange risk between the U.S. dollar and foreignoperations in Euro (EUR), Mexican Peso (MXN), Colombian Peso (COP) and Peruvian Nuevo Sol (PEN). In connection with the Refinancing process, 8 of the 10derivatives contracts designated as Net Investment Hedges were terminated between August 1, 2017 and August 4, 2017, generating positive cash of 46,080thousand U.S. dollars, net of charges. During August 2017, Atento Luxco 1 also entered into new Cross-Currency Swaps related to exchange risk between U.S.dollars and Euro (EUR), Mexican Peso (MXN), Brazilian Reais (BRL) and Peruvian Nuevo Sol (PEN). Except for the Cross-Currency Swap between U.S. dollarsand Brazilian Reais, all other Cross-Currency Swaps were designated for hedge accounting as net investment hedge.
As of September 30, 2018, details of interest rate swap, cross-currency swaps that do not qualify for hedge accounting and net investment hedges were asfollows:
56

Interest Rate Swap
Bank Maturity Notionalcurrency Index
Notional incontractcurrency
(thousands) Fair value
assets/(liability)
Othercomprehensiveincome, net of
taxes
Changein
OCI,net oftaxes
Statementsof
operations -Finance cost
Statementsof
operations- Change
in fairvalue
(unaudited) D/(C) D/(C) D/(C) D/(C) D/(C)
Itau Dec-18 BRL BRL CDI 135,000 (596) - - 922 - (596) - - 922 -
Cross Currency Swaps - that do not qualify for hedge accounting
Bank Maturity Purchasecurrency
Sellingcurrency
Notional(thousands)
Fair valueassets/(liability)
Othercomprehensive
income
Changein OCI,net oftaxes
Statementsof
operations -Finance cost
Statementsof
operations- Change
in fairvalue
(unaudited) D/(C) D/(C) D/(C) D/(C) D/(C)
Goldman Sachs Aug-22 BRL USD 754,440 9,252 - - (7,534) -
9,252 - - (7,534) -
Net Investment Hedge
Bank Maturity Purchasecurrency
Sellingcurrency
Notional(thousands)
Fair valueassets/(liability)
Othercomprehensive
income
Changein
OCI,net oftaxes
Statementsof
operations -Finance cost
Statementsof
operations- Change
in fairvalue
(unaudited) D/(C) D/(C) D/(C) D/(C) D/(C)
Nomura International Aug-22 EUR USD 34,109 (64) (5) 387 - -Goldman Sachs Aug-22 MXN USD 1,065,060 1,650 549 (7,806) - -Goldman Sachs Aug-22 PEN USD 194,460 (2,177) 3,719 1,040 - -Santander Jan-20 USD EUR 20,000 - 1,742 - - -Santander Jan-20 USD MXN 11,111 - (2,113) - - -Goldman Sachs Jan-20 USD EUR 48,000 - 3,587 - - -Goldman Sachs Jan-20 USD MXN 40,000 - (7,600) - - -Nomura International Jan-20 USD MXN 23,889 - (4,357) - - -Nomura International Jan-20 USD EUR 22,000 - 1,620 - - -Goldman Sachs Jan-18 USD PEN 13,800 - 22 (4) - -Goldman Sachs Jan-18 USD COP 7,200 - (80) (8) - -BBVA Jan-18 USD PEN 55,200 - 72 - - -BBVA Jan-18 USD COP 28,800 - (359) - - - (591) (3,203) (6,391) - -Total 8,065 (3,203) (6,391) (6,612) -Derivative financial instrument - asset 10,902 Derivative financial instrument - liability (2,837)
57

Gains and losses on net investment hedges accumulated in equity will be taken to the statements of operations when the foreign operation is partiallydisposed of or sold.
13. PROVISIONS AND CONTINGENCIES
Atento has contingent liabilities arising from lawsuits in the normal course of its business. Contingent liabilities with a probable likelihood of lossare recorded as liabilities and the breakdown is as follows:
Thousands of U.S. dollars 12/31/2017 9/30/2018 (audited) (unaudited)Non-current Provisions for liabilities 30,810 25,173Provisions for taxes 19,833 17,774Provisions for dismantling 9,249 8,215Other provisions 1,294 1,316Total non-current 61,186 52,478 Current Provisions for liabilities 10,543 3,722Provisions for taxes 5,641 5,623Provisions for dismantling - 10Other provisions 2,884 4,703Total current 19,068 14,058
“Provisions for liabilities” primarily relate to provisions for legal claims underway in Brazil. Atento Brasil S.A. has made payments in escrow related tolegal claims from ex-employees, amounting to 42,217 thousand U.S. dollars and 45,123 thousand U.S. dollars as of December 31, 2017 and September 30, 2018,respectively. Also, the variation of the period was impacted by the Brazilian Reais and Argentinian Peso depreciations against the U.S. dollar.
“Provisions for taxes” mainly relate to probable contingencies in Brazil with respect to social security payments and other taxes, which are subject tointerpretations by tax authorities. Atento Brasil S.A. has made payments in escrow related to taxes claims 4,407 thousand U.S. dollars and 3,423 thousand U.S.dollars as of December 31, 2017 and September 30, 2018 , respectively.
The amount recognized under “Provision for dismantling” corresponds to the necessary cost of dismantling of the installations held under operating leasesto bring them to its original condition.
As of September 30, 2018, lawsuits outstanding in the courts were as follows:
Brazil
At September 30, 2018, Atento Brasil was involved in 11,625 labor-related disputes (14,750 labor as of December 31, 2017), being 11,408 of labormassive and 217 of outliers and others, filed by Atento’s employees or ex-employees for various reasons, such as dismissals or claims over employment conditionsin general. The total amount of the main claims classified as possible was 51,630 thousand U.S. dollars (162,701 thousand U.S. dollars on December 31, 2017), ofwhich 16,082 thousand U.S. dollars Labor Massive-related, 17,340 thousand U.S. dollars Labor Outliers-related and 18,208 thousand U.S. dollars Special Laborcases related.
In addition, at September 30, 2018, there are labor-related disputes belonging to the company Atento Brasil 1 (formerly Casa Bahia Contact Center Ltda –“CBCC”) totaling 409 thousand U.S. dollars. According to the Company’s external attorneys, the risk of loss is probable.
58

Furthermore, it is important to highlight out that the Superior Labor Court of Appeals (Tribunal Superior do Trabalho) during the month of August 2015decided to amend the indexation rate related to labor contingencies. The decision alters the Reference Rate Index (TR) usually used to adjust the amount of thecontingencies to the Special Broad Consumer Price Index (Índice de Preços ao Consumidor Amplo Especial – IPCA-E). There are several questions about thismatter, especially the period to which change should be applied as well as if the new index is appropriate. In addition, during October 2015, the Supreme Court(STF) issued a “writ of Mandamus” to the Federation of Brazilian Banks (FEBRABAN) suspending the application of the new index (IPCA-E). On September 30,2017, a new decision of the Superior Labor Court of Appeals on the application of the index IPCA-E was amended, changing the initial date of the application ofthe index from June 30, 2009 to March 25, 2015. As early as December 2017 came the judgment of the Brazilian Bank Federation (FEBRABAN), declaringunfounded the suit proposed by FEBRABAN. With this unfounded, the effects of the injunction that had been granted by the STF were ceased. However,considering that this recent Supreme Court decision was rendered after the entry into force of Law 13,467 / 17 (Labor Reform), the conclusion that can be sustain itis that its effects would be limited to 25 March 2015 to 10 November 2017 because the new law gave a new text to the Article 879 of the Consolidated Labor Laws(CLT), to expressly determine that it will be apply the TR to upgrading of workers' claims arising from criminal conviction.
Thus, the Company considered this quarter the new modulation projection of the IPCA-E in labor, and this, the external opinion of our lawyers alsoconsidering as “possible” the probability of loss in an eventual dispute.
On September 30, 2018, the subsidiary RBrasil Soluções S.A. holds contingent liabilities of labor nature classified as possible in the amount of 50thousand U.S. dollars.
On September 30, 2018, the subsidiary Interfile holds contingent liabilities of labor nature and social charges classified as possible in the amount of 1,762thousand U.S. dollars.
As of September 30, 2018, Atento Brasil S.A. is party to 7 civil lawsuits ongoing for various reasons (8 on December 31, 2017) which, according to theCompany’s external attorneys, materialization of the risk event is possible. The total amount of the claims is 5,278 thousand U.S. dollars (5,953 thousand U.S.dollars on December 31, 2017).
As of September 30, 2018, Atento Brasil is party to 34 disputes ongoing with the tax authorities and social security authorities for various reasons relatingto infraction proceedings filed (42 on December 31, 2017) which, according to the Company’s external attorneys, materialization of the risk event is possible orprobable. The total amount of these claims is 39,612 thousand U.S. dollars (59,445 thousand U.S. dollars on December 31, 2017), of which 1,736 thousand U.S.dollars relate to claims that have been classified as probable by our internal and external lawyers, for which amount Atento Brasil has recorded a provision.
In March 2018, Atento Brasil S.A. received a tax notice from the Brazilian Federal Revenue Service, related to Corporate Income Tax (IRPJ) and SocialContribution on Net Income (CSLL) for the period from 2012 to 2015, due to the disallowance of the expenses on tax amortization of goodwill and deductibility ofcertain financing costs originated of the acquisition of Atento Brasil S.A. by Bain Capital in 2012, and the withholding taxes on payments made to certain of ourformer shareholders. The amount of the tax assessment from the Brazilian Federal Revenue Service, not including interest and penalties, was 105,268 thousandU.S. dollars, and was assessed by the Company’s outside legal counsel as possible loss. We disagree with the proposed tax assessment and we intend to defend ourposition, which we believe is meritorious, through applicable administrative and, if necessary, judicial remedies. Based on our interpretation of the relevant law andbased on the advice of our legal and tax advisors, we believe the position we have taken is sustainable. Consequently, no provisions are recognized regarding theseproceedings.
In addition, as of September 30, 2018, there are tax authorities disputes belonging to the company CBCC totaling 1,438 thousand U.S. dollars. Accordingto the Company’s external attorneys, materialization of the risk event is probable.
Spain
At September 30, 2018, Atento Teleservicios España S.A.U. including its branches and our other Spanish companies were party to labor-related disputesfiled by Atento employees or former employees for different reasons, such as dismissals and disagreements regarding employment conditions, totaling 731thousand U.S. dollars. According to the Company’s external lawyers, materialization of the risk event is possible.
59

Mexico
At September 30, 2018, Atento Mexico through its two entities (Atento Servicios, S.A. de C.V. and Atento Atencion y Servicios, S.A. de C.V.) is party tolabor related disputes filed by Atento employees that abandoned their employment or former employees that base their claim on justified termination reasons,totaling 9,844 thousand U.S. dollars (Atento Servicios, S.A. de C.V. totaling 6,484 thousand U.S. dollars and Atento Atencion y Servicios, S.A. de C.V. totaling3,360 thousand U.S. dollars), according to the external labor law firm for possible risk labor disputes.
Argentina
In Argentina, as a consequence of an unfavorable sentence on the case “ATUSA S.A.” issued by Argentinian Internal Revenue Services (“AdministraciónFederal de Ingresos Públicos”), notified on February 2017, the contingency previously qualified as “remote” became “possible” estimated at 1,127 thousand U.S.dollars at September 30, 2018 (2,454 thousand U.S. dollars on December 31, 2017). A formal appeal has been filed at the National Supreme Court of Justice.
Given the nature of the risks covered by these provisions, it is not possible to determine a reliable schedule of potential payments, if any.
14. INCOME TAX
The breakdown of the Atento Groups’s income tax expense is as follow:
Thousands of U.S. dollars Thousands of U.S. dollars
For the three months ended September30, For the nine months ended September 30,
Income taxes2017 2018 2017 2018
(unaudited) (unaudited)Current tax expense (10,515) (5,059) (20,292) (17,498)Deferred tax 13,347 1,258 12,033 8,642Total income tax benefit/(expense) 2,832 (3,801) (8,259) (8,856)
For the three months ended September 30, 2018, Atento Group’s interim condensed consolidated financial information presented a profit before incometax in the amount of profit of 6,864 thousand U.S. dollars and a tax expense of 3,801 thousand U.S. dollars compared to a loss before income tax in the amount of12,851 thousand U.S. dollars and a tax benefit of 2,832 thousand U.S. dollars for the three months ended September 30, 2017. This movement is due to the positiveprofit before income tax in 2018.
For the nine months ended September 30, 2018, Atento Group’s interim condensed consolidated financial information presented profit before income taxin the amount of 14,295 thousand U.S. dollars and a tax expense of 8,856 thousand U.S. dollars compared to a profit before income tax of 3,610 thousand U.S.dollars and a tax expense of 8,259 thousand U.S. dollars for the nine months ended September 30, 2017. This movement is due to the positive profit before incometax in 2017 and 2018.
For the three months ended September 30, 2017 and 2018, the effective tax rate was 19.0% and 31.0%, respectively. For the nine months ended September30, 2017 and 2018, the effective tax rate was 34.0% and 31.9%, respectively.
15. EARNINGS/(LOSS) PER SHARE
Basic earnings per share is calculated by dividing the profits attributable to equity owners of the Company by the weighted average number of ordinaryshares outstanding during the periods as demonstrated below:
60

For the three months ended September
30, For the nine months ended September
30,
2017 2018 2017 2018
(unaudited) (unaudited)Profit/(loss) attributable to equity owners of the Company Atento’s profit/(loss) attributable to equity owners of the parent fromcontinuing operations (in thousands of U.S. dollars) (12,013) 2,684 (6,906) 3,985
Weigthed average number of ordinary shares 73,909,056 73,909,056 73,909,056 73,909,056Basic (loss)/earnings per share (in U.S. dollars) (0.16) 0.04 (0.09) 0.05
Diluted results per share are calculated by adjusting the weighted average number of ordinary shares outstanding to reflect the conversion of all dilutiveordinary shares. The weighted average number of ordinary shares outstanding used to calculate both basic and diluted net loss per share attributable to commonstockholders is the same. The share-based plan was first granted in October 2014.
For the three months ended September
30, For the nine months ended September
30,
2017 2018 2017 2018
(unaudited) (unaudited)Profit/(loss) attributable to equity owners of the Company Atento’s profit/(loss) attributable to equity owners of the parent fromcontinuing operations (in thousands of U.S. dollars) (12,013) 2,684 (6,906) 3,985
Potential increase in number of ordinary shares outstanding in respect ofshare-based plan - 1,142,431 - 1,142,431
Adjusted weighted average number of ordinary shares 73,909,056 75,027,905 73,909,056 75,027,905
Diluted (loss)/earnings per share (in U.S. dollars) (1) (0.16) 0.04 (0.09) 0.05
(1) For the three and nine months ended September 30, 2017, potential ordinary shares of 870,589, relating to the stock option plan were excluded from thecalculation of diluted net loss per share, as their effect would dilute the loss per share.
61

16. RELATED PARTIES
Directors
The directors of the Company as of the date on which the interim condensed consolidated financial information were prepared are Melissa Bethell, Marie-Catherine Brunner, Thomas Iannotti, David Garner, Stuart Gent, Devin O’Reilly, Antonio Viana-Baptista and Alejandro Reynal.
At September 30, 2018, some members of Board of Directors have the right to the stock-based compensation as described in Note 10.
Change in Board of Directors
On November 6, 2018, Melissa Bethell and Devin O’Reilly resigned from their position of directors of Atento, S.A, The Board of Directors then electedDavid Danon and Charles Megaw to serve both as Class III Directors replacing Ms. Bethell and Mr. O’Reilly, respectively. Additionally, Thomas Iannottisubstitutes Melissa as Chairman to the Compensation and Sustainability Committee.
David Danon, 37, has 13 years of experience in the private equity industry. He is currently a Principal of Bain Capital Private Equity (Europe) LP and aboard member of Autodistribution, MSX International and Italmatch. Prior to his position at Bain, Mr. Danon worked as an analyst in Lehman Brother’s MerchantBanking division from 2005 to 2008. Mr. Danon has a Master’s in Business from HEC Paris.
Charles Megaw, 48, has over 22 years of experience in the business and financial services industry. Mr. Megaw joined Bain Capital in 2007 and is anOperating Partner in the London office. Prior to joining Bain Capital, Mr. Megaw was a Partner at Bain & Company where he worked in a variety of industries. Heis currently a member of the Board of Directors of MSX International. Mr. Megaw holds an MA and PhD from the University of Cambridge in the UnitedKingdom.
Key management personnel
Key management personnel include those persons empowered and responsible for planning, directing and controlling the Atento Group’s activities, eitherdirectly or indirectly.
The following table shows the total remuneration paid to the Atento Group’s key management personnel in the nine months ended September 30, 2017and 2018:
For the nine months ended September 30,
2017 2018
(unaudited)Total remuneration paid to key management personnel 4,243 4,698
17. OTHER INFORMATION
a. Guarantees and commitments
At September 30, 2018, the Atento Group has guarantees and commitments to third parties amounting to 350,138 thousand U.S. dollars (322,233 thousandU.S. dollars at December 31, 2017).
The total amount of operating lease expenses recognized in the interim condensed consolidated statements of operations for the nine months endedSeptember 30, 2018 was 61,726 thousand U.S. dollars ( 52 ,998 thousand U.S. dollars at September 30, 2017).
There are no contingent payments on operating leases recognized in the interim condensed consolidated statements of operations for the nine monthsended September 30, 2017 and 2018.
62

The operating leases where the Company acts as lessee are mainly on premises intended for use as call centers. These leases have various terminationdates, with the latest terminating in 2028. As of September 30, 2018, the payment commitment for the early cancellation of these leases is 108,741 thousand U.S.dollars (137,519 thousand U.S. dollars at December 31, 2017).
63

PART II - OTHER INFORMATION
LEGAL PROCEEDINGS
See Note 13 to the unaudited interim condensed consolidated financial information.
RISK FACTORS
There were no material changes to the risk factors described in section “Risk Factors” in our Annual Form 20-F, for the year ended December 31, 2017.
64
SIGNATURES
Pursuant to the requirements of the Securities Exchange Act of 1934, the registrant has duly caused this report to be signed on its behalf by theundersigned, thereunto duly authorized.
ATENTO S.A.
Date: November 12, 2018.
By: /s/ Alejandro Reynal Name: Alejandro ReynalTitle: Chief Executive Officer
By: /s/ Mauricio Montilha Name: Mauricio MontilhaTitle: Chief Financial Officer
65

Atento Reports Fiscal 2018Third-Quarter Results Highlighted by Delivery of Turnaround in Brazil
- Adjusted EBITDA margin up 0.5 p.p. sequentially, driven by strong margin expansion in Brazil.- Brazil Adj. EBITDA margin expansion of 3.3 p.p. sequentially to 11.9%.- Revenues up 0.9% YoY in Q3, driven by continued growth in Multisector; YTD revenues increased 4.2%.- Multisector revenue up 1.2% in the quarter, driven by growth in Brazil and EMEA.- Higher value-added solutions expanded 0.7 p.p. to 27.1% of total revenue. - Recurring EPS increased 17.3% to $0.25- Free cash flow before interest and acquisitions of $36.7 million, with positive FCF of $18.3 million- Net debt down 3.0% sequentially to $360.2 million, with net leverage at 1.8x- Robust Balance Sheet and Cash Flow generation allow pursuit of accretive growth opportunities- Share buyback program acquired 0.7 million shares in Q3 at a cost of $5.3 million. At September 30, 2018, the remaining authorization to purchase
outstanding shares was $24.7million.
NEW YORK, November 12, 2018 -- Atento S.A. (NYSE: ATTO) (“Atento” or the “Company”), the largest provider of customer-relationship management andbusiness-process outsourcing services in Latin America, and among the top five providers globally, today announced its third-quarter 2018 operating and financialresults. All comparisons in this announcement are year-over-year and in constant-currency (CCY), unless noted otherwise, and may differ from 6K due to certainintra-group eliminations.
Summary
($ in millions except EPS) Q3 2018 Q3 2017 CCY Growth YTD 2018 YTD 2017 CCY GrowthIncome Statement
Revenue 432.6 501.3 +0.9% 1,396.4 1,443.0 +4.2%EBITDA (1) 46.9 54.4 +2.4% 145.8 150.8 +5.2% EBITDA Margin 10.9% 10.9% 0.0 p.p. 10.4% 10.5% -0.1 p.p.Adjusted EBITDA (1) 46.9 59.7 -7.8% 145.8 165.8 -4.3% Adjusted EBITDA Margin 10.9% 11.9% -1.0 p.p. 10.4% 11.5% -1.1 p.p.Net Income (2) 3.1 (10.1) n.m. 5.4 (4.7) n.m.Recurring Net Income (2) 18.4 17.6 +17.3% 40.5 39.1 11.3%Earnings Per Share (2) $0.04 ($0.14) n.m. $0.07 ($0.06) n.m.Recurring Earnings Per Share (2) $0.25 $0.24 +17.3% $0.55 $0.53 +11.3%
Cashflow, Debt and Leverage Free Cash Flow (3) 36.7 47.5 43.7 40.7 Net Debt 360.2 342.9 Leverage (x) 1.8x 1.5x
(1) EBITDA is defined as profit/(loss) for the period from continuing operations before net finance costs, income taxes and depreciation and amortization. Adjusted EBITDA is defined as EBITDA adjusted to exclude restructuringcosts, site relocation costs and other items not related to our core results of operations. EBITDA and Adjusted EBITDA are not measures defined by IFRS. The most directly comparable IFRS measure to EBITDA and AdjustedEBITDA is profit/(loss) for the year/period from continuing operations.
(2) Reported Net Income and Earnings Per Share and Adjusted EBITDA, Adjusted EBITDA Margin and Adjusted Earnings Per Share refer only to continuing operations. Reported and Adjusted Earnings Per Share, for the period endedSeptember 30, 2018, were calculated considering the weighted average number of ordinary shares of 73,885,474. For the period ended September 30, 2017, the number of ordinary shares was 73,909,056. Recurring Earningsand EPS attributable to Owners of the parent company
(3) We define Free Cash Flow before interest and acquisitions as operating cashflow minus Capex payments and income tax expenses.
1

Message of the CEO and CFO
Alejandro Reynal, Atento´s Chief Executive Officer, commented, “We delivered a good quarterly result, driven by the performance of our Brazil and EMEAoperations. Brazil, our flagship operation, remains at the forefront of Atento’s profitable growth strategy and closed the quarter with a substantial marginimprovement. During the period we also completed the carve out of Unimed Rio in Brazil, increasing our market share in the healthcare sector, one of the fastestgrowing verticals for CRM/BPO services in the country. We continue strengthening our market share in Latin America and diversifying our revenue mix, fueled bynew client wins across our footprint.”
Mauricio Montilha, Atento´s Chief Financial Officer, said, "Atento’s robust balance sheet and strong cash flow generation are allowing us to pursue accretivegrowth opportunities that further diversify our revenue base and to continue focusing on evolving the digital value offering to our clients. The recent strategicpartnership with T-Systems in Brazil for managing datacenters will help accelerate the roll out of our digital and BPO solutions.”
Mr. Reynal concluded, "As we expect to develop our business in a mixed political macro scenario, with volatility in some countries and potential improvement inothers, our commercial pipeline remains strong and reflects the acceleration of our move into digital services, while new clients wins across all regions form abase for future profitable growth.”
Third Quarter Consolidated Operating Results
All comparisons in this announcement, unless otherwise noted, are year-over-year and in constant-currency (CCY).
Consolidated revenues increased 0.9% to $432.6 million in the third quarter of 2018, driven by a 1.2% rise in Multisector sales, mainly in Brazil and EMEA. It isimportant to note the unfavorable year-on-year comparison base due to acquisitions in Brazil and Argentina that impacted results as of Q3 2017.
New client wins during the quarter helped offset overall volume and price pressures in the more massive CRM programs across the Company’s geographicmarkets. On a nine-month basis, revenues grew 4.2% to $1,396.4 million.
At the end of the quarter, Multisector revenues accounted for 61.6% of consolidated revenue. On a nine-month basis, Multisector revenues increased 6.1% andrepresented 61.3% of revenues.
Higher value-added solutions increased 0.7% sequentially to 27.1% of total revenues. Client demand for solutions, including Digital, remains at above 1/3 ofqualified pipeline.
Revenues from Telefónica increased 0.5% in the quarter, accounting for 38.4% of total revenue. Atento remains Telefónica’s reference partner for CRM/BPOservices.
EBITDA increased 0.5 p.p. sequentially, driven by a 3.3 p.p. margin expansion in the Brazilian operation. Compared to last year’s comparable quarter, EBITDAincreased 2.4% to $46.9 million, with the margin stable at 10.9%. On a nine-month basis, EBITDA increased 5.2% to $145.8 million, with the margin declining 0.1p.p. to 10.4%.
Recurring net income attributable to owners of the parent company increased 17.3% to $18.4 million, or $0.25 per share. The higher Recurring EPS was positivelyimpacted by a $7.6 million pre-tax gain resulting from a mark-to-market of the Real/US dollar hedge related to the interest of Atento’s 2022 senior secured notes.
Adjusted earnings, adjusted EBITDA and adjusted earnings per share are non-GAAP financial measures and are reconciled to their most directly comparable GAAPmeasures in the accompanying financial tables.
2

Segment Reporting
($ in millions) Q3 2018 Q3 2017 CCY growth YTD 2018 YTD 2017 CCY growth
Brazil Region Revenue 204.4 248.5 +2.8% 664.5 720.3 4.2%
Adjusted EBITDA 24.3 32.1 -5.7% 69.8 95.1 -17.2%
Adjusted EBITDA Margin 11.9% 12.9% -1.0 p.p. 10.5% 13.2% -2.7 p.p.
Operating Income/(loss) 1.4 3.0 -33.7% (2.7) 13.9 N.M
Americas Region Revenue 174.1 198.4 -1.2% 558.2 557.5 6.5%
Adjusted EBITDA 19.7 23.7 -8.6% 66.8 62.9 11.2%
Adjusted EBITDA Margin 11.3% 12.0% -0.6 p.p. 12.0% 11.3% 0.7 p.p.
Operating Income/(loss) (2.8) (0.9) - 30.9% 6.7 5.5 48.5%
EMEA Region Revenue 55.7 55.1 +2.1% 181.0 166.9 +0.7%
Adjusted EBITDA 5.7 3.5 +38.5% 16.7 11.6 +27.2%
Adjusted EBITDA Margin 10.3% 6.4% +3.9 p.p. 9.2% 7.0% +2.4 p.p.
Operating Income/(loss) 0.7 (9.2) N.M 1.5 (12.4) N.M
Brazil
Following a challenging beginning in the year, Atento delivered a solid margin turnaround in its flagship Brazilian operations, a result of operationalimprovements made in 1H18. Brazil’s operations remain at the forefront of Atento’s growth strategy, with a focus on profitability and evolving the value offering.Atento Brazil’s solutions factory is helping accelerate the Group’s move into digital services and leading the standardization and roll out of digital solutions (DataDriven Digital Sales, Data Driven Customer Care, Digital Back Office, Digital Collections), as well as the Analytics and Business Process Consulting offerings.
Additionally, it is important to highlight two key achievements during the third quarter:
· The Unimed Rio carve out, which accelerates Atento’s penetration of the healthcare segment, one of the fastest growing verticals for CRM services inBrazil ( clickherefor full details)
· The strategic partnership with T-Systems for managing data centers in Brazil, which speeds Atento’s transformation into a digital BPO solutionsprovider enables faster and easier roll-outs of new services and solutions for clients (click here for full details).
3

Revenues in Brazil grew 2.8% during the third quarter to $204.4 million and 4.2% year-to-date, as multisector clients continued driving sales growth.
Financial Services clients drove a 3.4% YoY increase in Multisector sales, leading the way for the Group in revenue diversification. The share of total sales in Brazilwas 0.4 p.p. higher to 70.3%. Year-to-date, Multisector revenue increased 4.9%.
On a quarterly and year-to-date basis, revenues from Telefónica increased 1.5% and 2.8%, respectively, representing 29.7% and 30.6% of total revenue in Brazil.During the quarter, Atento delivered the first digital solutions for Vivo within the TEF Group.
Adjusted EBITDA margin improved 3.3 p.p. on a sequential basis to 11.9%, reflecting the operational improvements made in the first half of 2018. Year-over-year,Adjusted EBITDA decreased 5.7% to $24.3 million.
Americas Region
In the Americas region, revenue decreased 1.2% YoY to $174.1 million, while increasing 6.5% year-to-date. The decrease was driven by lower volumes in the telcospace, mainly in the more massive CRM and the impact of weaker economic activity in Argentina. Performance in the Financial Services sector was mixed, withnew client wins in Chile offset by weaker volume and price pressures in Mexico.
Due to these factors, Multisector revenue declined 2.4%. At the end of the quarter, Multisector sales accounted for 58.3% of the revenue mix in the Americas,down 0.4 p.p. On a nine-month basis, Multisector sales increased 7.9%, 1.3 p.p. to 58.9% of Americas’ revenue.
Telefónica revenue increased 0.2% and accounted for 41.7% of Americas sales during the quarter. Year-to-date, Telefónica revenues increased 2.9%, representing41.1% of total Americas revenues in the period.
Adjusted EBITDA decreased 8.6% to $19.7 million, with the margin declining 0.6 p.p. to 11.3% in the third quarter, in line with the expected normalized level, andrising 0.7 p.p. to 12.0% on a nine-month basis. The third quarter margin decline was mostly due to lower volumes in the more massive CRM programs and toweaker economic activity in Argentina.
4

EMEA Region
Revenue in the EMEA region grew 2.1% over last year’s quarter to $55.7 million. The growth was driven by a 6.8% rise in Multisector sales, which were supportedby growth in non-Telefónica telco clients. Year-to-date, EMEA revenue increased 8.9%.
In the third quarter, Multisector revenue increased 1.8 p.p. to 40.5% of total EMEA sales. For the nine-month period, Multisector revenue rose 2.9 p.p. to 39.4%of the region’s sales.
Due to lower volumes, Telefónica revenues decreased 0.9% in the quarter. Year-to-date, they declined 4.0%.
Adjusted EBITDA for the EMEA region grew 38.5% to $5.7 million with the margin expanding 3.9 p.p. to 10.3%, a good result considering the more mature stageof this market. On a year-to-date basis, the Adjusted EBITDA margin expanded 2.4 p.p. to 9.2%. The margin expansion was primarily due to higher Multisectorvolumes, primarily non-Telefónica telco clients.
Cash Flow and Capital Structure
During the third quarter, Atento generated Free Cash Flow before interest and acquisitions of $36.7 million, with a positive Free Cash Flow of $18.3 million. Year-to-date, Free Cash Flow before interest and acquisitions amounted $43.7 million.
Cash capex accounted for 2.7% of revenues compared to 3.5% year-to-date. The decrease is mainly explained by the optimization of the utilization rate.
Year-to-date EBITDA-to-cash conversion improved 5.3 percentage points to 29.9%.
At the end of September 2018, Atento held cash and cash equivalents of $96.5 million and available revolving credit facilities of $100 million, implying totalliquidity of $196.5 million.
Atento's net debt decreased 3.0% sequentially to $360.2 million, while gross debt decreased 4.4% sequentially to $458.0 million on lower use of revolvers anddebt amortization. Net leverage increased to 1.8x from 1.7x in the second quarter, mainly due to the effect of currency translation on EBITDA.
Recent Developments
New Customer Relationship Center in Chile: On October 17th, Atento opened its fourth Customer Relationship Center in Chile, reinforcing its leadership positionin the country. The center has over 350 operational workstations and the capacity to expand above 500 in the short term. Including state-of-the-art facilities, italready has more than 300 agents specialized in customer care and sales solutions for the banking and financial services sector. Solutions are provided through anomnichannel platform combining traditional and digital channels and automation solutions. The center is located in Santiago's Mall Plaza Norte and has commonspaces and rooms for training and selection. Click here for full details.
CRC Gold Awards in Spain: On November 1st, Atento was recognized, for the 3rd consecutive year, as the best customer service outsourcer in Spain, onthis occasion for its service to Endesa. The recognition is within the framework of the CRC Gold Awards, the benchmark awards Spain’s CRM industry, forexcellence in CRM/ BPO management in the country. Click here for full details.
Great Place To Work® Argentina: Atento was ranked number 6 on the list of Argentina's best companies to work in the "More than 1,000 employees" category,according to Great Place to Work®. Atento is the only company in the CRM/BPO sector to be included in this prestigious ranking for 12 consecutive years in thecountry, reflecting the strength of its corporate culture and its commitment to fostering an excellent work environment. Great Place to Work® also gave a specialrecognition for Atento Argentina's inclusion policy. Sixty-five percent of employees are women 50% represent mid-level leadership teams and supervisor roles,and 3 of the 8 seats on the company's Management Committee are held by women. Click here for full details.
Atento strengthens leadership in LatAm: Frost & Sullivan, the global consulting company specialized in growth strategies, has identified Atento as the clearleader in contact center outsourcing services in Latin America, according to its annual study, “Analysis of the Contact Center Outsourcing Services Market in LatinAmerica and the Caribbean, Forecast to 2023”. In addition to being the leader at the regional level, Atento is also the market leader in Brazil, Argentina, Chile,Peru and Mexico. In Brazil, the largest market in the region, which accounts for nearly 40% of the revenues in the continent, Atento´s share reached 26.6% of thetotal market in 2017, an increase of 1.9p.p. vs the previous year and 12.3p.p. above its closest competitor. Atento also gained market share in Argentina,Colombia and Chile. When considering just aggregated domestic demand in Latin America (domestic market and the LATAM-Shore segment), Atento’s marketshare reached 23.7%, an increase of 1.0 p.p. versus the previous year and 16.2 p.p. above its closest competitor. Click here for full details.
5

Conference Call
The Company will host a conference call and webcast on Tuesday , November 13, 2018 at 10:00 am ET to discuss its financial results. The conference call can beaccessed by dialing: +1 (877) 407-0784 toll free domestic, UK: (+44) 0 800 756 3429 toll free, Brazil: (+55) 0 800 891 6221 toll free, or Spain: (+34) 900 834 236 tollfree. All other international callers can access the conference call by dialing: +1 (201) 689-8560 toll free. No passcode is required. Individuals who dial in will beasked to identify themselves and their affiliations. The live webcast of the conference call will be available on Atento's Investor Relations website at investors.atento.com . A web-based archive of the conference call will also be available at the above website.
About Atento
Atento is the largest provider of customer relationship management and business process outsourcing (CRM BPO) solutions in Latin America, and among the topfive providers globally, based on revenues. Atento is also a leading provider of nearshoring CRM/BPO services to companies that carry out their activities in theUnited States. Since 1999, the company has developed its business model in 13 countries where it employs 150,000 people. Atento has over 400 clients to whomit offers a wide range of CRM/BPO services through multiple channels. Atento's clients are mostly leading multinational corporations in sectors such astelecommunications, banking and financial services, health, retail and public administrations, among others. Atento´s shares trade under the symbol ATTO on theNew York Stock Exchange (NYSE). In 2016, Atento was named one of the World´s 25 Best Multinational Workplaces by Great Place to Work® for a fourthconsecutive year. For more information visit www.atento.com
Investor Relations Shay Chor + 55 11 3293-5926 [email protected] Schneider+ 55 11 [email protected] Media Relations Maite Cordero + 34 91 740 74 47 [email protected]
6

Forward-Looking Statements
This press release contains forward-looking statements. Forward-looking statements can be identified by the use of words such as "may," "should," "expects,""plans," "anticipates," "believes," "estimates," "predicts," "intends," "continue" or similar terminology. These statements reflect only Atento's currentexpectations and are not guarantees of future performance or results. These statements are subject to risks and uncertainties that could cause actual results todiffer materially from those contained in the forward-looking statements. These risks and uncertainties include, but are not limited to, competition in Atento'shighly competitive industries; increases in the cost of voice and data services or significant interruptions in these services; Atento's ability to keep pace with itsclients' needs for rapid technological change and systems availability; the continued deployment and adoption of emerging technologies; the loss, financialdifficulties or bankruptcy of any key clients; the effects of global economic trends on the businesses of Atento's clients; the non-exclusive nature of Atento's clientcontracts and the absence of revenue commitments; security and privacy breaches of the systems Atento uses to protect personal data; the cost of pending andfuture litigation; the cost of defending Atento against intellectual property infringement claims; extensive regulation affecting many of Atento's businesses;Atento's ability to protect its proprietary information or technology; service interruptions to Atento's data and operation centers; Atento's ability to retain keypersonnel and attract a sufficient number of qualified employees; increases in labor costs and turnover rates; the political, economic and other conditions in thecountries where Atento operates; changes in foreign exchange rates; Atento's ability to complete future acquisitions and integrate or achieve the objectives of itsrecent and future acquisitions; future impairments of our substantial goodwill, intangible assets, or other long-lived assets; and Atento's ability to recoverconsumer receivables on behalf of its clients. In addition, Atento is subject to risks related to its level of indebtedness. Such risks include Atento's ability togenerate sufficient cash to service its indebtedness and fund its other liquidity needs; Atento's ability to comply with covenants contained in its debt instruments;the ability to obtain additional financing; the incurrence of significant additional indebtedness by Atento and its subsidiaries; and the ability of Atento's lenders tofulfill their lending commitments. Atento is also subject to other risk factors described in documents filed by the company with the United States Securities andExchange Commission.
These forward-looking statements speak only as of the date on which the statements were made. Atento undertakes no obligation to update or revise publiclyany forward-looking statements, whether as a result of new information, future events or otherwise.
7

SELECTED FINANCIAL DATA
The following selected financial information should be read in conjunction with the interim consolidated financial statements and the section entitled"Management's Discussion and Analysis of Financial Condition and Results of Operations" presented elsewhere in the Form 6-K.
Reconciliation of EBITDA and Adjusted EBITDA to profit/(loss):
For the three months ended
September 30, For the nine months ended September
30,
($ in millions) 2017 2018 2017 2018
(unaudited)
(Loss)/profit for the period (10.1) 3.1 (4.7) 5.4
Net finance expense 37.7 18.3 68.8 59.8
Income tax expense (2.8) 3.8 8.3 8.9
Depreciation and amortization 29.6 21.8 78.4 71.7
EBITDA (non-GAAP) (unaudited) 54.4 46.9 150.8 145.8
Restructuring costs (a) 1.3 - 10.2 -
Other (b) 4.0 - 4.8 -
Total non-recurring items (*) 5.3 - 15.0 -
Adjusted EBITDA (non-GAAP) (unaudited) 59.7 46.9 165.8 145.8
(*) We define non-recurring items as items that are limited in number, clearly identifiable, unusual, are unlikely to be repeated in the near future in the ordinary course of business and that have a material impact on theconsolidated results of operations. Non-recurring items can be summarized as demonstrated below:
a) Restructuring costs primarily included restructuring activities and other personnel costs that were not related to our core results of operations. Restructuring costs for the three and nine months ended September 30,2017, primarily relates to the costs to adapt the organization in Argentina and Brazil to the lower level of activities and the investments made in Brazil, Mexico and Spain to implement a lower-cost operating model.
b) Other non-recurring items for three and nine months ended September 30, 2017, mainly refer to consulting and other non-recurring costs.
8

Reconciliation of Adjusted Earnings to profit/(loss):
For the three months ended
September 30, For the nine months ended
September 30,($ in millions) 2017 2018 2017 2018 (unaudited)(Loss)/profit for the period (10.1) 3.1 (4.7) 5.4
Amortization of acquisition related intangible assets (a) 5.7 5.1 16.8 16.1
Restructuring costs (b) (*) 1.3 - 10.2 -
Other (c) (*) 4.0 - 4.8 -
Change in fair value of financial instruments (d) 2.4 5.9 2.6 -Net foreign exchange gain/(loss) 3.2 9.3 4.2 31.1
Financial non-recurring (e) 17.7 - 17.7 -
Depreciation non-recurring (f) 2.8 - 2.8 -
Tax effect (g) (7.4) (4.6) (13.0) (10.7)Total of add-backs 29.7 15.7 46.1 36.5Adjusted Earnings (non-GAAP) (unaudited) 19.6 18.7 41.4 41.9
Adjusted Earnings per share (in U.S. dollars) (**) (unaudited) 0.27 0.25 0.56 0.57
Adjusted Earnings attributable to Owners of the parent (non-GAAP) (unaudited) 17.6 18.4 39.1 40.5
Adjusted Earnings per share attributable to Owners of the parent (in U.S. dollars) (**)
(unaudited) 0.24 0.25 0.53 0.55
(*) We define non-recurring items as items that are limited in number, clearly identifiable, unusual, are unlikely to be repeated in the near future in the ordinary course of business and that have a material impact on the consolidatedresults of operations. Non-recurring items can be summarized as demonstrated below:
(a) Amortization of acquisition related intangible assets represents the amortization expense of customer base, recorded as intangible assets. This customer base represents the fair value (within the business combinationinvolving the acquisition of control of Atento Group) of the intangible assets arising from service agreements (tacit or explicitly formulated in contracts) with Telefónica Group and with other customers.
(b) Restructuring costs primarily included restructuring activities and other personnel costs that were not related to our core results of operations. Restructuring costs for the three and nine months ended September 30,2017, primarily relates to the costs to adapt the organization in Argentina and Brazil to the lower level of activities and the investments made in Brazil, Mexico and Spain to implement a lower-cost operating model.
(c) Other non-recurring items for three and nine months ended September 30, 2017, mainly refer to consulting and other non-recurring costs.
(d) Since April 1, 2015, the Company designated the foreign currency risk on certain of its subsidiaries as net investment hedges using financial instruments as the hedging items. As a consequence, any gain or loss on thehedging instrument, related to the effective portion of the hedge is recognized in other comprehensive income (equity) as from that date. The gains or losses related to the ineffective portion are recognized in thestatements of operations and for comparability, and those adjustments are added back to calculate Adjusted Earnings.
(e) Financial non-recurring relates to the costs incurred in the debt refinance process occurred in August 2017, which includes: (i) 2020 Senior Secured Notes call premium of $11.1 million and amortization of issuance costsof $4.9 million; (ii) Brazilian debentures due 2019 penalty fee of $0.7 million and remaining balance of the issuance cost of $1.0 million.
(f) Non-recurring depreciation relates to the provision for accelerated depreciation of fixed assets in Puerto Rico and Mexico, due to the natural disasters.
(g) The tax effect represents the impact of the taxable adjustments based on tax nominal rate by country. For the three months ended September 30, 2017 and 2018, the effective tax rate after moving non-recurring itemswas 19.0% and 31.0%, respectively. For the nine months ended September 30, 2017 and 2018, the effective tax rate after moving non-recurring items was 34.0% and 31.9%, respectively.
(**) Adjusted Earnings per share is calculated based on the weighted average number of ordinary shares outstanding of 73,909,056 as of September 30, 2017 and 73,885,474 as of September 30, 2018.
9

Financing Arrangements
Net debt with third parties as of September 30, 2017 and 2018 is as follow:
As of September 30,
($ in millions, except Net Debt/Adj. EBITDA LTM) 2017 2018
(unaudited)
Cash and cash equivalents 162.8 9 7 .7
Debt:
Senior Secured Notes 393.8 393.3
Brazilian Debentures 22.5 16.2
BNDES 56.3 27.9
Finance Lease Payables 9.8 6.2
Other Borrowings 23.4 14.3
Total Debt 505.7 458.0
Net Debt with third parties (1) (unaudited) 342.9 36 0 .2
Adjusted EBITDA LTM (2) (non-GAAP) (unaudited) 224.4 200.9
Net Debt/Adjusted EBITDA LTM (non-GAAP) (unaudited) 1.5x 1.8x
1) In considering our financial condition, our management analyzes Net debt with third parties, which is defined as total debt less cash and cash equivalents. Net debt with third parties is not a measure defined by IFRS and it has
limitations as an analytical tool. Net debt with third parties is neither a measure defined by or presented in accordance with IFRS nor a measure of financial performance, and should not be considered in isolation or as analternative financial measure determined in accordance with IFRS. Net debt is not necessarily comparable to similarly titled measures used by other companies.
2) Adjusted EBITDA LTM (Last Twelve Months) is defined as EBITDA adjusted to exclude restructuring costs, site relocation costs and other items not related to our core results of operations.
10

Consolidated Statements of Operations for the Three and Nine Months Ended September 30, 2017 and 2018
($ in millions, except percentage changes)
For the three monthsended September 30,
Change (%)
Changeexcluding FX
(%)
For the nine months
ended September 30, Change(%)
Change excludingFX (%)2017 2018 2017 2018
(unaudited) (unaudited) Revenue 501.3 432.6 (13.7) 0.9 1,443.0 1,396.4 (3.2) 4.2Other operating income 4.8 7.2 50.6 139.2 13.9 15.1 8.9 33.1Operating expenses: Supplies (20.8) (19.5) (6.0) 20.6 (55.1) (54.2) (1.6) 9.6Employee benefit expenses (369.1) (321.5) (12.9) 1.6 (1,070.0) (1,046.3) (2.2) 5.1Depreciation (14.4) (12.3) (14.3) (3.1) (37.3) (31.8) (14.7) (8.8)Amortization (15.2) (9.4) (38.0) (27.1) (41.1) (39.8) (3.1) 3.5Changes in trade provisions - (0.3) N.M. N.M. - (0.4) N.M. N.M.Other operating expenses (61.8) (51.5) (16.6) (3.1) (181.0) (164.8) (8.9) (1.8)
Total operating expenses (481.3) (414.7) (13.8) 0.7 (1,384.5) (1,337.4) (3.4) 4.0
Operating profit 24.8 25.2 1.5 24.8 72.4 74.1 2.3 13.7
Finance income 2.4 0.8 (66.1) (58.9) 6.0 2.2 (63.8) (59.9)Finance costs (34.5) (3.9) (88.7) (87.9) (68.0) (30.9) (54.6) (52.3)
Change in fair value of financial instruments (2.4) (5.9) 146.3 149.0 (2.6) - (100.0) (100.0)Net foreign exchange loss (3.2) (9.3) N.M. N.M. (4.2) (31.1) N.M. N.M.
Net finance expense (37.7) (18.3) (51.4) (47.9) (68.8) (59.8) (13.1) (7.2)
Profit before income tax (12.9) 6.9 N.M. 145.9 3.6 14.3 N.M. N.M.
Income tax benefit/(expense) 2.8 (3.8) N.M. N.M. (8.3) (8.9) 6.7 7.6(Loss)/profit for the period (10.1) 3.1 130.3 125.0 (4.7) 5.4 N.M. N.M.(Loss)/profit attributable to: Owners of the parent (12.0) 2.7 122.4 119.4 (6.9) 4.0 N.M. (142.4)Non-controlling interest 1.9 0.4 (80.1) (76.1) 2.2 1.5 (33.9) (20.3)(Loss)/profit for the period (10.1) 3.1 130.3 125.0 (4.7) 5.4 N.M. N.M.
Other financial data: EBITDA (1) (unaudited) 54.4 46.9 (13.7) 2.4 150.8 145.8 (3.3) 5.2Adjusted EBITDA (1) (unaudited) 59.7 46.9 (21.4) (7.8) 165.8 145.8 (12.1) (4.3) (1) For reconciliation with IFRS as issued by IASB, see section "Summary Consolidated Historical Financial Information - Reconciliation of EBITDA and Adjusted EBITDA to profit/(loss)".
N.M. means not meaningful
11

ATENTO S.A. AND SUBSIDIARIESINTERIM CONDENSED CONSOLIDATED STATEMENTS OF FINANCIAL POSITION
As of December 31, 2017 and September 30, 2018(In thousands of U.S. dollars, unless otherwise indicated)
ASSETS
Notes
December 31, September 30,
2017 2018
(audited) (unaudited) NON-CURRENT ASSETS 764,127 675,299
Intangible assets 230,104 214,259Goodwill 153,144 128,656Property, plant and equipment 152,195 115,680Non-current financial assets 90,076 85,740Trade and other receivables 21,677 12,380Other non-current financial assets 60,222 62,458Derivative financial instruments 8,177 10,902Other taxes receivable 7,282 5,956Deferred tax assets 131,326 125,008
CURRENT ASSETS 566,178 534,823
Trade and other receivables 410,534 4 19 ,188Trade and other receivables 388,565 39 1 ,358Current income tax receivable 21,969 27,830Other taxes receivable 12,072 16,903Other current financial assets 1,810 1,008Cash and cash equivalents 141,762 9 7 ,724
TOTAL ASSETS 1,330,305 1,210,122
12

ATENTO S.A. AND SUBSIDIARIESINTERIM CONDENSED CONSOLIDATED STATEMENTS OF FINANCIAL POSITION
As of December 31, 2017 and September 30, 2018(In thousands of U.S. dollars, unless otherwise indicated)
EQUITY AND LIABILITIES
Notes
December 31, September 30,
2017 2018
(audited) (unaudited)
TOTAL EQUITY 377,839 316,810
EQUITY ATTRIBUTABLE TO: NON-CONTROLLING INTEREST 9,476 9,250
OWNERS OF THE PARENT COMPANY 368,363 307,560 Share capital 48 48Reserve for acquisition of non-controlling interest (23,531) (23,531)Share premium 639,435 615,288Treasury shares - (5,337)Retained losses (94,535) (66,403)Translation differences (170,063) (227,179)Hedge accounting effects 9,594 3,203Stock-based compensation 7,415 11,471NON-CURRENT LIABILITIES 582,870 543,838
Deferred tax liabilities 43,942 33,348Debt with third parties 439,731 414,268Derivative financial instruments 5,140 2,241Provisions and contingencies 61,186 52,478Non-trade payables 8,094 18,597Option for the acquisition of non-controlling interest 23,752 19,624Other taxes payable 1,025 3,282
CURRENT LIABILITIES 369,596 349,474
Debt with third parties 46,560 43,711Derivative financial instruments 1,212 596Trade and other payables 302,756 291,109Trade payables 94,078 73,907Income tax payables 8,058 11,355Other taxes payables 86,166 90,281Other non-trade payables 114,454 115,566Provisions and contingencies 19,068 14,058
TOTAL EQUITY AND LIABILITIES 1,330,305 1,210,122
13

Cash Flow:
For the three months ended September 30,
For the nine months ended September 30,
($ in millions) 2018 2017 2018 2017
(unaudited) (***) (unaudited) (***)
Operating Cash Flow (1) 48.5 65.4 94.7 105.5
Cash Capex (2) -9.6 -13.1 -38.3 -49.9
Income Tax Paid -2.2 -4.8 -12.7 -14.9
Free Cash Flow before interest and acquisitions 36.7 47.5 43.7 40.7
Acquisitions 0.0 0.0 0.0 -14.5
Net Financial Expenses (3) -18.4 9.1 -44.6 19.4
Free Cash Flow (FCF) 18.3 56.6 -1.0 -6.8
(1) We define Operating Cash flow as Net Cash flow from/(used in) operating activities (as per 6K) adding back net interest and income tax expenses.
(2) Does not consider acquisitions
(3) Interest payments related to the 2022 SSN are done every February and August, until Bond maturity in August 2022. Q1 2018 includes hedge adjustments of negative $3.1 million and withholding taxes of negative $1.6million, versus hedge adjustments of positive $1.5 million and no withholding taxes in Q1 2017.
(4) Interest payments related to the 2022 SSN are done every February and August, until Bond maturity in August 2022. Therefore, settlement of hedging instruments will impact Q1 and Q3 Net Financial Expenses cashflowof each year. Q3 2017 includes one-off gains of~$25million from unwinding existing hedge instruments related to the debt refinance process.
(***) These preliminary results are unaudited and are based on management's initial review of operations for the third quarter ended September 30, 2018 and remain subject to the completion of the Company's customaryannual closing and review procedures. Final adjustments and other material developments may arise between the date hereof and the filing of the Company's Annual Report on Form 20-F.
14