seer cancer statistics review 1975-2004
TRANSCRIPT

SEE
R C
ancer Statistics Review
1975-2004N
ational Cancer Institute
Joinpoint Regression Program Version 3.0, April 2005, National Cancer Institute. (http://srab.cancer.gov/joinpoint/).
The APC is the Annual Percent Change based on rates age-adjusted to the 2000 US Std Population (19 age groups - CensusP25-1130).
a Trends are from the SEER 9 areas (San Francisco, Connecticut, Detroit, Hawaii, Iowa, New Mexico, Seattle, Utah, and Atlanta).b Trends are from the NCHS public use data file for the total US.* The APC is significantly different from zero (p<.05).
Joinpoint Segment 1 Joinpoint Segment 2 Joinpoint Segment 3 Joinpoint Segment 4Year APC Year APC Year APC Year APC
SEER Cancer Incidencea
All Races Male and Female 1975-1982 2.5* 1982-1991 1.0* 1991-2004 -0.9*All Races Male 1975-1982 1.4* 1982-1991 -0.4 1991-2004 -1.9*All Races Female 1975-1982 5.5* 1982-1990 3.5* 1990-1998 1.0* 1998-2004 -0.5
White Male and Female 1975-1987 2.0* 1987-1998 -0.1 1998-2004 -1.3*White Male 1975-1981 1.5* 1981-1990 -0.2 1990-2004 -1.8*White Female 1975-1982 5.6* 1982-1988 4.1* 1988-1997 1.6* 1997-2004 -0.4
Black Male and Female 1975-1985 3.2* 1985-2004 -0.9*Black Male 1975-1984 3.3* 1984-2004 -1.8*Black Female 1975-1990 4.3* 1990-2004 0.4
SEER Delay-Adjusted Incidencea
All Races Male and Female 1975-1982 2.5* 1982-1991 1.0* 1991-2004 -0.7*All Races Male 1975-1982 1.5* 1982-1991 -0.5 1991-2004 -1.8*All Races Female 1975-1982 5.5* 1982-1990 3.5* 1990-1998 1.0* 1998-2004 -0.1
White Male and Female 1975-1982 2.5* 1982-1991 1.1* 1991-2004 -0.6*White Male 1975-1981 1.4* 1981-1989 -0.1 1989-2004 -1.6*White Female 1975-1982 5.6* 1982-1988 4.1* 1988-1997 1.6* 1997-2004 0.0
Black Male and Female 1975-1985 3.1* 1985-2004 -0.8*Black Male 1975-1984 3.2* 1984-2004 -1.7*Black Female 1975-1990 4.2* 1990-2004 0.5
U.S. Cancer Mortalityb
All Races Male and Female 1975-1980 3.0* 1980-1990 1.8* 1990-1995 -0.2 1995-2004 -1.0*All Races Male 1975-1982 1.7* 1982-1990 0.5* 1990-1994 -1.3* 1994-2004 -2.0*All Races Female 1975-1982 6.0* 1982-1990 4.2* 1990-1995 1.7* 1995-2004 0.2*
White Male and Female 1975-1980 2.9* 1980-1990 1.8* 1990-1995 -0.1 1995-2004 -0.8*White Male 1975-1982 1.7* 1982-1991 0.4* 1991-2004 -1.8*White Female 1975-1983 5.8* 1983-1990 4.1* 1990-1995 1.9* 1995-2004 0.3*
Black Male and Female 1975-1981 3.5* 1981-1990 1.9* 1990-1995 -0.7* 1995-2004 -1.6*Black Male 1975-1982 2.9* 1982-1990 1.3* 1990-1994 -1.3 1994-2004 -2.7*Black Female 1975-1982 6.3* 1982-1992 3.7* 1992-2004 0.4*
Table XV-1LUNG AND BRONCHUS CANCER (Invasive)
TRENDS IN SEER INCIDENCEa AND U.S. MORTALITYb USING THE JOINPOINT REGRESSION PROGRAM, 1975-2004WITH UP TO THREE JOINPOINTS BY RACE AND SEX

SEE
R C
ancer Statistics Review
1975-2004N
ational Cancer Institute
Joinpoint Regression Program Version 3.0, April 2005, National Cancer Institute. (http://srab.cancer.gov/joinpoint/).
The APC is the Annual Percent Change based on rates age-adjusted to the 2000 US Std Population (19 age groups - CensusP25-1130).
a Trends are from the SEER 9 areas (San Francisco, Connecticut, Detroit, Hawaii, Iowa, New Mexico, Seattle, Utah, and Atlanta).* The APC is significantly different from zero (p<.05).
Joinpoint Segment 1 Joinpoint Segment 2 Joinpoint Segment 3 Joinpoint Segment 4Year APC Year APC Year APC Year APC
SEER Cancer Incidence for Small Cell Lung and Bronchusa
All Races Male and Female 1982-1989 1.3* 1989-2003 -2.4*All Races Male 1975-1980 6.4* 1980-1988 0.5 1988-2003 -3.4*All Races Female 1975-1982 9.6* 1982-1991 2.9* 1991-2003 -1.7*
White Male and Female 1975-1982 6.3* 1982-1989 1.4* 1989-2003 -2.2*White Male 1975-1980 6.2* 1980-1988 0.6 1988-2003 -3.3*White Female 1975-1982 10.0* 1982-1990 3.4* 1990-2003 -1.2*
Black Male and Female 1975-1986 4.7* 1986-2003 -2.3*Black Male 1975-1985 4.8* 1985-2003 -3.3*Black Female 1975-1991 4.6* 1991-2003 -2.2
SEER Cancer Incidence for Non-Small Cell Lung and Bronchusa
All Races Male and Female 1975-1991 1.3* 1991-2003 -0.6*All Races Male 1975-1982 0.9* 1982-1992 -0.4 1992-2003 -1.6*All Races Female 1975-1988 4.3* 1988-1998 1.7* 1998-2003 -0.4
White Male and Female 1975-1990 1.5* 1990-2003 -0.3*White Male 1975-1988 0.3* 1988-2003 -1.4*White Female 1975-1988 4.4* 1988-1997 1.9* 1997-2003 0.0
Black Male and Female 1975-1984 3.2* 1984-2003 -0.6*Black Male 1975-1984 2.9* 1984-2003 -1.5*Black Female 1975-1990 4.1* 1990-2003 0.8*
Table XV-2SMALL CELL LUNG AND BRONCHUS CANCER (Invasive) AND NON-SMALL CELL LUNG AND BRONCHUS CANCER (Invasive)
TRENDS IN SEER INCIDENCEa USING THE JOINPOINT REGRESSION PROGRAM, 1975-2004WITH UP TO THREE JOINPOINTS BY RACE AND SEX

SEE
R C
ancer Statistics Review
1975-2004N
ational Cancer Institute
a SEER 9 areas (San Francisco, Connecticut, Detroit, Hawaii, Iowa, New Mexico, Seattle, Utah, and Atlanta). Rates are per100,000 and are age-adjusted to the 2000 US Std Population (19 age groups - Census P25-1130).
- Statistic not shown. Rate based on less than 16 cases for the time interval.
All Races Whites BlacksTotal Males Females Total Males Females Total Males Females
AGE-ADJUSTED RATESYEAR OF DIAGNOSIS:
1975 52.3 89.6 24.5 52.0 89.2 24.9 64.6 114.9 24.71976 55.4 93.8 27.3 54.6 92.8 27.3 72.3 131.0 28.61977 56.7 95.5 28.3 55.9 94.7 28.1 73.6 124.8 33.91978 57.8 96.7 29.7 57.3 95.9 29.9 74.5 130.5 31.61979 58.6 95.8 31.6 58.0 95.2 31.6 74.5 127.6 34.11980 60.7 100.0 32.2 59.4 97.7 32.4 86.6 151.5 38.31981 62.0 99.4 35.1 61.6 98.5 35.5 82.2 143.0 37.21982 63.3 100.7 36.7 63.1 99.7 37.7 80.4 141.1 35.71983 63.4 99.5 37.9 63.0 97.6 39.1 86.6 151.3 39.51984 65.5 102.1 39.5 64.3 99.9 39.6 93.1 159.2 44.81985 64.6 98.7 40.2 64.0 96.9 40.9 89.6 149.7 46.01986 65.8 99.1 42.3 65.2 97.4 42.9 92.9 156.2 48.61987 67.9 101.5 44.2 68.1 100.7 45.5 84.8 143.7 43.21988 68.0 98.7 46.3 68.2 97.9 47.7 88.1 144.9 48.11989 67.5 97.9 46.1 67.5 97.0 47.2 89.0 142.8 51.41990 68.0 96.9 47.7 68.2 96.1 48.9 86.7 137.0 52.01991 69.2 97.3 49.6 69.0 95.9 50.6 93.2 145.0 56.91992 69.4 97.2 49.8 68.9 94.8 51.0 93.9 149.0 55.81993 67.7 93.9 49.2 67.8 92.5 50.7 86.3 135.4 52.41994 67.1 90.9 50.5 67.3 90.1 51.6 86.9 131.1 56.21995 66.8 89.7 50.4 67.0 87.9 52.4 85.7 138.6 50.01996 66.4 88.0 51.1 66.7 86.7 52.9 84.0 127.9 55.11997 66.5 86.2 52.5 67.2 84.8 54.9 82.1 129.4 50.41998 67.5 88.0 52.9 68.0 86.5 55.0 87.0 130.5 57.71999 65.7 84.5 52.4 66.2 83.2 54.3 84.2 121.7 58.72000 63.9 81.8 51.1 64.6 80.6 53.2 79.1 112.8 56.52001 63.8 80.8 51.4 64.8 80.6 53.4 79.6 113.4 56.72002 63.5 79.8 51.9 64.2 79.2 53.7 80.5 111.1 60.12003 63.8 79.9 52.2 64.7 78.5 54.9 79.3 116.4 54.32004 60.0 73.6 50.2 60.6 72.7 52.0 73.0 100.0 54.91975-2004 64.3 91.8 44.5 64.3 90.7 45.4 83.2 132.1 48.8
Table XV-3LUNG AND BRONCHUS CANCER (Invasive)
AGE ADJUSTED SEER INCIDENCEa RATES BY YEAR, RACE AND SEX
SEE
R C
ancer Statistics Review
1975-2004N
ational Cancer Institute
a SEER 9 areas (San Francisco, Connecticut, Detroit, Hawaii, Iowa, New Mexico, Seattle, Utah, and Atlanta). Rates are per100,000 and are age-adjusted to the 2000 US Std Population (19 age groups - Census P25-1130).
- Statistic not shown. Rate based on less than 16 cases for the time interval.
All Races Whites BlacksTotal Males Females Total Males Females Total Males Females
AGE-ADJUSTED RATESYEAR OF DIAGNOSIS:
1975 6.6 10.4 3.8 6.9 10.7 4.0 5.9 8.9 3.51976 7.1 11.4 3.8 7.1 11.5 3.9 8.2 12.8 4.81977 7.7 12.4 4.2 7.8 12.8 4.2 8.1 11.2 5.81978 8.6 13.4 5.0 8.9 13.7 5.3 7.8 13.9 3.11979 8.7 13.1 5.3 9.0 13.6 5.6 7.6 11.8 4.51980 9.1 14.2 5.2 9.3 14.4 5.5 10.0 17.5 4.41981 9.7 14.5 6.1 10.0 14.8 6.5 9.2 15.9 4.21982 10.4 14.9 7.1 10.7 15.3 7.6 9.6 15.9 4.91983 10.4 14.9 7.1 10.7 15.0 7.6 9.1 15.1 4.91984 10.7 15.2 7.4 11.0 15.6 7.8 10.4 15.0 6.91985 10.4 15.0 7.1 10.8 15.3 7.5 11.1 17.8 6.31986 11.2 15.5 8.0 11.5 16.0 8.3 12.3 17.7 8.41987 10.6 14.1 8.2 11.2 14.6 8.8 9.5 14.5 6.01988 11.4 15.3 8.5 11.9 15.6 9.2 10.5 17.9 5.31989 11.2 14.8 8.7 11.7 15.2 9.2 12.1 17.7 8.41990 10.7 13.8 8.4 11.3 14.5 9.1 9.4 13.7 6.21991 11.3 14.0 9.4 11.7 14.3 9.8 12.4 16.0 10.01992 10.5 13.4 8.4 11.0 13.8 9.0 10.2 13.4 8.01993 10.0 12.3 8.3 10.5 12.6 8.9 9.4 13.2 6.71994 9.8 11.7 8.4 10.2 12.0 9.1 9.9 13.6 7.41995 9.8 12.2 8.1 10.4 12.6 8.8 9.4 13.7 6.61996 9.7 12.1 8.0 10.3 12.4 8.6 8.8 12.0 6.81997 9.5 10.9 8.6 10.1 11.1 9.5 7.9 10.8 6.11998 9.3 10.8 8.1 9.9 11.3 8.8 9.4 12.1 7.41999 8.8 10.0 7.9 9.3 10.2 8.7 8.1 10.9 6.02000 8.7 10.4 7.6 9.3 10.8 8.1 9.4 11.5 7.82001 8.3 9.8 7.3 8.9 10.2 7.9 8.4 10.8 6.82002 8.2 9.3 7.5 8.9 9.8 8.3 7.2 9.7 5.72003 8.1 9.0 7.5 8.6 9.2 8.3 7.8 9.4 6.72004 7.9 8.7 7.3 8.3 9.0 7.8 8.4 9.7 7.61975-2004 9.5 12.4 7.3 9.9 12.8 7.8 9.2 13.2 6.4
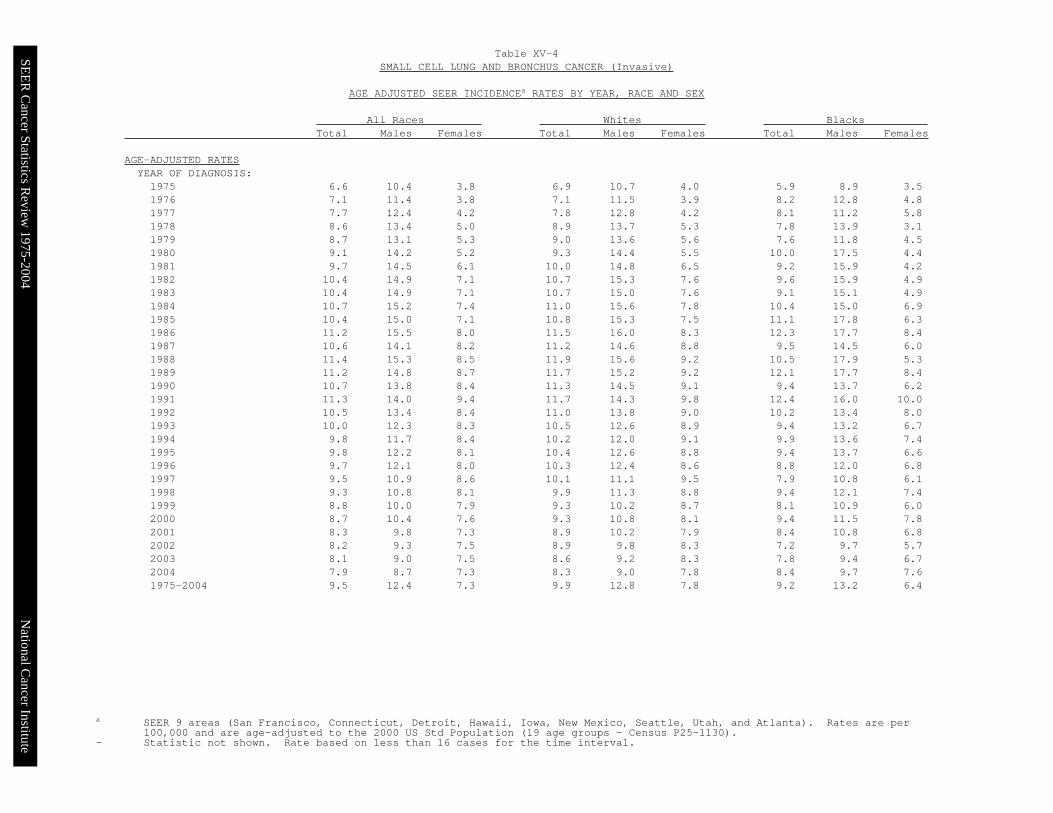
Table XV-4SMALL CELL LUNG AND BRONCHUS CANCER (Invasive)
AGE ADJUSTED SEER INCIDENCEa RATES BY YEAR, RACE AND SEX

SEE
R C
ancer Statistics Review
1975-2004N
ational Cancer Institute
a SEER 9 areas (San Francisco, Connecticut, Detroit, Hawaii, Iowa, New Mexico, Seattle, Utah, and Atlanta). Rates are per100,000 and are age-adjusted to the 2000 US Std Population (19 age groups - Census P25-1130).
- Statistic not shown. Rate based on less than 16 cases for the time interval.
All Races Whites BlacksTotal Males Females Total Males Females Total Males Females
AGE-ADJUSTED RATESYEAR OF DIAGNOSIS:
1975 45.6 79.2 20.8 45.1 78.5 20.9 58.7 106.0 21.21976 48.4 82.5 23.5 47.5 81.3 23.4 64.1 118.2 23.91977 49.0 83.1 24.1 48.0 82.0 23.8 65.4 113.6 28.11978 49.2 83.3 24.6 48.4 82.2 24.6 66.7 116.6 28.51979 49.9 82.7 26.2 49.0 81.6 26.0 66.9 115.8 29.61980 51.6 85.8 27.0 50.1 83.3 26.8 76.7 133.9 33.91981 52.3 84.9 29.0 51.5 83.6 29.1 73.0 127.1 33.01982 52.9 85.8 29.6 52.3 84.4 30.2 70.7 125.1 30.81983 53.1 84.6 30.8 52.3 82.6 31.5 77.5 136.3 34.61984 54.8 86.9 32.0 53.3 84.3 31.9 82.6 144.2 38.01985 54.2 83.7 33.1 53.2 81.7 33.4 78.5 131.9 39.81986 54.6 83.5 34.3 53.6 81.4 34.7 80.6 138.5 40.31987 57.3 87.4 36.0 56.9 86.1 36.7 75.2 129.2 37.21988 56.6 83.4 37.8 56.3 82.3 38.5 77.6 127.1 42.81989 56.3 83.1 37.4 55.9 81.8 38.0 77.0 125.1 43.01990 57.4 83.1 39.3 56.9 81.7 39.8 77.3 123.3 45.81991 57.9 83.3 40.2 57.3 81.6 40.8 80.8 129.0 46.91992 58.9 83.8 41.4 57.9 81.0 42.1 83.7 135.5 47.81993 57.7 81.6 40.8 57.3 79.8 41.7 76.9 122.1 45.71994 57.4 79.2 42.1 57.0 78.1 42.6 76.9 117.5 48.71995 56.9 77.5 42.3 56.7 75.3 43.7 76.2 124.9 43.41996 56.7 75.9 43.1 56.5 74.2 44.3 75.2 115.9 48.21997 57.0 75.3 43.9 57.0 73.6 45.4 74.3 118.6 44.31998 58.2 77.1 44.7 58.1 75.3 46.1 77.7 118.4 50.21999 56.9 74.4 44.4 56.9 72.9 45.6 76.0 110.8 52.62000 55.2 71.5 43.5 55.3 69.9 45.1 69.7 101.3 48.72001 55.4 71.1 44.1 55.9 70.3 45.4 71.1 102.6 49.92002 55.2 70.4 44.4 55.3 69.4 45.4 73.2 101.4 54.42003 55.7 70.8 44.7 56.0 69.3 46.6 71.5 107.0 47.62004 52.1 64.8 42.9 52.3 63.7 44.1 64.5 90.3 47.31975-2004 54.8 79.4 37.2 54.4 78.0 37.6 74.0 118.9 42.4
Table XV-5NON-SMALL CELL LUNG AND BRONCHUS CANCER (Invasive)
AGE ADJUSTED SEER INCIDENCEa RATES BY YEAR, RACE AND SEX

SEE
R C
ancer Statistics Review
1975-2004N
ational Cancer Institute
a NCHS public use data file for the total US. Rates are per 100,000 and are age-adjusted to the 2000 US Std Population(19 age groups - Census P25-1130).
- Statistic not shown. Rate based on less than 16 cases for the time interval.
All Races Whites BlacksTotal Males Females Total Males Females Total Males Females
AGE-ADJUSTED RATESYEAR OF DEATH:
1975 42.6 76.4 17.6 42.1 75.5 17.7 49.3 91.0 17.31976 44.2 78.5 19.0 43.7 77.6 19.1 51.1 94.0 18.51977 45.5 80.4 20.0 44.8 79.1 20.1 54.6 100.8 19.91978 46.9 82.1 21.4 46.3 80.8 21.6 55.3 101.6 20.71979 47.7 82.9 22.3 47.1 81.6 22.4 56.4 102.9 22.21980 49.4 84.7 24.1 48.8 83.3 24.2 59.2 106.7 24.61981 50.0 85.2 24.9 49.3 83.5 25.1 60.6 109.7 25.11982 51.4 86.8 26.5 50.8 85.2 26.7 62.3 112.5 26.31983 52.4 87.0 28.1 51.7 85.4 28.3 63.7 112.8 28.71984 53.4 88.2 28.9 52.6 86.2 29.3 65.1 118.0 28.01985 54.3 88.5 30.4 53.7 86.7 30.8 65.8 117.5 29.61986 55.0 89.0 31.4 54.4 87.0 31.8 67.0 119.2 31.01987 56.2 90.0 32.7 55.6 88.1 33.0 68.6 121.8 32.51988 57.0 89.9 34.1 56.4 87.9 34.6 69.2 122.2 33.51989 57.9 89.8 35.8 57.2 87.6 36.3 71.0 124.7 34.91990 58.9 90.6 36.8 58.2 88.4 37.3 72.1 125.2 36.51991 59.0 89.9 37.6 58.4 87.8 38.1 71.6 123.6 37.21992 58.9 88.0 38.7 58.3 86.0 39.2 71.4 121.1 38.61993 59.1 87.6 39.3 58.7 85.5 40.0 71.1 122.0 37.71994 58.5 85.7 39.6 58.2 83.8 40.3 70.2 118.6 38.61995 58.4 84.4 40.3 58.1 82.6 41.0 69.3 116.1 38.81996 57.9 82.8 40.4 57.7 81.2 41.2 68.3 113.2 39.11997 57.5 81.3 40.8 57.3 79.8 41.5 67.9 110.2 40.51998 57.1 79.9 41.0 56.9 78.5 41.7 66.9 107.4 40.71999 55.4 77.0 40.1 55.3 75.7 40.9 65.0 103.6 40.02000 55.8 76.5 41.1 56.0 75.4 42.1 63.8 100.9 39.72001 55.3 75.2 41.0 55.5 74.3 42.0 62.7 99.4 38.82002 55.0 73.5 41.6 55.3 72.8 42.6 62.2 95.7 40.32003 54.2 71.9 41.2 54.5 71.2 42.2 61.1 93.1 40.32004 53.3 70.3 40.9 53.6 69.6 41.9 60.0 90.6 40.01975-2004 54.5 82.9 34.2 54.1 81.5 34.6 64.4 109.2 33.7
Table XV-6LUNG AND BRONCHUS CANCER (Invasive)
AGE-ADJUSTED U.S. DEATHa RATES BY YEAR, RACE AND SEX
SEE
R C
ancer Statistics Review
1975-2004N
ational Cancer Institute
a SEER 17 areas. Rates are per 100,000 and are age-adjusted to the 2000 US Std Population (19 age groups - Census P25-1130),unless noted.
b NCHS public use data file for the total US. Rates are per 100,000 and are age-adjusted to the 2000 US Std Population(19 age groups - Census P25-1130), unless noted.
c Rates are per 100,000 and are age-adjusted to the IARC world standard population.- Statistic not shown. Rate based on less than 16 cases for the time interval.
All Races Whites BlacksTotal Males Females Total Males Females Total Males Females
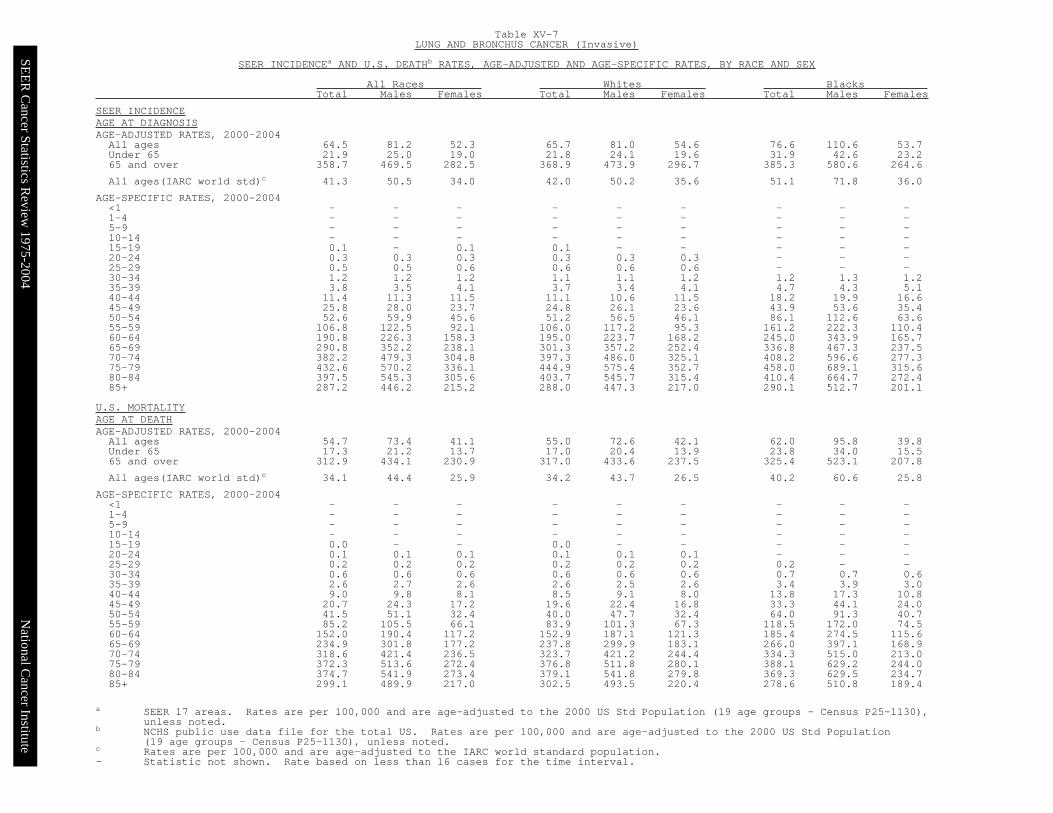
SEER INCIDENCEAGE AT DIAGNOSISAGE-ADJUSTED RATES, 2000-2004All ages 64.5 81.2 52.3 65.7 81.0 54.6 76.6 110.6 53.7Under 65 21.9 25.0 19.0 21.8 24.1 19.6 31.9 42.6 23.265 and over 358.7 469.5 282.5 368.9 473.9 296.7 385.3 580.6 264.6
All ages(IARC world std)c 41.3 50.5 34.0 42.0 50.2 35.6 51.1 71.8 36.0
AGE-SPECIFIC RATES, 2000-2004<1 - - - - - - - - -1-4 - - - - - - - - -5-9 - - - - - - - - -10-14 - - - - - - - - -15-19 0.1 - 0.1 0.1 - - - - -20-24 0.3 0.3 0.3 0.3 0.3 0.3 - - -25-29 0.5 0.5 0.6 0.6 0.6 0.6 - - -30-34 1.2 1.2 1.2 1.1 1.1 1.2 1.2 1.3 1.235-39 3.8 3.5 4.1 3.7 3.4 4.1 4.7 4.3 5.140-44 11.4 11.3 11.5 11.1 10.6 11.5 18.2 19.9 16.645-49 25.8 28.0 23.7 24.8 26.1 23.6 43.9 53.6 35.450-54 52.6 59.9 45.6 51.2 56.5 46.1 86.1 112.6 63.655-59 106.8 122.5 92.1 106.0 117.2 95.3 161.2 222.3 110.460-64 190.8 226.3 158.3 195.0 223.7 168.2 245.0 343.9 165.765-69 290.8 352.2 238.1 301.3 357.2 252.4 336.8 467.3 237.570-74 382.2 479.3 304.8 397.3 486.0 325.1 408.2 596.6 277.375-79 432.6 570.2 336.1 444.9 575.4 352.7 458.0 689.1 315.680-84 397.5 545.3 305.6 403.7 545.7 315.4 410.4 664.7 272.485+ 287.2 446.2 215.2 288.0 447.3 217.0 290.1 512.7 201.1
U.S. MORTALITYAGE AT DEATHAGE-ADJUSTED RATES, 2000-2004All ages 54.7 73.4 41.1 55.0 72.6 42.1 62.0 95.8 39.8Under 65 17.3 21.2 13.7 17.0 20.4 13.9 23.8 34.0 15.565 and over 312.9 434.1 230.9 317.0 433.6 237.5 325.4 523.1 207.8
All ages(IARC world std)c 34.1 44.4 25.9 34.2 43.7 26.5 40.2 60.6 25.8
AGE-SPECIFIC RATES, 2000-2004<1 - - - - - - - - -1-4 - - - - - - - - -5-9 - - - - - - - - -10-14 - - - - - - - - -15-19 0.0 - - 0.0 - - - - -20-24 0.1 0.1 0.1 0.1 0.1 0.1 - - -25-29 0.2 0.2 0.2 0.2 0.2 0.2 0.2 - -30-34 0.6 0.6 0.6 0.6 0.6 0.6 0.7 0.7 0.635-39 2.6 2.7 2.6 2.6 2.5 2.6 3.4 3.9 3.040-44 9.0 9.8 8.1 8.5 9.1 8.0 13.8 17.3 10.845-49 20.7 24.3 17.2 19.6 22.4 16.8 33.3 44.1 24.050-54 41.5 51.1 32.4 40.0 47.7 32.4 64.0 91.3 40.755-59 85.2 105.5 66.1 83.9 101.3 67.3 118.5 172.0 74.560-64 152.0 190.4 117.2 152.9 187.1 121.3 185.4 274.5 115.665-69 234.9 301.8 177.2 237.8 299.9 183.1 266.0 397.1 168.970-74 318.6 421.4 236.5 323.7 421.2 244.4 334.3 515.0 213.075-79 372.3 513.6 272.4 376.8 511.8 280.1 388.1 629.2 244.080-84 374.7 541.9 273.4 379.1 541.8 279.8 369.3 629.5 234.785+ 299.1 489.9 217.0 302.5 493.5 220.4 278.6 510.8 189.4
Table XV-7LUNG AND BRONCHUS CANCER (Invasive)
SEER INCIDENCEa AND U.S. DEATHb RATES, AGE-ADJUSTED AND AGE-SPECIFIC RATES, BY RACE AND SEX

SEE
R C
ancer Statistics Review
1975-2004N
ational Cancer Institute
a SEER 17 areas. Rates are per 100,000 and are age-adjusted to the 2000 US Std Population (19 age groups - Census P25-1130),unless noted.
b Rates are per 100,000 and are age-adjusted to the IARC world standard population.- Statistic not shown. Rate based on less than 16 cases for the time interval.
All Races Whites BlacksTotal Males Females Total Males Females Total Males Females
SMALL CELL LUNG AND BRONCHUS CANCERAGE AT DIAGNOSISAGE-ADJUSTED RATES, 2000-2004All ages 8.4 9.7 7.4 9.0 10.1 8.1 7.8 10.0 6.3Under 65 3.3 3.5 3.1 3.5 3.7 3.4 3.3 4.1 2.765 and over 43.7 52.4 37.7 46.5 54.6 41.0 38.5 51.0 30.8
All ages(IARC world std)b 5.7 6.4 5.2 6.1 6.7 5.7 5.3 6.7 4.4
AGE-SPECIFIC RATES, 2000-2004<1 - - - - - - - - -1-4 - - - - - - - - -5-9 - - - - - - - - -10-14 - - - - - - - - -15-19 - - - - - - - - -20-24 - - - - - - - - -25-29 - - - - - - - - -30-34 0.1 - - 0.1 - - - - -35-39 0.4 0.3 0.4 0.4 0.4 0.4 - - -40-44 1.3 1.3 1.4 1.4 1.4 1.5 1.3 1.2 1.345-49 3.5 3.6 3.4 3.8 3.9 3.8 3.7 4.3 3.150-54 7.8 8.7 7.1 8.4 9.1 7.7 8.8 10.7 7.255-59 16.9 17.8 16.1 17.9 18.3 17.6 18.4 22.8 14.760-64 29.6 32.0 27.4 32.3 33.9 30.7 27.7 34.5 22.365-69 42.8 46.4 39.7 46.2 48.8 43.9 39.3 48.7 32.170-74 51.7 59.4 45.6 56.0 62.9 50.4 39.8 47.7 34.275-79 52.8 65.4 43.9 55.7 67.8 47.3 47.9 64.1 37.980-84 38.8 50.4 31.7 40.1 51.2 33.3 37.7 58.0 26.685+ 18.7 31.4 13.0 19.1 31.8 13.4 18.6 31.6 13.4
NON-SMALL CELL LUNG AND BRONCHUS CANCERAGE AT DIAGNOSISAGE-ADJUSTED RATES, 2000-2004All ages 56.1 71.5 44.9 56.7 70.9 46.5 68.8 100.6 47.4Under 65 18.6 21.5 15.9 18.3 20.5 16.2 28.6 38.5 20.465 and over 315.0 417.1 244.8 322.4 419.2 255.7 346.8 529.7 233.8
All ages(IARC world std)b 35.6 44.1 28.9 35.9 43.5 29.9 45.7 65.2 31.6
AGE-SPECIFIC RATES, 2000-2004<1 - - - - - - - - -1-4 - - - - - - - - -5-9 - - - - - - - - -10-14 - - - - - - - - -15-19 0.1 - 0.1 0.1 - - - - -20-24 0.3 0.3 0.3 0.3 0.2 0.3 - - -25-29 0.5 0.5 0.5 0.6 0.6 0.6 - - -30-34 1.1 1.1 1.1 1.0 1.0 1.1 1.2 1.3 1.235-39 3.4 3.2 3.7 3.3 3.0 3.7 4.4 4.1 4.740-44 10.1 10.1 10.2 9.6 9.3 10.0 16.9 18.7 15.245-49 22.3 24.3 20.4 21.0 22.2 19.8 40.3 49.3 32.350-54 44.7 51.2 38.6 42.9 47.4 38.4 77.3 101.9 56.455-59 89.9 104.7 76.0 88.1 98.9 77.7 142.8 199.5 95.860-64 161.1 194.3 130.9 162.7 189.8 137.5 217.3 309.4 143.465-69 248.0 305.8 198.4 255.1 308.4 208.5 297.6 418.6 205.470-74 330.4 419.9 259.2 341.3 423.2 274.7 368.4 548.9 243.175-79 379.8 504.8 292.2 389.1 507.6 305.4 410.1 625.0 277.680-84 358.6 494.9 273.9 363.5 494.5 282.2 372.7 606.6 245.885+ 268.5 414.8 202.2 268.9 415.5 203.6 271.5 481.2 187.7
Table XV-8SMALL CELL LUNG AND BRONCHUS CANCER (Invasive) and NON-SMALL CELL LUNG AND BRONCHUS CANCER (Invasive)
SEER INCIDENCEa RATES, AGE-ADJUSTED AND AGE-SPECIFIC RATES, BY RACE AND SEX

SEE
R C
ancer Statistics Review
1975-2004N
ational Cancer Institute
a Rates are based on End Results data from a series of hospital registries and one population-based registry.b Rates are from the SEER 9 areas (San Francisco, Connecticut, Detroit, Hawaii, Iowa, New Mexico, Seattle, Utah, Atlanta).
Rates are based on follow-up of patients into 2004.c Rates are from the SEER 17 areas (San Francisco, Connecticut, Detroit, Hawaii, Iowa, New Mexico, Seattle, Utah, Atlanta, San
Jose-Monterey, Los Angeles, Alaska Native Registry, Rural Georgia, California excluding SF/SJM/LA, Kentucky, Louisiana and NewJersey). California excluding SF/SJM/LA, Kentucky, Louisiana, and New Jersey contribute cases for diagnosis years 2000-2003.The remaining 13 SEER Areas contribute cases for the entire period 1996-2003. Rates are based on follow-up of patients into2004.
d Period survival provides a more up-to-date estimate of survival by piecing together the most recent conditional survivalestimates from several cohorts. It is computed here using three calendar year blocks (2001-2003: 0-1 year survival),(2000-2002: 1-2 year survival), (1999-2001: 2-3 year survival), (1998-2000: 3-4 year survival), (1997-1999: 4-5 yearssurvival).
e The difference in rates between 1975-1977 and 1996-2003 is statistically significant (p<.05).f The standard error of the survival rate is between 5 and 10 percentage points.g The standard error of the survival rate is greater than 10 percentage points.- Statistic could not be calculated due to fewer than 16 cases during the time period.
All Races Whites BlacksTotal Males Females Total Males Females Total Males Females
5-YR RELATIVE SURVIVAL RATESYEAR OF DIAGNOSIS:1960-1963a - - - 8 7 11 5 5 61970-1973a - - - 10 9 14 7 6 101975-1977b 12.7 11.5 15.8 12.8 11.5 15.9 11.5 10.7 14.01978-1980b 13.3 11.8 16.6 13.4 12.0 16.6 12.0 10.0 17.91981-1983b 13.7 12.1 16.9 13.9 12.3 17.1 11.7 10.5 14.91984-1986b 13.3 11.6 16.3 13.5 11.7 16.7 11.4 10.6 13.01987-1989b 13.6 12.4 15.4 13.8 12.5 15.8 11.2 11.1 11.51990-1992b 14.1 12.6 16.3 14.5 13.0 16.6 10.8 9.6 12.81993-1995b 14.8 12.9 17.4 15.1 13.1 17.7 13.0 11.5 15.81996-2003b 15.5e 13.4e 17.9e 15.7e 13.6e 18.1e 12.5e 10.8 14.9
5-YR PERIOD SURVIVAL RATEScd
YEAR OF DIAGNOSIS:1996-2003 15.1 12.9 17.7 15.4 13.2 17.8 12.1 10.3 14.7
STAGE DISTRIBUTION (%) 1996-2003c
All StagesNumber of cases 209,212 115,421 93,791 173,860 93,945 79,915 22,088 13,287 8,801Percent 100% 100% 100% 100% 100% 100% 100% 100% 100%Localized 16 15 18 16 15 18 14 13 15Regional 35 35 35 35 35 34 36 36 37Distant 41 43 39 41 42 39 43 45 41Unstaged 8 7 8 8 7 8 7 6 7
5-YR RELATIVE SURVIVAL RATES, 1996-2003c
AGE AT DIAGNOSIS:<45 23.1 20.8 25.4 25.2 23.7 26.7 14.8 11.5 18.845-54 17.8 14.3 22.2 18.5 14.7 23.2 13.7 11.6 17.355-64 17.0 14.6 20.3 17.5 15.1 20.6 13.3 11.1 17.165-74 15.0 13.0 17.5 15.2 13.2 17.7 11.0 9.6 12.975+ 10.5 9.2 11.7 10.7 9.3 11.9 8.3 7.0 9.6Under 65 17.7 15.0 21.4 18.4 15.6 21.9 13.7 11.4 17.465 and over 13.2 11.5 15.0 13.3 11.7 15.1 10.1 8.8 11.7
STAGE:All Stages 15.0 13.0 17.4 15.3 13.2 17.6 12.0 10.2 14.6Localized 49.1 44.6 53.4 49.8 45.4 53.8 40.4 36.7 44.7Regional 15.2 13.9 16.8 15.5 14.2 16.9 12.9 10.9 15.7Distant 3.0 2.7 3.4 2.9 2.5 3.4 2.8 2.6 3.1Unstaged 8.1 7.6 8.7 7.8 7.1 8.5 8.5 8.7 8.2
Table XV-9LUNG AND BRONCHUS CANCER (Invasive)
SURVIVAL RATES, BY RACE, SEX, DIAGNOSIS YEAR, STAGE AND AGE

SEE
R C
ancer Statistics Review
1975-2004N
ational Cancer Institute
a Rates are from the SEER 9 areas (San Francisco, Connecticut, Detroit, Hawaii, Iowa, New Mexico, Seattle, Utah, Atlanta).Rates are based on follow-up of patients into 2004.
b Rates are from the SEER 17 areas (San Francisco, Connecticut, Detroit, Hawaii, Iowa, New Mexico, Seattle, Utah, Atlanta, SanJose-Monterey, Los Angeles, Alaska Native Registry, Rural Georgia, California excluding SF/SJM/LA, Kentucky, Louisiana and NewJersey). California excluding SF/SJM/LA, Kentucky, Louisiana, and New Jersey contribute cases for diagnosis years 2000-2003.The remaining 13 SEER Areas contribute cases for the entire period 1996-2003. Rates are based on follow-up of patients into2004.
c Period survival provides a more up-to-date estimate of survival by piecing together the most recent conditional survivalestimates from several cohorts. It is computed here using three calendar year blocks (2001-2003: 0-1 year survival),(2000-2002: 1-2 year survival), (1999-2001: 2-3 year survival), (1998-2000: 3-4 year survival), (1997-1999: 4-5 yearssurvival).
d The difference in rates between 1975-1977 and 1996-2003 is statistically significant (p<.05).e The standard error of the survival rate is between 5 and 10 percentage points.f The standard error of the survival rate is greater than 10 percentage points.- Statistic could not be calculated due to fewer than 16 cases during the time period.
All Races Whites BlacksTotal Males Females Total Males Females Total Males Females
5-YR RELATIVE SURVIVAL RATESYEAR OF DIAGNOSIS:1975-1977a 3.7 3.1 4.8 3.7 3.1 4.9 3.8 3.9 3.61978-1980a 4.4 3.3 6.6 4.5 3.5 6.5 3.2 2.4 5.01981-1983a 4.8 3.8 6.4 4.9 3.9 6.3 5.6 4.3 8.51984-1986a 4.7 3.5 6.4 4.9 3.7 6.6 3.6 2.3 5.61987-1989a 5.2 4.0 6.7 5.3 4.0 6.9 4.0 3.4 4.71990-1992a 5.6 4.8 6.6 5.7 4.8 6.8 4.2 4.4 3.91993-1995a 6.6 5.4 8.0 6.5 5.3 7.8 6.9 4.6 9.91996-2003a 6.2d 5.3d 7.0d 6.2d 5.1d 7.2d 4.8d 4.8d 4.7
5-YR PERIOD SURVIVAL RATESbc
YEAR OF DIAGNOSIS:1996-2003 5.9 5.3 6.5 5.9 5.1 6.7 4.8 5.6 4.0
STAGE DISTRIBUTION (%) 1996-2003b
All StagesNumber of cases 29,144 15,049 14,095 25,504 12,906 12,598 2,317 1,260 1,057Percent 100% 100% 100% 100% 100% 100% 100% 100% 100%Localized 6 6 6 6 6 6 6 6 6Regional 33 31 35 33 30 35 35 35 36Distant 56 59 54 57 60 53 54 55 54Unstaged 5 4 5 5 4 5 4 4 5
5-YR RELATIVE SURVIVAL RATES, 1996-2003b
AGE AT DIAGNOSIS:<45 9.0 7.6 10.4 9.5 7.6 11.4 - - 0.045-54 8.3 6.4 10.6 8.5 6.9 10.4 6.3 2.8 10.755-64 7.4 6.3 8.5 7.4 6.2 8.6 5.2 4.9 5.665-74 4.9 4.2 5.6 4.9 3.9 5.8 4.0 5.0 2.975+ 2.8 2.3 3.2 2.9 2.6 3.2 1.4 1.1 2.0Under 65 7.7 6.5 9.2 7.8 6.5 9.2 5.3 4.3 6.865 and over 4.2 3.6 4.7 4.2 3.5 4.9 3.2 3.7 2.6
STAGE:All Stages 5.7 4.9 6.6 5.8 4.9 6.7 4.3 3.9 4.7Localized 18.9 17.3 20.3 18.5 17.3 19.6 17.7 19.9e 13.2e
Regional 9.9 9.2 10.4 10.2 9.4 10.9 6.3 6.3 6.4Distant 1.9 1.4 2.4 1.8 1.4 2.4 0.8 0.0 2.3Unstaged 6.5 5.8 7.0 6.4 6.1 6.7 7.1 - 8.6
Table XV-10SMALL CELL LUNG AND BRONCHUS CANCER (Invasive)
SURVIVAL RATES, BY RACE, SEX, DIAGNOSIS YEAR, STAGE AND AGE

SEE
R C
ancer Statistics Review
1975-2004N
ational Cancer Institute
a Rates are from the SEER 9 areas (San Francisco, Connecticut, Detroit, Hawaii, Iowa, New Mexico, Seattle, Utah, Atlanta).Rates are based on follow-up of patients into 2004.
b Rates are from the SEER 17 areas (San Francisco, Connecticut, Detroit, Hawaii, Iowa, New Mexico, Seattle, Utah, Atlanta, SanJose-Monterey, Los Angeles, Alaska Native Registry, Rural Georgia, California excluding SF/SJM/LA, Kentucky, Louisiana and NewJersey). California excluding SF/SJM/LA, Kentucky, Louisiana, and New Jersey contribute cases for diagnosis years 2000-2003.The remaining 13 SEER Areas contribute cases for the entire period 1996-2003. Rates are based on follow-up of patients into2004.
c Period survival provides a more up-to-date estimate of survival by piecing together the most recent conditional survivalestimates from several cohorts. It is computed here using three calendar year blocks (2001-2003: 0-1 year survival),(2000-2002: 1-2 year survival), (1999-2001: 2-3 year survival), (1998-2000: 3-4 year survival), (1997-1999: 4-5 yearssurvival).
d The difference in rates between 1975-1977 and 1996-2003 is statistically significant (p<.05).e The standard error of the survival rate is between 5 and 10 percentage points.f The standard error of the survival rate is greater than 10 percentage points.- Statistic could not be calculated due to fewer than 16 cases during the time period.
All Races Whites BlacksTotal Males Females Total Males Females Total Males Females
5-YR RELATIVE SURVIVAL RATESYEAR OF DIAGNOSIS:1975-1977a 14.2 12.7 17.9 14.3 12.8 18.1 12.5 11.4 16.21978-1980a 15.0 13.4 18.9 15.3 13.6 18.9 13.2 10.9 19.91981-1983a 15.6 13.7 19.5 16.0 14.0 19.9 12.5 11.3 15.91984-1986a 15.1 13.2 18.8 15.5 13.4 19.2 12.6 11.8 14.61987-1989a 15.4 14.0 17.6 15.8 14.2 18.2 12.3 12.1 12.71990-1992a 15.8 14.0 18.6 16.4 14.6 19.1 11.7 10.2 14.41993-1995a 16.4 14.2 19.4 16.8 14.5 20.0 13.8 12.3 16.71996-2003a 17.1d 14.7d 20.1d 17.5d 15.1d 20.4d 13.4 11.5 16.4
5-YR PERIOD SURVIVAL RATESbc
YEAR OF DIAGNOSIS:1996-2003 16.6 14.0 19.7 17.0 14.5 20.0 12.9 10.8 16.1
STAGE DISTRIBUTION (%) 1996-2003b
All StagesNumber of cases 180,068 100,372 79,696 148,356 81,039 67,317 19,771 12,027 7,744Percent 100% 100% 100% 100% 100% 100% 100% 100% 100%Localized 18 16 20 18 16 20 15 13 17Regional 35 36 35 35 36 34 37 36 37Distant 39 40 37 38 40 37 42 44 39Unstaged 8 8 9 8 8 9 7 7 7
5-YR RELATIVE SURVIVAL RATES, 1996-2003b
AGE AT DIAGNOSIS:<45 24.8 22.5 27.3 27.4 26.1 28.8 15.7 11.9 20.545-54 19.4 15.6 24.4 20.4 16.1 25.9 14.5 12.5 18.155-64 19.0 16.1 23.1 19.8 16.8 23.7 14.4 11.8 18.865-74 16.8 14.4 19.9 17.2 14.7 20.2 11.9 10.1 14.575+ 11.5 10.0 12.9 11.7 10.2 13.1 9.0 7.6 10.4Under 65 19.6 16.4 23.9 20.6 17.3 24.8 14.6 12.1 18.865 and over 14.6 12.7 16.7 14.8 12.9 17.0 10.9 9.3 13.0
STAGE:All Stages 16.5 14.2 19.4 17.0 14.6 19.7 12.9 10.8 15.9Localized 50.8 46.1 55.4 51.6 47.0 55.9 41.4 37.4 46.1Regional 16.1 14.5 18.0 16.3 14.9 18.1 13.6 11.4 16.9Distant 3.2 2.9 3.7 3.2 2.8 3.7 3.0 2.9 3.2Unstaged 8.3 7.7 9.0 7.9 7.2 8.7 8.6 8.9 8.0
Table XV-11NON-SMALL CELL LUNG AND BRONCHUS CANCER (Invasive)
SURVIVAL RATES, BY RACE, SEX, DIAGNOSIS YEAR, STAGE AND AGE

SEE
R C
ancer Statistics Review
1975-2004N
ational Cancer Institute
a Survival rates are relative rates expressed as percents.b Rates are from the SEER 9 areas (San Francisco, Connecticut, Detroit, Hawaii, Iowa, New Mexico, Seattle, Utah, and Atlanta).
1975- 1980-1979 1984 1985 1986 1987 1988 1989 1990 1991 1992 1993 1994 1995 1996 1997 1998 1999 2000 2001 2002 2003
Relative Survival Rates (SEERb)
1-year 36.7 38.7 39.5 40.2 39.7 40.2 40.3 40.3 41.2 41.1 40.8 41.0 41.5 41.0 41.7 41.2 42.7 42.3 41.4 41.8 42.82-year 21.6 22.6 22.9 23.1 22.8 23.4 23.4 23.6 24.0 24.7 24.6 24.5 25.4 25.2 25.4 25.8 26.4 26.5 26.0 26.93-year 16.7 17.4 17.6 17.6 17.0 17.7 17.6 18.0 18.8 19.0 18.9 19.1 19.5 19.7 19.8 20.2 20.2 20.8 20.14-year 14.4 14.9 15.1 14.8 14.8 15.2 15.2 15.3 16.0 16.2 16.2 16.3 16.9 16.7 17.0 17.3 17.4 18.05-year 13.0 13.4 13.6 13.2 13.3 13.5 13.9 13.8 14.2 14.3 14.7 14.8 15.0 15.1 15.3 15.1 15.66-year 12.0 12.3 12.6 12.1 12.2 12.3 12.9 12.7 13.2 13.2 13.6 13.6 13.7 13.7 13.8 13.77-year 11.4 11.5 11.6 11.4 11.1 11.4 12.0 11.7 12.0 12.2 12.6 12.6 13.0 12.8 12.98-year 10.8 10.7 10.9 10.6 10.5 10.6 11.1 11.0 11.2 11.3 11.7 11.9 12.2 11.99-year 10.2 10.0 10.2 10.1 9.8 10.0 10.5 10.1 10.6 10.6 11.1 11.2 11.5
11-year 9.7 9.4 9.7 9.4 9.3 9.4 10.0 9.4 10.1 10.0 10.3 10.610-year 9.2 9.1 9.2 8.9 8.8 8.8 9.4 8.8 9.5 9.4 9.712-year 8.9 8.6 8.8 8.4 8.4 8.2 9.0 8.3 9.0 9.013-year 8.5 8.2 8.4 8.0 7.8 7.9 8.6 8.1 8.414-year 8.2 7.9 8.0 7.7 7.4 7.5 8.1 7.815-year 7.8 7.5 7.7 7.3 7.1 7.4 7.816-year 7.6 7.1 7.2 7.1 6.9 7.017-year 7.4 6.8 6.6 6.7 6.618-year 7.0 6.5 6.1 6.619-year 6.8 6.1 5.820-year 6.6 5.8
Table XV-12LUNG AND BRONCHUS CANCER (Invasive)
SURVIVAL RATESa
By Year of Diagnosis
All Races, Males and Females
Year of Diagnosis

SEE
R C
ancer Statistics Review
1975-2004N
ational Cancer Institute
a Survival rates are relative rates expressed as percents.b Rates are from the SEER 9 areas (San Francisco, Connecticut, Detroit, Hawaii, Iowa, New Mexico, Seattle, Utah, and Atlanta).
1975- 1980-1979 1984 1985 1986 1987 1988 1989 1990 1991 1992 1993 1994 1995 1996 1997 1998 1999 2000 2001 2002 2003
Relative Survival Rates (SEERb)
1-year 34.7 36.8 36.8 38.2 38.2 38.2 37.9 38.1 39.0 39.1 38.2 38.7 39.3 39.2 39.3 38.3 39.6 39.9 38.2 38.3 40.22-year 20.0 20.8 20.9 21.0 21.7 21.9 22.0 21.4 22.1 23.2 22.4 22.1 23.5 23.5 23.5 23.2 23.3 24.2 22.6 23.63-year 15.1 15.7 15.6 15.9 15.9 16.5 16.2 16.1 17.1 17.6 16.6 16.7 17.6 18.1 18.1 17.7 17.0 18.6 17.54-year 12.9 13.4 13.0 13.1 13.7 13.7 13.9 13.5 14.2 14.8 14.0 14.0 15.1 15.0 15.3 15.0 14.4 16.05-year 11.5 12.0 11.7 11.6 12.3 12.1 12.8 12.0 12.6 13.1 12.6 12.7 13.5 13.4 13.8 12.8 13.06-year 10.6 10.9 10.8 10.6 11.3 10.8 11.9 11.0 11.7 11.9 11.6 11.5 12.2 12.2 12.3 11.47-year 10.0 10.1 9.9 9.9 10.4 9.9 11.2 10.2 10.5 10.9 10.7 10.6 11.7 11.2 11.38-year 9.5 9.3 9.2 9.1 9.9 9.2 10.5 9.3 9.7 9.9 9.9 9.9 10.8 10.59-year 8.9 8.7 8.7 8.7 9.3 8.6 10.0 8.4 9.2 9.2 9.3 9.4 10.1
11-year 8.4 8.2 8.3 8.1 8.7 8.1 9.5 7.7 8.8 8.6 8.8 9.010-year 8.0 7.9 7.9 7.4 8.2 7.6 8.9 7.1 8.2 7.9 8.112-year 7.6 7.5 7.5 6.9 7.8 7.0 8.5 6.7 7.9 7.713-year 7.3 7.1 7.1 6.6 7.0 6.7 8.0 6.4 7.214-year 7.0 6.8 6.9 6.3 6.7 6.4 7.5 6.315-year 6.6 6.4 6.4 6.0 6.5 6.3 7.316-year 6.4 6.1 6.2 5.7 6.2 6.017-year 6.3 5.7 5.5 5.3 5.918-year 5.9 5.5 5.0 5.119-year 5.7 5.2 4.820-year 5.5 4.8
Table XV-13LUNG AND BRONCHUS CANCER (Invasive)
SURVIVAL RATESa
By Year of Diagnosis
All Races, Males
Year of Diagnosis

SEE
R C
ancer Statistics Review
1975-2004N
ational Cancer Institute
a Survival rates are relative rates expressed as percents.b Rates are from the SEER 9 areas (San Francisco, Connecticut, Detroit, Hawaii, Iowa, New Mexico, Seattle, Utah, and Atlanta).
1975- 1980-1979 1984 1985 1986 1987 1988 1989 1990 1991 1992 1993 1994 1995 1996 1997 1998 1999 2000 2001 2002 2003
Relative Survival Rates (SEERb)
1-year 41.7 42.8 44.6 43.9 42.3 43.7 44.1 43.7 44.6 44.1 44.6 44.1 44.6 43.4 44.6 44.8 46.5 45.2 45.4 46.0 45.82-year 25.8 26.2 26.6 27.1 24.6 25.9 25.8 27.0 26.8 27.0 27.9 27.9 27.9 27.5 27.6 29.0 30.1 29.3 30.2 30.83-year 20.6 20.9 21.4 20.6 18.9 19.8 19.8 20.9 21.2 21.1 22.2 22.2 22.1 21.7 21.8 23.2 24.0 23.5 23.24-year 18.1 18.1 18.9 17.8 16.6 17.6 17.3 18.0 18.6 18.3 19.2 19.4 19.3 18.9 19.0 20.3 20.9 20.45-year 16.6 16.4 17.1 15.9 14.8 15.7 15.7 16.5 16.5 16.1 17.7 17.5 17.1 17.1 17.1 17.8 18.86-year 15.4 15.1 16.0 14.7 13.6 14.5 14.5 15.2 15.2 15.1 16.3 16.4 15.7 15.7 15.7 16.67-year 14.5 14.2 14.6 13.8 12.2 13.6 13.1 14.0 14.1 14.0 15.1 15.2 14.7 14.7 14.78-year 13.7 13.3 13.8 12.9 11.5 12.8 12.0 13.3 13.3 13.2 14.2 14.4 14.0 13.79-year 13.0 12.5 12.9 12.5 10.5 12.0 11.3 12.5 12.6 12.5 13.4 13.4 13.3
11-year 12.3 11.8 12.2 11.5 10.3 11.3 10.7 11.7 11.9 11.9 12.3 12.610-year 11.9 11.3 11.5 11.0 9.8 10.6 10.1 11.2 11.2 11.2 11.812-year 11.4 10.7 11.0 10.6 9.3 9.9 9.7 10.5 10.6 10.813-year 11.1 10.1 10.5 10.0 9.0 9.7 9.4 10.3 9.914-year 10.6 9.8 9.9 9.7 8.4 9.1 9.0 9.915-year 10.1 9.3 9.6 9.2 8.1 8.9 8.516-year 9.8 8.9 8.8 9.0 7.8 8.417-year 9.4 8.7 8.1 8.9 7.618-year 9.0 8.2 7.7 8.519-year 8.7 7.6 7.420-year 8.4 7.3
Table XV-14LUNG AND BRONCHUS CANCER (Invasive)
SURVIVAL RATESa
By Year of Diagnosis
All Races, Females
Year of Diagnosis

SEE
R C
ancer Statistics Review
1975-2004N
ational Cancer Institute
Devcan Version 6.2.0, April 2006, National Cancer Institute (http://srab.cancer.gov/devcan/).Source: Incidence data are from the SEER 17 areas (San Francisco, Connecticut, Detroit, Hawaii, Iowa, New Mexico, Seattle, Utah, Atlanta, San
Jose-Monterey, Los Angeles, Alaska Native Registry, Rural Georgia, California excluding SF/SJM/LA, Kentucky, Louisiana and New Jersey).Mortality data are from the NCHS public use data file for the total US.
- Statistic could not be calculated.A percent or confidence interval value of 0.00 represents a value that is below 0.005.
Risk of Being Diagnosed with Cancer Risk of Dying from Cancer
Race/ Current +10 yrs +20 yrs +30 yrs Eventually Eventually
Ethnicity Age Percent ( 95% C.I. ) Percent ( 95% C.I. ) Percent ( 95% C.I. ) Percent ( 95% C.I. ) Percent ( 95% C.I. )
All Races 0 0.00 ( 0.00, 0.00 ) 0.00 ( 0.00, 0.00 ) 0.01 ( 0.00, 0.01 ) 6.98 ( 6.94, 7.02 ) 5.99 ( 5.97, 6.00 )
10 0.00 ( 0.00, 0.00 ) 0.01 ( 0.00, 0.01 ) 0.03 ( 0.03, 0.03 ) 7.07 ( 7.03, 7.11 ) 6.07 ( 6.05, 6.09 )
20 0.00 ( 0.00, 0.01 ) 0.03 ( 0.03, 0.03 ) 0.22 ( 0.21, 0.22 ) 7.10 ( 7.06, 7.13 ) 6.10 ( 6.08, 6.12 )
30 0.03 ( 0.03, 0.03 ) 0.21 ( 0.21, 0.22 ) 0.94 ( 0.93, 0.95 ) 7.16 ( 7.12, 7.20 ) 6.15 ( 6.14, 6.17 )
40 0.19 ( 0.19, 0.19 ) 0.93 ( 0.92, 0.94 ) 2.88 ( 2.86, 2.90 ) 7.22 ( 7.18, 7.26 ) 6.22 ( 6.20, 6.24 )
50 0.76 ( 0.75, 0.77 ) 2.77 ( 2.75, 2.79 ) 5.51 ( 5.48, 5.54 ) 7.24 ( 7.20, 7.28 ) 6.25 ( 6.24, 6.27 )
60 2.14 ( 2.12, 2.16 ) 5.06 ( 5.03, 5.10 ) 6.63 ( 6.59, 6.67 ) 6.90 ( 6.86, 6.95 ) 6.01 ( 5.99, 6.03 )
70 3.39 ( 3.36, 3.42 ) 5.21 ( 5.17, 5.25 ) - ( - , - ) 5.52 ( 5.48, 5.56 ) 4.94 ( 4.92, 4.95 )
80 2.61 ( 2.58, 2.64 ) - ( - , - ) - ( - , - ) 3.06 ( 3.02, 3.09 ) 2.94 ( 2.92, 2.96 )
White 0 0.00 ( 0.00, 0.00 ) 0.00 ( 0.00, 0.00 ) 0.01 ( 0.00, 0.01 ) 7.17 ( 7.12, 7.21 ) 6.13 ( 6.11, 6.15 )
10 0.00 ( 0.00, 0.00 ) 0.01 ( 0.00, 0.01 ) 0.03 ( 0.03, 0.03 ) 7.25 ( 7.20, 7.29 ) 6.20 ( 6.18, 6.22 )
20 0.00 ( 0.00, 0.01 ) 0.03 ( 0.03, 0.03 ) 0.21 ( 0.21, 0.21 ) 7.27 ( 7.23, 7.32 ) 6.23 ( 6.21, 6.25 )
30 0.03 ( 0.02, 0.03 ) 0.21 ( 0.20, 0.21 ) 0.93 ( 0.91, 0.94 ) 7.33 ( 7.29, 7.38 ) 6.28 ( 6.26, 6.30 )
40 0.18 ( 0.18, 0.19 ) 0.91 ( 0.90, 0.92 ) 2.94 ( 2.91, 2.96 ) 7.39 ( 7.35, 7.44 ) 6.34 ( 6.32, 6.36 )
50 0.75 ( 0.74, 0.76 ) 2.83 ( 2.80, 2.85 ) 5.68 ( 5.64, 5.71 ) 7.41 ( 7.36, 7.46 ) 6.37 ( 6.35, 6.39 )
60 2.21 ( 2.19, 2.23 ) 5.24 ( 5.20, 5.27 ) 6.82 ( 6.77, 6.86 ) 7.08 ( 7.03, 7.12 ) 6.12 ( 6.10, 6.14 )
70 3.50 ( 3.47, 3.53 ) 5.33 ( 5.29, 5.38 ) - ( - , - ) 5.63 ( 5.59, 5.68 ) 5.01 ( 4.99, 5.03 )
80 2.63 ( 2.60, 2.67 ) - ( - , - ) - ( - , - ) 3.06 ( 3.03, 3.10 ) 2.96 ( 2.94, 2.98 )
Black 0 0.00 ( 0.00, 0.00 ) 0.00 ( 0.00, 0.00 ) 0.01 ( 0.00, 0.01 ) 6.64 ( 6.52, 6.76 ) 5.50 ( 5.45, 5.55 )
10 0.00 ( 0.00, 0.00 ) 0.01 ( 0.00, 0.01 ) 0.04 ( 0.03, 0.04 ) 6.80 ( 6.68, 6.93 ) 5.64 ( 5.59, 5.69 )
20 0.01 ( 0.00, 0.01 ) 0.04 ( 0.03, 0.04 ) 0.33 ( 0.32, 0.35 ) 6.84 ( 6.72, 6.97 ) 5.67 ( 5.62, 5.73 )
30 0.03 ( 0.03, 0.04 ) 0.34 ( 0.32, 0.35 ) 1.39 ( 1.35, 1.43 ) 6.95 ( 6.82, 7.08 ) 5.76 ( 5.71, 5.81 )
40 0.31 ( 0.29, 0.32 ) 1.39 ( 1.35, 1.43 ) 3.51 ( 3.44, 3.59 ) 7.08 ( 6.96, 7.21 ) 5.88 ( 5.83, 5.93 )
50 1.14 ( 1.11, 1.18 ) 3.38 ( 3.30, 3.46 ) 5.79 ( 5.68, 5.91 ) 7.14 ( 7.01, 7.28 ) 5.95 ( 5.89, 6.00 )
60 2.51 ( 2.44, 2.58 ) 5.22 ( 5.11, 5.34 ) 6.51 ( 6.38, 6.65 ) 6.74 ( 6.60, 6.89 ) 5.68 ( 5.63, 5.74 )
70 3.41 ( 3.31, 3.52 ) 5.04 ( 4.91, 5.18 ) - ( - , - ) 5.33 ( 5.19, 5.47 ) 4.63 ( 4.57, 4.69 )
80 2.61 ( 2.50, 2.74 ) - ( - , - ) - ( - , - ) 3.08 ( 2.94, 3.22 ) 2.84 ( 2.78, 2.90 )
Table XV-15
LUNG AND BRONCHUS CANCER (Invasive)
Risk of Being Diagnosed With Cancer in 10, 20 and 30 Years, Lifetime Risk of Being Diagnosed with Cancer, and
Lifetime Risk of Dying from Cancer Given Cancer Free At Current Age
Both Sexes, 2002-2004 By Race/Ethnicity

SEE
R C
ancer Statistics Review
1975-2004N
ational Cancer Institute
Devcan Version 6.2.0, April 2006, National Cancer Institute (http://srab.cancer.gov/devcan/).Source: Incidence data are from the SEER 17 areas (San Francisco, Connecticut, Detroit, Hawaii, Iowa, New Mexico, Seattle, Utah, Atlanta, San
Jose-Monterey, Los Angeles, Alaska Native Registry, Rural Georgia, California excluding SF/SJM/LA, Kentucky, Louisiana and New Jersey).Mortality data are from the NCHS public use data file for the total US.
a Underlying incidence and mortlaity data for American Indian/Alaska Native are based on the CHSDA(Contract Health Service Delivery Area)counties.
b Hispanic is not mutually exclusive from whites, blacks, Asian/Pacific Islanders, and American Indians/Alaska Natives. Underlyingincidence data for Hispanics are based on NHIA and exclude cases from the Alaska Native Registry and Kentucky. Underlying mortalitydata for Hispanics exclude deaths from Minnesota, New Hampshire and North Dakota.
- Statistic could not be calculated.A percent or confidence interval value of 0.00 represents a value that is below 0.005.
Risk of Being Diagnosed with Cancer Risk of Dying from Cancer
Race/ Current +10 yrs +20 yrs +30 yrs Eventually Eventually
Ethnicity Age Percent ( 95% C.I. ) Percent ( 95% C.I. ) Percent ( 95% C.I. ) Percent ( 95% C.I. ) Percent ( 95% C.I. )
Asian/ 0 0.00 ( 0.00, 0.00 ) 0.00 ( 0.00, 0.00 ) 0.00 ( 0.00, 0.01 ) 5.55 ( 5.39, 5.73 ) 4.12 ( 3.99, 4.25 )
Pacific 10 0.00 ( 0.00, 0.00 ) 0.00 ( 0.00, 0.01 ) 0.03 ( 0.03, 0.04 ) 5.60 ( 5.44, 5.78 ) 4.16 ( 4.03, 4.29 )
Islander 20 0.00 ( 0.00, 0.00 ) 0.03 ( 0.03, 0.04 ) 0.15 ( 0.14, 0.16 ) 5.62 ( 5.45, 5.79 ) 4.17 ( 4.04, 4.30 )
30 0.03 ( 0.02, 0.03 ) 0.14 ( 0.13, 0.16 ) 0.58 ( 0.55, 0.60 ) 5.64 ( 5.47, 5.82 ) 4.18 ( 4.05, 4.32 )
40 0.12 ( 0.11, 0.13 ) 0.55 ( 0.52, 0.58 ) 1.66 ( 1.60, 1.72 ) 5.65 ( 5.48, 5.82 ) 4.19 ( 4.06, 4.32 )
50 0.44 ( 0.42, 0.46 ) 1.56 ( 1.51, 1.62 ) 3.46 ( 3.36, 3.56 ) 5.61 ( 5.44, 5.79 ) 4.17 ( 4.04, 4.31 )
60 1.16 ( 1.12, 1.22 ) 3.13 ( 3.03, 3.23 ) 4.79 ( 4.65, 4.93 ) 5.36 ( 5.18, 5.54 ) 4.04 ( 3.91, 4.18 )
70 2.14 ( 2.06, 2.22 ) 3.95 ( 3.82, 4.09 ) - ( - , - ) 4.57 ( 4.39, 4.76 ) 3.60 ( 3.47, 3.75 )
80 2.26 ( 2.14, 2.39 ) - ( - , - ) - ( - , - ) 3.04 ( 2.85, 3.24 ) 2.56 ( 2.41, 2.73 )
American 0 0.00 ( 0.00, 0.02 ) 0.00 ( 0.00, 0.02 ) 0.01 ( 0.00, 0.03 ) 4.66 ( 4.18, 5.27 ) 4.13 ( 3.88, 4.42 )
Indian/ 10 0.00 ( 0.00, 0.01 ) 0.01 ( 0.00, 0.02 ) 0.02 ( 0.01, 0.04 ) 4.74 ( 4.25, 5.36 ) 4.21 ( 3.95, 4.50 )
Alaska 20 0.01 ( 0.00, 0.02 ) 0.02 ( 0.01, 0.04 ) 0.10 ( 0.07, 0.14 ) 4.78 ( 4.28, 5.40 ) 4.24 ( 3.98, 4.54 )
Nativea 30 0.01 ( 0.00, 0.03 ) 0.09 ( 0.06, 0.13 ) 0.61 ( 0.51, 0.72 ) 4.85 ( 4.35, 5.49 ) 4.32 ( 4.06, 4.62 )
40 0.08 ( 0.06, 0.12 ) 0.62 ( 0.52, 0.73 ) 1.96 ( 1.73, 2.21 ) 4.97 ( 4.46, 5.62 ) 4.44 ( 4.17, 4.75 )
50 0.55 ( 0.46, 0.66 ) 1.95 ( 1.72, 2.21 ) 3.88 ( 3.49, 4.31 ) 5.09 ( 4.55, 5.76 ) 4.57 ( 4.28, 4.89 )
60 1.50 ( 1.29, 1.74 ) 3.58 ( 3.18, 4.02 ) 4.71 ( 4.20, 5.29 ) 4.88 ( 4.32, 5.59 ) 4.52 ( 4.21, 4.86 )
70 2.44 ( 2.08, 2.85 ) 3.77 ( 3.25, 4.37 ) - ( - , - ) 3.96 ( 3.39, 4.73 ) 3.72 ( 3.40, 4.09 )
80 1.88 ( 1.44, 2.44 ) - ( - , - ) - ( - , - ) 2.15 ( 1.60, 3.02 ) 2.29 ( 1.95, 2.72 )
Hispanicb 0 0.00 ( 0.00, 0.00 ) 0.00 ( 0.00, 0.00 ) 0.00 ( 0.00, 0.01 ) 4.38 ( 4.25, 4.52 ) 3.17 ( 3.10, 3.24 )
10 0.00 ( 0.00, 0.00 ) 0.00 ( 0.00, 0.01 ) 0.02 ( 0.01, 0.02 ) 4.43 ( 4.30, 4.57 ) 3.21 ( 3.14, 3.28 )
20 0.00 ( 0.00, 0.01 ) 0.02 ( 0.01, 0.02 ) 0.09 ( 0.08, 0.10 ) 4.45 ( 4.32, 4.59 ) 3.22 ( 3.15, 3.29 )
30 0.01 ( 0.01, 0.01 ) 0.09 ( 0.08, 0.09 ) 0.40 ( 0.39, 0.42 ) 4.48 ( 4.35, 4.62 ) 3.25 ( 3.18, 3.32 )
40 0.08 ( 0.07, 0.08 ) 0.40 ( 0.38, 0.41 ) 1.35 ( 1.31, 1.40 ) 4.51 ( 4.38, 4.65 ) 3.27 ( 3.20, 3.35 )
50 0.33 ( 0.31, 0.35 ) 1.31 ( 1.26, 1.35 ) 2.94 ( 2.86, 3.02 ) 4.54 ( 4.40, 4.68 ) 3.30 ( 3.23, 3.37 )
60 1.03 ( 0.99, 1.07 ) 2.75 ( 2.66, 2.83 ) 3.99 ( 3.88, 4.11 ) 4.43 ( 4.29, 4.58 ) 3.24 ( 3.17, 3.32 )
70 1.93 ( 1.86, 2.00 ) 3.33 ( 3.21, 3.45 ) - ( - , - ) 3.82 ( 3.67, 3.98 ) 2.89 ( 2.81, 2.97 )
80 1.86 ( 1.75, 1.97 ) - ( - , - ) - ( - , - ) 2.51 ( 2.35, 2.69 ) 2.05 ( 1.96, 2.14 )
Table XV-15 - continued
LUNG AND BRONCHUS CANCER (Invasive)
Risk of Being Diagnosed With Cancer in 10, 20 and 30 Years, Lifetime Risk of Being Diagnosed with Cancer, and
Lifetime Risk of Dying from Cancer Given Cancer Free At Current Age
Both Sexes, 2002-2004 By Race/Ethnicity

SEE
R C
ancer Statistics Review
1975-2004N
ational Cancer Institute
Devcan Version 6.2.0, April 2006, National Cancer Institute (http://srab.cancer.gov/devcan/).Source: Incidence data are from the SEER 17 areas (San Francisco, Connecticut, Detroit, Hawaii, Iowa, New Mexico, Seattle, Utah, Atlanta, San
Jose-Monterey, Los Angeles, Alaska Native Registry, Rural Georgia, California excluding SF/SJM/LA, Kentucky, Louisiana and New Jersey).Mortality data are from the NCHS public use data file for the total US.
- Statistic could not be calculated.A percent or confidence interval value of 0.00 represents a value that is below 0.005.
Risk of Being Diagnosed with Cancer Risk of Dying from Cancer
Race/ Current +10 yrs +20 yrs +30 yrs Eventually Eventually
Ethnicity Age Percent ( 95% C.I. ) Percent ( 95% C.I. ) Percent ( 95% C.I. ) Percent ( 95% C.I. ) Percent ( 95% C.I. )
All Races 0 0.00 ( 0.00, 0.00 ) 0.00 ( 0.00, 0.00 ) 0.00 ( 0.00, 0.01 ) 7.91 ( 7.85, 7.98 ) 7.12 ( 7.09, 7.14 )
10 0.00 ( 0.00, 0.00 ) 0.00 ( 0.00, 0.01 ) 0.03 ( 0.03, 0.03 ) 8.02 ( 7.96, 8.08 ) 7.23 ( 7.20, 7.26 )
20 0.00 ( 0.00, 0.01 ) 0.03 ( 0.03, 0.03 ) 0.22 ( 0.22, 0.23 ) 8.07 ( 8.01, 8.13 ) 7.27 ( 7.24, 7.30 )
30 0.03 ( 0.02, 0.03 ) 0.22 ( 0.22, 0.23 ) 1.04 ( 1.02, 1.05 ) 8.17 ( 8.11, 8.23 ) 7.37 ( 7.34, 7.40 )
40 0.20 ( 0.19, 0.21 ) 1.03 ( 1.02, 1.05 ) 3.28 ( 3.24, 3.31 ) 8.28 ( 8.22, 8.35 ) 7.48 ( 7.45, 7.51 )
50 0.86 ( 0.85, 0.88 ) 3.19 ( 3.16, 3.22 ) 6.40 ( 6.35, 6.45 ) 8.38 ( 8.32, 8.45 ) 7.59 ( 7.56, 7.62 )
60 2.52 ( 2.49, 2.55 ) 5.99 ( 5.94, 6.05 ) 7.83 ( 7.77, 7.90 ) 8.14 ( 8.07, 8.21 ) 7.42 ( 7.39, 7.45 )
70 4.16 ( 4.12, 4.21 ) 6.37 ( 6.31, 6.43 ) - ( - , - ) 6.74 ( 6.67, 6.81 ) 6.29 ( 6.26, 6.33 )
80 3.43 ( 3.38, 3.49 ) - ( - , - ) - ( - , - ) 4.00 ( 3.94, 4.07 ) 4.01 ( 3.98, 4.05 )
White 0 0.00 ( 0.00, 0.00 ) 0.00 ( 0.00, 0.00 ) 0.00 ( 0.00, 0.01 ) 7.98 ( 7.92, 8.05 ) 7.20 ( 7.17, 7.23 )
10 0.00 ( 0.00, 0.00 ) 0.00 ( 0.00, 0.01 ) 0.03 ( 0.03, 0.03 ) 8.08 ( 8.01, 8.14 ) 7.29 ( 7.27, 7.32 )
20 0.00 ( 0.00, 0.01 ) 0.03 ( 0.03, 0.03 ) 0.21 ( 0.20, 0.22 ) 8.12 ( 8.05, 8.19 ) 7.34 ( 7.31, 7.37 )
30 0.02 ( 0.02, 0.03 ) 0.21 ( 0.20, 0.21 ) 0.99 ( 0.97, 1.01 ) 8.21 ( 8.14, 8.28 ) 7.43 ( 7.40, 7.45 )
40 0.19 ( 0.18, 0.19 ) 0.98 ( 0.96, 1.00 ) 3.25 ( 3.22, 3.29 ) 8.32 ( 8.25, 8.39 ) 7.53 ( 7.50, 7.56 )
50 0.82 ( 0.81, 0.84 ) 3.17 ( 3.14, 3.21 ) 6.45 ( 6.39, 6.51 ) 8.42 ( 8.35, 8.49 ) 7.63 ( 7.60, 7.67 )
60 2.53 ( 2.50, 2.57 ) 6.06 ( 6.00, 6.12 ) 7.90 ( 7.83, 7.97 ) 8.19 ( 8.12, 8.27 ) 7.46 ( 7.42, 7.49 )
70 4.22 ( 4.16, 4.27 ) 6.41 ( 6.34, 6.47 ) - ( - , - ) 6.76 ( 6.68, 6.83 ) 6.32 ( 6.29, 6.35 )
80 3.41 ( 3.36, 3.47 ) - ( - , - ) - ( - , - ) 3.96 ( 3.89, 4.04 ) 4.01 ( 3.97, 4.04 )
Black 0 0.00 ( 0.00, 0.00 ) 0.00 ( 0.00, 0.00 ) 0.01 ( 0.00, 0.01 ) 8.09 ( 7.90, 8.29 ) 7.09 ( 7.01, 7.17 )
10 0.00 ( 0.00, 0.00 ) 0.01 ( 0.00, 0.01 ) 0.04 ( 0.03, 0.05 ) 8.31 ( 8.11, 8.51 ) 7.29 ( 7.20, 7.37 )
20 0.01 ( 0.00, 0.01 ) 0.04 ( 0.03, 0.05 ) 0.38 ( 0.36, 0.41 ) 8.38 ( 8.18, 8.59 ) 7.35 ( 7.26, 7.43 )
30 0.03 ( 0.03, 0.04 ) 0.39 ( 0.36, 0.41 ) 1.76 ( 1.70, 1.83 ) 8.59 ( 8.38, 8.80 ) 7.51 ( 7.43, 7.60 )
40 0.36 ( 0.34, 0.39 ) 1.78 ( 1.72, 1.85 ) 4.49 ( 4.36, 4.61 ) 8.83 ( 8.62, 9.05 ) 7.73 ( 7.64, 7.81 )
50 1.52 ( 1.46, 1.58 ) 4.40 ( 4.28, 4.54 ) 7.41 ( 7.22, 7.60 ) 9.04 ( 8.82, 9.27 ) 7.93 ( 7.84, 8.02 )
60 3.35 ( 3.23, 3.47 ) 6.84 ( 6.64, 7.04 ) 8.46 ( 8.23, 8.69 ) 8.73 ( 8.49, 8.98 ) 7.77 ( 7.67, 7.87 )
70 4.68 ( 4.50, 4.87 ) 6.86 ( 6.61, 7.11 ) - ( - , - ) 7.23 ( 6.97, 7.50 ) 6.58 ( 6.47, 6.70 )
80 3.97 ( 3.72, 4.22 ) - ( - , - ) - ( - , - ) 4.64 ( 4.35, 4.96 ) 4.34 ( 4.22, 4.47 )
Table XV-15 - continued
LUNG AND BRONCHUS CANCER (Invasive)
Risk of Being Diagnosed With Cancer in 10, 20 and 30 Years, Lifetime Risk of Being Diagnosed with Cancer, and
Lifetime Risk of Dying from Cancer Given Cancer Free At Current Age
Males, 2002-2004 By Race/Ethnicity

SEE
R C
ancer Statistics Review
1975-2004N
ational Cancer Institute
Devcan Version 6.2.0, April 2006, National Cancer Institute (http://srab.cancer.gov/devcan/).Source: Incidence data are from the SEER 17 areas (San Francisco, Connecticut, Detroit, Hawaii, Iowa, New Mexico, Seattle, Utah, Atlanta, San
Jose-Monterey, Los Angeles, Alaska Native Registry, Rural Georgia, California excluding SF/SJM/LA, Kentucky, Louisiana and New Jersey).Mortality data are from the NCHS public use data file for the total US.
a Underlying incidence and mortlaity data for American Indian/Alaska Native are based on the CHSDA(Contract Health Service Delivery Area)counties.
b Hispanic is not mutually exclusive from whites, blacks, Asian/Pacific Islanders, and American Indians/Alaska Natives. Underlyingincidence data for Hispanics are based on NHIA and exclude cases from the Alaska Native Registry and Kentucky. Underlying mortalitydata for Hispanics exclude deaths from Minnesota, New Hampshire and North Dakota.
- Statistic could not be calculated.A percent or confidence interval value of 0.00 represents a value that is below 0.005.
Risk of Being Diagnosed with Cancer Risk of Dying from Cancer
Race/ Current +10 yrs +20 yrs +30 yrs Eventually Eventually
Ethnicity Age Percent ( 95% C.I. ) Percent ( 95% C.I. ) Percent ( 95% C.I. ) Percent ( 95% C.I. ) Percent ( 95% C.I. )
Asian/ 0 0.00 ( 0.00, 0.00 ) 0.00 ( 0.00, 0.00 ) 0.00 ( 0.00, 0.01 ) 7.06 ( 6.80, 7.34 ) 5.34 ( 5.14, 5.55 )
Pacific 10 0.00 ( 0.00, 0.00 ) 0.00 ( 0.00, 0.01 ) 0.03 ( 0.02, 0.04 ) 7.13 ( 6.87, 7.41 ) 5.39 ( 5.19, 5.60 )
Islander 20 0.00 ( 0.00, 0.00 ) 0.03 ( 0.02, 0.04 ) 0.17 ( 0.15, 0.19 ) 7.16 ( 6.89, 7.44 ) 5.41 ( 5.21, 5.62 )
30 0.03 ( 0.02, 0.04 ) 0.17 ( 0.15, 0.18 ) 0.70 ( 0.66, 0.75 ) 7.20 ( 6.94, 7.48 ) 5.43 ( 5.23, 5.65 )
40 0.14 ( 0.12, 0.15 ) 0.68 ( 0.64, 0.72 ) 2.14 ( 2.05, 2.24 ) 7.23 ( 6.96, 7.51 ) 5.45 ( 5.25, 5.67 )
50 0.55 ( 0.51, 0.59 ) 2.04 ( 1.95, 2.14 ) 4.69 ( 4.52, 4.86 ) 7.22 ( 6.95, 7.51 ) 5.45 ( 5.25, 5.67 )
60 1.56 ( 1.47, 1.64 ) 4.32 ( 4.16, 4.50 ) 6.42 ( 6.18, 6.66 ) 6.97 ( 6.70, 7.27 ) 5.33 ( 5.12, 5.56 )
70 3.09 ( 2.94, 3.24 ) 5.43 ( 5.19, 5.67 ) - ( - , - ) 6.04 ( 5.76, 6.35 ) 4.82 ( 4.60, 5.07 )
80 3.11 ( 2.90, 3.34 ) - ( - , - ) - ( - , - ) 3.93 ( 3.63, 4.27 ) 3.40 ( 3.15, 3.67 )
American 0 0.00 ( 0.00, 0.04 ) 0.00 ( 0.00, 0.04 ) 0.01 ( 0.00, 0.06 ) 5.01 ( 4.25, 6.10 ) 4.58 ( 4.18, 5.06 )
Indian/ 10 0.00 ( 0.00, 0.02 ) 0.01 ( 0.00, 0.05 ) 0.03 ( 0.01, 0.07 ) 5.11 ( 4.34, 6.23 ) 4.68 ( 4.27, 5.17 )
Alaska 20 0.01 ( 0.00, 0.04 ) 0.03 ( 0.01, 0.07 ) 0.11 ( 0.07, 0.17 ) 5.17 ( 4.39, 6.29 ) 4.73 ( 4.32, 5.23 )
Nativea 30 0.02 ( 0.00, 0.05 ) 0.10 ( 0.06, 0.16 ) 0.71 ( 0.56, 0.89 ) 5.28 ( 4.48, 6.43 ) 4.86 ( 4.43, 5.36 )
40 0.09 ( 0.05, 0.14 ) 0.72 ( 0.56, 0.90 ) 2.07 ( 1.74, 2.45 ) 5.46 ( 4.63, 6.65 ) 5.04 ( 4.60, 5.56 )
50 0.66 ( 0.51, 0.84 ) 2.09 ( 1.74, 2.48 ) 4.19 ( 3.60, 4.85 ) 5.65 ( 4.78, 6.91 ) 5.25 ( 4.79, 5.81 )
60 1.56 ( 1.25, 1.92 ) 3.85 ( 3.25, 4.54 ) 5.18 ( 4.38, 6.11 ) 5.45 ( 4.53, 6.81 ) 5.25 ( 4.74, 5.87 )
70 2.76 ( 2.20, 3.42 ) 4.36 ( 3.52, 5.37 ) - ( - , - ) 4.69 ( 3.69, 6.23 ) 4.57 ( 4.00, 5.28 )
80 2.43 ( 1.65, 3.50 ) - ( - , - ) - ( - , - ) 2.93 ( 1.83, 5.01 ) 3.14 ( 2.46, 4.07 )
Hispanicb 0 0.00 ( 0.00, 0.00 ) 0.00 ( 0.00, 0.00 ) 0.00 ( 0.00, 0.01 ) 5.32 ( 5.11, 5.56 ) 4.29 ( 4.17, 4.41 )
10 0.00 ( 0.00, 0.00 ) 0.00 ( 0.00, 0.01 ) 0.02 ( 0.01, 0.02 ) 5.39 ( 5.17, 5.62 ) 4.34 ( 4.22, 4.47 )
20 0.00 ( 0.00, 0.00 ) 0.01 ( 0.01, 0.02 ) 0.09 ( 0.08, 0.10 ) 5.42 ( 5.20, 5.66 ) 4.37 ( 4.25, 4.49 )
30 0.01 ( 0.01, 0.01 ) 0.09 ( 0.08, 0.10 ) 0.44 ( 0.42, 0.47 ) 5.48 ( 5.26, 5.72 ) 4.42 ( 4.30, 4.55 )
40 0.08 ( 0.07, 0.08 ) 0.44 ( 0.41, 0.47 ) 1.63 ( 1.56, 1.70 ) 5.54 ( 5.32, 5.79 ) 4.47 ( 4.35, 4.60 )
50 0.37 ( 0.35, 0.40 ) 1.60 ( 1.53, 1.68 ) 3.70 ( 3.57, 3.84 ) 5.64 ( 5.41, 5.89 ) 4.55 ( 4.43, 4.69 )
60 1.31 ( 1.24, 1.38 ) 3.55 ( 3.41, 3.69 ) 5.10 ( 4.91, 5.30 ) 5.62 ( 5.38, 5.88 ) 4.53 ( 4.40, 4.67 )
70 2.59 ( 2.46, 2.72 ) 4.38 ( 4.18, 4.59 ) - ( - , - ) 4.98 ( 4.72, 5.27 ) 4.11 ( 3.97, 4.27 )
80 2.54 ( 2.35, 2.75 ) - ( - , - ) - ( - , - ) 3.39 ( 3.09, 3.74 ) 2.99 ( 2.81, 3.18 )
Table XV-15 - continued
LUNG AND BRONCHUS CANCER (Invasive)
Risk of Being Diagnosed With Cancer in 10, 20 and 30 Years, Lifetime Risk of Being Diagnosed with Cancer, and
Lifetime Risk of Dying from Cancer Given Cancer Free At Current Age
Males, 2002-2004 By Race/Ethnicity

SEE
R C
ancer Statistics Review
1975-2004N
ational Cancer Institute
Devcan Version 6.2.0, April 2006, National Cancer Institute (http://srab.cancer.gov/devcan/).Source: Incidence data are from the SEER 17 areas (San Francisco, Connecticut, Detroit, Hawaii, Iowa, New Mexico, Seattle, Utah, Atlanta, San
Jose-Monterey, Los Angeles, Alaska Native Registry, Rural Georgia, California excluding SF/SJM/LA, Kentucky, Louisiana and New Jersey).Mortality data are from the NCHS public use data file for the total US.
- Statistic could not be calculated.A percent or confidence interval value of 0.00 represents a value that is below 0.005.
Risk of Being Diagnosed with Cancer Risk of Dying from Cancer
Race/ Current +10 yrs +20 yrs +30 yrs Eventually Eventually
Ethnicity Age Percent ( 95% C.I. ) Percent ( 95% C.I. ) Percent ( 95% C.I. ) Percent ( 95% C.I. ) Percent ( 95% C.I. )
All Races 0 0.00 ( 0.00, 0.00 ) 0.00 ( 0.00, 0.00 ) 0.01 ( 0.00, 0.01 ) 6.18 ( 6.13, 6.23 ) 5.00 ( 4.98, 5.02 )
10 0.00 ( 0.00, 0.00 ) 0.01 ( 0.00, 0.01 ) 0.03 ( 0.03, 0.04 ) 6.25 ( 6.20, 6.30 ) 5.06 ( 5.04, 5.09 )
20 0.00 ( 0.00, 0.01 ) 0.03 ( 0.03, 0.04 ) 0.21 ( 0.21, 0.22 ) 6.27 ( 6.22, 6.32 ) 5.08 ( 5.06, 5.10 )
30 0.03 ( 0.03, 0.03 ) 0.21 ( 0.20, 0.21 ) 0.85 ( 0.83, 0.86 ) 6.29 ( 6.24, 6.35 ) 5.10 ( 5.08, 5.13 )
40 0.18 ( 0.18, 0.19 ) 0.82 ( 0.81, 0.84 ) 2.51 ( 2.48, 2.54 ) 6.32 ( 6.27, 6.37 ) 5.13 ( 5.11, 5.16 )
50 0.66 ( 0.65, 0.67 ) 2.38 ( 2.35, 2.41 ) 4.73 ( 4.68, 4.77 ) 6.27 ( 6.22, 6.33 ) 5.12 ( 5.09, 5.14 )
60 1.81 ( 1.78, 1.83 ) 4.27 ( 4.23, 4.31 ) 5.64 ( 5.59, 5.69 ) 5.90 ( 5.84, 5.95 ) 4.86 ( 4.84, 4.88 )
70 2.78 ( 2.74, 2.81 ) 4.32 ( 4.28, 4.37 ) - ( - , - ) 4.61 ( 4.56, 4.66 ) 3.92 ( 3.90, 3.94 )
80 2.08 ( 2.05, 2.12 ) - ( - , - ) - ( - , - ) 2.47 ( 2.43, 2.51 ) 2.29 ( 2.27, 2.31 )
White 0 0.00 ( 0.00, 0.00 ) 0.00 ( 0.00, 0.00 ) 0.01 ( 0.00, 0.01 ) 6.49 ( 6.43, 6.54 ) 5.20 ( 5.17, 5.22 )
10 0.00 ( 0.00, 0.00 ) 0.01 ( 0.00, 0.01 ) 0.03 ( 0.03, 0.04 ) 6.55 ( 6.49, 6.61 ) 5.25 ( 5.23, 5.28 )
20 0.00 ( 0.00, 0.01 ) 0.03 ( 0.03, 0.04 ) 0.21 ( 0.20, 0.22 ) 6.56 ( 6.51, 6.62 ) 5.27 ( 5.24, 5.29 )
30 0.03 ( 0.03, 0.03 ) 0.21 ( 0.20, 0.21 ) 0.86 ( 0.85, 0.88 ) 6.59 ( 6.53, 6.65 ) 5.29 ( 5.27, 5.31 )
40 0.18 ( 0.17, 0.19 ) 0.84 ( 0.83, 0.86 ) 2.63 ( 2.60, 2.67 ) 6.61 ( 6.56, 6.67 ) 5.32 ( 5.29, 5.34 )
50 0.67 ( 0.66, 0.69 ) 2.50 ( 2.47, 2.54 ) 4.99 ( 4.94, 5.04 ) 6.56 ( 6.50, 6.62 ) 5.29 ( 5.27, 5.32 )
60 1.92 ( 1.89, 1.94 ) 4.52 ( 4.47, 4.57 ) 5.92 ( 5.86, 5.98 ) 6.17 ( 6.11, 6.23 ) 5.02 ( 5.00, 5.05 )
70 2.93 ( 2.89, 2.97 ) 4.51 ( 4.46, 4.56 ) - ( - , - ) 4.79 ( 4.73, 4.84 ) 4.03 ( 4.01, 4.05 )
80 2.13 ( 2.10, 2.17 ) - ( - , - ) - ( - , - ) 2.51 ( 2.47, 2.55 ) 2.33 ( 2.31, 2.35 )
Black 0 0.00 ( 0.00, 0.00 ) 0.00 ( 0.00, 0.00 ) 0.01 ( 0.00, 0.01 ) 5.35 ( 5.20, 5.50 ) 4.12 ( 4.06, 4.18 )
10 0.00 ( 0.00, 0.00 ) 0.00 ( 0.00, 0.01 ) 0.04 ( 0.03, 0.05 ) 5.47 ( 5.32, 5.62 ) 4.21 ( 4.15, 4.27 )
20 0.00 ( 0.00, 0.01 ) 0.04 ( 0.03, 0.04 ) 0.29 ( 0.27, 0.31 ) 5.48 ( 5.33, 5.64 ) 4.23 ( 4.16, 4.29 )
30 0.03 ( 0.03, 0.04 ) 0.29 ( 0.27, 0.31 ) 1.06 ( 1.01, 1.11 ) 5.52 ( 5.37, 5.68 ) 4.26 ( 4.20, 4.32 )
40 0.26 ( 0.24, 0.28 ) 1.05 ( 1.00, 1.09 ) 2.65 ( 2.56, 2.74 ) 5.58 ( 5.43, 5.74 ) 4.31 ( 4.25, 4.38 )
50 0.82 ( 0.78, 0.86 ) 2.49 ( 2.40, 2.59 ) 4.41 ( 4.28, 4.55 ) 5.55 ( 5.39, 5.71 ) 4.31 ( 4.25, 4.37 )
60 1.83 ( 1.75, 1.91 ) 3.93 ( 3.79, 4.06 ) 4.96 ( 4.81, 5.12 ) 5.17 ( 5.01, 5.34 ) 4.07 ( 4.01, 4.14 )
70 2.51 ( 2.40, 2.63 ) 3.76 ( 3.61, 3.91 ) - ( - , - ) 4.00 ( 3.84, 4.17 ) 3.30 ( 3.23, 3.37 )
80 1.85 ( 1.72, 1.98 ) - ( - , - ) - ( - , - ) 2.22 ( 2.07, 2.37 ) 2.03 ( 1.96, 2.09 )
Table XV-15 - continued
LUNG AND BRONCHUS CANCER (Invasive)
Risk of Being Diagnosed With Cancer in 10, 20 and 30 Years, Lifetime Risk of Being Diagnosed with Cancer, and
Lifetime Risk of Dying from Cancer Given Cancer Free At Current Age
Females, 2002-2004 By Race/Ethnicity

SEE
R C
ancer Statistics Review
1975-2004N
ational Cancer Institute
Devcan Version 6.2.0, April 2006, National Cancer Institute (http://srab.cancer.gov/devcan/).Source: Incidence data are from the SEER 17 areas (San Francisco, Connecticut, Detroit, Hawaii, Iowa, New Mexico, Seattle, Utah, Atlanta, San
Jose-Monterey, Los Angeles, Alaska Native Registry, Rural Georgia, California excluding SF/SJM/LA, Kentucky, Louisiana and New Jersey).Mortality data are from the NCHS public use data file for the total US.
a Underlying incidence and mortlaity data for American Indian/Alaska Native are based on the CHSDA(Contract Health Service Delivery Area)counties.
b Hispanic is not mutually exclusive from whites, blacks, Asian/Pacific Islanders, and American Indians/Alaska Natives. Underlyingincidence data for Hispanics are based on NHIA and exclude cases from the Alaska Native Registry and Kentucky. Underlying mortalitydata for Hispanics exclude deaths from Minnesota, New Hampshire and North Dakota.
- Statistic could not be calculated.A percent or confidence interval value of 0.00 represents a value that is below 0.005.
Risk of Being Diagnosed with Cancer Risk of Dying from Cancer
Race/ Current +10 yrs +20 yrs +30 yrs Eventually Eventually
Ethnicity Age Percent ( 95% C.I. ) Percent ( 95% C.I. ) Percent ( 95% C.I. ) Percent ( 95% C.I. ) Percent ( 95% C.I. )
Asian/ 0 0.00 ( 0.00, 0.00 ) 0.00 ( 0.00, 0.01 ) 0.00 ( 0.00, 0.01 ) 4.26 ( 4.05, 4.48 ) 3.10 ( 2.94, 3.27 )
Pacific 10 0.00 ( 0.00, 0.00 ) 0.00 ( 0.00, 0.01 ) 0.03 ( 0.02, 0.04 ) 4.29 ( 4.09, 4.52 ) 3.12 ( 2.96, 3.30 )
Islander 20 0.00 ( 0.00, 0.01 ) 0.03 ( 0.02, 0.04 ) 0.13 ( 0.11, 0.15 ) 4.30 ( 4.09, 4.53 ) 3.13 ( 2.97, 3.30 )
30 0.03 ( 0.02, 0.03 ) 0.13 ( 0.11, 0.14 ) 0.46 ( 0.43, 0.50 ) 4.31 ( 4.10, 4.54 ) 3.13 ( 2.97, 3.31 )
40 0.10 ( 0.09, 0.11 ) 0.44 ( 0.40, 0.47 ) 1.24 ( 1.17, 1.31 ) 4.30 ( 4.09, 4.53 ) 3.13 ( 2.97, 3.31 )
50 0.34 ( 0.31, 0.37 ) 1.15 ( 1.09, 1.22 ) 2.46 ( 2.35, 2.57 ) 4.25 ( 4.04, 4.48 ) 3.10 ( 2.94, 3.28 )
60 0.83 ( 0.78, 0.89 ) 2.17 ( 2.07, 2.28 ) 3.45 ( 3.30, 3.62 ) 4.01 ( 3.80, 4.25 ) 2.99 ( 2.82, 3.17 )
70 1.43 ( 1.35, 1.52 ) 2.80 ( 2.65, 2.96 ) - ( - , - ) 3.40 ( 3.18, 3.64 ) 2.65 ( 2.48, 2.84 )
80 1.64 ( 1.51, 1.78 ) - ( - , - ) - ( - , - ) 2.35 ( 2.13, 2.61 ) 1.94 ( 1.76, 2.15 )
American 0 0.00 ( 0.00, 0.04 ) 0.00 ( 0.00, 0.04 ) 0.00 ( 0.00, 0.04 ) 4.37 ( 3.75, 5.23 ) 3.75 ( 3.42, 4.14 )
Indian/ 10 0.00 ( 0.00, 0.02 ) 0.00 ( 0.00, 0.03 ) 0.01 ( 0.00, 0.04 ) 4.44 ( 3.81, 5.31 ) 3.81 ( 3.48, 4.20 )
Alaska 20 0.00 ( 0.00, 0.03 ) 0.01 ( 0.00, 0.04 ) 0.09 ( 0.05, 0.15 ) 4.46 ( 3.83, 5.33 ) 3.83 ( 3.50, 4.23 )
Nativea 30 0.01 ( 0.00, 0.04 ) 0.09 ( 0.05, 0.15 ) 0.52 ( 0.40, 0.67 ) 4.50 ( 3.86, 5.38 ) 3.87 ( 3.54, 4.27 )
40 0.08 ( 0.04, 0.14 ) 0.52 ( 0.40, 0.67 ) 1.86 ( 1.55, 2.21 ) 4.57 ( 3.92, 5.47 ) 3.94 ( 3.60, 4.34 )
50 0.45 ( 0.34, 0.60 ) 1.83 ( 1.52, 2.19 ) 3.61 ( 3.09, 4.20 ) 4.62 ( 3.96, 5.55 ) 4.01 ( 3.65, 4.43 )
60 1.46 ( 1.17, 1.79 ) 3.35 ( 2.83, 3.95 ) 4.33 ( 3.67, 5.09 ) 4.42 ( 3.74, 5.38 ) 3.94 ( 3.57, 4.38 )
70 2.18 ( 1.73, 2.72 ) 3.31 ( 2.66, 4.08 ) - ( - , - ) 3.41 ( 2.74, 4.42 ) 3.10 ( 2.73, 3.56 )
80 1.51 ( 1.01, 2.19 ) - ( - , - ) - ( - , - ) 1.65 ( 1.09, 2.74 ) 1.76 ( 1.40, 2.26 )
Hispanicb 0 0.00 ( 0.00, 0.00 ) 0.00 ( 0.00, 0.00 ) 0.01 ( 0.00, 0.01 ) 3.61 ( 3.45, 3.79 ) 2.25 ( 2.17, 2.33 )
10 0.00 ( 0.00, 0.00 ) 0.01 ( 0.00, 0.01 ) 0.02 ( 0.01, 0.02 ) 3.65 ( 3.49, 3.83 ) 2.27 ( 2.19, 2.35 )
20 0.00 ( 0.00, 0.01 ) 0.02 ( 0.01, 0.02 ) 0.09 ( 0.08, 0.10 ) 3.66 ( 3.49, 3.83 ) 2.27 ( 2.19, 2.36 )
30 0.01 ( 0.01, 0.02 ) 0.09 ( 0.08, 0.10 ) 0.37 ( 0.34, 0.39 ) 3.67 ( 3.50, 3.84 ) 2.28 ( 2.20, 2.36 )
40 0.08 ( 0.07, 0.08 ) 0.36 ( 0.33, 0.38 ) 1.11 ( 1.05, 1.16 ) 3.67 ( 3.51, 3.85 ) 2.29 ( 2.21, 2.37 )
50 0.28 ( 0.26, 0.31 ) 1.05 ( 0.99, 1.11 ) 2.30 ( 2.20, 2.40 ) 3.65 ( 3.49, 3.83 ) 2.28 ( 2.20, 2.37 )
60 0.79 ( 0.74, 0.84 ) 2.09 ( 1.99, 2.19 ) 3.10 ( 2.96, 3.24 ) 3.49 ( 3.32, 3.68 ) 2.23 ( 2.14, 2.31 )
70 1.42 ( 1.34, 1.51 ) 2.53 ( 2.40, 2.67 ) - ( - , - ) 2.96 ( 2.79, 3.15 ) 2.00 ( 1.92, 2.09 )
80 1.40 ( 1.29, 1.53 ) - ( - , - ) - ( - , - ) 1.95 ( 1.77, 2.16 ) 1.47 ( 1.38, 1.57 )
Table XV-15 - continued
LUNG AND BRONCHUS CANCER (Invasive)
Risk of Being Diagnosed With Cancer in 10, 20 and 30 Years, Lifetime Risk of Being Diagnosed with Cancer, and
Lifetime Risk of Dying from Cancer Given Cancer Free At Current Age
Females, 2002-2004 By Race/Ethnicity
SEER Cancer Statistics Review 1975-2004 National Cancer Institute
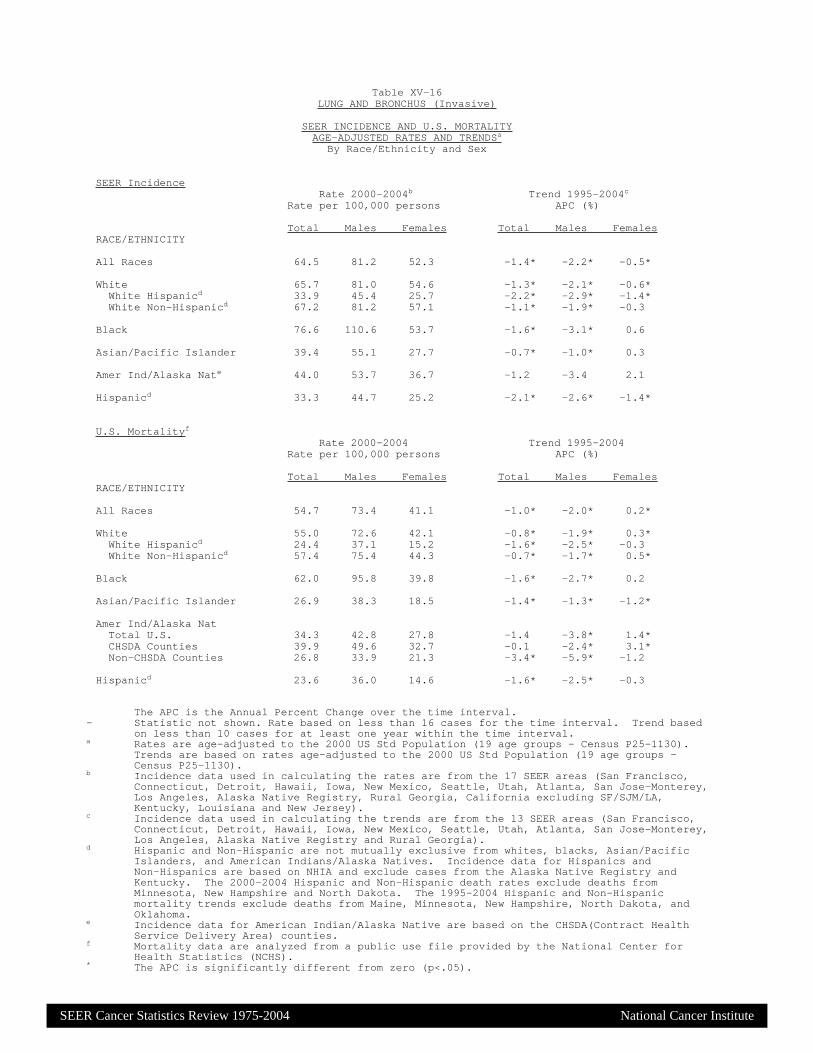
The APC is the Annual Percent Change over the time interval.- Statistic not shown. Rate based on less than 16 cases for the time interval. Trend based
on less than 10 cases for at least one year within the time interval.a Rates are age-adjusted to the 2000 US Std Population (19 age groups - Census P25-1130).
Trends are based on rates age-adjusted to the 2000 US Std Population (19 age groups -Census P25-1130).
b Incidence data used in calculating the rates are from the 17 SEER areas (San Francisco,Connecticut, Detroit, Hawaii, Iowa, New Mexico, Seattle, Utah, Atlanta, San Jose-Monterey,Los Angeles, Alaska Native Registry, Rural Georgia, California excluding SF/SJM/LA,Kentucky, Louisiana and New Jersey).
c Incidence data used in calculating the trends are from the 13 SEER areas (San Francisco,Connecticut, Detroit, Hawaii, Iowa, New Mexico, Seattle, Utah, Atlanta, San Jose-Monterey,Los Angeles, Alaska Native Registry and Rural Georgia).
d Hispanic and Non-Hispanic are not mutually exclusive from whites, blacks, Asian/PacificIslanders, and American Indians/Alaska Natives. Incidence data for Hispanics andNon-Hispanics are based on NHIA and exclude cases from the Alaska Native Registry andKentucky. The 2000-2004 Hispanic and Non-Hispanic death rates exclude deaths fromMinnesota, New Hampshire and North Dakota. The 1995-2004 Hispanic and Non-Hispanicmortality trends exclude deaths from Maine, Minnesota, New Hampshire, North Dakota, andOklahoma.
e Incidence data for American Indian/Alaska Native are based on the CHSDA(Contract HealthService Delivery Area) counties.
f Mortality data are analyzed from a public use file provided by the National Center forHealth Statistics (NCHS).
* The APC is significantly different from zero (p<.05).
SEER IncidenceRate 2000-2004b Trend 1995-2004c
Rate per 100,000 persons APC (%)
Total Males Females Total Males FemalesRACE/ETHNICITY
All Races 64.5 81.2 52.3 -1.4* -2.2* -0.5*
White 65.7 81.0 54.6 -1.3* -2.1* -0.6*White Hispanicd 33.9 45.4 25.7 -2.2* -2.9* -1.4*White Non-Hispanicd 67.2 81.2 57.1 -1.1* -1.9* -0.3
Black 76.6 110.6 53.7 -1.6* -3.1* 0.6
Asian/Pacific Islander 39.4 55.1 27.7 -0.7* -1.0* 0.3
Amer Ind/Alaska Nate 44.0 53.7 36.7 -1.2 -3.4 2.1
Hispanicd 33.3 44.7 25.2 -2.1* -2.6* -1.4*
U.S. Mortalityf
Rate 2000-2004 Trend 1995-2004Rate per 100,000 persons APC (%)
Total Males Females Total Males FemalesRACE/ETHNICITY
All Races 54.7 73.4 41.1 -1.0* -2.0* 0.2*
White 55.0 72.6 42.1 -0.8* -1.9* 0.3*White Hispanicd 24.4 37.1 15.2 -1.6* -2.5* -0.3White Non-Hispanicd 57.4 75.4 44.3 -0.7* -1.7* 0.5*
Black 62.0 95.8 39.8 -1.6* -2.7* 0.2
Asian/Pacific Islander 26.9 38.3 18.5 -1.4* -1.3* -1.2*
Amer Ind/Alaska NatTotal U.S. 34.3 42.8 27.8 -1.4 -3.8* 1.4*CHSDA Counties 39.9 49.6 32.7 -0.1 -2.4* 3.1*Non-CHSDA Counties 26.8 33.9 21.3 -3.4* -5.9* -1.2
Hispanicd 23.6 36.0 14.6 -1.6* -2.5* -0.3
Table XV-16LUNG AND BRONCHUS (Invasive)
SEER INCIDENCE AND U.S. MORTALITYAGE-ADJUSTED RATES AND TRENDSa
By Race/Ethnicity and Sex

SEE
R C
ancer Statistics Review
1975-2004N
ational Cancer Institute
a Rates are per 100,000 and are age-adjusted to the 2000 US Std Population (19 age groups - Census P25-1130)b The SEER 9 areas are San Francisco, Connecticut, Detroit, Hawaii, Iowa, New Mexico, Seattle, Utah and Atlanta.
The SEER 11 areas comprise the SEER 9 areas plus San Jose-Monterey and Los Angeles.The SEER 13 areas comprise the SEER 11 areas plus the Alaska Native Registry and Rural Georgia.The SEER 17 areas comprise the SEER 13 areas plus California excluding SF/SJM/LA, Kentucky, Louisiana and New Jersey
- Statistic not shown. Rate based on less than 16 cases for the time interval.
All Races Whites BlacksTotal Males Females Total Males Females Total Males Females
SEER INCIDENCE RATESa, 2000-2004REGISTRY
Atlanta & Rural Georgia 64.4 87.4 49.0 64.6 83.2 51.9 66.9 105.1 44.2Atlanta 64.0 86.1 49.3 64.0 82.2 51.8 66.9 103.6 45.4Rural Georgia 73.9 111.4 45.0 75.8 103.6 52.4 69.1 128.1 31.4
California 56.8 69.0 47.9 58.4 69.1 50.6 71.7 97.4 53.4Greater Bay Area 53.5 64.4 45.8 54.9 62.9 49.5 77.6 99.4 62.0San Francisco-Oakland 56.0 67.6 47.6 56.7 64.6 51.2 80.4 103.2 64.2San Jose-Monterey 48.7 58.2 42.2 51.7 59.8 46.4 61.2 81.2 45.1
Los Angeles 49.9 62.8 40.4 49.5 59.8 41.9 70.6 99.3 51.1Greater California 61.3 73.5 52.3 63.1 74.6 54.6 69.3 94.2 50.6
Connecticut 67.9 83.0 57.3 68.6 83.1 58.5 65.0 91.2 48.0Detroit 80.5 102.3 65.5 79.3 97.8 66.8 89.3 126.2 64.4Hawaii 50.9 67.8 37.6 63.0 75.3 52.1 35.8 - -Iowa 67.0 89.5 50.8 66.7 89.0 50.7 95.1 133.8 63.9Kentucky 101.1 137.9 74.9 101.0 137.7 74.6 108.5 148.9 81.4Louisiana 80.3 112.3 57.4 80.2 107.3 60.5 81.6 130.4 48.9New Jersey 66.4 82.4 55.4 67.3 81.9 57.3 70.9 100.4 51.8New Mexico 47.2 59.5 37.7 49.5 61.7 40.0 53.2 83.3 32.5Seattle-Puget Sound 70.1 82.6 61.0 71.5 82.8 63.5 83.6 114.7 57.7Utah 29.6 40.3 20.9 29.6 40.4 20.9 44.9 - -
9 SEER Areasb 62.9 79.0 51.3 63.7 78.2 53.3 78.1 110.5 56.411 SEER Areasb 59.2 74.2 48.3 60.1 73.4 50.5 75.8 107.0 54.813 SEER Areasb 59.3 74.4 48.3 60.1 73.5 50.5 75.7 107.2 54.417 SEER Areasb 64.5 81.2 52.3 65.7 81.0 54.6 76.6 110.6 53.7
Table XV-17LUNG AND BRONCHUS CANCER (Invasive)
AGE-ADJUSTED SEER INCIDENCE RATESa
By Registry, Race and Sex

SEE
R C
ancer Statistics Review
1975-2004N
ational Cancer Institute
a NCHS public use data file for the total US. Rates are per 100,000 and are age-adjusted to the 2000 US Std Population(19 age groups - Census P25-1130).
b The SEER 9 areas are San Francisco, Connecticut, Detroit, Hawaii, Iowa, New Mexico, Seattle, Utah and Atlanta.The SEER 11 areas comprise the SEER 9 areas plus San Jose-Monterey and Los Angeles.The SEER 13 areas comprise the SEER 11 areas plus the Alaska Native Registry and Rural Georgia.The SEER 17 areas comprise the SEER 13 areas plus California excluding SF/SJM/LA, Kentucky, Louisiana and New Jersey
- Statistic not shown. Rate based on less than 16 cases for the time interval.
All Races Whites BlacksTotal Males Females Total Males Females Total Males Females
SEER DEATH RATESa, 2000-2004REGISTRY
Atlanta & Rural Georgia 51.5 72.6 37.7 51.6 69.5 39.7 53.5 87.1 33.8Atlanta 50.8 71.0 37.8 50.9 68.1 39.7 53.2 85.0 34.7Rural Georgia 63.1 99.8 36.2 64.7 94.2 42.0 60.4 115.1 26.0
California 45.1 56.4 36.8 46.6 57.0 39.1 59.2 83.2 42.5Greater Bay Area 42.1 51.7 35.3 43.7 51.2 38.6 65.9 89.9 48.8San Francisco-Oakland 44.5 55.0 36.9 46.0 53.8 40.6 67.4 91.6 50.4San Jose-Monterey 37.5 45.3 32.1 39.6 46.6 35.1 57.9 82.7 36.0
Los Angeles 39.6 51.9 30.7 39.4 50.0 31.6 57.7 83.1 41.0Greater California 48.8 60.3 40.4 50.4 61.4 42.2 56.6 79.4 39.7
Connecticut 49.5 63.1 40.1 49.9 63.1 40.9 50.3 73.2 36.0Detroit 58.3 76.1 46.2 56.9 72.7 46.4 66.4 94.1 48.0Hawaii 35.6 49.5 24.5 44.1 54.3 34.7 26.9 - -Iowa 52.3 73.1 37.4 52.1 72.8 37.4 84.1 112.0 61.5Kentucky 79.4 113.2 55.5 79.4 113.0 55.5 86.3 125.5 60.6Louisiana 67.2 97.1 46.0 65.5 90.4 47.7 73.1 120.8 41.6New Jersey 51.2 66.5 40.7 51.6 65.9 41.9 58.8 87.3 40.9New Mexico 38.3 50.1 29.4 40.0 51.6 31.3 46.9 81.1 22.5Seattle-Puget Sound 54.2 66.1 45.6 55.8 66.9 47.9 63.6 93.2 40.1Utah 25.0 34.9 17.0 25.0 35.0 16.9 - - -
9 SEER Areasb 48.0 62.5 37.7 48.9 62.3 39.4 60.9 88.0 42.911 SEER Areasb 45.6 59.2 35.8 46.4 58.9 37.5 60.0 86.5 42.313 SEER Areasb 45.7 59.4 35.9 46.5 59.1 37.6 59.9 86.9 42.017 SEER Areasb 50.5 65.9 39.3 51.4 65.8 41.1 62.8 93.7 42.3
Total U.S. 54.7 73.4 41.1 55.0 72.6 42.1 62.0 95.8 39.8
Table XV-18LUNG AND BRONCHUS CANCER (Invasive)
AGE-ADJUSTED SEER DEATH RATESa
By Registry, Race and Sex

SEE
R C
ancer Statistics Review
1975-2004N
ational Cancer Institute
a NCHS public use data file. Rates are per 100,000 and are age-adjusted to the 2000 US Std Population (19 age groups - CensusP25-1130).
b Difference between state rate and total U.S. rate is statistically significant (p<=.0002).c Absolute percent difference between state rate and total U.S. rate is 5% or more.SE Standard error of the rate.PD Percent difference between state rate and total U.S. rate.
State Rate SE Rank PDTOTAL U.S. 54.7 0.06High Five States
Kentucky 79.4b 0.62 (01) 45.2c
West Virginia 69.5b 0.80 (02) 27.1c
Arkansas 68.9b 0.68 (03) 26.0c
Tennessee 68.6b 0.48 (04) 25.4c
Mississippi 68.5b 0.70 (05) 25.2c
Low Five StatesIdaho 44.1b 0.85 (47) -19.4c
Colorado 41.4b 0.48 (48) -24.3c
New Mexico 38.3b 0.66 (49) -30.0c
Hawaii 35.6b 0.73 (50) -34.9c
Utah 25.0b 0.55 (51) -54.3c
State Rate SE Rank PD State Rate SE Rank PD
Alabama 63.6b 0.52 (09) 16.3c Montana 52.9 1.03 (33) -3.3Alaska 55.9 1.85 (24) 2.2 Nebraska 49.0b 0.74 (38) -10.4c
Arizona 47.2b 0.42 (42) -13.7c Nevada 61.4b 0.80 (13) 12.2c
Arkansas 68.9b 0.68 (03) 26.0c New Hampshire 54.1 0.93 (31) -1.1California 45.1b 0.17 (46) -17.6c New Jersey 51.2b 0.34 (35) -6.4c
Colorado 41.4b 0.48 (48) -24.3c New Mexico 38.3b 0.66 (49) -30.0c
Connecticut 49.5b 0.51 (37) -9.5c New York 47.8b 0.22 (41) -12.6c
Delaware 61.5b 1.21 (12) 12.4c North Carolina 60.2b 0.39 (17) 10.1c
District of Columbia 55.0 1.41 (26) 0.5 North Dakota 45.5b 1.13 (45) -16.8c
Florida 55.2 0.23 (25) 0.9 Ohio 60.9b 0.32 (14) 11.3c
Georgia 60.3b 0.42 (16) 10.2c Oklahoma 64.0b 0.59 (08) 17.0c
Hawaii 35.6b 0.73 (50) -34.9c Oregon 56.2 0.56 (22) 2.7Idaho 44.1b 0.85 (47) -19.4c Pennsylvania 54.2 0.27 (29) -0.9Illinois 56.1b 0.30 (23) 2.6 Rhode Island 56.4 0.98 (21) 3.1Indiana 64.5b 0.46 (07) 17.9c South Carolina 60.8b 0.54 (15) 11.2c
Iowa 52.3b 0.56 (34) -4.4 South Dakota 48.3b 1.08 (40) -11.7c
Kansas 54.1 0.62 (32) -1.1 Tennessee 68.6b 0.48 (04) 25.4c
Kentucky 79.4b 0.62 (01) 45.2c Texas 54.2 0.25 (30) -0.9Louisiana 67.2b 0.56 (06) 22.9c Utah 25.0b 0.55 (51) -54.3c
Maine 61.5b 0.91 (11) 12.4c Vermont 50.4 1.25 (36) -7.9c
Maryland 56.9b 0.47 (19) 4.0 Virginia 57.2b 0.41 (18) 4.6Massachusetts 54.4 0.40 (28) -0.5 Washington 55.0 0.44 (27) 0.5Michigan 56.9b 0.34 (20) 4.0 West Virginia 69.5b 0.80 (02) 27.1c
Minnesota 46.9b 0.44 (44) -14.3c Wisconsin 49.0b 0.42 (39) -10.4c
Mississippi 68.5b 0.70 (05) 25.2c Wyoming 47.2b 1.40 (43) -13.7c
Missouri 63.3b 0.46 (10) 15.7c
Table XV-19LUNG AND BRONCHUS CANCER (Invasive)
AVERAGE ANNUAL AGE-ADJUSTED CANCER DEATHa RATES BY STATE, ALL RACES, 2000-2004
Males and Females
SEE
R C
ancer Statistics Review
1975-2004N
ational Cancer Institute
a NCHS public use data file. Rates are per 100,000 and are age-adjusted to the 2000 US Std Population (19 age groups - CensusP25-1130).
b Difference between state rate and total U.S. rate is statistically significant (p<=.0002).c Absolute percent difference between state rate and total U.S. rate is 5% or more.SE Standard error of the rate.PD Percent difference between state rate and total U.S. rate.
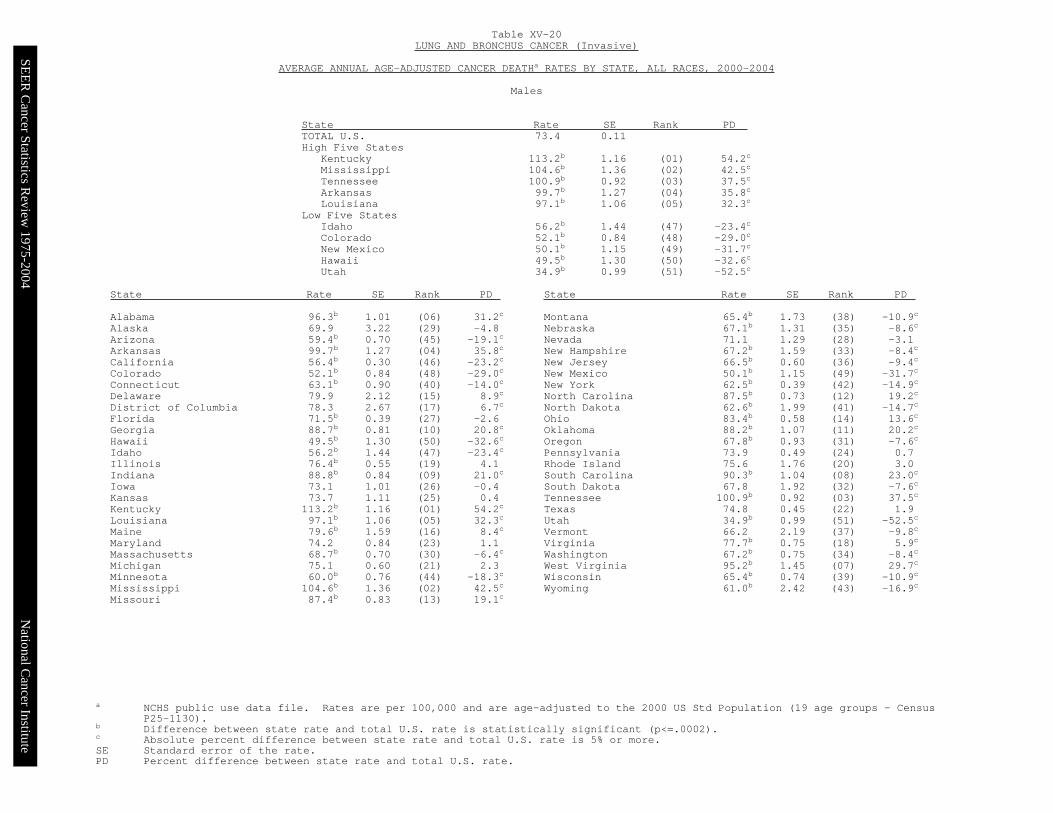
State Rate SE Rank PDTOTAL U.S. 73.4 0.11High Five States
Kentucky 113.2b 1.16 (01) 54.2c
Mississippi 104.6b 1.36 (02) 42.5c
Tennessee 100.9b 0.92 (03) 37.5c
Arkansas 99.7b 1.27 (04) 35.8c
Louisiana 97.1b 1.06 (05) 32.3c
Low Five StatesIdaho 56.2b 1.44 (47) -23.4c
Colorado 52.1b 0.84 (48) -29.0c
New Mexico 50.1b 1.15 (49) -31.7c
Hawaii 49.5b 1.30 (50) -32.6c
Utah 34.9b 0.99 (51) -52.5c
State Rate SE Rank PD State Rate SE Rank PD
Alabama 96.3b 1.01 (06) 31.2c Montana 65.4b 1.73 (38) -10.9c
Alaska 69.9 3.22 (29) -4.8 Nebraska 67.1b 1.31 (35) -8.6c
Arizona 59.4b 0.70 (45) -19.1c Nevada 71.1 1.29 (28) -3.1Arkansas 99.7b 1.27 (04) 35.8c New Hampshire 67.2b 1.59 (33) -8.4c
California 56.4b 0.30 (46) -23.2c New Jersey 66.5b 0.60 (36) -9.4c
Colorado 52.1b 0.84 (48) -29.0c New Mexico 50.1b 1.15 (49) -31.7c
Connecticut 63.1b 0.90 (40) -14.0c New York 62.5b 0.39 (42) -14.9c
Delaware 79.9 2.12 (15) 8.9c North Carolina 87.5b 0.73 (12) 19.2c
District of Columbia 78.3 2.67 (17) 6.7c North Dakota 62.6b 1.99 (41) -14.7c
Florida 71.5b 0.39 (27) -2.6 Ohio 83.4b 0.58 (14) 13.6c
Georgia 88.7b 0.81 (10) 20.8c Oklahoma 88.2b 1.07 (11) 20.2c
Hawaii 49.5b 1.30 (50) -32.6c Oregon 67.8b 0.93 (31) -7.6c
Idaho 56.2b 1.44 (47) -23.4c Pennsylvania 73.9 0.49 (24) 0.7Illinois 76.4b 0.55 (19) 4.1 Rhode Island 75.6 1.76 (20) 3.0Indiana 88.8b 0.84 (09) 21.0c South Carolina 90.3b 1.04 (08) 23.0c
Iowa 73.1 1.01 (26) -0.4 South Dakota 67.8 1.92 (32) -7.6c
Kansas 73.7 1.11 (25) 0.4 Tennessee 100.9b 0.92 (03) 37.5c
Kentucky 113.2b 1.16 (01) 54.2c Texas 74.8 0.45 (22) 1.9Louisiana 97.1b 1.06 (05) 32.3c Utah 34.9b 0.99 (51) -52.5c
Maine 79.6b 1.59 (16) 8.4c Vermont 66.2 2.19 (37) -9.8c
Maryland 74.2 0.84 (23) 1.1 Virginia 77.7b 0.75 (18) 5.9c
Massachusetts 68.7b 0.70 (30) -6.4c Washington 67.2b 0.75 (34) -8.4c
Michigan 75.1 0.60 (21) 2.3 West Virginia 95.2b 1.45 (07) 29.7c
Minnesota 60.0b 0.76 (44) -18.3c Wisconsin 65.4b 0.74 (39) -10.9c
Mississippi 104.6b 1.36 (02) 42.5c Wyoming 61.0b 2.42 (43) -16.9c
Missouri 87.4b 0.83 (13) 19.1c
Table XV-20LUNG AND BRONCHUS CANCER (Invasive)
AVERAGE ANNUAL AGE-ADJUSTED CANCER DEATHa RATES BY STATE, ALL RACES, 2000-2004
Males

SEE
R C
ancer Statistics Review
1975-2004N
ational Cancer Institute
a NCHS public use data file. Rates are per 100,000 and are age-adjusted to the 2000 US Std Population (19 age groups - CensusP25-1130).
b Difference between state rate and total U.S. rate is statistically significant (p<=.0002).c Absolute percent difference between state rate and total U.S. rate is 5% or more.SE Standard error of the rate.PD Percent difference between state rate and total U.S. rate.
State Rate SE Rank PDTOTAL U.S. 41.1 0.07High Five States
Kentucky 55.5b 0.69 (01) 35.0c
Nevada 53.4b 1.01 (02) 29.9c
West Virginia 51.0b 0.91 (03) 24.1c
Maine 48.5b 1.08 (04) 18.0c
Oregon 47.7b 0.70 (05) 16.1c
Low Five StatesSouth Dakota 33.7b 1.23 (47) -18.0c
North Dakota 32.7b 1.31 (48) -20.4c
New Mexico 29.4b 0.77 (49) -28.5c
Hawaii 24.5b 0.82 (50) -40.4c
Utah 17.0b 0.62 (51) -58.6c
State Rate SE Rank PD State Rate SE Rank PD
Alabama 40.9 0.55 (27) -0.5 Montana 43.4 1.27 (20) 5.6c
Alaska 45.0 2.23 (14) 9.5c Nebraska 35.6b 0.85 (44) -13.4c
Arizona 37.7b 0.50 (38) -8.3c Nevada 53.4b 1.01 (02) 29.9c
Arkansas 46.5b 0.75 (08) 13.1c New Hampshire 44.7 1.13 (17) 8.8c
California 36.8b 0.21 (43) -10.5c New Jersey 40.7 0.40 (28) -1.0Colorado 33.8b 0.58 (46) -17.8c New Mexico 29.4b 0.77 (49) -28.5c
Connecticut 40.1 0.62 (31) -2.4 New York 37.7b 0.26 (37) -8.3c
Delaware 47.7b 1.42 (06) 16.1c North Carolina 41.0 0.42 (26) -0.2District of Columbia 38.6 1.54 (36) -6.1c North Dakota 32.7b 1.31 (48) -20.4c
Florida 42.3b 0.27 (24) 2.9 Ohio 45.0b 0.36 (15) 9.5c
Georgia 40.7 0.45 (29) -1.0 Oklahoma 46.4b 0.68 (09) 12.9c
Hawaii 24.5b 0.82 (50) -40.4c Oregon 47.7b 0.70 (05) 16.1c
Idaho 34.7b 1.02 (45) -15.6c Pennsylvania 40.4 0.31 (30) -1.7Illinois 42.0 0.35 (25) 2.2 Rhode Island 43.1 1.15 (21) 4.9Indiana 47.4b 0.53 (07) 15.3c South Carolina 39.7 0.58 (33) -3.4Iowa 37.4b 0.64 (41) -9.0c South Dakota 33.7b 1.23 (47) -18.0c
Kansas 39.9 0.72 (32) -2.9 Tennessee 45.8b 0.52 (13) 11.4c
Kentucky 55.5b 0.69 (01) 35.0c Texas 39.1b 0.28 (34) -4.9Louisiana 46.0b 0.62 (12) 11.9c Utah 17.0b 0.62 (51) -58.6c
Maine 48.5b 1.08 (04) 18.0c Vermont 38.9 1.48 (35) -5.4c
Maryland 44.5b 0.55 (18) 8.3c Virginia 42.7 0.47 (23) 3.9Massachusetts 44.7b 0.48 (16) 8.8c Washington 46.1b 0.55 (11) 12.2c
Michigan 44.0b 0.40 (19) 7.1c West Virginia 51.0b 0.91 (03) 24.1c
Minnesota 37.5b 0.53 (39) -8.8c Wisconsin 37.4b 0.49 (40) -9.0c
Mississippi 43.1 0.73 (22) 4.9 Wyoming 36.9 1.67 (42) -10.2c
Missouri 46.1b 0.52 (10) 12.2c
Table XV-21LUNG AND BRONCHUS CANCER (Invasive)
AVERAGE ANNUAL AGE-ADJUSTED CANCER DEATHa RATES BY STATE, ALL RACES, 2000-2004
Females

SEE
R C
ancer Statistics Review
1975-2004N
ational Cancer Institute
a US 2004 cancer prevalence counts are based on 2004 cancer prevalence proportions from the SEER registries and 1/1/2004 USpopulation estimates based on the average of 2003 and 2004 population estimates from the US Bureau of the Census. Prevalence wascalculated using the First Malignant Primary Only for a person.
b c d Statistics based on (b) SEER 9 Areas (c) SEER 11 Areas and Rural Georgia (d) NHIA for Hispanic for SEER 11 Areas and RuralGeorgia.
e Maximum limited-duration prevalence: 29 years for 1975-2004 SEER 9 data; 14 years for 1990-2004 SEER 11 data (used to calculateprevalence for Hispanics and Asian Pacific Islanders).
f Percentages are age-adjusted to the 2000 US Standard Population (19 age groups - Census P25-1130) by 5-year age groups.g h (g) Cases diagnosed more than 29 years ago were estimated using the completeness index method (Capocaccia et. al. 1997, Merrill
et. al. 2000). (h)Complete prevalence is obtained by summing 0 to <29 and >=29.- Statistic not shown. Statistic based on fewer than 5 cases estimated alive in SEER for the time interval.+ Not available.
Years Since Diagnosis 0 to <5 5 to <10 10 to <15 15 to <20 20 to <25 0 to <14e 0 to <29e >=29g Completeh
Race/SexAll Racesb 206,480 68,243 36,705 19,051 9,818 305,761 345,236 12,892 358,128
Males 101,519 31,773 17,638 9,160 4,783 147,917 167,413 7,467 174,880Females 104,961 36,470 19,067 9,891 5,035 157,844 177,823 5,425 183,248
Whiteb 178,187 59,851 32,779 16,905 8,674 265,677 300,763 6,351 307,114Males 86,324 27,305 15,553 7,948 4,198 126,476 143,550 3,172 146,722Females 91,863 32,546 17,226 8,957 4,476 139,201 157,213 3,179 160,392
Blackb 21,464 6,451 3,102 1,692 903 30,595 34,037 610 34,647Males 11,492 3,328 1,621 923 466 16,198 18,085 344 18,429Females 9,972 3,123 1,481 769 437 14,397 15,952 266 16,218
Asian/Pacific Islanderc 4,900 1,321 + + + 6,712 + + +Males 2,691 779 + + + 3,749 + + +Females 2,209 542 + + + 2,963 + + +
Hispanicd 5,693 1,636 + + + 8,142 + + +Males 3,027 845 + + + 4,236 + + +Females 2,666 791 + + + 3,906 + + +
Age Specific (Crude) Age-Adjustedf
Age at Prevalence All Ages 0-9 10-19 20-29 30-39 40-49 50-59 60-69 70-79 80+ All Ages
Race/SexAll Racesc 0.0792% - 0.0002% 0.0011% 0.0044% 0.0252% 0.1052% 0.3251% 0.5545% 0.3823% 0.0858%
Males 0.0782% - 0.0002% 0.0010% 0.0039% 0.0242% 0.1081% 0.3469% 0.6361% 0.4780% 0.0954%Females 0.0801% - 0.0002% 0.0013% 0.0049% 0.0262% 0.1024% 0.3056% 0.4929% 0.3298% 0.0789%
Whitec 0.0851% - 0.0002% 0.0013% 0.0045% 0.0245% 0.1033% 0.3373% 0.5764% 0.3868% 0.0879%Males 0.0812% - - 0.0010% 0.0040% 0.0221% 0.1006% 0.3466% 0.6430% 0.4744% 0.0945%Females 0.0890% - - 0.0015% 0.0051% 0.0270% 0.1060% 0.3287% 0.5251% 0.3394% 0.0834%
Blackc 0.0687% - - 0.0009% 0.0040% 0.0364% 0.1615% 0.3793% 0.5540% 0.3534% 0.0968%Males 0.0765% - - - 0.0039% 0.0431% 0.2087% 0.4645% 0.6748% 0.5144% 0.1218%Females 0.0617% - - - 0.0042% 0.0306% 0.1225% 0.3126% 0.4748% 0.2757% 0.0795%
Asian/Pacific Islanderc 0.0563% - - - 0.0043% 0.0195% 0.0725% 0.2138% 0.4131% 0.3543% 0.0636%Males 0.0649% - - - 0.0040% 0.0217% 0.0798% 0.2701% 0.5702% 0.4822% 0.0824%Females 0.0483% - - - 0.0047% 0.0176% 0.0661% 0.1667% 0.3004% 0.2692% 0.0497%
Hispanicd 0.0177% - - 0.0010% 0.0026% 0.0110% 0.0392% 0.1280% 0.2530% 0.1970% 0.0377%Males 0.0179% - - - 0.0025% 0.0109% 0.0424% 0.1423% 0.3339% 0.2731% 0.0464%Females 0.0174% - - 0.0015% 0.0027% 0.0112% 0.0362% 0.1161% 0.1952% 0.1534% 0.0317%
Table XV-22LUNG AND BRONCHUS CANCER (Invasive)
Estimated United States Cancer Prevalence Countsa on January 1, 2004By Race/Ethnicity, Sex and Years Since Diagnosis
Estimated prevalence percenta on January 1, 2004, of the SEER 11 population diagnosed in the previous 10 yearsBy Age at Prevalence, Race/Ethnicity and Sex
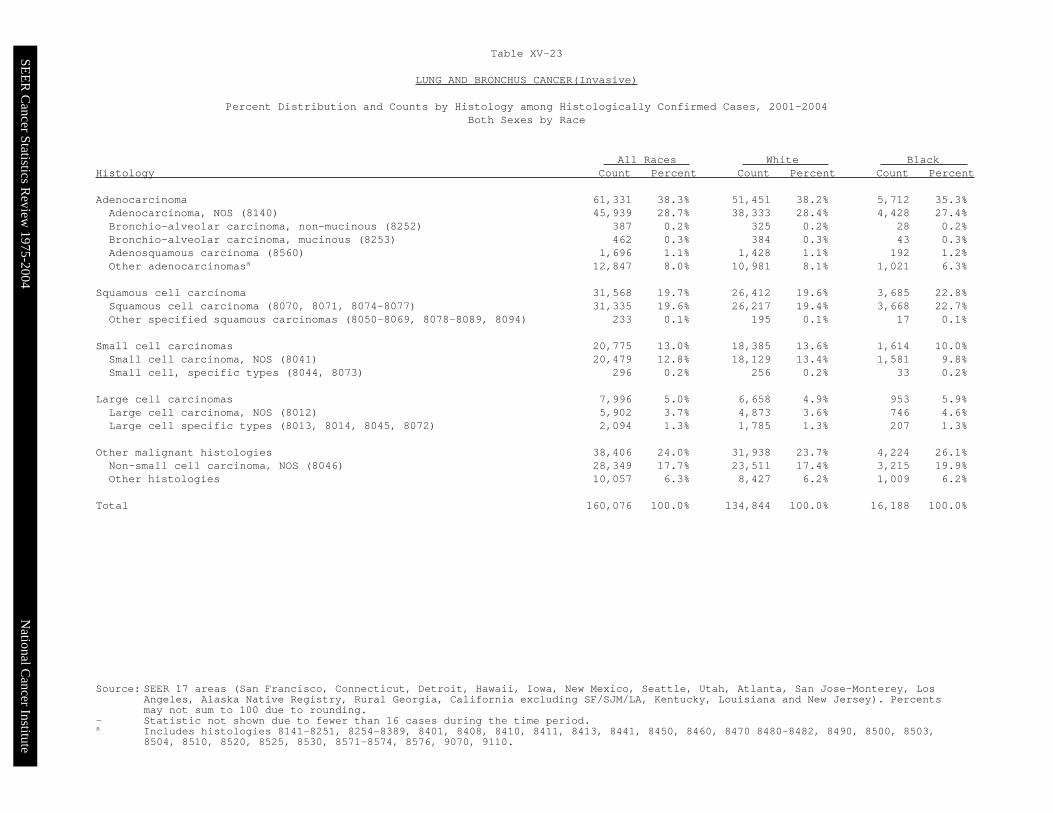
SEE
R C
ancer Statistics Review
1975-2004N
ational Cancer Institute
Source: SEER 17 areas (San Francisco, Connecticut, Detroit, Hawaii, Iowa, New Mexico, Seattle, Utah, Atlanta, San Jose-Monterey, LosAngeles, Alaska Native Registry, Rural Georgia, California excluding SF/SJM/LA, Kentucky, Louisiana and New Jersey). Percentsmay not sum to 100 due to rounding.
- Statistic not shown due to fewer than 16 cases during the time period.a Includes histologies 8141-8251, 8254-8389, 8401, 8408, 8410, 8411, 8413, 8441, 8450, 8460, 8470 8480-8482, 8490, 8500, 8503,
8504, 8510, 8520, 8525, 8530, 8571-8574, 8576, 9070, 9110.
All Races White BlackHistology Count Percent Count Percent Count Percent
Adenocarcinoma 61,331 38.3% 51,451 38.2% 5,712 35.3%Adenocarcinoma, NOS (8140) 45,939 28.7% 38,333 28.4% 4,428 27.4%Bronchio-alveolar carcinoma, non-mucinous (8252) 387 0.2% 325 0.2% 28 0.2%Bronchio-alveolar carcinoma, mucinous (8253) 462 0.3% 384 0.3% 43 0.3%Adenosquamous carcinoma (8560) 1,696 1.1% 1,428 1.1% 192 1.2%Other adenocarcinomasa 12,847 8.0% 10,981 8.1% 1,021 6.3%
Squamous cell carcinoma 31,568 19.7% 26,412 19.6% 3,685 22.8%Squamous cell carcinoma (8070, 8071, 8074-8077) 31,335 19.6% 26,217 19.4% 3,668 22.7%Other specified squamous carcinomas (8050-8069, 8078-8089, 8094) 233 0.1% 195 0.1% 17 0.1%
Small cell carcinomas 20,775 13.0% 18,385 13.6% 1,614 10.0%Small cell carcinoma, NOS (8041) 20,479 12.8% 18,129 13.4% 1,581 9.8%Small cell, specific types (8044, 8073) 296 0.2% 256 0.2% 33 0.2%
Large cell carcinomas 7,996 5.0% 6,658 4.9% 953 5.9%Large cell carcinoma, NOS (8012) 5,902 3.7% 4,873 3.6% 746 4.6%Large cell specific types (8013, 8014, 8045, 8072) 2,094 1.3% 1,785 1.3% 207 1.3%
Other malignant histologies 38,406 24.0% 31,938 23.7% 4,224 26.1%Non-small cell carcinoma, NOS (8046) 28,349 17.7% 23,511 17.4% 3,215 19.9%Other histologies 10,057 6.3% 8,427 6.2% 1,009 6.2%
Total 160,076 100.0% 134,844 100.0% 16,188 100.0%
Table XV-23
LUNG AND BRONCHUS CANCER(Invasive)
Percent Distribution and Counts by Histology among Histologically Confirmed Cases, 2001-2004Both Sexes by Race

SEE
R C
ancer Statistics Review
1975-2004N
ational Cancer Institute
Source: SEER 17 areas (San Francisco, Connecticut, Detroit, Hawaii, Iowa, New Mexico, Seattle, Utah, Atlanta, San Jose-Monterey, LosAngeles, Alaska Native Registry, Rural Georgia, California excluding SF/SJM/LA, Kentucky, Louisiana and New Jersey). Percentsmay not sum to 100 due to rounding.
- Statistic not shown due to fewer than 16 cases during the time period.a Includes histologies 8141-8251, 8254-8389, 8401, 8408, 8410, 8411, 8413, 8441, 8450, 8460, 8470 8480-8482, 8490, 8500, 8503,
8504, 8510, 8520, 8525, 8530, 8571-8574, 8576, 9070, 9110.
All Races White BlackHistology Count Percent Count Percent Count Percent
Adenocarcinoma 30,311 34.7% 25,108 34.6% 3,030 31.8%Adenocarcinoma, NOS (8140) 23,334 26.7% 19,231 26.5% 2,411 25.3%Bronchio-alveolar carcinoma, non-mucinous (8252) 137 0.2% 110 0.2% - -Bronchio-alveolar carcinoma, mucinous (8253) 193 0.2% 164 0.2% 16 0.2%Adenosquamous carcinoma (8560) 937 1.1% 783 1.1% 110 1.2%Other adenocarcinomasa 5,710 6.5% 4,820 6.6% 480 5.0%
Squamous cell carcinoma 20,429 23.4% 16,840 23.2% 2,535 26.6%Squamous cell carcinoma (8070, 8071, 8074-8077) 20,303 23.2% 16,738 23.1% 2,523 26.5%Other specified squamous carcinomas (8050-8069, 8078-8089, 8094) 126 0.1% 102 0.1% - -
Small cell carcinomas 10,484 12.0% 9,160 12.6% 839 8.8%Small cell carcinoma, NOS (8041) 10,327 11.8% 9,022 12.4% 823 8.6%Small cell, specific types (8044, 8073) 157 0.2% 138 0.2% 16 0.2%
Large cell carcinomas 4,622 5.3% 3,808 5.2% 572 6.0%Large cell carcinoma, NOS (8012) 3,376 3.9% 2,760 3.8% 441 4.6%Large cell specific types (8013, 8014, 8045, 8072) 1,246 1.4% 1,048 1.4% 131 1.4%
Other malignant histologies 21,612 24.7% 17,661 24.3% 2,550 26.8%Non-small cell carcinoma, NOS (8046) 16,116 18.4% 13,120 18.1% 1,972 20.7%Other histologies 5,496 6.3% 4,541 6.3% 578 6.1%
Total 87,458 100.0% 72,577 100.0% 9,526 100.0%
Table XV-24
LUNG AND BRONCHUS CANCER(Invasive)
Percent Distribution and Counts by Histology among Histologically Confirmed Cases, 2001-2004Males by Race

SEE
R C
ancer Statistics Review
1975-2004N
ational Cancer Institute
Source: SEER 17 areas (San Francisco, Connecticut, Detroit, Hawaii, Iowa, New Mexico, Seattle, Utah, Atlanta, San Jose-Monterey, LosAngeles, Alaska Native Registry, Rural Georgia, California excluding SF/SJM/LA, Kentucky, Louisiana and New Jersey). Percentsmay not sum to 100 due to rounding.
- Statistic not shown due to fewer than 16 cases during the time period.a Includes histologies 8141-8251, 8254-8389, 8401, 8408, 8410, 8411, 8413, 8441, 8450, 8460, 8470 8480-8482, 8490, 8500, 8503,
8504, 8510, 8520, 8525, 8530, 8571-8574, 8576, 9070, 9110.
All Races White BlackHistology Count Percent Count Percent Count Percent
Adenocarcinoma 31,020 42.7% 26,343 42.3% 2,682 40.3%Adenocarcinoma, NOS (8140) 22,605 31.1% 19,102 30.7% 2,017 30.3%Bronchio-alveolar carcinoma, non-mucinous (8252) 250 0.3% 215 0.3% - -Bronchio-alveolar carcinoma, mucinous (8253) 269 0.4% 220 0.4% 27 0.4%Adenosquamous carcinoma (8560) 759 1.0% 645 1.0% 82 1.2%Other adenocarcinomasa 7,137 9.8% 6,161 9.9% 541 8.1%
Squamous cell carcinoma 11,139 15.3% 9,572 15.4% 1,150 17.3%Squamous cell carcinoma (8070, 8071, 8074-8077) 11,032 15.2% 9,479 15.2% 1,145 17.2%Other specified squamous carcinomas (8050-8069, 8078-8089, 8094) 107 0.1% 93 0.1% - -
Small cell carcinomas 10,291 14.2% 9,225 14.8% 775 11.6%Small cell carcinoma, NOS (8041) 10,152 14.0% 9,107 14.6% 758 11.4%Small cell, specific types (8044, 8073) 139 0.2% 118 0.2% 17 0.3%
Large cell carcinomas 3,374 4.6% 2,850 4.6% 381 5.7%Large cell carcinoma, NOS (8012) 2,526 3.5% 2,113 3.4% 305 4.6%Large cell specific types (8013, 8014, 8045, 8072) 848 1.2% 737 1.2% 76 1.1%
Other malignant histologies 16,794 23.1% 14,277 22.9% 1,674 25.1%Non-small cell carcinoma, NOS (8046) 12,233 16.8% 10,391 16.7% 1,243 18.7%Other histologies 4,561 6.3% 3,886 6.2% 431 6.5%
Total 72,618 100.0% 62,267 100.0% 6,662 100.0%
Table XV-25
LUNG AND BRONCHUS CANCER(Invasive)
Percent Distribution and Counts by Histology among Histologically Confirmed Cases, 2001-2004Females by Race

0
30
60
90
120
150
180
1974 1984 1994 20040
30
60
90
120
150
180
1974 1984 1994 20040
10
20
30
40
50
60
70
1974 1984 1994 20040
10
20
30
40
50
60
70
1974 1984 1994 2004
Incidence
Delay-AdjustedIncidenceMortality
SEER Incidence, Delay Adjusted Incidence and US Death RatesLung and Bronchus Cancer, by Race and Sex
a
Figure X
V-1
Source: SEER 9 areas and NCHS public use data file for the total US. Rates are age-adjusted to the 2000 US Std Population (19 age groups - Census P25-1103).Regression lines and APCs are calculated using the Joinpoint Regression Program Version 3.0, April 2005, National Cancer Institute.The APC is the Annual Percent Change for the regression line segments. The APC shown on the graph is for the most recent trend.The APC is significantly different from zero (p < 0.05).
a
*
White Male Black Male White Female Black FemaleRate per 100,000 Rate per 100,000 Rate per 100,000 Rate per 100,000
Year of Diagnosis/Death Year of Diagnosis/Death Year of Diagnosis/Death Year of Diagnosis/Death
APC = -1.6*
APC = -1.8*
APC = -1.8*
APC = -1.7*
APC = -1.8*
APC = -2.7*
APC = 0.0
APC = -0.4
APC = 0.3*
APC = 0.5
APC = 0.4
APC = 0.4*
SEE
R C
ancer Statistics Review
1975-2004N
ational Cancer Institute

0
20
40
60
80
100
1974 1984 1994 20040
20
40
60
80
100
1974 1984 1994 20040
20
40
60
80
100
1974 1984 1994 20040
20
40
60
80
100
1974 1984 1994 2004
Incidence
Delay-AdjustedIncidenceMortality
SEER Incidence, Delay Adjusted Incidence and US Death RatesLung and Bronchus Cancer, Under 65 Years of Age, by Race and Sex
a
Figure X
V-2
Source: SEER 9 areas and NCHS public use data file for the total US. Rates are age-adjusted to the 2000 US Std Population (19 age groups - Census P25-1103).Regression lines and APCs are calculated using the Joinpoint Regression Program Version 3.0, April 2005, National Cancer Institute.The APC is the Annual Percent Change for the regression line segments. The APC shown on the graph is for the most recent trend.The APC is significantly different from zero (p < 0.05).
a
*
White Male Black Male White Female Black FemaleRate per 100,000 Rate per 100,000 Rate per 100,000 Rate per 100,000
Year of Diagnosis/Death Year of Diagnosis/Death Year of Diagnosis/Death Year of Diagnosis/Death
APC = -3.4*
APC = -5.9*
APC = -2.9*
APC = -3.4*
APC = -3.5*
APC = -2.0
APC = -1.6*
APC = -1.8*
APC = -1.6*
APC = -1.3*
APC = -1.4*
APC = -1.7*
SEE
R C
ancer Statistics Review
1975-2004N
ational Cancer Institute

0
100
200
300
400
500
600
700
800
1974 1984 1994 20040
100
200
300
400
500
600
700
800
1974 1984 1994 20040
100
200
300
400
1974 1984 1994 20040
100
200
300
400
1974 1984 1994 2004
Incidence
Delay-AdjustedIncidenceMortality
SEER Incidence, Delay Adjusted Incidence and US Death RatesLung and Bronchus Cancer, Ages 65 and Over, by Race and Sex
a
Figure X
V-3
Source: SEER 9 areas and NCHS public use data file for the total US. Rates are age-adjusted to the 2000 US Std Population (19 age groups - Census P25-1103).Regression lines and APCs are calculated using the Joinpoint Regression Program Version 3.0, April 2005, National Cancer Institute.The APC is the Annual Percent Change for the regression line segments. The APC shown on the graph is for the most recent trend.The APC is significantly different from zero (p < 0.05).
a
*
White Male Black Male White Female Black FemaleRate per 100,000 Rate per 100,000 Rate per 100,000 Rate per 100,000
Year of Diagnosis/Death Year of Diagnosis/Death Year of Diagnosis/Death Year of Diagnosis/Death
APC = -1.0*
APC = -1.2*
APC = -1.5*
APC = -0.9*
APC = -1.0*
APC = -2.2*
APC = 0.9*
APC = 0.5
APC = 1.1*
APC = 2.1*
APC = 2.0*
APC = 0.7*
SEE
R C
ancer Statistics Review
1975-2004N
ational Cancer Institute

Joinpoint Analyses for Whites and Blacks from 1975-2004and for Asian/Pacific Islanders, American Indians/Alaska Natives and Hispanics from 1992-2004
0
10
20
30
40
50
60
70
80
90
100
1974 1979 1984 1989 1994 1999 20040
10
20
30
40
50
60
70
80
90
100
1974 1979 1984 1989 1994 1999 2004
White
Black
API
AI/AN
Hispanic
SEER Incidence and US Death RatesLung and Bronchus Cancer, Both Sexes
Figure X
V-4
Source: Incidence data for whites and blacks are from the SEER 9 areas (San Francisco, Connecticut, Detroit, Hawaii, Iowa, New Mexico, Seattle, Utah, Atlanta). Incidence data for Asian/Pacific Islanders, American Indians/Alaska Natives and Hispanics are from the SEER 13 Areas (SEER 9 Areas, San Jose-Monterey, Los Angeles,Alaska Native Registry and Rural Georgia). Mortality data are from NCHS public use data file for the total US.Rates are age-adjusted to the 2000 US Std Population (19 age groups - Census P25-1103). Regression lines are calculated using the Joinpoint Regression Program Version 3.0, April 2005, National Cancer Institute.API = Asian/Pacific Islander.AI/AN = American Indian/Alaska Native. Rates for American Indian/Alaska Native are based on the CHSDA(Contract Health Service Delivery Area) counties.Hispanic is not mutually exclusive from whites, blacks, Asian/Pacific Islanders, and American Indians/Alaska Natives. Incidence data for Hispanics are based on NHIA andexclude cases from the Alaska Native Registry. Mortality data for Hispanics exclude cases from Connecticut, Maine, Maryland, Minnesota, New Hampshire, New York,North Dakota, Oklahoma, and Vermont.
Incidence MortalityRate per 100,000 Rate per 100,000
Year of Diagnosis Year of Death
a
d
a
b
c
cb
d
SEE
R C
ancer Statistics Review
1975-2004N
ational Cancer Institute

0
20
40
60
80
100
120
1974 1979 1984 1989 1994 1999 2004
Cancer of the Lung & BronchusSEER Delay-Adjusted Incidence & US Death Rates,
1975-2004, All Races, By Sex
Figure XV-5
Source: SEER 9 areas and NCHS public use data file for the total US. Rates are age-adjusted to the 2000 US Std Population (19 age groups - Census P25-1103).Regression lines are calculated using the Joinpoint Regression Program Version 3.0, April 2005, National Cancer Institute.
Rate per 100,000
Male Delay-Adjusted IncidenceMale Delay-Adjusted Incidence
Male MortalityMale Mortality
Female Delay-Adjusted IncidenceFemale Delay-Adjusted Incidence
Female MortalityFemale Mortality
Year of Diagnosis/Death
SEER Cancer Statistics Review 1975-2004 National Cancer Institute
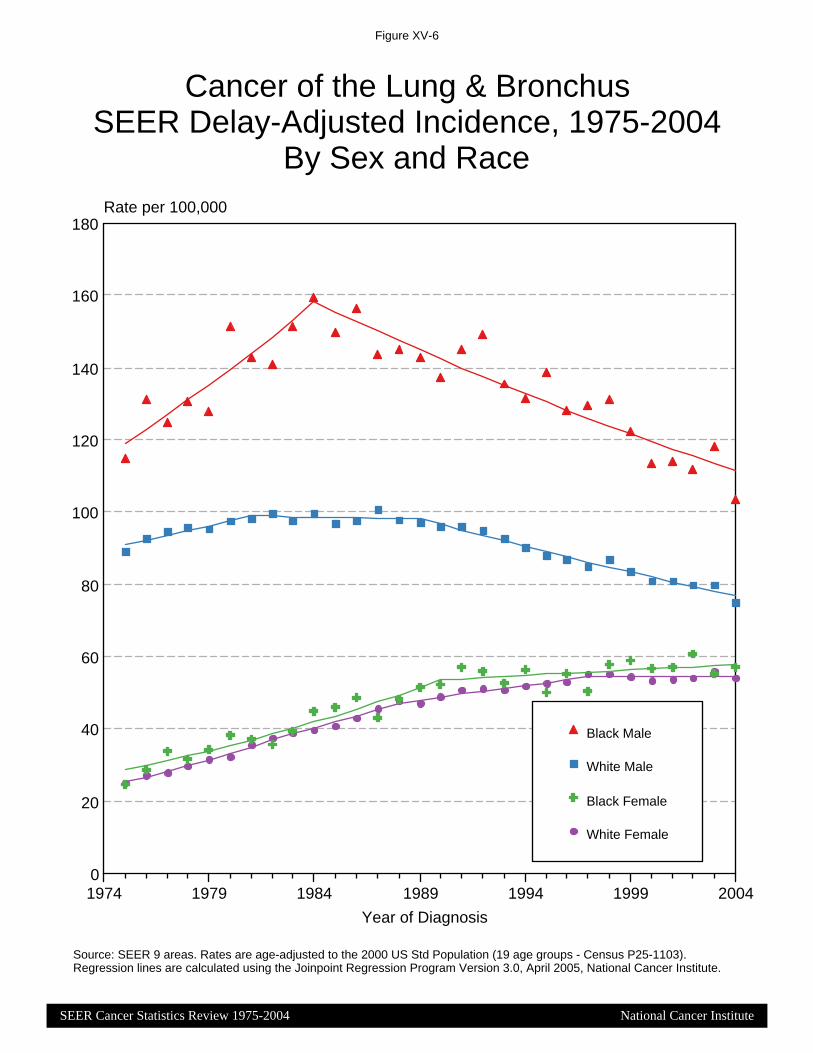
0
20
40
60
80
100
120
140
160
180
1974 1979 1984 1989 1994 1999 2004
Cancer of the Lung & BronchusSEER Delay-Adjusted Incidence, 1975-2004
By Sex and Race
Figure XV-6
Source: SEER 9 areas. Rates are age-adjusted to the 2000 US Std Population (19 age groups - Census P25-1103).Regression lines are calculated using the Joinpoint Regression Program Version 3.0, April 2005, National Cancer Institute.
Rate per 100,000
Black Male
White Male
Black Female
White Female
Year of Diagnosis
SEER Cancer Statistics Review 1975-2004 National Cancer Institute