seer cancer statistics review 1975-2013 · seer cancer statistics review 1975-2013 national cancer...
TRANSCRIPT

SEE
R C
ancer Statistics Review
1975-2013N
ational Cancer Institute
Joinpoint Regression Program Version 4.3.0.0, April 2016, National Cancer Institute. (http://surveillance.cancer.gov/joinpoint/).The APC is the Annual Percent Change based on rates age-adjusted to the 2000 US Std Population (19 age groups - Census P25-1130).
a Trends are from the SEER 9 areas (San Francisco, Connecticut, Detroit, Hawaii, Iowa, New Mexico, Seattle, Utah, and Atlanta).b Trends are from the SEER 13 areas (SEER 9 Areas, Los Angeles, San Jose-Monterey, Rural Georgia, and the Alaska Native Registry).c Trends are from US Mortality Files, National Center for Health Statistics, Centers for Disease Control and Prevention.d The AAPC is the Average Annual Percent Change and is based on the APCs calculated by Joinpoint.e API - Asian/Pacific Islander, AI/AN - American Indian/Alaska Native, NH - Non-Hispanicf Hispanic and Non-Hispanic are not mutually exclusive from whites, blacks, Asian/Pacific Islanders, and American Indians/Alaska
Natives. Incidence data for Hispanics and Non-Hispanics are based on NHIA and exclude cases from the Alaska Native Registry.The Hispanic and Non-Hispanic mortality trends exclude deaths from New Hampshire and Oklahoma.
g Data for American Indian/Alaska Native are based on the CHSDA(Contract Health Service Delivery Area) counties.* The APC/AAPC is significantly different from zero (p<.05).- Joinpoint regression line analysis could not be performed on data series.
JP Trend 1 JP Trend 2 JP Trend 3 JP Trend 4 JP Trend 5 JP Trend 6 AAPCd Years APC Years APC Years APC Years APC Years APC Years APC 2004-13 2009-13
SEER 9 Delay-Adjusted Incidencea, 1975-2013All Races 1975-88 0.0 1988-13 -2.4* -2.4* -2.4*White 1975-87 0.1 1987-13 -2.3* -2.3* -2.3*Black 1975-90 1.2* 1990-13 -2.9* -2.9* -2.9*
SEER 13 Delay-Adjusted Incidenceb, 1992-2013All Races 1992-13 -2.6* -2.6* -2.6*White 1992-13 -2.3* -2.3* -2.3*Black 1992-13 -3.4* -3.4* -3.4*
SEER 9 Observed Incidencea, 1975-2013All Races 1975-88 0.0 1988-13 -2.4* -2.4* -2.4*White 1975-87 0.1 1987-13 -2.3* -2.3* -2.3*Black 1975-90 1.3* 1990-13 -3.0* -3.0* -3.0*
SEER 13 Observed Incidenceb, 1992-2013All Races 1992-13 -2.6* -2.6* -2.6*White 1992-13 -2.4* -2.4* -2.4*White NHef 1992-13 -2.4* -2.4* -2.4*
Black 1992-13 -3.4* -3.4* -3.4*Black NHef 1992-13 -3.4* -3.4* -3.4*
APIe 1992-13 -3.1* -3.1* -3.1*AI/ANeg 1992-13 -0.1 -0.1 -0.1Hispanicf 1992-13 -1.7* -1.7* -1.7*
U.S. Cancer Mortalityc, 1975-2013All Races 1975-94 -0.4* 1994-13 -2.3* -2.3* -2.3*White 1975-94 -0.7* 1994-13 -1.9* -1.9* -1.9*Black 1975-94 1.1* 1994-13 -3.6* -3.6* -3.6*
U.S. Cancer Mortalityc, 1992-2013All Races 1992-13 -2.2* -2.2* -2.2*White 1992-13 -1.9* -1.9* -1.9*White NHef 1992-13 -1.8* -1.8* -1.8*
Black 1992-13 -3.4* -3.4* -3.4*Black NHef 1992-13 -3.3* -3.3* -3.3*
APIe 1992-13 -2.0* -2.0* -2.0*AI/ANeg 1992-13 -2.8* -2.8* -2.8*Hispanicf 1992-13 -2.5* -2.5* -2.5*
Table 12.1Cancer of the Larynx (Invasive)
Trends in SEER Incidenceab and U.S. Mortalityc Using the Joinpoint Regression Program,1975-2013 With up to Five Joinpoints, 1992-2013 With up to Four Joinpoints,
Both Sexes by Race/Ethnicity

SEE
R C
ancer Statistics Review
1975-2013N
ational Cancer Institute
Joinpoint Regression Program Version 4.3.0.0, April 2016, National Cancer Institute. (http://surveillance.cancer.gov/joinpoint/).The APC is the Annual Percent Change based on rates age-adjusted to the 2000 US Std Population (19 age groups - Census P25-1130).
a Trends are from the SEER 9 areas (San Francisco, Connecticut, Detroit, Hawaii, Iowa, New Mexico, Seattle, Utah, and Atlanta).b Trends are from the SEER 13 areas (SEER 9 Areas, Los Angeles, San Jose-Monterey, Rural Georgia, and the Alaska Native Registry).c Trends are from US Mortality Files, National Center for Health Statistics, Centers for Disease Control and Prevention.d The AAPC is the Average Annual Percent Change and is based on the APCs calculated by Joinpoint.e API - Asian/Pacific Islander, AI/AN - American Indian/Alaska Native, NH - Non-Hispanicf Hispanic and Non-Hispanic are not mutually exclusive from whites, blacks, Asian/Pacific Islanders, and American Indians/Alaska
Natives. Incidence data for Hispanics and Non-Hispanics are based on NHIA and exclude cases from the Alaska Native Registry.The Hispanic and Non-Hispanic mortality trends exclude deaths from New Hampshire and Oklahoma.
g Data for American Indian/Alaska Native are based on the CHSDA(Contract Health Service Delivery Area) counties.* The APC/AAPC is significantly different from zero (p<.05).- Joinpoint regression line analysis could not be performed on data series.
JP Trend 1 JP Trend 2 JP Trend 3 JP Trend 4 JP Trend 5 JP Trend 6 AAPCd Years APC Years APC Years APC Years APC Years APC Years APC 2004-13 2009-13
SEER 9 Delay-Adjusted Incidencea, 1975-2013All Races 1975-85 0.2 1985-13 -2.4* -2.4* -2.4*White 1975-85 0.1 1985-13 -2.4* -2.4* -2.4*Black 1975-90 1.0 1990-13 -2.8* -2.8* -2.8*
SEER 13 Delay-Adjusted Incidenceb, 1992-2013All Races 1992-13 -2.6* -2.6* -2.6*White 1992-02 -3.1* 2002-13 -1.7* -1.7* -1.7*Black 1992-13 -3.4* -3.4* -3.4*
SEER 9 Observed Incidencea, 1975-2013All Races 1975-86 0.0 1986-13 -2.4* -2.4* -2.4*White 1975-85 0.1 1985-13 -2.4* -2.4* -2.4*Black 1975-90 1.0 1990-13 -2.8* -2.8* -2.8*
SEER 13 Observed Incidenceb, 1992-2013All Races 1992-13 -2.6* -2.6* -2.6*White 1992-02 -3.1* 2002-13 -1.8* -1.8* -1.8*White NHef 1992-13 -2.5* -2.5* -2.5*
Black 1992-13 -3.4* -3.4* -3.4*Black NHef 1992-13 -3.4* -3.4* -3.4*
APIe 1992-13 -3.0* -3.0* -3.0*AI/ANeg 1992-13 0.5 0.5 0.5Hispanicf 1992-13 -1.6* -1.6* -1.6*
U.S. Cancer Mortalityc, 1975-2013All Races 1975-94 -0.8* 1994-13 -2.5* -2.5* -2.5*White 1975-93 -1.1* 1993-13 -2.2* -2.2* -2.2*Black 1975-94 1.2* 1994-13 -3.6* -3.6* -3.6*
U.S. Cancer Mortalityc, 1992-2013All Races 1992-13 -2.5* -2.5* -2.5*White 1992-13 -2.2* -2.2* -2.2*White NHef 1992-13 -2.2* -2.2* -2.2*
Black 1992-13 -3.4* -3.4* -3.4*Black NHef 1992-13 -3.3* -3.3* -3.3*
APIe 1992-13 -1.3* -1.3* -1.3*AI/ANeg 1992-13 -2.2 -2.2 -2.2Hispanicf 1992-13 -2.7* -2.7* -2.7*
Table 12.2Cancer of the Larynx (Invasive)
Trends in SEER Incidenceab and U.S. Mortalityc Using the Joinpoint Regression Program,1975-2013 With up to Five Joinpoints, 1992-2013 With up to Four Joinpoints,
Males by Race/Ethnicity

SEE
R C
ancer Statistics Review
1975-2013N
ational Cancer Institute
Joinpoint Regression Program Version 4.3.0.0, April 2016, National Cancer Institute. (http://surveillance.cancer.gov/joinpoint/).The APC is the Annual Percent Change based on rates age-adjusted to the 2000 US Std Population (19 age groups - Census P25-1130).
a Trends are from the SEER 9 areas (San Francisco, Connecticut, Detroit, Hawaii, Iowa, New Mexico, Seattle, Utah, and Atlanta).b Trends are from the SEER 13 areas (SEER 9 Areas, Los Angeles, San Jose-Monterey, Rural Georgia, and the Alaska Native Registry).c Trends are from US Mortality Files, National Center for Health Statistics, Centers for Disease Control and Prevention.d The AAPC is the Average Annual Percent Change and is based on the APCs calculated by Joinpoint.e API - Asian/Pacific Islander, AI/AN - American Indian/Alaska Native, NH - Non-Hispanicf Hispanic and Non-Hispanic are not mutually exclusive from whites, blacks, Asian/Pacific Islanders, and American Indians/Alaska
Natives. Incidence data for Hispanics and Non-Hispanics are based on NHIA and exclude cases from the Alaska Native Registry.The Hispanic and Non-Hispanic mortality trends exclude deaths from New Hampshire and Oklahoma.
g Data for American Indian/Alaska Native are based on the CHSDA(Contract Health Service Delivery Area) counties.* The APC/AAPC is significantly different from zero (p<.05).- Joinpoint regression line analysis could not be performed on data series.
JP Trend 1 JP Trend 2 JP Trend 3 JP Trend 4 JP Trend 5 JP Trend 6 AAPCd Years APC Years APC Years APC Years APC Years APC Years APC 2004-13 2009-13
SEER 9 Delay-Adjusted Incidencea, 1975-2013All Races 1975-89 1.9* 1989-13 -2.6* -2.6* -2.6*White 1975-89 1.7* 1989-13 -2.4* -2.4* -2.4*Black 1975-89 4.1* 1989-13 -3.1* -3.1* -3.1*
SEER 13 Delay-Adjusted Incidenceb, 1992-2013All Races 1992-13 -3.1* -3.1* -3.1*White 1992-13 -2.9* -2.9* -2.9*Black 1992-13 -3.4* -3.4* -3.4*
SEER 9 Observed Incidencea, 1975-2013All Races 1975-89 1.9* 1989-13 -2.7* -2.7* -2.7*White 1975-89 1.7* 1989-13 -2.4* -2.4* -2.4*Black 1975-89 4.1* 1989-13 -3.1* -3.1* -3.1*
SEER 13 Observed Incidenceb, 1992-2013All Races 1992-13 -3.1* -3.1* -3.1*White 1992-13 -2.9* -2.9* -2.9*White NHef 1992-13 -2.7* -2.7* -2.7*
Black 1992-13 -3.4* -3.4* -3.4*Black NHef 1992-13 -3.4* -3.4* -3.4*
APIe 1992-13 -2.4 -2.4 -2.4AI/ANeg - - - -Hispanicf 1992-13 -3.0* -3.0* -3.0*
U.S. Cancer Mortalityc, 1975-2013All Races 1975-92 1.6* 1992-13 -2.1* -2.1* -2.1*White 1975-92 1.5* 1992-13 -1.8* -1.8* -1.8*Black 1975-93 2.3* 1993-13 -3.2* -3.2* -3.2*
U.S. Cancer Mortalityc, 1992-2013All Races 1992-13 -2.1* -2.1* -2.1*White 1992-13 -1.8* -1.8* -1.8*White NHef 1992-13 -1.6* -1.6* -1.6*
Black 1992-13 -3.1* -3.1* -3.1*Black NHef 1992-13 -3.1* -3.1* -3.1*
APIe 1992-13 -4.6* -4.6* -4.6*AI/ANeg - - - -Hispanicf 1992-13 -2.2* -2.2* -2.2*
Table 12.3Cancer of the Larynx (Invasive)
Trends in SEER Incidenceab and U.S. Mortalityc Using the Joinpoint Regression Program,1975-2013 With up to Five Joinpoints, 1992-2013 With up to Four Joinpoints,
Females by Race/Ethnicity

SEE
R C
ancer Statistics Review
1975-2013N
ational Cancer Institute
Additional information on the model used to delay-adjust SEER Incidence rates can be found at(http://surveillance.cancer.gov/delay/).
a SEER 9 areas (San Francisco, Connecticut, Detroit, Hawaii, Iowa, New Mexico, Seattle, Utah, and Atlanta).Rates are per 100,000 and are age-adjusted to the 2000 US Std Population (19 age groups - Census P25-1130).
- Delay-adjusted rate is not shown for observed rates based on less than 16 cases for the time interval.
All Races Whites Blacks Total Males Females Total Males Females Total Males Females
Year of Diagnosis:1975 5.02 9.47 1.48 4.96 9.43 1.46 7.08 13.36 1.961976 5.22 10.00 1.39 5.19 9.95 1.44 7.31 14.61 1.411977 5.02 9.70 1.36 4.96 9.64 1.33 7.46 13.89 2.451978 5.31 9.79 1.84 5.31 9.78 1.85 6.95 13.20 2.221979 5.39 10.09 1.69 5.40 10.21 1.64 7.50 13.22 3.071980 5.25 10.02 1.53 5.16 9.89 1.51 7.34 14.47 1.831981 5.39 9.82 1.92 5.31 9.56 2.03 8.09 16.33 1.871982 5.30 9.76 1.80 5.27 9.75 1.79 7.91 14.49 2.881983 5.34 9.93 1.73 5.42 10.17 1.69 6.81 12.20 2.611984 5.10 9.62 1.58 4.99 9.58 1.46 8.46 14.85 3.441985 5.42 9.92 1.93 5.41 10.01 1.88 8.43 15.24 3.371986 5.00 9.38 1.62 4.93 9.18 1.68 7.65 15.14 2.081987 5.19 9.42 1.92 5.14 9.36 1.89 8.20 15.08 3.121988 5.20 9.58 1.87 5.19 9.57 1.86 8.17 14.93 3.211989 5.02 8.91 2.00 4.98 8.89 1.92 7.89 14.25 3.281990 5.10 9.18 1.92 5.00 8.98 1.87 9.46 17.72 3.591991 4.73 8.46 1.80 4.79 8.53 1.85 6.59 12.27 2.281992 4.98 9.08 1.76 4.87 8.90 1.72 8.68 15.75 3.401993 4.38 8.13 1.48 4.38 8.03 1.56 6.99 14.20 1.711994 4.66 8.34 1.76 4.54 8.15 1.67 8.91 15.96 3.711995 4.41 7.89 1.61 4.42 7.87 1.62 6.82 13.15 2.251996 4.27 7.57 1.64 4.27 7.57 1.62 6.38 11.28 2.781997 4.22 7.55 1.61 4.14 7.31 1.62 7.30 13.62 2.741998 3.88 6.80 1.60 3.73 6.51 1.56 6.71 12.15 2.831999 4.19 7.05 1.86 4.13 6.95 1.77 7.19 12.18 3.722000 4.06 7.29 1.44 4.05 7.21 1.48 6.22 11.65 2.282001 3.66 6.58 1.27 3.60 6.35 1.30 6.25 12.19 1.922002 3.57 6.35 1.31 3.47 6.15 1.28 6.47 11.51 2.752003 3.36 6.01 1.22 3.37 5.93 1.28 5.05 9.57 1.832004 3.47 6.12 1.37 3.46 6.02 1.38 5.73 10.67 2.382005 3.49 6.22 1.31 3.50 6.15 1.36 5.76 10.72 2.042006 3.38 5.97 1.27 3.43 5.90 1.38 5.46 10.68 1.662007 3.25 5.69 1.24 3.25 5.64 1.24 5.64 10.24 2.332008 3.14 5.55 1.14 3.21 5.67 1.13 4.39 8.03 1.832009 3.11 5.71 0.99 3.20 5.74 1.07 4.22 8.38 1.262010 3.20 5.71 1.14 3.15 5.49 1.20 5.08 9.48 1.832011 2.96 5.26 1.08 3.01 5.28 1.09 4.24 8.56 1.292012 3.02 5.31 1.11 3.06 5.29 1.14 4.72 8.82 1.872013 2.86 5.15 0.96 2.96 5.27 0.99 4.04 7.21 1.69
Table 12.4Cancer of the Larynx (Invasive)
Delay-adjusted SEER Incidencea Rates by Year, Race and Sex

SEE
R C
ancer Statistics Review
1975-2013N
ational Cancer Institute
a SEER 9 areas (San Francisco, Connecticut, Detroit, Hawaii, Iowa, New Mexico, Seattle, Utah, and Atlanta).Rates are per 100,000 and are age-adjusted to the 2000 US Std Population (19 age groups - Census P25-1130).
- Statistic not shown. Rate based on less than 16 cases for the time interval.
All Races Whites Blacks Total Males Females Total Males Females Total Males Females
Year of Diagnosis:1975-2013 4.18 7.56 1.48 4.20 7.55 1.49 6.36 11.87 2.301975 5.02 9.47 1.48 4.96 9.43 1.46 7.08 13.36 -1976 5.22 10.00 1.39 5.19 9.95 1.44 7.31 14.61 -1977 5.02 9.70 1.36 4.96 9.64 1.33 7.46 13.89 2.451978 5.31 9.79 1.84 5.31 9.78 1.85 6.95 13.20 2.221979 5.39 10.09 1.69 5.40 10.21 1.64 7.50 13.22 3.071980 5.25 10.02 1.53 5.16 9.89 1.51 7.34 14.47 -1981 5.39 9.82 1.92 5.31 9.56 2.03 8.09 16.33 -1982 5.30 9.76 1.80 5.27 9.75 1.79 7.91 14.49 2.881983 5.34 9.93 1.73 5.42 10.17 1.69 6.81 12.20 2.611984 5.10 9.62 1.58 4.99 9.58 1.46 8.46 14.85 3.441985 5.42 9.92 1.93 5.41 10.01 1.88 8.43 15.24 3.371986 5.00 9.38 1.62 4.93 9.18 1.68 7.65 15.14 2.081987 5.19 9.42 1.92 5.14 9.36 1.89 8.20 15.08 3.121988 5.20 9.58 1.87 5.19 9.57 1.86 8.17 14.93 3.211989 5.02 8.91 2.00 4.98 8.89 1.92 7.89 14.25 3.281990 5.10 9.18 1.92 5.00 8.98 1.87 9.46 17.72 3.591991 4.73 8.46 1.80 4.79 8.53 1.85 6.59 12.27 2.281992 4.98 9.08 1.76 4.87 8.90 1.72 8.68 15.75 3.401993 4.38 8.13 1.48 4.38 8.03 1.56 6.99 14.20 1.711994 4.66 8.34 1.76 4.54 8.15 1.67 8.91 15.96 3.711995 4.41 7.89 1.61 4.42 7.87 1.62 6.82 13.15 2.251996 4.27 7.57 1.64 4.27 7.57 1.62 6.38 11.28 2.781997 4.22 7.55 1.61 4.14 7.31 1.62 7.30 13.62 2.741998 3.88 6.80 1.60 3.73 6.51 1.56 6.71 12.15 2.831999 4.19 7.05 1.86 4.13 6.95 1.77 7.19 12.18 3.722000 4.06 7.29 1.44 4.05 7.21 1.48 6.22 11.65 2.282001 3.66 6.58 1.27 3.60 6.35 1.30 6.25 12.19 1.922002 3.57 6.35 1.31 3.47 6.15 1.28 6.47 11.51 2.752003 3.36 6.01 1.22 3.37 5.93 1.28 5.05 9.57 1.832004 3.47 6.12 1.37 3.46 6.02 1.38 5.73 10.67 2.382005 3.49 6.22 1.31 3.50 6.15 1.36 5.76 10.72 2.042006 3.38 5.96 1.27 3.43 5.90 1.38 5.46 10.68 1.662007 3.25 5.69 1.24 3.25 5.64 1.24 5.64 10.23 2.332008 3.13 5.55 1.14 3.21 5.66 1.13 4.39 8.03 1.832009 3.11 5.70 0.99 3.19 5.73 1.07 4.21 8.37 1.262010 3.20 5.70 1.14 3.15 5.48 1.20 5.07 9.46 1.822011 2.95 5.24 1.07 2.99 5.26 1.08 4.22 8.52 1.282012 3.00 5.28 1.10 3.04 5.26 1.13 4.69 8.76 1.862013 2.81 5.06 0.94 2.90 5.17 0.97 3.97 7.09 1.66
Table 12.5Cancer of the Larynx (Invasive)
Age-adjusted SEER Incidencea Rates by Year, Race and Sex

SEE
R C
ancer Statistics Review
1975-2013N
ational Cancer Institute
a US Mortality Files, National Center for Health Statistics, Centers for Disease Control and Prevention.Rates are per 100,000 and are age-adjusted to the 2000 US Std Population (19 age groups - Census P25-1130).
- Statistic not shown. Rate based on less than 16 cases for the time interval.
All Races Whites Blacks Total Males Females Total Males Females Total Males Females
Year of Death:1975-2013 1.40 2.62 0.50 1.31 2.44 0.47 2.53 5.01 0.801975 1.68 3.35 0.46 1.60 3.22 0.43 2.61 4.97 0.781976 1.72 3.41 0.49 1.63 3.26 0.47 2.63 5.13 0.711977 1.70 3.41 0.47 1.61 3.25 0.44 2.74 5.47 0.721978 1.70 3.40 0.49 1.59 3.18 0.46 2.90 5.88 0.711979 1.67 3.34 0.46 1.59 3.19 0.44 2.59 5.21 0.631980 1.61 3.17 0.48 1.49 2.95 0.44 2.91 5.73 0.871981 1.66 3.28 0.52 1.54 3.09 0.46 2.95 5.55 1.061982 1.67 3.23 0.54 1.57 3.05 0.51 2.79 5.51 0.831983 1.64 3.18 0.54 1.54 3.01 0.50 2.73 5.28 0.891984 1.63 3.16 0.53 1.50 2.90 0.51 3.05 6.21 0.751985 1.56 3.01 0.52 1.42 2.77 0.47 2.97 5.79 0.941986 1.59 3.06 0.55 1.45 2.81 0.50 3.07 6.11 0.961987 1.60 3.10 0.53 1.48 2.87 0.50 2.93 5.88 0.861988 1.58 3.04 0.53 1.43 2.73 0.51 3.21 6.73 0.761989 1.59 3.01 0.58 1.44 2.71 0.55 3.20 6.59 0.831990 1.55 2.97 0.54 1.42 2.73 0.49 3.00 5.79 1.081991 1.65 3.07 0.63 1.50 2.80 0.58 3.33 6.43 1.201992 1.61 3.00 0.61 1.46 2.73 0.57 3.26 6.39 1.071993 1.59 3.01 0.57 1.45 2.74 0.53 3.24 6.38 1.061994 1.55 2.92 0.57 1.41 2.63 0.53 3.20 6.41 1.041995 1.50 2.82 0.54 1.37 2.56 0.50 3.03 5.97 1.031996 1.50 2.78 0.56 1.36 2.49 0.53 3.16 6.35 0.971997 1.44 2.67 0.53 1.30 2.40 0.50 2.98 6.08 0.891998 1.43 2.58 0.57 1.31 2.34 0.54 2.83 5.55 0.901999 1.39 2.54 0.53 1.29 2.34 0.50 2.59 5.13 0.852000 1.39 2.55 0.52 1.27 2.32 0.49 2.79 5.46 0.952001 1.34 2.48 0.49 1.24 2.28 0.46 2.55 4.99 0.882002 1.29 2.33 0.50 1.20 2.15 0.47 2.46 4.81 0.842003 1.29 2.36 0.47 1.20 2.16 0.45 2.50 5.12 0.752004 1.22 2.25 0.44 1.15 2.09 0.43 2.23 4.57 0.662005 1.25 2.24 0.48 1.16 2.07 0.47 2.30 4.59 0.772006 1.22 2.19 0.48 1.16 2.04 0.48 2.07 4.11 0.682007 1.14 2.05 0.42 1.06 1.88 0.41 2.11 4.28 0.642008 1.15 2.05 0.45 1.10 1.93 0.44 2.01 3.89 0.742009 1.09 1.94 0.42 1.03 1.82 0.41 1.88 3.78 0.602010 1.08 1.95 0.40 1.03 1.85 0.38 1.78 3.38 0.672011 1.06 1.88 0.41 1.01 1.75 0.41 1.82 3.70 0.542012 1.02 1.83 0.38 0.97 1.72 0.37 1.71 3.38 0.582013 1.01 1.82 0.36 0.98 1.75 0.35 1.61 3.14 0.58
Table 12.6Cancer of the Larynx (Invasive)
Age-adjusted U.S. Deatha Rates by Year, Race and Sex

SEE
R C
ancer Statistics Review
1975-2013N
ational Cancer Institute
a SEER 18 areas. Rates are per 100,000 and are age-adjusted to the 2000 US Std Population (19 age groups - Census P25-1130),unless noted.
b US Mortality Files, National Center for Health Statistics, Centers for Disease Control and Prevention.Rates are per 100,000 and are age-adjusted to the 2000 US Std Population (19 age groups - Census P25-1130), unless noted.
c Rates are per 100,000 and are age-adjusted to the IARC world standard population.- Statistic not shown. Rate based on less than 16 cases for the time interval.
All Races Whites Blacks Total Males Females Total Males Females Total Males Females
SEER IncidenceAge at DiagnosisAge-Adjusted Rates, 2009-2013All ages 3.2 5.6 1.1 3.2 5.6 1.2 4.6 8.7 1.6Under 65 1.5 2.5 0.6 1.6 2.5 0.7 2.4 4.2 1.065 and over 14.3 27.1 4.6 14.6 27.3 4.7 19.4 39.6 6.2
All ages (IARC world std)c 2.2 3.8 0.8 2.2 3.8 0.9 3.3 6.1 1.2
Age-Specific Rates, 2009-2013<1 - - - - - - - - -1-4 - - - - - - - - -5-9 - - - - - - - - -10-14 - - - - - - - - -15-19 - - - - - - - - -20-24 - - - - - - - - -25-29 0.1 - - 0.1 - - - - -30-34 0.1 0.1 0.1 0.1 0.1 - - - -35-39 0.3 0.5 0.2 0.4 0.5 0.2 - - -40-44 0.9 1.3 0.4 0.9 1.3 0.5 1.4 2.4 -45-49 2.2 3.3 1.1 2.3 3.4 1.2 2.7 4.2 1.350-54 4.8 7.4 2.3 4.9 7.4 2.4 7.3 11.6 3.455-59 7.4 12.1 3.0 7.4 11.9 3.1 12.8 21.5 5.360-64 10.9 18.9 3.5 10.8 18.5 3.5 18.6 34.4 5.865-69 13.7 24.0 4.6 13.9 23.9 4.7 21.0 39.5 6.670-74 15.9 28.7 5.2 16.2 28.9 5.4 22.6 43.4 7.675-79 15.9 29.6 5.3 16.4 30.4 5.4 18.6 38.4 5.880-84 13.8 28.7 3.7 13.8 28.3 3.8 19.0 44.3 5.185+ 10.2 24.3 3.1 10.4 24.8 3.1 11.3 28.8 -
U.S. MortalityAge at DeathAge-Adjusted Rates, 2009-2013All ages 1.1 1.9 0.4 1.0 1.8 0.4 1.8 3.5 0.6Under 65 0.4 0.7 0.2 0.4 0.6 0.1 0.7 1.3 0.365 and over 5.5 10.2 2.1 5.3 9.7 2.0 8.8 18.5 2.8
All ages (IARC world std)c 0.7 1.2 0.3 0.6 1.1 0.2 1.2 2.2 0.4
Age-Specific Rates, 2009-2013<1 - - - - - - - - -1-4 - - - - - - - - -5-9 - - - - - - - - -10-14 - - - - - - - - -15-19 - - - - - - - - -20-24 - - - - - - - - -25-29 - - - - - - - - -30-34 - - - - - - - - -35-39 0.0 0.1 - 0.0 0.1 - - - -40-44 0.1 0.2 0.0 0.1 0.2 0.0 0.2 0.4 -45-49 0.5 0.8 0.2 0.5 0.8 0.2 0.9 1.3 0.550-54 1.2 2.0 0.5 1.1 1.9 0.4 2.1 3.6 0.855-59 2.1 3.6 0.8 2.0 3.3 0.8 4.0 7.0 1.460-64 3.1 5.4 1.1 2.9 4.9 1.0 6.0 11.1 1.865-69 4.4 7.5 1.6 4.2 7.0 1.6 8.0 15.3 2.370-74 5.1 8.8 2.0 4.9 8.4 2.0 8.7 16.9 2.875-79 6.2 10.9 2.4 6.0 10.6 2.4 9.4 18.4 3.780-84 6.7 13.1 2.4 6.5 12.4 2.4 10.0 23.1 3.085+ 6.3 14.5 2.2 6.2 14.1 2.2 8.4 23.5 2.4
Table 12.7Cancer of the Larynx (Invasive)
SEER Incidencea and U.S. Deathb Rates, Age-Adjusted and Age-Specific Rates, by Race and Sex

SEE
R C
ancer Statistics Review
1975-2013N
ational Cancer Institute
a Based on End Results data from a series of hospital registries and one population-based registry.b SEER 9 areas (San Francisco, Connecticut, Detroit, Hawaii, Iowa, New Mexico, Seattle, Utah, Atlanta).
Based on follow-up of patients into 2013.c SEER 18 areas (San Francisco, Connecticut, Detroit, Hawaii, Iowa, New Mexico, Seattle, Utah, Atlanta, San Jose-Monterey,
Los Angeles, Alaska Native Registry, Rural Georgia, California excluding SF/SJM/LA, Kentucky, Louisiana, New Jersey andGeorgia excluding ATL/RG).Based on follow-up of patients into 2013.
d Period survival provides a 2012 estimate of survival by piecing together the most recent conditional survival estimatesfrom several cohorts. It is computed here using three year calendar blocks (2010-2012: 0-1 year survival),(2009-2011: 1-2 year survival), (2008-2010: 2-3 year survival), (2007-2009: 3-4 year survival), (2006-2008: 4-5 years survival).
e Stage at diagnosis is classified using SEER Summary Stage 2000. Stage distribution percentages may not sum to 100 due to rounding.f The difference between 1975-1977 and 2006-2012 is statistically significant (p<.05).g The standard error is between 5 and 10 percentage points.h The standard error is greater than 10 percentage points.- Statistic could not be calculated due to fewer than 25 cases during the time period.
All Races Whites Blacks Total Males Females Total Males Females Total Males Females
5-Year Relative Survival (Percent)Year of Diagnosis:1960-1963a - - - 53 54 46 - - -1970-1973a - - - 62 63 56 - - -1975-1977b 66.0 66.6 62.6 66.7 67.4 62.3 58.2 57.1 63.3g
1978-1980b 65.3 65.5 64.6 66.2 66.3 65.4 56.9 57.2 55.8g
1981-1983b 68.1 68.4 66.9 69.5 69.7 68.5 56.5 57.7 50.7g
1984-1986b 65.2 65.8 62.2 67.0 67.6 63.9 52.8 53.1 51.1g
1987-1989b 65.5 66.6 61.1 66.9 68.5 60.6 55.9 54.1 61.3g
1990-1992b 65.8 66.7 62.3 67.7 68.5 64.4 53.5 54.0 51.3g
1993-1995b 63.6 65.3 56.6 65.2 67.0 57.6 53.1 54.5 47.4g
1996-1998b 65.0 66.8 58.7 66.9 68.5 61.1 53.8 56.8 45.0g
1999-2001b 63.3 64.2 59.7 65.2 66.3 60.8 50.0 49.1 53.0g
2002-2005b 62.8 62.9 62.3 65.3 65.3 65.2 50.5 51.5 46.8g
2006-2012b 62.0f 62.6f 58.8 63.6f 64.1f 61.5 52.1 53.5 46.4
5-Year Period Survival (Percent)cd
2012 60.1 60.8 57.2 61.4 62.0 58.9 51.5 52.6 46.9
Stage Distribution (%) 2006-2012ce
All StagesNumber of cases 16,454 13,295 3,159 13,204 10,673 2,531 2,513 1,991 522Percent 100% 100% 100% 100% 100% 100% 100% 100% 100%Localized 55 57 49 57 59 51 45 48 37Regional 22 20 30 21 20 29 25 23 33Distant 19 19 18 17 18 16 27 27 27Unstaged 4 4 4 4 4 3 3 3 3
5-Year Relative Survival (Percent), 2006-2012c
Age at Diagnosis:Ages <45 73.8 71.9 78.3 78.8 77.7 81.2 53.2g 51.1g 58.8h
Ages 45-54 61.6 61.7 61.0 63.3 62.9 64.7 53.2 54.9 48.4Ages 55-64 60.9 60.8 61.3 62.7 62.6 63.0 50.8 50.1 53.7Ages 65-74 60.6 62.6 50.9 60.5 62.5 50.7 57.8 59.8 48.3g
Ages 75+ 56.9 58.8 48.6 57.3 59.6 48.1 51.2 53.0g 41.9g
Ages <65 62.0 61.8 62.8 64.0 63.6 65.5 51.8 51.8 51.7Ages 65+ 59.1 61.2 49.8 59.1 61.3 49.5 56.1 58.1 47.0g
Stagee:All Stages 60.7 61.5 57.4 61.8 62.5 58.5 53.3 54.1 50.3Localized 76.3 77.0 72.6 76.2 76.9 72.8 73.8 74.6 69.1Regional 44.5 43.4 47.5 45.1 44.2 47.5 41.8 39.5 47.2Distant 35.1 35.0 35.3 36.0 36.0 36.3 30.1 30.0 30.7Unstaged 56.4 57.8 50.2g 58.0 59.9 49.2g 46.6g 48.6g -
Table 12.8Cancer of the Larynx (Invasive)
5-Year Relative and Period Survival (Percent) by Race, Sex, Diagnosis Year, Stage and Age

SEE
R C
ancer Statistics Review
1975-2013N
ational Cancer Institute a Based on the SEER 9 areas (San Francisco, Connecticut, Detroit, Hawaii, Iowa, New Mexico, Seattle, Utah, and Atlanta).
1975- 1980- 1985- 1990-1979 1984 1989 1994 1995 1996 1997 1998 1999 2000 2001 2002 2003 2004 2005 2006 2007 2008 2009 2010 2011 2012
Survival Time
1-year 88.2 88.5 88.2 87.8 89.1 88.3 85.9 86.2 85.4 85.4 85.3 84.2 84.1 85.6 86.7 86.4 88.1 84.1 86.9 85.6 86.8 87.72-year 79.1 79.5 79.0 78.0 80.0 79.2 77.3 75.9 74.7 76.8 75.5 74.8 74.7 75.4 78.0 74.6 75.5 76.3 76.9 76.9 72.33-year 73.3 74.0 73.6 71.7 74.8 74.1 72.1 70.8 70.7 71.0 70.0 70.0 66.8 68.6 72.5 68.5 70.5 71.1 71.5 70.04-year 68.8 70.0 68.7 67.3 69.3 69.7 68.7 67.0 68.6 66.7 66.5 67.0 62.6 64.2 69.9 62.8 65.7 66.6 67.95-year 65.5 66.8 65.9 64.5 66.1 65.8 65.4 63.5 63.7 63.3 62.9 62.7 60.4 62.2 65.8 59.6 61.9 64.16-year 63.1 63.9 62.5 61.0 63.2 63.6 62.2 59.1 60.6 60.4 60.6 60.1 56.1 59.5 61.4 56.9 59.27-year 60.8 61.3 60.0 59.2 59.8 61.3 59.6 55.5 57.3 56.5 57.2 56.3 54.2 57.0 58.4 54.08-year 58.8 59.6 57.1 56.4 57.4 57.9 57.0 52.8 54.1 53.0 54.4 52.7 51.9 53.8 54.99-year 56.4 57.3 54.5 53.9 54.3 54.2 55.5 50.3 52.2 50.7 52.0 52.2 49.4 51.810-year 54.1 55.4 52.1 51.3 51.1 52.0 53.3 48.4 50.4 48.9 50.4 48.6 47.311-year 52.7 52.9 50.1 49.3 47.8 49.3 50.9 47.1 47.6 47.5 47.0 45.412-year 50.9 50.2 48.0 47.4 46.0 46.7 46.2 45.0 45.2 44.3 45.213-year 49.6 48.0 46.9 45.0 44.2 44.7 44.9 43.2 42.3 43.014-year 48.0 46.5 44.2 43.1 41.3 41.6 43.0 41.6 41.215-year 45.8 44.8 41.8 41.3 38.8 38.8 42.0 39.516-year 43.6 42.1 40.2 39.4 37.9 37.3 40.817-year 41.4 40.6 38.7 37.5 37.2 35.318-year 40.2 38.8 37.2 35.4 36.119-year 38.2 37.2 34.6 33.520-year 36.4 35.4 33.4
Table 12.9Cancer of the Larynx (Invasive)
SEERa Relative Survival (Percent)By Year of Diagnosis
All Races, Males and Females
Year of Diagnosis

SEE
R C
ancer Statistics Review
1975-2013N
ational Cancer Institute a Based on the SEER 9 areas (San Francisco, Connecticut, Detroit, Hawaii, Iowa, New Mexico, Seattle, Utah, and Atlanta).
1975- 1980- 1985- 1990-1979 1984 1989 1994 1995 1996 1997 1998 1999 2000 2001 2002 2003 2004 2005 2006 2007 2008 2009 2010 2011 2012
Survival Time
1-year 88.5 88.6 88.5 88.5 91.2 88.1 88.4 87.2 86.7 85.4 85.7 84.8 84.1 86.2 86.5 86.7 88.9 84.3 87.6 86.1 87.0 86.62-year 79.2 79.7 79.4 79.1 81.8 79.3 80.0 76.7 75.9 77.4 75.7 75.1 75.3 75.5 77.1 75.4 75.6 76.9 77.3 77.6 72.33-year 73.5 74.5 74.2 72.6 76.5 74.3 74.8 71.6 71.6 71.7 70.9 71.0 68.4 68.7 72.5 69.5 70.1 72.8 71.5 71.04-year 69.2 70.6 69.5 68.3 71.5 69.7 71.2 68.3 69.6 67.3 66.7 68.3 63.3 63.6 70.0 64.0 65.8 67.8 67.45-year 65.8 67.3 66.6 65.6 68.2 66.4 68.2 65.6 65.3 64.2 63.1 63.6 60.5 61.8 65.4 61.6 61.5 65.36-year 63.5 64.5 63.2 62.1 65.4 64.0 65.1 62.3 62.0 61.6 60.8 61.1 56.2 59.9 60.8 58.4 58.97-year 61.3 61.8 61.0 60.4 61.9 61.4 62.9 58.7 58.6 58.5 58.7 57.1 54.5 58.2 57.3 55.48-year 59.1 60.4 58.2 57.8 59.4 57.9 59.7 55.6 55.5 55.7 56.1 53.9 53.1 55.4 53.09-year 56.7 58.0 56.1 55.3 56.6 53.9 57.8 53.0 53.3 53.9 54.4 53.0 50.5 53.410-year 54.7 56.3 53.9 52.6 53.7 51.6 55.8 50.8 51.2 51.8 53.0 49.5 48.811-year 53.5 53.7 52.1 50.6 50.0 49.1 53.8 50.1 48.5 49.8 49.1 46.512-year 52.0 51.0 50.1 48.7 49.1 46.2 48.8 48.7 46.1 47.0 47.413-year 50.8 48.8 49.2 46.5 47.2 44.0 47.0 46.5 43.9 46.414-year 49.1 47.0 46.8 44.5 44.8 41.8 44.7 45.6 42.515-year 46.9 45.2 44.3 42.7 41.8 39.3 44.3 43.516-year 44.7 42.9 42.7 40.8 40.6 37.6 43.317-year 42.5 41.7 41.3 39.1 39.9 35.418-year 41.2 39.8 39.5 37.0 39.619-year 39.0 38.2 36.6 34.920-year 37.5 36.3 35.6
Table 12.10Cancer of the Larynx (Invasive)
SEERa Relative Survival (Percent)By Year of Diagnosis
All Races, Males
Year of Diagnosis

SEE
R C
ancer Statistics Review
1975-2013N
ational Cancer Institute a Based on the SEER 9 areas (San Francisco, Connecticut, Detroit, Hawaii, Iowa, New Mexico, Seattle, Utah, and Atlanta).
1975- 1980- 1985- 1990-1979 1984 1989 1994 1995 1996 1997 1998 1999 2000 2001 2002 2003 2004 2005 2006 2007 2008 2009 2010 2011 2012
Survival Time
1-year 86.8 88.1 86.9 85.2 80.1 88.8 76.7 83.1 81.1 85.4 83.2 81.7 83.8 83.5 87.6 85.2 84.8 83.2 83.1 83.2 85.8 91.92-year 78.6 78.6 77.3 73.6 72.0 79.0 67.1 73.4 70.7 74.3 74.3 73.4 71.8 74.9 81.0 70.6 74.9 73.5 74.3 73.6 72.43-year 71.7 72.0 71.1 68.3 67.5 73.4 62.0 68.3 67.1 68.1 66.0 65.9 59.9 68.1 72.5 64.0 71.9 63.4 72.0 65.24-year 67.0 67.5 65.6 63.2 60.1 69.4 59.2 62.9 65.0 63.9 65.5 61.5 59.6 65.8 69.6 57.1 65.3 61.2 70.45-year 63.8 64.2 62.6 60.0 57.4 63.6 55.4 57.1 58.3 59.7 61.7 59.1 58.5 63.2 67.1 50.6 62.9 58.56-year 61.1 61.2 59.3 56.4 53.8 62.3 51.8 49.6 55.5 55.8 59.2 55.4 55.4 57.4 63.8 49.8 60.57-year 58.4 58.9 56.1 54.2 51.4 60.0 48.0 45.6 52.8 48.3 50.2 52.9 52.7 52.3 62.3 46.88-year 57.1 56.3 52.5 50.8 49.1 57.8 46.7 44.0 49.5 41.7 46.7 48.1 46.8 48.4 61.29-year 54.4 54.2 48.2 48.4 45.1 55.0 46.7 41.8 48.1 38.0 41.3 48.1 44.6 46.110-year 51.2 51.6 45.2 46.3 40.9 53.0 44.2 40.5 47.4 37.1 38.3 44.9 40.711-year 48.4 49.2 42.4 44.3 38.8 50.1 39.8 37.6 44.1 37.1 37.5 40.512-year 45.7 46.8 39.8 42.2 34.0 48.4 36.7 34.3 41.8 33.5 34.813-year 44.1 44.4 38.0 39.1 32.4 45.9 36.7 33.3 37.0 30.014-year 42.7 43.4 34.3 37.3 28.2 40.4 36.0 29.7 36.615-year 40.5 42.7 32.6 35.8 27.0 36.9 33.7 27.916-year 38.6 39.0 30.8 33.9 27.0 36.3 31.917-year 36.1 35.7 29.3 31.4 26.3 34.618-year 35.3 34.7 28.9 29.5 22.719-year 34.1 33.2 27.1 28.320-year 31.7 31.8 25.2
Table 12.11Cancer of the Larynx (Invasive)
SEERa Relative Survival (Percent)By Year of Diagnosis
All Races, Females
Year of Diagnosis

SEE
R C
ancer Statistics Review
1975-2013N
ational Cancer Institute
Devcan 6.7.4, August 2016, National Cancer Institute (http://surveillance.cancer.gov/devcan/).Source: Incidence data are from the SEER 18 areas (San Francisco, Connecticut, Detroit, Hawaii, Iowa, New Mexico, Seattle, Utah, Atlanta,
San Jose-Monterey, Los Angeles, Alaska Native Registry, Rural Georgia, California excluding SF/SJM/LA, Kentucky, Louisiana, New Jersey,and Georgia excluding ATL/RG). Mortality data are from the NCHS public use data file for the total US.
a Underlying incidence and mortality data for American Indian/Alaska Native are based on the CHSDA(Contract Health Service Delivery Area)counties.
b Hispanic is not mutually exclusive from whites, blacks, Asian/Pacific Islanders, and American Indians/Alaska Natives.Underlying incidence data for Hispanics are based on NHIA and exclude cases from the Alaska Native Registry.
- Statistic could not be calculated.A percent of 0.00 represents a value that is below 0.005.
Risk of Being Risk of Being
Race/ Current Diagnosed with Cancer Risk of Dying Race/ Current Diagnosed with Cancer Risk of Dying
Ethnicity Age +10 yrs +20 yrs +30 yrs Ever from Cancer Ethnicity Age +10 yrs +20 yrs +30 yrs Ever from Cancer
All Races 0 0.00 0.00 0.00 0.34 0.12 Asian/ 0 0.00 0.00 0.00 0.16 0.07
10 0.00 0.00 0.00 0.34 0.12 Pacific 10 0.00 0.00 0.00 0.16 0.07
20 0.00 0.00 0.02 0.34 0.12 Islander 20 0.00 0.00 0.01 0.16 0.07
30 0.00 0.02 0.07 0.35 0.12 30 0.00 0.01 0.02 0.16 0.07
40 0.02 0.07 0.17 0.35 0.12 40 0.00 0.02 0.05 0.16 0.07
50 0.06 0.16 0.27 0.34 0.12 50 0.02 0.05 0.10 0.16 0.07
60 0.11 0.23 0.29 0.30 0.12 60 0.03 0.09 0.13 0.15 0.07
70 0.13 0.20 - 0.22 0.09 70 0.06 0.10 - 0.12 0.06
80 0.09 - - 0.11 0.06 80 0.05 - - 0.08 0.05
White 0 0.00 0.00 0.00 0.35 0.12 American 0 0.00 0.00 0.00 0.21 0.07
10 0.00 0.00 0.00 0.35 0.12 Indian/ 10 0.00 0.00 0.00 0.21 0.07
20 0.00 0.00 0.02 0.35 0.12 Alaska 20 0.00 0.00 0.01 0.21 0.07
30 0.00 0.02 0.07 0.35 0.12 Nativea 30 0.00 0.01 0.05 0.22 0.07
40 0.02 0.07 0.18 0.35 0.12 40 0.01 0.05 0.11 0.22 0.07
50 0.06 0.16 0.28 0.35 0.12 50 0.04 0.10 0.16 0.22 0.07
60 0.11 0.23 0.30 0.31 0.11 60 0.06 0.13 0.19 0.19 0.07
70 0.14 0.21 - 0.22 0.09 70 0.08 0.14 - 0.14 0.05
80 0.10 - - 0.11 0.06 80 0.09 - - 0.09 0.03
Black 0 0.00 0.00 0.00 0.42 0.18 Hispanicb 0 0.00 0.00 0.00 0.28 0.11
10 0.00 0.00 0.00 0.43 0.18 10 0.00 0.00 0.00 0.28 0.11
20 0.00 0.00 0.02 0.43 0.18 20 0.00 0.00 0.01 0.28 0.11
30 0.00 0.02 0.11 0.44 0.18 30 0.00 0.01 0.04 0.28 0.12
40 0.02 0.11 0.25 0.45 0.19 40 0.01 0.04 0.10 0.28 0.12
50 0.09 0.24 0.37 0.44 0.19 50 0.03 0.10 0.20 0.28 0.12
60 0.17 0.30 0.37 0.38 0.17 60 0.07 0.17 0.24 0.26 0.11
70 0.17 0.25 - 0.26 0.14 70 0.11 0.18 - 0.20 0.10
80 0.12 - - 0.14 0.08 80 0.09 - - 0.12 0.07
Table 12.12
Cancer of the Larynx (Invasive)
Risk of Being Diagnosed With Cancer in 10, 20 and 30 Years,
Lifetime Risk of Being Diagnosed with Cancer Given Alive and Cancer-Free at Current Age, and
Lifetime Risk of Dying from Cancer Given Alive at Current Age
Both Sexes, 2011-2013 By Race/Ethnicity

SEE
R C
ancer Statistics Review
1975-2013N
ational Cancer Institute
Devcan 6.7.4, August 2016, National Cancer Institute (http://surveillance.cancer.gov/devcan/).Source: Incidence data are from the SEER 18 areas (San Francisco, Connecticut, Detroit, Hawaii, Iowa, New Mexico, Seattle, Utah, Atlanta,
San Jose-Monterey, Los Angeles, Alaska Native Registry, Rural Georgia, California excluding SF/SJM/LA, Kentucky, Louisiana, New Jersey,and Georgia excluding ATL/RG). Mortality data are from the NCHS public use data file for the total US.
a Underlying incidence and mortality data for American Indian/Alaska Native are based on the CHSDA(Contract Health Service Delivery Area)counties.
b Hispanic is not mutually exclusive from whites, blacks, Asian/Pacific Islanders, and American Indians/Alaska Natives.Underlying incidence data for Hispanics are based on NHIA and exclude cases from the Alaska Native Registry.
- Statistic could not be calculated.A percent of 0.00 represents a value that is below 0.005.
Risk of Being Risk of Being
Race/ Current Diagnosed with Cancer Risk of Dying Race/ Current Diagnosed with Cancer Risk of Dying
Ethnicity Age +10 yrs +20 yrs +30 yrs Ever from Cancer Ethnicity Age +10 yrs +20 yrs +30 yrs Ever from Cancer
All Races 0 0.00 0.00 0.00 0.57 0.20 Asian/ 0 0.00 0.00 0.00 0.29 0.13
10 0.00 0.00 0.00 0.58 0.20 Pacific 10 0.00 0.00 0.00 0.29 0.13
20 0.00 0.00 0.03 0.58 0.20 Islander 20 0.00 0.00 0.01 0.29 0.13
30 0.00 0.03 0.11 0.59 0.20 30 0.00 0.01 0.04 0.29 0.13
40 0.02 0.11 0.28 0.59 0.21 40 0.01 0.04 0.09 0.29 0.13
50 0.09 0.27 0.46 0.59 0.21 50 0.03 0.09 0.18 0.29 0.13
60 0.19 0.39 0.51 0.53 0.20 60 0.06 0.16 0.24 0.27 0.13
70 0.24 0.37 - 0.40 0.16 70 0.11 0.20 - 0.23 0.12
80 0.20 - - 0.23 0.11 80 0.11 - - 0.15 0.10
White 0 0.00 0.00 0.00 0.57 0.19 American 0 0.00 0.00 0.00 0.34 0.10
10 0.00 0.00 0.00 0.58 0.19 Indian/ 10 0.00 0.00 0.00 0.35 0.11
20 0.00 0.00 0.03 0.58 0.19 Alaska 20 0.00 0.00 0.03 0.35 0.11
30 0.00 0.03 0.11 0.59 0.19 Nativea 30 0.00 0.03 0.09 0.36 0.11
40 0.02 0.11 0.28 0.59 0.20 40 0.03 0.09 0.18 0.37 0.11
50 0.09 0.27 0.46 0.59 0.20 50 0.07 0.16 0.27 0.36 0.12
60 0.19 0.40 0.51 0.53 0.19 60 0.10 0.22 0.32 0.32 0.11
70 0.24 0.38 - 0.40 0.16 70 0.15 0.26 - 0.26 0.09
80 0.20 - - 0.23 0.11 80 0.17 - - 0.17 0.06
Black 0 0.00 0.00 0.00 0.73 0.31 Hispanicb 0 0.00 0.00 0.00 0.51 0.21
10 0.00 0.00 0.00 0.75 0.32 10 0.00 0.00 0.00 0.52 0.21
20 0.00 0.00 0.03 0.75 0.32 20 0.00 0.00 0.01 0.52 0.21
30 0.00 0.04 0.17 0.76 0.33 30 0.00 0.01 0.07 0.53 0.22
40 0.03 0.18 0.43 0.78 0.33 40 0.01 0.06 0.19 0.53 0.22
50 0.15 0.42 0.64 0.78 0.34 50 0.05 0.18 0.37 0.53 0.22
60 0.30 0.55 0.69 0.71 0.33 60 0.14 0.33 0.46 0.50 0.22
70 0.32 0.49 - 0.52 0.27 70 0.22 0.37 - 0.41 0.20
80 0.27 - - 0.31 0.20 80 0.20 - - 0.26 0.15
Table 12.13
Cancer of the Larynx (Invasive)
Risk of Being Diagnosed With Cancer in 10, 20 and 30 Years,
Lifetime Risk of Being Diagnosed with Cancer Given Alive and Cancer-Free at Current Age, and
Lifetime Risk of Dying from Cancer Given Alive at Current Age
Males, 2011-2013 By Race/Ethnicity

SEE
R C
ancer Statistics Review
1975-2013N
ational Cancer Institute
Devcan 6.7.4, August 2016, National Cancer Institute (http://surveillance.cancer.gov/devcan/).Source: Incidence data are from the SEER 18 areas (San Francisco, Connecticut, Detroit, Hawaii, Iowa, New Mexico, Seattle, Utah, Atlanta,
San Jose-Monterey, Los Angeles, Alaska Native Registry, Rural Georgia, California excluding SF/SJM/LA, Kentucky, Louisiana, New Jersey,and Georgia excluding ATL/RG). Mortality data are from the NCHS public use data file for the total US.
a Underlying incidence and mortality data for American Indian/Alaska Native are based on the CHSDA(Contract Health Service Delivery Area)counties.
b Hispanic is not mutually exclusive from whites, blacks, Asian/Pacific Islanders, and American Indians/Alaska Natives.Underlying incidence data for Hispanics are based on NHIA and exclude cases from the Alaska Native Registry.
- Statistic could not be calculated.A percent of 0.00 represents a value that is below 0.005.
Risk of Being Risk of Being
Race/ Current Diagnosed with Cancer Risk of Dying Race/ Current Diagnosed with Cancer Risk of Dying
Ethnicity Age +10 yrs +20 yrs +30 yrs Ever from Cancer Ethnicity Age +10 yrs +20 yrs +30 yrs Ever from Cancer
All Races 0 0.00 0.00 0.00 0.12 0.05 Asian/ 0 0.00 0.00 0.00 0.05 0.02
10 0.00 0.00 0.00 0.13 0.05 Pacific 10 0.00 0.00 0.00 0.06 0.02
20 0.00 0.00 0.01 0.13 0.05 Islander 20 0.00 0.00 0.00 0.06 0.02
30 0.00 0.01 0.03 0.13 0.05 30 0.00 0.00 0.00 0.06 0.02
40 0.01 0.03 0.07 0.13 0.05 40 0.00 0.00 0.02 0.06 0.02
50 0.02 0.06 0.10 0.12 0.05 50 0.00 0.01 0.03 0.05 0.02
60 0.04 0.08 0.10 0.10 0.05 60 0.01 0.03 0.04 0.05 0.02
70 0.04 0.06 - 0.07 0.04 70 0.02 0.03 - 0.04 0.02
80 0.02 - - 0.03 0.02 80 0.01 - - 0.03 0.02
White 0 0.00 0.00 0.00 0.13 0.05 American 0 0.00 0.00 0.00 0.08 0.03
10 0.00 0.00 0.00 0.13 0.05 Indian/ 10 0.00 0.00 0.00 0.08 0.03
20 0.00 0.00 0.01 0.13 0.05 Alaska 20 0.00 0.00 0.00 0.08 0.03
30 0.00 0.01 0.03 0.13 0.05 Nativea 30 0.00 0.00 0.02 0.08 0.03
40 0.01 0.03 0.07 0.13 0.05 40 0.00 0.02 0.04 0.08 0.04
50 0.02 0.06 0.10 0.12 0.05 50 0.02 0.04 0.06 0.09 0.04
60 0.04 0.08 0.10 0.10 0.04 60 0.02 0.04 0.07 0.07 0.03
70 0.05 0.07 - 0.07 0.04 70 0.02 0.05 - 0.05 0.02
80 0.03 - - 0.03 0.02 80 0.04 - - 0.04 0.00
Black 0 0.00 0.00 0.00 0.16 0.06 Hispanicb 0 0.00 0.00 0.00 0.07 0.03
10 0.00 0.00 0.00 0.16 0.06 10 0.00 0.00 0.00 0.07 0.03
20 0.00 0.00 0.01 0.16 0.06 20 0.00 0.00 0.00 0.07 0.03
30 0.00 0.01 0.05 0.16 0.06 30 0.00 0.00 0.01 0.07 0.03
40 0.01 0.05 0.10 0.16 0.07 40 0.00 0.01 0.02 0.07 0.03
50 0.04 0.09 0.14 0.16 0.07 50 0.01 0.02 0.05 0.07 0.03
60 0.05 0.10 0.12 0.13 0.06 60 0.02 0.04 0.06 0.06 0.03
70 0.05 0.08 - 0.08 0.05 70 0.03 0.04 - 0.05 0.03
80 0.03 - - 0.04 0.03 80 0.02 - - 0.03 0.02
Table 12.14
Cancer of the Larynx (Invasive)
Risk of Being Diagnosed With Cancer in 10, 20 and 30 Years,
Lifetime Risk of Being Diagnosed with Cancer Given Alive and Cancer-Free at Current Age, and
Lifetime Risk of Dying from Cancer Given Alive at Current Age
Females, 2011-2013 By Race/Ethnicity

SEER Cancer Statistics Review 1975-2013 National Cancer Institute
The AAPC is the Average Annual Percent Change over the time interval. The AAPCs are calculated bythe Joinpoint Regression Program Version 4.3.0.0, April 2016, National Cancer Institute.
- Statistic not shown. Rate based on less than 16 cases for the time interval.Trend based on less than 10 cases for at least one year within the time interval.
a Rates are age-adjusted to the 2000 US Std Population (19 age groups - Census P25-1130). Trendsare based on rates age-adjusted to the 2000 US Std Population (19 age groups - Census P25-1130).
b The SEER 9 areas are San Francisco, Connecticut, Detroit, Hawaii, Iowa, New Mexico, Seattle,Utah, and Atlanta.The SEER 13 areas comprise the SEER 9 areas plus San Jose-Monterey, Los Angeles, the AlaskaNative Registry, and Rural Georgia.The SEER 18 areas comprise the SEER 13 areas plus California excluding SF/SJM/LA, Kentucky,Louisiana, New Jersey, and Georgia excluding ATL/RG.
c The 2004-2013 AAPC estimates are based on a Joinpoint analysis with up to 4 Joinpoints overdiagnosis years 1992-2013.
d The 2004-2013 AAPC estimates are based on a Joinpoint analysis with up to 5 Joinpoints overdiagnosis years 1975-2013.
e Hispanic and Non-Hispanic are not mutually exclusive from whites, blacks, Asian/PacificIslanders, and American Indians/Alaska Natives. Incidence data for Hispanics and Non-Hispanicsare based on NHIA and exclude cases from the Alaska Native Registry. The 2004-2013 Hispanic andNon-Hispanic mortality trends exclude deaths from New Hampshire and Oklahoma.
f Incidence data for American Indian/Alaska Native are based on the CHSDA(Contract Health ServiceDelivery Area) counties.
g US Mortality Files, National Center for Health Statistics, CDC.h The 2004-2013 mortality AAPCs are based on a Joinpoint analysis using years of death 1992-2013.* The APC is significantly different from zero (p<.05).
SEER Incidence SEER 18 Areasb SEER 13 Areasb SEER 9 Areasb
Rate 2009-2013 Trend 2004-2013c Trend 2004-2013d
Rate per 100,000 persons AAPC (%) AAPC (%)
Total Males Females Total Males Females Total Males Females RACE/ETHNICITY
All Races 3.2 5.6 1.1 -2.6* -2.6* -3.1* -2.4* -2.4* -2.7*
White 3.2 5.6 1.2 -2.4* -1.8* -2.9* -2.3* -2.4* -2.4*White Hispanice 2.3 4.6 0.5 -1.7* -1.6* -3.2* - - -White Non-Hispanice 3.4 5.8 1.3 -2.4* -2.5* -2.7* - - -
Black 4.6 8.7 1.6 -3.4* -3.4* -3.4* -3.0* -2.8* -3.1*
Asian/Pacific Islander 1.2 2.3 0.3 -3.1* -3.0* -2.4 - - -
Amer Ind/Alaska Natf 2.1 3.9 - -0.1 0.5 - - - -
Hispanice 2.2 4.4 0.5 -1.7* -1.6* -3.0* - - -
U.S. Mortalityg Rate 2009-2013 Trend 2004-2013h
Rate per 100,000 persons AAPC (%)
Total Males Females Total Males FemalesRACE/ETHNICITY
All Races 1.1 1.9 0.4 -2.2* -2.5* -2.1*
White 1.0 1.8 0.4 -1.9* -2.2* -1.8*White Hispanice 0.8 1.7 0.2 -2.5* -2.7* -2.1*White Non-Hispanice 1.0 1.8 0.4 -1.8* -2.2* -1.6*
Black 1.8 3.5 0.6 -3.4* -3.4* -3.1*
Asian/Pacific Islander 0.4 0.8 0.1 -2.0* -1.3* -4.6*
Amer Ind/Alaska NatTotal U.S. 0.7 1.2 0.3 -2.8* -2.5 -CHSDA Counties 0.8 1.5 - -2.8* -2.2 -Non-CHSDA Counties 0.5 0.9 - - - -
Hispanice 0.8 1.6 0.2 -2.5* -2.7* -2.2*
Table 12.15Cancer of the Larynx (Invasive)
SEER Incidence and U.S. MortalityAge-Adjusted Rates and Trendsa
By Race/Ethnicity and Sex

SEE
R C
ancer Statistics Review
1975-2013N
ational Cancer Institute
a Rates are per 100,000 and are age-adjusted to the 2000 US Std Population (19 age groups - Census P25-1130)b The SEER 9 areas are San Francisco, Connecticut, Detroit, Hawaii, Iowa, New Mexico, Seattle, Utah and Atlanta.
The SEER 13 areas comprise the SEER 9 areas plus San Jose-Monterey, Los Angeles, the Alaska Native Registry and Rural Georgia.The SEER 18 areas comprise the SEER 13 areas plus California excluding SF/SJM/LA, Kentucky, Louisiana, New Jersey andGeorgia excluding ATL/RG.
- Statistic not shown. Rate based on less than 16 cases for the time interval.
All Races Whites Blacks Total Males Females Total Males Females Total Males Females
SEER Incidence Ratesa, 2009-2013
California 2.26 4.14 0.72 2.38 4.32 0.76 3.49 6.37 1.27Greater Bay Area 2.03 3.88 0.53 2.21 4.15 0.58 3.90 7.61 -San Francisco-Oakland 2.06 3.87 0.58 2.16 3.93 0.63 3.90 7.59 -San Jose-Monterey 1.98 3.91 0.43 2.31 4.55 0.48 - - -
Los Angeles 2.24 4.18 0.69 2.37 4.44 0.68 3.40 6.03 1.49Greater California 2.35 4.22 0.80 2.43 4.33 0.84 3.37 6.09 1.10
Connecticut 3.61 6.55 1.26 3.52 6.28 1.28 4.90 10.01 -Detroit 4.24 7.41 1.72 4.00 6.89 1.62 5.51 10.29 2.22Georgia 4.10 7.39 1.43 4.11 7.19 1.52 4.41 8.65 1.40Atlanta 3.14 6.18 0.86 3.14 6.13 0.82 3.37 6.57 1.10Rural Georgia 4.67 8.42 - 4.10 7.73 - 5.10 - -Greater Georgia 4.55 7.95 1.72 4.47 7.59 1.79 5.15 10.05 1.61
Hawaii 2.38 4.43 0.62 3.70 6.11 1.18 - - -Iowa 4.08 7.13 1.44 4.09 7.15 1.45 - - -Kentucky 5.73 9.57 2.47 5.70 9.42 2.51 7.24 13.51 2.65Louisiana 5.25 9.04 2.12 4.94 8.25 2.11 6.41 11.99 2.28New Jersey 3.29 5.87 1.27 3.36 5.91 1.34 3.75 7.22 1.40New Mexico 2.42 4.45 0.69 2.48 4.53 0.72 - - -Seattle-Puget Sound 2.62 4.53 1.01 2.64 4.55 1.01 4.78 7.13 -Utah 1.67 2.77 0.70 1.67 2.75 0.70 - - -
SEER 9 Areasb 3.01 5.38 1.05 3.05 5.37 1.09 4.42 8.42 1.58SEER 13 Areasb 2.78 5.04 0.93 2.87 5.14 0.97 4.17 7.82 1.54SEER 18 Areasb 3.16 5.61 1.14 3.21 5.62 1.19 4.59 8.65 1.63
Table 12.16Cancer of the Larynx (Invasive)
Age-Adjusted SEER Incidence Ratesa
By Registry, Race and Sex

SEE
R C
ancer Statistics Review
1975-2013N
ational Cancer Institute
a US Mortality Files, National Center for Health Statistics, Centers for Disease Control and Prevention.Rates are per 100,000 and are age-adjusted to the 2000 US Std Population (19 age groups - Census P25-1130).
b The SEER 9 areas are San Francisco, Connecticut, Detroit, Hawaii, Iowa, New Mexico, Seattle, Utah and Atlanta.The SEER 13 areas comprise the SEER 9 areas plus San Jose-Monterey, Los Angeles, the Alaska Native Registry and Rural Georgia.The SEER 18 areas comprise the SEER 13 areas plus California excluding SF/SJM/LA, Kentucky, Louisiana, New Jersey andGeorgia excluding ATL/RG.
- Statistic not shown. Rate based on less than 16 cases for the time interval.
All Races Whites Blacks Total Males Females Total Males Females Total Males Females
SEER Death Ratesa, 2009-2013
California 0.78 1.45 0.26 0.82 1.49 0.29 1.47 2.88 0.46Greater Bay Area 0.64 1.26 0.17 0.68 1.30 0.21 1.41 3.09 -San Francisco-Oakland 0.63 1.23 0.18 0.63 1.16 0.23 1.49 3.32 -San Jose-Monterey 0.66 1.33 - 0.77 1.55 - - - -
Los Angeles 0.76 1.51 0.20 0.75 1.45 0.19 1.70 3.42 0.62Greater California 0.85 1.50 0.32 0.89 1.57 0.34 1.23 2.18 -
Connecticut 0.86 1.59 0.31 0.82 1.55 0.26 1.53 2.52 -Detroit 1.25 2.22 0.54 1.02 1.86 0.39 2.23 3.90 1.09Georgia 1.07 1.96 0.38 1.00 1.77 0.38 1.35 2.78 0.39Atlanta 0.83 1.57 0.30 0.76 1.39 - 1.01 2.03 -Rural Georgia 1.82 - - - - - - - -Greater Georgia 1.15 2.08 0.41 1.08 1.89 0.42 1.50 3.09 0.41
Hawaii 0.82 1.63 - 1.13 2.04 - - - -Iowa 0.93 1.65 0.37 0.94 1.65 0.36 - - -Kentucky 1.45 2.48 0.65 1.40 2.38 0.64 2.40 4.49 -Louisiana 1.33 2.33 0.55 1.20 1.96 0.60 1.70 3.52 0.43New Jersey 1.14 1.96 0.51 1.11 1.91 0.49 1.74 3.14 0.87New Mexico 0.88 1.56 0.30 0.92 1.60 0.33 - - -Seattle-Puget Sound 0.94 1.62 0.39 0.97 1.65 0.42 - - -Utah 0.34 0.56 - 0.33 0.56 - - - -
SEER 9 Areasb 0.86 1.56 0.32 0.83 1.49 0.31 1.60 3.01 0.62SEER 13 Areasb 0.83 1.54 0.28 0.82 1.49 0.28 1.64 3.14 0.62SEER 18 Areasb 0.95 1.71 0.36 0.94 1.66 0.37 1.63 3.14 0.59
Total U.S. 1.05 1.88 0.39 1.01 1.78 0.38 1.76 3.46 0.59
Table 12.17Cancer of the Larynx (Invasive)
Age-Adjusted SEER Death Ratesa
By Registry, Race and Sex

SEER Cancer Statistics Review 1975-2013 National Cancer Institute
a US Mortality Files, National Center for Health Statistics, Centers for Disease Control andPrevention. Rates are per 100,000 and are age-adjusted to the 2000 US Std Population (19age groups - Census P25-1130).
b Difference between state rate and total U.S. rate is statistically significant (p<=.0002).c Absolute percent difference between state rate and total U.S. rate is 15% or more.d Rank of state level death rate and the 95% confidence intervals (low, high) for the rank.SE Standard error of the rate.PD Percent difference between state rate and total U.S. rate.- Statistic not shown. Rate based on less than 16 cases for the time interval.
State Rate SE Rank(CI)d PD TOTAL U.S. 1.05 0.01
High Five StatesD.C. 1.69 0.24 01(01,28) 60.32c
West Virginia 1.60 0.12 02(01,10) 52.11c
Kentucky 1.45 0.08 03(01,13) 37.88c
Tennessee 1.36 0.06 04(01,15) 29.47c
Louisiana 1.33 0.07 05(01,22) 26.16c
Low Five StatesIdaho 0.69 0.09 47(31,50) -34.75c
Wyoming 0.68 0.15 48(14,51) -35.40c
Colorado 0.66 0.05 49(39,50) -37.37c
South Dakota 0.65 0.12 50(27,51) -38.43c
Utah 0.34 0.06 51(50,51) -67.50c
State Rate SE Rank(CI)d PD State Rate SE Rank(CI)d PD
Alabama 1.31 0.07 06(02,23) 24.75c Montana 1.13 0.14 21(02,45) 7.07Alaska 0.91 0.20 34(02,50) -13.35 Nebraska 0.84 0.09 39(18,50) -19.99c
Arizona 0.79 0.05 42(32,49) -24.41c Nevada 0.91 0.08 35(15,47) -13.51Arkansas 0.94 0.07 32(15,46) -10.52 New Hampshire 1.04 0.12 28(03,47) -0.68California 0.78 0.02 43(36,47) -25.38c New Jersey 1.14 0.05 19(08,30) 8.00Colorado 0.66 0.05 49(39,50) -37.37c New Mexico 0.88 0.09 37(15,50) -16.55c
Connecticut 0.86 0.06 38(25,48) -17.75c New York 1.14 0.03 18(10,29) 8.07Delaware 1.07 0.14 26(02,48) 1.62 North Carolina 1.11 0.05 24(10,32) 5.81D.C. 1.69 0.24 01(01,28) 60.32c North Dakota 1.16 0.17 16(01,47) 9.98Florida 1.16 0.03 15(09,27) 10.02 Ohio 1.31 0.04 07(03,16) 24.40c
Georgia 1.07 0.05 27(12,35) 1.55 Oklahoma 0.97 0.07 30(15,44) -7.93Hawaii 0.82 0.10 41(18,50) -22.21c Oregon 0.74 0.06 44(33,50) -29.16c
Idaho 0.69 0.09 47(31,50) -34.75c Pennsylvania 1.12 0.04 22(10,30) 6.88Illinois 1.18 0.04 12(06,26) 12.27 Rhode Island 1.13 0.14 20(02,44) 7.89Indiana 1.15 0.06 17(06,31) 9.06 South Carolina 1.28 0.07 09(02,26) 21.52c
Iowa 0.93 0.07 33(17,46) -11.22 South Dakota 0.65 0.12 50(27,51) -38.43c
Kansas 0.74 0.07 45(31,50) -29.92c Tennessee 1.36 0.06 04(01,15) 29.47c
Kentucky 1.45 0.08 03(01,13) 37.88c Texas 1.11 0.03 25(12,30) 5.77Louisiana 1.33 0.07 05(01,22) 26.16c Utah 0.34 0.06 51(50,51) -67.50c
Maine 1.31 0.12 08(01,32) 24.16c Vermont 1.16 0.18 14(01,47) 10.65Maryland 1.17 0.06 13(05,30) 11.52 Virginia 1.00 0.05 29(16,39) -4.59Massachusetts 0.96 0.05 31(21,41) -8.88 Washington 0.89 0.05 36(26,45) -15.20c
Michigan 1.20 0.05 11(05,26) 13.89 West Virginia 1.60 0.12 02(01,10) 52.11c
Minnesota 0.71 0.05 46(36,50) -32.05c Wisconsin 0.83 0.05 40(29,48) -21.27c
Mississippi 1.26 0.09 10(02,30) 19.69c Wyoming 0.68 0.15 48(14,51) -35.40c
Missouri 1.12 0.06 23(07,33) 6.15
Table 12.18Cancer of the Larynx (Invasive)
Age-Adjusted Cancer Deatha Rates By State, All Races, 2009-2013
Males and Females

SEER Cancer Statistics Review 1975-2013 National Cancer Institute
a US Mortality Files, National Center for Health Statistics, Centers for Disease Control andPrevention. Rates are per 100,000 and are age-adjusted to the 2000 US Std Population (19age groups - Census P25-1130).
b Difference between state rate and total U.S. rate is statistically significant (p<=.0002).c Absolute percent difference between state rate and total U.S. rate is 15% or more.d Rank of state level death rate and the 95% confidence intervals (low, high) for the rank.SE Standard error of the rate.PD Percent difference between state rate and total U.S. rate.- Statistic not shown. Rate based on less than 16 cases for the time interval.
State Rate SE Rank(CI)d PD TOTAL U.S. 1.88 0.02
High Five StatesD.C. 3.08 0.51 01(01,33) 63.79c
West Virginia 2.56 0.22 02(01,25) 36.17c
Kentucky 2.48 0.15 03(01,19) 31.64c
South Carolina 2.46 0.15 04(01,19) 30.72c
Tennessee 2.43 0.13 05(01,18) 28.82c
Low Five StatesWyoming 1.21 0.29 47(12,51) -35.67c
South Dakota 1.20 0.24 48(21,51) -36.28c
Idaho 1.15 0.17 49(31,51) -39.17c
Colorado 1.08 0.10 50(41,50) -42.45c
Utah 0.56 0.11 51(49,51) -70.05c
State Rate SE Rank(CI)d PD State Rate SE Rank(CI)d PD
Alabama 2.40 0.14 06(01,22) 27.31c Montana 1.94 0.27 25(01,48) 3.07Alaska 1.55 0.38 38(01,51) -17.60c Nebraska 1.53 0.19 40(13,50) -18.54c
Arizona 1.37 0.09 43(32,49) -26.97c Nevada 1.58 0.16 36(15,49) -16.26c
Arkansas 1.69 0.15 31(12,46) -10.15 New Hampshire 1.84 0.24 28(02,48) -2.22California 1.45 0.04 42(33,46) -22.78c New Jersey 1.96 0.10 24(09,33) 4.08Colorado 1.08 0.10 50(41,50) -42.45c New Mexico 1.56 0.17 37(14,49) -17.23c
Connecticut 1.59 0.13 35(20,48) -15.39c New York 2.06 0.07 15(08,28) 9.45Delaware 1.72 0.27 30(03,50) -8.65 North Carolina 2.04 0.09 18(07,31) 8.11D.C. 3.08 0.51 01(01,33) 63.79c North Dakota 2.04 0.34 17(01,49) 8.26Florida 2.07 0.06 14(09,27) 9.93 Ohio 2.29 0.09 10(02,20) 21.66c
Georgia 1.96 0.10 23(08,34) 4.20 Oklahoma 1.76 0.14 29(11,44) -6.47Hawaii 1.63 0.21 34(08,49) -13.53 Oregon 1.33 0.12 44(30,50) -29.38c
Idaho 1.15 0.17 49(31,51) -39.17c Pennsylvania 1.99 0.08 21(10,31) 5.50Illinois 2.19 0.09 11(04,25) 16.46c Rhode Island 1.86 0.27 27(02,49) -1.46Indiana 1.99 0.11 22(07,34) 5.50 South Carolina 2.46 0.15 04(01,19) 30.72c
Iowa 1.65 0.14 33(15,47) -12.50 South Dakota 1.20 0.24 48(21,51) -36.28c
Kansas 1.28 0.14 46(31,50) -31.87c Tennessee 2.43 0.13 05(01,18) 28.82c
Kentucky 2.48 0.15 03(01,19) 31.64c Texas 2.05 0.06 16(08,28) 9.11Louisiana 2.33 0.15 08(01,26) 23.99c Utah 0.56 0.11 51(49,51) -70.05c
Maine 2.35 0.24 07(01,32) 24.94c Vermont 2.01 0.34 19(01,49) 6.51Maryland 2.15 0.13 12(03,30) 14.06 Virginia 1.88 0.10 26(11,37) -0.41Massachusetts 1.67 0.10 32(20,44) -11.17 Washington 1.54 0.10 39(27,47) -18.08c
Michigan 2.11 0.09 13(05,28) 12.33 West Virginia 2.56 0.22 02(01,25) 36.17c
Minnesota 1.32 0.10 45(33,50) -29.71c Wisconsin 1.48 0.10 41(28,48) -21.36c
Mississippi 2.30 0.18 09(01,29) 22.22c Wyoming 1.21 0.29 47(12,51) -35.67c
Missouri 1.99 0.12 20(07,34) 5.57
Table 12.19Cancer of the Larynx (Invasive)
Age-Adjusted Cancer Deatha Rates By State, All Races, 2009-2013
Males
SEER Cancer Statistics Review 1975-2013 National Cancer Institute
a US Mortality Files, National Center for Health Statistics, Centers for Disease Control andPrevention. Rates are per 100,000 and are age-adjusted to the 2000 US Std Population (19age groups - Census P25-1130).
b Difference between state rate and total U.S. rate is statistically significant (p<=.0002).c Absolute percent difference between state rate and total U.S. rate is 15% or more.d Rank of state level death rate and the 95% confidence intervals (low, high) for the rank.SE Standard error of the rate.PD Percent difference between state rate and total U.S. rate.- Statistic not shown. Rate based on less than 16 cases for the time interval.
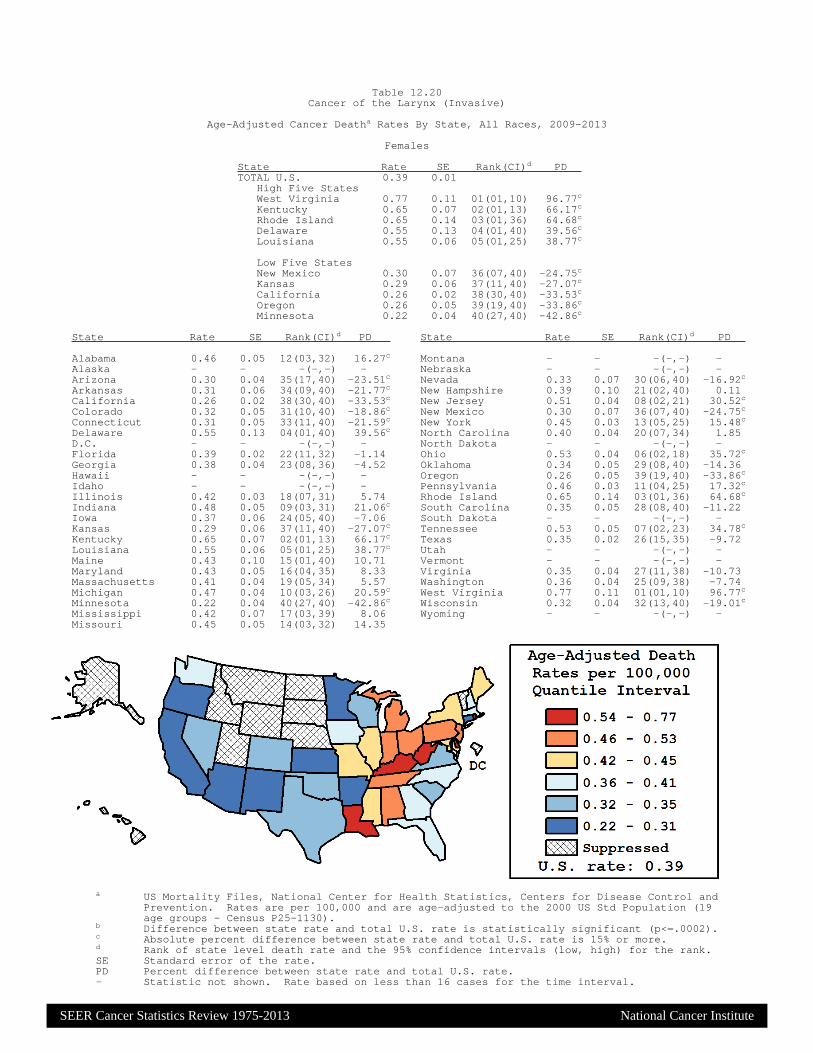
State Rate SE Rank(CI)d PD TOTAL U.S. 0.39 0.01
High Five StatesWest Virginia 0.77 0.11 01(01,10) 96.77c
Kentucky 0.65 0.07 02(01,13) 66.17c
Rhode Island 0.65 0.14 03(01,36) 64.68c
Delaware 0.55 0.13 04(01,40) 39.56c
Louisiana 0.55 0.06 05(01,25) 38.77c
Low Five StatesNew Mexico 0.30 0.07 36(07,40) -24.75c
Kansas 0.29 0.06 37(11,40) -27.07c
California 0.26 0.02 38(30,40) -33.53c
Oregon 0.26 0.05 39(19,40) -33.86c
Minnesota 0.22 0.04 40(27,40) -42.86c
State Rate SE Rank(CI)d PD State Rate SE Rank(CI)d PD
Alabama 0.46 0.05 12(03,32) 16.27c Montana - - -(-,-) -Alaska - - -(-,-) - Nebraska - - -(-,-) -Arizona 0.30 0.04 35(17,40) -23.51c Nevada 0.33 0.07 30(06,40) -16.92c
Arkansas 0.31 0.06 34(09,40) -21.77c New Hampshire 0.39 0.10 21(02,40) 0.11California 0.26 0.02 38(30,40) -33.53c New Jersey 0.51 0.04 08(02,21) 30.52c
Colorado 0.32 0.05 31(10,40) -18.86c New Mexico 0.30 0.07 36(07,40) -24.75c
Connecticut 0.31 0.05 33(11,40) -21.59c New York 0.45 0.03 13(05,25) 15.48c
Delaware 0.55 0.13 04(01,40) 39.56c North Carolina 0.40 0.04 20(07,34) 1.85D.C. - - -(-,-) - North Dakota - - -(-,-) -Florida 0.39 0.02 22(11,32) -1.14 Ohio 0.53 0.04 06(02,18) 35.72c
Georgia 0.38 0.04 23(08,36) -4.52 Oklahoma 0.34 0.05 29(08,40) -14.36Hawaii - - -(-,-) - Oregon 0.26 0.05 39(19,40) -33.86c
Idaho - - -(-,-) - Pennsylvania 0.46 0.03 11(04,25) 17.32c
Illinois 0.42 0.03 18(07,31) 5.74 Rhode Island 0.65 0.14 03(01,36) 64.68c
Indiana 0.48 0.05 09(03,31) 21.06c South Carolina 0.35 0.05 28(08,40) -11.22Iowa 0.37 0.06 24(05,40) -7.06 South Dakota - - -(-,-) -Kansas 0.29 0.06 37(11,40) -27.07c Tennessee 0.53 0.05 07(02,23) 34.78c
Kentucky 0.65 0.07 02(01,13) 66.17c Texas 0.35 0.02 26(15,35) -9.72Louisiana 0.55 0.06 05(01,25) 38.77c Utah - - -(-,-) -Maine 0.43 0.10 15(01,40) 10.71 Vermont - - -(-,-) -Maryland 0.43 0.05 16(04,35) 8.33 Virginia 0.35 0.04 27(11,38) -10.73Massachusetts 0.41 0.04 19(05,34) 5.57 Washington 0.36 0.04 25(09,38) -7.74Michigan 0.47 0.04 10(03,26) 20.59c West Virginia 0.77 0.11 01(01,10) 96.77c
Minnesota 0.22 0.04 40(27,40) -42.86c Wisconsin 0.32 0.04 32(13,40) -19.01c
Mississippi 0.42 0.07 17(03,39) 8.06 Wyoming - - -(-,-) -Missouri 0.45 0.05 14(03,32) 14.35
Table 12.20Cancer of the Larynx (Invasive)
Age-Adjusted Cancer Deatha Rates By State, All Races, 2009-2013
Females

SEE
R C
ancer Statistics Review
1975-2013N
ational Cancer Institute
a US 2013 cancer prevalence counts are based on 2013 cancer prevalence proportions from the SEER registries and 1/1/2013US population estimates based on the average of 2012 and 2013 population estimates from the US Bureau of the Census.Prevalence was calculated using the First Malignant Primary Only for a person.
b c d Statistics based on (b) SEER 9 Areas (c) SEER 13 Areas excluding the Alaska Native Registry(d) NHIA for Hispanic for SEER 13 Areas excluding the Alaska Native Registry.
e Maximum limited-duration prevalence: 38 years for 1975-2013 SEER 9 data; 21 years for 1992-2013 SEER 13 data(excluding the Alaska Navtive Registry) used to calculate prevalence for Hispanics and Asian Pacific Islanders.
f Percentages are age-adjusted to the 2000 US Standard Population (19 age groups - Census P25-1130) by 5-year age groups.g h i (g) Cases diagnosed more than 38 years ago were estimated using the completeness index method (Capocaccia et. al. 1997,
Merrill et. al. 2000). (h) Complete prevalence is obtained by summing 0 to <38 and >=38. (i) Age-specific completeness indexwas approximated using empirical data from historical Connecticut tumor registry.
- Statistic not shown. Statistic based on fewer than 5 cases estimated alive in SEER for the time interval.+ Not available.
Years Since Diagnosis 0 to <5 5 to <10 10 to <15 15 to <20 20 to <25 25 to <30 0 to <21e 0 to <38e >=38g Completeh
Race Sex All Racesb Both Sexes 32,033 19,496 14,224 9,251 6,278 3,797 79,147 87,910 1,171 89,081
Males 25,889 15,426 11,526 7,418 4,999 3,094 63,539 70,533 955 71,488Females 6,144 4,070 2,698 1,833 1,279 703 15,608 17,377 216 17,593
Whiteb Both Sexes 26,843 16,515 12,110 8,088 5,454 3,285 67,159 74,794 910 75,704Males 21,712 13,117 9,861 6,465 4,412 2,738 54,015 60,217 739 60,956Females 5,131 3,398 2,249 1,623 1,042 547 13,144 14,577 171 14,748
Blackb Both Sexes 4,140 2,465 1,668 954 673 411 9,688 10,547 80 10,627Males 3,271 1,866 1,280 793 495 295 7,568 8,188 69 8,257Females 869 599 388 161 178 116 2,120 2,359 11 2,370
Asian/ Both Sexes 568 346 251 + + + 1,330 + + +Pacific Males 484 298 214 + + + 1,143 + + +Islanderc Females 84 48 37 + + + 187 + + +
Hispanicd Both Sexes 1,894 1,093 882 + + + 4,362 + + +Males 1,650 910 718 + + + 3,692 + + +Females 244 183 164 + + + 670 + + +
Age Specific (Crude) Age-Adjustedf Age at Prevalence All Ages 0-9 10-19 20-29 30-39 40-49 50-59 60-69 70-79 80+ All Ages
Race Sex All Racesc Both Sexes 0.0206% - - 0.0003% 0.0009% 0.0051% 0.0259% 0.0683% 0.1205% 0.0998% 0.0193%
Males 0.0339% - - 0.0004% 0.0011% 0.0070% 0.0405% 0.1184% 0.2253% 0.2238% 0.0353%Females 0.0075% - - - 0.0008% 0.0032% 0.0120% 0.0230% 0.0351% 0.0257% 0.0066%
Whitec Both Sexes 0.0229% - - 0.0003% 0.0010% 0.0059% 0.0278% 0.0721% 0.1263% 0.1037% 0.0204%Males 0.0373% - - 0.0005% 0.0012% 0.0078% 0.0429% 0.1229% 0.2331% 0.2290% 0.0366%Females 0.0085% - - - 0.0009% 0.0038% 0.0128% 0.0246% 0.0369% 0.0278% 0.0071%
Blackc Both Sexes 0.0214% - - - 0.0014% 0.0046% 0.0361% 0.0939% 0.1728% 0.1094% 0.0257%Males 0.0352% - - - 0.0021% 0.0068% 0.0550% 0.1698% 0.3448% 0.2863% 0.0500%Females 0.0087% - - - - 0.0027% 0.0196% 0.0347% 0.0528% 0.0224% 0.0091%
Asian/ Both Sexes 0.0086% - - - - 0.0017% 0.0072% 0.0278% 0.0537% 0.0676% 0.0087%Pacific Males 0.0155% - - - - 0.0027% 0.0135% 0.0535% 0.1057% 0.1563% 0.0175%Islanderc Females 0.0023% - - - - - 0.0017% 0.0067% 0.0133% 0.0133% 0.0022%
Hispanicd Both Sexes 0.0083% - - 0.0004% 0.0007% 0.0033% 0.0151% 0.0429% 0.1000% 0.0984% 0.0148%Males 0.0140% - - 0.0007% 0.0008% 0.0048% 0.0250% 0.0790% 0.2061% 0.2268% 0.0294%Females 0.0026% - - - - 0.0017% 0.0057% 0.0118% 0.0213% 0.0211% 0.0039%
Table 12.21Cancer of the Larynx (Invasive)
Estimated United States Cancer Prevalence Countsa on January 1, 2013By Race/Ethnicity, Sex and Years Since Diagnosis
Estimated prevalence percenta on January 1, 2013, of the SEERc population diagnosed in the previous 21 yearsBy Age at Prevalence, Race/Ethnicity and Sex

0
5
10
15
20
1975 1990 2000 20130
5
10
15
20
1975 1990 2000 20130
1
2
3
4
5
1975 1990 2000 20130
1
2
3
4
5
1975 1990 2000 2013
Delay-Adj IncidenceDelay-Adj Incidence
Observed IncidenceObserved Incidence
MortalityMortality
SEER Observed Incidence, SEER Delay Adjusted Incidence and US Death RatesCancer of the Larynx, by Race and Sex
a
Figure 12.1
Source: SEER 9 areas and US Mortality Files (National Center for Health Statistics, CDC).Rates are age-adjusted to the 2000 US Std Population (19 age groups - Census P25-1103).Regression lines and APCs are calculated using the Joinpoint Regression Program Version 4.3.0.0, April 2016, National Cancer Institute.The APC is the Annual Percent Change for the regression line segments. The APC shown on the graph is for the most recent trend.The APC is significantly different from zero (p < 0.05).
a
*
White Male Black Male White Female Black FemaleRate per 100,000 Rate per 100,000 Rate per 100,000 Rate per 100,000
Year of Diagnosis/Death Year of Diagnosis/Death Year of Diagnosis/Death Year of Diagnosis/Death
SEER Incidence APCsDelay Adj, 1985-13 = -2.4*Observed, 1985-13 = -2.4*
US Mortality APC1993-13 = -2.2*
SEER Incidence APCsDelay Adj, 1990-13 = -2.8*Observed, 1990-13 = -2.8*
US Mortality APC1994-13 = -3.6*
SEER Incidence APCsDelay Adj, 1989-13 = -2.4*Observed, 1989-13 = -2.4*
US Mortality APC1992-13 = -1.8*
SEER Incidence APCsDelay Adj, 1989-13 = -3.1*Observed, 1989-13 = -3.1*
US Mortality APC1993-13 = -3.2*
SEE
R C
ancer Statistics Review
1975-2013N
ational Cancer Institute

Joinpoint Analyses for Whites and Blacks from 1975-2013and for Asian/Pacific Islanders, American Indians/Alaska Natives and Hispanics from 1992-2013
0
1
2
3
4
5
6
7
8
9
10
1975 1980 1985 1990 1995 2000 2005 20130
1
2
3
4
5
6
7
8
9
10
1975 1980 1985 1990 1995 2000 2005 2013
White
Black
API
AI/AN
Hispanic
SEER Incidence and US Death RatesCancer of the Larynx, Both Sexes
Figure 12.2
Source: Incidence data for whites and blacks are from the SEER 9 areas (San Francisco, Connecticut, Detroit, Hawaii, Iowa, New Mexico, Seattle, Utah, Atlanta).Incidence data for Asian/Pacific Islanders, American Indians/Alaska Natives and Hispanics are from the SEER 13 Areas (SEER 9 Areas, San Jose-Monterey,Los Angeles, Alaska Native Registry and Rural Georgia). Mortality data are from US Mortality Files, National Center for Health Statistics, CDC.Rates are age-adjusted to the 2000 US Std Population (19 age groups - Census P25-1103).Regression lines are calculated using the Joinpoint Regression Program Version 4.3.0.0, April 2016, National Cancer Institute. Joinpoint analyses for Whites andBlacks during the 1975-2013 period allow a maximum of 5 joinpoints. Analyses for other ethnic groups during the period 1992-2013 allow a maximum of 4 joinpoints.API = Asian/Pacific Islander.AI/AN = American Indian/Alaska Native. Rates for American Indian/Alaska Native are based on the CHSDA(Contract Health Service Delivery Area) counties.Hispanic is not mutually exclusive from whites, blacks, Asian/Pacific Islanders, and American Indians/Alaska Natives. Incidence data for Hispanics are based onNHIA and exclude cases from the Alaska Native Registry. Mortality data for Hispanics exclude cases from New Hampshire and Oklahoma.
Incidence MortalityRate per 100,000 Rate per 100,000
Year of Diagnosis Year of Death
a
d
a
b
c
c
b
d
SEE
R C
ancer Statistics Review
1975-2013N
ational Cancer Institute

0
5
10
15
20
1975 1990 2000 20130
5
10
15
20
1975 1990 2000 20130
5
10
15
20
1975 1990 2000 2013
SEER 9 Delay-Adj. IncidenceSEER 9 Delay-Adj. Incidence SEER 9 Observed IncidenceSEER 9 Observed Incidence SEER 13 Delay-Adj. IncidenceSEER 13 Delay-Adj. Incidence SEER 13 Observed IncidenceSEER 13 Observed Incidence
SEER Observed Incidence and SEER Delay Adjusted Incidence RatesSEER 9 Areas Compared to SEER 13 Areas
Cancer of the Larynx, Male, by Race
aFigure 12.3
Source: SEER 9 areas and SEER 13 areas.Rates are age-adjusted to the 2000 US Std Population (19 age groups - Census P25-1103).Regression lines and APCs are calculated using the Joinpoint Regression Program Version 4.3.0.0, April 2016, National Cancer Institute.The APC is the Annual Percent Change for the regression line segments. The APC shown on the graph is for the most recent trend.The APC is significantly different from zero (p < 0.05).
a
*
All Races White BlackRate per 100,000 Rate per 100,000 Rate per 100,000
Year of Diagnosis Year of Diagnosis Year of Diagnosis
SEER 9 APCsDelay Adj, 1985-13 = -2.4*Observed, 1986-13 = -2.4*
SEER 13 APCsDelay Adj, 1992-13 = -2.6*Observed, 1992-13 = -2.6*
SEER 9 APCsDelay Adj, 1985-13 = -2.4*Observed, 1985-13 = -2.4*
SEER 13 APCsDelay Adj, 2002-13 = -1.7*Observed, 2002-13 = -1.8*
SEER 9 APCsDelay Adj, 1990-13 = -2.8*Observed, 1990-13 = -2.8*
SEER 13 APCsDelay Adj, 1992-13 = -3.4*Observed, 1992-13 = -3.4*
SEE
R C
ancer Statistics Review
1975-2013N
ational Cancer Institute

0
1
2
3
4
5
1975 1990 2000 20130
1
2
3
4
5
1975 1990 2000 20130
1
2
3
4
5
1975 1990 2000 2013
SEER 9 Delay-Adj. IncidenceSEER 9 Delay-Adj. Incidence SEER 9 Observed IncidenceSEER 9 Observed Incidence SEER 13 Delay-Adj. IncidenceSEER 13 Delay-Adj. Incidence SEER 13 Observed IncidenceSEER 13 Observed Incidence
SEER Observed Incidence and SEER Delay Adjusted Incidence RatesSEER 9 Areas Compared to SEER 13 Areas
Cancer of the Larynx, Female, by Race
aFigure 12.4
Source: SEER 9 areas and SEER 13 areas.Rates are age-adjusted to the 2000 US Std Population (19 age groups - Census P25-1103).Regression lines and APCs are calculated using the Joinpoint Regression Program Version 4.3.0.0, April 2016, National Cancer Institute.The APC is the Annual Percent Change for the regression line segments. The APC shown on the graph is for the most recent trend.The APC is significantly different from zero (p < 0.05).
a
*
All Races White BlackRate per 100,000 Rate per 100,000 Rate per 100,000
Year of Diagnosis Year of Diagnosis Year of Diagnosis
SEER 9 APCsDelay Adj, 1989-13 = -2.6*Observed, 1989-13 = -2.7*
SEER 13 APCsDelay Adj, 1992-13 = -3.1*Observed, 1992-13 = -3.1*
SEER 9 APCsDelay Adj, 1989-13 = -2.4*Observed, 1989-13 = -2.4*
SEER 13 APCsDelay Adj, 1992-13 = -2.9*Observed, 1992-13 = -2.9*
SEER 9 APCsDelay Adj, 1989-13 = -3.1*Observed, 1989-13 = -3.1*
SEER 13 APCsDelay Adj, 1992-13 = -3.4*Observed, 1992-13 = -3.4*
SEE
R C
ancer Statistics Review
1975-2013N
ational Cancer Institute

Figure 12.5
Cancer of the Larynx5-Year SEER Conditional Relative Survival and
95% Confidence Intervals
Source: SEER 18 areas (San Francisco, Connecticut, Detroit, Hawaii, Iowa, New Mexico, Seattle, Utah, Atlanta,San Jose-Monterey, Los Angeles, Alaska Native Registry, Rural Georgia, California excluding SF/SJM/LA,Kentucky, Louisiana, New Jersey and Georgia excluding ATL/RG). California excluding SF/SJM/LA, Kentucky,Louisiana, New Jersey and Georgia excluding ATL/RG contribute cases for diagnosis years 2000 and later.The remaining 13 SEER Areas contribute cases for the entire time period.Percent surviving is not shown if based on less than 25 cases.Confidence intervals are not shown if length of the confidence interval is greater than 5 times the standard error.
0
20
40
60
80
100Percent Surviving Next 5 Years
Stage at Diagnosis
Probabilty of surviving the next 5 years given the cohort has already survived 0, 1, or 3 years
1998-2012 by stage at diagnosis
Survival Time Since Diagnosis
Localized Regional Distant Unstaged
0 year (at diagnosis) 1 year 3 years
SEER Cancer Statistics Review 1975-2013 National Cancer Institute