segmentation of high resolution satellite images spot ...jocelyn.chanussot/publis/ieee... ·...
TRANSCRIPT
Segmentation of high resolution satellite imagesSPOT applied to lake detection.
Tarek Habib, Michel Gay, Jocelyn Chanussot and Pascal BertolinoSignals and Images Laboratory – LIS, Grenoble
LIS / ENSIEG – Domaine Universitaire – BP 46 – 38402 Saint-Martin-d’Hères Cedex, Francee-mail: [email protected]
Abstract— High resolution satellite imagery are widelyused in many applications. One of the main applicationsis planet monitoring for hazard assessment. The objectiveof our study is to develop segmentation methods of space-borne remote sensing images capable of detecting lakesover large areas in high mountainous regions. In thiscontext three different methods are investigated on aSPOT2 image, namely: the spectral angle mapper, theirregular pyramid and the watershed with markers. Eachmethod having its own characteristics, we propose toaggregate the three algorithms and thus improve thesegmentation result. In this paper, first we present eachone of these methods and the results obtained, then wepresent the fusion architecture and the result obtained bythe comibation of the three methods.
Index Terms— Lake detection, segmentation, spectralangle mapper, irregular pyramid, watershed with markers.
I. INTRODUCTION
The use of remote sensing imagery for planet mon-itoring as well as for updating geographical systemsdatabases is quite common these days. With the launchof many satellites every year, new performing methodsfor extracting information from the provided imagesare still needed. In this paper we are interested in thedetection of lakes in high mountainous remote areas,these areas being very difficult for human access, theuse of remote sensing imagery is especially interesting.The paper is devided into four parts, the first part isdedicated to presenting the study area, then each oneof the tested methods, namely: Spectral Angle Mapper,Irregular pyramid and Watershed respectively, as well asthe results obtained. The second part presents the resultsobtained from the combination of the three methods.Finally the conclusion is drawn in the final part.
II. SEGMENTATION METHODS AND EXPERIMENTAL
RESULTS
A. Study area
The study area considered in this paper is a4067.21km2 area located at the borders between France
(a) (b)
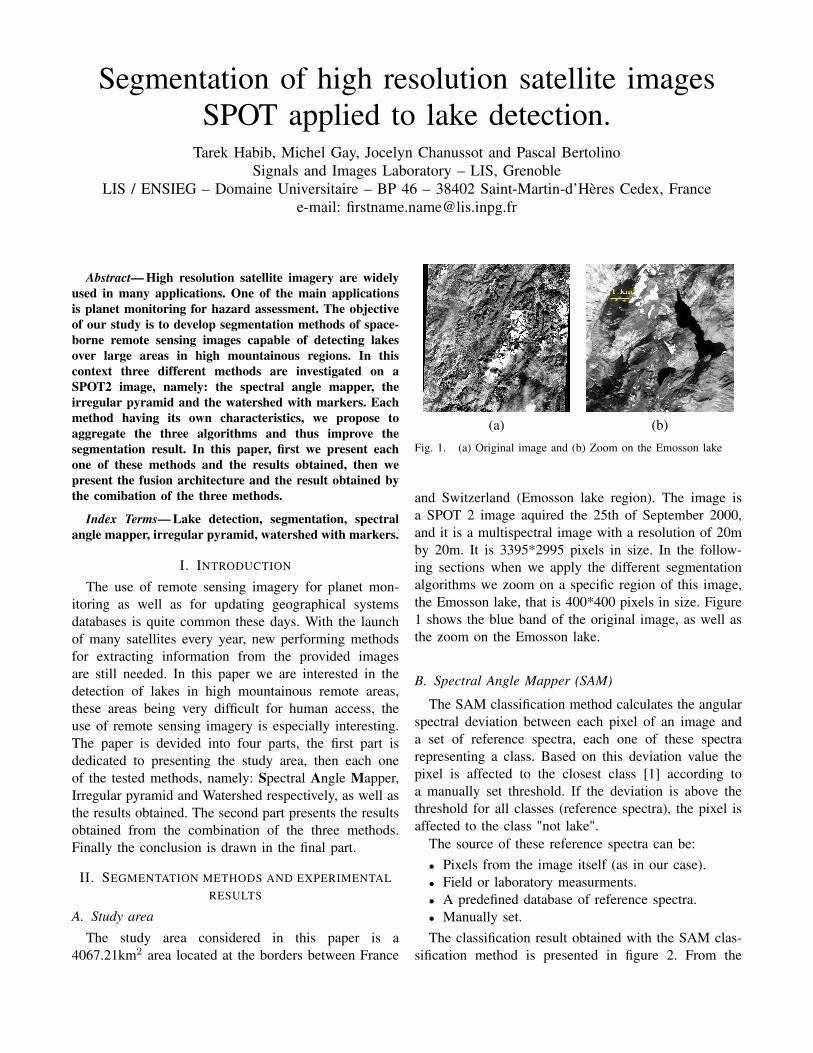
Fig. 1. (a) Original image and (b) Zoom on the Emosson lake
and Switzerland (Emosson lake region). The image isa SPOT 2 image aquired the 25th of September 2000,and it is a multispectral image with a resolution of 20mby 20m. It is 3395*2995 pixels in size. In the follow-ing sections when we apply the different segmentationalgorithms we zoom on a specific region of this image,the Emosson lake, that is 400*400 pixels in size. Figure1 shows the blue band of the original image, as well asthe zoom on the Emosson lake.
B. Spectral Angle Mapper (SAM)
The SAM classification method calculates the angularspectral deviation between each pixel of an image anda set of reference spectra, each one of these spectrarepresenting a class. Based on this deviation value thepixel is affected to the closest class [1] according toa manually set threshold. If the deviation is above thethreshold for all classes (reference spectra), the pixel isaffected to the class "not lake".
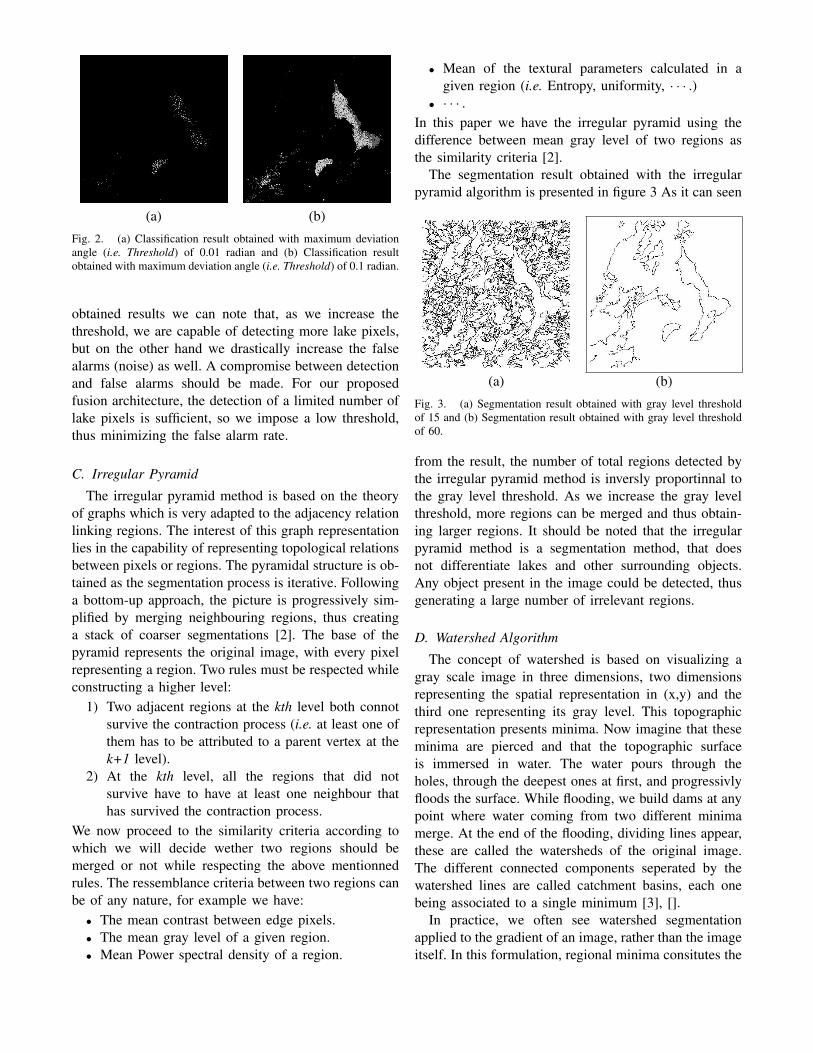
The source of these reference spectra can be:• Pixels from the image itself (as in our case).• Field or laboratory measurments.• A predefined database of reference spectra.• Manually set.The classification result obtained with the SAM clas-
sification method is presented in figure 2. From the
(a) (b)
Fig. 2. (a) Classification result obtained with maximum deviationangle (i.e. Threshold) of 0.01 radian and (b) Classification resultobtained with maximum deviation angle (i.e. Threshold) of 0.1 radian.
obtained results we can note that, as we increase thethreshold, we are capable of detecting more lake pixels,but on the other hand we drastically increase the falsealarms (noise) as well. A compromise between detectionand false alarms should be made. For our proposedfusion architecture, the detection of a limited number oflake pixels is sufficient, so we impose a low threshold,thus minimizing the false alarm rate.
C. Irregular Pyramid
The irregular pyramid method is based on the theoryof graphs which is very adapted to the adjacency relationlinking regions. The interest of this graph representationlies in the capability of representing topological relationsbetween pixels or regions. The pyramidal structure is ob-tained as the segmentation process is iterative. Followinga bottom-up approach, the picture is progressively sim-plified by merging neighbouring regions, thus creatinga stack of coarser segmentations [2]. The base of thepyramid represents the original image, with every pixelrepresenting a region. Two rules must be respected whileconstructing a higher level:
1) Two adjacent regions at the kth level both connotsurvive the contraction process (i.e. at least one ofthem has to be attributed to a parent vertex at thek+1 level).
2) At the kth level, all the regions that did notsurvive have to have at least one neighbour thathas survived the contraction process.
We now proceed to the similarity criteria according towhich we will decide wether two regions should bemerged or not while respecting the above mentionnedrules. The ressemblance criteria between two regions canbe of any nature, for example we have:
• The mean contrast between edge pixels.• The mean gray level of a given region.• Mean Power spectral density of a region.
• Mean of the textural parameters calculated in agiven region (i.e. Entropy, uniformity, · · · .)
• · · · .In this paper we have the irregular pyramid using thedifference between mean gray level of two regions asthe similarity criteria [2].
The segmentation result obtained with the irregularpyramid algorithm is presented in figure 3 As it can seen
(a) (b)
Fig. 3. (a) Segmentation result obtained with gray level thresholdof 15 and (b) Segmentation result obtained with gray level thresholdof 60.
from the result, the number of total regions detected bythe irregular pyramid method is inversly proportinnal tothe gray level threshold. As we increase the gray levelthreshold, more regions can be merged and thus obtain-ing larger regions. It should be noted that the irregularpyramid method is a segmentation method, that doesnot differentiate lakes and other surrounding objects.Any object present in the image could be detected, thusgenerating a large number of irrelevant regions.
D. Watershed Algorithm
The concept of watershed is based on visualizing agray scale image in three dimensions, two dimensionsrepresenting the spatial representation in (x,y) and thethird one representing its gray level. This topographicrepresentation presents minima. Now imagine that theseminima are pierced and that the topographic surfaceis immersed in water. The water pours through theholes, through the deepest ones at first, and progressivlyfloods the surface. While flooding, we build dams at anypoint where water coming from two different minimamerge. At the end of the flooding, dividing lines appear,these are called the watersheds of the original image.The different connected components seperated by thewatershed lines are called catchment basins, each onebeing associated to a single minimum [3], [].
In practice, we often see watershed segmentationapplied to the gradient of an image, rather than the imageitself. In this formulation, regional minima consitutes the
regions having small gradient values, this is a reasonableassumption since any object in an image is characterizedby homogeneous texture and hence a weak gradient.The objects in an image corresponds therefore withregions having small gradient values. But even if we takethis formulation into account we’ll obtain unsatisfactory,oversegmented results [4], [5].
In order to overcome the problem of oversegmenta-tion, another method was proposed in the litterature,this method is called watershed with markers [6], [7],[8]. In this method we define markers for the objects tobe extracted. these markers will then be imposed as thenew and only minima of the gradient image. And finallyafter imposing the markers, we can launch the watershedalgorithm on this modified gradient image.
The most critical part of this modified algorithm, is themarker extraction part; many methods were proposed inthe litterature in this domain, but it should be noted thatthe marker extraction procedure is totally dependent onthe application in hand.
For our application we have proposed three markerextraction algorithms, these algorithms were found upon:
1) Texture calculations and mainly focused on theentropy of each pixel on a spredefined neighbour-hood.
2) Building a database with previously defined lakeregions and comparing the caracteristics (i.e. graylevel, texture calculations, · · · ) of each new pixelwith the mean values of the lake regions stored inthe database.
3) Spectral signature of the water and exploiting theinformation provided by the multispectral imagery.
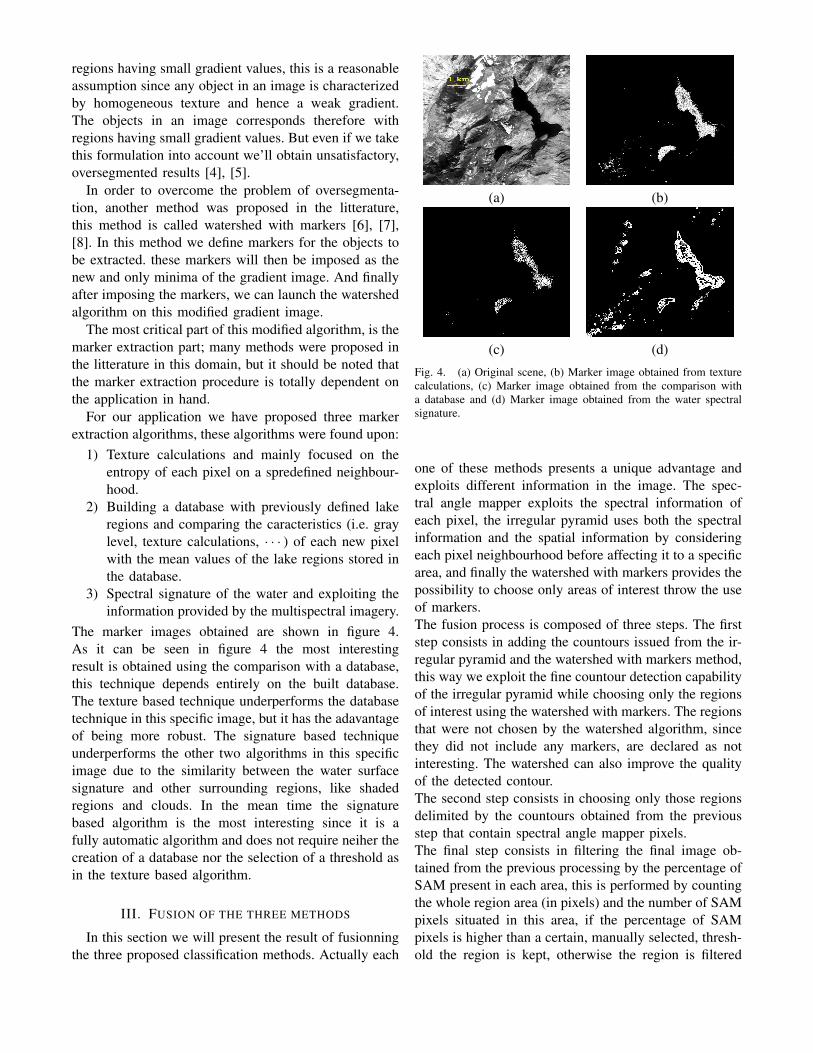
The marker images obtained are shown in figure 4.As it can be seen in figure 4 the most interestingresult is obtained using the comparison with a database,this technique depends entirely on the built database.The texture based technique underperforms the databasetechnique in this specific image, but it has the adavantageof being more robust. The signature based techniqueunderperforms the other two algorithms in this specificimage due to the similarity between the water surfacesignature and other surrounding regions, like shadedregions and clouds. In the mean time the signaturebased algorithm is the most interesting since it is afully automatic algorithm and does not require neiher thecreation of a database nor the selection of a threshold asin the texture based algorithm.
III. FUSION OF THE THREE METHODS
In this section we will present the result of fusionningthe three proposed classification methods. Actually each
(a) (b)
(c) (d)
Fig. 4. (a) Original scene, (b) Marker image obtained from texturecalculations, (c) Marker image obtained from the comparison witha database and (d) Marker image obtained from the water spectralsignature.
one of these methods presents a unique advantage andexploits different information in the image. The spec-tral angle mapper exploits the spectral information ofeach pixel, the irregular pyramid uses both the spectralinformation and the spatial information by consideringeach pixel neighbourhood before affecting it to a specificarea, and finally the watershed with markers provides thepossibility to choose only areas of interest throw the useof markers.The fusion process is composed of three steps. The firststep consists in adding the countours issued from the ir-regular pyramid and the watershed with markers method,this way we exploit the fine countour detection capabilityof the irregular pyramid while choosing only the regionsof interest using the watershed with markers. The regionsthat were not chosen by the watershed algorithm, sincethey did not include any markers, are declared as notinteresting. The watershed can also improve the qualityof the detected contour.The second step consists in choosing only those regionsdelimited by the countours obtained from the previousstep that contain spectral angle mapper pixels.The final step consists in filtering the final image ob-tained from the previous processing by the percentage ofSAM present in each area, this is performed by countingthe whole region area (in pixels) and the number of SAMpixels situated in this area, if the percentage of SAMpixels is higher than a certain, manually selected, thresh-old the region is kept, otherwise the region is filtered
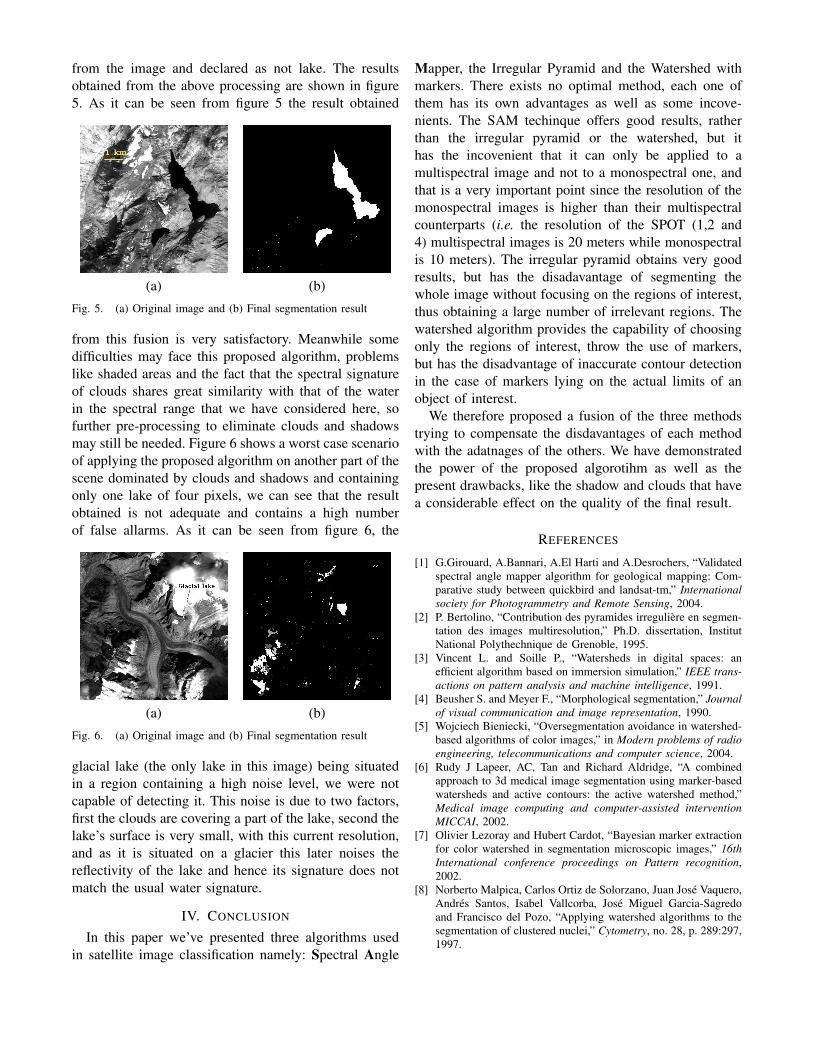
from the image and declared as not lake. The resultsobtained from the above processing are shown in figure5. As it can be seen from figure 5 the result obtained
(a) (b)
Fig. 5. (a) Original image and (b) Final segmentation result
from this fusion is very satisfactory. Meanwhile somedifficulties may face this proposed algorithm, problemslike shaded areas and the fact that the spectral signatureof clouds shares great similarity with that of the waterin the spectral range that we have considered here, sofurther pre-processing to eliminate clouds and shadowsmay still be needed. Figure 6 shows a worst case scenarioof applying the proposed algorithm on another part of thescene dominated by clouds and shadows and containingonly one lake of four pixels, we can see that the resultobtained is not adequate and contains a high numberof false allarms. As it can be seen from figure 6, the
(a) (b)
Fig. 6. (a) Original image and (b) Final segmentation result
glacial lake (the only lake in this image) being situatedin a region containing a high noise level, we were notcapable of detecting it. This noise is due to two factors,first the clouds are covering a part of the lake, second thelake’s surface is very small, with this current resolution,and as it is situated on a glacier this later noises thereflectivity of the lake and hence its signature does notmatch the usual water signature.
IV. CONCLUSION
In this paper we’ve presented three algorithms usedin satellite image classification namely: Spectral Angle
Mapper, the Irregular Pyramid and the Watershed withmarkers. There exists no optimal method, each one ofthem has its own advantages as well as some incove-nients. The SAM techinque offers good results, ratherthan the irregular pyramid or the watershed, but ithas the incovenient that it can only be applied to amultispectral image and not to a monospectral one, andthat is a very important point since the resolution of themonospectral images is higher than their multispectralcounterparts (i.e. the resolution of the SPOT (1,2 and4) multispectral images is 20 meters while monospectralis 10 meters). The irregular pyramid obtains very goodresults, but has the disadavantage of segmenting thewhole image without focusing on the regions of interest,thus obtaining a large number of irrelevant regions. Thewatershed algorithm provides the capability of choosingonly the regions of interest, throw the use of markers,but has the disadvantage of inaccurate contour detectionin the case of markers lying on the actual limits of anobject of interest.
We therefore proposed a fusion of the three methodstrying to compensate the disdavantages of each methodwith the adatnages of the others. We have demonstratedthe power of the proposed algorotihm as well as thepresent drawbacks, like the shadow and clouds that havea considerable effect on the quality of the final result.
REFERENCES
[1] G.Girouard, A.Bannari, A.El Harti and A.Desrochers, “Validatedspectral angle mapper algorithm for geological mapping: Com-parative study between quickbird and landsat-tm,” Internationalsociety for Photogrammetry and Remote Sensing, 2004.
[2] P. Bertolino, “Contribution des pyramides irregulière en segmen-tation des images multiresolution,” Ph.D. dissertation, InstitutNational Polythechnique de Grenoble, 1995.
[3] Vincent L. and Soille P., “Watersheds in digital spaces: anefficient algorithm based on immersion simulation,” IEEE trans-actions on pattern analysis and machine intelligence, 1991.
[4] Beusher S. and Meyer F., “Morphological segmentation,” Journalof visual communication and image representation, 1990.
[5] Wojciech Bieniecki, “Oversegmentation avoidance in watershed-based algorithms of color images,” in Modern problems of radioengineering, telecommunications and computer science, 2004.
[6] Rudy J Lapeer, AC, Tan and Richard Aldridge, “A combinedapproach to 3d medical image segmentation using marker-basedwatersheds and active contours: the active watershed method,”Medical image computing and computer-assisted interventionMICCAI, 2002.
[7] Olivier Lezoray and Hubert Cardot, “Bayesian marker extractionfor color watershed in segmentation microscopic images,” 16thInternational conference proceedings on Pattern recognition,2002.
[8] Norberto Malpica, Carlos Ortiz de Solorzano, Juan José Vaquero,Andrés Santos, Isabel Vallcorba, José Miguel Garcia-Sagredoand Francisco del Pozo, “Applying watershed algorithms to thesegmentation of clustered nuclei,” Cytometry, no. 28, p. 289:297,1997.