seismic behavior, analysis and design of complex wall...
TRANSCRIPT

Seismic Behavior, Analysis and Design of Complex Wall Systems
A Small-Group Research Project Funded through the NSF NEES Research Program

ACI Com. 374 Meeting: 18 April 2005
The Research TeamUniversity of Washington
Laura Lowes, Assistant ProfessorDawn Lehman, Assistant ProfessorAaron Sterns & Paul Øyen, Graduate Student ResearchersUndergraduate Researchers
University of Illinois Dan Kuchma, Assistant ProfessorJian Zhang, Assistant ProfessorYuchuan Tang, Graduate Research AssistantJun Ji, Graduate Student Researcher
External Advisory PanelRon Klemencic and John Hooper, Magnusson Klemencic AssociatesAndrew Taylor, KPFF Consulting EngineersNeil Hawkins, Professor Emeritus, University of Illinois
ACI Com. 374 Meeting: 18 April 2005
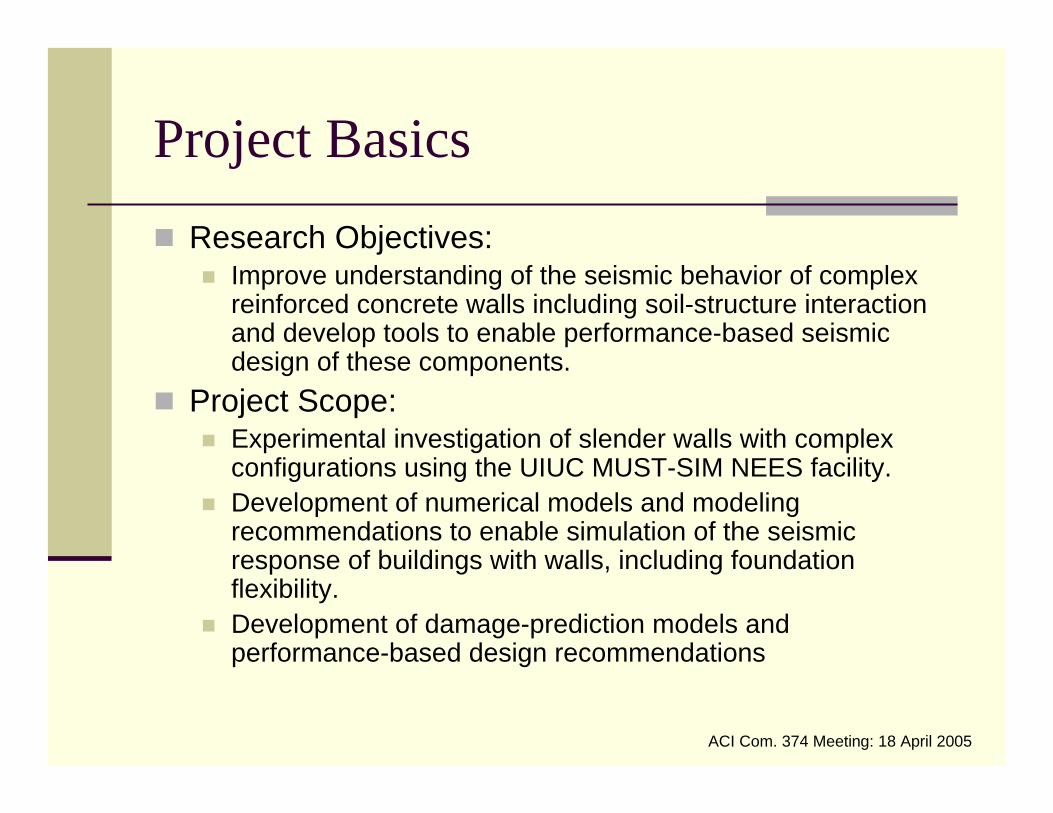
Project BasicsResearch Objectives:
Improve understanding of the seismic behavior of complex reinforced concrete walls including soil-structure interaction and develop tools to enable performance-based seismic design of these components.
Project Scope:Experimental investigation of slender walls with complex configurations using the UIUC MUST-SIM NEES facility.Development of numerical models and modeling recommendations to enable simulation of the seismic response of buildings with walls, including foundation flexibility. Development of damage-prediction models and performance-based design recommendations
ACI Com. 374 Meeting: 18 April 2005
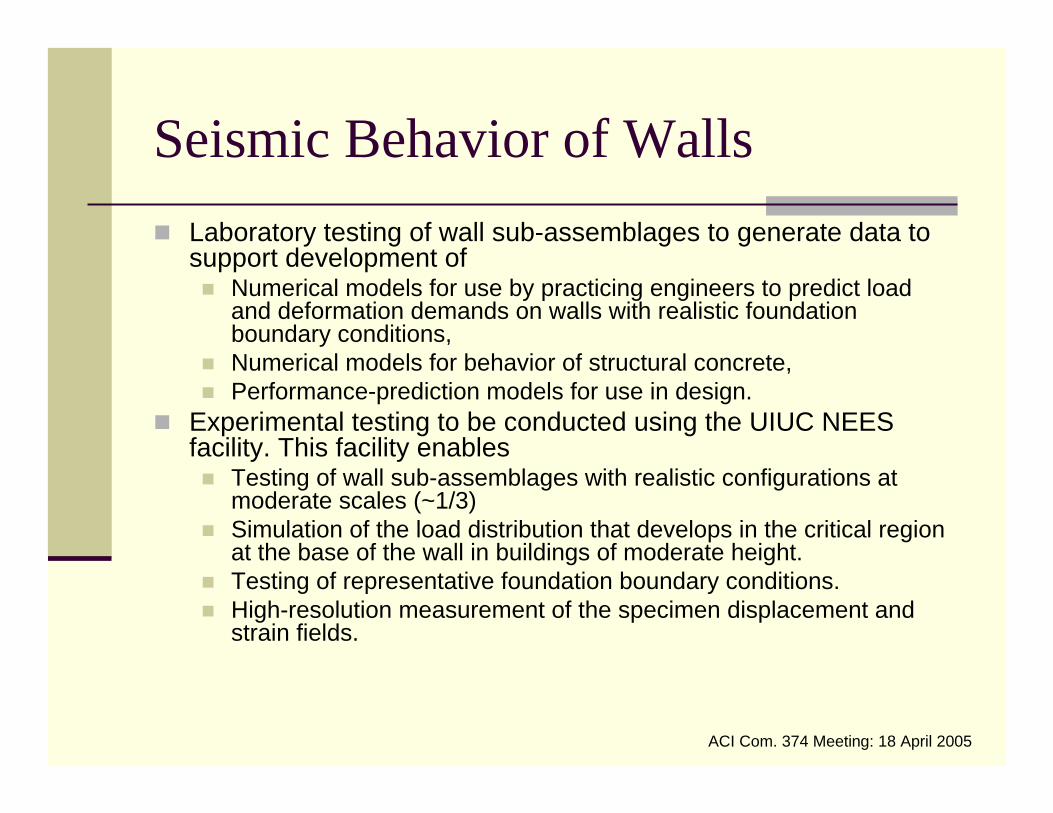
Seismic Behavior of WallsLaboratory testing of wall sub-assemblages to generate data to support development of
Numerical models for use by practicing engineers to predict loadand deformation demands on walls with realistic foundation boundary conditions,Numerical models for behavior of structural concrete, Performance-prediction models for use in design.
Experimental testing to be conducted using the UIUC NEES facility. This facility enables
Testing of wall sub-assemblages with realistic configurations at moderate scales (~1/3) Simulation of the load distribution that develops in the critical region at the base of the wall in buildings of moderate height.Testing of representative foundation boundary conditions.High-resolution measurement of the specimen displacement and strain fields.

ACI Com. 374 Meeting: 18 April 2005
Experimental Test Program
Moment – Shear RatioSSI
BoundaryConditions
Uni
dire
ctio
nal
Load
ing
Bid
irect
iona
lLo
adin
g
Planar (2) Flanged Coupled
Core-Wall System
LoadHistory
Long. Reinf.Ratio

ACI Com. 374 Meeting: 18 April 2005
Laboratory Test Specimens
Idealization of a test specimen in the UIUC NEES facility

ACI Com. 374 Meeting: 18 April 2005
Analysis of Wall SystemsDevelop recommendations for the use of simple, elastic, effective-stiffness models for performance-based design of walls.Develop recommendations for the use of simplified nonlinear models for performance-based design.Develop sophisticated nonlinear continuum models that can be used for design of special structures as well as to investigate the impact of design parameters and load history on performance.Develop nonlinear macroscopic models for use in simulating pile and spread-footing foundations.

ACI Com. 374 Meeting: 18 April 2005
Replace concrete and
reinforcement
Remove and recast concrete
Epoxy inject cracks and patch concreteNo repairRepair
Representative Damage Pattern
On-set of bar buckling
Substantial spalling
Cracking and minimal spalling
Hairline crackingDamage
PS FourPS ThreePS TwoPS One
Performance-Based Design ToolsQuantify the uncertainty with which the simplified simulation models predict wall demand. Identify repair-specific performance states for slender wall systems.Develop probabilistic models linking structural performance withpredicted demand.
ACI Com. 374 Meeting: 18 April 2005
Activities to Date
Literature and inventory review Identification of prototype buildingsPreliminary design of planar wall test program
Design details for prototype test specimenTest matrix

ACI Com. 374 Meeting: 18 April 2005
Inventory and Literature ReviewLiterature and inventory review
Review of drawings of 10 buildings designed for construction on the West Coast, primarily designed using UBC 91 and UBC 97.Questionnaires sent to 30 consulting engineering firms. To date, we’ve received “replies” from 5 engineers.Review of 17 experimental investigations conducted from 1985 – 2002
Issues investigated in the inventory reviewGross dimensions: length, thickness, aspect ratioLongitudinal reinforcement ratio: gross, in boundary elements, at mid-spanHorizontal reinforcement ratio at mid-spanBoundary element confinement: transverse reinforcement ratio, height of bound element confinementConfiguration including presence of coupling beams
Additional issues considered in review of the experimental researchAxial loadDisplacement history

ACI Com. 374 Meeting: 18 April 2005
Inventory and Literature Review: Longitudinal Reinforcement Ratio
Rectangular and Barbell Shaped Walls
0.0
0.5
1.0
1.5
2.0
2.5
3.0
0 5 10 15 20 25 30 35Aspect Ratio
Gro
ss L
ong.
Rei
nf. R
atio
[%]
Building InventoryLaboratory Tests
C, H, L, and Box Shaped Walls
0.0
0.5
1.0
1.5
2.0
2.5
3.0
0 5 10 15 20 25 30Aspect Ratio
Building Inventory
Laboratory Tests

ACI Com. 374 Meeting: 18 April 2005
Inventory and Literature Review: Horizontal Reinforcement Ratio
C, H, L, and Box Shaped Walls
0.0
0.5
1.0
1.5
2.0
2.5
0 5 10 15 20 25 30
Aspect Rato
Hor
z. R
einf
. Rat
io [%
]
Building Inventory
Rectangular and Barbell Shaped Walls
0.0
0.5
1.0
1.5
2.0
2.5
0 5 10 15 20 25 30 35
Aspect Ratio
Hor
z. R
einf
. Rat
io [%
]
Building Inventory

ACI Com. 374 Meeting: 18 April 2005
Inventory and Literature Review: Wall Thickness
C, L & Box Shaped Walls
0
0.5
1
1.5
2
2.5
3
0 5 10 15 20 25Aspect Ratio
Rectangular and Barbell Shaped Walls
0
0.5
1
1.5
2
2.5
3
0 10 20 30Aspect Ratio
Wal
l Thi
ckne
ss (f
t.)

Inventory and Literature Review: StatisticsBuilding Code Wall Height (ft) # stories AspectR Shape t [in] Max. Lb [in] ρL [%] ρv [%] s [in] ρg [%] ρh [%] s [in] Coupled
PAB 4 129 10 29.8 Rectang 18 12 2.89 ? ? ? 0.27 18 yesMKA#4 CA98 2 237.33 25 7.8 Rectang 18 58.52 2.56 0.93 12 1.45 0.27 18LDAB1 UBC97 2 67 7 2.1 Rectang 24 - - 0.31 12 0.31 0.31 12 noLDAB1 UBC97 7 78 7 2.4 Rectang 24 - - 0.31 12 0.31 0.31 12 noLDAB1 UBC97 13 91 7 5.4 Rectang 24 - - 0.42 12 0.42 0.31 12 noLDAB1 UBC97 14 91 7 5.4 Rectang 24 - - 0.42 12 0.42 0.31 12 noLDAB1 UBC97 15 52 7 1.6 Rectang 24 - - 0.42 12 0.42 0.31 12 noLDAB1 UBC97 16 65 7 3.8 Rectang 24 - - 0.69 12 0.69 0.31 12 noLDAB1 UBC97 17 65 7 3.8 Rectang 24 - - 0.42 12 0.42 0.31 12 no
EH UBC91 2 335 30 26.3 Rectang 24 - - 0.69 12 0.69 1.38 4 yesCHEM 3 75 7 3.9 Rectang 12 48 3.97 0.28 12 1.81 0.67 15 no
EH UBC91 335 30 10.6 L/Box 24 - - 0.55 6, 12 0.55 0.92 4 yesPAB 2 140 10 7.1 L 18 54 4.81 ? ? ? 0.43 12 yesPAB 3 140 10 14.9 L 12 12 4.33 ? ? ? 0.57 9 yes
LDAB1 0 10 91 7 3.7 L 24 - - 1 12 1 0.88 12 noLDAB1 0 11 91 7 2.9 L 24 - - 1.27 6, 12 1.27 0.55 12 noLDAB1 0 12 78 7 2.4 L 24 - - 1.1 12 1.1 0.31 12 no
BTT UBC91 5 260 20 21.7 L 24 yesBTT UBC91 6 260 20 8.6 L 24 yes
MKA#1 UBC94 1 51 5 0.5 I 20 46 1.09 0.26 12 0.47 0.26 12LDAB1 UBC94 9 91 7 2.8 H 24 - - 1.5 6, 12 1.5 0.69 12 yesMFC UBC97 3 205 23 6.2 C 30 - - 1.4 5, 10 1.4 1.7 5 yes
LDAB1 UBC97 1 80 7 2.5 C 24 - - 1.6 6, 12 1.6 0.88 12 noLDAB1 UBC97 3 65 7 2.0 C 24 - - 0.74 12 0.74 0.69 12 yesLDAB1 UBC97 4 65 7 2.0 C 24 - - 0.93 6, 12 0.93 0.42 12 yesLDAB1 UBC97 5 65 7 2.0 C 24 - - 0.84 12 0.84 0.31 12 noLDAB1 UBC97 6 78 7 2.4 C 24 - - 0.85 12 0.85 0.69 12 noLDAB1 UBC97 8 78 7 2.4 C 24 - - 0.84 12 0.84 0.31 12 yes
EH UBC91 335 30 10.3 C 24 - - 0.77 6, 12 0.77 0.92 4 yesCHEM 4 93 7 7.2 C 12 48 5.42 0.28 12 2.61 0.73 10 no
BTT UBC91 4 260 20 6.5 C 24 yesPAB 1 88 10 4.1 Box 18 36, 48 3.61 ? ? ? 0.43 12 yes
MKA#4 CA98 3 309 32 10.1 Box 30 76.26 1.68 0.56 12 1.19 0.31 12MKA#4 CA98 1 237.33 25 6.3 Box 30 52.66 2.6 0.69 12 1.49 0.31 12MKA#3 UBC97 1 110 10 3.4 Box 24 49 3.18 2.17 6 2.42 0.61 6
MFC UBC97 1 449.50 23 13.6 Box 30 - - 1.68 5, 10 1.68 0.69 5 yesMFC UBC97 2 449.50 23 11.0 Box 30 - - 1.29 5, 10 1.29 2.2 5 yes
CHEM 1a 93 7 2.7 Barbell 12 36 4.7 0.97 6, 12 1.67 0.83 12 noCHEM 1b 75 7 2.0 Barbell 12 36 4.7 0.97 6, 12 1.63 0.83 12 noCHEM 2 93 7 2.1 Barbell 16 28 3.56 0.21 12 0.78 0.32 12 no
Average: 151.3 6.7 22 3.5 0.8 1.1 0.6 10.9Rect. Avg: 116.8 8.4 Rectang 22 3.1 0.5 0.7 0.4 12.6
C-Shape Avg: 132.4 4.4 C-shaped 23 5.4 0.9 1.2 0.7 10.1L-Shape Avg: 151.4 8.8 L-shaped 21 4.6 1.1 1.1 0.5 11.4
Box Avg: 273.9 8.1 Box 27 2.8 1.3 1.6 0.8 8.7Barbell Avg: 87.0 2.3 Barbell 13 4.3 0.7 1.4 0.7 12.0
Boundary Ele. Horz. Reinf.Vert. Reinf.

ACI Com. 374 Meeting: 18 April 2005
Identify Prototype Buildings
10-story office building in San FranciscoDesigned by MKA per UBC 1997Fairly regular layout with two core-wall systems (coupled and non-coupled)
Would like to include4-story office building designed per code20-story office building designed per code
Possibly will include9-story hospital in Reno
Designed using performance-based design criteriaFairly regular layout with couple core and non-coupled wallsIn the process of acquiring owners permission

ACI Com. 374 Meeting: 18 April 2005
Planar Tests: Prototype SpecimenThickness
Prototype = 18 in.Average from inventory review (all walls) = 22 in.
LengthPrototype = 30 ft.Average from inventory review (all walls) = 29.4 ft.
Boundary Element reinforcement ratioPrototype = 5%Average from inventory review (rectangular walls) = 3.1%Average from inventory review (all walls) = 3.5%
Gross vertical reinforcement ratioPrototype = 1%Average from inventory review (rectangular walls) = 0.7%Average from inventory review (all walls) = 1.1%
Vertical (mid-span) & horizontal reinforcement ratio Prototype = code minimumAverage from inventory review (all walls) = 0.64% (horz.), 0.8% (vert.)Average from inventory review (rectangular) = 0.5% (horz.), 0.4% (vert.)

ACI Com. 374 Meeting: 18 April 2005
Typical Specimen
18”26” 308” 26”

ACI Com. 374 Meeting: 18 April 2005
Planar Tests: Loading of Prototype Test Specimen
Simulation of building response to earthquake loading used to
determine roof displacement and moment-shear ratio
ACI Com. 374 Meeting: 18 April 2005
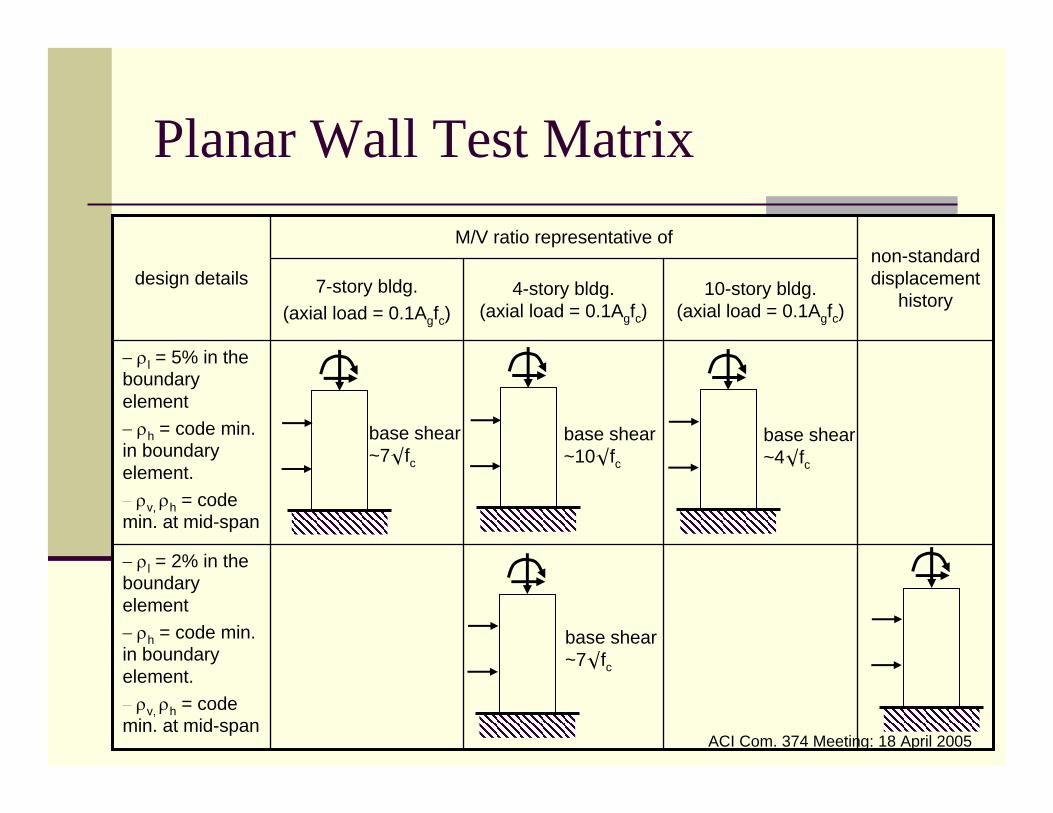
M/V ratio representative of
10-story bldg.(axial load = 0.1Agfc)
− ρl = 2% in the boundary element− ρh = code min. in boundary element.− ρv, ρh = code min. at mid-span
− ρl = 5% in the boundary element− ρh = code min. in boundary element.− ρv, ρh = code min. at mid-span
design detailsnon-standard displacement
history4-story bldg.(axial load = 0.1Agfc)
7-story bldg.(axial load = 0.1Agfc)
Planar Wall Test Matrix
base shear ~7◊fc
base shear ~7◊fc
base shear ~4◊fc
base shear ~10◊fc
ACI Com. 374 Meeting: 18 April 2005
Planar Tests: Current Activities
Review of experimental data to develop links between drift demand, damage and effective stiffness Analyses of prototype buildings to better determine moment-shear ratios to use in the laboratoryAnalyses of proposed test specimens to verify failure modes of laboratory test specimensIdentify drift histories for use in laboratory testing
ACI Com. 374 Meeting: 18 April 2005
Research Project: Future Activities
Planar wall tests: summer 2005Coupled walls
Design & testing: 2005-2006
C-shaped wallsDesign & testing: 2006
Core wallDesign & testing: 2006-2007
ACI Com. 374 Meeting: 18 April 2005
Planar Wall Test Matrix
Issues to be resolved in designing test matrixDoes the prototype specimen exhibit flexure or flexure-shear failure?Does the prototype specimen have boundary elements?Pseudo-dynamic testing for non-standard displacement history?Is it necessary to test a wall with a steep moment gradient? If not, other potential test parameters include
Non-standard, pre-defined displacement histories or pseudo-dynamic displacement historiesBoundary zone confinement

ACI Com. 374 Meeting: 18 April 2005
Specimen DesignBoundary elements
Vertical reinforcement ratio in boundary elements defined by moment demand (Mu).Depth used for confinement is code defined (ACI 318: 21.7.6.2) and a function of drift demand: Is drift is computed using elastic effective stiffness model?Transverse reinforcement for confinement as for columns (ACI 318: 21.4.1 – 21.4.3).Height of boundary element is code defined (ACI 318: 21.7.6.4) and may be a function of Vu: Is Vu defined by analysis under code defined forces?Bar size: Is this typically the same as in the remainder of wall?
Mid-spanVertical shear reinforcement: code defined minimum ratio (ACI 318: 11.10.9.4), code defined minimum spacing (ACI 318: 11.10.9.5).Horizontal shear reinforcement: code defined minimum ratio is 0.0025, code minimum spacing (ACI 318: 11.10.9.3).

ACI Com. 374 Meeting: 18 April 2005
Specimen DesignAdditional design issues
What criteria are used to determine the height at which boundary elements are discontinued? What criteria are used to determine the height at which longitudinal reinforcement is discontinued? How is a capacity design approach used in defining moment demand (Mu) and shear demand (Vu)?Is there a target / typical shear demand on the wall ?
Additional issuesTypical concrete strength?Typical aggregate size?
( )'cfα

ACI Com. 374 Meeting: 18 April 2005
Laboratory Load Histories
Issues to be consideredBuilding height as defined by M-V ratioLower story shear loadsNon-standard displacement histories
Pre-definedPseudo-dynamic testing
ACI Com. 374 Meeting: 18 April 2005
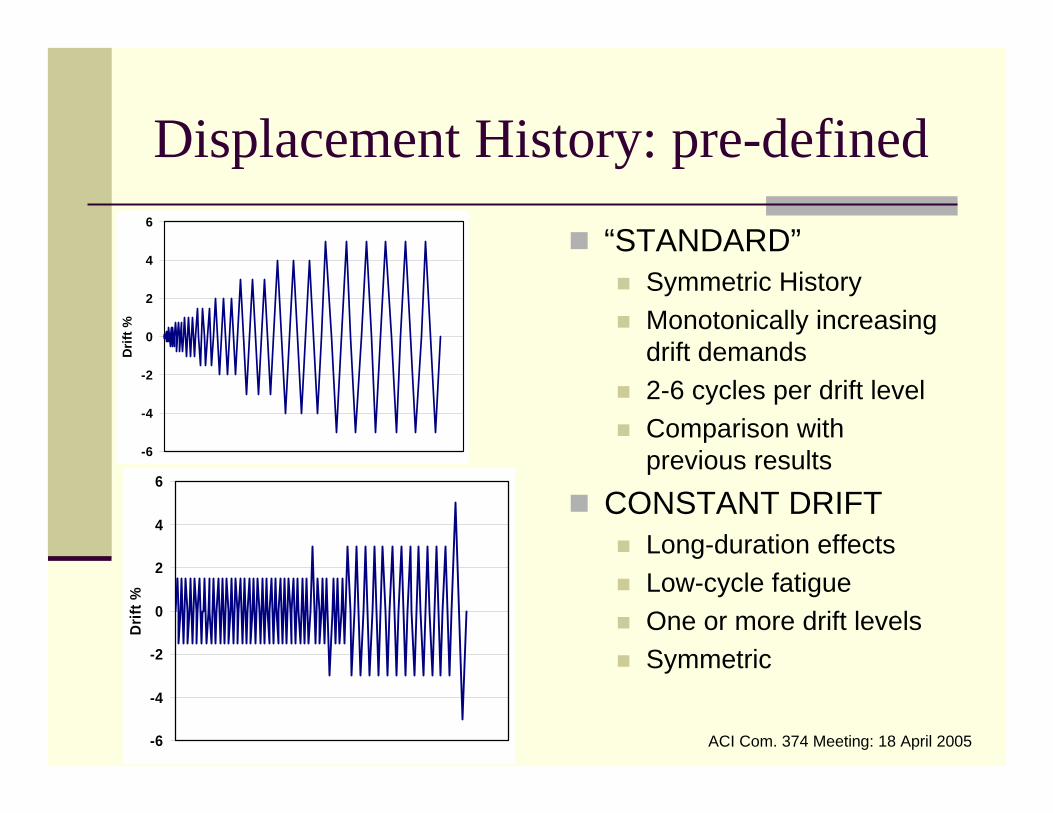
Displacement History: pre-defined
-6
-4
-2
0
2
4
6
Drif
t %
“STANDARD”Symmetric HistoryMonotonically increasing drift demands2-6 cycles per drift levelComparison with previous results
CONSTANT DRIFT Long-duration effectsLow-cycle fatigueOne or more drift levelsSymmetric
-6
-4
-2
0
2
4
6
Drif
t %

ACI Com. 374 Meeting: 18 April 2005
Displacement History: pre-defined
-6
-4
-2
0
2
4
6
Drif
t %
PULSE/NON-SYMMETRIC Near-fault effectsAnalytical Model developmentOne or more drift levelsNot Symmetric
ACI Com. 374 Meeting: 18 April 2005
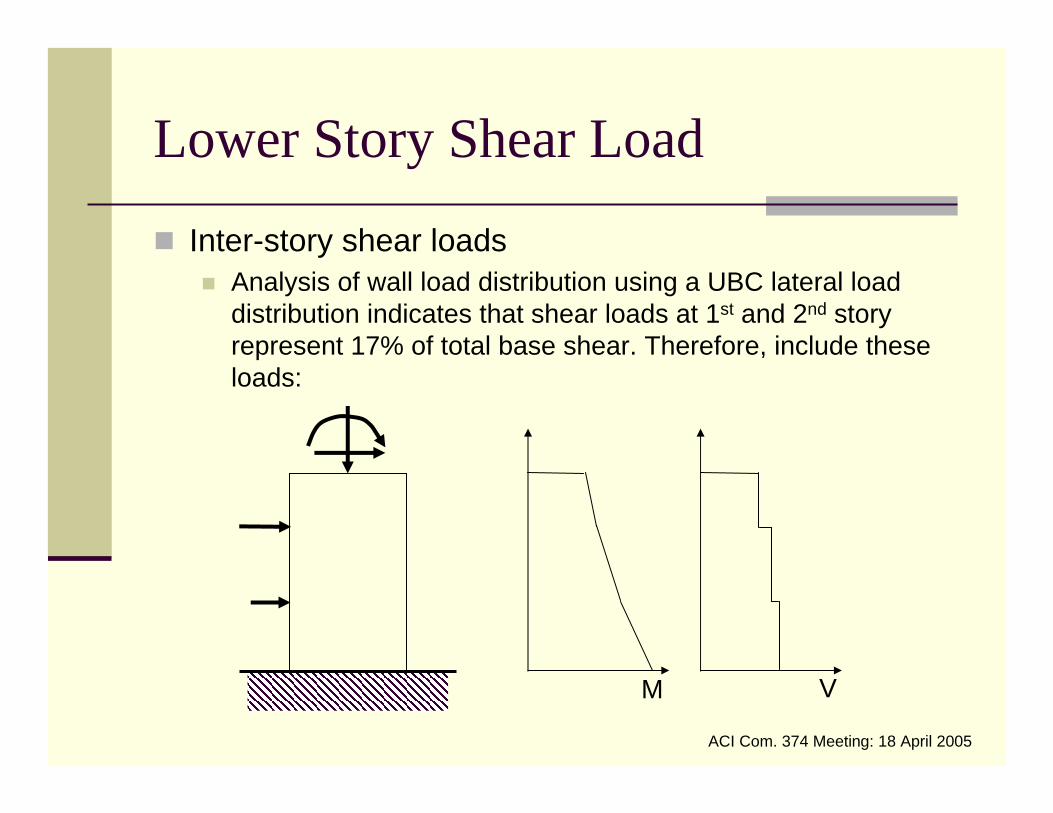
Lower Story Shear Load
Inter-story shear loadsAnalysis of wall load distribution using a UBC lateral load distribution indicates that shear loads at 1st and 2nd story represent 17% of total base shear. Therefore, include these loads:
M V

ACI Com. 374 Meeting: 18 April 2005
Building Height and M-V Ratio
Number of Stories Number of Stories4 20 4 8.5 208
Shea
r App
lied
at T
op o
f Wal
l
Mom
ent A
pplie
d at
Top
of W
all
ρvert,gross = 1.0%Axial load = 0.1Agfc
ρvert,gross = 1.0%Axial load = 0.1Agfc