seismic evaluation of an existing building using ...iepkarachi.org.pk/downloads/sammar...
TRANSCRIPT

Seismic Evaluation of an Existing Building Using Performance Based Design
Sammar Iqbal
Junior Design Engineer, EA Consulting Pvt. Ltd., Karachi
Introduction
This paper is based on the seismic evaluation of an existing building
Seismic evaluation is done to check the vulnerability of the given
building against the seismic forces
Performance Based Design (PBD) approach is employed for seismic
evaluation of the building

Need of Evaluation
Earthquake, a natural phenomenon
The forces generated by earthquake causes potential hazard to
buildings and in evidently to human life
Therefore, seismic evaluation is required to understand the
behaviour of buildings under such forces
Seismic Evaluation
Is the process of identifying any potential risks as posed by specific
building and determining whether during the occurrence of
earthquake events will the building be able to resist it or not
Performance Based Design
Is an approach that determines the performance of a structure
under the influence of seismic loads
Considers the potential hazards likely to be experienced by the
structure during an earthquake
Provides a method for determining acceptable levels of earthquake
damage i.e. performance levels
Performance level is the selection of acceptable damage state for
any structure

Immediate Occupancy Life Safety Collapse Prevention
Performance Levels
Methodology
The given building was evaluated for Seismic Zone 3 with performance
level Life Safety (LS)
ASCE 31-03 and ASCE 41-06 were used as guidelines for the analysis
Seismic load parameters and load combinations were taken from
UBC-97
Linear Static Procedure and Push Over Static Procedure have been used
for linear and non-linear analysis respectively
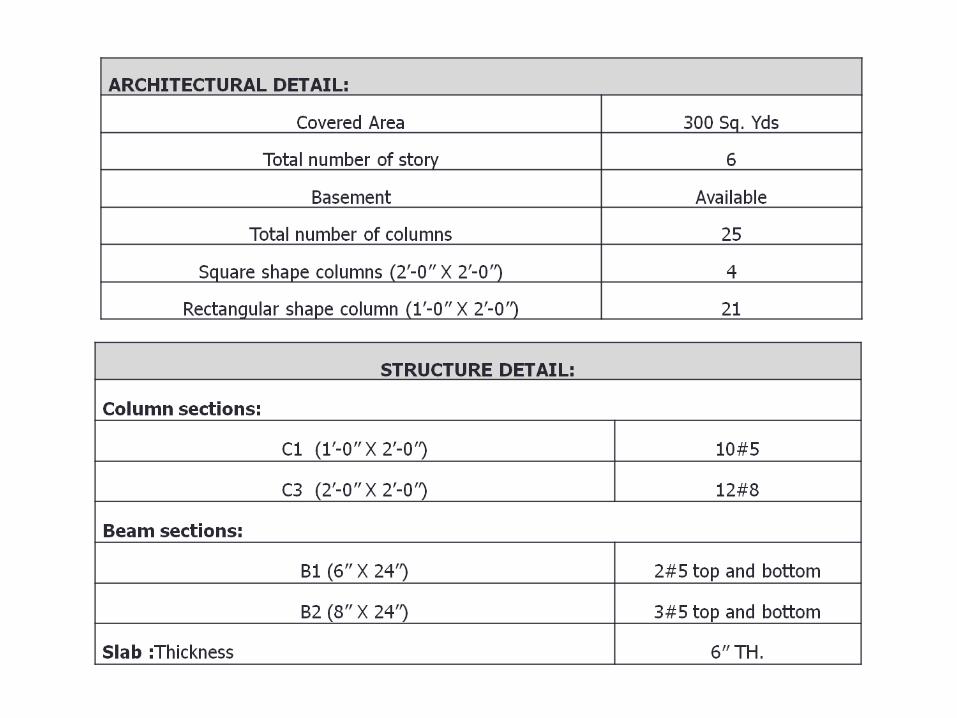
Cross sectional details of beams, columns and slabs were extracted from
the available drawings
continue Methodology…..
Methodology
Infill walls were modelled by equivalent strut method
In linear analysis to determine the potential deficiencies of the
structure, checks were performed as defined in ASCE 31-03
Deficient members were further analyzed by considering nonlinearity of
the section
Retrofitting technique was proposed for the members not meeting the
required performance level
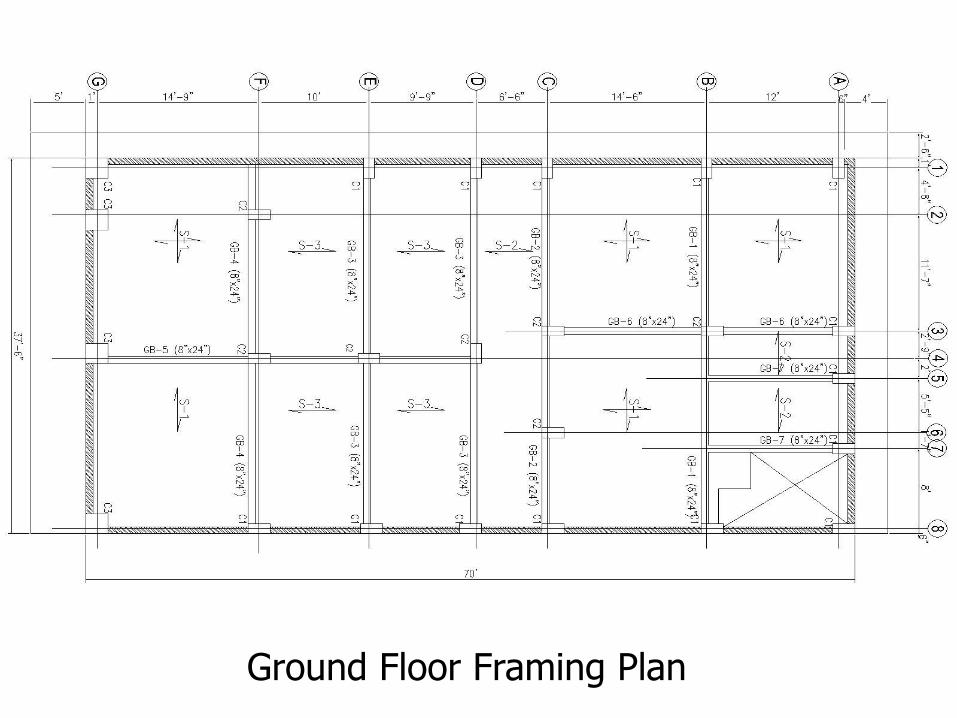
Ground Floor Framing Plan
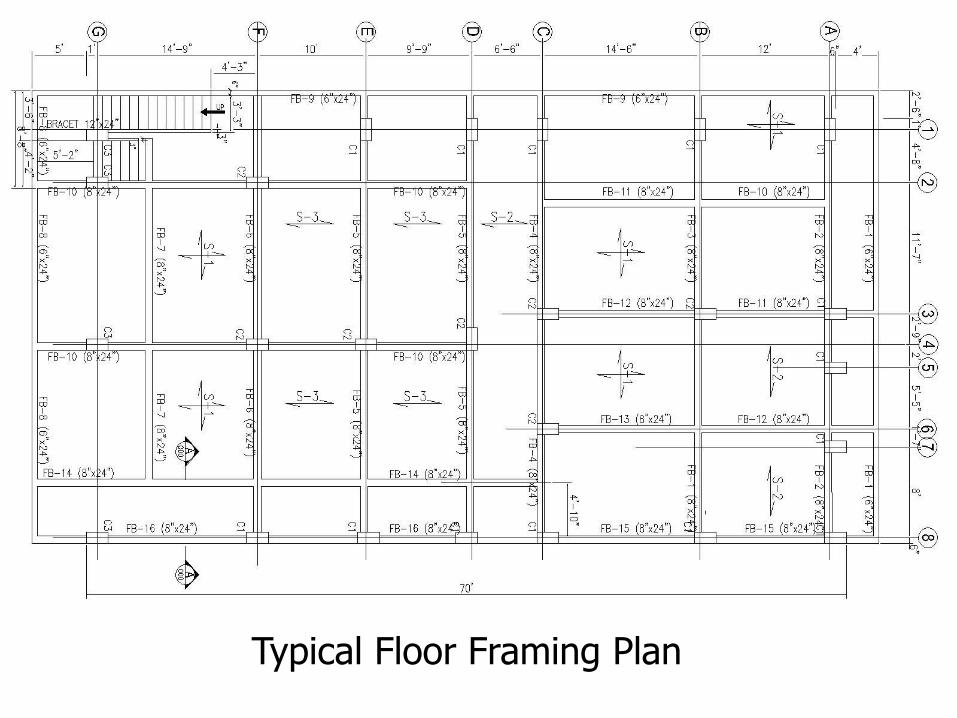
Typical Floor Framing Plan
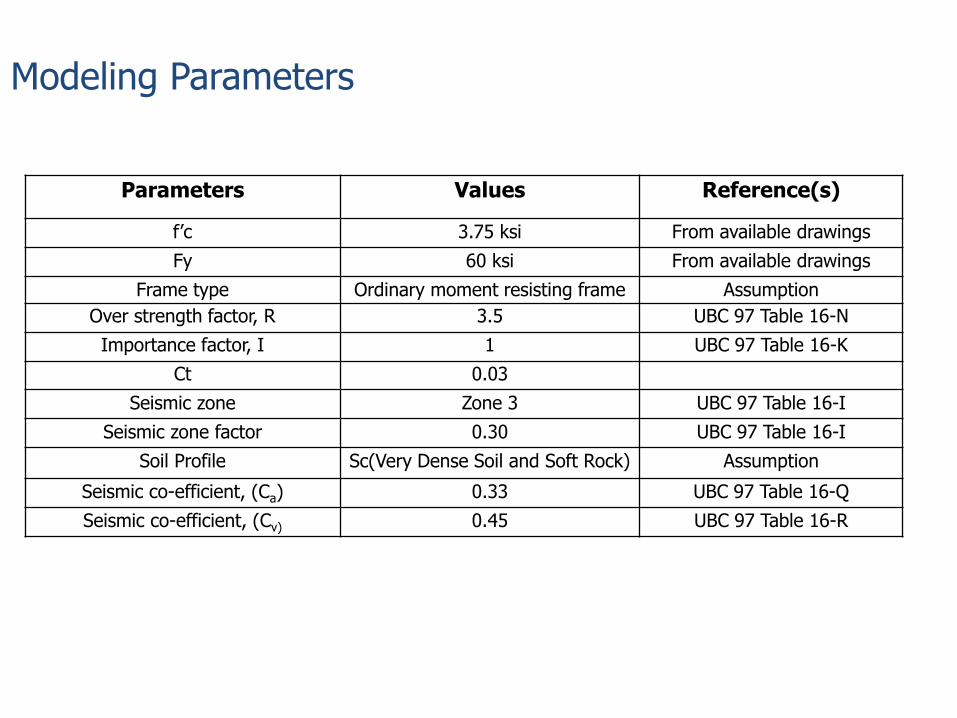
Parameters Values Reference(s)
f’c 3.75 ksi From available drawings
Fy 60 ksi From available drawings
Frame type Ordinary moment resisting frame Assumption
Over strength factor, R 3.5 UBC 97 Table 16-N
Importance factor, I 1 UBC 97 Table 16-K
Ct 0.03
Seismic zone Zone 3 UBC 97 Table 16-I
Seismic zone factor 0.30 UBC 97 Table 16-I
Soil Profile Sc(Very Dense Soil and Soft Rock) Assumption
Seismic co-efficient, (Ca) 0.33 UBC 97 Table 16-Q
Seismic co-efficient, (Cv) 0.45 UBC 97 Table 16-R
Modeling Parameters
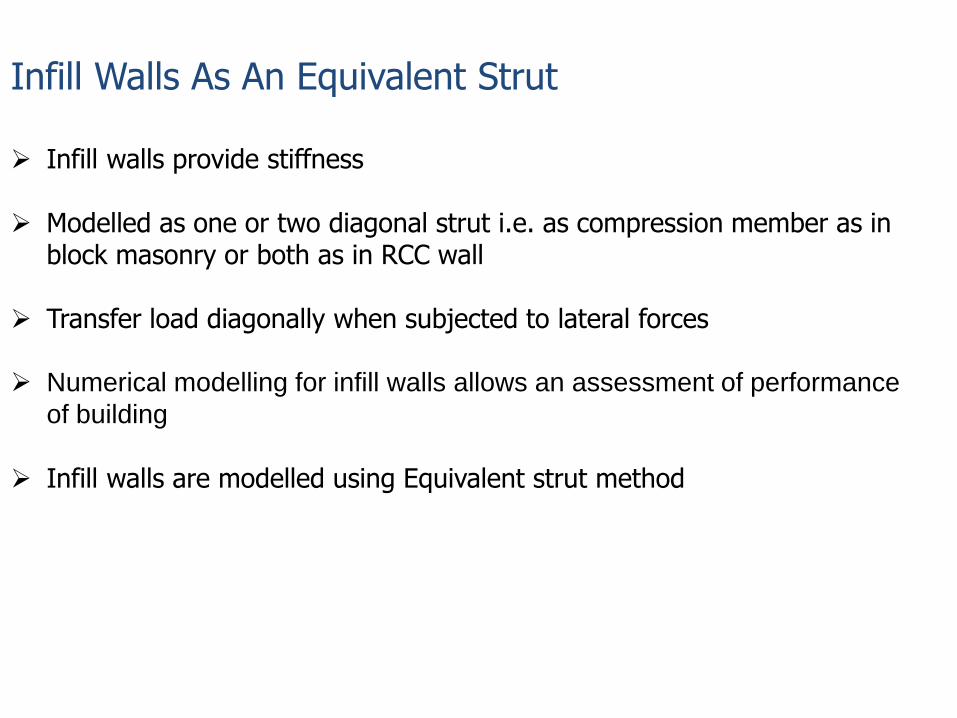
Infill Walls As An Equivalent Strut Infill walls provide stiffness
Modelled as one or two diagonal strut i.e. as compression member as in block masonry or both as in RCC wall
Transfer load diagonally when subjected to lateral forces
Numerical modelling for infill walls allows an assessment of performance
of building
Infill walls are modelled using Equivalent strut method
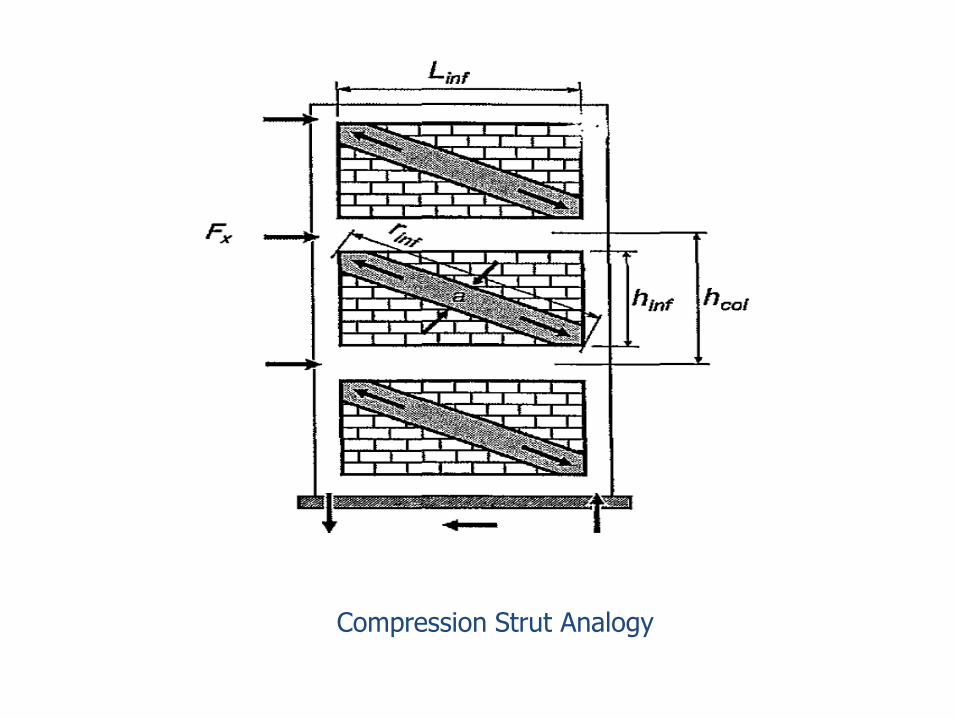
Compression Strut Analogy
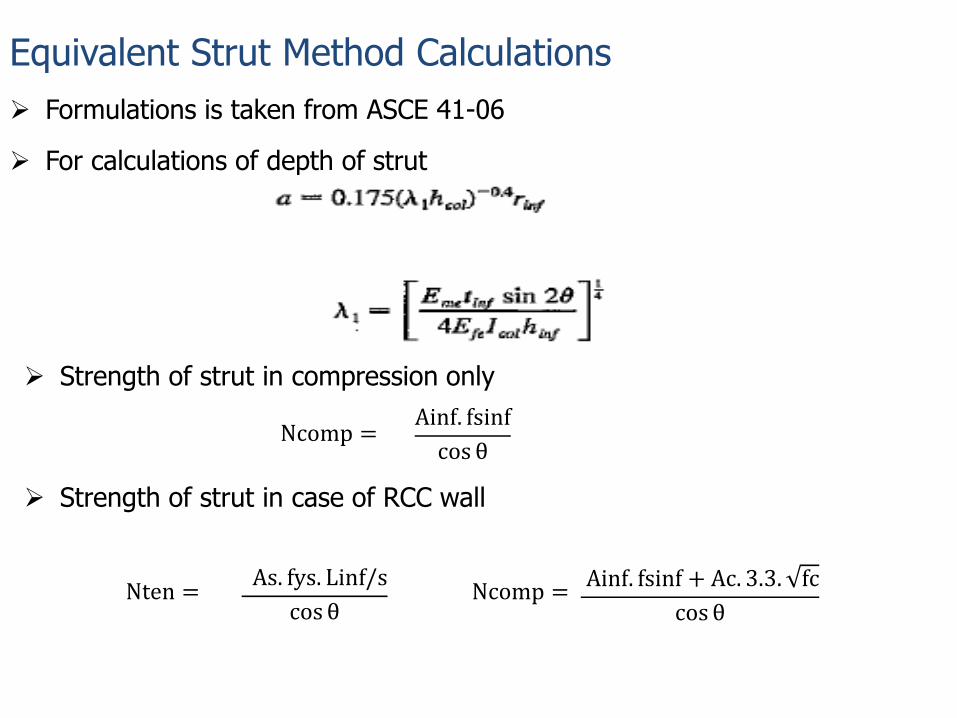
Equivalent Strut Method Calculations
Formulations is taken from ASCE 41-06
For calculations of depth of strut
Strength of strut in compression only
Strength of strut in case of RCC wall
Ainf. fsinf
cos θ
Ncomp = Ainf. fsinf + Ac. 3.3. fc
cos θ
Ncomp =
Nten = As. fys. Linf/s
cos θ
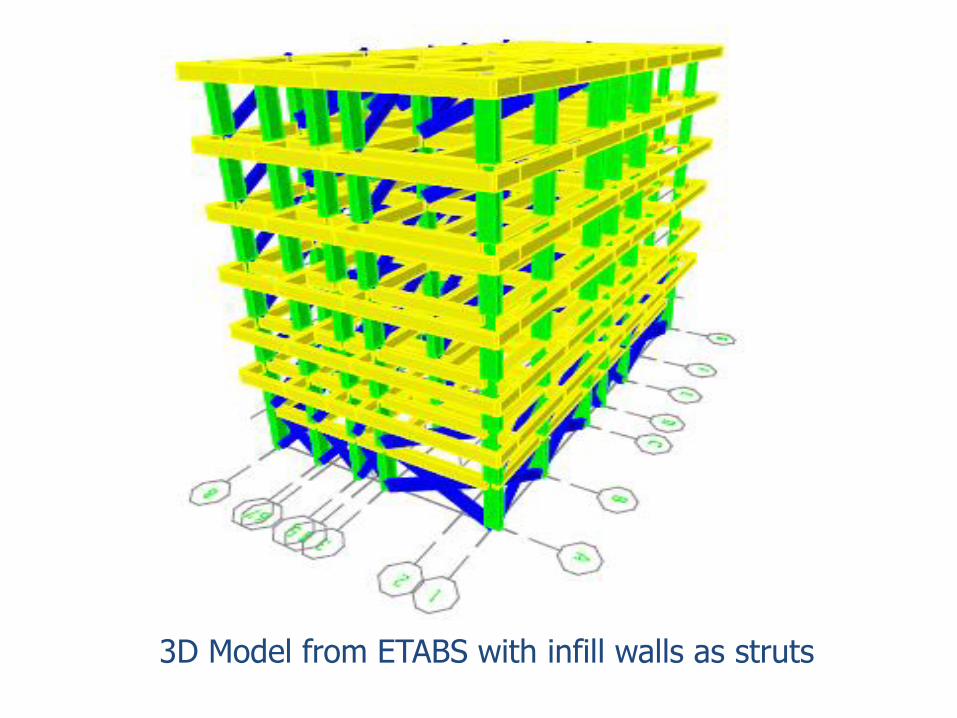
3D Model from ETABS with infill walls as struts
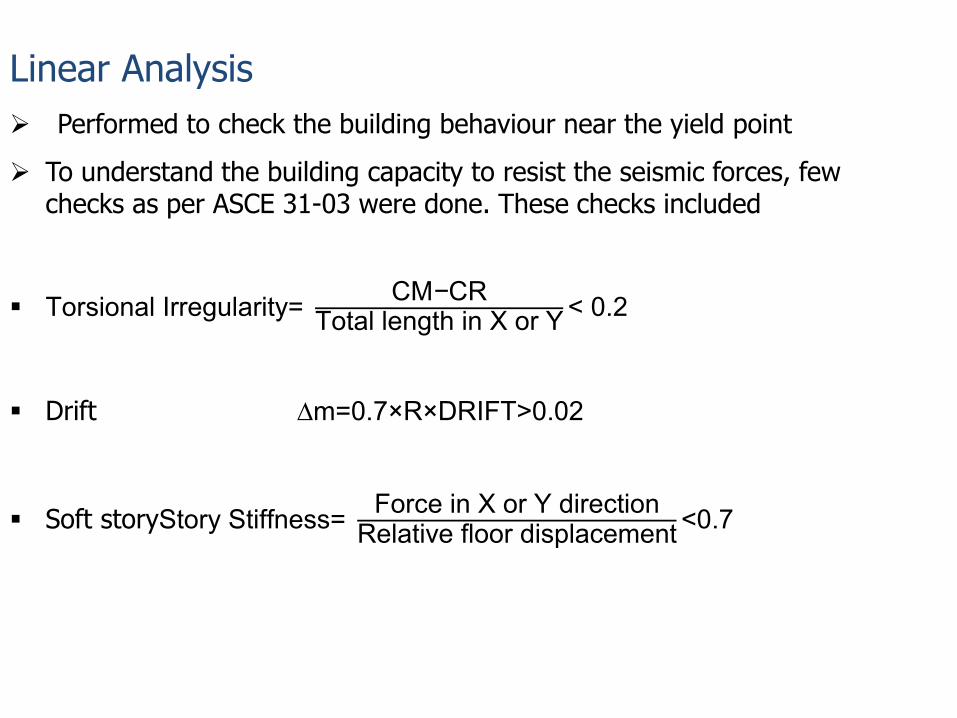
Linear Analysis
Performed to check the building behaviour near the yield point
To understand the building capacity to resist the seismic forces, few checks as per ASCE 31-03 were done. These checks included
Torsional Irregularity= CM−CR
Total length in X or Y< 0.2
Drift ∆m=0.7×R×DRIFT>0.02
Soft storyStory Stiffness= Force in X or Y direction
Relative floor displacement<0.7
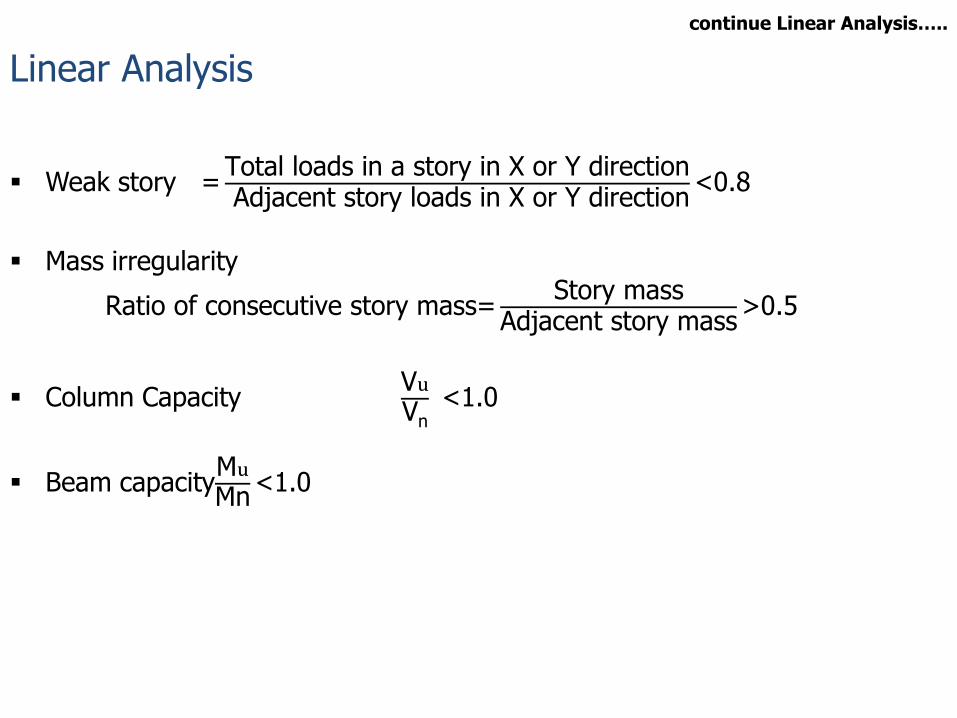
Linear Analysis
Weak story =Total loads in a story in X or Y direction Adjacent story loads in X or Y direction
<0.8
Mass irregularity
Ratio of consecutive story mass=Story mass
Adjacent story mass>0.5
Column Capacity Vu
Vn <1.0
Beam capacityMu
Mn<1.0
continue Linear Analysis…..
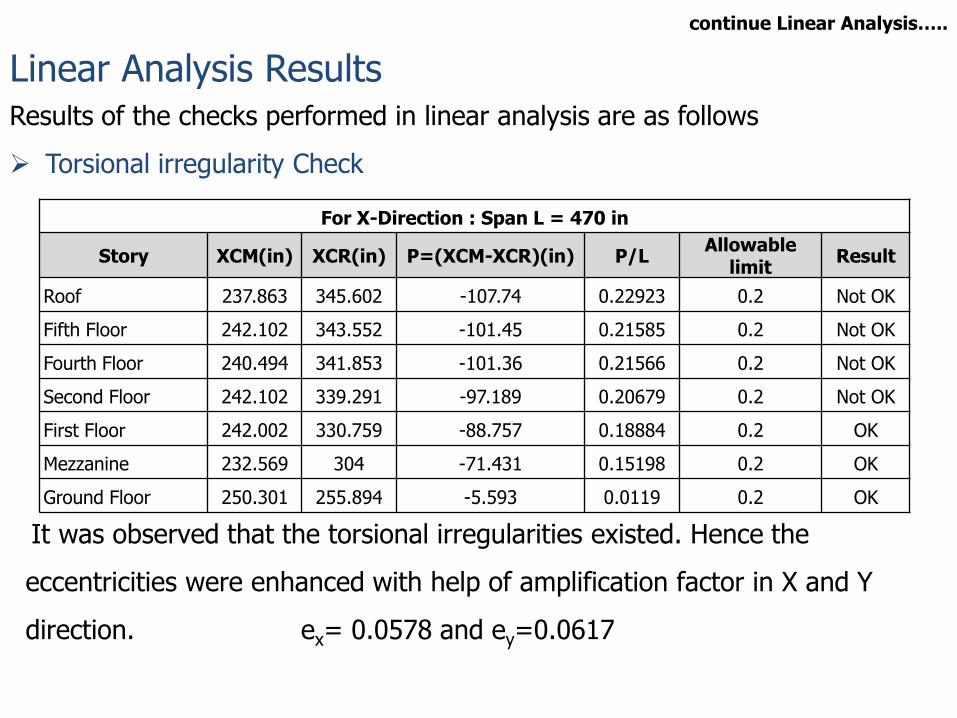
Linear Analysis Results Results of the checks performed in linear analysis are as follows
Torsional irregularity Check
It was observed that the torsional irregularities existed. Hence the
eccentricities were enhanced with help of amplification factor in X and Y
direction. ex= 0.0578 and ey=0.0617
For X-Direction : Span L = 470 in
Story XCM(in) XCR(in) P=(XCM-XCR)(in) P/L Allowable
limit Result
Roof 237.863 345.602 -107.74 0.22923 0.2 Not OK
Fifth Floor 242.102 343.552 -101.45 0.21585 0.2 Not OK
Fourth Floor 240.494 341.853 -101.36 0.21566 0.2 Not OK
Second Floor 242.102 339.291 -97.189 0.20679 0.2 Not OK
First Floor 242.002 330.759 -88.757 0.18884 0.2 OK
Mezzanine 232.569 304 -71.431 0.15198 0.2 OK
Ground Floor 250.301 255.894 -5.593 0.0119 0.2 OK
continue Linear Analysis…..
continue Linear Analysis…..
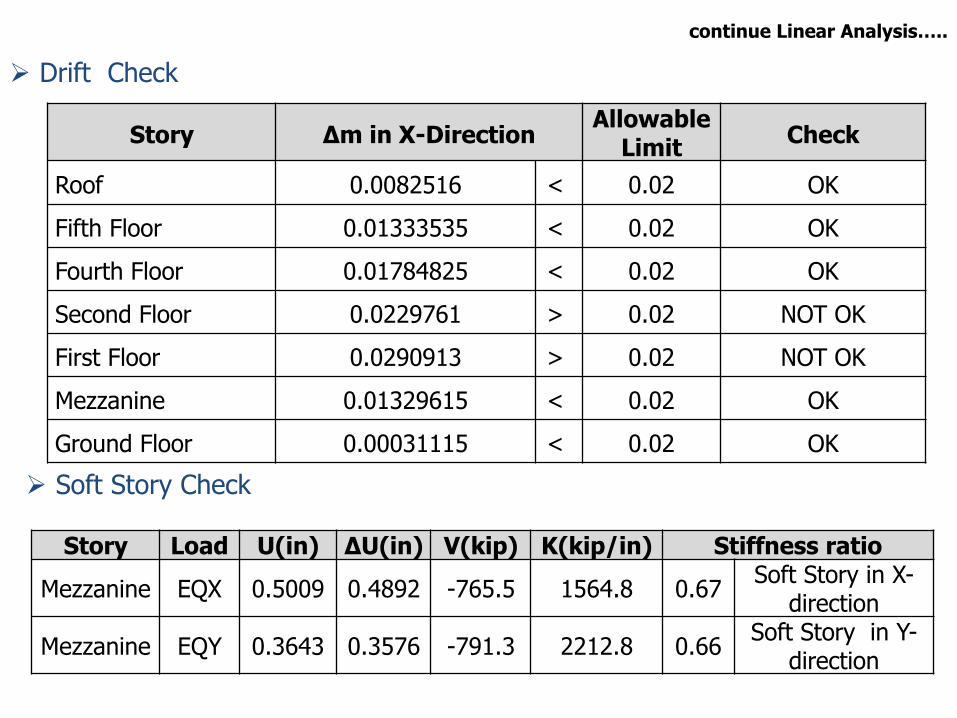
Drift Check
Story Load U(in) ΔU(in) V(kip) K(kip/in) Stiffness ratio
Mezzanine EQX 0.5009 0.4892 -765.5 1564.8 0.67 Soft Story in X-
direction
Mezzanine EQY 0.3643 0.3576 -791.3 2212.8 0.66 Soft Story in Y-
direction
Story ∆m in X-Direction Allowable
Limit Check
Roof 0.0082516 < 0.02 OK
Fifth Floor 0.01333535 < 0.02 OK
Fourth Floor 0.01784825 < 0.02 OK
Second Floor 0.0229761 > 0.02 NOT OK
First Floor 0.0290913 > 0.02 NOT OK
Mezzanine 0.01329615 < 0.02 OK
Ground Floor 0.00031115 < 0.02 OK
Soft Story Check
continue Linear Analysis…..
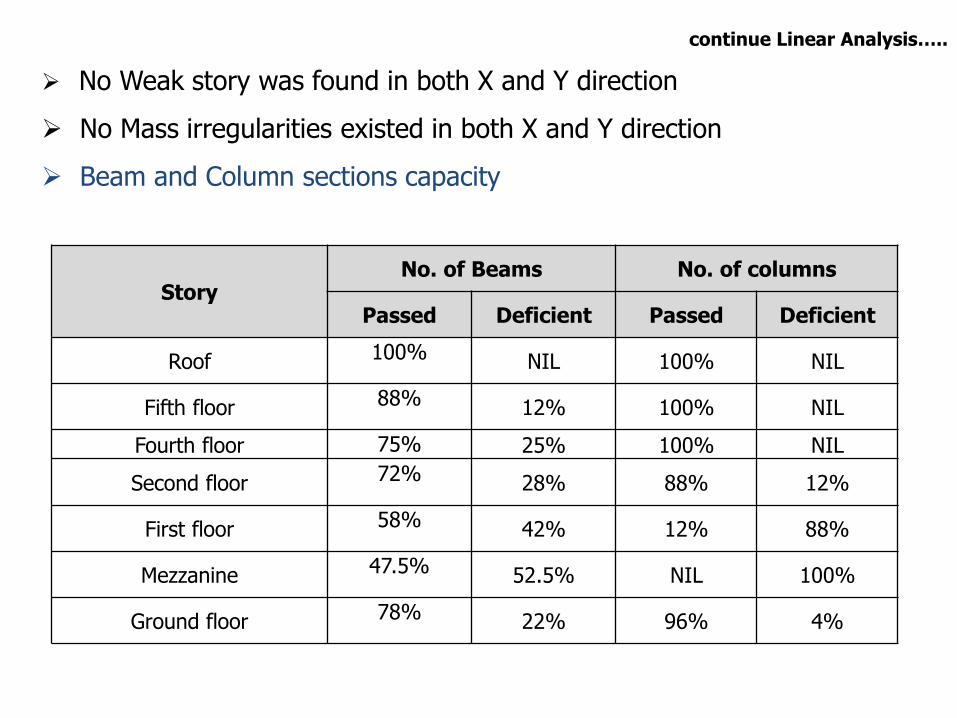
No Weak story was found in both X and Y direction
No Mass irregularities existed in both X and Y direction
Beam and Column sections capacity
Story No. of Beams No. of columns
Passed Deficient Passed Deficient
Roof 100% NIL 100% NIL
Fifth floor 88% 12% 100% NIL
Fourth floor 75% 25% 100% NIL
Second floor 72% 28% 88% 12%
First floor 58% 42% 12% 88%
Mezzanine 47.5% 52.5% NIL 100%
Ground floor 78% 22% 96% 4%

continue Linear Analysis…..
Comparison of Results With and Without Infill’s Contribution
Beam and Column capacity comparison
Story No. of deficient column
without infill’s
No. of deficient column
with infill’s
Roof 3 NIL
Fifth floor 10 NIL
Fourth floor 15 NIL
Second floor 18 3
First floor 23 22
Mezzanine 25 25
Ground floor 4 1
Story No. of deficient beam
without infill’s
No. of deficient beam
with infill’s
Roof 6 NIL
Fifth floor 26 12
Fourth floor 31 21
Second floor 34 27
First floor 34 33
Mezzanine 31 31
Ground floor 7 4

continue Linear Analysis…..
Story drift comparison of the model with infill’s and without infill’s contribution
0
1
2
3
4
5
6
7
8
0 0.02 0.04 0.06 0.08 0.1
STO
RY
DRIFT RATIO
STORY DRIFT
Without strut
With Strut

Non-Linear Analysis Number of Beam and Column sections that were found to be deficient in
linear analysis, were further analyzed in nonlinear analysis
Push Over Analysis
Is a technique by which a structure is subjected to an incremental lateral load
With the sequence of yielding and plastic hinge formation, failure of building members are noted
An iterative analysis which goes on until a pre-established criteria is satisfied
An attempt to evaluate the real strength of the building by utilizing the full
capacity of the building members
continue Non-Linear Analysis…..
Plastic Hinges
Plastic hinges are the yield capacity of a member that can be used to
monitor which member goes to the nonlinear portion, and shows the
acceptance criteria of the member
Plastic hinges had been defined and assigned for the following building members
Beams
Columns
Struts
Yield moment capacity of the Beam and Column were computed from Response 2000
Plastic rotations and Acceptance criteria for Beams and Columns have been taken from ASCE 41-06 based on “percentage of Steel”, “Shear force” and “axial load”
Plastic Displacement and Acceptance criteria for Struts have been taken from ASCE 41-06 based on infill dimensions

continue Non-Linear Analysis…..
φ
MO
ME
NT
Point A= origin
Point B= yielding
Point C= ultimate capacity
Point D= residual strength
Point E = failure
M-φ Curve for Pushover Hinge
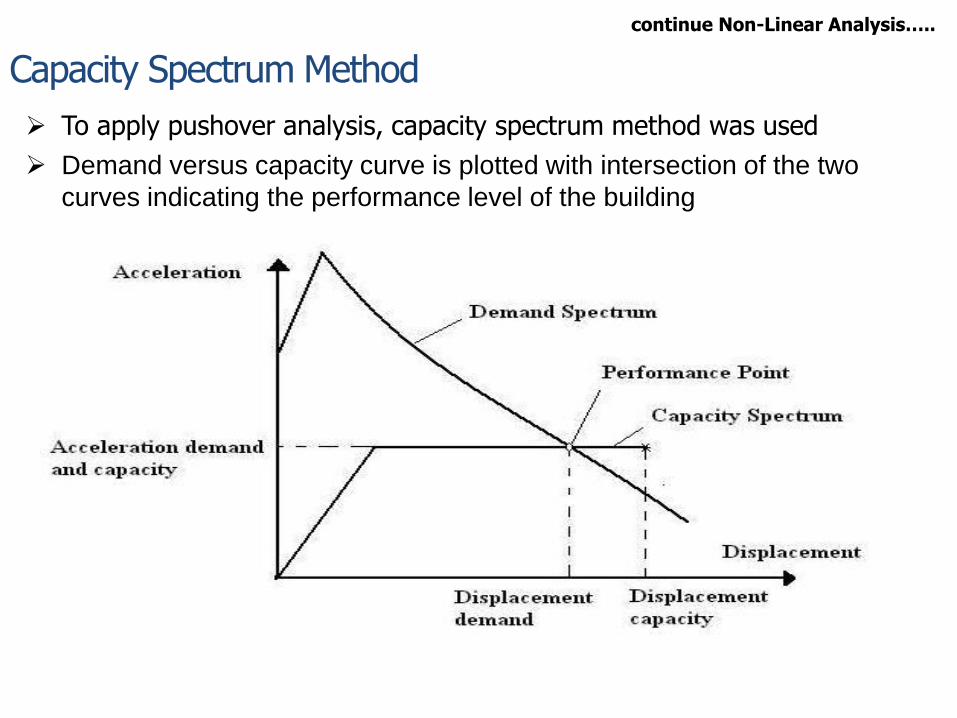
Capacity Spectrum Method
To apply pushover analysis, capacity spectrum method was used
Demand versus capacity curve is plotted with intersection of the two
curves indicating the performance level of the building
continue Non-Linear Analysis…..
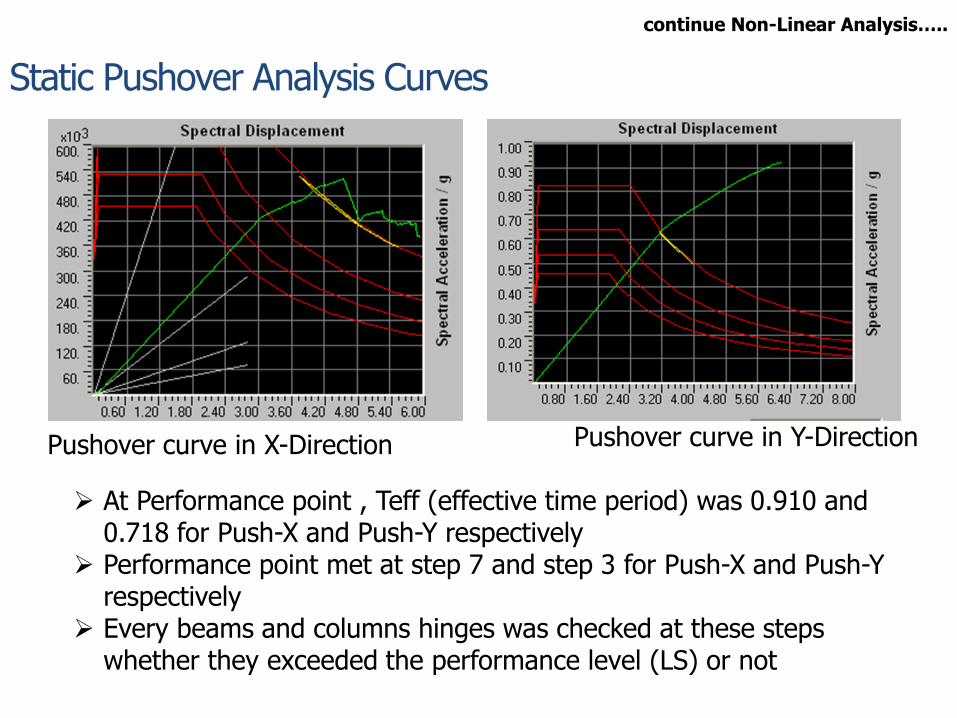
Static Pushover Analysis Curves
Pushover curve in X-Direction Pushover curve in Y-Direction
At Performance point , Teff (effective time period) was 0.910 and
0.718 for Push-X and Push-Y respectively Performance point met at step 7 and step 3 for Push-X and Push-Y
respectively Every beams and columns hinges was checked at these steps
whether they exceeded the performance level (LS) or not
continue Non-Linear Analysis…..
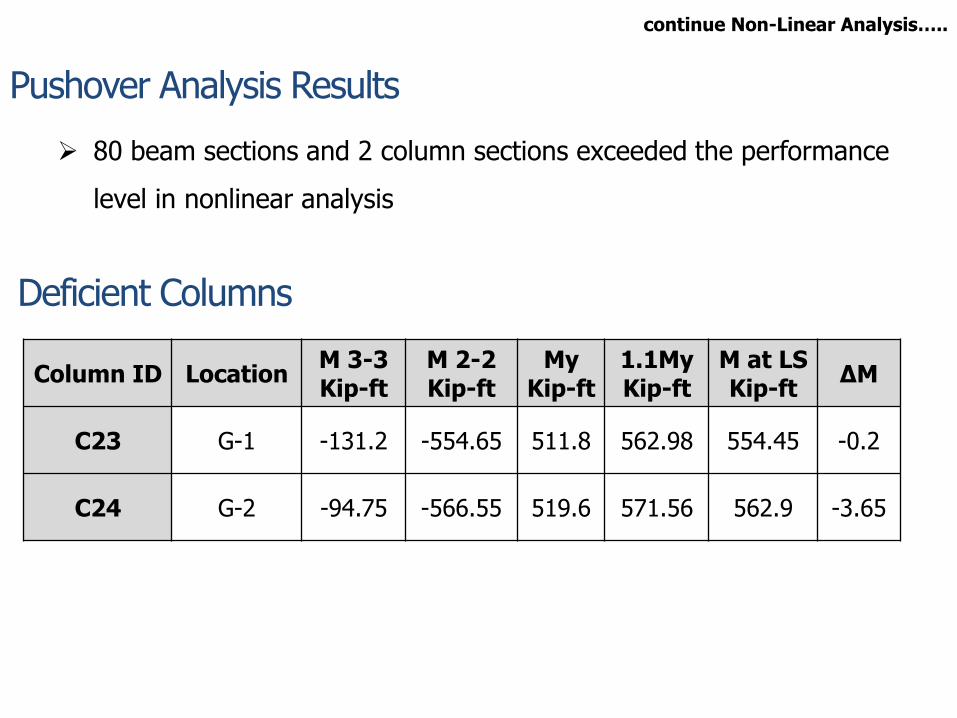
Pushover Analysis Results
80 beam sections and 2 column sections exceeded the performance
level in nonlinear analysis
Deficient Columns
Column ID Location M 3-3 Kip-ft
M 2-2 Kip-ft
My Kip-ft
1.1My Kip-ft
M at LS Kip-ft
ΔM
C23 G-1 -131.2 -554.65 511.8 562.98 554.45 -0.2
C24 G-2 -94.75 -566.55 519.6 571.56 562.9 -3.65
continue Non-Linear Analysis…..

Pushover Analysis Results continue Non-Linear Analysis…..

Deficient Beams
Story Beam Type Performance
Level No. of Beams
deficient
Ground Floor Primary - Nil
Secondary - Nil
Mezzanine Primary >LS 19
Secondary >LS 3
First Floor Primary >LS 16
Secondary >LS 7
Second Floor Primary >LS 6
Secondary >LS 7
Fourth Floor Primary >LS 4
Secondary >LS 6
Fifth Floor Primary >LS 5
Secondary >LS 7
Roof Primary - Nil
Secondary - Nil

Pushover Analysis Results
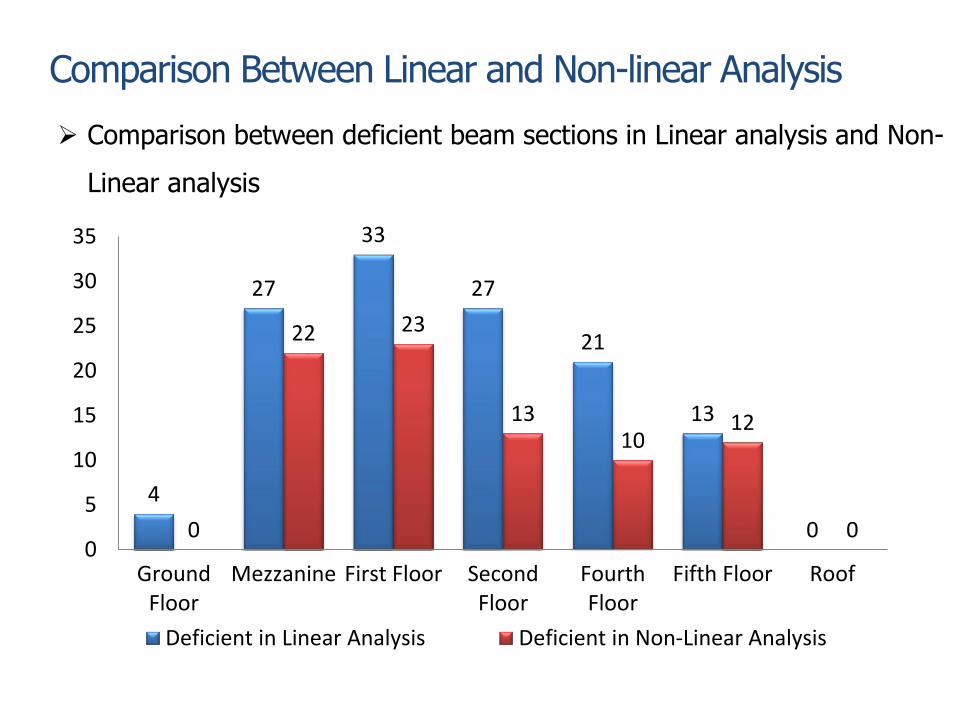
Comparison Between Linear and Non-linear Analysis
4
27
33
27
21
13
0 0
22 23
13 10
12
0 0
5
10
15
20
25
30
35
GroundFloor
Mezzanine First Floor SecondFloor
FourthFloor
Fifth Floor Roof
Deficient in Linear Analysis Deficient in Non-Linear Analysis
Comparison between deficient beam sections in Linear analysis and Non-
Linear analysis

Retrofitting
To increase the strength of the member
To increase the stiffness of the member
Proposed Retrofitting Technique
Concrete Jacketing
A common technique
Increases the member cross section
Enhances the capacity of flexural strength and shear strength
Employed as the contractors have the knowledge about it
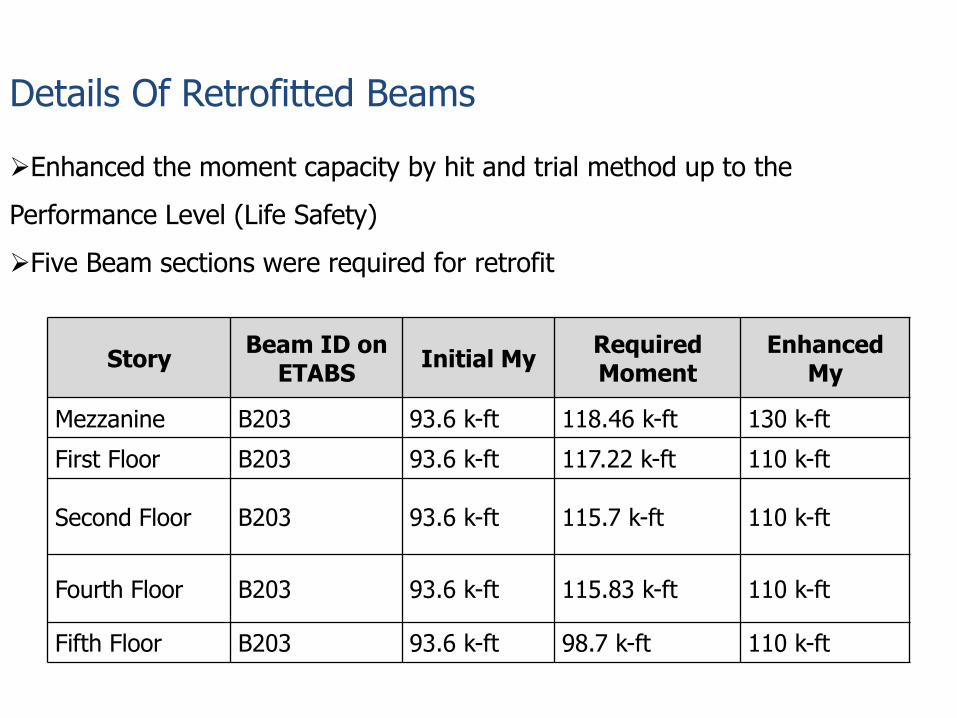
Details Of Retrofitted Beams
Story Beam ID on
ETABS Initial My
Required Moment
Enhanced My
Mezzanine B203 93.6 k-ft 118.46 k-ft 130 k-ft
First Floor B203 93.6 k-ft 117.22 k-ft 110 k-ft
Second Floor B203 93.6 k-ft 115.7 k-ft 110 k-ft
Fourth Floor B203 93.6 k-ft 115.83 k-ft 110 k-ft
Fifth Floor B203 93.6 k-ft 98.7 k-ft 110 k-ft
Enhanced the moment capacity by hit and trial method up to the
Performance Level (Life Safety)
Five Beam sections were required for retrofit
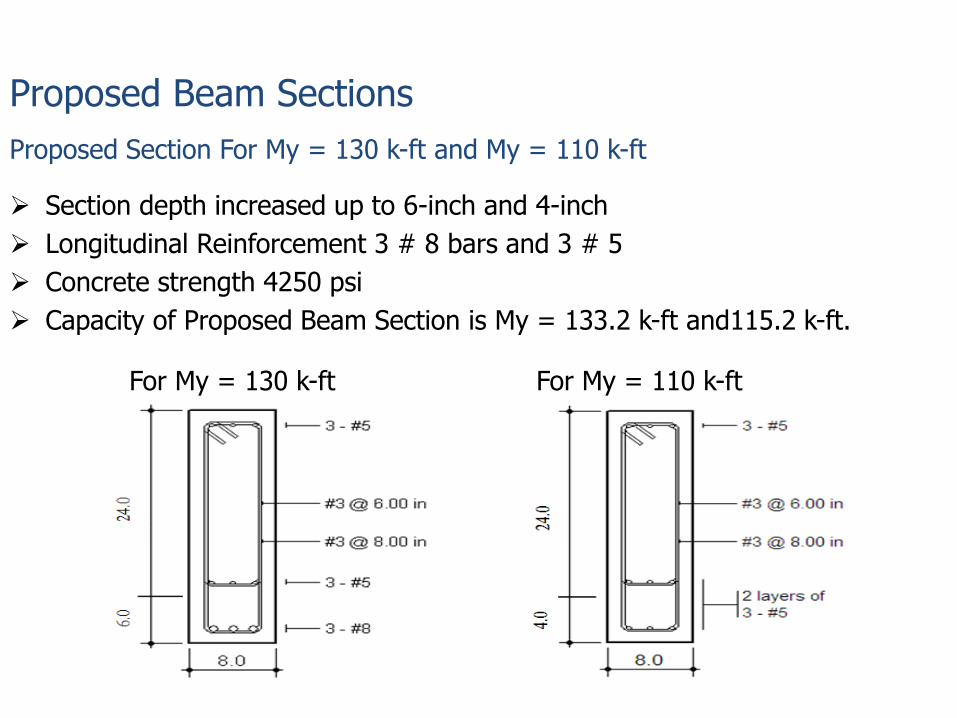
Proposed Beam Sections
Section depth increased up to 6-inch and 4-inch
Longitudinal Reinforcement 3 # 8 bars and 3 # 5
Concrete strength 4250 psi
Capacity of Proposed Beam Section is My = 133.2 k-ft and115.2 k-ft.
Proposed Section For My = 130 k-ft and My = 110 k-ft
For My = 130 k-ft For My = 110 k-ft
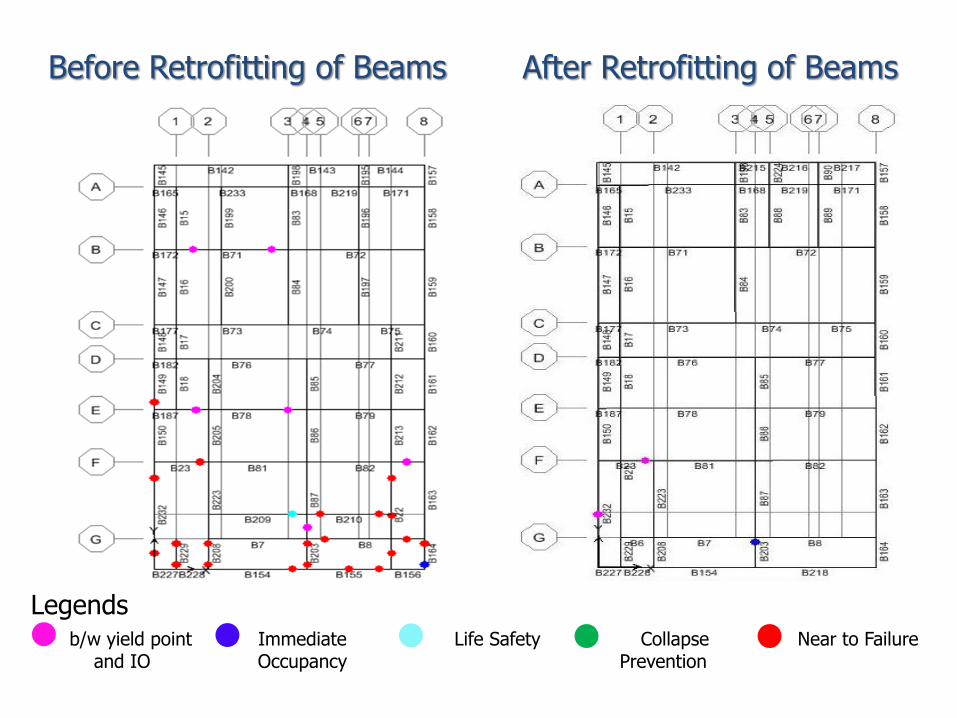
Before Retrofitting of Beams After Retrofitting of Beams
Legends b/w yield point
and IO Immediate Occupancy
Life Safety Collapse Prevention
Near to Failure

Retrofitting Of Columns
After Retrofitting of beams section, analyzed the structure in the non-linear
The Performance point was obtained at step 1
No column found was deficient as no additional moment distributed from
beam to column
Column ID
Applied Moment M 3-3 (k-ft)
Applied Moment M 2-2 (k-ft)
Yield Moment Capacity My (k-ft)
C23 -35.91 -38.59 511.8
C24 -27.89 -32.09 519.6
No need to retrofit

Push Over Curves
After Retrofitting, all members were within the performance level (Life Safety)
Before Retrofitting After Retrofitting
Pushover curve for Push X case
Conclusion
Capacity of number of beams and columns in linear analysis is inadequate to
resist the applied loads whereas in non-linear case the deficient number of
beams and columns had been significantly reduced
Number of deficient columns were less while analyzing the building with infill
walls as compared to without infill walls
Application of Performance Based Design approach reflected a clear view of
the building behaviour when analysed for Life safety
continue…..
Conclusion
By utilizing the non linear capacity of the members and providing
acceptable levels of earthquake damage to the building , can provide safety
to rest of the buildings elements
In retrofitting, after increasing the yield moment capacity of five beam
sections, all beams and columns fulfilled the limitations of performance level
(LS)
Concrete Jacketing approach was proposed for retrofitting

Acknowledgement 1. Dr. Abdul Jabbar Sangi 2. Anum Raza 3. Hafiz Muhammad Zohaib Kabir 4. Tehniat Tanveer 5. Hafiz Muhammad Rashid Mohiuddin 6. Syed Ahmed Raza