seismic evaluation of deficient reinforced concrete weak
TRANSCRIPT

SEISMIC EVALUATION OF DEFICIENT REINFORCED CONCRETE WEAK BEAM-COLUMN JOINT FRAMES
MUHAMMAD RIZWAN1, NAVEED AHMAD2, AKHTAR NAEEM KHAN3,MUHAMMAD FAHAD4
The use of old building design codes and improper execution of recent seismic design practices have caused large
amount of substandard and vulnerable reinforced concrete RC building stock majority of which are built with weak
beam-column joint connections defect (i.e. joint panel having no transverse reinforcement and built in low strength
concrete). In order to understand the seismic response and damage behaviour of recent special moment resisting
frame SMRF structures with the defect of weak beam-column joints, shake table tests have been performed on two
1:3 reduced scaled, two story RC frame models. The representative reference code design and weak beam-column
joint frame models were subjected to uni-directional dynamic excitations of increasing intensities using the natural
record of 1994 Northridge Earthquake. The input scaled excitations were applied from 5% to 130% of the
maximum input peak ground acceleration record, to deformed the test models from elastic to inelastic stage and
then to fully plastic incipient collapse stage. The weak beam-column frame experienced column flexure cracking,
longitudinal bar-slip in beam members and observed with cover concrete spalling and severe damageability of the
joint panels upon subjected to multiple dynamic excitations. The deficient frame was only able to resist 40% of
the maximum acceleration input as compared to the code design frame which was able to resist about 130%. The
seismic performance of considered RC frames was evaluated in terms of seismic response parameters (seismic
response modification, overstrength and displacement ductility factors), for critical comparison.
Keywords: reinforced concrete, special moment resisting frame, response modification factor, beam-column joints
1 PhD., Eng., University of Engineering and Technology Peshawar, Department of Civil Engineering, Khyber
Pakhtunkhwa, Pakistan, e-mail: [email protected] Associate Prof., PhD., Eng., University of Engineering and Technology Peshawar, Department of Civil Engineering,
Khyber Pakhtunkhwa, Pakistan, e-mail: [email protected] Prof., PhD., Eng., University of Engineering and Technology Peshawar, Department of Civil Engineering, Khyber
Pakhtunkhwa, Pakistan, e-mail: [email protected] Associate Prof., PhD., Eng., University of Engineering and Technology Peshawar, Department of Civil Engineering,
Khyber Pakhtunkhwa, Pakistan, e-mail: [email protected]
1. INTRODUCTION
The construction of reinforced concrete (RC) frame buildings are growing abundantly in many
developing countries of the world and mostly used for commercial, residential, office or school type
building. The prime factors for this type of construction material and building system is the
availability of vast resources of the constituents of concrete and easy adoptable construction methods.
In the developing low-income countries, the seismic codes are mostly adopted based on the
international building guidelines and code, with some regional adaptation of the region-specific
seismicity characteristics. Due to the use of old building codes and also the improper use and
execution of the current special moment resisting frame (SMRF) structures, seismic code detailing
has caused majority of these RC building having different seismic defects or deficiencies. Different
field surveys conducted recently in order to find the most typical construction and seismic
deficiencies in the general RC building stock [1-2]. These field surveys have revealed that mostly the
design or construction defects consist of substandard quality of building materials (i.e. low strength
concrete and reinforcement material) along with different non-seismic provisions. The typical non-
seismic practices that are currently available in the existing building stock consist of; not providing
shear confining ties reinforcement in the beam-column joint panel regions, use of larger ties spacing
in the RC structural member such as beam and columns, practicing reduced flexural reinforcement
requirement for the beam and column members and provision of 90o non-seismic hook for the shear
ties and stirrups along with others [1,3]. In most of these construction defects the weak beam-column
connection deficiency i.e. not having any confining shear ties in the joint panel critical regions and
constructed with substandard low strength concrete as required per the code specifications, is very
common. As also seen from past earthquakes damage observation of RC building typology, such
defects can cause severe joint failures, thus reducing the load carrying capacity of the connecting
members (beams and columns) and can cause partial or even complete collapse of the RC building
systems [2]. Furthermore, majority of such RC buildings typology are currently existing in areas with
very has high seismicity and which can be excited with the coming future earthquake demands [4]. It
is also evident from the past earthquake observations that if reinforced concrete buildings having
older non-seismic provisions or not design and constructed as per the proper design provisions will
cause significant failure upon subjected by design level earthquake demands and which can cause
huge human and economic losses [5-9]. All these shows the importance of the seismic evolution of
RC frame system with design or construction defects with in context of seismic feasibility assessment
of such building typology.
430 M. RIZWAN, N. AHMAD, A.N. KHAN, M. FAHAD

The present work aims to evaluate the seismic performance of RC special moment resisting frame
(SMRF) structures with the weak beam-column connection defects (having no transverse
confinement in beam-column panel regions and built with a low strength concrete of 14 MPa (2000
psi) which is about 33% less than the code specified concrete strength) using experimental dynamic
shaking testing. Different experimental studies (Quasi-static and dynamic shake table tests) have been
reported in the literature in order evaluate the seismic assessment of older code design buildings i.e.
not having capacity design principles and non-seismic provisions in the structural members [10-20].
Various shaking test studies have also been reported on feasibility assessment of different retrofitting
and strengthening technique provided to enhanced the performance of deficient RC frame buildings
[21-24]. Most of these studies only focus on the older code design provisions, while the seismic
assessment with the recent SMRF frame structures (i.e. beam and column members detailing as per
SMRF) and having no confinement ties in the beam-column connections panel regions and also built
with low strength concrete is not available. Similarly, the seismic response to real acceleration
shaking record and as well the, the ultimate damage mechanism and seismic performance is also not
well understood in the literature. In order evaluate the seismic performance of RC SMRF frames
with weak beam-column connections, shaking table test on representative reduced scaled models have
been conducted with multiple shaking excitations. The test structures consist of a code design frame
Model-1, a representative of a critical frame of a two-story reinforced concrete building with typical
geometry and design specification. For the seismic evolution of weak beam- column connection
defects, a similar model but built with weak beam-column connections i.e. no confining shear ties
and built in low strength concrete (33% less than the code specified compressive strength) has been
considered as Model-2. The representative frame models were shake in a uni-directional movement
using the 1994 Northridge Earthquake acceleration record with increasing shaking inputs from 5% to
130% of the peak acceleration record. The damage response and the experimental observed data in
the form of test model acceleration and displacement histories have been recorded for each run and
have been further analyze for the computation of seismic responses evolution in terms of force-
deformation relationships and seismic response parameter (response modification factors) for critical
comparisons.
SEISMIC EVALUATION OF DEFICIENT REINFORCED CONCRETE WEAK BEAM-COLUMN... 431
2. DESCRIPTION OF CONSIDERED RC FRAME STRUCTURE
For the seismic assessment of RC frame structures with the defect of having weak beam-column
connections, this study considered a typical low-rise building. For this purpose, a two-story regular
frame building structure with two bays by one bay configuration and with bay length of 5486 mm (18
feet) and story height of 3657 mm (12 feet), typically used for school, commercial and residential
type building was considered. The seismic analysis of the RC frame building was performed using
the static lateral force procedures for a region of high seismicity (0.40g peak ground acceleration)
and with stiff soil characteristics. For the concrete material, a compressive strength of 21 MPa (3000
psi) and for reinforcement material yield strength of 413 MPa (60,000 psi) was used. The analysis
and design were performed using the CSI ETABS design software considering the load combinations
as per the Building Code of Pakistan (BCP-SP 2007) and Uniform Building Code (UBC-97) [25-26]
and the seismic detailing was performed as per the American Concrete Institute ACI 318-14 [27]
special moment resisting frame SMRF seismic detailing provisions. Fig. 1 shows the frame geometry
and design details of the beam and column members. In order to evaluate the seismic assessment and
observed damage response of frame structures with weak beam-column connections, a second
deficient Model-2, having similar properties to that of code design Model-1, but, was not provided
with any ties in the beam-column joint panels and the construction was performance using low
strength concrete of 14 MPa (2000 psi), was considered. The low strength concrete used in the
deficient Model-2 construction is about 33% less than the minimum specified code value of 21 MPa
(3000 psi). For the steel rebar the similar yield strength of 413 MPa (60000 psi) was considered for
Model-2. For the dynamic shake table testing the interior frame (critical direction) was selected from
the prototype building and was reduced by a factor of 3, in order to be with in the shaking simulator
limitations. The scaling and mass simulation of the representative interior frame was performed based
on the principals of simple model idealization [28,29]. Table 1 report the scaling criterion selected
for the preparation of reduced scale frame models. In the simple scaling model idealization, the stress-
strain relations of the materials remain the same in both the prototype and model domain. Such simple
idealization was adopted because of its simplicity, low cost and less associated complexity in
modeling the material behavior in model domain [10,28]. The frame members dimensions were
scaled by a factor of SL = 3. For the model frame, a reduced size beam dimension of 101.6 mm x
152.5 mm (4 in x 6 in), column dimension of 101.6 mm x 101.6 mm (4 in x 4 in) and slab thickness
of 50.8 mm (2 in) was used. Similarly, for story height and bay length, a 1/3rd reduced length of
1219.2 mm (4 feet) and 1828.8 mm (6 feet) was used for the test model preparation.
432 M. RIZWAN, N. AHMAD, A.N. KHAN, M. FAHAD

Table 1 Simple model similitude scaling factors
For the concrete constituents scaling, only the coarse aggregate size scaling has been performed with
8.52 mm (3/8 in) down size aggregates were used in the model preparation, whereas the fine aggregate
and cement have been used without any scaling. The ACI mix design procedures were used in order
Beam member section A-A
Column member section B-B
Fig. 1. Layout of two-story frame model, geometry and members design details
Physical Quantity Scale FactorLength 3Stress 1Strain 1
Specific Mass 1Displacement 3
Force 9Time
FrequencyVelocity 1
Acceleration 1/3
SEISMIC EVALUATION OF DEFICIENT REINFORCED CONCRETE WEAK BEAM-COLUMN... 433
to obtain different batches of concrete constituents for a code specified concrete strength of 21 MPa
(3000 psi) and low strength concrete of 14 MPa (2000 psi). Two reduced scaled models i.e. code
design reference Model-1 and a deficient weak beak-column joint Model-2 were constructed after the
specified code design and low strength concrete cylinders were tested and verified. Initially a strong
reinforced concrete pad base (strong beam having dimensions of 558.8 mm (22 in) depth, 406.4 mm
(16 in) width and 2438.4 mm (8 feet long)) was constructed, and was provided with holes at regular
intervals to be used to mount and fixed the test frames on shake table steel platform through steel
bolts. After the construction of the fixed supported pad, the ground and first story were constructed
sequentially. The SMRF code design reference frame model was constructed as per the design details
and using concrete compressive strength of 21 MPa (3000 psi). The deficient frame model was
constructed with same details of Model-1 but in the joint panels regions no confinement transverse
ties were provided and the frame was built with low strength concrete of 14 MPa (2000 psi). After
the construction, the as built models were water cured for 14 days and then left for 28 days for
concrete maturity. After that the test models were shifted to the testing facility and mounted on the
shaking simulator for testing purpose. For seismic mass simulation [10, 28], a total mass of 1200 kg
(1.2 tone) was provided on each story level in the from steel plates. Each steel plate was firmly fixed
to the slab using 06 numbers, 6.35 mm (0.25 in) diameter steel bolts.
3. DYNAMIC SHAKE TABLE TESTS
3.1. TEST SETUP AND INSTRUMENTATION DETAILS
The 1/3rd scaled two-story frame model testing setup is shown in Fig. 2. Both frame models were
tested using the uni-directional seismic simulator of Earthquake Engineering Centre (EEC) Peshawar.
After shifting of the test models to the testing laboratory, a 30-tone overhead crane was used to mount
the test frame on the top of the shake table. The strong base beam of the test models was firmly fixed
to the top of the shake table using 15 number and 6.35 mm (0.25 in) diameter steel screws to provide
a fixed support in the in-plane direction as well as to stop the toppling of the frame in the out of plane
direction (perpendicular to direction of plane of the test frame). For obtaining model response
parameters (such as displacement and acceleration histories) during the shake table test, the test
frames were instrumented with six accelerometers and three linear variable displacement transducers
(LVDT). Three accelerometers on the front side, and three accelerometers on the back side were
installed at the base, first story and second/roof story level mid position. Similarly, three LVDTs were
434 M. RIZWAN, N. AHMAD, A.N. KHAN, M. FAHAD

mounted on a steel frame installed in front of the test frame (in-plane direction) at base, first story
and roof story level mid position. The thread wire from each LVDT was mounted on the base, first
story and roof story mid position level, in order to measure the displacement of each story level.
3.2. INPUT EXCITATION AND TESTING PROTOCOLS
For the shake table input shaking excitations a number of accelerogram were first examine, that can
be operated with in the displacement, velocity and acceleration limitations of the shake table. After a
number of analysis and trial shaking of equivalent weights on the shake table with different natural
acceleration records, the 1994 Northridge Earthquake natural acceleration record as shown in Fig.3,
was selected for the dynamic shaking of test frames.
Fig. 2. Test models setup on shake table
SEISMIC EVALUATION OF DEFICIENT REINFORCED CONCRETE WEAK BEAM-COLUMN... 435

Fig. 3. Input shaking record of 1994 Northridge Earthquake
The acceleration record has been obtained from the PEER strong motion data base (Recording station:
090 CDMG STATION 24278, Frequency range: 0.12-23.0 Hz) and has a peak ground acceleration
(PGA) of 0.57g. Time scaling of the input acceleration record was performed as per the conversion
factors reported in Table 1. The testing sequence and applied loading protocols in terms of scaled
excitations, for the code design Model-1 and deficient Model-2, are reported in Table 2 and Table 3.
Both reduced frames were excited with linearly scaled and increasing shakings from 5% to 130% of
the input acceleration record PGA, depending on the resisting test frames capacity. The idea of using
low intensity shaking and, increasing the shaking to high intensity was to force the frame models
from elastic to full collapse condition. For each scaled excitation, the response parameters (story
displacements and accelerations) and observed damage behavior have been recorded through
respective instrumentation and visual observations (photographs and video recording). For
displacement and acceleration time histories a data logger system was used to records the response
values.
Table 2 Input loading protocols for code design Model-1
-0,6
-0,4
-0,2
0
0,2
0,4
0,6
0 5 10 15 20 25 30 35 40
Acc
eler
atio
n (g
)
Time (sec)
Input acceleration record Run excitation (%) PGA (g)
Experimental recorded
Natural acceleration record of Northridge
Earthquake
Self-Check 0.605% 0.033
10% 0.0620% 0.1230% 0.1640% 0.1950% 0.2560% 0.3170% 0.3680% 0.4190% 0.49100% 0.62
Self-Check 130% 0.62130% (Final run) 1.06
436 M. RIZWAN, N. AHMAD, A.N. KHAN, M. FAHAD

Table 3 Input loading protocols for deficient Model-2
The data logger records the accelerometers and LVDTs data in the form current (voltage mv/in or
mv/g) values. For each installed accelerometer and LVDTs, instrument coefficient factors have been
used to obtain the displacement and acceleration values in the units of length (mm or in) and
acceleration (g) respectively. The raw data was further process for base line correction and data
filtering in order remove any noise observed during experimental testing. For the base line correction
and noise data filtering the data processing software SeismoSignal (2018) was utilized. Table 4 and
Table 5 reports the deficient weak beam column joint Model-2 experimentally recorded top/roof story
displacement and acceleration histories for the 5% run, 30% run and final 40% run excitations, with
corresponding peak values.
Table 4 Experimentally observed roof displacement responses for deficient Model-2
Run Story level Displacement history (mm)
5%
Peak Value123.68mm
Roof story level
30%
Peak Value182.36mm
Roof story level
-150
-100
-50
0
50
100
150
0 10 20 30 40 50
Dis
plac
emen
t (m
m)
Time (sec)
Peak
-200
-100
0
100
200
300
0 10 20 30 40 50
Dis
plac
emen
t (m
m)
Time (sec)
Input acceleration record
Run excitation (%)
PGA (g)Experimental recorded
Natural acceleration record of Northridge
Earthquake
Self-Check 0.0155% 0.52
10% 0.2520% 0.3130% 0.35
40% (Final run) 0.73
Peak
SEISMIC EVALUATION OF DEFICIENT REINFORCED CONCRETE WEAK BEAM-COLUMN... 437
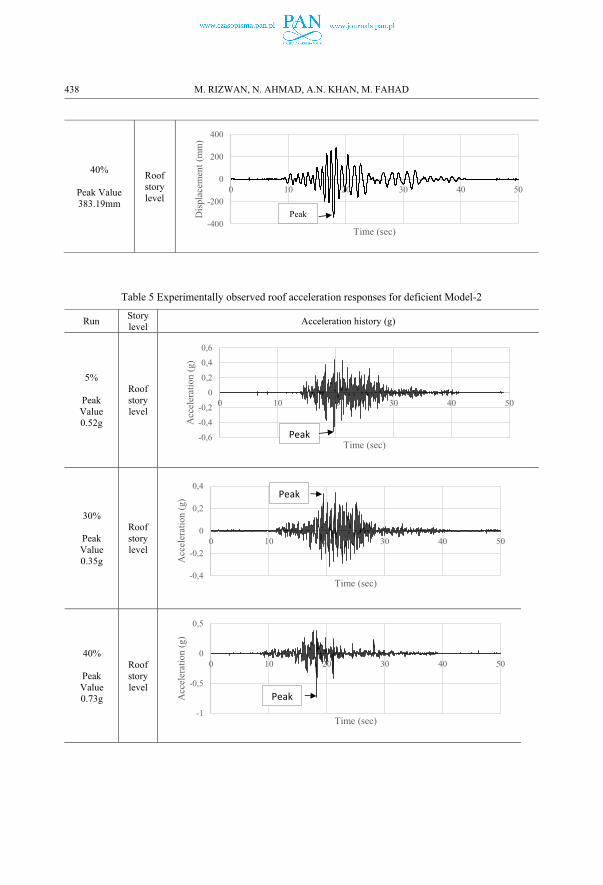
40%
Peak Value383.19mm
Roof story level
Table 5 Experimentally observed roof acceleration responses for deficient Model-2
Run Story level Acceleration history (g)
5%
Peak Value0.52g
Roof story level
30%
Peak Value0.35g
Roof story level
40%
Peak Value0.73g
Roof story level
-400
-200
0
200
400
0 10 20 30 40 50D
ispl
acem
ent (
mm
)
Time (sec)
Peak
-0,6
-0,4
-0,2
0
0,2
0,4
0,6
0 10 20 30 40 50
Acc
eler
atio
n (g
)
Time (sec)Peak
-0,4
-0,2
0
0,2
0,4
0 10 20 30 40 50
Acc
eler
atio
n (g
)
Time (sec)
Peak
-1
-0,5
0
0,5
0 10 20 30 40 50
Acc
eler
atio
n (g
)
Time (sec)
Peak
438 M. RIZWAN, N. AHMAD, A.N. KHAN, M. FAHAD
3.3. OBSERVE DAMAGE RESPONSE
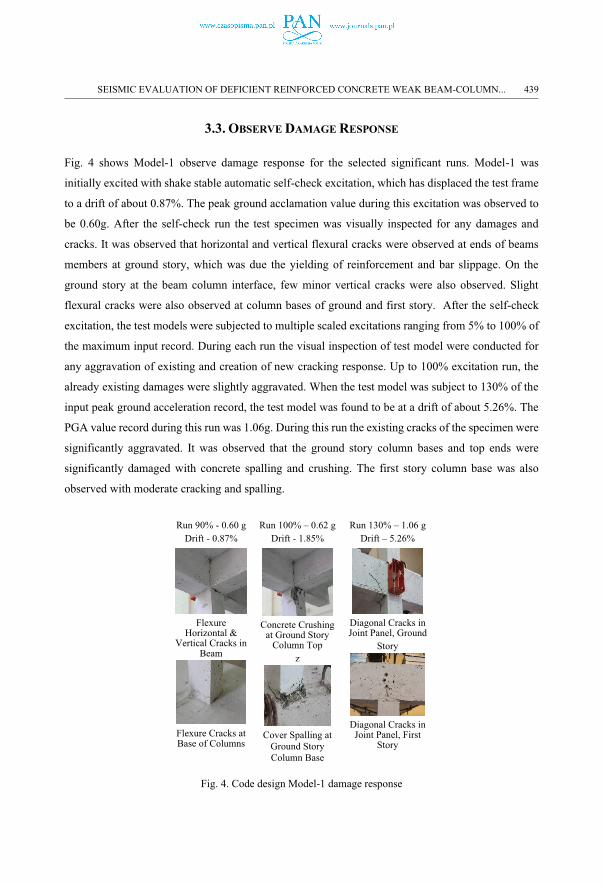
Fig. 4 shows Model-1 observe damage response for the selected significant runs. Model-1 was
initially excited with shake stable automatic self-check excitation, which has displaced the test frame
to a drift of about 0.87%. The peak ground acclamation value during this excitation was observed to
be 0.60g. After the self-check run the test specimen was visually inspected for any damages and
cracks. It was observed that horizontal and vertical flexural cracks were observed at ends of beams
members at ground story, which was due the yielding of reinforcement and bar slippage. On the
ground story at the beam column interface, few minor vertical cracks were also observed. Slight
flexural cracks were also observed at column bases of ground and first story. After the self-check
excitation, the test models were subjected to multiple scaled excitations ranging from 5% to 100% of
the maximum input record. During each run the visual inspection of test model were conducted for
any aggravation of existing and creation of new cracking response. Up to 100% excitation run, the
already existing damages were slightly aggravated. When the test model was subject to 130% of the
input peak ground acceleration record, the test model was found to be at a drift of about 5.26%. The
PGA value record during this run was 1.06g. During this run the existing cracks of the specimen were
significantly aggravated. It was observed that the ground story column bases and top ends were
significantly damaged with concrete spalling and crushing. The first story column base was also
observed with moderate cracking and spalling.
Fig. 4. Code design Model-1 damage response
Run 90% - 0.60 gDrift - 0.87%
Run 100% – 0.62 gDrift - 1.85%
Run 130% – 1.06 gDrift – 5.26%
Flexure Horizontal &
Vertical Cracks in Beam
Flexure Cracks at Base of Columns
Concrete Crushing at Ground Story
Column Topz
Cover Spalling at Ground Story Column Base
Diagonal Cracks in Joint Panel, Ground
Story
Diagonal Cracks in Joint Panel, First
Story
SEISMIC EVALUATION OF DEFICIENT REINFORCED CONCRETE WEAK BEAM-COLUMN... 439

Severe diagonal cracking was also observed on the joint panel regions and transverse beam of the
ground story. Some minor cracking in the diagonal direction were also observed at the joint panel of
the first story. The test model was found to be in the near incipient collapse stage and testing was stop
after this run.
Fig. 5 shows the weak beam-column joint frame Model-2 observed damage response for the selected
significant runs. Initially this model was excited with a self-check excitation which has displaced the
test model to a drift of about 0.2% and the PGA value observed to be 0.05g. No visible cracks were
observed during the self-check excitation. After this the test models were excited with 5% run during
which the test model was laterally displaced to drift of about 1.75% and the observed PGA was about
0.52g. During this run the deficient model was observed with slight flexural cracks at the column
bases of the ground story. Significant flexural cracks were also observed at the bases of the first story
column. Diagonal cracks were also observed at joint panel regions of the first story and slight bat like
cracks were observed at the panel region of the ground story. During this run, minor vertical and
significant horizontal cracks were also observed at the beam member ends, both at the ground and
first story. After this test model was excited with 10% and 20% shaking, during which the existing
cracks were observed with minor aggravations.
Fig. 5. Deficient weak beam-column joint Model-2 damage response
When the test model was exited with the 30% input acceleration record, the test model was laterally
displaced to a drift of about 2.75% and the observed PGA was 0.35g. During this run the already
existing cracking pattern were significantly aggravated with flexural cracks were further widens at
Run 5%– 0.52gDrfit % - 1.75%
Run 30% – 0.35 gDrfit % - 2.75%
Run 40% – 0.73 gDrift – 4.77%
Flexure Cracks in Beams and
Columns, Ground Story
Slight Cracks in Joint Panel on Ground Story
Severe Bat-Like Cracks in Joints on
First Story
Damage Progress in Joint Panel on
Ground Story
Cover Detachment and Damage in Joint
on First Story
Severe Damage to Joint Panel on Ground Story
440 M. RIZWAN, N. AHMAD, A.N. KHAN, M. FAHAD

the end of the beam and column members. The cracks on the ground and first story were further
widens and spread over the panel regions. Significant detachment of the cover concrete was also
observed at the ground story panel and transverse beams region. When the test model was further
excited to 40% of the input excitation, the test specimen was laterally displaced to a drift of about
4.77% and the observe PGA was about 0.73g. During this run the test models experienced severe
damages at beams and columns end with cover spalling and crushing of concrete. Joint panels on the
first story were severely damaged with cover concrete wedge detachment and spalling. The model
after this run was found to be in the incipient collapse state. Fig. 6 shows the test model joint panel
observed damage responses at final runs i.e. at the incipient collapse state.
Fig. 6. Joint panel damage response at incipient collapse state
Model-1 at final 130% Run
Model-2 at final 40% Run
First story front and back side joint panels
Ground story front and back side joint panels
SEISMIC EVALUATION OF DEFICIENT REINFORCED CONCRETE WEAK BEAM-COLUMN... 441

4. SEISMIC EVOLUTION OF CONSIDERED FRAMES STRUCTURES
4.1. SEISMIC RESPONSE CURVES
Seismic response curves which basically shows the relationship between peak displacement (or drift)
demands and peak ground acceleration PGA, have been obtained for the reference prototype Model-
1 and deficient Model-2 using the experimental observed data. For this purpose, first, the shake table
test data have been transferred using the scaling factors as shown in Table 1. The peak values of
top/first story displacement have been obtained for each run and, correlated with the corresponding
peak PGA in order to develop the seismic response curves as shown in Fig. 7. As observed from Fig.
7, the reference prototype frame structure was able to withstand higher intensity level shaking both
in the elastic and at the final near collapse state as compared to the deficient frame structure. The code
design frame was in near incipient collapsed condition at intensity shaking of about 130% i.e. at an
input PGA level of about 1.06g. Whereas, the substandard weak beam-column frame with no shear
reinforcement in the panel region as well built in low concrete strength, has resisted about 40% i.e. at
an input PGA level of about 0.73g of input acceleration record.
Fig. 7. Prototype frame seismic response curves
4.2. FORCE-DEFORMATION RELATIONSHIPS
For the prototype frame structures, force-displacement curves have been developed by corelating the
peak values of displacement and total base shear force for each run. In order to calculate the maximum
values of base shear forces, the peak value of acceleration for each run have been obtained from the
0
0,2
0,4
0,6
0,8
1
1,2
0 100 200 300 400
PGA
(g)
First Story Displacement (mm)
Model-1
Model-2
442 M. RIZWAN, N. AHMAD, A.N. KHAN, M. FAHAD

experimental testing. The peak values of the acceleration records for each story level were multiplied
with the corresponding mass of that story. For the total mass/weight on each story; the self-weight of
beam, column, slab portion and the extra seismic mass used during the dynamic testing was
employed. The total base shear force has been computed using Eq. (1) to Eq. (3):
Where is the total base shear force at base of the frame, and are maximum story shear at the
first and roof story level, and are masses at the first and roof story level, and are the
recorded peak values of acceleration at the first and roof story level. The story shear forces for both
story levels are added to calculate the total base shear force for the prototype structure. The total base
shear force for each run is further corelated with the corresponding peak values of displacement to
develop the force-deformation relations for the code design Model-1 and deficient Model-2 prototype
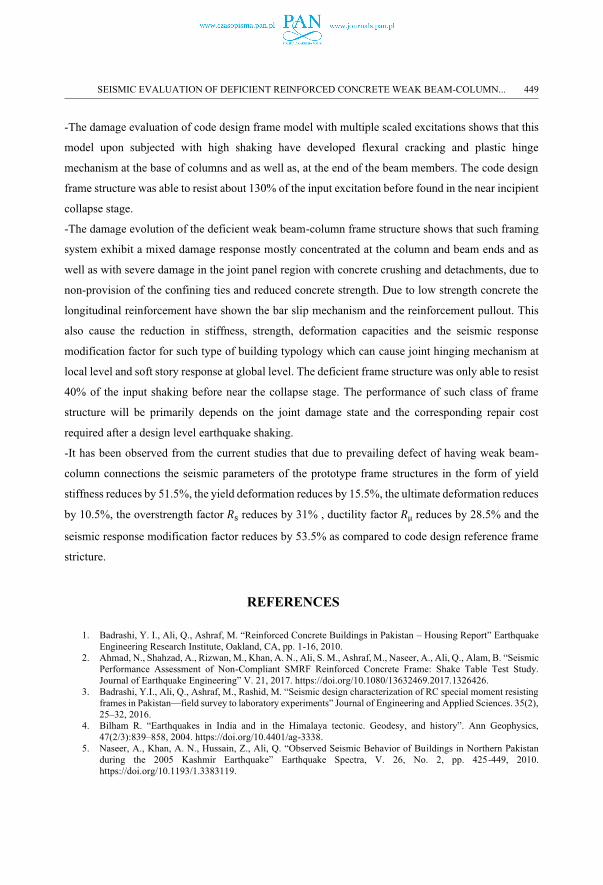
structure as shown in Fig. 8. In order to have a quantitative comparison between the reference code
design and weak beam-column joint frames and also, to compute different seismic response
parameters, the nonlinear force-displacement correlations were further converted to simple bilinear
relationships using the energy balance technique. For this reason, the area under the nonlinear force-
displacement were normalized to an equivalent bilinear force-displacement with well define yield
displacement, ultimate displacement and yield force. Fig. 9 and Fig. 10 shows the developed idealized
bilinear force-displacement correlations for the considered Model-1 and Model-2. For the ultimate
displacement of the bilinear force-displacement relationships, the maximum displacement demands
obtained from the shake table tests (i.e. for Model-1 375 mm and for Model-2 280 mm) have used.
As shown in Fig. 11, the yield stiffness, strength and also the peak displacement capacity or ductility
generally decreases for the case of deficient weak beam-column Model-2. In case of deficient weak
beam-column joint frame Model-2, the yield displacement increased by 40%, ultimate displacement
decreased by 9%, the yielding force decreased by 31.5% and the yield stiffness decreased by about
50% as compared to the code design Model-1.
SEISMIC EVALUATION OF DEFICIENT REINFORCED CONCRETE WEAK BEAM-COLUMN... 443
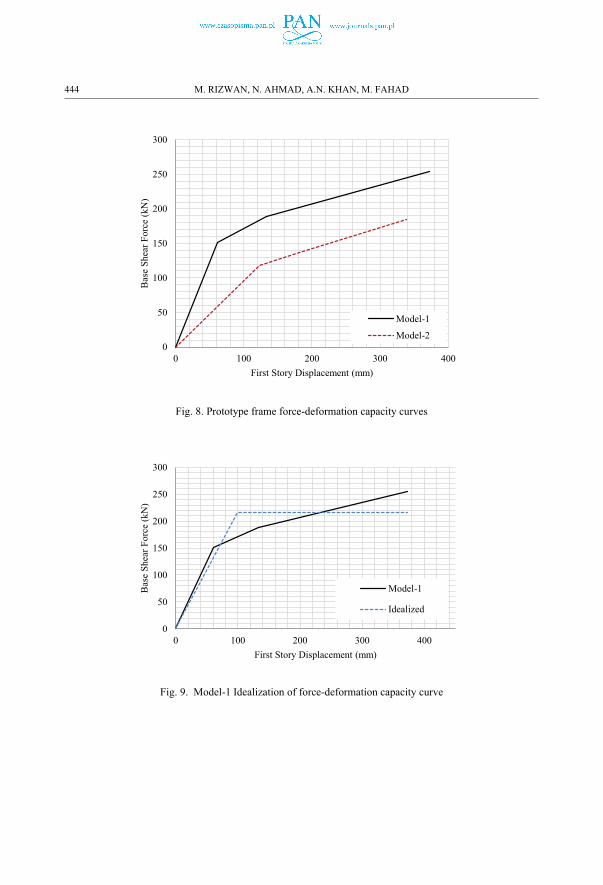
Fig. 8. Prototype frame force-deformation capacity curves
Fig. 9. Model-1 Idealization of force-deformation capacity curve
0
50
100
150
200
250
300
0 100 200 300 400
Bas
e Sh
ear F
orce
(kN
)
First Story Displacement (mm)
Model-1
Model-2
0
50
100
150
200
250
300
0 100 200 300 400
Bas
e Sh
ear F
orce
(kN
)
First Story Displacement (mm)
Model-1
Idealized
444 M. RIZWAN, N. AHMAD, A.N. KHAN, M. FAHAD

Fig. 10. Model-2 Idealization of force-deformation capacity curve
Fig. 11. Response parameter from idealized force-displacement relationships
020406080
100120140160180200
0 100 200 300 400
Bas
e Sh
ear F
orce
(kN
)
First Story Displacement (mm)
Model-2
Idealized
0
20
40
60
80
100
120
140
160
Yie
ld d
ispl
acem
ent (
mm
)
Model-1
Model-2
320
330
340
350
360
370
380
Ulti
mat
e di
spla
cem
ent
(mm
) Model-1
Model-2
0
50
100
150
200
250
Yie
ld fo
rce
(kN
)
Model-1
Model-2
0
500
1000
1500
2000
2500
Yie
ld st
iffne
ss (k
N/m
)
Model-1
Model-2
SEISMIC EVALUATION OF DEFICIENT REINFORCED CONCRETE WEAK BEAM-COLUMN... 445

4.3. SEISMIC RESPONSE MODIFICATION FACTORS
The seismic evolution of the considered frame models was also investigated in term of the structural
seismic response modification factors. These factors are used in the building codes to allow the use
of linear elastic seismic analysis of structural systems (lateral force procedure and response spectrum
methods), and are used to account for the structural nonlinear response and energy dissipation
behavior [30-35]. Generally, the response modification factors can be obtained from the inelastic
force-deformation capacity curves as shown in Fig. 12 and can be computed mathematically using
Eq. (4) [31-32].
Where, is force required for the structural system to remain within the elastic limits; is the force
values at the yield strength from the idealize bi-linear curves; is the force requiring for the design
level demand; is the ductility factor and is the overstrength factor. can be obtained using
force-deformation capacity curves from the ratio of the idealized yield strength to the design base
shear force . In the current study the ductility factor is couple with the structural ductility and
is obtained from the analytical procedure [36] and as given in Eq. (5) to Eq. (7).
For short period structures having fundamental time period T less than 0.20 sec the value of can
be taken as 1, for intermediate period structures having the fundamental time period in the range of
0.2 to 0.5 sec, the value of can be computed as √((2μ -1)) and similarly, for the longer period
structures with a fundamental time period of more than 0.5 sec, the value of can be equal the
ductility μ of the system [36].
446 M. RIZWAN, N. AHMAD, A.N. KHAN, M. FAHAD

Fig. 12. Response modification factor parameters from capacity curve [31]
The response modification factor for the considered RC prototype code design and deficient frame
structures were obtained by multiplying the ductility dependent factor Rμ with the over strength
reduction factor. Fig. 13 report the seismic parameters and response modification factor for
considered prototype frame structures. It can be seen that the response modification factor for the
code design frame Model-1 is approximated as 7.5 which about 10% less than the UBC/BCP-SP 2007
code specified value of 8.5 for reinforced concrete SMRF structures. The response modification factor
for the deficient frame structure with no provision of confinement ties in the joint panel regions and
built with low strength concrete has been obtained approximately as 3.50, which about 53.5% less
than Model-1 value and about 59% less than code specified value of 8.5. It has been observed from
the current studies that due to prevailing defect of having weak beam-column connections the seismic
parameters of the prototype frame structures in the form of yield stiffness reduces by 51.5%, the yield
deformation reduces by 15.5%, the ultimate deformation reduces by 10.5%, the overstrength factor
reduces by 31% , ductility factor reduces by 28.5% and the seismic response modification
factor reduces by 53.5% as compared to code design reference frame stricture.
SEISMIC EVALUATION OF DEFICIENT REINFORCED CONCRETE WEAK BEAM-COLUMN... 447

Fig. 13. Structural seismic response parameters
4. CONCLUSION
Due to the use of old seismic design building codes and the improper construction executions of the
recent SMRF seismic detailing, numerous defects are currently existing in the RC building stock more
specifically in the developing countries. The construction or design defects of having a weak beam-
column connection (i.e. the joint panel not provided with the confining shear ties and constructed
with low strength concrete of about 33% less the code specified value for concrete compressive
strength) is very common and can cause partial or full collapse of RC buildings. In order to evaluate
the seismic performance of current reinforced concrete special moment resisting frame SMFR
building with the construction deficiency of having weak beam-column connections, dynamic
shaking tests were performed on representative frame models.
The following conclusion have been summarized from the current experimental studies and seismic
evaluation of the considered RC frame structures:
0
0,5
1
1,5
2
Dis
plac
emen
t duc
tility
Model-1
Model-2
00,5
11,5
22,5
33,5
44,5
Ove
r stre
ngth
fact
or R
s
Model-1
Model-2
0
0,5
1
1,5
2
Duc
tility
bas
ed f
acto
r
Model-1
Model-2
0
1
2
3
4
5
6
7
8R
espo
nse
mod
ifica
tion
fact
or R Model-1
Model-2
448 M. RIZWAN, N. AHMAD, A.N. KHAN, M. FAHAD
-The damage evaluation of code design frame model with multiple scaled excitations shows that this
model upon subjected with high shaking have developed flexural cracking and plastic hinge
mechanism at the base of columns and as well as, at the end of the beam members. The code design
frame structure was able to resist about 130% of the input excitation before found in the near incipient
collapse stage.
-The damage evolution of the deficient weak beam-column frame structure shows that such framing
system exhibit a mixed damage response mostly concentrated at the column and beam ends and as
well as with severe damage in the joint panel region with concrete crushing and detachments, due to
non-provision of the confining ties and reduced concrete strength. Due to low strength concrete the
longitudinal reinforcement have shown the bar slip mechanism and the reinforcement pullout. This
also cause the reduction in stiffness, strength, deformation capacities and the seismic response
modification factor for such type of building typology which can cause joint hinging mechanism at
local level and soft story response at global level. The deficient frame structure was only able to resist
40% of the input shaking before near the collapse stage. The performance of such class of frame
structure will be primarily depends on the joint damage state and the corresponding repair cost
required after a design level earthquake shaking.
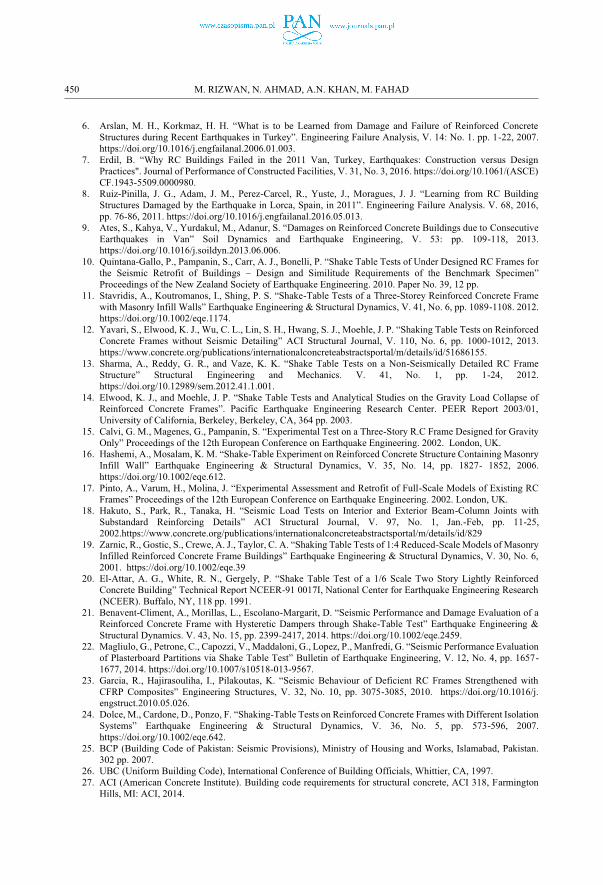
-It has been observed from the current studies that due to prevailing defect of having weak beam-
column connections the seismic parameters of the prototype frame structures in the form of yield
stiffness reduces by 51.5%, the yield deformation reduces by 15.5%, the ultimate deformation reduces
by 10.5%, the overstrength factor reduces by 31% , ductility factor reduces by 28.5% and the
seismic response modification factor reduces by 53.5% as compared to code design reference frame
stricture.
REFERENCES
1. Badrashi, Y. I., Ali, Q., Ashraf, M. “Reinforced Concrete Buildings in Pakistan – Housing Report” Earthquake Engineering Research Institute, Oakland, CA, pp. 1-16, 2010.
2. Ahmad, N., Shahzad, A., Rizwan, M., Khan, A. N., Ali, S. M., Ashraf, M., Naseer, A., Ali, Q., Alam, B. “Seismic Performance Assessment of Non-Compliant SMRF Reinforced Concrete Frame: Shake Table Test Study. Journal of Earthquake Engineering” V. 21, 2017. https://doi.org/10.1080/13632469.2017.1326426.
3. Badrashi, Y.I., Ali, Q., Ashraf, M., Rashid, M. “Seismic design characterization of RC special moment resisting frames in Pakistan—field survey to laboratory experiments” Journal of Engineering and Applied Sciences. 35(2), 25–32, 2016.
4. Bilham R. “Earthquakes in India and in the Himalaya tectonic. Geodesy, and history”. Ann Geophysics, 47(2/3):839–858, 2004. https://doi.org/10.4401/ag-3338.
5. Naseer, A., Khan, A. N., Hussain, Z., Ali, Q. “Observed Seismic Behavior of Buildings in Northern Pakistan during the 2005 Kashmir Earthquake” Earthquake Spectra, V. 26, No. 2, pp. 425-449, 2010. https://doi.org/10.1193/1.3383119.
SEISMIC EVALUATION OF DEFICIENT REINFORCED CONCRETE WEAK BEAM-COLUMN... 449
6. Arslan, M. H., Korkmaz, H. H. “What is to be Learned from Damage and Failure of Reinforced Concrete Structures during Recent Earthquakes in Turkey”. Engineering Failure Analysis, V. 14: No. 1. pp. 1-22, 2007. https://doi.org/10.1016/j.engfailanal.2006.01.003.
7. Erdil, B. “Why RC Buildings Failed in the 2011 Van, Turkey, Earthquakes: Construction versus DesignPractices". Journal of Performance of Constructed Facilities, V. 31, No. 3, 2016. https://doi.org/10.1061/(ASCE) CF.1943-5509.0000980.
8. Ruiz-Pinilla, J. G., Adam, J. M., Perez-Carcel, R., Yuste, J., Moragues, J. J. “Learning from RC Building Structures Damaged by the Earthquake in Lorca, Spain, in 2011”. Engineering Failure Analysis. V. 68, 2016, pp. 76-86, 2011. https://doi.org/10.1016/j.engfailanal.2016.05.013.
9. Ates, S., Kahya, V., Yurdakul, M., Adanur, S. “Damages on Reinforced Concrete Buildings due to Consecutive Earthquakes in Van” Soil Dynamics and Earthquake Engineering, V. 53: pp. 109-118, 2013. https://doi.org/10.1016/j.soildyn.2013.06.006.
10. Quintana-Gallo, P., Pampanin, S., Carr, A. J., Bonelli, P. “Shake Table Tests of Under Designed RC Frames forthe Seismic Retrofit of Buildings – Design and Similitude Requirements of the Benchmark Specimen” Proceedings of the New Zealand Society of Earthquake Engineering. 2010. Paper No. 39, 12 pp.
11. Stavridis, A., Koutromanos, I., Shing, P. S. “Shake-Table Tests of a Three-Storey Reinforced Concrete Frame with Masonry Infill Walls” Earthquake Engineering & Structural Dynamics, V. 41, No. 6, pp. 1089-1108. 2012. https://doi.org/10.1002/eqe.1174.
12. Yavari, S., Elwood, K. J., Wu, C. L., Lin, S. H., Hwang, S. J., Moehle, J. P. “Shaking Table Tests on Reinforced Concrete Frames without Seismic Detailing” ACI Structural Journal, V. 110, No. 6, pp. 1000-1012, 2013. https://www.concrete.org/publications/internationalconcreteabstractsportal/m/details/id/51686155.
13. Sharma, A., Reddy, G. R., and Vaze, K. K. “Shake Table Tests on a Non-Seismically Detailed RC Frame Structure” Structural Engineering and Mechanics. V. 41, No. 1, pp. 1-24, 2012. https://doi.org/10.12989/sem.2012.41.1.001.
14. Elwood, K. J., and Moehle, J. P. “Shake Table Tests and Analytical Studies on the Gravity Load Collapse of Reinforced Concrete Frames”. Pacific Earthquake Engineering Research Center. PEER Report 2003/01, University of California, Berkeley, Berkeley, CA, 364 pp. 2003.
15. Calvi, G. M., Magenes, G., Pampanin, S. “Experimental Test on a Three-Story R.C Frame Designed for Gravity Only” Proceedings of the 12th European Conference on Earthquake Engineering. 2002. London, UK.
16. Hashemi, A., Mosalam, K. M. “Shake-Table Experiment on Reinforced Concrete Structure Containing Masonry Infill Wall” Earthquake Engineering & Structural Dynamics, V. 35, No. 14, pp. 1827- 1852, 2006. https://doi.org/10.1002/eqe.612.
17. Pinto, A., Varum, H., Molina, J. “Experimental Assessment and Retrofit of Full-Scale Models of Existing RC Frames” Proceedings of the 12th European Conference on Earthquake Engineering. 2002. London, UK.
18. Hakuto, S., Park, R., Tanaka, H. “Seismic Load Tests on Interior and Exterior Beam-Column Joints with Substandard Reinforcing Details” ACI Structural Journal, V. 97, No. 1, Jan.-Feb, pp. 11-25, 2002.https://www.concrete.org/publications/internationalconcreteabstractsportal/m/details/id/829
19. Zarnic, R., Gostic, S., Crewe, A. J., Taylor, C. A. “Shaking Table Tests of 1:4 Reduced-Scale Models of Masonry Infilled Reinforced Concrete Frame Buildings” Earthquake Engineering & Structural Dynamics, V. 30, No. 6, 2001. https://doi.org/10.1002/eqe.39
20. El-Attar, A. G., White, R. N., Gergely, P. “Shake Table Test of a 1/6 Scale Two Story Lightly Reinforced Concrete Building” Technical Report NCEER-91 0017I, National Center for Earthquake Engineering Research (NCEER). Buffalo, NY, 118 pp. 1991.
21. Benavent-Climent, A., Morillas, L., Escolano-Margarit, D. “Seismic Performance and Damage Evaluation of a Reinforced Concrete Frame with Hysteretic Dampers through Shake-Table Test” Earthquake Engineering & Structural Dynamics. V. 43, No. 15, pp. 2399-2417, 2014. https://doi.org/10.1002/eqe.2459.
22. Magliulo, G., Petrone, C., Capozzi, V., Maddaloni, G., Lopez, P., Manfredi, G. “Seismic Performance Evaluation of Plasterboard Partitions via Shake Table Test” Bulletin of Earthquake Engineering, V. 12, No. 4, pp. 1657-1677, 2014. https://doi.org/10.1007/s10518-013-9567.
23. Garcia, R., Hajirasouliha, I., Pilakoutas, K. “Seismic Behaviour of Deficient RC Frames Strengthened with CFRP Composites” Engineering Structures, V. 32, No. 10, pp. 3075-3085, 2010. https://doi.org/10.1016/j. engstruct.2010.05.026.
24. Dolce, M., Cardone, D., Ponzo, F. “Shaking-Table Tests on Reinforced Concrete Frames with Different Isolation Systems” Earthquake Engineering & Structural Dynamics, V. 36, No. 5, pp. 573-596, 2007. https://doi.org/10.1002/eqe.642.
25. BCP (Building Code of Pakistan: Seismic Provisions), Ministry of Housing and Works, Islamabad, Pakistan. 302 pp. 2007.
26. UBC (Uniform Building Code), International Conference of Building Officials, Whittier, CA, 1997.27. ACI (American Concrete Institute). Building code requirements for structural concrete, ACI 318, Farmington
Hills, MI: ACI, 2014.
450 M. RIZWAN, N. AHMAD, A.N. KHAN, M. FAHAD

28. Morcarz, P., and Krawinkler, H. Theory and Application of Experimental Model Analysis in Earthquake Engineering, Technical Report Report No. 50, CA, 1981, 272 pp. 1981.
29. Rizwan M, Ahmad N, Naeem Khan A, Qazi S, Akbar J, Fahad M. Shake table investigations on code non-compliant reinforced concrete frames. Alexandria Engineering Journal. 59:349-67. 2020.https://doi.org/10.1016/j.aej.2019.12.047.
30. Applied Technology Council (ATC), “Structural Response Modification Factors” (ATC-19), Redwood City, California, 1995.
31. Mondal A, Ghosh S & Reddy GR. “Performance-based evaluation of the response reduction factor for ductile RC frames” Engineering Structures, 56: 1808 – 1819, 2013. https://doi.org/10.1016/j.engstruct.2013.07.038.
32. Miranda E, Bertero V. “Evaluation of strength reduction factors for earthquake resistant design” Earthquake Spectra, 1994. https://doi.org/10.1193/1.1585778.
33. ASCE SEI/ASCE 7-05. Minimum design loads for buildings and other structures. Reston (USA): American Society of Civil Engineers; 2005.
34. Nishanth M, Visuvasam J, Simon J, Packiaraj JS. “Assessment of seismic response reduction factor for moment resisting RC frames” IOP Conference Series: Materials Science and Engineering, 2017 263 (3), art. no. 032034,. https://doi.org/10.1088/1757-899X/263/3/032034.
35. Whittaker A, Hart G, Rojahn C. “Seismic response modification factors” Journal of Structural Engineering ASCE, 125(4):438 – 44, 1999. https://doi.org/10.1061/(ASCE)0733-9445(1999)125:4(438).
36. Newmark N, Hall W. Earthquake spectra and design. Engineering monograph; Earthquake Engineering Research Institute, Berkeley, California; 1982.
LIST OF FIGURES AND TABLES:
Fig. 1. Layout of two-story frame model, geometry and members design details
Fig. 2. Test models setup on shake table
Fig. 3. Input shaking record of 1994 Northridge Earthquake
Fig. 4. Code design Model-1 damage response
Fig. 5. Deficient weak beam-column joint Model-2 damage response
Fig. 6. Joint panel damage response at incipient collapse state
Fig. 7. Prototype frame seismic response curves
Fig. 8. Prototype frame force-deformation capacity curves
Fig. 9. Model-1 Idealization of force-deformation capacity curve
Fig. 10. Model-2 Idealization of force-deformation capacity curve
Fig. 11. Response parameter from idealized force-displacement relationships
Fig. 12. Response modification factor parameters from capacity curve
Fig. 13. Structural seismic response parameters
Tab. 1. Simple model similitude scaling factors
Tab. 2. Input loading protocols for code design Model-1
Tab. 3. Input loading protocols for code design Model-2
Tab. 4 Experimentally observed roof displacement responses for deficient Model-2
Tab. 5 Experimentally observed roof acceleration responses for deficient Model-2
Received: 05.06.2020, Revised: 01.10.2020
SEISMIC EVALUATION OF DEFICIENT REINFORCED CONCRETE WEAK BEAM-COLUMN... 451
