seismic imaging of the metamorphism of young sediment...
TRANSCRIPT

RESEARCH ARTICLE1010022016GC006610
Seismic imaging of the metamorphism of young sediment intonew crystalline crust in the actively rifting Imperial ValleyCaliforniaLiang Han12 John A Hole1 Joann M Stock3 Gary S Fuis4 Colin F Williams4 Jonathan R Delph15Kathy K Davenport16 and Amanda J Livers17
1Department of Geosciences Virginia Tech Blacksburg Virginia USA 2Now at Institute for Geophysics University ofTexas Austin Texas USA 3Seismological Laboratory California Institute of Technology Pasadena California USA 4USGeological Survey Menlo Park California USA 5Now at Department of Earth Science Rice University Houston TexasUSA 6Now at College of Earth Ocean and Atmospheric Sciences Oregon State University Eugene Oregon USA 7Now atUniversity of North Dakota Energy and Environmental Research Center Grand Forks North Dakota USA
Abstract Plate-boundary rifting between transform faults is opening the Imperial Valley of southernCalifornia and the rift is rapidly filling with sediment from the Colorado River Three 65ndash90 km long seismicrefraction profiles across and along the valley acquired as part of the 2011 Salton Seismic Imaging Projectwere analyzed to constrain upper crustal structure and the transition from sediment to underlyingcrystalline rock Both first arrival travel-time tomography and frequency-domain full-waveform inversionwere applied to provide P-wave velocity models down to 7 km depth The valley margins arefault-bounded beyond which thinner sediment has been deposited on preexisting crystalline rocksWithin the central basin seismic velocity increases continuously from 18 kms sediment at the surface togt6 kms crystalline rock with no sharp discontinuity Borehole data show young sediment is progressivelymetamorphosed into crystalline rock The seismic velocity gradient with depth decreases approximately atthe 4 kms contour which coincides with changes in the porosity and density gradient in borehole coresamples This change occurs at 3 km depth in most of the valley but at only 15 km depth in the SaltonSea geothermal field We interpret progressive metamorphism caused by high heat flow to be creating newcrystalline crust throughout the valley at a rate comparable to the 2 kmMyr sedimentation rate Thenewly formed crystalline crust extends to at least 7ndash8 km depth and it is shallower and faster where heatflow is higher Most of the active seismicity occurs within this new crust
1 Introduction
Continental rifting results in high heat flow and an elevated geotherm as hot mantle rises beneath the riftThe later stages of rifting produce a topographic low into which rivers can flow depositing sediment Acombination of high temperature and rapid sedimentation may metamorphose the deep basin sedimentMetamorphism of very young sediment has been observed in the Salton Trough of southern California [Muf-fler and White 1969 McDowell and Elders 1980 Fuis et al 1984 Cho et al 1988 Shearer et al 1988] Due tothe geographic extent of high heat flow [Lachenbruch et al 1985] and the large river delta metamorphismmay occur at a regional scale and create a significant volume of new felsic crystalline crust The rate of crust-al growth by sedimentation and metamorphism is comparable to those by magmatic accretion atsubduction-related island arcs and slow seafloor spreading centers [Dorsey 2010] This new crust may hostshallow seismicity in the active rift [Hauksson et al 2012] and it may eventually form a large component ofthe future passive continental margin
The Salton Trough is an active sediment-filled rift basin at the northern end of the Gulf of California exten-sional province (Figure 1) [eg Elders et al 1972 Lonsdale 1989 Stock and Hodges 1989 Larsen and Reilin-ger 1991] It is being formed by extension between the plate-bounding right-lateral San Andreas (SAF)Imperial (IF) and Cerro Prieto (CPF) transform faults (Figure 1) The northern Imperial Valley and southernSalton Sea (Figure 1) is the active part of the Salton Trough between the SAF and IF and is characterized byhigh heat flow volcanic and geothermal activity (Figure 2) and seismicity It is almost entirely below sea
Key Points High heat flow is metamorphosing
very young sediment in the ImperialValley and highest heat flow createsshallowest metamorphism Metamorphism of sediment is
creating new crystalline crust togt7 km depth in the Imperial Valleyand most earthquakes are in this newcrust Progressive metamorphism creates
no discontinuities and the velocitygradient with depth decreases whererock porosity is reduced to 5ndash10
Correspondence toL Hanlianghanvtedu
CitationHan L J A Hole J M Stock G S FuisC F Williams J R DelphK K Davenport and A J Livers (2016)Seismic imaging of the metamorphismof young sediment into new crystallinecrust in the actively rifting ImperialValley California Geochem GeophysGeosyst 17 4566ndash4584 doi1010022016GC006610
Received 29 AUG 2016
Accepted 28 OCT 2016
Accepted article online 3 NOV 2016
Published online 18 NOV 2016
VC 2016 American Geophysical Union
All Rights Reserved
HAN ET AL SEISMIC IMAGING OF META-SEDIMENT 4566
Geochemistry Geophysics Geosystems
PUBLICATIONS
California
Arizona
0 50
Nkm
Mexico
USA
(b)OBS airgun array
Onshore profile
3-D grid
minus120˚
minus120˚
minus115˚
minus115˚
minus110˚
minus110˚
minus105˚
minus105˚
20˚ 20˚
25˚ 25˚
30˚ 30˚
35˚ 35˚
Pacific Plate G
ulf of California
Baja California
CaliforniaArizona
Sonora
Mexico
USA
North American Plate
4002000
km
(a)
25 km
NSan Andreas Fault
Imperial Fault
CPF
Sand HillsAlgodones Fault
SMF
SHF
Elsinore Fault Zone
San Jacinto Fault ZoneColorado River
Chocolate Mountains
California
Mexico
USA
Imperial Valley
Salton Sea
State 2-14 well
BSZ
BSZ
10931
21130
30520
Line 1
Line 2
Line 3
Wilson No 1 Well
(c)
OB
Figure 1 Salton Seismic Imaging Project (SSIP) study area and seismic lines used in this paper (a) Rifts and transform faults of the plate boundary in California Mexico and the Gulf ofCalifornia Arrows show relative motion between Pacific plate and North America plate Blue box is the survey area in Figure 1b (b) Map of SSIP seismic lines Thick black lines areonshore 2-D profiles yellow-shaded areas are 3-D grids and thick green lines in the Salton Sea are OBS arrays Active faults are red CPF Cerro Prieto Fault (c) Portions of SSIP Lines 1 2and 3 used in this study Red stars are explosive shots and larger stars correspond to shots gt400 kg Numbered shots are shown in data Figures 3ndash5 Blue dots are onshore seismo-graphs SHF Superstition Hills Fault SMF Superstition Mountain Fault BSZ Brawley Seismic Zone OB Obsidian Butte Interpreted Sand HillsAlgodones Fault is shown by dashed redline Faults are from Jennings and Bryant [2010]
Geochemistry Geophysics Geosystems 1010022016GC006610
HAN ET AL SEISMIC IMAGING OF META-SEDIMENT 4567
level the elevation of the Salton Sea is 270 m The Colorado River (Figure 1) has flowed into this active riftbasin throughout the basinrsquos history carrying a high sediment load
Heat flow in most of the Salton Trough is between 100 and 200 mWm2 (Figure 2) [Lachenbruch et al1985] much larger than the mean global heat flow of 80 mWm2 In the Salton Sea Geothermal Field(Figure 2) in the northern Imperial Valley heat flow exceeds 600 mWm2 in an arcuate zone 4 km wideand 12 km long [eg Helgeson 1968 Newmark et al 1988] roughly parallel to the five small Late Quater-nary volcanic domes the Salton Buttes at the southern shore of the Salton Sea [eg Robinson et al 1976Schmitt and Vazquez 2006] Significant seismicity occurs at 3ndash11 km depth in the oblique Brawley SeismicZone (BSZ) (Figure 1) [Hauksson et al 2012] which connects the SAF and IF
In the Salton Trough most of the sediment and sedimentary rock was originally transported by the Colora-do River from the Colorado Plateau [Muffler and Doe 1968 Herzig et al 1988 Dorsey 2010 Dorsey and Laz-ear 2013] The lithology from boreholes is dominantly lacustrine shale and siltstone with minor amounts ofsandstone and anhydrite and mineralogy is consistent throughout the basin Coarser alluvium derivedfrom adjacent ranges is interbedded at the edges of the valley Mineralogy changes systematically withdepth interpreted to be related to increasing temperature and progressive metamorphism of the sedimentnot to changes in the source of the sediment [Muffler and White 1969 McDowell and Elders 1980 Cho et al1988 Shearer et al 1988] Greenschist facies metamorphism of the sediment is observed in wells through-out the valley starting at 06ndash2 km depth and amphibolite grade is observed at 3 km depth within theSalton Sea geothermal field [Muffler and White 1969 Cho et al 1988] Larsen and Reilinger [1991] suggesteda recent regional subsidence rate of 3 kmMyr from leveling data in the northern Imperial Valley Schmittand Hulen [2008] argued that the sedimentation rate accelerates toward the center of the Salton Troughincreasing from 22 to 38 kmMyr
Numerous regional three-dimensional seismic velocity models have been built to study earthquake hazardsin Southern California [eg Magistrale et al 1992 Magistrale et al 2000 Lin et al 2007 Hauksson et al2012] but earthquake network data do not well constrain shallow structure in the valleys Structure of theImperial Valley in the upper crust was best studied by Fuis et al [1984] who interpreted data from five seis-mic refraction profiles One unreversed shot or two reversed shots were recorded on each profile on sta-tions every 05ndash1 km Low seismic velocity (2ndash5 kms) was observed in the upper 4 km throughout thevalley underlain by crystalline rock that has slower seismic velocity than the valley margins They inter-preted the shallowest crystalline rock as metamorphosed sediment based on low seismic velocity and thelack of a seismic reflection or velocity discontinuity associated with sediment deposited on crystalline rock
25 km
N0 100 200 300 400 500 Heat Flow (mWm )2
Mexico
USA
Salton Sea
State 2-14SSGF
BGF Line 2
Line 1
Line 3
Wilson No 1
Figure 2 Heat flow in the Imperial Valley compiled from Newmark et al [1988] Sass et al [1988] and the original data that were presentedas gridded averages by Lachenbruch et al [1985] Small circles are well locations Heat flow greater than 500 mWm2 was set as 500 mWm2 Data from wells were gridded in Matlab at 001 by 001 degree Seismic lines and labels are the same as those in Figure 1 BGF Brawleygeothermal field SSGF Salton Sea geothermal field
Geochemistry Geophysics Geosystems 1010022016GC006610
HAN ET AL SEISMIC IMAGING OF META-SEDIMENT 4568
The Salton Seismic Imaging Project (SSIP) acquired new controlled-source seismic data in the Salton Troughin 2011 [Rose et al 2013] Persaud et al [2016] use some of these data to investigate basin structure andfaulting in the Imperial Valley This paper uses seismic imaging from a portion of the SSIP data set to studythe transition from sediment to crystalline rock in the Imperial Valley testing and improving models pro-duced by the sparser data of Fuis et al [1984] The model of sedimentary metamorphism is tested by search-ing for a sediment-basement depositional discontinuity that might have remained undetected by thesparser seismic data and by correlating the higher-resolution seismic results with borehole and heat-flowobservations The new seismic velocity models confirm metamorphism and provide additional constraintson its depth and lateral extent
2 Seismic Data
21 Data AcquisitionSeven refractionwide-angle reflection profiles and two 3-D seismometer grids were acquired along andacross the Salton Trough by SSIP in 2011 (Figure 1b) [Rose et al 2013] Both in-line and offline shots wererecorded to provide three-dimensional data coverage The recording systems were mostly single-component lsquolsquoTexanrsquorsquo (Ref Tek 125a) seismographs with geophones with a corner frequency of 45 Hz Three-component 45 Hz geophones and RT130 (Ref Tek 130) seismographs were deployed every 1 km alongLine 2 In total 2781 land seismometers with spacing as dense as 100 m were deployed at over 4200 sitesA total of 126 buried explosive shots of 3ndash1400 kg were detonated Thirty-eight ocean-bottom seismo-graphs and 2330 small airgun shots were used in the Salton Sea
In the Imperial Valley three seismic lines were recorded two of which went through the volcanic and geo-thermal field In order to study the transition from sediment to basement in this basin only the valley andnear-valley portions of those three seismic profiles are used in this study (Figure 1c) Line 1 is parallel to thetransform faults and relative plate motion direction (Figure 1) Twenty shot gathers were analyzed along the65 km long portion of Line 1 in the Valley Most shots were 115 kg but a few were up to 1367 kg Theshots were recorded by 574 seismographs in the valley at a spacing of 100 m There were 18 shots and776 seismographs along the 90 km long valley portion of Line 2 oriented approximately perpendicular tothe Imperial Fault (Figure 1) The receiver interval was 100 m in the west and middle of this line segmentbut 200 m in the eastern third The shot size was 115 kg except the shot at the Imperial Fault was 911 kgand the shot to the east of the valley was 592 kg The 67 km long portion of Line 3 consisted of 16 shotsand 429 seismographs This line crossed the valley perpendicular to the transform faults and along theSalton Sea geothermal field (Figure 2) On each side of the valley two shots of gt400 kg were fired while inthe valley the shot size was either 115 or 229 kg The receiver interval was 500 m in the western third ofLine 3 100 m in the valley and 300 m to the east of the valley Although larger shots were fired to thewest of the valley the signal recorded from these shots by the receivers inside the valley was poor This wasalso observed during the seismic survey of Fuis et al [1984] and is probably caused by basin margin struc-ture to the west
22 Data DescriptionFigure 3a illustrates the seismic phases that were observed throughout most of the valley The inverse ofthe slope of the seismic arrivals indicates the apparent seismic velocity which gradually increases from slowlt2 kms sediment near the surface (phase A) to turning (continuously refracted) waves with velocitiesgt5 kms representative of crystalline rock (phase B) The boundary between A and B is gradational anddoes not exhibit a sharp change in apparent velocity No seismic reflection from the base of sediment isobserved in data filtered at any frequency The smooth increase in velocity low crystalline-rock velocityand lack of basement reflector are consistent with the observations of Fuis et al [1984] that were inter-preted as metamorphism of sediment but the SSIP observations are much more densely constrainedStrong multiple basin reverberations (phases C) are observed indicative of a strong increase in velocitywith depth similar to the previous studies [McMechan and Mooney 1980 Fuis et al 1984] Deeper crustalphases such as the Moho reflection PmP and Moho refraction Pn are observed in the valley at distancesgreater than 40 and 80 km respectively [Han et al 2016] but are not shown in this paper
Arrivals very similar to those of Figure 3 are observed on all shots and stations within the central ImperialValley (Figures 3ndash5) indicating only weak lateral variation in geologic structure throughout most of the
Geochemistry Geophysics Geosystems 1010022016GC006610
HAN ET AL SEISMIC IMAGING OF META-SEDIMENT 4569
valley An important exception iswithin the Salton Sea geothermalfield at the southern shore of theSalton Sea where phase B arrives05 s earlier than the rest of thecentral valley (Figures 3 and 5) Earlierarrival times for phase B indicateshallower crystalline rock beneaththe Salton Sea geothermal field butthe transition from phase A to B isgradational similar to the rest of thevalley
The data along Lines 2 and 3 havelarger variation where they extendbeyond the edges of the Imperial Val-ley (Figures 4 and 5) To the west ofshot 21130 (Figure 4) the crystalline-rock phase E arrives much earlierthan phase B the velocity increasefrom A to E is much sharper theapparent velocity of E is faster andthe basin reverberation is muchweaker or absent This shot and othershots to the west on line 2 indicate amuch shallower basin a sharpersediment-rock boundary and a fastercrystalline-rock velocity The twowestern-most shots on line 3 that areincluded in the analysis (Figure 1c)and the two eastern-most shots onboth Lines 2 and 3 display similar fea-tures These observations map theedges of the main basin [Persaudet al 2016]
The crustal reflection phase observedin the data phase G in Figure 4 is onlyobserved on Line 2 at offset gt20ndash22 km and only for shot-receiver mid-points west of the Imperial Fault Asimilar phase was observed nearby byFuis et al [1984] Phases A and B exhib-
it only very small changes across the Imperial Fault (eg Figure 4) indicating that basin and shallowest crystallinerock structure are similar These minor differences and the existence of reflector G west of the fault representtwo different rift segments Based on travel time and offset reflector G is at 12ndash13 km depth Two-dimensionalmodeling of this reflector is beyond the scope of this paper which focuses primarily on the Imperial Valley riftsegment
3 Travel-Time Tomography
31 MethodFirst arrivals were picked manually on all the shot gathers (eg Figure 6a) The estimated accuracy of thosepicks is less than a half period of the dominant signals which is 40ndash50 ms within the offset range used inthis study This represents an upper limit and many picks have lt25 ms accuracy
D
BB
C
Shot 10931
0
2
4
6
8
Tim
e-D
ista
nce
(6
km
s)
(s)
A
BB
C
Shot 10931
0
2
4
6
8
Tim
e-D
ista
nce
(6
km
s)
(s)
A
BB
C
Shot 10931
NW SE-10 0 10 20 30 40
Shot-Receiver Distance (km)
0
2
4
6
8
Tim
e-D
ista
nce
(6
km
s)
(s)
SSGF BSZ
(a)
(b)
(c)
6655
44
2 kms
33
2
Figure 3 (a) Shot 10931 recorded along Line 1 see Figure 1 for location Only theportion of the line in the Imperial Valley is shown Travel time is reduced by 6 kmsThe data are bandpass filtered by an Ormsby filter at 5ndash8ndash20ndash30 Hz Amplitudes arenormalized for each station Smaller signal at the northwest end of the figure is dueto amplitude normalization of geothermal energy industrial noise (b) Synthetic seis-mic data at 01ndash10 Hz computed within the northern portion of the seismic velocitymodel of Figure 7 (c) Synthetic seismic data at 01ndash10 Hz computed within the seis-mic velocity model of Figure 11a Seismic phases A direct or turning wave in sedi-ment B turning waves in the crystalline crust in the valley C multiple of B in thesedimentary basin D reflection from the artificial velocity discontinuity in Figure11a this phase does not exist in the real data BSZ Brawley Seismic Zone SSGFSalton Sea geothermal field
Geochemistry Geophysics Geosystems 1010022016GC006610
HAN ET AL SEISMIC IMAGING OF META-SEDIMENT 4570
These first arrivals were inverted using the travel time tomography algorithm of Hole [1992] Travel timesand rays are computed using finite differences within a 3-D seismic velocity model [Hole and Zelt 1995]Rays are traced in 3-D to include the crooked line geometry but the velocity is smoothed perpendicular tothe line to create a 2-D model The inversion uses smoothed back-projection Weighting is used to eliminatethe effects of uneven seismograph spacing A moving average filter is applied to smooth the velocity per-turbation before it is added to the previous velocity model Rays and times are computed in the new modeland the inversion iterates to find the final model The smoothing size is reduced gradually so that the initialiterations model large-scale structure which is then used as the starting model for later iterations Thisstrongly reduces the effects of smooth starting models and pushes misfits toward smooth structure Theratio between the horizontal and vertical smoothing is kept constant Iterations are stopped before raystreaking artifacts are produced by model errors The model resolution ie the final smoothing size is pri-marily limited by the shot spacing
The starting velocity model for 2-D tomography was built using the same tomography process but the hori-zontal smoothing was set large enough to keep the model 1-D and the vertical smoothing was graduallydecreased to 1 km This simple 1-D model produces travel times that approximate the average observedtimes from all of the shots (eg Figure 6) For Lines 2 and 3 the 1-D starting model was derived using dataonly from the central basin which is the focus of this paper Strong velocity contrasts at shallow depth onthe valley margins are not well represented by the smooth starting model and are less well constrained by
sparser shots so the tomography resultsare smoothed representations of actualstructure outside the basins A range of1-D starting models with faster and slowervelocity and with larger and smaller veloci-ty gradients were tested Within a reason-able range smooth starting velocitymodels all produced similar final velocitystructure with larger variation outside thebasin
The grid size used in this study is 100 m Arange of smoothing ratios were testedand 51 allowed the best spatial resolutionin a smooth model The final tomographyhorizontal smoothing of Lines 1 and 3 was25 km which is roughly the average shotinterval and the vertical smoothing is05 km Line 2 was smoothed to 36 by07 km due to the sparser average shot
6655
44
2 kms
33
2
W E-10 0 10 20 30 40 50 60
Shot-Receiver Distance (km)
0
2
4
6
8
Tim
e-D
ista
nce
(6
km
s)
(s)
Shot 21130
A
B
C
E
G
F
IFSHFEF SF
Figure 4 Shot 21130 recorded along Line 2 plotted and labeled similar to Figure 3 This line segment crosses the Imperial Fault (IF) andextends beyond farmland (lacustrine clay soil) onto the alluvial flanks of the Imperial Valley (Figure 1) Phase E turning waves in the crystal-line crust outside of the valley phase F same as B but with faster apparent velocity caused by the basin thinning eastward phase G reflec-tion from the middle crust with midpoints west of the IF EF Elsinore Fault SHF Superstition Hills Fault SF Sand Hills Fault
BC
A
B
SMF SHF SFSSGFBSZ
H
6655
44
2 kms
33
2
SW NE-20 -10 0 10 20 30
Shot-Receiver Distance (km)
0
2
4
6
8
Tim
e-D
ista
nce
(6
km
s)
(s)
Shot 30520
Figure 5 Shot 30520 recorded along Line 3 plotted and labeled the same asFigure 3 This line extends along the Salton Sea geothermal field (SSGF) nearthe volcanic domes and extends beyond farmland onto the alluvial flanks ofthe Imperial Valley (Figure 1) The geothermal field is visible in the shot gath-ers as a region with higher industrial noise (7ndash20 km) Phase B to the east ofthe shot is 05 s earlier within the SSGF than in most of the valley Firstarrivals are earlier in the Superstition Mountains at distance 220 km wheregranitic bedrock is exposed Phase H diffraction at the eastern edge of thedeep basin SMF Superstition Mountain Fault
Geochemistry Geophysics Geosystems 1010022016GC006610
HAN ET AL SEISMIC IMAGING OF META-SEDIMENT 4571
spacing A smaller smoothing size results in more structural detail and a smaller data misfit but producesartifacts parallel to the dominant ray directions that are caused by noise or picking uncertainty
The ray coverage is very dense and crosses at multiple angles in the center of the models (Figures 7ndash9) pro-viding strong constraints At the bottom and edges of the models ray coverage is sparser and mostly paral-lel to the boundaries allowing for smearing of structure along these directions The root-mean-square
0 10 20 30 40 50 600
05
1
15
2
25
3
Absolute Shot Receiver Distance (km)
Tim
eminusA
bso
lute
Dis
tan
ce(
6km
s)
(s)
1 2 3 4 5 6 70
2
4
6
8
10
Velocity (kms)
Dep
th (
km)
(a) (b)
Line 1Line 3
Line 2
Figure 6 (a) Reduced first-arrival travel times for shots recorded along Line 1 (black lines) and synthetic times in green from the Line 1model in Figure 6b The earlier times correspond to the shot and stations in the Salton Sea geothermal field Later times correspond toshots and receivers in southern Imperial Valley (b) 1-D starting velocity models for Line 1 2 and 3 derived from the first arrival traveltimes The starting models for Lines 2 and 3 were derived using only shots and stations within the valley and the velocity models aresimilar
0 50 100 (rayscell)
2
34
5
62 3 4 5 6 7 (kms)
Dep
th (
km)
0
5
10
Dep
th (
km)
0
5
10
NW SE20 40 60
Distance (km)
(a)
(b)
Line 1
L2BGF MEXSSGFL3 BSZ
Wilson
10931
Figure 7 Line 1 upper crustal velocity model and ray coverage at a vertical exaggeration of 2 Velocity is in kms and contours are at02 kms intervals Ray coverage is plotted as hit count in 100 m grid cells Regions without ray coverage are white Red stars are shots andshot 10931 of Figure 3 is labeled Vertical black line is the Wilson No 1 well SSGF Salton Sea geothermal field L2 and L3 intersectionswith Lines 2 and 3 BSZ Brawley Seismic Zone BGF Brawley geothermal field MEX USA-Mexico border
Geochemistry Geophysics Geosystems 1010022016GC006610
HAN ET AL SEISMIC IMAGING OF META-SEDIMENT 4572
(RMS) data misfit for lines 1 2 and 3 respectively is 36 45 and 39 ms within the picking accuracy(Figure 10)
32 Velocity ModelsFor Line 1 which is oriented northwest-southeast parallel to the relative plate motion direction the velocitystructure is almost 1-D (Figure 7) Velocity gradually increases from 18 kms at the surface to 6 kms at7 km depth approaching the maximum depth of good ray coverage Velocity lt3 kms near the surface istypical for unconsolidated water-saturated clastic sediment [Eberhart-Phillips et al 1989] The 4 kms con-tour typical of a well-lithified low-porosity shale or sandstone [Han et al 1986 Eberhart-Phillips et al 1989Johnston and Christensen 1995 Vernik and Liu 1997] is nearly flat at 3 km depth along the Imperial ValleyThe velocity gradient with depth below 3ndash4 km depth is much smaller than that near the surface (Figures 7and 15) There is no evidence of a steepening in the gradient that might indicate a smoothed discontinuityVelocity gt5 kms a rough proxy for crystalline metamorphic or igneous rock with very low porosity [eg
0 50 100 (rayscell)
2
3
4
5
6
6
2 3 4 5 6 7 (kms)
Distance (km)
0
5
10
Dep
th (
km)
0
5
10
Dep
th (
km)
W E20 40 60 80
Line 2
IF SFUF1 UF2EF SHF L1
(a)
(b)
Wilson
21130
Figure 8 Line 2 upper crust velocity model and ray coverage plotted as for Figure 7 Vertical black line is the Wilson No 1 well EF ElsinoreFault Zone UF1 unidentified fault at the west margin of the basin UF2 unnamed fault characterized by a seismicity lineament connectingto the Superstition Mountain Fault [Hauksson et al 2012] SHF Superstition Hills Fault IF Imperial Fault SF interpreted location of SandHills Fault L1 Line 1
2
34
5
SW NE20 40 60
0
5Dep
th (
km)
0
5Dep
th (
km)
Distance (km)Line 3
(a)
(b)0 50 100 (rayscell)
2 3 4 5 6 7 (kms)
SMF SHF SFOBL1 SSGF
State
BSZ30520
Figure 9 Line 3 upper crust velocity model and ray coverage plotted as for Figure 7 Vertical black line is the State 2ndash14 well OB ObsidianButte
Geochemistry Geophysics Geosystems 1010022016GC006610
HAN ET AL SEISMIC IMAGING OF META-SEDIMENT 4573
Eberhart-Phillips et al 1989 Christensenand Mooney 1995] is at 45 km depthin the northern Imperial Valley and grad-ually deepens from the southern end ofthe Brawley seismic zone to 55 kmdepth at the south end of the line Fractur-ing in the seismic zone might be expectedto reduce velocity yet slightly highercrystalline-rock velocity is observed at agiven depth in the seismic zone Highvelocity is deeper toward the south corre-sponding to both proximity to the mouthof the Colorado River and to slightly lowerheat flow Velocities of lt45 kms areslightly shallower near the Brawley geo-thermal field at model km 21 on Line 1(Figure 7) The SSGF where higher velocityoccurs at much shallower depth is theonly exception to nearly 1-D structure Thisstructure near the northwest edge of themodel is not well constrained on Line 1but is well resolved by Line 3 Deeper con-tours are uplifted a little to the south
The west-east Line 2 crosses the centerof the Imperial Valley and the northernend of the Imperial Fault approximatelyperpendicular to Line 1 The deep sedi-mentary basin is 60 km wide along thisprofile with the deepest part near theImperial Fault (Figure 8) Similar to Line 1seismic velocity continuously increases inthe deep basin with a similar change in
velocity gradient There is a subtle deflection of the contour lines across the Imperial Fault which may besmaller than can be resolved Resolution of the margins of the deep basin are affected by the shot spacingand the tomography smoothing such that lateral resolution is 3ndash4 km Velocity contours rise slowly towardthe eastern side of the basin then rise sharply consistent with a steep fault at model km 80 This basinmargin is east of the southeastern extrapolation of the San Andreas Fault but consistent with the inactiveSand Hills Fault which is the along-strike extension of the Algodones Fault In the western valley the con-tours are consistent with the Superstition Hills Fault at model km 30 and the basin margin at km 17may represent an unidentified fault A seismicity lineament connecting to the Superstition Mountain Fault isobserved at km 22 [Hauksson et al 2012] These structures define a complex western margin of the riftsegment west of the transform Imperial Fault and a complex step-over zone from the active Cerro Prietoand Imperial Faults to the San Jacinto Fault [Magistrale 2002 Persaud et al 2016]
Line 3 extends southwest-northeast along the southern shore of the Salton Sea and along the axis of thegeothermal field The basin is about 45 km wide along this profile with the deepest part near the westernmargin (Figure 9) Compared to Line 2 the basin is much narrower at this location which limits the maxi-mum recording offset and the imaging depth of the basin Within the basin the velocity model is only wellconstrained to 5 km depth and lt56 kms The basin boundaries are consistent with steep faults with thewestern margin at or west of the Superstition Hills Fault and the eastern margin consistent with the SandHills Fault Phase H in Figure 5 is caused by energy diffracted off the edge of the shallow crystalline rock atthe Sand Hills Fault Similar to the other lines velocity within the main basin increases continuously withdepth with a change in gradient However the velocity gradients are much larger within the Salton Seageothermal field and higher velocity occurs at much shallower depth (Figure 9) Shallow high velocity is
Absolute shot receiver distance (km)
Mis
fit
(ms)
Line 1
Line 2
Line 3
0 10 20 30 40
0 10 20 30 40 50 60
0 10 20 30 40 50 60
200
100
0
-100
-200M
isfi
t (m
s)
200
100
0
-100
-200
Mis
fit
(ms)
200
100
0
-100
-200
Figure 10 Travel time misfits (calculated minus observed) for the seismicvelocity models of Figures 7ndash9 The RMS data misfit is 36 45 and 39 ms forlines 1 2 and 3 respectively
Geochemistry Geophysics Geosystems 1010022016GC006610
HAN ET AL SEISMIC IMAGING OF META-SEDIMENT 4574
also observed within the Salton Sea geothermal field along Line 1 (Figure 7) but it is better constrainedalong this profile
Travel-time tomography with smoothing successfully matches the data (Figure 10) but produces a modelthat is as smooth as possible A sharp velocity discontinuity will be imaged as a zone with elevated velocitygradient There is no evidence within the velocity models for a downward increase in the velocity gradientat any depth (Figures 7ndash9) In addition no strong reflectors are observed in the data (Figures 3ndash5) Theseobservations suggest that no velocity discontinuity such as a depositional surface between sediment andbedrock exists However smooth tomography is not the ideal tool to detect discontinuities so syntheticseismograms and full-waveform inversion were used to further test for the presence or absence of adiscontinuity
4 Synthetic Seismograms
Full-waveform synthetic seismograms were computed for a representative shot in the central Imperial Val-ley The algorithm of Pratt [1999] computes synthetic seismograms in a gridded 2-D velocity model using afinite-difference approximation of the acoustic wave equation in the frequency domain Synthetic datawere computed at 01ndash10 Hz for shot 10931 in the northern half of the travel-time tomography model ofFigure 7 The synthetic data successfully reproduce the first arrivals and the strong basin reverberations (Fig-ure 3b) The reverberations were not considered in the tomography so their production in the syntheticdata provides additional confidence in the velocity model in particular the strong velocity gradient in thebasin
For comparison purposes synthetic seismograms were computed for a similar velocity model but contain-ing a velocity discontinuity to simulate a depositional unconformity above basement (Figure 11a) Thismodel was created by adding a velocity discontinuity from 4 to 5 kms to the travel-time tomography mod-el of Figure 7 The boundary is evident in the synthetic seismic data as a secondary reflection arrival firstarrival amplitude weakening at critical distance and a slightly sharper change in the slope of first arrival(distance 10 km) and basin reverberation (distance 15 km at 4 s) (Figure 3c) none of which are detectedin the real data (Figure 3a) The lack of such evidence in the real data indicates that a strong discontinuity isnot present under the Imperial Valley
5 Full-Waveform Inversion
To improve the vertical resolution of the velocity model and to further test for the existence of discontinu-ities full-waveform inversion was applied to the northern half of Line 1 where the shots are closesttogether
51 Inversion MethodThe full-waveform tomography algorithm of Pratt [1999] inverts phase and amplitude of seismic data in thefrequency domain An excellent starting model accurate to within a half-period of the frequencies beinginverted is required for convergence Brenders and Pratt [2007a 2007b] demonstrate that a starting velocitymodel derived from first-arrival travel-time tomography works well for long-offset refraction and reflectiondata An approach that progressively inverts from low to high-frequency stabilizes the inversion by produc-ing more detailed starting models for inversions at higher frequency
Land crustal seismic refraction and wide-angle reflection data are usually acquired along crooked roadswhich makes 2-D full waveform inversion difficult Due to the crooked SSIP line (Figure 1) an approximate2-D geometry was used following Smithyman and Clowes [2012] Similar to the travel-time tomography thevelocity and attenuation models are assumed to be homogeneous in the direction perpendicular to theaverage seismic line Shots and receivers are projected to the straight line and the seismic waveforms arecorrected using a time shift determined by 3-D ray tracing which accounts for the cross-line offsets pro-duced by the crooked-line acquisition
Densely spaced shots and receivers are required for full-waveform inversion to converge At least one of thetwo domains must not be spatially aliased The minimum velocity in the Imperial Valley is 16 kms andthe receiver interval is 100 m so 8 Hz is the highest frequency that is not spatial aliased The lowest
Geochemistry Geophysics Geosystems 1010022016GC006610
HAN ET AL SEISMIC IMAGING OF META-SEDIMENT 4575
frequency observed in the SSIP data is 2 Hz so the data were inverted from 2 to 7 Hz Brenders and Pratt[2007b] showed that full-waveform inversion can work if the shots are spatially aliased but only up to a lim-it The northern 30 km of Line 1 along the northern Imperial Valley has the densest shot spacing Unfortu-nately two shots could not be used because they were recorded only by every second station which is notallowed by the existing software The remaining shots are spaced 25 km on average and 7 km at mostBrenders and Pratt [2007b] showed that the image quality remains acceptable if the shot spacing is lessthan 15 times the shortest wavelength recorded at the starting frequency and accurate images can beobtained in the central portion of the model when the ratio is around 35 but the images suffer from somedegradation For the SSIP data the ratio is 3 (08 km wavelength at 2 Hz at 16 kms) so the shot spacingis nonideal Additional challenges are the irregular shot spacing and noise in the data Bleibinhaus et al[2009] showed that the inversion of only the phase of the frequency-domain data is more stable for realisticlong-offset data so the SSIP inversion ignored amplitude The inversion is thus similar to the finite-
2
3
4
5
2
3
4
5
2 3 4 5 6 (kms)
(a)
(b)
(c)
0
2
4
6
Dep
th (
km)
0
2
4
6
Dep
th (
km)
0
2
4
6
Dep
th (
km)
Distance (km)
NW SE5 10 15 20 25 30 35
BSZLine 1 synthetic
Figure 11 (a) Synthetic velocity model for a segment of Line 1 derived from the model of Figure 7 with an added 4 to 5 kms discontinu-ity This discontinuity is marked as black-dashed lines in Figures 11b and 11c The x axis is labeled as for Figure 7 (b) Results of first arrivaltravel time tomography of synthetic seismic data for the shots shown as stars (c) Results of full-waveform inversion of 2ndash7 Hz syntheticdata The discontinuity is detected as a sharp jump in velocity at the correct location
Geochemistry Geophysics Geosystems 1010022016GC006610
HAN ET AL SEISMIC IMAGING OF META-SEDIMENT 4576
frequency inversion method but it uses thephase of a long-time window that can containmultiple arrivals rather than the travel timeof a narrowly windowed single arrival Datapreprocessing included removal of noisydata traces and bandpass filtering Large-amplitude surface waves and S waves weremuted from the data as they are not includedin the acoustic-wave synthetic data
52 Inversion of Synthetic DataIn order to test whether full-waveform inversioncould detect the presence of a basement-like
velocity discontinuity full-waveform inversion was applied to synthetic data computed in the artificial model ofFigure 11a The synthetic data set was produced using the same shot and receiver geometry as the real data(eg Figure 3c) The starting model (Figure 11b) was derived from first arrival travel-time tomography usingtravel-times calculated from the synthetic velocity model As expected travel-time tomography smoothed thesharp boundary shown by the black dash line so that it was not detected (Figure 11b)
The synthetic data were preprocessed in the same manner as would be used for the real data The near off-set data were muted to remove surface waves and very high amplitudes in the real data The remainingdata were windowed for 3 s after the first arrivals and band-pass filtered The inversion was iteratively per-formed on a single frequency at a time progressing gradually from 2 to 7 Hz (Table 1) The inversion foreach higher frequency used the velocity model from the previous inversion as the starting model stabiliz-ing the inversion at shorter wavelengths For each frequency the source signature was inverted first fromthe most recent velocity model Inversion for each frequency required eight iterations
The velocity model after full-waveform inversion of 2ndash7 Hz data successfully sharpened the velocity contrastat the correct depth (Figure 11c) Although velocity oscillations common from waveform inversion wereproduced the results resemble the true synthetic model and detect the discontinuity The image quality isbest at model distances of 8ndash14 km and 28ndash34 km which are beneath the densest shots This syntheticexperiment shows that full waveform inversion can improve images of a discontinuity for the geometry ofthe SSIP experiment
53 Inversion of SSIP DataThe same procedure and parameters (Table 1) were applied to the real SSIP data The starting velocity mod-el was the first-arrival travel-time tomography model from Figure 7 (Figure 12a) Short-offset data bad seis-mic traces and a very noisy section of the data set was muted The remaining data were windowed for 3 safter the first arrivals The waveform-inversion result (Figure 12b) closely resembles the travel-time inversionvelocity model except for the high velocity below 25 km depth at distance 14ndash17 km This part of the mod-el is not as well constrained by the sparse shots above it as suggested by the synthetic study so is inter-preted as an artifact The model has short-wavelength oscillations about the starting model but shows noevidence for a sharp contrast that extends across the model (Figures 12 and 13) Waveform inversion con-firms that the transition from sediment to crystalline rock velocity is gradual
6 Metamorphism of Sediment
61 Seismic EvidenceThe seismic velocity throughout the Imperial Valley increases continuously with depth from lt2 kms in sur-face sediment to gt5 kms (Figures 729 and 13215) typical of crystalline rocks [eg Christensen andMooney 1995] The high-quality seismic data are capable of detecting a sharp velocity contrast with depthbut such a discontinuity is not detected by a reflection arrival in the seismic data nor by full waveform inver-sion of the data The mineralogy in geothermal energy and research boreholes indicates progressive meta-morphism of Colorado River sediment with depth caused by the valleyrsquos high geothermal gradient [egMuffler and White 1969 McDowell and Elders 1980 Cho et al 1988 Shearer et al 1988] A previous seismicrefraction study with several sparsely sampled lines also observed a lack of seismic bedrock reflector and a
Table 1 Full-Waveform Inversion Parametersa
Frequency(Hz)
No ofIterations
Synthetic-DataObjective Function
Reduction
Real-DataObjective Function
Reduction
2 8 44 2224 8 46 2229 8 43 2435 8 45 3442 8 44 465 8 44 436 8 42 527 8 44 48
aThe objective function defined by Pratt [1999] represents misfit
Geochemistry Geophysics Geosystems 1010022016GC006610
HAN ET AL SEISMIC IMAGING OF META-SEDIMENT 4577
low crystalline-rock velocity and interpreted shallow crystalline rocks within the Imperial Valley to be meta-morphosed sediment [Fuis et al 1984] The SSIP data provide higher-resolution seismic images that supportand refine this interpretation
Beyond the margins of the deep basin the seismic data clearly show a much sharper velocity contrast fromlt35 to 6 kms (eg west side of Figure 4) The starting velocity model sparser shots and smoothingused for the tomography do not ideally image the shallow sediment-rock transition outside the deep basinHowever the data are most consistent with 0ndash2 km of sediment deposited on pre-existing felsic crystallinebedrock with velocity near 60 kms
Throughout the Imperial Valley the velocity gradient deeper than the 45 kms contour is much smallerthan that above 40 kms (Figures 729 and 14 and 15) The velocity gradient at shallow depth varies with-in the valley from 08 up to 2 kmskm such that 4 kms occurs at variable depth This depth generally cor-relates with heat flow (Figures 2 and 16) At greater depth the gradient is a much lower 04ndash05 s21 almostdown to the 6 kms contour The transition zone between high and low gradient is 1 km thick along line 1and the central valley portions of lines 2 and 3 Toward the western margin of the deep basin along line 3and both margins along line 2 the velocity gradient changes less sharply but a strong change is stillobserved The true change in gradient may be more gradational at these locations or resolution might beworse because of the sparser shots and lateral smearing of the basin margins
62 Correlation With Borehole ObservationsThe State 2-14 well of the Salton Sea Scientific Drilling Project [Elders and Sass 1988] is located lt05 kmfrom seismic Line 3 (Figure 1) which enables correlation of the seismic velocity model with observationsfrom the borehole (Figure 14) This research borehole penetrated 322 km of Pleistocene to Holocene sedi-ment and metasedimentary rock in the Salton Sea geothermal field Temperature in the borehole reached3008C at 1700 m and 3558C at 3170 m (Figure 14e) [Sass et al 1988] Sedimentary layering and bulk
2
3
4
5
2 3 4 5 6 (kms)
0
2
4
6
Dep
th (
km)
0
2
4
6
Dep
th (
km)
Line 1 Distance (km)
NW SE5 10 15 20 25 30 35
BSZ
(a)
(b)
L2
Figure 12 (a) Starting velocity model for full-waveform inversion from Figure 7 (b) Results of full-waveform inversion of the 2ndash7 Hz realdata for the shots shown as stars No sharp velocity discontinuity is produced
Geochemistry Geophysics Geosystems 1010022016GC006610
HAN ET AL SEISMIC IMAGING OF META-SEDIMENT 4578
composition are preserved throughout the boreholeand are consistent with a Colorado River source butthe sediment is progressively metamorphosed as temper-ature increases with depth [Cho et al 1988 Shearer et al1988] Three major metamorphic zones are observedfrom core samples (Figure 14a) chlorite-calcite (Chl-Cc)zone biotite (Bt) zone and clinopyroxene-amphibole(Cpx) zone Epidote is formed beneath 09 km depth atgt2508C The Chl-Cc zone beginning at 06 km depth and1908C represents greenschist facies metamorphism andthe Cpx zone at 30 km depth and 3508C marks thelow-pressure transition from greenschist to amphibolitefacies [Cho et al 1988 Shearer et al 1988] The rocks areprogressively lithified in a manner similar to diagenesisbut without the formation of typical diagenetic mineralslike zeolite The metamorphism is driven primarily by theeffects of temperature except in sporadic steep fractureswhere hydrothermal fluids dominate A regional 770 katuff is observed in the well at 17 km depth [Herzig andElders 1988 Schmitt and Hulen 2008] indicating gt2 kmMyr deposition and metamorphism of sediment that wasdeposited as recently as 300 kyr ago
Seismic velocity measured in the borehole and from coresamples [Daley et al 1988 Paillet and Morin 1988 Tarifet al 1988] is consistent with the seismic velocity modelfrom Line 3 (Figure 14b) The change in velocity gradientat 16ndash21 km depth occurs within the Chl-Cc metamorphiczone and does not correlate with any metamorphic faciesboundary or major mineral occurrence (Figure 14) It doeshowever correlate with a change in gradient in the porosi-ty (Figure 16d) and density of core samples [Tarif et al1988] and in the electrical resistivity log [Paillet and Morin1988] Most of the porosity is sedimentary matrix porositynot fractures Porosity decreases rapidly within the Chl-Cczone from gt20 to5 due to calcite precipitation crys-tal overgrowth and metamorphism of clays to feldspars
and epidote [Cho et al 1988 Tarif et al 1988] Once porosity reaches5 metamorphism continues with depthbut porosity closes much more slowly perhaps due to lower permeability and less fluid flow The top of thechange in gradient in seismic velocity is interpreted to be due to the change in gradient in porosity and densitynot to the minerals present This change occurs at a velocity of 44 kms which is typical of a well-cementedlow-porosity shale or sandstone [eg Han et al 1986 Eberhart-Phillips et al 1989 Johnston and Christensen 1995Vernik and Liu 1997] This5 porosity is very high and seismic velocity is very low for a greenschist facies meta-sedimentary rock probably due to the shallow depth and rapid speed of metamorphism Consolidated higherporosity weaker metasedimentary rock starts at shallower depth near the top of the Chl-Cc zone
The same metamorphic mineralogy is observed in geothermal wells throughout the Imperial Valley [egMuffler and White 1969 McDowell and Elders 1980] The metamorphic reactions are observed at differentdepths due to different heat flow but at very similar temperatures The Elmore 1 well within the geothermalfield near line 3 has much higher temperature (3608C at 2120 m depth) the metamorphic zones are shal-lower and garnet is created near the bottom of the well [McDowell and Elders 1980] A change in porositygradient at porosity 9 very similar to the State 2-14 well occurs at 13 km depth in the Elmore 1 wellbut in middle of the Bt zone rather than the Chl-Cc zone
Metamorphic mineralogy is available for few wells outside the geothermal field where the heat flow ismuch lower but still much higher than normal continental values The deep Wilson No 1 well at the
1
2
3
4
5
6
7
Velocity (kms)
Dep
th (
km)
1 2 3 4 5 60
km 12
km 30
km 50
Figure 13 Velocity profiles at three locations along Line 1 atmodel km 12 (red) km 30 (green) and km 50 (blue) The sol-id lines are from first-arrival travel-time tomography (Figure7) and the dashed lines from full-waveform inversion (Fig-ure 12b) The velocity-depth profiles are averaged 500 mhorizontally for travel-time tomography and 200 m for fullwaveform inversion
Geochemistry Geophysics Geosystems 1010022016GC006610
HAN ET AL SEISMIC IMAGING OF META-SEDIMENT 4579
intersection of Lines 1 and 2 with a temperature typical of most of the valley (2608C at 41 km depth)observed the same metamorphic reactions at similar temperatures but greater depth (Figure 15) [Mufflerand White 1969] Due to lower temperature epidote and the biotite zone were not observed Porosity was
1 2 3 4 5 60
1
2
3
4
5
6
7
8
02 04 06 08 10
1
2
3
4
5
6
7
8
0 100 200 3000
1
2
3
4
5
6
7
8
Dep
th (
km)
Velocity (kms) Velocity gradient (s Temperature ( C))-1
Chl-CcZone
Sediment
(a) (b) (c) (d)
Line 1
Line 2
260 C
Figure 15 Correlation of seismic velocity profiles at the intersection of Lines 1 and 2 with the Wilson No 1 well (a) Metamorphic faciesfrom Muffler and White [1969] (b) Seismic velocity from Lines 1 (green) and 2 (blue) are consistent (c) Velocity gradient from Figure 15bThe velocity gradient is very different above and below a transition zone (stars) (d) Well bottom temperature from Muffler and White[1969] projected linearly to the surface
1 2 3 4 5 60
05
1
15
2
25
3
Velocity (kms)
Dep
th (
km)
0 05 1 15 20
05
1
15
2
25
3
Velocity gradient (sminus1)0 5 10 15 20 25
0
05
1
15
2
25
3
Porosity ()100 200 3000
1
2
3
Temperature ( C)
Chl-Cc
Zone
Bt Zone
Cpx Zone
Sediment
(c)(b)(a) (d) (e)
Epidote
Figure 14 Correlation of the seismic velocity model with borehole observations from the State 2ndash14 well in the Salton Sea geothermal field (a) Metamorphic zones from Cho et al[1988] (b) P-wave seismic velocity from this study (green) vertical seismic profiling in the well (blue) from Daley et al [1988] sonic waveform log (red) from Paillet and Morin [1988] andultrasonic measurements of core samples (orange) from Tarif et al [1988] (c) Velocity gradient from this study (top and bottom) The transition zone in velocity gradient is marked byred stars (d) Porosity of core samples from Tarif et al [1988] (e) Borehole temperature from Sass et al [1988]
Geochemistry Geophysics Geosystems 1010022016GC006610
HAN ET AL SEISMIC IMAGING OF META-SEDIMENT 4580
mostly closed at an unreported depth within the Chl-Cc zone Seismic velocity at this location is lower thanin the geothermal field and the change in velocity gradient occurs almost twice as deep at 28 km depthwhere the velocity is a very similar 40 kms (Figure 15) This depth is within the Chl-Cc zone but at lowermetamorphic facies within the zone The change in velocity gradient is interpreted to be due to a change in
0
3
6
9
12
Dep
th (
km)
0500
10001500
HF
(m
Wm
2 )
10 20 30 40 50 60
0
3
6
9
12
Dep
th (
km)
0500
10001500
HF
(m
Wm
2 )
10 20 30 40 50 60 70 80
0
3
6
9
12D
epth
(km
)
0500
10001500
HF
(m
Wm
2 )
0 10 20 30 40 50 60 70
L2BGF
L1
MEX
IF SHF SF
SSGFL3 BSZ
Wilson
Wilson
SMF SHF SFOBL1SSGF
State
BSZ
Distance (km)
Line 1
Line 2
Line 3
51 kms
51 kms
51 kms
(a)
(b)
(c)
(d)
(e)
(f)
NW SE
W E
SW NE
60 kms
60 kms
60 kms
Figure 16 Interpretation of the seismic velocity models of Figures 7ndash9 For each seismic line (top) heat flow from wells within 2 km of theseismic line (Figure 2) (bottom) Depth to features of the seismic velocity models Green lines show the top of the change in velocity gradi-ent Within the Imperial Valley this represents a greenschist-facies metasedimentary rock with 5ndash10 porosity Red lines correspond tometasedimentary rocks with seismic velocity of 51 kms Blue lines correspond to the 60 kms seismic velocity of preexisting crust outsidethe valley which may not exist beneath the valley Line 3 does not image deep enough to observe 6 kms in the valley These lines do notrepresent boundaries but are gradational changes due to progressive metamorphism Metasediment continues to at least 7ndash8 km depth Blackdots are seismicity within 5 km of the seismic line from Hauksson et al [2012] Geologic labels and wells are as for Figures 7ndash9
Geochemistry Geophysics Geosystems 1010022016GC006610
HAN ET AL SEISMIC IMAGING OF META-SEDIMENT 4581
porosity gradient at 5ndash10 porosity similar to that observed in the geothermal fields Rapid closure of porosi-ty always occurs within the Chl-Cc zone indicating that metamorphism plays a role However at greaterdepth it occurs at a lower temperature within the Chl-Cc zone This suggests that while pressure plays only aminor role in the metamorphic mineralogy metamorphism and pressure work together to close porosity
63 Depth and Extent of Metasedimentary CrustThe top of the sharp decrease in seismic velocity gradient is interpreted to be the depth where rapid closureof porosity ends at 5ndash10 porosity This depth was measured along all of the seismic lines (Figure 16) Eventhough the depth changes along the lines it occurs at a fairly consistent velocity of 41 kms In the geother-mal fields the velocity at this depth is up to 5 faster representing a more intense metamorphism Wherethe change in velocity gradient is not as sharply defined 41 kms was used as a proxy At this depth(Figure 16) we interpret a greenschist-facies metasedimentary rock with 5ndash10 porosity due to rapid meta-morphism at shallow depth This lsquolsquoboundaryrsquorsquo is in fact gradational due to progressive metamorphism withdepth It represents a change in the gradient of the closure of porosity rather than a metamorphic faciesboundary Metasedimentary rock with higher porosity exists well above this boundary but the top of metamor-phism and consolidation are not well expressed by geophysical parameters The shallowest depth for thisvelocity-gradient boundary is 12ndash16 km in the Salton Sea geothermal field along Line 3 and at the northernend of Line 1 (Figure 16) where the heat flow exceeds 600 mWm2 [Helgeson 1968 Newmark et al 1988]Most of the rest of the valley however has a much lower heat flow of 100ndash200 mWm2 (Figures 2 and 16)[Lachenbruch et al 1985] For the rest of the valley the depth of the velocity-gradient boundary is at 25ndash3 kmdepth and it is very flat at 28 km depth along the axis of the valley on Line 1 (Figure 16) Little contrast isobserved across the Imperial Fault even though this transform fault bounds two different rift segments Thedeepest boundary is along the western portion of Line 3 which extends west of the northwest extrapolation ofthe Imperial fault This area lies outside the main rift The velocity-gradient boundary is difficult to define nearthe margins of the valley due to sparser shots shallower ray coverage and lateral smoothing of the tomogra-phy model It may not turn shallower toward the southwest as shown in Figure 16 except outside the basin
At the eastern and western margins of the valley along Lines 2 and 3 the raw seismic data (eg Figure 4)indicate thinner sediment a sharper sediment-rock boundary and faster crystalline-rock velocity of 6 kms immediately beneath the sediment These observations are interpreted as evidence for sediment deposi-tion on preexisting crystalline crust outside the main rift valley The margins of the deep basin are smearedby tomographic smoothing and sparser shots but are still consistent with steep faults Along Line 2 achange in slope of the velocity contours suggests a discontinuity at km 30 (Figure 8) near the SuperstitionHills Fault The western boundary along Line 3 lies east of the Superstition Mountains which expose graniticbasement and may be as far east as the Superstition Hills Fault (Figure 9) The eastern boundary of thebasin is similar along lines 2 and 3 and is consistent with the Sand Hills Fault which is thought to representan inactive strike-slip fault that predates the modern active faults
Metasedimentary crust extends to at least 7ndash8 km depth based on smoothly increasing seismic velocity that isslower than that observed outside the basin Based on deposition rates of 2ndash4 kmMyr [Schmitt and Hulen2008] 8ndash16 km of sediment has been deposited in the last 4 Myr Based on longer-offset SSIP data [Han et al2016] felsic crystalline rock extends to 13 km depth The entire felsic component of the crystalline crust maybe metamorphosed synrift sediment Alternatively the lower 5 km has seismic velocity that is also consistentwith prerift granitic continental crust Dorsey [2010] and Dorsey and Lazear [2013] show that the volume of sed-iment produced by erosion of the Colorado Plateau and carried to the Salton Trough by the Colorado River isconsistent with the 8ndash13 km of sediment plus metasediment constrained by the seismic data
Abundant seismicity occurs at 3ndash8 km depth in the Salton Sea geothermal field 3ndash11 km depth in most ofthe Brawley Seismic Zone and 8ndash11 km depth beneath the Imperial fault (Figure 16) [Lin et al 2007 Hauks-son et al 2012] A seismic velocity of 51 kms is used as a rough proxy for stronger crystalline rock thatmight support seismic stress (Figure 16) In general the shape of this velocity contour mimics the shallowervelocity-gradient boundary at almost twice the depth Most seismicity occurs deeper than this proxy Withinthe Brawley Seismic Zone abundant seismicity occurs at depths much shallower than 9 km includingevents with magnitude 5 [eg Hauksson et al 2013] Thus metamorphism is creating new crystalline crustthat is strong enough for large-magnitude seismic brittle fracture Imperial Fault seismicity occurs at depthsthat may correspond to prerift crust or higher-grade metasediment
Geochemistry Geophysics Geosystems 1010022016GC006610
HAN ET AL SEISMIC IMAGING OF META-SEDIMENT 4582
The interpreted metasedimentary rock is 5ndash10 km thick from lt3 to 8ndash13 km depth which constitutes a sig-nificant fraction of the Imperial Valley crust that is only 18 km thick [Han et al 2016] Assuming that conti-nental rifting proceeds to seafloor spreading and an ocean basin metamorphosed rift sediment will form asignificant component of the passive continental margin Based solely on geophysical properties metamor-phosed synrift sediment may be mistaken for extended preexisting continent Since high heat flow and riv-er deltas are expected during the late stages of continental breakup metasediment may be an importantand underrecognized component of global passive continental margins
7 Conclusions
Three P-wave seismic velocity models in the Imperial Valley were generated from first arrival travel timetomography of the SSIP refraction data The results are consistent with the previous study of Fuis et al[1984] but provide more details on the basin structure and underlying crystalline rock Velocity increasescontinuously with depth within the valley with no velocity discontinuity indicating a gradational transitionbetween sediment and underlying crystalline rock This interpretation is confirmed by full waveform inver-sion on one of the seismic lines Comparison with boreholes indicates that sediment within the basin is pro-gressively metamorphosed at shallow depth by the high heat flow in the rift This temperature-drivenmetamorphism continues with depth producing strong new crystalline rock A regional sharp change inthe seismic velocity gradient correlates to a change in the rate of closing porosity in wells This changeoccurs within the greenschist facies but at a porosity of 5ndash10 that is much higher than traditional meta-morphism This change in porosity gradient occurs at 25ndash3 km depth in most of the valley but is muchshallower at 15 km depth in the Salton Sea geothermal field corresponding to extremely high heat flowVelocity more typical of strong crystalline rock is observed at almost twice these depths Abundant seismici-ty within the Brawley seismic zone occurs within metamorphosed synrift sediment Sedimentation and highheat flow are actively creating new crystalline crust in the Imperial Valley and that crust is strong enoughfor brittle seismicity related to ongoing extension This new felsic crystalline crust will become a significantcomponent of the future passive continental margin
ReferencesBleibinhaus F R W Lester and J A Hole (2009) Applying waveform inversion to wide-angle seismic surveys Tectonophysics 472 238ndash
248 doi101016jtecto200808023Brenders A J and R G Pratt (2007a) Full waveform tomography for lithospheric imaging Results from a blind test in a realistic crustal
model Geophys J Int 168 133ndash151 doi101111j1365-246X200603156xBrenders A J and R G Pratt (2007b) Efficient waveform tomography for lithospheric imaging Implications for realistic two-dimensional
acquisition geometries and low-frequency data Geophys J Int 169 152ndash170 doi101111j1365-246X200603096xCho M J G Liou and D K Bird (1988) Prograde phase relations in the State 2-14 well metasandstones Salton Sea geothermal field Cali-
fornia J Geophys Res 93 13081ndash13103 doi101029JB093iB11p13081Christensen N I and W D Mooney (1995) Seismic velocity structure and composition of the continental crust A global view J Geophys
Res 100 9761ndash9788 doi10102995JB00259Daley T M T V McEvilly and E L Majer (1988) Analysis of P and S wave vertical seismic profile data from the Salton Sea Scientific Drilling
Project J Geophys Res 93 13025ndash13036 doi101029JB093iB11p13025Dorsey R J (2010) Sedimentation and crustal recycling along an active oblique rift margin Salton Trough and northern Gulf of California
Geology 38 443ndash446 doi101130G306981Dorsey R J and G Lazear (2013) A post-6 Ma sediment budget for the Colorado River Geosphere 9 781ndash791 doi101130GES007841Eberhart-Phillips D D Han and M D Zoback (1989) Empirical relationships among seismic velocity effective pressure porosity and clay
content in sandstone Geophysics 54 82ndash89 doi10119011442580Elders W A and J H Sass (1988) The Salton Sea scientific drilling project J Geophys Res 93 12953ndash12968 doi101029
JB093iB11p12953Elders W A R W Rex T Meidav P T Robinson and S Bieler (1972) Crustal spreading in southern California Science 178 15ndash24 doi
101126science178405615Fuis G S and W M Mooney J H Healy G A McMechan and W J Lutter (1984) A seismic refraction survey of the Imperial Valley region
California J Geophys Res 89 1165ndash1189 doi101029JB089iB02p01165Han D A Nur and D Morgan (1986) Effects of porosity and clay content on wave velocities in sandstones Geophysics 51 2093ndash2107
doi10119011442062Han L et al (2016) Continental rupture and the creation of new crust in the Salton Trough rift southern California and northern Mexico
Results from the Salton Seismic Imaging Project J Geophys Res Solid Earth 121 doi1010022016JB013139Hauksson E W Yang and P M Shearer (2012) Waveform relocated earthquake catalog for Southern California (1981 to June 2011) Bull
Seismol Soc Am 102 2239ndash2244 doi1017850120120010Hauksson E et al (2013) Report on the August 2012 Brawley earthquake swarm in Imperial Valley Southern California Seismol Res Lett
84(2) 177ndash189 doi1017850220120169Helgeson H C (1968) Geologic and thermodynamic characteristics of the Salton Sea geothermal system Am J Sci 266 129ndash166 doi
102475ajs2663129
AcknowledgmentsWe thank the Editor Thorsten Beckerand three anonymous reviewers fortheir helpful and constructive reviewsThis research was supported by NSFMARGINS and EarthScope grants0742263 to JAH and 0742253 toJMS by the U S Geological SurveyrsquosMultihazards Research Program andby the Southern California EarthquakeCenter (SCEC) (Contribution No 6244)We thank the gt90 field volunteers andUSGS personnel who made dataacquisition possible Numerouslandowners acknowledged in Roseet al [2013] allowed access for shotsand stations Seismographs andtechnical support were provided bythe IRIS-PASSCAL instrument facilityspecial thanks go to Mouse Reuschand Patrick Bastien from PASSCAL fortheir field and data efforts Softwaresupport was provided by LandmarkSoftware and Services a HalliburtonCompany The data have beenarchived at the IRIS DMC (httpdsirisedupic-ph5metadataSSIPformphp)
Geochemistry Geophysics Geosystems 1010022016GC006610
HAN ET AL SEISMIC IMAGING OF META-SEDIMENT 4583
Herzig C T and W A Elders (1988) Nature and significance of igneous rocks cored in the State 2-14 research borehole Salton Sea Scien-tific Drilling Project California J Geophys Res 93 13069ndash13080 doi101029JB093iB11p13069
Herzig C T J M Mehegan and C E Stelting (1988) Lithostratigraphy of the State 2-14 borehole Salton Sea Scientific Drilling Project JGeophys Res 93 12969ndash12980 doi101029JB093iB11p12969
Hole J A (1992) Nonlinear high-resolution three-dimensional seismic travel time tomography J Geophys Res 97 6553ndash6562 doi10102992JB00235
Hole J A and B C Zelt (1995) 3-D finite-difference reflection traveltimes Geophys J Int 121(2) 427ndash434 doi101111j1365-246X1995tb05723x
Jennings C W and W A Bryant (2010) Active Fault Map of California Geologic Data Map No 6 Scale 1750000 Calif Geol SurvSacramento
Johnston J E and N I Christensen (1995) Seismic anisotropy of shales J Geophys Res 100 5991ndash6003 doi10102995JB00031Lachenbruch A H J H Sass and S P Galanis Jr (1985) Heat flow in southernmost California and the origin of the Salton Trough J Geo-
phys Res 90 6709ndash6736 doi101029JB090iB08p06709Larsen S and R Reilinger (1991) Age constraints for the present fault configuration in the Imperial Valley California Evidence for north-
westward propagation of the Gulf of California rift system J Geophys Res 96 10339ndash10346 doi10102991JB00618Lin G P M Shearer and E Hauksson (2007) Applying a three-dimensional velocity model waveform cross correlation and cluster analy-
sis to locate southern California seismicity from 1981 to 2005 J Geophys Res 112 B12309 doi1010292007JB004986Lonsdale P (1989) Chapter 26 Geology and tectonic history of the Gulf of California in The Eastern Pacific Ocean and Hawaii The Geologi-
cal Society of America The Geology of North America vol N edited by E L Winterer D M Hussong and R W Decker pp 499ndash521 GeolSoc Am Boulder Colo
Magistrale H (2002) The relation of the southern San Jacinto fault zone to the Imperial and Cerro Prieto faults in A Barth ed Contribu-tions to crustal evolution of the southwestern United States Geol Soc Am Spec Pap 365 271ndash278
Magistrale H H Kanamori and C Jones (1992) Forward and inverse three-dimensional P wave velocity models of the southern Californiacrust J Geophys Res 97 14115ndash14135 doi10102992JB00494
Magistrale H S Day R W Clayton and R Graves (2000) The SCEC southern California reference three-dimensional seismic velocity modelversion 2 Bull Seismol Soc Am 90 S65ndashS76 doi1017850120000510
McDowell S D and W A Elders (1980) Authigenic layer silicate minerals in borehole Elmore 1 Salton Sea geothermal field CaliforniaUSA Contrib Mineral Petrol 74 293ndash310 doi101007BF00371699
McMechan G A and W D Mooney (1980) Asymptotic ray theory and synthetic seismogram for laterally varying structures Theory andapplication to the Imperial Valley California Bull Seismol Soc Am 70 2021ndash2035
Muffler L J P and B R Doe (1968) Composition and mean age of detritus of the Colorado River delta in the Salton Trough southeasternCalifornia J Sediment Petrol 38 384ndash399
Muffler L J P and D E White (1969) Active metamorphism of upper Cenozoic sediments in the Salton Sea geothermal field and theSalton Trough southeastern California Geol Soc Am Bull 80 157ndash182 doi1011300016-7606(1969)80[157AMOUCS]20CO2
Newmark R L P W Kasameyer and L W Younker (1988) Shallow drilling in the Salton Sea region The thermal anomaly J Geophys Res93 13005ndash13023 doi101029JB093iB11p13005
Paillet F L and R H Morin (1988) Analysis of geophysical well logs obtained in the State 2-14 borehole Salton Sea geothermal area Cali-fornia J Geophys Res 93 12981ndash12994 doi101029JB093iB11p12981
Persaud P Y Ma J M Stock J A Hole G S Fuis and L Han (2016) Fault zone characteristics and basin complexity in the southern SaltonTrough California Geology 44(9) 747ndash750 doi101130G380331
Pratt P G (1999) Seismic waveform inversion in the frequency domain part 1 Theory and verification in a physical scale model Geophys-ics 64 888ndash901 doi10119011444597
Robinson P T W A Elders and L J P Muffler (1976) Quaternary volcanism in the Salton Sea geothermal field Imperial Valley CaliforniaGeol Soc Am Bull 87 347ndash360 doi1011300016-7606(1976)87lt 347QVITSSgt20CO2
Rose E J et al (2013) Borehole-explosion and air-gun data acquired in the 2011 Salton Seismic Imaging Project (SSIP) southernCalifornia-Description of the survey US Geol Surv Open File Rep 2013-1172 84 p doi103133ofr20131172
Sass J H S S Priest L E Duda C C Carson J D Hendricks and L C Robison (1988) Thermal regime of the State 2-14 well Salton SeaScientific Drilling Project J Geophys Res 93 12995ndash13004 doi101029JB093iB11p12995
Schmitt A K and J B Hulen (2008) Buried rhyolites within the active high-temperature Salton Sea geothermal system J Volcanol Geo-therm Res 178(4) 708ndash718 doi101016jjvolgeores200809001
Schmitt A K and J A Vazquez (2006) Alteration and remelting of nascent oceanic crust during continental rupture Evidence from zircongeochemistry of rhyolites and xenoliths from the Salton Trough California Earth Planet Sci Lett 252 260ndash274 doi101016jepsl200609041
Shearer C K J J Papike S B Simon and B L Davis (1988) Mineral reactions in altered sediments from the California state 2-14 well Var-iations in the model mineralogy mineral chemistry and bulk composition of the Salton Sea scientific drilling project core J GeophysRes 93 13104ndash13122 doi101029JB093iB11p13104
Smithyman B R and R M Clowes (2012) Waveform tomography of field vibroseis data using an approximate 2D geometry leads toimproved velocity models Geophysics 77 R33ndashR43 doi101190GEO2011-00761
Stock J M and K V Hodges (1989) Pre-Pliocene extension around the gulf of California and the transfer of Baja California to the pacificplate Tectonics 8 99ndash115 doi101029TC008i001p00099
Tarif P A R H Wilkens C H Cheng and F L Paillet (1988) Laboratory studies of the acoustic properties of samples from Salton Sea Sci-entific Drilling Project and their relation to microstructure and field measurements J Geophys Res 93 13057ndash13067
Vernik L and X Liu (1997) Velocity anisotropy in shales A petrophysical study Geophysics 62 521ndash532 doi10119011444162
Geochemistry Geophysics Geosystems 1010022016GC006610
HAN ET AL SEISMIC IMAGING OF META-SEDIMENT 4584

California
Arizona
0 50
Nkm
Mexico
USA
(b)OBS airgun array
Onshore profile
3-D grid
minus120˚
minus120˚
minus115˚
minus115˚
minus110˚
minus110˚
minus105˚
minus105˚
20˚ 20˚
25˚ 25˚
30˚ 30˚
35˚ 35˚
Pacific Plate G
ulf of California
Baja California
CaliforniaArizona
Sonora
Mexico
USA
North American Plate
4002000
km
(a)
25 km
NSan Andreas Fault
Imperial Fault
CPF
Sand HillsAlgodones Fault
SMF
SHF
Elsinore Fault Zone
San Jacinto Fault ZoneColorado River
Chocolate Mountains
California
Mexico
USA
Imperial Valley
Salton Sea
State 2-14 well
BSZ
BSZ
10931
21130
30520
Line 1
Line 2
Line 3
Wilson No 1 Well
(c)
OB
Figure 1 Salton Seismic Imaging Project (SSIP) study area and seismic lines used in this paper (a) Rifts and transform faults of the plate boundary in California Mexico and the Gulf ofCalifornia Arrows show relative motion between Pacific plate and North America plate Blue box is the survey area in Figure 1b (b) Map of SSIP seismic lines Thick black lines areonshore 2-D profiles yellow-shaded areas are 3-D grids and thick green lines in the Salton Sea are OBS arrays Active faults are red CPF Cerro Prieto Fault (c) Portions of SSIP Lines 1 2and 3 used in this study Red stars are explosive shots and larger stars correspond to shots gt400 kg Numbered shots are shown in data Figures 3ndash5 Blue dots are onshore seismo-graphs SHF Superstition Hills Fault SMF Superstition Mountain Fault BSZ Brawley Seismic Zone OB Obsidian Butte Interpreted Sand HillsAlgodones Fault is shown by dashed redline Faults are from Jennings and Bryant [2010]
Geochemistry Geophysics Geosystems 1010022016GC006610
HAN ET AL SEISMIC IMAGING OF META-SEDIMENT 4567
level the elevation of the Salton Sea is 270 m The Colorado River (Figure 1) has flowed into this active riftbasin throughout the basinrsquos history carrying a high sediment load
Heat flow in most of the Salton Trough is between 100 and 200 mWm2 (Figure 2) [Lachenbruch et al1985] much larger than the mean global heat flow of 80 mWm2 In the Salton Sea Geothermal Field(Figure 2) in the northern Imperial Valley heat flow exceeds 600 mWm2 in an arcuate zone 4 km wideand 12 km long [eg Helgeson 1968 Newmark et al 1988] roughly parallel to the five small Late Quater-nary volcanic domes the Salton Buttes at the southern shore of the Salton Sea [eg Robinson et al 1976Schmitt and Vazquez 2006] Significant seismicity occurs at 3ndash11 km depth in the oblique Brawley SeismicZone (BSZ) (Figure 1) [Hauksson et al 2012] which connects the SAF and IF
In the Salton Trough most of the sediment and sedimentary rock was originally transported by the Colora-do River from the Colorado Plateau [Muffler and Doe 1968 Herzig et al 1988 Dorsey 2010 Dorsey and Laz-ear 2013] The lithology from boreholes is dominantly lacustrine shale and siltstone with minor amounts ofsandstone and anhydrite and mineralogy is consistent throughout the basin Coarser alluvium derivedfrom adjacent ranges is interbedded at the edges of the valley Mineralogy changes systematically withdepth interpreted to be related to increasing temperature and progressive metamorphism of the sedimentnot to changes in the source of the sediment [Muffler and White 1969 McDowell and Elders 1980 Cho et al1988 Shearer et al 1988] Greenschist facies metamorphism of the sediment is observed in wells through-out the valley starting at 06ndash2 km depth and amphibolite grade is observed at 3 km depth within theSalton Sea geothermal field [Muffler and White 1969 Cho et al 1988] Larsen and Reilinger [1991] suggesteda recent regional subsidence rate of 3 kmMyr from leveling data in the northern Imperial Valley Schmittand Hulen [2008] argued that the sedimentation rate accelerates toward the center of the Salton Troughincreasing from 22 to 38 kmMyr
Numerous regional three-dimensional seismic velocity models have been built to study earthquake hazardsin Southern California [eg Magistrale et al 1992 Magistrale et al 2000 Lin et al 2007 Hauksson et al2012] but earthquake network data do not well constrain shallow structure in the valleys Structure of theImperial Valley in the upper crust was best studied by Fuis et al [1984] who interpreted data from five seis-mic refraction profiles One unreversed shot or two reversed shots were recorded on each profile on sta-tions every 05ndash1 km Low seismic velocity (2ndash5 kms) was observed in the upper 4 km throughout thevalley underlain by crystalline rock that has slower seismic velocity than the valley margins They inter-preted the shallowest crystalline rock as metamorphosed sediment based on low seismic velocity and thelack of a seismic reflection or velocity discontinuity associated with sediment deposited on crystalline rock
25 km
N0 100 200 300 400 500 Heat Flow (mWm )2
Mexico
USA
Salton Sea
State 2-14SSGF
BGF Line 2
Line 1
Line 3
Wilson No 1
Figure 2 Heat flow in the Imperial Valley compiled from Newmark et al [1988] Sass et al [1988] and the original data that were presentedas gridded averages by Lachenbruch et al [1985] Small circles are well locations Heat flow greater than 500 mWm2 was set as 500 mWm2 Data from wells were gridded in Matlab at 001 by 001 degree Seismic lines and labels are the same as those in Figure 1 BGF Brawleygeothermal field SSGF Salton Sea geothermal field
Geochemistry Geophysics Geosystems 1010022016GC006610
HAN ET AL SEISMIC IMAGING OF META-SEDIMENT 4568
The Salton Seismic Imaging Project (SSIP) acquired new controlled-source seismic data in the Salton Troughin 2011 [Rose et al 2013] Persaud et al [2016] use some of these data to investigate basin structure andfaulting in the Imperial Valley This paper uses seismic imaging from a portion of the SSIP data set to studythe transition from sediment to crystalline rock in the Imperial Valley testing and improving models pro-duced by the sparser data of Fuis et al [1984] The model of sedimentary metamorphism is tested by search-ing for a sediment-basement depositional discontinuity that might have remained undetected by thesparser seismic data and by correlating the higher-resolution seismic results with borehole and heat-flowobservations The new seismic velocity models confirm metamorphism and provide additional constraintson its depth and lateral extent
2 Seismic Data
21 Data AcquisitionSeven refractionwide-angle reflection profiles and two 3-D seismometer grids were acquired along andacross the Salton Trough by SSIP in 2011 (Figure 1b) [Rose et al 2013] Both in-line and offline shots wererecorded to provide three-dimensional data coverage The recording systems were mostly single-component lsquolsquoTexanrsquorsquo (Ref Tek 125a) seismographs with geophones with a corner frequency of 45 Hz Three-component 45 Hz geophones and RT130 (Ref Tek 130) seismographs were deployed every 1 km alongLine 2 In total 2781 land seismometers with spacing as dense as 100 m were deployed at over 4200 sitesA total of 126 buried explosive shots of 3ndash1400 kg were detonated Thirty-eight ocean-bottom seismo-graphs and 2330 small airgun shots were used in the Salton Sea
In the Imperial Valley three seismic lines were recorded two of which went through the volcanic and geo-thermal field In order to study the transition from sediment to basement in this basin only the valley andnear-valley portions of those three seismic profiles are used in this study (Figure 1c) Line 1 is parallel to thetransform faults and relative plate motion direction (Figure 1) Twenty shot gathers were analyzed along the65 km long portion of Line 1 in the Valley Most shots were 115 kg but a few were up to 1367 kg Theshots were recorded by 574 seismographs in the valley at a spacing of 100 m There were 18 shots and776 seismographs along the 90 km long valley portion of Line 2 oriented approximately perpendicular tothe Imperial Fault (Figure 1) The receiver interval was 100 m in the west and middle of this line segmentbut 200 m in the eastern third The shot size was 115 kg except the shot at the Imperial Fault was 911 kgand the shot to the east of the valley was 592 kg The 67 km long portion of Line 3 consisted of 16 shotsand 429 seismographs This line crossed the valley perpendicular to the transform faults and along theSalton Sea geothermal field (Figure 2) On each side of the valley two shots of gt400 kg were fired while inthe valley the shot size was either 115 or 229 kg The receiver interval was 500 m in the western third ofLine 3 100 m in the valley and 300 m to the east of the valley Although larger shots were fired to thewest of the valley the signal recorded from these shots by the receivers inside the valley was poor This wasalso observed during the seismic survey of Fuis et al [1984] and is probably caused by basin margin struc-ture to the west
22 Data DescriptionFigure 3a illustrates the seismic phases that were observed throughout most of the valley The inverse ofthe slope of the seismic arrivals indicates the apparent seismic velocity which gradually increases from slowlt2 kms sediment near the surface (phase A) to turning (continuously refracted) waves with velocitiesgt5 kms representative of crystalline rock (phase B) The boundary between A and B is gradational anddoes not exhibit a sharp change in apparent velocity No seismic reflection from the base of sediment isobserved in data filtered at any frequency The smooth increase in velocity low crystalline-rock velocityand lack of basement reflector are consistent with the observations of Fuis et al [1984] that were inter-preted as metamorphism of sediment but the SSIP observations are much more densely constrainedStrong multiple basin reverberations (phases C) are observed indicative of a strong increase in velocitywith depth similar to the previous studies [McMechan and Mooney 1980 Fuis et al 1984] Deeper crustalphases such as the Moho reflection PmP and Moho refraction Pn are observed in the valley at distancesgreater than 40 and 80 km respectively [Han et al 2016] but are not shown in this paper
Arrivals very similar to those of Figure 3 are observed on all shots and stations within the central ImperialValley (Figures 3ndash5) indicating only weak lateral variation in geologic structure throughout most of the
Geochemistry Geophysics Geosystems 1010022016GC006610
HAN ET AL SEISMIC IMAGING OF META-SEDIMENT 4569
valley An important exception iswithin the Salton Sea geothermalfield at the southern shore of theSalton Sea where phase B arrives05 s earlier than the rest of thecentral valley (Figures 3 and 5) Earlierarrival times for phase B indicateshallower crystalline rock beneaththe Salton Sea geothermal field butthe transition from phase A to B isgradational similar to the rest of thevalley
The data along Lines 2 and 3 havelarger variation where they extendbeyond the edges of the Imperial Val-ley (Figures 4 and 5) To the west ofshot 21130 (Figure 4) the crystalline-rock phase E arrives much earlierthan phase B the velocity increasefrom A to E is much sharper theapparent velocity of E is faster andthe basin reverberation is muchweaker or absent This shot and othershots to the west on line 2 indicate amuch shallower basin a sharpersediment-rock boundary and a fastercrystalline-rock velocity The twowestern-most shots on line 3 that areincluded in the analysis (Figure 1c)and the two eastern-most shots onboth Lines 2 and 3 display similar fea-tures These observations map theedges of the main basin [Persaudet al 2016]
The crustal reflection phase observedin the data phase G in Figure 4 is onlyobserved on Line 2 at offset gt20ndash22 km and only for shot-receiver mid-points west of the Imperial Fault Asimilar phase was observed nearby byFuis et al [1984] Phases A and B exhib-
it only very small changes across the Imperial Fault (eg Figure 4) indicating that basin and shallowest crystallinerock structure are similar These minor differences and the existence of reflector G west of the fault representtwo different rift segments Based on travel time and offset reflector G is at 12ndash13 km depth Two-dimensionalmodeling of this reflector is beyond the scope of this paper which focuses primarily on the Imperial Valley riftsegment
3 Travel-Time Tomography
31 MethodFirst arrivals were picked manually on all the shot gathers (eg Figure 6a) The estimated accuracy of thosepicks is less than a half period of the dominant signals which is 40ndash50 ms within the offset range used inthis study This represents an upper limit and many picks have lt25 ms accuracy
D
BB
C
Shot 10931
0
2
4
6
8
Tim
e-D
ista
nce
(6
km
s)
(s)
A
BB
C
Shot 10931
0
2
4
6
8
Tim
e-D
ista
nce
(6
km
s)
(s)
A
BB
C
Shot 10931
NW SE-10 0 10 20 30 40
Shot-Receiver Distance (km)
0
2
4
6
8
Tim
e-D
ista
nce
(6
km
s)
(s)
SSGF BSZ
(a)
(b)
(c)
6655
44
2 kms
33
2
Figure 3 (a) Shot 10931 recorded along Line 1 see Figure 1 for location Only theportion of the line in the Imperial Valley is shown Travel time is reduced by 6 kmsThe data are bandpass filtered by an Ormsby filter at 5ndash8ndash20ndash30 Hz Amplitudes arenormalized for each station Smaller signal at the northwest end of the figure is dueto amplitude normalization of geothermal energy industrial noise (b) Synthetic seis-mic data at 01ndash10 Hz computed within the northern portion of the seismic velocitymodel of Figure 7 (c) Synthetic seismic data at 01ndash10 Hz computed within the seis-mic velocity model of Figure 11a Seismic phases A direct or turning wave in sedi-ment B turning waves in the crystalline crust in the valley C multiple of B in thesedimentary basin D reflection from the artificial velocity discontinuity in Figure11a this phase does not exist in the real data BSZ Brawley Seismic Zone SSGFSalton Sea geothermal field
Geochemistry Geophysics Geosystems 1010022016GC006610
HAN ET AL SEISMIC IMAGING OF META-SEDIMENT 4570
These first arrivals were inverted using the travel time tomography algorithm of Hole [1992] Travel timesand rays are computed using finite differences within a 3-D seismic velocity model [Hole and Zelt 1995]Rays are traced in 3-D to include the crooked line geometry but the velocity is smoothed perpendicular tothe line to create a 2-D model The inversion uses smoothed back-projection Weighting is used to eliminatethe effects of uneven seismograph spacing A moving average filter is applied to smooth the velocity per-turbation before it is added to the previous velocity model Rays and times are computed in the new modeland the inversion iterates to find the final model The smoothing size is reduced gradually so that the initialiterations model large-scale structure which is then used as the starting model for later iterations Thisstrongly reduces the effects of smooth starting models and pushes misfits toward smooth structure Theratio between the horizontal and vertical smoothing is kept constant Iterations are stopped before raystreaking artifacts are produced by model errors The model resolution ie the final smoothing size is pri-marily limited by the shot spacing
The starting velocity model for 2-D tomography was built using the same tomography process but the hori-zontal smoothing was set large enough to keep the model 1-D and the vertical smoothing was graduallydecreased to 1 km This simple 1-D model produces travel times that approximate the average observedtimes from all of the shots (eg Figure 6) For Lines 2 and 3 the 1-D starting model was derived using dataonly from the central basin which is the focus of this paper Strong velocity contrasts at shallow depth onthe valley margins are not well represented by the smooth starting model and are less well constrained by
sparser shots so the tomography resultsare smoothed representations of actualstructure outside the basins A range of1-D starting models with faster and slowervelocity and with larger and smaller veloci-ty gradients were tested Within a reason-able range smooth starting velocitymodels all produced similar final velocitystructure with larger variation outside thebasin
The grid size used in this study is 100 m Arange of smoothing ratios were testedand 51 allowed the best spatial resolutionin a smooth model The final tomographyhorizontal smoothing of Lines 1 and 3 was25 km which is roughly the average shotinterval and the vertical smoothing is05 km Line 2 was smoothed to 36 by07 km due to the sparser average shot
6655
44
2 kms
33
2
W E-10 0 10 20 30 40 50 60
Shot-Receiver Distance (km)
0
2
4
6
8
Tim
e-D
ista
nce
(6
km
s)
(s)
Shot 21130
A
B
C
E
G
F
IFSHFEF SF
Figure 4 Shot 21130 recorded along Line 2 plotted and labeled similar to Figure 3 This line segment crosses the Imperial Fault (IF) andextends beyond farmland (lacustrine clay soil) onto the alluvial flanks of the Imperial Valley (Figure 1) Phase E turning waves in the crystal-line crust outside of the valley phase F same as B but with faster apparent velocity caused by the basin thinning eastward phase G reflec-tion from the middle crust with midpoints west of the IF EF Elsinore Fault SHF Superstition Hills Fault SF Sand Hills Fault
BC
A
B
SMF SHF SFSSGFBSZ
H
6655
44
2 kms
33
2
SW NE-20 -10 0 10 20 30
Shot-Receiver Distance (km)
0
2
4
6
8
Tim
e-D
ista
nce
(6
km
s)
(s)
Shot 30520
Figure 5 Shot 30520 recorded along Line 3 plotted and labeled the same asFigure 3 This line extends along the Salton Sea geothermal field (SSGF) nearthe volcanic domes and extends beyond farmland onto the alluvial flanks ofthe Imperial Valley (Figure 1) The geothermal field is visible in the shot gath-ers as a region with higher industrial noise (7ndash20 km) Phase B to the east ofthe shot is 05 s earlier within the SSGF than in most of the valley Firstarrivals are earlier in the Superstition Mountains at distance 220 km wheregranitic bedrock is exposed Phase H diffraction at the eastern edge of thedeep basin SMF Superstition Mountain Fault
Geochemistry Geophysics Geosystems 1010022016GC006610
HAN ET AL SEISMIC IMAGING OF META-SEDIMENT 4571
spacing A smaller smoothing size results in more structural detail and a smaller data misfit but producesartifacts parallel to the dominant ray directions that are caused by noise or picking uncertainty
The ray coverage is very dense and crosses at multiple angles in the center of the models (Figures 7ndash9) pro-viding strong constraints At the bottom and edges of the models ray coverage is sparser and mostly paral-lel to the boundaries allowing for smearing of structure along these directions The root-mean-square
0 10 20 30 40 50 600
05
1
15
2
25
3
Absolute Shot Receiver Distance (km)
Tim
eminusA
bso
lute
Dis
tan
ce(
6km
s)
(s)
1 2 3 4 5 6 70
2
4
6
8
10
Velocity (kms)
Dep
th (
km)
(a) (b)
Line 1Line 3
Line 2
Figure 6 (a) Reduced first-arrival travel times for shots recorded along Line 1 (black lines) and synthetic times in green from the Line 1model in Figure 6b The earlier times correspond to the shot and stations in the Salton Sea geothermal field Later times correspond toshots and receivers in southern Imperial Valley (b) 1-D starting velocity models for Line 1 2 and 3 derived from the first arrival traveltimes The starting models for Lines 2 and 3 were derived using only shots and stations within the valley and the velocity models aresimilar
0 50 100 (rayscell)
2
34
5
62 3 4 5 6 7 (kms)
Dep
th (
km)
0
5
10
Dep
th (
km)
0
5
10
NW SE20 40 60
Distance (km)
(a)
(b)
Line 1
L2BGF MEXSSGFL3 BSZ
Wilson
10931
Figure 7 Line 1 upper crustal velocity model and ray coverage at a vertical exaggeration of 2 Velocity is in kms and contours are at02 kms intervals Ray coverage is plotted as hit count in 100 m grid cells Regions without ray coverage are white Red stars are shots andshot 10931 of Figure 3 is labeled Vertical black line is the Wilson No 1 well SSGF Salton Sea geothermal field L2 and L3 intersectionswith Lines 2 and 3 BSZ Brawley Seismic Zone BGF Brawley geothermal field MEX USA-Mexico border
Geochemistry Geophysics Geosystems 1010022016GC006610
HAN ET AL SEISMIC IMAGING OF META-SEDIMENT 4572
(RMS) data misfit for lines 1 2 and 3 respectively is 36 45 and 39 ms within the picking accuracy(Figure 10)
32 Velocity ModelsFor Line 1 which is oriented northwest-southeast parallel to the relative plate motion direction the velocitystructure is almost 1-D (Figure 7) Velocity gradually increases from 18 kms at the surface to 6 kms at7 km depth approaching the maximum depth of good ray coverage Velocity lt3 kms near the surface istypical for unconsolidated water-saturated clastic sediment [Eberhart-Phillips et al 1989] The 4 kms con-tour typical of a well-lithified low-porosity shale or sandstone [Han et al 1986 Eberhart-Phillips et al 1989Johnston and Christensen 1995 Vernik and Liu 1997] is nearly flat at 3 km depth along the Imperial ValleyThe velocity gradient with depth below 3ndash4 km depth is much smaller than that near the surface (Figures 7and 15) There is no evidence of a steepening in the gradient that might indicate a smoothed discontinuityVelocity gt5 kms a rough proxy for crystalline metamorphic or igneous rock with very low porosity [eg
0 50 100 (rayscell)
2
3
4
5
6
6
2 3 4 5 6 7 (kms)
Distance (km)
0
5
10
Dep
th (
km)
0
5
10
Dep
th (
km)
W E20 40 60 80
Line 2
IF SFUF1 UF2EF SHF L1
(a)
(b)
Wilson
21130
Figure 8 Line 2 upper crust velocity model and ray coverage plotted as for Figure 7 Vertical black line is the Wilson No 1 well EF ElsinoreFault Zone UF1 unidentified fault at the west margin of the basin UF2 unnamed fault characterized by a seismicity lineament connectingto the Superstition Mountain Fault [Hauksson et al 2012] SHF Superstition Hills Fault IF Imperial Fault SF interpreted location of SandHills Fault L1 Line 1
2
34
5
SW NE20 40 60
0
5Dep
th (
km)
0
5Dep
th (
km)
Distance (km)Line 3
(a)
(b)0 50 100 (rayscell)
2 3 4 5 6 7 (kms)
SMF SHF SFOBL1 SSGF
State
BSZ30520
Figure 9 Line 3 upper crust velocity model and ray coverage plotted as for Figure 7 Vertical black line is the State 2ndash14 well OB ObsidianButte
Geochemistry Geophysics Geosystems 1010022016GC006610
HAN ET AL SEISMIC IMAGING OF META-SEDIMENT 4573
Eberhart-Phillips et al 1989 Christensenand Mooney 1995] is at 45 km depthin the northern Imperial Valley and grad-ually deepens from the southern end ofthe Brawley seismic zone to 55 kmdepth at the south end of the line Fractur-ing in the seismic zone might be expectedto reduce velocity yet slightly highercrystalline-rock velocity is observed at agiven depth in the seismic zone Highvelocity is deeper toward the south corre-sponding to both proximity to the mouthof the Colorado River and to slightly lowerheat flow Velocities of lt45 kms areslightly shallower near the Brawley geo-thermal field at model km 21 on Line 1(Figure 7) The SSGF where higher velocityoccurs at much shallower depth is theonly exception to nearly 1-D structure Thisstructure near the northwest edge of themodel is not well constrained on Line 1but is well resolved by Line 3 Deeper con-tours are uplifted a little to the south
The west-east Line 2 crosses the centerof the Imperial Valley and the northernend of the Imperial Fault approximatelyperpendicular to Line 1 The deep sedi-mentary basin is 60 km wide along thisprofile with the deepest part near theImperial Fault (Figure 8) Similar to Line 1seismic velocity continuously increases inthe deep basin with a similar change in
velocity gradient There is a subtle deflection of the contour lines across the Imperial Fault which may besmaller than can be resolved Resolution of the margins of the deep basin are affected by the shot spacingand the tomography smoothing such that lateral resolution is 3ndash4 km Velocity contours rise slowly towardthe eastern side of the basin then rise sharply consistent with a steep fault at model km 80 This basinmargin is east of the southeastern extrapolation of the San Andreas Fault but consistent with the inactiveSand Hills Fault which is the along-strike extension of the Algodones Fault In the western valley the con-tours are consistent with the Superstition Hills Fault at model km 30 and the basin margin at km 17may represent an unidentified fault A seismicity lineament connecting to the Superstition Mountain Fault isobserved at km 22 [Hauksson et al 2012] These structures define a complex western margin of the riftsegment west of the transform Imperial Fault and a complex step-over zone from the active Cerro Prietoand Imperial Faults to the San Jacinto Fault [Magistrale 2002 Persaud et al 2016]
Line 3 extends southwest-northeast along the southern shore of the Salton Sea and along the axis of thegeothermal field The basin is about 45 km wide along this profile with the deepest part near the westernmargin (Figure 9) Compared to Line 2 the basin is much narrower at this location which limits the maxi-mum recording offset and the imaging depth of the basin Within the basin the velocity model is only wellconstrained to 5 km depth and lt56 kms The basin boundaries are consistent with steep faults with thewestern margin at or west of the Superstition Hills Fault and the eastern margin consistent with the SandHills Fault Phase H in Figure 5 is caused by energy diffracted off the edge of the shallow crystalline rock atthe Sand Hills Fault Similar to the other lines velocity within the main basin increases continuously withdepth with a change in gradient However the velocity gradients are much larger within the Salton Seageothermal field and higher velocity occurs at much shallower depth (Figure 9) Shallow high velocity is
Absolute shot receiver distance (km)
Mis
fit
(ms)
Line 1
Line 2
Line 3
0 10 20 30 40
0 10 20 30 40 50 60
0 10 20 30 40 50 60
200
100
0
-100
-200M
isfi
t (m
s)
200
100
0
-100
-200
Mis
fit
(ms)
200
100
0
-100
-200
Figure 10 Travel time misfits (calculated minus observed) for the seismicvelocity models of Figures 7ndash9 The RMS data misfit is 36 45 and 39 ms forlines 1 2 and 3 respectively
Geochemistry Geophysics Geosystems 1010022016GC006610
HAN ET AL SEISMIC IMAGING OF META-SEDIMENT 4574
also observed within the Salton Sea geothermal field along Line 1 (Figure 7) but it is better constrainedalong this profile
Travel-time tomography with smoothing successfully matches the data (Figure 10) but produces a modelthat is as smooth as possible A sharp velocity discontinuity will be imaged as a zone with elevated velocitygradient There is no evidence within the velocity models for a downward increase in the velocity gradientat any depth (Figures 7ndash9) In addition no strong reflectors are observed in the data (Figures 3ndash5) Theseobservations suggest that no velocity discontinuity such as a depositional surface between sediment andbedrock exists However smooth tomography is not the ideal tool to detect discontinuities so syntheticseismograms and full-waveform inversion were used to further test for the presence or absence of adiscontinuity
4 Synthetic Seismograms
Full-waveform synthetic seismograms were computed for a representative shot in the central Imperial Val-ley The algorithm of Pratt [1999] computes synthetic seismograms in a gridded 2-D velocity model using afinite-difference approximation of the acoustic wave equation in the frequency domain Synthetic datawere computed at 01ndash10 Hz for shot 10931 in the northern half of the travel-time tomography model ofFigure 7 The synthetic data successfully reproduce the first arrivals and the strong basin reverberations (Fig-ure 3b) The reverberations were not considered in the tomography so their production in the syntheticdata provides additional confidence in the velocity model in particular the strong velocity gradient in thebasin
For comparison purposes synthetic seismograms were computed for a similar velocity model but contain-ing a velocity discontinuity to simulate a depositional unconformity above basement (Figure 11a) Thismodel was created by adding a velocity discontinuity from 4 to 5 kms to the travel-time tomography mod-el of Figure 7 The boundary is evident in the synthetic seismic data as a secondary reflection arrival firstarrival amplitude weakening at critical distance and a slightly sharper change in the slope of first arrival(distance 10 km) and basin reverberation (distance 15 km at 4 s) (Figure 3c) none of which are detectedin the real data (Figure 3a) The lack of such evidence in the real data indicates that a strong discontinuity isnot present under the Imperial Valley
5 Full-Waveform Inversion
To improve the vertical resolution of the velocity model and to further test for the existence of discontinu-ities full-waveform inversion was applied to the northern half of Line 1 where the shots are closesttogether
51 Inversion MethodThe full-waveform tomography algorithm of Pratt [1999] inverts phase and amplitude of seismic data in thefrequency domain An excellent starting model accurate to within a half-period of the frequencies beinginverted is required for convergence Brenders and Pratt [2007a 2007b] demonstrate that a starting velocitymodel derived from first-arrival travel-time tomography works well for long-offset refraction and reflectiondata An approach that progressively inverts from low to high-frequency stabilizes the inversion by produc-ing more detailed starting models for inversions at higher frequency
Land crustal seismic refraction and wide-angle reflection data are usually acquired along crooked roadswhich makes 2-D full waveform inversion difficult Due to the crooked SSIP line (Figure 1) an approximate2-D geometry was used following Smithyman and Clowes [2012] Similar to the travel-time tomography thevelocity and attenuation models are assumed to be homogeneous in the direction perpendicular to theaverage seismic line Shots and receivers are projected to the straight line and the seismic waveforms arecorrected using a time shift determined by 3-D ray tracing which accounts for the cross-line offsets pro-duced by the crooked-line acquisition
Densely spaced shots and receivers are required for full-waveform inversion to converge At least one of thetwo domains must not be spatially aliased The minimum velocity in the Imperial Valley is 16 kms andthe receiver interval is 100 m so 8 Hz is the highest frequency that is not spatial aliased The lowest
Geochemistry Geophysics Geosystems 1010022016GC006610
HAN ET AL SEISMIC IMAGING OF META-SEDIMENT 4575
frequency observed in the SSIP data is 2 Hz so the data were inverted from 2 to 7 Hz Brenders and Pratt[2007b] showed that full-waveform inversion can work if the shots are spatially aliased but only up to a lim-it The northern 30 km of Line 1 along the northern Imperial Valley has the densest shot spacing Unfortu-nately two shots could not be used because they were recorded only by every second station which is notallowed by the existing software The remaining shots are spaced 25 km on average and 7 km at mostBrenders and Pratt [2007b] showed that the image quality remains acceptable if the shot spacing is lessthan 15 times the shortest wavelength recorded at the starting frequency and accurate images can beobtained in the central portion of the model when the ratio is around 35 but the images suffer from somedegradation For the SSIP data the ratio is 3 (08 km wavelength at 2 Hz at 16 kms) so the shot spacingis nonideal Additional challenges are the irregular shot spacing and noise in the data Bleibinhaus et al[2009] showed that the inversion of only the phase of the frequency-domain data is more stable for realisticlong-offset data so the SSIP inversion ignored amplitude The inversion is thus similar to the finite-
2
3
4
5
2
3
4
5
2 3 4 5 6 (kms)
(a)
(b)
(c)
0
2
4
6
Dep
th (
km)
0
2
4
6
Dep
th (
km)
0
2
4
6
Dep
th (
km)
Distance (km)
NW SE5 10 15 20 25 30 35
BSZLine 1 synthetic
Figure 11 (a) Synthetic velocity model for a segment of Line 1 derived from the model of Figure 7 with an added 4 to 5 kms discontinu-ity This discontinuity is marked as black-dashed lines in Figures 11b and 11c The x axis is labeled as for Figure 7 (b) Results of first arrivaltravel time tomography of synthetic seismic data for the shots shown as stars (c) Results of full-waveform inversion of 2ndash7 Hz syntheticdata The discontinuity is detected as a sharp jump in velocity at the correct location
Geochemistry Geophysics Geosystems 1010022016GC006610
HAN ET AL SEISMIC IMAGING OF META-SEDIMENT 4576
frequency inversion method but it uses thephase of a long-time window that can containmultiple arrivals rather than the travel timeof a narrowly windowed single arrival Datapreprocessing included removal of noisydata traces and bandpass filtering Large-amplitude surface waves and S waves weremuted from the data as they are not includedin the acoustic-wave synthetic data
52 Inversion of Synthetic DataIn order to test whether full-waveform inversioncould detect the presence of a basement-like
velocity discontinuity full-waveform inversion was applied to synthetic data computed in the artificial model ofFigure 11a The synthetic data set was produced using the same shot and receiver geometry as the real data(eg Figure 3c) The starting model (Figure 11b) was derived from first arrival travel-time tomography usingtravel-times calculated from the synthetic velocity model As expected travel-time tomography smoothed thesharp boundary shown by the black dash line so that it was not detected (Figure 11b)
The synthetic data were preprocessed in the same manner as would be used for the real data The near off-set data were muted to remove surface waves and very high amplitudes in the real data The remainingdata were windowed for 3 s after the first arrivals and band-pass filtered The inversion was iteratively per-formed on a single frequency at a time progressing gradually from 2 to 7 Hz (Table 1) The inversion foreach higher frequency used the velocity model from the previous inversion as the starting model stabiliz-ing the inversion at shorter wavelengths For each frequency the source signature was inverted first fromthe most recent velocity model Inversion for each frequency required eight iterations
The velocity model after full-waveform inversion of 2ndash7 Hz data successfully sharpened the velocity contrastat the correct depth (Figure 11c) Although velocity oscillations common from waveform inversion wereproduced the results resemble the true synthetic model and detect the discontinuity The image quality isbest at model distances of 8ndash14 km and 28ndash34 km which are beneath the densest shots This syntheticexperiment shows that full waveform inversion can improve images of a discontinuity for the geometry ofthe SSIP experiment
53 Inversion of SSIP DataThe same procedure and parameters (Table 1) were applied to the real SSIP data The starting velocity mod-el was the first-arrival travel-time tomography model from Figure 7 (Figure 12a) Short-offset data bad seis-mic traces and a very noisy section of the data set was muted The remaining data were windowed for 3 safter the first arrivals The waveform-inversion result (Figure 12b) closely resembles the travel-time inversionvelocity model except for the high velocity below 25 km depth at distance 14ndash17 km This part of the mod-el is not as well constrained by the sparse shots above it as suggested by the synthetic study so is inter-preted as an artifact The model has short-wavelength oscillations about the starting model but shows noevidence for a sharp contrast that extends across the model (Figures 12 and 13) Waveform inversion con-firms that the transition from sediment to crystalline rock velocity is gradual
6 Metamorphism of Sediment
61 Seismic EvidenceThe seismic velocity throughout the Imperial Valley increases continuously with depth from lt2 kms in sur-face sediment to gt5 kms (Figures 729 and 13215) typical of crystalline rocks [eg Christensen andMooney 1995] The high-quality seismic data are capable of detecting a sharp velocity contrast with depthbut such a discontinuity is not detected by a reflection arrival in the seismic data nor by full waveform inver-sion of the data The mineralogy in geothermal energy and research boreholes indicates progressive meta-morphism of Colorado River sediment with depth caused by the valleyrsquos high geothermal gradient [egMuffler and White 1969 McDowell and Elders 1980 Cho et al 1988 Shearer et al 1988] A previous seismicrefraction study with several sparsely sampled lines also observed a lack of seismic bedrock reflector and a
Table 1 Full-Waveform Inversion Parametersa
Frequency(Hz)
No ofIterations
Synthetic-DataObjective Function
Reduction
Real-DataObjective Function
Reduction
2 8 44 2224 8 46 2229 8 43 2435 8 45 3442 8 44 465 8 44 436 8 42 527 8 44 48
aThe objective function defined by Pratt [1999] represents misfit
Geochemistry Geophysics Geosystems 1010022016GC006610
HAN ET AL SEISMIC IMAGING OF META-SEDIMENT 4577
low crystalline-rock velocity and interpreted shallow crystalline rocks within the Imperial Valley to be meta-morphosed sediment [Fuis et al 1984] The SSIP data provide higher-resolution seismic images that supportand refine this interpretation
Beyond the margins of the deep basin the seismic data clearly show a much sharper velocity contrast fromlt35 to 6 kms (eg west side of Figure 4) The starting velocity model sparser shots and smoothingused for the tomography do not ideally image the shallow sediment-rock transition outside the deep basinHowever the data are most consistent with 0ndash2 km of sediment deposited on pre-existing felsic crystallinebedrock with velocity near 60 kms
Throughout the Imperial Valley the velocity gradient deeper than the 45 kms contour is much smallerthan that above 40 kms (Figures 729 and 14 and 15) The velocity gradient at shallow depth varies with-in the valley from 08 up to 2 kmskm such that 4 kms occurs at variable depth This depth generally cor-relates with heat flow (Figures 2 and 16) At greater depth the gradient is a much lower 04ndash05 s21 almostdown to the 6 kms contour The transition zone between high and low gradient is 1 km thick along line 1and the central valley portions of lines 2 and 3 Toward the western margin of the deep basin along line 3and both margins along line 2 the velocity gradient changes less sharply but a strong change is stillobserved The true change in gradient may be more gradational at these locations or resolution might beworse because of the sparser shots and lateral smearing of the basin margins
62 Correlation With Borehole ObservationsThe State 2-14 well of the Salton Sea Scientific Drilling Project [Elders and Sass 1988] is located lt05 kmfrom seismic Line 3 (Figure 1) which enables correlation of the seismic velocity model with observationsfrom the borehole (Figure 14) This research borehole penetrated 322 km of Pleistocene to Holocene sedi-ment and metasedimentary rock in the Salton Sea geothermal field Temperature in the borehole reached3008C at 1700 m and 3558C at 3170 m (Figure 14e) [Sass et al 1988] Sedimentary layering and bulk
2
3
4
5
2 3 4 5 6 (kms)
0
2
4
6
Dep
th (
km)
0
2
4
6
Dep
th (
km)
Line 1 Distance (km)
NW SE5 10 15 20 25 30 35
BSZ
(a)
(b)
L2
Figure 12 (a) Starting velocity model for full-waveform inversion from Figure 7 (b) Results of full-waveform inversion of the 2ndash7 Hz realdata for the shots shown as stars No sharp velocity discontinuity is produced
Geochemistry Geophysics Geosystems 1010022016GC006610
HAN ET AL SEISMIC IMAGING OF META-SEDIMENT 4578
composition are preserved throughout the boreholeand are consistent with a Colorado River source butthe sediment is progressively metamorphosed as temper-ature increases with depth [Cho et al 1988 Shearer et al1988] Three major metamorphic zones are observedfrom core samples (Figure 14a) chlorite-calcite (Chl-Cc)zone biotite (Bt) zone and clinopyroxene-amphibole(Cpx) zone Epidote is formed beneath 09 km depth atgt2508C The Chl-Cc zone beginning at 06 km depth and1908C represents greenschist facies metamorphism andthe Cpx zone at 30 km depth and 3508C marks thelow-pressure transition from greenschist to amphibolitefacies [Cho et al 1988 Shearer et al 1988] The rocks areprogressively lithified in a manner similar to diagenesisbut without the formation of typical diagenetic mineralslike zeolite The metamorphism is driven primarily by theeffects of temperature except in sporadic steep fractureswhere hydrothermal fluids dominate A regional 770 katuff is observed in the well at 17 km depth [Herzig andElders 1988 Schmitt and Hulen 2008] indicating gt2 kmMyr deposition and metamorphism of sediment that wasdeposited as recently as 300 kyr ago
Seismic velocity measured in the borehole and from coresamples [Daley et al 1988 Paillet and Morin 1988 Tarifet al 1988] is consistent with the seismic velocity modelfrom Line 3 (Figure 14b) The change in velocity gradientat 16ndash21 km depth occurs within the Chl-Cc metamorphiczone and does not correlate with any metamorphic faciesboundary or major mineral occurrence (Figure 14) It doeshowever correlate with a change in gradient in the porosi-ty (Figure 16d) and density of core samples [Tarif et al1988] and in the electrical resistivity log [Paillet and Morin1988] Most of the porosity is sedimentary matrix porositynot fractures Porosity decreases rapidly within the Chl-Cczone from gt20 to5 due to calcite precipitation crys-tal overgrowth and metamorphism of clays to feldspars
and epidote [Cho et al 1988 Tarif et al 1988] Once porosity reaches5 metamorphism continues with depthbut porosity closes much more slowly perhaps due to lower permeability and less fluid flow The top of thechange in gradient in seismic velocity is interpreted to be due to the change in gradient in porosity and densitynot to the minerals present This change occurs at a velocity of 44 kms which is typical of a well-cementedlow-porosity shale or sandstone [eg Han et al 1986 Eberhart-Phillips et al 1989 Johnston and Christensen 1995Vernik and Liu 1997] This5 porosity is very high and seismic velocity is very low for a greenschist facies meta-sedimentary rock probably due to the shallow depth and rapid speed of metamorphism Consolidated higherporosity weaker metasedimentary rock starts at shallower depth near the top of the Chl-Cc zone
The same metamorphic mineralogy is observed in geothermal wells throughout the Imperial Valley [egMuffler and White 1969 McDowell and Elders 1980] The metamorphic reactions are observed at differentdepths due to different heat flow but at very similar temperatures The Elmore 1 well within the geothermalfield near line 3 has much higher temperature (3608C at 2120 m depth) the metamorphic zones are shal-lower and garnet is created near the bottom of the well [McDowell and Elders 1980] A change in porositygradient at porosity 9 very similar to the State 2-14 well occurs at 13 km depth in the Elmore 1 wellbut in middle of the Bt zone rather than the Chl-Cc zone
Metamorphic mineralogy is available for few wells outside the geothermal field where the heat flow ismuch lower but still much higher than normal continental values The deep Wilson No 1 well at the
1
2
3
4
5
6
7
Velocity (kms)
Dep
th (
km)
1 2 3 4 5 60
km 12
km 30
km 50
Figure 13 Velocity profiles at three locations along Line 1 atmodel km 12 (red) km 30 (green) and km 50 (blue) The sol-id lines are from first-arrival travel-time tomography (Figure7) and the dashed lines from full-waveform inversion (Fig-ure 12b) The velocity-depth profiles are averaged 500 mhorizontally for travel-time tomography and 200 m for fullwaveform inversion
Geochemistry Geophysics Geosystems 1010022016GC006610
HAN ET AL SEISMIC IMAGING OF META-SEDIMENT 4579
intersection of Lines 1 and 2 with a temperature typical of most of the valley (2608C at 41 km depth)observed the same metamorphic reactions at similar temperatures but greater depth (Figure 15) [Mufflerand White 1969] Due to lower temperature epidote and the biotite zone were not observed Porosity was
1 2 3 4 5 60
1
2
3
4
5
6
7
8
02 04 06 08 10
1
2
3
4
5
6
7
8
0 100 200 3000
1
2
3
4
5
6
7
8
Dep
th (
km)
Velocity (kms) Velocity gradient (s Temperature ( C))-1
Chl-CcZone
Sediment
(a) (b) (c) (d)
Line 1
Line 2
260 C
Figure 15 Correlation of seismic velocity profiles at the intersection of Lines 1 and 2 with the Wilson No 1 well (a) Metamorphic faciesfrom Muffler and White [1969] (b) Seismic velocity from Lines 1 (green) and 2 (blue) are consistent (c) Velocity gradient from Figure 15bThe velocity gradient is very different above and below a transition zone (stars) (d) Well bottom temperature from Muffler and White[1969] projected linearly to the surface
1 2 3 4 5 60
05
1
15
2
25
3
Velocity (kms)
Dep
th (
km)
0 05 1 15 20
05
1
15
2
25
3
Velocity gradient (sminus1)0 5 10 15 20 25
0
05
1
15
2
25
3
Porosity ()100 200 3000
1
2
3
Temperature ( C)
Chl-Cc
Zone
Bt Zone
Cpx Zone
Sediment
(c)(b)(a) (d) (e)
Epidote
Figure 14 Correlation of the seismic velocity model with borehole observations from the State 2ndash14 well in the Salton Sea geothermal field (a) Metamorphic zones from Cho et al[1988] (b) P-wave seismic velocity from this study (green) vertical seismic profiling in the well (blue) from Daley et al [1988] sonic waveform log (red) from Paillet and Morin [1988] andultrasonic measurements of core samples (orange) from Tarif et al [1988] (c) Velocity gradient from this study (top and bottom) The transition zone in velocity gradient is marked byred stars (d) Porosity of core samples from Tarif et al [1988] (e) Borehole temperature from Sass et al [1988]
Geochemistry Geophysics Geosystems 1010022016GC006610
HAN ET AL SEISMIC IMAGING OF META-SEDIMENT 4580
mostly closed at an unreported depth within the Chl-Cc zone Seismic velocity at this location is lower thanin the geothermal field and the change in velocity gradient occurs almost twice as deep at 28 km depthwhere the velocity is a very similar 40 kms (Figure 15) This depth is within the Chl-Cc zone but at lowermetamorphic facies within the zone The change in velocity gradient is interpreted to be due to a change in
0
3
6
9
12
Dep
th (
km)
0500
10001500
HF
(m
Wm
2 )
10 20 30 40 50 60
0
3
6
9
12
Dep
th (
km)
0500
10001500
HF
(m
Wm
2 )
10 20 30 40 50 60 70 80
0
3
6
9
12D
epth
(km
)
0500
10001500
HF
(m
Wm
2 )
0 10 20 30 40 50 60 70
L2BGF
L1
MEX
IF SHF SF
SSGFL3 BSZ
Wilson
Wilson
SMF SHF SFOBL1SSGF
State
BSZ
Distance (km)
Line 1
Line 2
Line 3
51 kms
51 kms
51 kms
(a)
(b)
(c)
(d)
(e)
(f)
NW SE
W E
SW NE
60 kms
60 kms
60 kms
Figure 16 Interpretation of the seismic velocity models of Figures 7ndash9 For each seismic line (top) heat flow from wells within 2 km of theseismic line (Figure 2) (bottom) Depth to features of the seismic velocity models Green lines show the top of the change in velocity gradi-ent Within the Imperial Valley this represents a greenschist-facies metasedimentary rock with 5ndash10 porosity Red lines correspond tometasedimentary rocks with seismic velocity of 51 kms Blue lines correspond to the 60 kms seismic velocity of preexisting crust outsidethe valley which may not exist beneath the valley Line 3 does not image deep enough to observe 6 kms in the valley These lines do notrepresent boundaries but are gradational changes due to progressive metamorphism Metasediment continues to at least 7ndash8 km depth Blackdots are seismicity within 5 km of the seismic line from Hauksson et al [2012] Geologic labels and wells are as for Figures 7ndash9
Geochemistry Geophysics Geosystems 1010022016GC006610
HAN ET AL SEISMIC IMAGING OF META-SEDIMENT 4581
porosity gradient at 5ndash10 porosity similar to that observed in the geothermal fields Rapid closure of porosi-ty always occurs within the Chl-Cc zone indicating that metamorphism plays a role However at greaterdepth it occurs at a lower temperature within the Chl-Cc zone This suggests that while pressure plays only aminor role in the metamorphic mineralogy metamorphism and pressure work together to close porosity
63 Depth and Extent of Metasedimentary CrustThe top of the sharp decrease in seismic velocity gradient is interpreted to be the depth where rapid closureof porosity ends at 5ndash10 porosity This depth was measured along all of the seismic lines (Figure 16) Eventhough the depth changes along the lines it occurs at a fairly consistent velocity of 41 kms In the geother-mal fields the velocity at this depth is up to 5 faster representing a more intense metamorphism Wherethe change in velocity gradient is not as sharply defined 41 kms was used as a proxy At this depth(Figure 16) we interpret a greenschist-facies metasedimentary rock with 5ndash10 porosity due to rapid meta-morphism at shallow depth This lsquolsquoboundaryrsquorsquo is in fact gradational due to progressive metamorphism withdepth It represents a change in the gradient of the closure of porosity rather than a metamorphic faciesboundary Metasedimentary rock with higher porosity exists well above this boundary but the top of metamor-phism and consolidation are not well expressed by geophysical parameters The shallowest depth for thisvelocity-gradient boundary is 12ndash16 km in the Salton Sea geothermal field along Line 3 and at the northernend of Line 1 (Figure 16) where the heat flow exceeds 600 mWm2 [Helgeson 1968 Newmark et al 1988]Most of the rest of the valley however has a much lower heat flow of 100ndash200 mWm2 (Figures 2 and 16)[Lachenbruch et al 1985] For the rest of the valley the depth of the velocity-gradient boundary is at 25ndash3 kmdepth and it is very flat at 28 km depth along the axis of the valley on Line 1 (Figure 16) Little contrast isobserved across the Imperial Fault even though this transform fault bounds two different rift segments Thedeepest boundary is along the western portion of Line 3 which extends west of the northwest extrapolation ofthe Imperial fault This area lies outside the main rift The velocity-gradient boundary is difficult to define nearthe margins of the valley due to sparser shots shallower ray coverage and lateral smoothing of the tomogra-phy model It may not turn shallower toward the southwest as shown in Figure 16 except outside the basin
At the eastern and western margins of the valley along Lines 2 and 3 the raw seismic data (eg Figure 4)indicate thinner sediment a sharper sediment-rock boundary and faster crystalline-rock velocity of 6 kms immediately beneath the sediment These observations are interpreted as evidence for sediment deposi-tion on preexisting crystalline crust outside the main rift valley The margins of the deep basin are smearedby tomographic smoothing and sparser shots but are still consistent with steep faults Along Line 2 achange in slope of the velocity contours suggests a discontinuity at km 30 (Figure 8) near the SuperstitionHills Fault The western boundary along Line 3 lies east of the Superstition Mountains which expose graniticbasement and may be as far east as the Superstition Hills Fault (Figure 9) The eastern boundary of thebasin is similar along lines 2 and 3 and is consistent with the Sand Hills Fault which is thought to representan inactive strike-slip fault that predates the modern active faults
Metasedimentary crust extends to at least 7ndash8 km depth based on smoothly increasing seismic velocity that isslower than that observed outside the basin Based on deposition rates of 2ndash4 kmMyr [Schmitt and Hulen2008] 8ndash16 km of sediment has been deposited in the last 4 Myr Based on longer-offset SSIP data [Han et al2016] felsic crystalline rock extends to 13 km depth The entire felsic component of the crystalline crust maybe metamorphosed synrift sediment Alternatively the lower 5 km has seismic velocity that is also consistentwith prerift granitic continental crust Dorsey [2010] and Dorsey and Lazear [2013] show that the volume of sed-iment produced by erosion of the Colorado Plateau and carried to the Salton Trough by the Colorado River isconsistent with the 8ndash13 km of sediment plus metasediment constrained by the seismic data
Abundant seismicity occurs at 3ndash8 km depth in the Salton Sea geothermal field 3ndash11 km depth in most ofthe Brawley Seismic Zone and 8ndash11 km depth beneath the Imperial fault (Figure 16) [Lin et al 2007 Hauks-son et al 2012] A seismic velocity of 51 kms is used as a rough proxy for stronger crystalline rock thatmight support seismic stress (Figure 16) In general the shape of this velocity contour mimics the shallowervelocity-gradient boundary at almost twice the depth Most seismicity occurs deeper than this proxy Withinthe Brawley Seismic Zone abundant seismicity occurs at depths much shallower than 9 km includingevents with magnitude 5 [eg Hauksson et al 2013] Thus metamorphism is creating new crystalline crustthat is strong enough for large-magnitude seismic brittle fracture Imperial Fault seismicity occurs at depthsthat may correspond to prerift crust or higher-grade metasediment
Geochemistry Geophysics Geosystems 1010022016GC006610
HAN ET AL SEISMIC IMAGING OF META-SEDIMENT 4582
The interpreted metasedimentary rock is 5ndash10 km thick from lt3 to 8ndash13 km depth which constitutes a sig-nificant fraction of the Imperial Valley crust that is only 18 km thick [Han et al 2016] Assuming that conti-nental rifting proceeds to seafloor spreading and an ocean basin metamorphosed rift sediment will form asignificant component of the passive continental margin Based solely on geophysical properties metamor-phosed synrift sediment may be mistaken for extended preexisting continent Since high heat flow and riv-er deltas are expected during the late stages of continental breakup metasediment may be an importantand underrecognized component of global passive continental margins
7 Conclusions
Three P-wave seismic velocity models in the Imperial Valley were generated from first arrival travel timetomography of the SSIP refraction data The results are consistent with the previous study of Fuis et al[1984] but provide more details on the basin structure and underlying crystalline rock Velocity increasescontinuously with depth within the valley with no velocity discontinuity indicating a gradational transitionbetween sediment and underlying crystalline rock This interpretation is confirmed by full waveform inver-sion on one of the seismic lines Comparison with boreholes indicates that sediment within the basin is pro-gressively metamorphosed at shallow depth by the high heat flow in the rift This temperature-drivenmetamorphism continues with depth producing strong new crystalline rock A regional sharp change inthe seismic velocity gradient correlates to a change in the rate of closing porosity in wells This changeoccurs within the greenschist facies but at a porosity of 5ndash10 that is much higher than traditional meta-morphism This change in porosity gradient occurs at 25ndash3 km depth in most of the valley but is muchshallower at 15 km depth in the Salton Sea geothermal field corresponding to extremely high heat flowVelocity more typical of strong crystalline rock is observed at almost twice these depths Abundant seismici-ty within the Brawley seismic zone occurs within metamorphosed synrift sediment Sedimentation and highheat flow are actively creating new crystalline crust in the Imperial Valley and that crust is strong enoughfor brittle seismicity related to ongoing extension This new felsic crystalline crust will become a significantcomponent of the future passive continental margin
ReferencesBleibinhaus F R W Lester and J A Hole (2009) Applying waveform inversion to wide-angle seismic surveys Tectonophysics 472 238ndash
248 doi101016jtecto200808023Brenders A J and R G Pratt (2007a) Full waveform tomography for lithospheric imaging Results from a blind test in a realistic crustal
model Geophys J Int 168 133ndash151 doi101111j1365-246X200603156xBrenders A J and R G Pratt (2007b) Efficient waveform tomography for lithospheric imaging Implications for realistic two-dimensional
acquisition geometries and low-frequency data Geophys J Int 169 152ndash170 doi101111j1365-246X200603096xCho M J G Liou and D K Bird (1988) Prograde phase relations in the State 2-14 well metasandstones Salton Sea geothermal field Cali-
fornia J Geophys Res 93 13081ndash13103 doi101029JB093iB11p13081Christensen N I and W D Mooney (1995) Seismic velocity structure and composition of the continental crust A global view J Geophys
Res 100 9761ndash9788 doi10102995JB00259Daley T M T V McEvilly and E L Majer (1988) Analysis of P and S wave vertical seismic profile data from the Salton Sea Scientific Drilling
Project J Geophys Res 93 13025ndash13036 doi101029JB093iB11p13025Dorsey R J (2010) Sedimentation and crustal recycling along an active oblique rift margin Salton Trough and northern Gulf of California
Geology 38 443ndash446 doi101130G306981Dorsey R J and G Lazear (2013) A post-6 Ma sediment budget for the Colorado River Geosphere 9 781ndash791 doi101130GES007841Eberhart-Phillips D D Han and M D Zoback (1989) Empirical relationships among seismic velocity effective pressure porosity and clay
content in sandstone Geophysics 54 82ndash89 doi10119011442580Elders W A and J H Sass (1988) The Salton Sea scientific drilling project J Geophys Res 93 12953ndash12968 doi101029
JB093iB11p12953Elders W A R W Rex T Meidav P T Robinson and S Bieler (1972) Crustal spreading in southern California Science 178 15ndash24 doi
101126science178405615Fuis G S and W M Mooney J H Healy G A McMechan and W J Lutter (1984) A seismic refraction survey of the Imperial Valley region
California J Geophys Res 89 1165ndash1189 doi101029JB089iB02p01165Han D A Nur and D Morgan (1986) Effects of porosity and clay content on wave velocities in sandstones Geophysics 51 2093ndash2107
doi10119011442062Han L et al (2016) Continental rupture and the creation of new crust in the Salton Trough rift southern California and northern Mexico
Results from the Salton Seismic Imaging Project J Geophys Res Solid Earth 121 doi1010022016JB013139Hauksson E W Yang and P M Shearer (2012) Waveform relocated earthquake catalog for Southern California (1981 to June 2011) Bull
Seismol Soc Am 102 2239ndash2244 doi1017850120120010Hauksson E et al (2013) Report on the August 2012 Brawley earthquake swarm in Imperial Valley Southern California Seismol Res Lett
84(2) 177ndash189 doi1017850220120169Helgeson H C (1968) Geologic and thermodynamic characteristics of the Salton Sea geothermal system Am J Sci 266 129ndash166 doi
102475ajs2663129
AcknowledgmentsWe thank the Editor Thorsten Beckerand three anonymous reviewers fortheir helpful and constructive reviewsThis research was supported by NSFMARGINS and EarthScope grants0742263 to JAH and 0742253 toJMS by the U S Geological SurveyrsquosMultihazards Research Program andby the Southern California EarthquakeCenter (SCEC) (Contribution No 6244)We thank the gt90 field volunteers andUSGS personnel who made dataacquisition possible Numerouslandowners acknowledged in Roseet al [2013] allowed access for shotsand stations Seismographs andtechnical support were provided bythe IRIS-PASSCAL instrument facilityspecial thanks go to Mouse Reuschand Patrick Bastien from PASSCAL fortheir field and data efforts Softwaresupport was provided by LandmarkSoftware and Services a HalliburtonCompany The data have beenarchived at the IRIS DMC (httpdsirisedupic-ph5metadataSSIPformphp)
Geochemistry Geophysics Geosystems 1010022016GC006610
HAN ET AL SEISMIC IMAGING OF META-SEDIMENT 4583
Herzig C T and W A Elders (1988) Nature and significance of igneous rocks cored in the State 2-14 research borehole Salton Sea Scien-tific Drilling Project California J Geophys Res 93 13069ndash13080 doi101029JB093iB11p13069
Herzig C T J M Mehegan and C E Stelting (1988) Lithostratigraphy of the State 2-14 borehole Salton Sea Scientific Drilling Project JGeophys Res 93 12969ndash12980 doi101029JB093iB11p12969
Hole J A (1992) Nonlinear high-resolution three-dimensional seismic travel time tomography J Geophys Res 97 6553ndash6562 doi10102992JB00235
Hole J A and B C Zelt (1995) 3-D finite-difference reflection traveltimes Geophys J Int 121(2) 427ndash434 doi101111j1365-246X1995tb05723x
Jennings C W and W A Bryant (2010) Active Fault Map of California Geologic Data Map No 6 Scale 1750000 Calif Geol SurvSacramento
Johnston J E and N I Christensen (1995) Seismic anisotropy of shales J Geophys Res 100 5991ndash6003 doi10102995JB00031Lachenbruch A H J H Sass and S P Galanis Jr (1985) Heat flow in southernmost California and the origin of the Salton Trough J Geo-
phys Res 90 6709ndash6736 doi101029JB090iB08p06709Larsen S and R Reilinger (1991) Age constraints for the present fault configuration in the Imperial Valley California Evidence for north-
westward propagation of the Gulf of California rift system J Geophys Res 96 10339ndash10346 doi10102991JB00618Lin G P M Shearer and E Hauksson (2007) Applying a three-dimensional velocity model waveform cross correlation and cluster analy-
sis to locate southern California seismicity from 1981 to 2005 J Geophys Res 112 B12309 doi1010292007JB004986Lonsdale P (1989) Chapter 26 Geology and tectonic history of the Gulf of California in The Eastern Pacific Ocean and Hawaii The Geologi-
cal Society of America The Geology of North America vol N edited by E L Winterer D M Hussong and R W Decker pp 499ndash521 GeolSoc Am Boulder Colo
Magistrale H (2002) The relation of the southern San Jacinto fault zone to the Imperial and Cerro Prieto faults in A Barth ed Contribu-tions to crustal evolution of the southwestern United States Geol Soc Am Spec Pap 365 271ndash278
Magistrale H H Kanamori and C Jones (1992) Forward and inverse three-dimensional P wave velocity models of the southern Californiacrust J Geophys Res 97 14115ndash14135 doi10102992JB00494
Magistrale H S Day R W Clayton and R Graves (2000) The SCEC southern California reference three-dimensional seismic velocity modelversion 2 Bull Seismol Soc Am 90 S65ndashS76 doi1017850120000510
McDowell S D and W A Elders (1980) Authigenic layer silicate minerals in borehole Elmore 1 Salton Sea geothermal field CaliforniaUSA Contrib Mineral Petrol 74 293ndash310 doi101007BF00371699
McMechan G A and W D Mooney (1980) Asymptotic ray theory and synthetic seismogram for laterally varying structures Theory andapplication to the Imperial Valley California Bull Seismol Soc Am 70 2021ndash2035
Muffler L J P and B R Doe (1968) Composition and mean age of detritus of the Colorado River delta in the Salton Trough southeasternCalifornia J Sediment Petrol 38 384ndash399
Muffler L J P and D E White (1969) Active metamorphism of upper Cenozoic sediments in the Salton Sea geothermal field and theSalton Trough southeastern California Geol Soc Am Bull 80 157ndash182 doi1011300016-7606(1969)80[157AMOUCS]20CO2
Newmark R L P W Kasameyer and L W Younker (1988) Shallow drilling in the Salton Sea region The thermal anomaly J Geophys Res93 13005ndash13023 doi101029JB093iB11p13005
Paillet F L and R H Morin (1988) Analysis of geophysical well logs obtained in the State 2-14 borehole Salton Sea geothermal area Cali-fornia J Geophys Res 93 12981ndash12994 doi101029JB093iB11p12981
Persaud P Y Ma J M Stock J A Hole G S Fuis and L Han (2016) Fault zone characteristics and basin complexity in the southern SaltonTrough California Geology 44(9) 747ndash750 doi101130G380331
Pratt P G (1999) Seismic waveform inversion in the frequency domain part 1 Theory and verification in a physical scale model Geophys-ics 64 888ndash901 doi10119011444597
Robinson P T W A Elders and L J P Muffler (1976) Quaternary volcanism in the Salton Sea geothermal field Imperial Valley CaliforniaGeol Soc Am Bull 87 347ndash360 doi1011300016-7606(1976)87lt 347QVITSSgt20CO2
Rose E J et al (2013) Borehole-explosion and air-gun data acquired in the 2011 Salton Seismic Imaging Project (SSIP) southernCalifornia-Description of the survey US Geol Surv Open File Rep 2013-1172 84 p doi103133ofr20131172
Sass J H S S Priest L E Duda C C Carson J D Hendricks and L C Robison (1988) Thermal regime of the State 2-14 well Salton SeaScientific Drilling Project J Geophys Res 93 12995ndash13004 doi101029JB093iB11p12995
Schmitt A K and J B Hulen (2008) Buried rhyolites within the active high-temperature Salton Sea geothermal system J Volcanol Geo-therm Res 178(4) 708ndash718 doi101016jjvolgeores200809001
Schmitt A K and J A Vazquez (2006) Alteration and remelting of nascent oceanic crust during continental rupture Evidence from zircongeochemistry of rhyolites and xenoliths from the Salton Trough California Earth Planet Sci Lett 252 260ndash274 doi101016jepsl200609041
Shearer C K J J Papike S B Simon and B L Davis (1988) Mineral reactions in altered sediments from the California state 2-14 well Var-iations in the model mineralogy mineral chemistry and bulk composition of the Salton Sea scientific drilling project core J GeophysRes 93 13104ndash13122 doi101029JB093iB11p13104
Smithyman B R and R M Clowes (2012) Waveform tomography of field vibroseis data using an approximate 2D geometry leads toimproved velocity models Geophysics 77 R33ndashR43 doi101190GEO2011-00761
Stock J M and K V Hodges (1989) Pre-Pliocene extension around the gulf of California and the transfer of Baja California to the pacificplate Tectonics 8 99ndash115 doi101029TC008i001p00099
Tarif P A R H Wilkens C H Cheng and F L Paillet (1988) Laboratory studies of the acoustic properties of samples from Salton Sea Sci-entific Drilling Project and their relation to microstructure and field measurements J Geophys Res 93 13057ndash13067
Vernik L and X Liu (1997) Velocity anisotropy in shales A petrophysical study Geophysics 62 521ndash532 doi10119011444162
Geochemistry Geophysics Geosystems 1010022016GC006610
HAN ET AL SEISMIC IMAGING OF META-SEDIMENT 4584
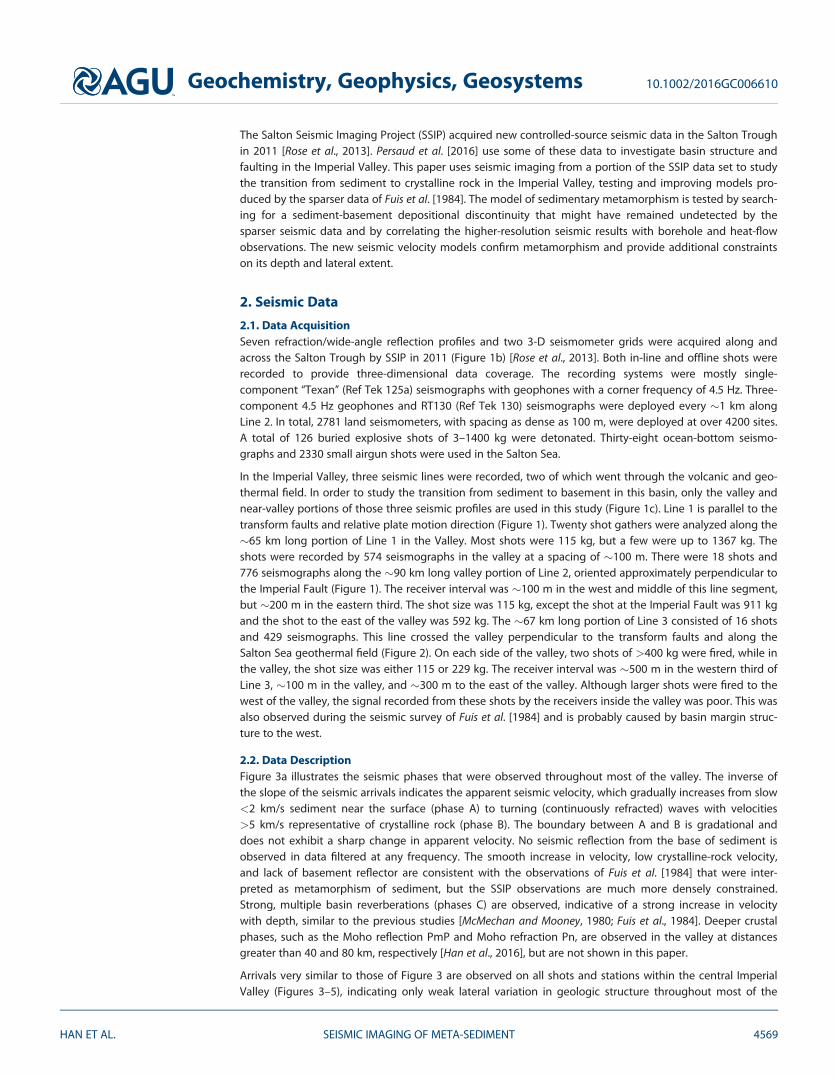
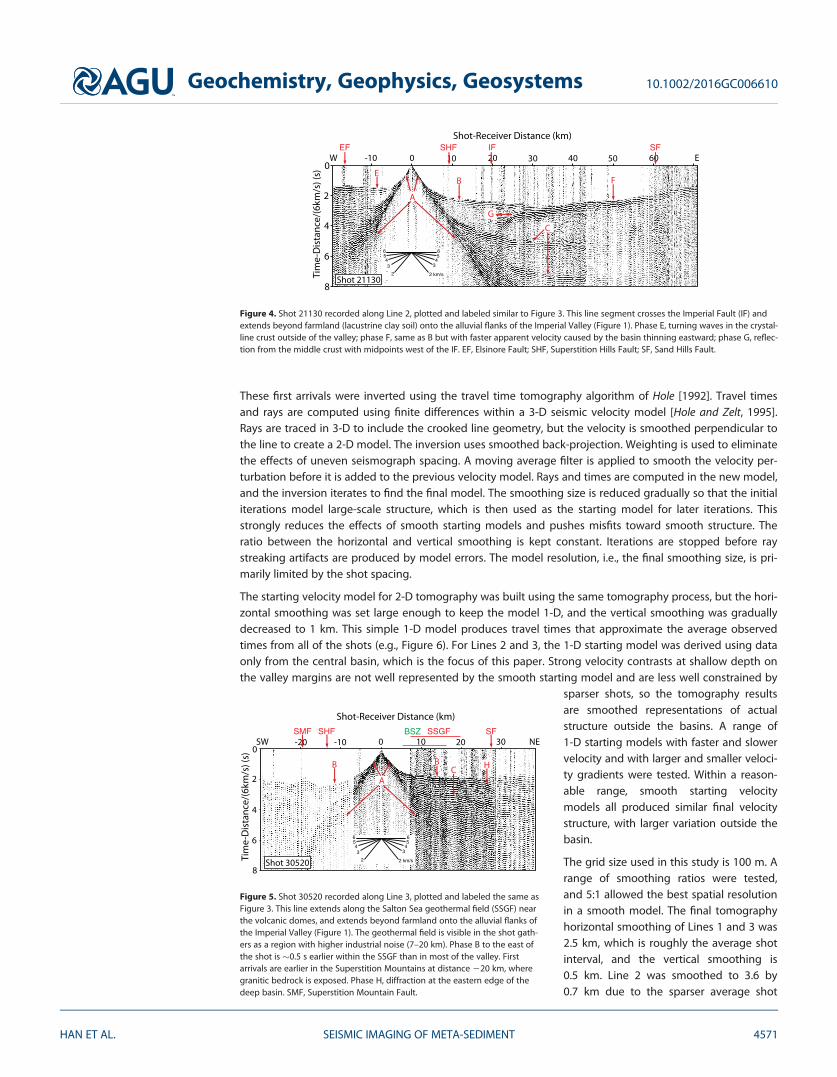
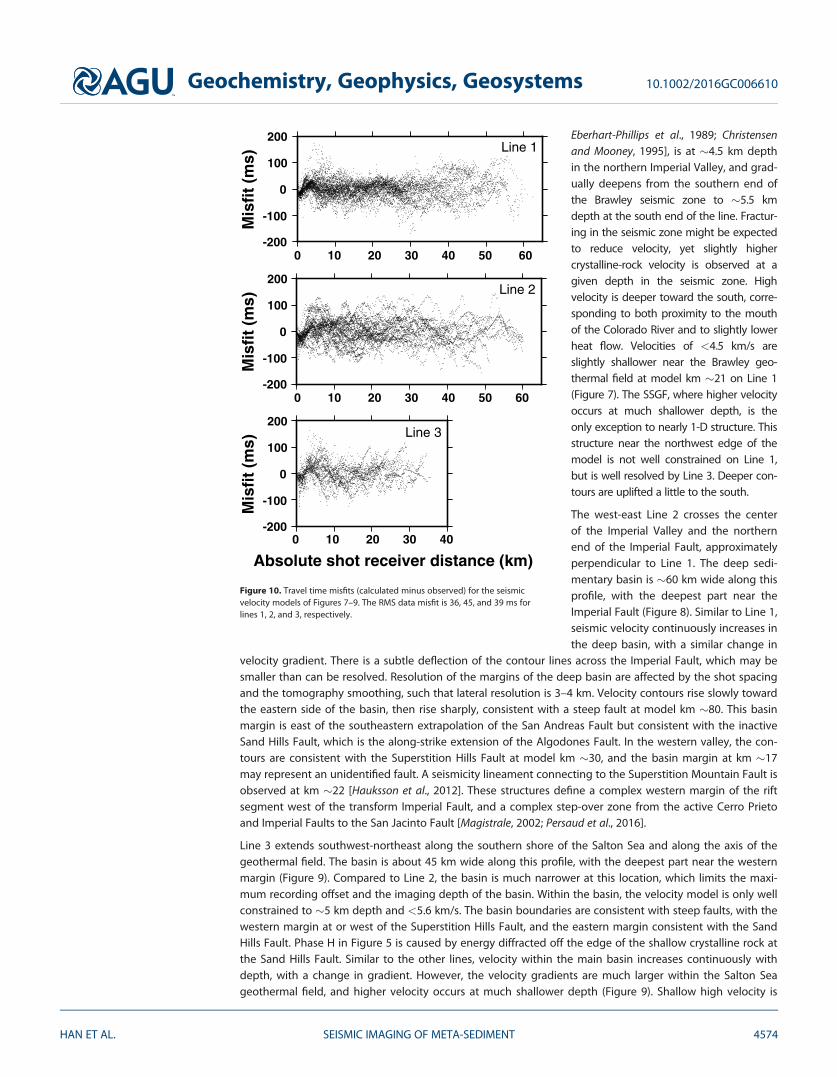
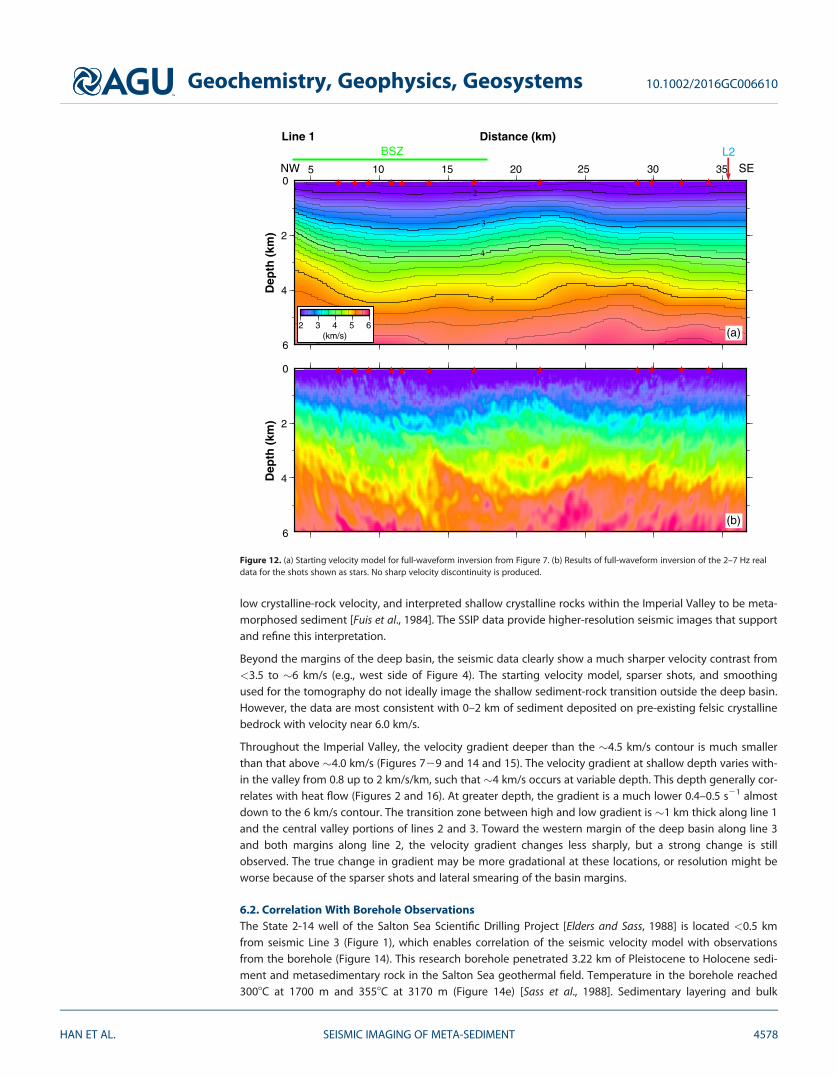
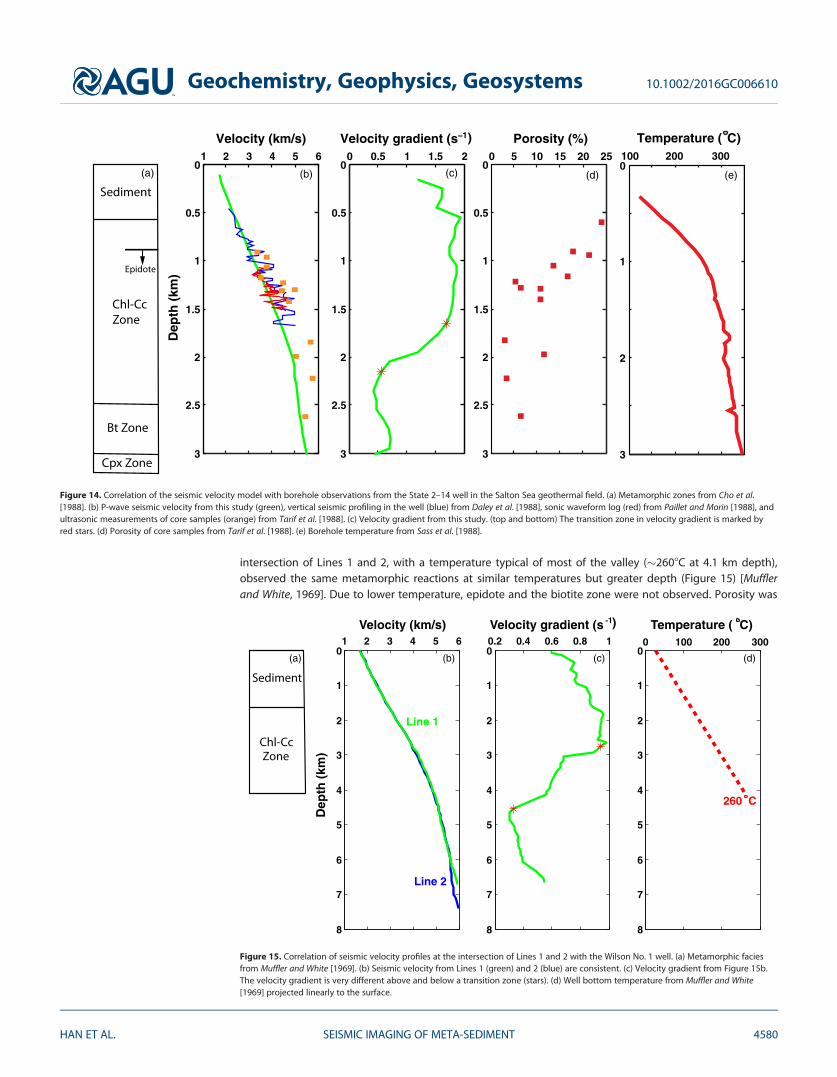
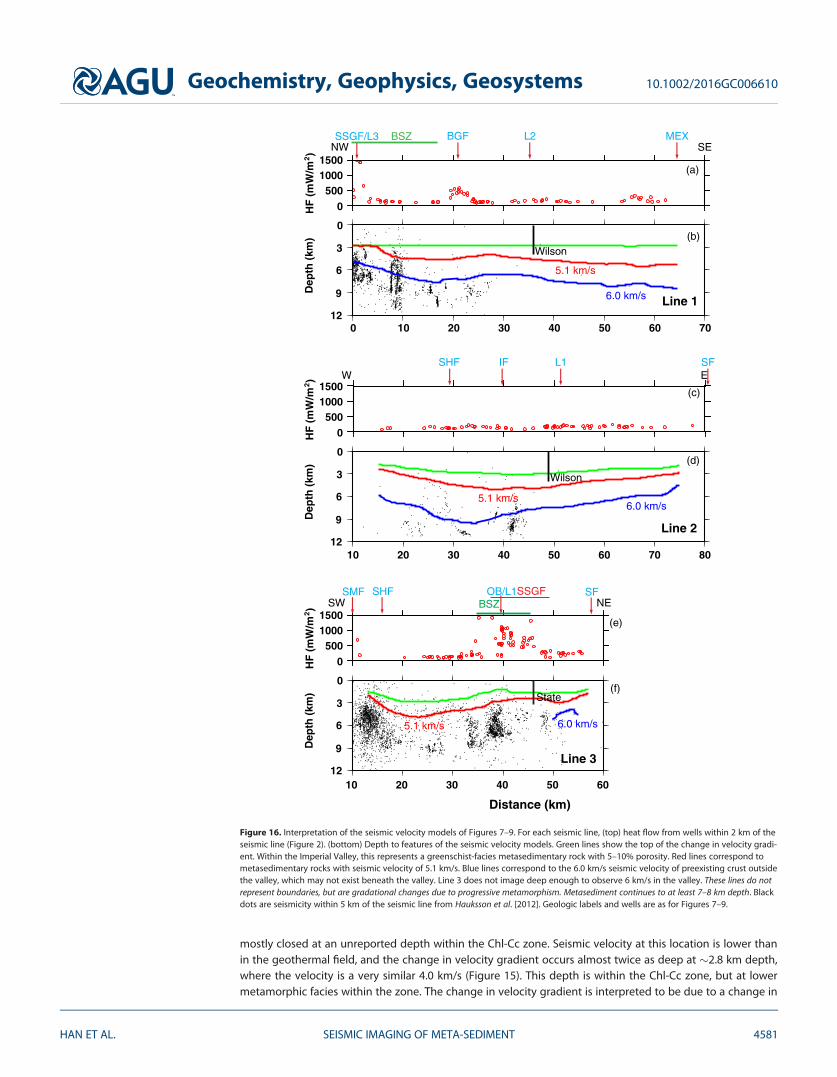