seismic microzonation of mandalay city, myanmar · seismic microzonation of mandalay city, myanmar...
TRANSCRIPT
Journal of Geological Resource and Engineering 6 (2018) 1-13 doi:10.17265/2328-2193/2018.01.001
Seismic Microzonation of Mandalay City, Myanmar
Pyi Soe Thein1,2, Junji Kiyono1, Tun Tun Win2, Than Than Nu2 and Day Wa Aung3
1. Graduate School of Global Environmental Studies, Kyoto University, Kyoto 615-8540, Japan
2. Department of Geology, University of Mandalay, Mandalay 05032, Myanmar
3. Department of Geology, University of Yangon, Yangon 11041, Myanmar
Abstract: Understanding the parameters of PGA (peak ground acceleration) is very important for seismic hazard mitigation and environmental planning in Mandalay City, Myanmar. In this study, fifty SPTs (Standard Penetration Tests) measurement data were collected in Mandalay City, for calculating average shear velocity Vs30, which will be used in seismic microzonation mapping. The shear wave velocity Vs30 of the top layer is Vs30 ≤ 220 m/s. The ground motion characteristic was estimated by means of the predominant periods and linear magnification factors obtained using the multiple reflection analysis. The highest potential zone of seismic hazard mostly locates the north western marginal part of Mandalay city, in the proximal portion to the dextral Sagaing fault. Key words: SPTs, shear wave velocity Vs30, multiple reflection analysis, Sagaing fault.
1. Introduction
Mandalay City is the famous cultural center of
Myanmar and the population is about one million.
There are also greater population, higher urbanization,
more industrialization and many infrastructures.
Actually, the city is located very closed to the most
active dextral Sagaing fault in Myanmar. In the
historical record, several earthquakes happened in and
around Mandalay, Amarapura, Innwa, Sagaing region
from the beginning of the year of 1400. Even a
moderately strong earthquake may cause great loss of
lives and property damage. This research will solve
part of this problem especially for Mandalay City. In
this research, the development of a high resolution
near-surface Mandalay City Vs30 model is presented,
including descriptions of the processing steps applied
to the SPT (standard penetration test) dataset, the
consideration made for the seismic microzonation
mapping of the selected spatial interpolation schemes.
This Vs30 model provides a characterization of the
near-surface shear wave velocity of the Mandalay City
that has useful connotations for site classification. The
Corresponding author: Pyi Soe Thein, Dr., research field: engineering geology. E-mail: [email protected]; [email protected].
seismic microzonation maps are developed by using
the multiple reflection analysis.
2. Regional Geology and Tectonic Setting
Tectonically, Myanmar is located in the eastern part
of the Cenozoic Alpine-Himalayan Orogenic Belt or
the active Alpide Seismic Belt, which extends from the
Mediterranean region eastward through Middle East
and Himalayan Arc (Fig. 1). At the eastern end of
Himalayan Syntaxis, the belt turned sharply to
south-southeasterly direction through Myanmar,
Andaman-Nicobar islands, Sumatra and other
Indonesian islands to the southeast. Plate collision,
active subduction, active volcanism and active
strike-slip movement are currently in progress along
the eastern part, from the Himalayan Arc eastward of
this seismotectonic belt, the southern boundary of
which is the locus of plate convergence between the
India/Australia Plate and the Eurasian Plate. The Indian
Ocean floor is subducting eastward in the Indonesian
region, with the obliquity of suduction increasing
northward along the convergent zone through offshore
west of the Andaman Islands to the west coast of
Myanmar, and extends further on land to the East
Himalayan Syntaxis, generating earthquakes.
D DAVID PUBLISHING

Seismic Microzonation of Mandalay City, Myanmar
2
Fig. 1 Tectonic map of Myanmar [11].
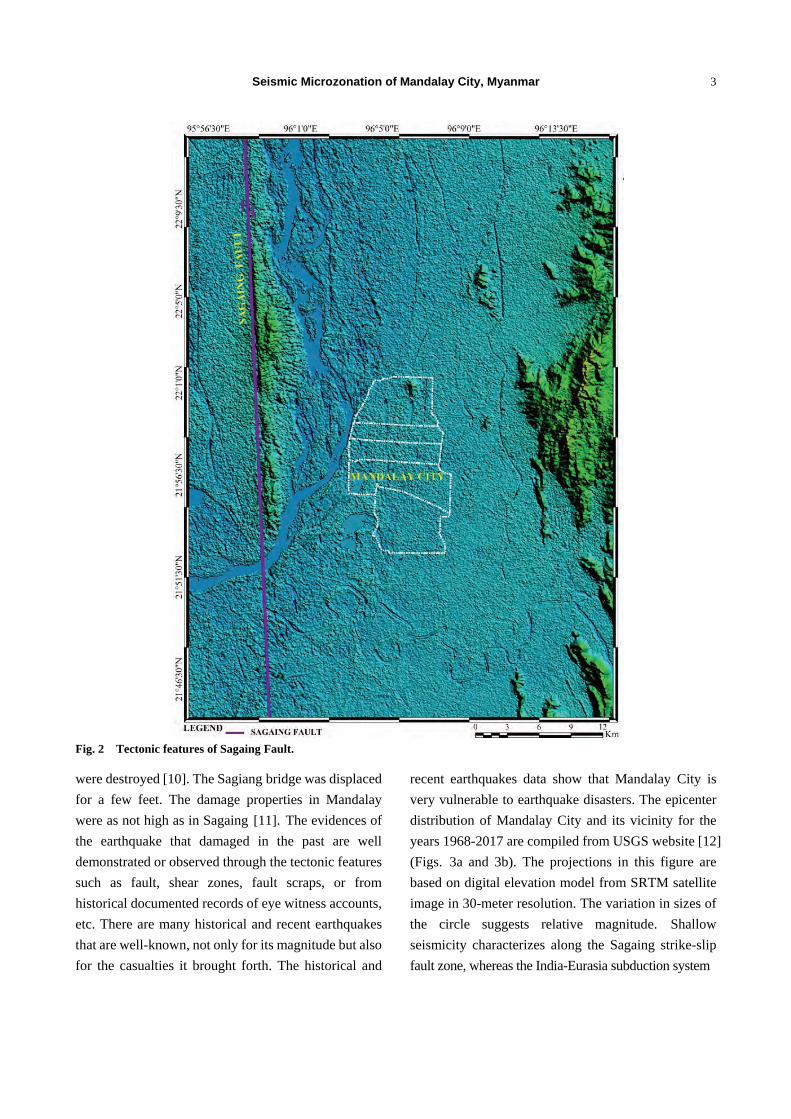
Mandalay City covers the central part of Myanmar,
approximately from latitude 21°51′ to 22°1′ N and
longitude 96°3′ to 96°8′ E. It includes the major part of
the boundary between Sagaing fault in the west (8 km
from Mandalay), Shan scarp fault and Kyaukkyan fault
in the east, Shweli and Moemeik faults in the north.
The Sagaing fault is a major strike-slip right-lateral
continental fault that extends over 1,200 km and
connects to the Andaman spreading center at its
southern termination (Fig. 2). This fault was noticed
early by Refs. [1-3] and later confirmed by several
authors [4-9]. Moreover, some active faults also
occurred in Myanmar, e.g. Sagaing dextral fault,
Kyaukkyan fault, Kyaukme fault, Momeik fault, Shan
scarp fault, Kabaw fault, Nama fault and Gwegyo fault,
etc. Among them, Sagaing is the most active fault and
several high magnitude earthquakes have been
originated from this fault.
3. Seismological Setting
The seismicity of the Myanmar is associated with the
activity along the Alpide Seismic Belt, which is one of
the most active seismogenic regions in the world. The
largest historic event in the Mandalay area i.e. March
23, 1839 Innwa earthquake and July 16, 1956 Sagaing
earthquake must have originated from huge sagaing
strike-slip fault. Innwa earthquake affected cities
comprise Innwa, Amarapura and Mandalay. The total
death tolls are about three to four hundred in Innwa and
Mandalay and the earthquake magnitude was also
estimated as Mercalli scale IX. In the banks of
Ayeyarwady River between Amarapura and Innwa and
in Mandalay, several chasms of from five to twenty feet
in width were resulted, from which large quantities of
water and sand were ejected, representing the liquefaction
characteristics [10]. Sagaing earthquake caused 40 to
50 death tolls and several buildings including pagodas
Seismic Microzonation of Mandalay City, Myanmar
3
Fig. 2 Tectonic features of Sagaing Fault.
were destroyed [10]. The Sagiang bridge was displaced
for a few feet. The damage properties in Mandalay
were as not high as in Sagaing [11]. The evidences of
the earthquake that damaged in the past are well
demonstrated or observed through the tectonic features
such as fault, shear zones, fault scraps, or from
historical documented records of eye witness accounts,
etc. There are many historical and recent earthquakes
that are well-known, not only for its magnitude but also
for the casualties it brought forth. The historical and
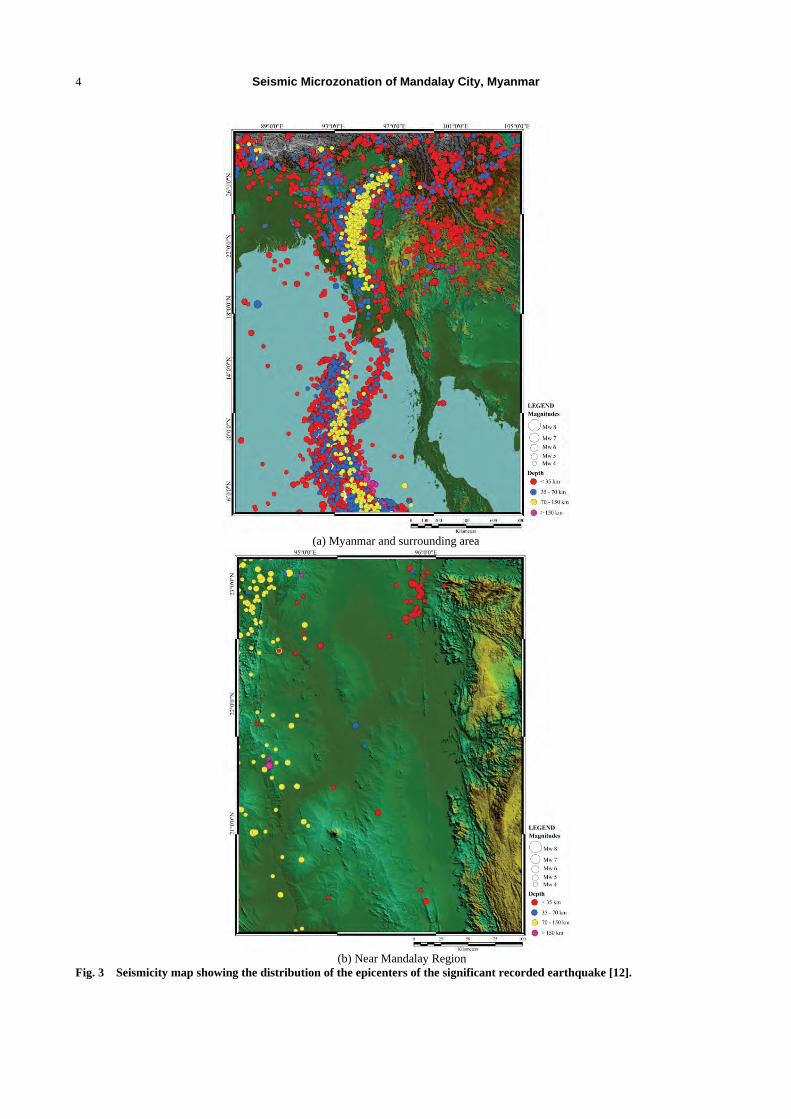
recent earthquakes data show that Mandalay City is
very vulnerable to earthquake disasters. The epicenter
distribution of Mandalay City and its vicinity for the
years 1968-2017 are compiled from USGS website [12]
(Figs. 3a and 3b). The projections in this figure are
based on digital elevation model from SRTM satellite
image in 30-meter resolution. The variation in sizes of
the circle suggests relative magnitude. Shallow
seismicity characterizes along the Sagaing strike-slip
fault zone, whereas the India-Eurasia subduction system
Seismic Microzonation of Mandalay City, Myanmar
4
(a) Myanmar and surrounding area
(b) Near Mandalay Region
Fig. 3 Seismicity map showing the distribution of the epicenters of the significant recorded earthquake [12].

Seismic Microzonation of Mandalay City, Myanmar
5
in the west and Sunda subduction system in the South
of Myanmar exhibit high and intermediate-depth
seismicity.
4. SPT Dataset and Vs30 Model
Fifty borehole data were collected to evaluate the
subsurface profiles and related geotechnical parameters
for seismic microzonation analyses. The detailed
drilling program had been carried out for subsurface
investigation in Mandalay City. Fifty boreholes were
generally drilled up to 30 m (Fig. 4). Due to the
limitation of the boring depth, we assumed that below
the bottom layer (mostly 30 m) is the engineering
bedrock and its shear wave velocity is 400 m/s.
Fig. 4 Satellite image of Mandalay City with 50 borehole sites.
Seismic Microzonation of Mandalay City, Myanmar
6
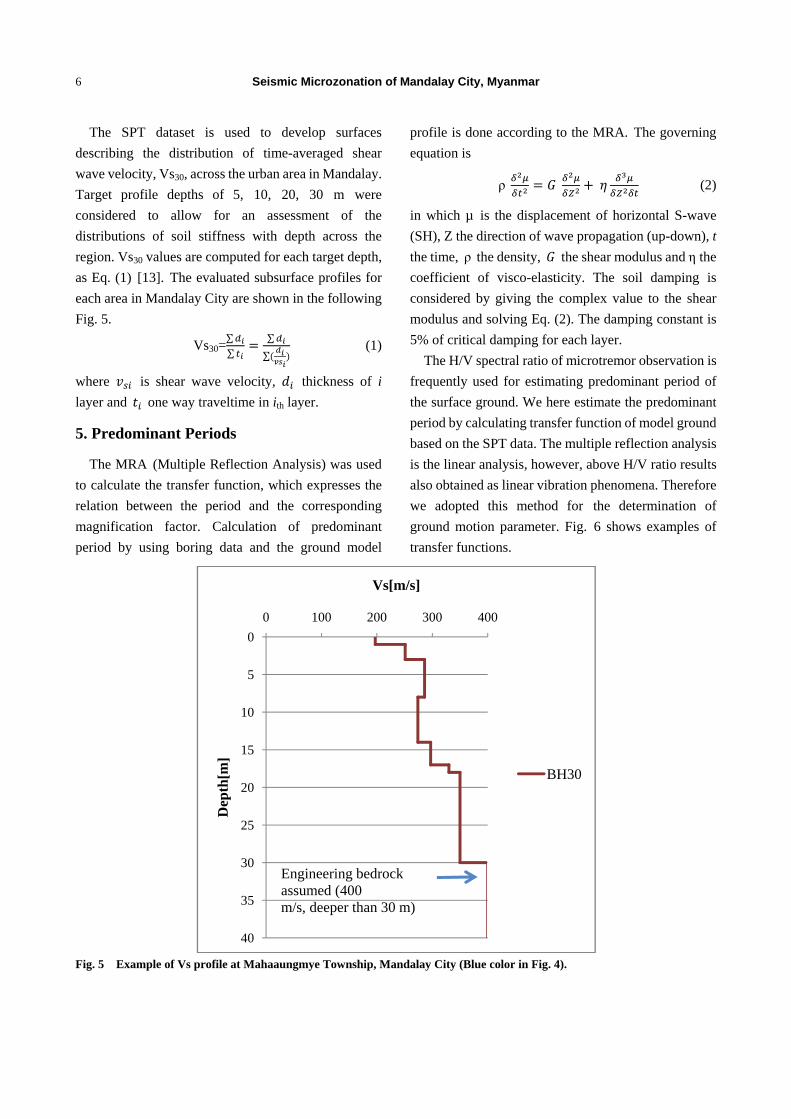
The SPT dataset is used to develop surfaces
describing the distribution of time-averaged shear
wave velocity, Vs30, across the urban area in Mandalay.
Target profile depths of 5, 10, 20, 30 m were
considered to allow for an assessment of the
distributions of soil stiffness with depth across the
region. Vs30 values are computed for each target depth,
as Eq. (1) [13]. The evaluated subsurface profiles for
each area in Mandalay City are shown in the following
Fig. 5.
Vs30=∑
∑
∑
∑ (1)
where is shear wave velocity, thickness of i
layer and one way traveltime in ith layer.
5. Predominant Periods
The MRA (Multiple Reflection Analysis) was used
to calculate the transfer function, which expresses the
relation between the period and the corresponding
magnification factor. Calculation of predominant
period by using boring data and the ground model
profile is done according to the MRA. The governing
equation is
ρ (2)
in which µ is the displacement of horizontal S-wave
(SH), Z the direction of wave propagation (up-down), t
the time, ρ the density, the shear modulus and η the
coefficient of visco-elasticity. The soil damping is
considered by giving the complex value to the shear
modulus and solving Eq. (2). The damping constant is
5% of critical damping for each layer.
The H/V spectral ratio of microtremor observation is
frequently used for estimating predominant period of
the surface ground. We here estimate the predominant
period by calculating transfer function of model ground
based on the SPT data. The multiple reflection analysis
is the linear analysis, however, above H/V ratio results
also obtained as linear vibration phenomena. Therefore
we adopted this method for the determination of
ground motion parameter. Fig. 6 shows examples of
transfer functions.
Fig. 5 Example of Vs profile at Mahaaungmye Township, Mandalay City (Blue color in Fig. 4).
0
5
10
15
20
25
30
35
40
0 100 200 300 400
Dep
th[m
]
Vs[m/s]
BH30
Engineering bedrock assumed (400 m/s, deeper than 30 m)

Seismic Microzonation of Mandalay City, Myanmar
7
Distinct peaks express the characteristics of the
layers for which the shear wave velocity is quite
different. The shorter and longer periods are
corresponding to a shallow and a deep soil layer or hard
and soft soil. Fig. 6 reflects an effect of different soil
characteristics, respectively. Although the predominant
period does not always indicate the characteristics of an
individual layer because typically the actual shaking
mode of the ground is complex, it was assumed that the
long and short periods reflected information from each
layer. Although there are 50 observation points, the
points are not adequate to cover all the target area. If
each value of the predominant period obtained is
considered to be a realization of a stochastic random
field. Space interpolation is conducted by ordinary
Kriging technique [14-16].
The predominant period of a site is a key parameter
which is frequently utilized in site specific earthquake
risk analyses. In the frame work of microzonation
studies the value of predominant period can be
estimated either experimentally or computationally
(analytically or numerically) by utilizing measured
Vs30 profiles. According to Fig. 7, a limited area at
the northern side of the city has lower values of periods
(a) Predominant period appears in a shorter period
(b) Predominant period appears in a longer period
Fig. 6 Example of the predominant periods.
Seismic Microzonation of Mandalay City, Myanmar
8
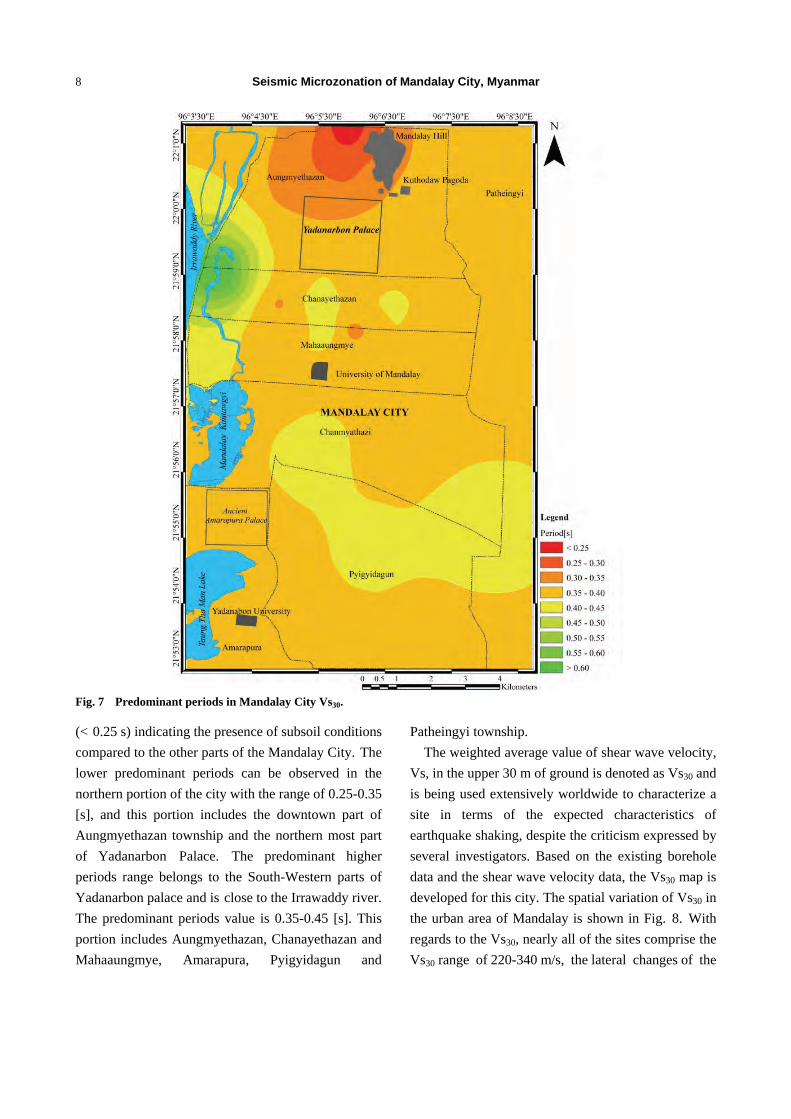
Fig. 7 Predominant periods in Mandalay City Vs30.
(< 0.25 s) indicating the presence of subsoil conditions
compared to the other parts of the Mandalay City. The
lower predominant periods can be observed in the
northern portion of the city with the range of 0.25-0.35
[s], and this portion includes the downtown part of
Aungmyethazan township and the northern most part
of Yadanarbon Palace. The predominant higher
periods range belongs to the South-Western parts of
Yadanarbon palace and is close to the Irrawaddy river.
The predominant periods value is 0.35-0.45 [s]. This
portion includes Aungmyethazan, Chanayethazan and
Mahaaungmye, Amarapura, Pyigyidagun and
Patheingyi township.
The weighted average value of shear wave velocity,
Vs, in the upper 30 m of ground is denoted as Vs30 and
is being used extensively worldwide to characterize a
site in terms of the expected characteristics of
earthquake shaking, despite the criticism expressed by
several investigators. Based on the existing borehole
data and the shear wave velocity data, the Vs30 map is
developed for this city. The spatial variation of Vs30 in
the urban area of Mandalay is shown in Fig. 8. With
regards to the Vs30, nearly all of the sites comprise the
Vs30 range of 220-340 m/s, the lateral changes of the

Seismic Microzonation of Mandalay City, Myanmar
9
Fig. 8 Spatial variation of Vs30 in the Mandalay City.
soil properties, in terms of Vs30 values are in East-West
direction. The minimum Vs30 range, 220-320 m/s,
constitutes in the western part of the city, comprising
Aungmyethazan, Chanayethazan, Mahaaungmye,
Chanmyathazi, Pyigyidagun and Amarapura townships.
The maximum Vs30 values can be observed in the
northeastern part of the city, with the range of 320-340
m/s in Patheingyi township.
6. The Previous Probabilistic Seismic Hazard Model of Myanmar
Seismic microzonation studies are generally
considered as a prerequisite for the site specific risk
analysis to mitigate earthquake losses or damages. The
first relevant applications appeared in Myanmar at
recent years [17-19]. Myo Thant et al. [20] have
recently demonstrated the reliability of a carefully
planned microzonation study in Myanmar by
comparing the areal seismic sources for the subduction
zone of Indian-Australia Plate beneath Eurasia Plate, in
the west of country and for the collision zone of
Indian-Australia Plate and Eurasia Plate, in the
north-west are re-identified and re-characterised in new
model (Fig. 9).
Seismic Microzonation of Mandalay City, Myanmar
10
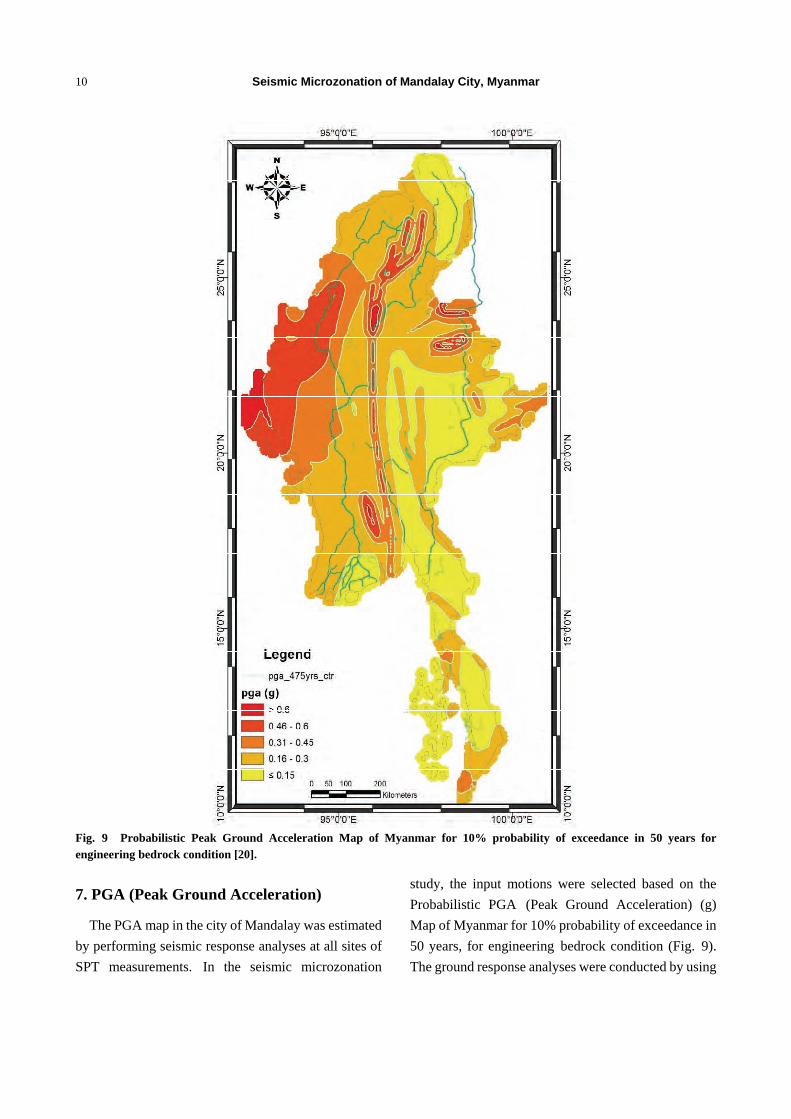
Fig. 9 Probabilistic Peak Ground Acceleration Map of Myanmar for 10% probability of exceedance in 50 years for engineering bedrock condition [20].
7. PGA (Peak Ground Acceleration)
The PGA map in the city of Mandalay was estimated
by performing seismic response analyses at all sites of
SPT measurements. In the seismic microzonation
study, the input motions were selected based on the
Probabilistic PGA (Peak Ground Acceleration) (g)
Map of Myanmar for 10% probability of exceedance in
50 years, for engineering bedrock condition (Fig. 9).
The ground response analyses were conducted by using
Seismic Microzonation of Mandalay City, Myanmar
11
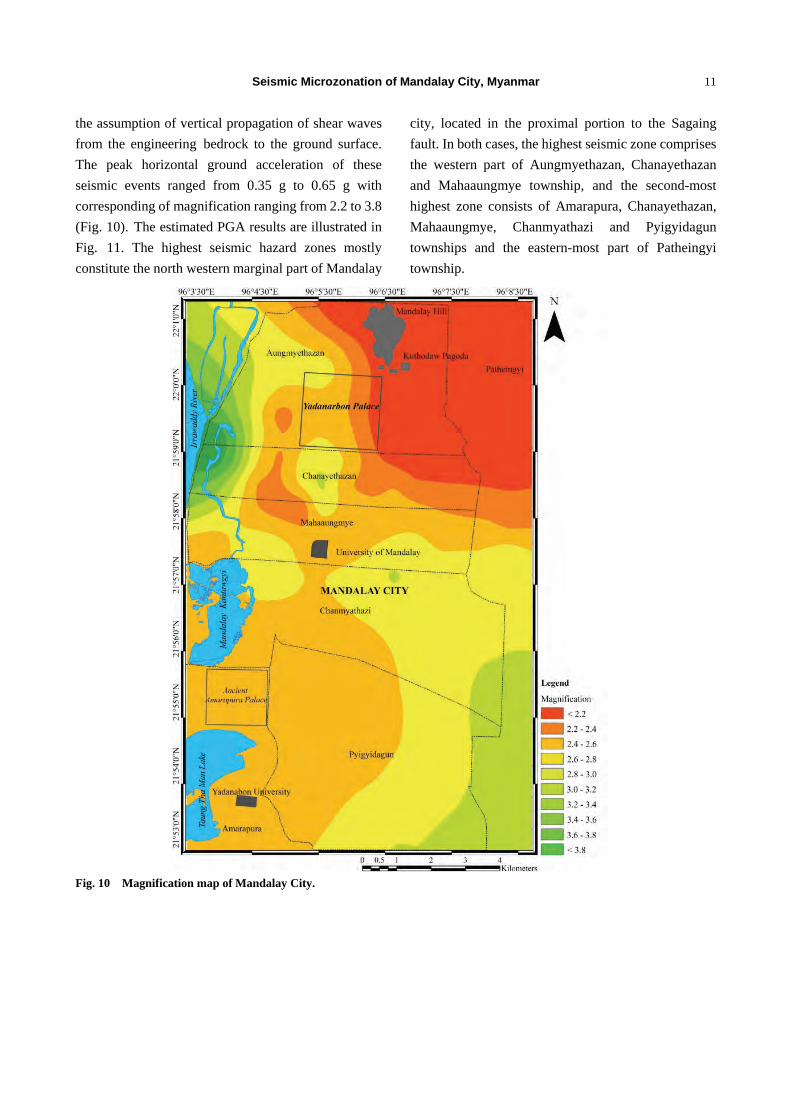
the assumption of vertical propagation of shear waves
from the engineering bedrock to the ground surface.
The peak horizontal ground acceleration of these
seismic events ranged from 0.35 g to 0.65 g with
corresponding of magnification ranging from 2.2 to 3.8
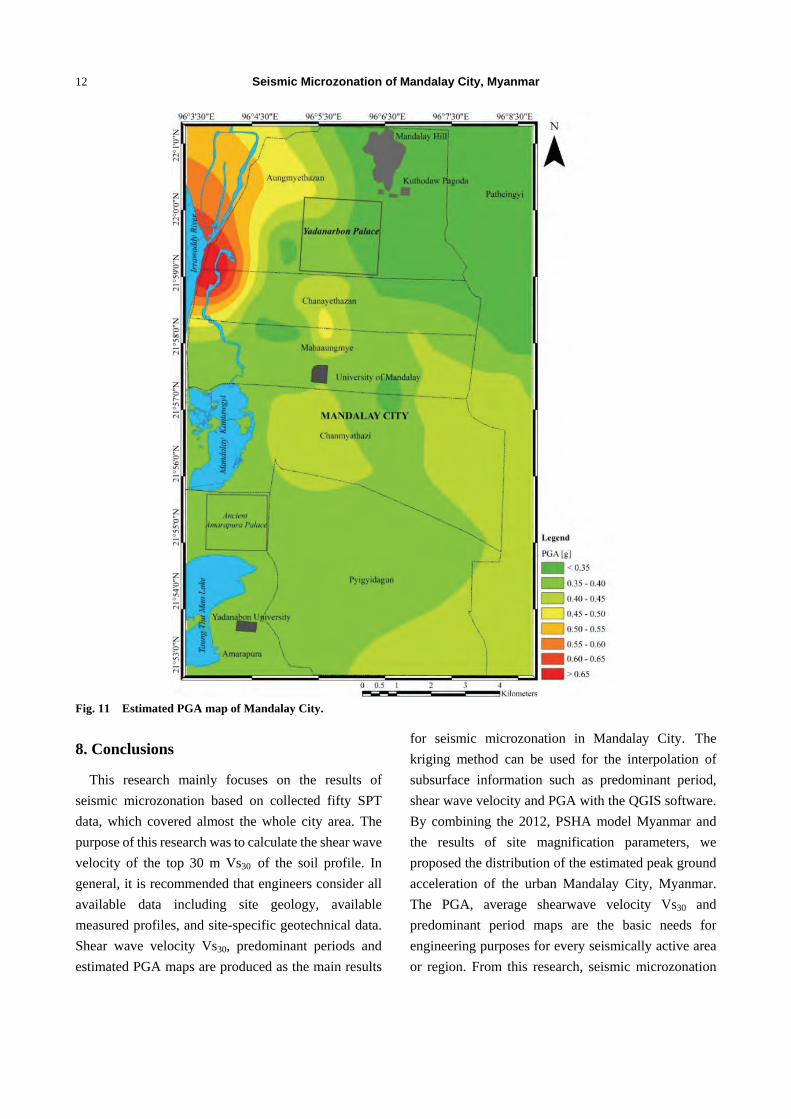
(Fig. 10). The estimated PGA results are illustrated in
Fig. 11. The highest seismic hazard zones mostly
constitute the north western marginal part of Mandalay
city, located in the proximal portion to the Sagaing
fault. In both cases, the highest seismic zone comprises
the western part of Aungmyethazan, Chanayethazan
and Mahaaungmye township, and the second-most
highest zone consists of Amarapura, Chanayethazan,
Mahaaungmye, Chanmyathazi and Pyigyidagun
townships and the eastern-most part of Patheingyi
township.
Fig. 10 Magnification map of Mandalay City.
Seismic Microzonation of Mandalay City, Myanmar
12
Fig. 11 Estimated PGA map of Mandalay City.
8. Conclusions
This research mainly focuses on the results of
seismic microzonation based on collected fifty SPT
data, which covered almost the whole city area. The
purpose of this research was to calculate the shear wave
velocity of the top 30 m Vs30 of the soil profile. In
general, it is recommended that engineers consider all
available data including site geology, available
measured profiles, and site-specific geotechnical data.
Shear wave velocity Vs30, predominant periods and
estimated PGA maps are produced as the main results
for seismic microzonation in Mandalay City. The
kriging method can be used for the interpolation of
subsurface information such as predominant period,
shear wave velocity and PGA with the QGIS software.
By combining the 2012, PSHA model Myanmar and
the results of site magnification parameters, we
proposed the distribution of the estimated peak ground
acceleration of the urban Mandalay City, Myanmar.
The PGA, average shearwave velocity Vs30 and
predominant period maps are the basic needs for
engineering purposes for every seismically active area
or region. From this research, seismic microzonation
Seismic Microzonation of Mandalay City, Myanmar
13
was carried out by means of PGA at Mandalay City.
Because of gradual growth of the population and the
high-rise building, seismic microzonation analysis in
absolutely needed to perform. These results are
enormously required for Mandalay region for
engineering purposes. The outputs of this research
would be very applicable for both engineering purpose
and to identify and mitigate the seismic risk for
Mandalay City, Myanmar.
Acknowledgements
This research project is supported by Ministry of
Education, Myanmar and AUN/SEED-Net, JICA. The
acknowledgement is extended to Dr. Myo Thant in
Monywa University for his empowerment and advices.
Thanks are also dedicated to Dr. Tun Naing, Yangon
Technological University for the help in undertaking
the reference of Mandalay City maps.
References
[1] Noetling, F. 1900. The Miocene of Burma. Edited by
Miller, J., GSA Memoir Deel VII, vol. 2., Amsterdam.
[2] Swe, W. 1981. “A Major Strike Slip Fault in Burma.” In
Contributions to Burmese Geology, pp. 63-72.
[3] Thein, M., Tint, K., and Aung, A. K. 1991. “On the
Lateral Displacement of the Sagaing Fault.” Georeports 1
(1): 23-34.
[4] Currey, J. R., Moore, D. G., Lawver, L. A., Emmel, F. J.,
Raitt, R. W., Henry, M., and Kiekhefer, R. 1979.
“Tectonics of the Andaman Sea and Burma.” Am. Assoc.
Petr. Geol. Mem. 29: 189-98.
[5] Mitchell, A. H. G. 1981. “Phanerozoic Plate Boundaries
in Mainland Southeast Asia, the Himalayas and Tibet.”
Journal of Geological Society London 138: 109-22.
[6] Swe, W. N. W. 2008. “Seismicity and Major Active Faults
of Myanmar.” Journal of the Myanmar Geosciences
Society 1 (1): 1-20.
[7] LeDain, A. Y., Tapponnier, P., and Molnar, P. 1984.
“Active Faulting and Tectonics of Burma and Surrounding
Regions.” Journal of Geophysical Research 89: 453-72.
[8] Maung, H. 1987. “Transcurrent Movements in the
Burma-Andaman Region.” Geology 15: 911-2. [9] Watkinson.,and Tun, S T. 2017. “Segmentation of the
Sagaing Fault.” Myanmar. [10] Chibber, H. L. 1934. The Geology of Burma. London:
Macmilland Com. & Limited, p. 538. [11] Thant, M., Mon, C. T., Tin, T. H., Oo, K. K. K., Aung, L.
T., Kyi, S. S., Kawase, K. S. S., and Aung., D. W. 2013. “Development of Seismic Hazard Maps for Mandalay, Mandalay Region.” Presented at International Conference on Geological Engineering, Yogyakarta, Indonesia.
[12] U.S. Geological Survey. 2017. “Significant Earthquakes of the World 2017.”
[13] Bernard R, W., Jason, T. D., and Thomas, S. 2012. Guidelines for Estimation of Shear Wave Velocity Profiles. Pacific Earthquake Engineering Research Center, PEER Report 2012/08.
[14] Kiyono, J., and Suzuki, M. 1996. “Conditional Simulation
of Stochastic Waves by Using Kalman Filter and Kriging
Techniques.” Presented at the 11th World Conference on
Earthquake Engineering, Acapulco, Mexico.
[15] Noguchi, T., Horio, T., Kubo, M., Ono, Y., Kiyono, J.,
Ikeda, T., and Rusnardi, P. R. 2009. Estimation of
Subsurface Structure in Padang, Indonesia by Using
Microtremor Observation. Report on earthquake disaster
prevention field, Tono Research Institute of Earthquake
Science. (in Japanese)
[16] Thein, P. S., Pramumijoyo, S. S., Brotopuspito, K. S.,
Kiyono, J., Wilopo, W., Furukawa, A., Setianto, A., and
Putra, R. R. 2015. “Estimation of S-Wave Velocity
Structure for Sedimentary Layered Media Using
Microtremor Array Measurements in Palu City, Indonesia.”
In Proceedings of the 5th Sustainable Future for Human
Security (Sustain 2014), Science Direct, Procedia
Environmental Sciences 28: 595-605.
[17] Thein, M., and Swe, T. L. 2006. “Explanatory Account
for Seismic Zone Map of Myanmar.” Myanmar
Earthquake Committee, Myanmar Engineer Society.
[18] Thein, M., Myint, T., Tun, S. T., and Swe, T. L. 2009.
“Earthquake and Tsunami Hazard in Myanmar.” Journal
of Earthquake and Tsunami 3 (2): 43-57.
[19] Naing, T. 2017. The Seismic Zone Map of Mandalay,
Myanmar. Technical Report.
[20] Thant, M., Khaing, S. N., Min, S., Aung, T., Tun, S. T., Kawase, H., Chan, C. H., and Wang, Y. 2012. New Probabilistic Seismic Hazard Models of Myanmar. Seismological Report.