sek 1 bn sek 4 bn sek 657 m x2 -...
TRANSCRIPT

Hoist Kredit AB (publ), Corp. Reg. No. 556329-5699
Acquisitions
SEK 1 bn
EBIT
x2 SEK 148 million
Capital ratio
1.60
Liquidity ratio
57%Carrying value
SEK 4 bn
Gross collections
SEK 657 m
SEK thousand Jan. 1 - Jun. 30, 2013 Jan. 1 - Jun. 30, 2012 Change
Net revenue from owned books* 434,386 246,104 77%Revenue from servicing 50,648 17,628 187%Total operating income 485,033 263,732 84%
EBIT 147,513 72,922 102%EBIT margin 30% 28% 10%
* Including income from performing claims of SEK 46 million (0 in H1 2012) and profit from joint ventures of SEK 15 million (SEK 24 million in H1 2012).
Interim ReportJanuary – June 2013

Hoist Kredit AB (publ) 2
The second quarter continued the trend we
embarked upon in 2012 and Q1 2013, with a high
level of activity in the European non-performing
loans market with both higher volumes and larger
portfolios coming up for sale. In the first half of 2013
Hoist Finance completed acquisitions of approxima-
tely SEK 1 billion, putting us among the top debt
purchasing companies in Europe. We have further
enhanced our positions in our core markets and
pursued a further geographical diversification of our
asset base by growing in our new markets, such as
the UK, Italy and Poland.
The total carrying value of our non-performing
loans portfolios now totals approximately SEK 4
billion, which is a 64 per cent increase over last
twelve months and 17 per cent this year. Our new
markets accounted for approximately 80 per cent of
the growth. The successful acquisition of Robinson
Way Ltd in the UK last year and several landmark
transactions in the first half of 2013 have demonstra-
ted our commitment to growth and long-term
strategies for our established markets, as well as
newly entered markets.
Our active growth strategy has resulted in gross
collections for non-performing portfolios that are
more than 50 per cent up on the first half of 2013,
totalling approximately SEK 657 million. During the
first half of 2013, we have also further focused on
optimising operations in our largest market,
Germany, by finalising the integration of secured
business with the rest of our German operation and
closing down our office in Eschborn. In the first half
of 2013 we doubled our EBIT to SEK 148 million.
During the first half of 2013 we further strengthe-
ned and diversified our capital base through the
issuance of Tier II capital, resulting in a substantial
improvement in our Pillar I capital ratio to 1.60. A
further issue of the Tier II programme will be
launched at the end of August. We have also
improved our liquidity with our well received and
attractive deposit offering under Hoist Spar. Our
current liquidity position thus puts us in a good
position to take part in the growing European
non-performing loan market.
At the beginning of August, 2013 Hoist Finance
completed another major transaction with the
acquisition of the lewis group - a Leeds-based debt
collection agency together with a portfolio of
690,000 accounts with a face value of GBP 1.2bn. The
acquisition of the lewis group will further enhance
our market position, and together with the
successful purchase of Robinson Way represents a
strategically important step into the sizeable and
growing UK market. The lewis group is a good fit for
the strategy and profile of Hoist Finance.
Looking ahead, we can clearly see the market for
non-performing loan portfolios continuing to grow.
We have the financial muscle and skills to take
advantage of and fully leverage future opportunities
in this exciting market.
Jörgen Olsson
Chief Executive Officer

Hoist Kredit AB (publ) 3
Administration Report
Unless otherwise stated, all comparisons of market, financial and
operational data apply to January – June 2012.
Market development and future outlookThe high level of portfolio sales activity in Hoist’s core markets
continued during the first half of 2013 with both, more and larger
portfolios coming on sale. In total, Hoist Finance completed portfolio
acquisitions of approximately SEK 1 billion compared to SEK 308
million in the first half of 2012 with further diversification into and
penetration of recently added geographical segments, such as Poland.
The Group takes an optimistic view of the future with further high
transaction volumes. The extended geographical coverage and the
expansion into new segments of non-performing receivables provide
better opportunities for growth.
Business Gross collections for the Group portfolios totalled SEK 657 million in
the first half of 2013, which is an increase of 51 per cent compared to
the same period in 2012. Net revenue from collections, excluding
revaluation effects, totalled SEK 374 million, which was an increase of
68 per cent or SEK 151 million. The growth in both gross collections and
net revenue relates mainly to the high acquisition activity of receiva-
bles portfolios in particular in the latter part of 2012 and in 2013.
The carrying value of receivables portfolios is SEK 3,966 million,
which is an increase of 64 per cent compared to the end of June last
year. Further expansion into the new markets (Poland, UK and Italy)
accounts for approximately 80 per cent of the asset growth.
The Group’s operating revenue totalled SEK 400 million, which is
an increase of SEK 184 million or 85 per cent. Approximately SEK 46
million of the increase relates to the performing portfolio that was
acquired in mid-2012 as well as the effect of the acquisition of
Robinson Way in November 2012.
Net interest income, which consists of the interest expenses that
relate to the Group’s cost of deposit-taking from the general public
and the interest income from the performing portfolio of consumer
receivables, totalled SEK -34 million (compared to SEK -22 million for
the same period last year). The increase in the interest expense
relates primarily to the substantially higher deposit volumes and the
associated excess liquidity that has been built up to accommodate
expected high acquisition volumes. Both interest income and interest
expenses in the first half of 2012 were higher as a result of a hedging
arrangement involving interest rate swaps.
Fee and commission income relates to the contingency collection
business. This income increased significantly as a result of the
acquisition of Robinson Way Ltd, with contingency collection as its
main area of business.
Operating expenses totalled SEK 333 million, which was an
increase of SEK 132 million or 66 per cent compared to the correspon-
ding period of 2012. The increase in expenses relates to the
expansion that took place in 2012, including the acquisition of
Robinson Way Ltd, as well as the initial costs associated with newly
acquired portfolios. During the first half of 2013, the Group has
further strengthened its central functions, including legal, compli-
ance and risk. Moreover, the operating expenses for the period
include non-recurring costs of approximately SEK 10 million related
to the integration of the secured operations in Germany, involving
closure of the Eschborn office and transfer of operations to Duisburg.
The depreciation of tangible and intangible fixed assets totalled SEK
-8 million, which is in line with the same period last year (SEK -9 million).
The consolidated profit before tax was SEK 74 million (SEK 30 million).
Net profit totalled SEK 48 million (SEK 20 million). The tax expense for
the period amounted to 35 per cent of the profit before tax, the reason
being that some taxable losses are currently not fully possible to offset
within the Group and thus have to be carried forward.
Comprehensive income, including currency translation differences
recorded directly in shareholders’ equity, amounted to SEK 41
million, which is an improvement of approximately 120 per cent from
SEK 19 million.
Capital structureCash and cash equivalents, and interest-bearing securities, totalled
SEK 5,133 million as of June 30, 2013 (SEK 1,860 million), which by far
exceeds Hoist’s internal targets for liquidity reserves for its deposit
operations. Net debt was SEK 3,887 million (SEK 2,757 million) at the
end of the period, resulting in a liquidity ratio of 57 per cent.
Shareholders’ equity totalled SEK 682 million (SEK 529 million).
As of June 30, 2013, the Group funded its operations through
deposits from the general public that are covered by the state deposit
insurance scheme (Insättningsgarantin). Hoist attracts a substantial
amount of deposits from the general public due to its competitive
product offering. Deposits from the general public increased by SEK
4,120 million to SEK 8,737 million as of June 30, 2013 (SEK 4,617 million).
During the first half of 2013 Hoist attracted Tier I and Tier II capital
to further strengthen and diversify its capital base and facilitate
further growth.
Subsequent eventsAt the beginning of August 2013, Hoist acquired the lewis group – a
Leeds-based debt collection agency together with its portfolio of
690,000 accounts with a face value of GBP 1.2 billion (approximately
SEK 12 billion). The acquisition of the lewis group will further enhance
Hoist Finance’s market position, and together with the successful
purchase of Robinson Way represents strategically important steps
into the sizeable and growing UK market.

Hoist Kredit AB (publ) 4
Accounting Policies
Applied accounting policiesThis Interim Report has been prepared in accordance with
IAS 34, Interim Reporting. The consolidated accounts have
been prepared in accordance with International Financial
Reporting Standards (IFRS) as approved by the European
Union and the Swedish Annual Accounts Act for Credit
Institutions and Securities Companies (ÅRKL) as well as the
Finansinspektionen (Swedish Financial Supervisory
Authority) regulations and general recommendations on
annual reports for credit institutions and securities
companies, FFFS 2008:25. The Parent Company adopts the
same accounting policies as the Group taking into account
the limitations under ÅRKL and FFFS 2008:25. The accoun-
ting policies and calculation methods are unchanged
compared to the annual report for 2012.

Hoist Kredit AB (publ) 5
Financial Statements
CoNSolIdAtEd INCoME StAtEMENt
SEK thousand Note Jan. 1-Jun. 30, 2013 Jan. 1-Jun. 30, 2012
Income receivables portfolios 1 373,741 222,331Interest income 86,066 68,809Interest expense -119,868 -91,089Fee and commission income 50,648 17,628Fee and commission expense -42,752 -7,831Net income from financial transactions 6,168 -20,543Other income 45,848 26,556total operating income 399,851 215,861
General and administrative expenses -332,720 -200,403Depreciation and amortisation of tangible and intangible assets -7,898 -9,132total operating expenses -340,618 -209,535
Profit from shares and participations in joint ventures 2 15,081 23,773Profit before income tax 74,314 30,099
Income tax expense -26,251 -9,661Net profit for the period 48,063 20,438
CoNSolIdAtEd StAtEMENt oF CoMPREHENSIvE INCoME
SEK thousand Jan. 1-Jun. 30, 2013 Jan. 1-Jun. 30, 2012
Net profit for the period 48,063 20,438Other comprehensive incomeCurrency translation differences -7,177 -1,886
Other comprehensive income for the period,net of tax -7,177 -1,886Total comprehensive income for the period 40,886 18,552
Attributable toOwners of the Parent Company 40,886 18,552
Hoist Kredit AB (publ) 6
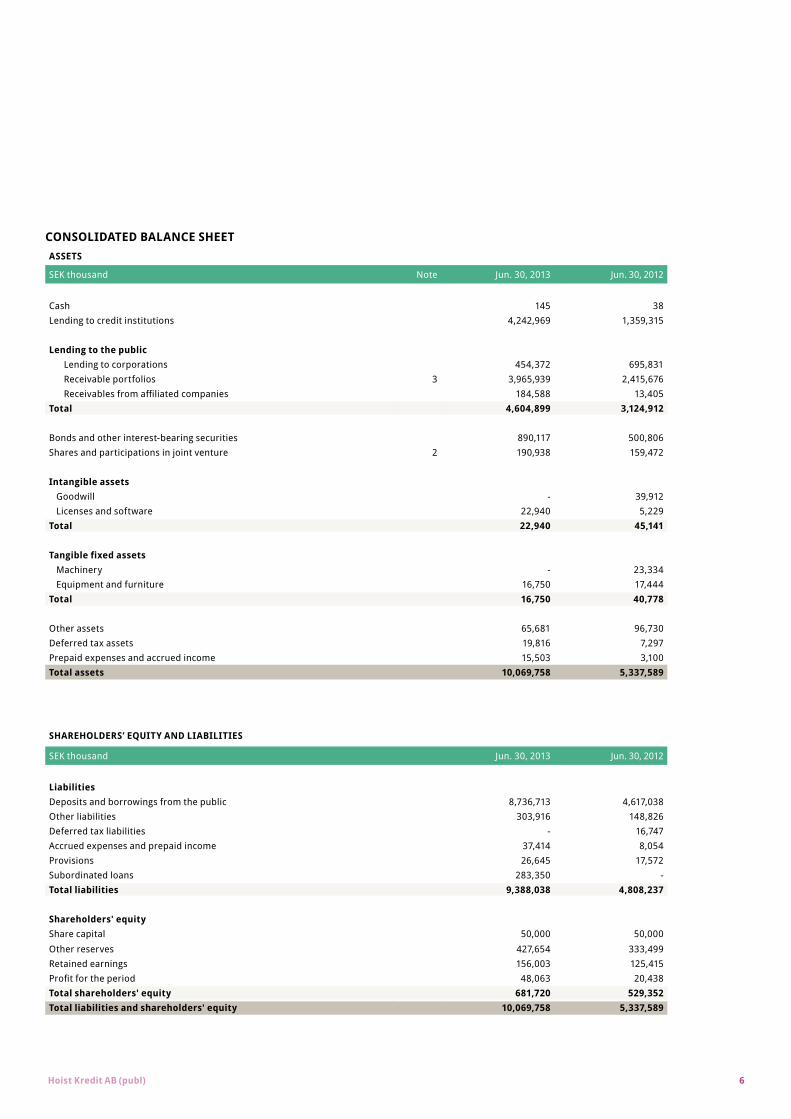
CoNSolIdAtEd BAlANCE SHEEtASSEtS
SEK thousand Note Jun. 30, 2013 Jun. 30, 2012
Cash 145 38Lending to credit institutions 4,242,969 1,359,315
Lending to the public Lending to corporations 454,372 695,831 Receivable portfolios 3 3,965,939 2,415,676 Receivables from affiliated companies 184,588 13,405
total 4,604,899 3,124,912
Bonds and other interest-bearing securities 890,117 500,806Shares and participations in joint venture 2 190,938 159,472
Intangible assets Goodwill - 39,912 Licenses and software 22,940 5,229total 22,940 45,141
Tangible fixed assets Machinery - 23,334 Equipment and furniture 16,750 17,444total 16,750 40,778
Other assets 65,681 96,730Deferred tax assets 19,816 7,297Prepaid expenses and accrued income 15,503 3,100total assets 10,069,758 5,337,589
SHAREHoldERS’ EQUItY ANd lIABIlItIES
SEK thousand Jun. 30, 2013 Jun. 30, 2012
liabilitiesDeposits and borrowings from the public 8,736,713 4,617,038Other liabilities 303,916 148,826Deferred tax liabilities - 16,747Accrued expenses and prepaid income 37,414 8,054Provisions 26,645 17,572Subordinated loans 283,350 -total liabilities 9,388,038 4,808,237 Shareholders' equityShare capital 50,000 50,000Other reserves 427,654 333,499Retained earnings 156,003 125,415Profit for the period 48,063 20,438Total shareholders' equity 681,720 529,352Total liabilities and shareholders' equity 10,069,758 5,337,589

Hoist Kredit AB (publ) 7
StAtEMENt oF CHANgES IN SHAREHoldERS’ EQUItY, gRoUP
SEK thousand Share capital Other reservesRetained earnings
Profit for the period
Total share-holders’ equity
Balance as of Jan. 1, 2012 50,000 335,385 125,415 510,800
Total comprehensive income for the periodNet profit for the period 20,438 20,438Currency translation differences -1,886 -1,886Total comprehensive income for the period -1,886 20,438 18,552Balance as of Jun. 30, 2012 50,000 333,499 125,415 20,438 529,352
SEK thousand Share capital Other reservesRetained earnings
Profit for the period
Total share-holders’ equity
Balance as of Jan. 1, 2013 50,000 434,831 156,003 640,835
Total comprehensive income for the periodNet profit for the period 48,063 48,063Currency translation differences -7,177 -7,177Total comprehensive income for the period -7,177 48,063 40,886Balance as of Jun. 30, 2013 50,000 427,654 156,003 48,063 681,720

Hoist Kredit AB (publ) 8
CoNSolIdAtEd CASH Flow StAtEMENtSEK thousand Jan. 1-Jun. 30, 2013 Jan. 1-Jun. 30, 2012
oPERAtINg ACtIvItIESCash flow from collections on receivables portfolios 657,029 434,578Interest income 86,066 68,809Fee and commission income 50,648 17,628Other received payments 44,922 26,556Interest expense -119,868 -91,089Fee and commission expenses -42,752 -7,831Administration expenses -332,720 -200,403Other operating income 5,823 -7,023Cash flow from net financial transactions 6,168 -20,543Income tax paid -18,453 -890total 336,863 219,792 Increase/decrease in receivables portfolios net of revaluations -885,320 -264,534Increase/decrease in lending to general public 100,173 -559,059Increase/decrease in deposits from general public 2,370,457 121,937Increase/decrease in other assets 13,803 -5,940Increase/decrease in other liabilities -45,343 -71,963Changes in other balance sheet items -3,371 3,282total 1,550,399 -776,277 Cash flow from operating activities 1,887,262 -556,485 INvEStINg ACtIvItIESInvestments in intangible fixed assets -8,575 -1,000Investments in tangible fixed assets -1,136 -1,629Investments in securities -157,445 -1,338Investments in affiliated companies -12,889 -14,906Withdrawal from affiliated companies -93 -Divestments of affiliated companies 10,240 3,948Cash flow from investing activities -169,898 -14,925 FINANCINg ACtIvItIESIssued bonds 283,350 -Cash flow from financing activities 283,350 -
Cash flow for the period 2,000,714 -571,410Cash at the beginning of the period 2,242,400 1,930,763Cash at the end of the period 4,243,114 1,359,353

Hoist Kredit AB (publ) 9
PARENt CoMPANY INCoME StAtEMENtSEK thousand Note Jan. 1-Jun. 30, 2013 Jan. 1-Jun. 30, 2012
Income receivables portfolios 1 188,172 95,897Interest income 109,548 80,436Interest expense -120,996 -90,430Fee and commission expense -13,108 -4,483Net income from financial transactions 9,617 -18,226Other income 8,284 5,090total operating income 181,517 68,284
General and administrative expenses -96,130 -46,640Depreciation and amortisation of tangible and intangible assets -1,158 -4,753total operating expenses -97,288 -51,393
Profit from shares and participations in joint ventures 2 -93 115Periodic fund -24,246 -Profit before income tax 59,890 17,006
Income tax expense -15,064 976Net profit for the period 44,826 17,982
PARENt CoMPANY StAtEMENt oF CoMPREHENSIvE INCoMESEK thousand Jan. 1-Jun. 30, 2013 Jan. 1-Jun. 30, 2012
Net profit for the period 44,826 17,982
Other comprehensive incomeCurrency translation differences 113 -113Other comprehensive income for the period, net of tax 113 -113Total comprehensive income for the period 44,939 17,869
Attributable to Owners of the Parent Company 44,939 17,869

Hoist Kredit AB (publ) 10
PARENt CoMPANY BAlANCE SHEEtASSEtS
SEK thousand Note Jun. 30, 2013 Jun. 30, 2012
Lending to credit institutions 3,841,435 1,243,051 Lending to the public Lending to corporations 453,859 609,831 Receivables portfolios 3 2,522,446 1,953,344 Receivables from affiliated companies 1,254,822 583,374total 4,231,127 3,146,549 Bonds and other interest-bearing securities 865,117 500,806Shares and participations in subsidiaries 873,638 136,605Shares and participations in joint venture 2 93,140 101,449 Intangible assets Licenses and software 14,444 280total 14,444 280 Tangible fixed assets Equipment and furniture 938 1,053total 938 1,053 Other assets 30,680 75,776Deferred tax assets 321 3,924Prepaid expenses and accrued income 2,275 473total assets 9,953,115 5,209,966
SHAREHoldERS’ EQUItY ANd lIABIlItIES
SEK thousand Jun. 30 2013 Jun. 30 2012
liabilitiesLiabilitiesDeposits and borrowings from the public 8,736,713 4,617,038Other liabilities 303,053 99,851Deferred tax liabilities - 986Accrued expenses and prepaid income 17,588 9,728Provisions 98 -Subordinated loans 283,350 -total liabilities 9,340,802 4,727,603 Untaxed reserves 42,609 - Shareholders' equityShare capital 50,000 50,000Other reserves 445,492 345,586
Retained earnings 29,386 68,795Profit for the period 44,826 17,982Total shareholders' equity 569,704 482,363 Total liabilities and shareholders' equity 9,953,115 5,209,966

Hoist Kredit AB (publ) 11
StAtEMENt oF CHANgES IN SHAREHoldERS’ EQUItY, PARENt CoMPANY
SEK thousand Share capital Other reservesRetained earnings
Profit for the period
Total share-holders’ equity
Balance as of Jan. 1, 2012 50,000 345,586 68,908 464,494
Total comprehensive income for the periodNet profit for the period 17,982 17,982Currency translation differences -113 -113Total comprehensive income for the period -113 17,982 17,869Balance as of Jun. 30, 2012 50,000 345,586 68,795 17,982 482,363
SEK thousand Share capital Other reservesRetained earnings
Profit for the period
Total share-holders’ equity
Balance as of Jan. 1, 2013 50,000 445,379 29,386 524,766
Total comprehensive income for the periodNet profit for the period 44,826 44,826Currency translation differences 113 113Total comprehensive income for the period 113 44,826 44,939Balance as of Jun. 30, 2013 50,000 445,492 29,386 44,826 569,704

Hoist Kredit AB (publ) 12
PARENt CoMPANY CASH Flow StAtEMENt
SEK thousand Jan. 1-Jun. 30, 2013 Jun. 30, 2012
oPERAtINg ACtIvItIESCash flow from collections on receivables portfolios 425,940 289,108Interest income 109,548 80,436Other received payments 8,284 5,090Interest expenses -120,996 -90,430Fee and commission expenses -13,108 -4,483Administration expenses -96,130 -46,640Other operating income 4,029 9,695Cash flow from net financial transactions 9,617 -18,226Income tax paid -14,852 -9,425total 312,332 215,125 Increase/decrease in receivables portfolios net of revaluations -366,853 -252,572Increase/decrease in lending to general public -103,777 -624,821Increase/decrease in deposits from general public 2,370,457 121,937Increase/decrease in other assets -8,240 -12,658Increase/decrease in other liabilities 73,512 -22,584Changes in other balance sheet items 99 -85total 1,965,198 -790,783 Cash flow from operating activities 2,277,530 -575,658 INvEStINg ACtIvItIESInvestments in intangible fixed assets -5,592 -185Investments in tangible fixed assets -97 -Investments in securities -132,445 -1,338Investments in subsidiaries -522,346 -1,021Investments in affiliated companies -12,889 -14,906Withdrawals from affiliated companies -93 115Divestments of affiliated companies 10,240 3,948Cash flow from investing activities -663,222 -13,387 FINANCINg ACtIvItIESIssued bonds 283,350 -Cash flow from financing activities 283,350 -
Cash flow for the period 1,897,658 -589,045Cash at the beginning of the period 1,943,777 1,832,096Cash at the end of the period 3,841,435 1,243,051

Hoist Kredit AB (publ) 13
NotE 1 Income by Geographical Region
The segmentation follows the geographical distribution of income from receivables portfolios:
GROUP PARENT COMPANY
SEK thousand Jan. 1- Jun. 30, 2013 Jan. 1-Jun. 30, 2012 Jan. 1-Jun. 30, 2013 Jan. 1-Jun. 30, 2012
Revenues by countryGermany 182,601 132,401 82,353 47,999France 32,215 40,759 - -Belgium 25,012 11,447 25,011 11,447The Netherlands 12,045 18,177 12,045 18,177Italy 67,312 18,274 67,312 18,274UK 28,928 1,273 - -Poland 25,628 - 1,449 -total revenues 373,741 222,331 188,172 95,897
GROUP PARENT COMPANY
SEK thousand Jan. 1- Jun. 30, 2013 Jan. 1-Jun. 30, 2012 Jan. 1-Jun. 30, 2013 Jan. 1-Jun. 30, 2012
Collection incomeGermany 314,929 270,434 214,681 186,032France 50,255 55,906 - -Belgium 63,879 31,487 63,879 31,487The Netherlands 31,540 47,466 31,540 47,466Italy 114,892 24,123 114,892 24,123UK 69,820 5,162 - -Poland 11,714 - 948 -total collection income 657,029 434,578 425,940 289,108
GROUP PARENT COMPANY
SEK thousand Jan. 1- Jun. 30, 2013 Jan. 1-Jun. 30, 2012 Jan. 1-Jun. 30, 2013 Jan. 1-Jun. 30, 2012
Change in carrying valueGermany -132,328 -138,033 -132,328 -138,033France -18,040 -15,147 - -Belgium -38,867 -20,040 -38,867 -20,040The Netherlands -19,495 -29,289 -19,495 -29,289Italy -47,580 -5,849 -47,580 -5,849UK -40,892 -3,889 - -Poland 13,914 - 502 -Total change in carrying value -283,288 -212,247 -237,768 -193,211
See Note 3 for further information.
Notes

Hoist Kredit AB (publ) 14
NotE 3 Non-performing Receivables Portfolios
This note refers to the receivables portfolios that are wholly-owned and non-performing.
GROUP PARENT COMPANY
SEK thousand Jan. 1-Jun. 30, 2013 Jan. 1-Jun. 30, 2012 Jan. 1-Jun. 30, 2013 Jan. 1-Jun. 30, 2012
Opening balance 3,363,907 2,363,389 2,393,361 1,893,983Acquisitions 1,021,104 307,562 384,370 270,230Disposals -108,953 - - -Translation differences -26,831 -43,028 -17,517 -17,658 RevaluationsBased on opening balance forecast (amortisation) -290,662 -212,247 -237,768 -193,211Based on revised estimates 7,374 - - -Carrying value 3,965,939 2,415,676 2,522,446 1,953,344Revaluation gains and losses recognised in the income statement for portfolios held at the end of the reporting period -283,288 -212,247 -237,768 -193,211
NotE 2 Shares and Participations in Joint VenturesShares and participations in joint ventures relate to Hoist Kredit AB (publ)’s holding in “BEST III” Sec Fund, which is a Polish closed-end fund for the purpose of individual purchases of receivables portfolios. The initial investment was PLN 40 million (SEK 90 million) and the invest-ment is consolidated according to the equity method.
GROUP/PARENT COMPANY
SEK thousand Jan. 1-Jun. 30, 2013 Jan. 1-Jun. 30, 2012
opening balance 180,843 123,869Acquisitions 12,889 14,906Disposals -10,241 -3,948Profit 15,174 23,657FX -7,727 988Closing Balance 190,938 159,472
The profit of the Parent Company totalled SEK -93 thousand. Hence the total profit related to the shares and participations in joint ventures is SEK 15,084 thousand (SEK 15,174 thousand minus 93 thousand).

Hoist Kredit AB (publ) 15
GROUP PARENT COMPANY
SEK thousand Jan. 1-Jun. 30, 2013 Jan. 1-Jun. 30, 2012 Jan. 1-Jun. 30, 2013 Jan. 1-Jun. 30, 2012
Portfolio per countryGermany 1,752,340 1,629,276 1,752,343 1,629,276France 483,934 453,291 - -Belgium 216,021 129,756 216,021 129,756The Netherlands 143,197 131,692 143,198 131,691Italy 344,574 61,571 344,574 61,571UK 332,833 9,040 - -Poland 652,735 1,050 26,005 1,050Austria 40,305 - 40,305 -total carrying value 3,965,939 2,415,676 2,522,446 1,953,344
GROUP
Jan. 1-Jun. 30, 2013 Jan. 1-Jun. 30, 2012
No. of clients 1,730,419 1,457,124No. of claims 1,891,658 1,511,568
MEURPrincipal claim 5,774 6,245Interest and charges 5,051 4,913total claim 10,825 11,158
MSEKPrincipal claim 50,567 54,747Interest and charges 44,235 43,064total claim 94,802 97,811
NotE 4 Related Parties transactionsRelated Parties Transactions

Hoist Kredit AB (publ) 16
NotE 5 Capital Adequacy Assessment
Capital adequacy assessmentThe information in this Note contains such information as is to be
disclosed in accordance with FFFS 2008:25 regarding annual reports
for credit institutions and concerns such information as is specified in
FFFS 2007:5. The information relates to the Hoist International AB
(publ) Financial Group. The Capital Coverage and Large Exposures Act
(2006:1371) and FFFS 2007:1 as amended are used to conclude the
capital demand. The purpose of the rules is to ensure that the Financial
Group is managing its risks and to protect the Group’s depositors. The
regulations state that the capital base is to cover the capital require-
ment including the minimum capital requirement (the capital
requirement for Credit Risk, Market Risk and Operational Risk) and the
capital requirement for all other material risks i.e. Pillar II risks.
Capital planningThe capital structure is planned so that the Group is able to continue
its operations and generate dividends to its shareholders. The
strategies and methods used to obtain this include the management
of risks that affect operations.
The risks are monitored through three separate functions:
Independent audit, Financial control and Compliance/Risk control.
An independent audit of the Group’s instructions and policies is
performed by the Group’s internal auditors according to an audit plan
that has been adopted by the Board of Directors. The outcome is
reported to the Board of Directors on a regular basis. These reports,
together with the financial reporting, allow the Board of Directors to
assess the risk level of the Group and make adjustments if necessary.
Financial control is performed by a separate department for
controlling that acts on the basis of the instructions provided by the
Management with respect to follow-up and reporting of financial
performance. The Group’s systems allow daily assessments of
financial development. In addition, the performance of the
receivables portfolios and the follow-up of the Group’s covenants are
reported to the Group’s lenders on a monthly basis.
In order to evaluate the capital basis and capital requirements, an
own internal capital assessment (ICAAP) is performed. This process
aims at ensuring that the Group identifies, values and manages all
relevant risks that the Group is exposed to in an explicit and correct
manner and the process assesses the internal capital based on this
background. This includes the Group having appropriate governance
and control functions as well as risk management functions. The
ICAAP is performed annually.
The starting point for the ICA is the identification of risks and
assessment discussions with senior management. The method can be
briefly described as (i) identification of the risk that affects the
operations, (ii) assessment of the probability of the risk incident
occurring, (iii) evaluation of policies, routines and other internal
actions taken to manage or eliminate the risk and finally (iv) the effect
on the Group. The assessment is done based on the Pillar I require-
ments, and additional capital is injected if deemed necessary.
An evaluation has been performed concerning the Group’s
opportunities for expansion providing certain capital scenarios. The
ICAAP has been documented and reported to the Financial
Supervisory Authority (Finansinspektionen).

Hoist Kredit AB (publ) 17
The capital situation for the Financial Group can be summarised as follows:
SEK thousand Jun. 30, 2013 Jun. 30, 2012
Total risk-weighted assets 9,925,736 3,143,863
Pillar ICredit Risk (standardised approach) 457,555 251,509
Institutions 82,226 32,418 Households (due) 333,750 69,651 Households (not yet due) 18,194 133,205 Corporations (risk weight 100%) 14,235 10,821 Corporations (risk weight 20%) 384 - Other 8,766 5,414
Operational Risk (basic indicator approach) 77,789 84,581Foreign Exchange Risk 2,405 48,356Capital requirement Pillar I 537,749 384,446
tier I capital 679,401 440,673Capital base 869,601 440,673
Financial group - calculation of capital baseJun. 30, 2013 Jun. 30, 2012
total equity in capital adequacy 657,825 514,260Goodwill - -39,099Intangible fixed assets -49,142 -17,112Deferred tax receivables -22,432 -17,376Tier I capital contribution 93,150 -Tier I capital 679,401 440,673tier II capital 190,200 -Capital base 869,601 440,673
The minimum capital requirement for the Financial Group as of June 30, 2013 was SEK 538 million (SEK 384 million as of June 30, 2012), which
exceeds the capital requirement by a wide margin.
There are no current or foreseen material or legal impediments to the prompt transfer of own funds or repayment of liabilities between the
companies and its subsidiaries.

Hoist Kredit AB (publ) 18
Stockholm, August 23, 2013
Jörgen Olsson Mikael Wirén
Chief Executive Officer Chairman of the Board
Dr Achim Prior Per Eric Skotthag
Member of the Board Member of the Board
Erik Fällström
Member of the Board