selection and gene flow shape genomic islands that control ... · gene flow to lower relative...
TRANSCRIPT

Selection and gene flow shape genomic islands thatcontrol floral guidesHugo Tavaresa,1, Annabel Whibleya, David L. Fieldb,c, Desmond Bradleya, Matthew Couchmana, Lucy Copseya,Joane Elleoueta, Monique Burrusd, Christophe Andalod, Miaomiao Lie,f,g, Qun Lie,f, Yongbiao Xuee,f,g,h,Alexandra B. Rebochoa, Nicolas H. Bartonb,2, and Enrico Coena,2
aDepartment of Cell and Developmental Biology, John Innes Centre, NR4 7UH Norwich NR4 7UH, United Kingdom; bInstitute of Science and TechnologyAustria, 3400 Klosterneuburg, Austria; cDepartment of Botany and Biodiversity Research, Faculty of Life Sciences, University of Vienna, A-1030 Vienna,Austria; dLaboratoire Evolution et Diversité Biologique, UMR 5174 CNRS–Université Paul Sabatier, 31062 Toulouse Cédex 9, France; eState Key Laboratory ofMolecular Developmental Biology, Institute of Genetics and Developmental Biology, Chinese Academy of Sciences, 100101 Beijing, China; fNational Centerfor Plant Gene Research, Chinese Academy of Sciences, 100101 Beijing, China gSchool of Life Sciences, University of Chinese Academy of Sciences, 100190Beijing, China; and hBeijing Institute of Genomics, Chinese Academy of Sciences, 100101 Beijing, China
Edited by Nils Chr. Stenseth, University of Oslo, Oslo, Norway, and approved September 12, 2018 (received for review February 6, 2018)
Genomes of closely-related species or populations often displaylocalized regions of enhanced relative sequence divergence, termedgenomic islands. It has been proposed that these islands arisethrough selective sweeps and/or barriers to gene flow. Here, wegenetically dissect a genomic island that controls flower colorpattern differences between two subspecies of Antirrhinum majus,A.m.striatum and A.m.pseudomajus, and relate it to clinal variationacross a natural hybrid zone. We show that selective sweeps likelyraised relative divergence at two tightly-linked MYB-like transcrip-tion factors, leading to distinct flower patterns in the two subspe-cies. The two patterns provide alternate floral guides and create astrong barrier to gene flow where populations come into contact.This barrier affects the selected flower color genes and tightly-linked loci, but does not extend outside of this domain, allowinggene flow to lower relative divergence for the rest of the chromo-some. Thus, both selective sweeps and barriers to gene flow play arole in shaping genomic islands: sweeps cause elevation in relativedivergence, while heterogeneous gene flow flattens the surround-ing “sea,” making the island of divergence stand out. By showinghow selective sweeps establish alternative adaptive phenotypesthat lead to barriers to gene flow, our study sheds light on possiblemechanisms leading to reproductive isolation and speciation.
hybrid zone | Antirrhinum | genomic island | selective sweep | speciation
Genome scans of closely-related species or populations haverevealed “genomic islands” as peaks of high relative se-
quence divergence (Fst) that stand out against a lower “sea” ofdivergence (1–5). The causes of genomic islands remain unclear, butthey have been suggested to contain key loci involved in local ad-aptation and/or reproductive isolation (6). However, their signifi-cance for speciation with or without gene flow between populationsis a matter of debate (6–9). One hypothesis is that gene flow is un-impeded across most of the genome, reducing between-populationdiversity, except for loci under divergent selection and loci in closephysical linkage to selected loci (8). Another hypothesis is that ge-nomic islands reflect selective sweeps, where specific alleles aredriven to high frequency, thus reducing within-population di-versity (7, 9, 10). These two hypotheses are typically presentedas alternatives, although they are not mutually exclusive: bothbarriers to gene flow and selective sweeps may play a role. Here,we determine how these processes contribute to a genomic islandthat controls floral differences between two subspecies of Antirrhi-num majus: A.m.striatum and A.m.pseudomajus. This system has theadvantage of being genetically tractable and having a hybrid zonethat allows selection and gene flow to be analyzed in nature (11, 12).Antirrhinum has closed flowers that are prised open by polli-
nating bees. A.m.striatum and A.m.pseudomajus exhibit two dif-ferent floral patterns that signpost the bee entry point (Fig. 1 Aand B). A.m.striatum flowers have restricted veins of magentaanthocyanin on upper petals, which contrast against a yellow
aurone background (Fig. 1A). A.m.pseudomajus exhibits a com-plementary pattern, with a patch of yellow at the bee entry pointon lower petals contrasted against magenta (Fig. 1B). Yellowpatterning is controlled by SULF (12). Here we focus on controlof magenta by the ROSEA (ROS) and ELUTA (EL) loci (13–15).The advantage of studying these loci is that they are tightlylinked, allowing variation in intervening regions to provide in-sights into evolutionary forces. A further locus influencing magentapigmentation pattern is VENOSA, which promotes magenta indorsal veins (14). Many natural accessions carry VEN alleles, whilethe cultivated species A. majus used for genetic analysis typicallycarries ven, allowing its effects to be seen in genetic crosses.Flowers homozygous for recessive alleles at all three loci (ros el
ven) have very weak magenta pigmentation (Fig. 1C). Introduc-tion of VEN leads to magenta overlying the veins of dorsal petals(Fig. 1D), whereas introduction of ROS leads to strong magentathroughout the corolla (Fig. 1E). The semidominant EL allelerestricts the magenta conferred by VEN and ROS to lie over thebee entry point (Fig. 1 F and G). The ROS locus contains threeMYB-like transcription factors, ROS1, ROS2, and ROS3, with∼90% protein sequence identity in the MYB domain. So far, onlyROS1 and ROS2 have been functionally characterized, with ROS1exerting the major control on anthocyanin levels and pattern (14).
Significance
Populations often show “islands of divergence” in the genome.Analysis of divergence between subspecies of Antirrhinum thatdiffer in flower color patterns shows that sharp peaks in rela-tive divergence occur at two causal loci. The island is shaped bya combination of gene flow and multiple selective sweeps,showing how divergence and barriers between populationscan arise and be maintained.
Author contributions: H.T., A.W., D.L.F., N.H.B., and E.C. designed research; H.T., A.W., D.L.F.,D.B., M.C., L.C., J.E., and A.B.R. performed research; H.T., A.W., D.L.F., D.B., M.C., L.C., M.B.,C.A., M.L., Q.L., Y.X., and N.H.B. contributed new reagents/analytic tools; H.T., A.W., D.L.F.,M.C., M.L., N.H.B., and E.C. analyzed data; and H.T., A.W., N.H.B., and E.C. wrote the paper.
The authors declare no conflict of interest.
This article is a PNAS Direct Submission.
This open access article is distributed under Creative Commons Attribution-NonCommercial-NoDerivatives License 4.0 (CC BY-NC-ND).
Data deposition: The genomic sequence data reported in this paper are available atEuropean Nucleotide Archive (ENA), https://www.ebi.ac.uk/ena (accession no. ENAPRJEB28287), and the RNAseq data have been deposited in the Gene Expression Omnibus(GEO) database, https://www.ncbi.nlm.nih.gov/geo (accession no. GSE118621).1Present address: Sainsbury Laboratory, University of Cambridge, Cambridge,United Kingdom.
2To whom correspondence may be addressed. Email: [email protected] or [email protected].
This article contains supporting information online at www.pnas.org/lookup/suppl/doi:10.1073/pnas.1801832115/-/DCSupplemental.
Published online October 8, 2018.
11006–11011 | PNAS | October 23, 2018 | vol. 115 | no. 43 www.pnas.org/cgi/doi/10.1073/pnas.1801832115

EL is tightly linked to ROS but has not been previously isolated(11, 14). Selection at ROS has been inferred from analysis of ahybrid zone between A.m.striatum and A.m.pseudomajus: bothmagenta pigmentation and ROS allele frequencies show sharpclines, ∼1 km wide, whereas markers >5 cM from ROS show moreuniform allele frequency distributions (11).Flower color differences between A.m.striatum and A.m.pseudo-
majus are unlikely to be maintained by adaptation to local condi-tions, as there are no clear differences in environment or pollinatorsacross the hybrid zone (16). Rather, hybrids and recombinants maybe selected against because their flower patterns are less effective assignposts for bee entry than the parental patterns (12, 17) andpossibly because bees favor the commonest local phenotype (18–20).This situation is similar to how wing color pattern differences aremaintained in Heliconius butterflies (21–23). Heliconius genes in-teract to generate distinct color patterns, which signal distastefulnessto predators (24). Several patterns can deter Heliconius predators,just as several can highlight Antirrhinum flower entry. Sharp clinesin Heliconius are maintained because hybrid phenotypes are less
effective (23) and because the commonest pattern is fitter (22).Genomic islands are observed at the wing pattern loci and areparticularly striking near hybrid zones (2, 21, 25).Here we combine analysis of pooled DNA sequences and SNP
frequencies from across the hybrid zone between A.m.striatumand A.m.pseudomajus, with genetic and gene expression analysisof parental and recombinant genotypes. We pinpoint the lociresponsible for differences in anthocyanin flower color patternand show that they underlie genomic islands of high Fst. Throughexamination of sequence variation around and between the is-lands, combined with simulations, we show that the islands re-flect multiple selective sweeps, which raise relative divergencelocally. The sweeps create a barrier to gene flow, which leads tothe islands standing out from the genomic sea. Thus, both se-lective sweeps and barriers to gene flow play key roles in thecreation and shaping of genomic islands.
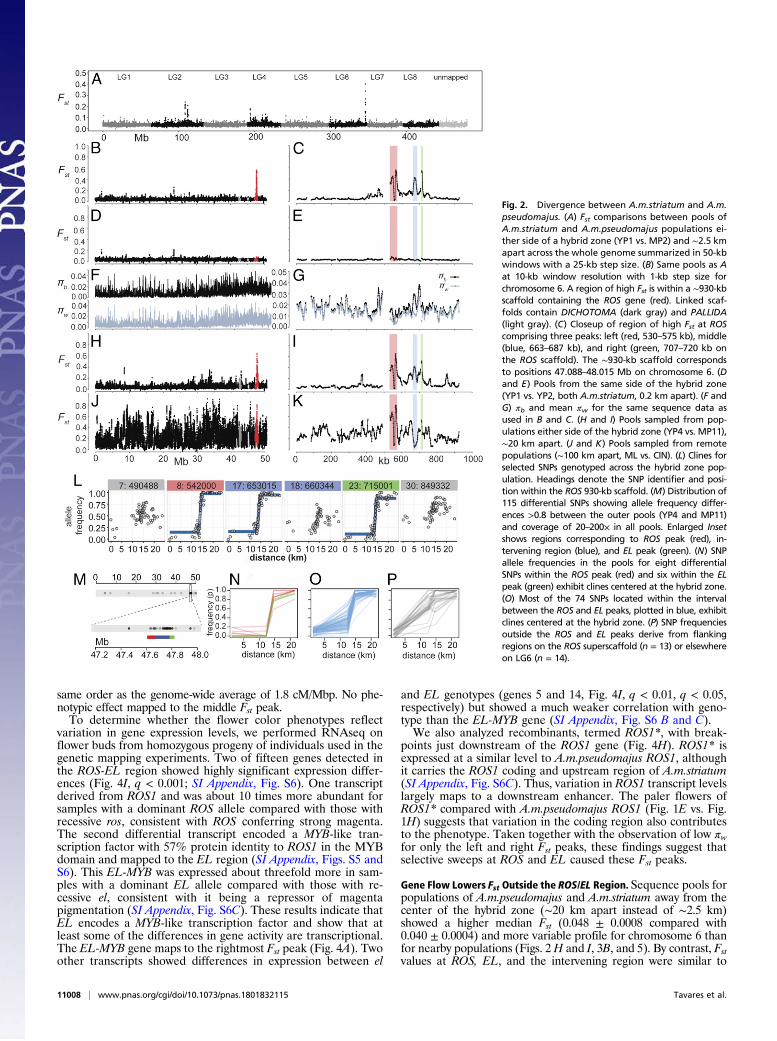
Results and DiscussionPatterns of Differentiation and Diversity. To determine the patternof sequence diversity around the ROS locus, we estimated relativesequence divergence, Fst, between A.m.striatum and A.m.pseudo-majus by sequencing pools of ∼50 individuals sampled from eitherside of the hybrid zone, with the centers of the pools separated by∼2.5 km (SI Appendix, Fig. S1 and Table S1) (26). SNP analysis ofindividuals showed that these pools provided good estimates ofallele frequencies (SI Appendix, Fig. S2). Low Fst was observedthroughout the genome except for regions with elevated Fst onchromosomes 2, 4, and 6 (Fig. 2A). We focused our analysis on thepeak on chromosome 6 as this is where the ROS locus maps (Fig.2B). At a finer scale, three sharp peaks were found in the ROSregion superimposed on a broader region of increased Fst (Fig. 2C).The left peak included ROS1 and ROS2 (ROS3 is in a region oflower Fst). These Fst peaks were not observed between pools fromthe same side of the hybrid zone (Fig. 2 D and E and SI Appendix,Fig. S3). Thus, the Fst peaks in the ROS region represent genomicislands of divergence between A.m.striatum and A.m.pseudomajus.Fst is defined as (πb − πw)/(πb + πw), where πb (also known as
dxy) and πw are the absolute pairwise divergence between andwithin populations, respectively (7). An increase in Fst can thereforebe due to an increase in πb, a decrease in πw, or a combination of thetwo. Plotting πb against πw revealed that for the Fst peak lying over theROS locus (left peak), πw is low, whereas πb is similar to that acrossthe rest of the genome (Fig. 2 F and G; red points, Fig. 3A). TheROS/EL region does not fall in a region of reduced recombination (SIAppendix, Fig. S4), so low recombination cannot explain the observedreduced diversity, unlike in other cases (27). Instead, reduced diversityat ROS is likely due to fixation of one or more favorable mutations(selective sweeps). The right Fst peak, ∼150 kb downstream of ROS,is also primarily due to a decrease in πw (lower green points, Fig.3A). πw is reduced in both populations, for both the left and rightpeaks, implying at least four sweeps (i.e., at two loci for each of thetwo populations). By contrast, the middle peak does not have lowπw but, rather, relatively high πb (light blue points, Fig. 3A). Themiddle peak is absent or reduced in some population comparisons(detailed below), suggesting that selective sweeps were not involvedin generating it. The above results thus indicate that only the leftand right Fst peaks arose through selective sweeps.
Mapping the Causal Loci. To determine whether the regions subjectto selective sweeps had phenotypic effects, we introgressed ros ELfrom A.m.striatum into A. majus (ROS el) and genotyped F2 pop-ulations. Recombinants were backcrossed or self-pollinated to de-termine their homozygous phenotypes (Fig. 4 B–F). Regions causingthe ROS phenotype mapped to the left Fst peak, while the ELphenotype mapped to the middle and/or right Fst peaks. The limitsof ROS and EL were further refined by crossing plants heterozygousfor ros EL (from A.m.striatum) and ROS el (from A.m.pseudomajusor A. majus) to a ros el/ros el line. Screening 10,261 progeny yielded26 ROS EL recombinants, mapping EL to an interval of ∼50 kb(Fig. 4G), below the right Fst peak. The map distance between ROSand EL was 0.5 cM, corresponding to ∼3 cM/Mbp, which is of the
Fig. 1. Genetics of flower color. Flowers of A.m.striatum (A, ross/ross ELs/ELs
sulfs/sulfs) and A.m.pseudomajus (B, ROSp/ROSp elp/elp SULFp/SULFp). Each panelshows face view (Left), inside of dorsal petals (Right), and closeup (Bottom).Arrowheads highlight dorsal (A) and ventral (B) patterns. (C–G) Progeny of crossesbetween plants from the hybrid zone and lines of A. majus, illustrating phenotypeof various allele combinations. All are SULFm/- or SULFp/-. (C) ross/rosd elp/elm ve/vegives a flower with pale magenta color on petal periphery. (D) ross/ross elp/elp
VE/- has flowers with magenta veins because of VE. (E) ROSp/ROSp elp/elp givesstrong magenta throughout the flower due to ROS allele (venosa genotypeunknown). (F) ross/ross ELs/ELs VE/- has vein pigment restricted to a centralregion. (G) ROSp/ROSp ELs/ELs ve/ve giving a restricted pattern of pigmentationcompared with E. (H) ROS*/ROS* elp/elp ve/ve have spread magenta but ofweaker intensity than conferred by ROS (compare with E). Allele superscripts andabbreviations used in figure legend: *, recombinant; d, dorsea (mutant in A.majus background); m, majus; p, A.m.pseudomajus; s, A.m.striatum; X/-,unknown whether homozygous or heterozygous for dominant allele X.
Tavares et al. PNAS | October 23, 2018 | vol. 115 | no. 43 | 11007
EVOLU
TION
same order as the genome-wide average of 1.8 cM/Mbp. No phe-notypic effect mapped to the middle Fst peak.To determine whether the flower color phenotypes reflect
variation in gene expression levels, we performed RNAseq onflower buds from homozygous progeny of individuals used in thegenetic mapping experiments. Two of fifteen genes detected inthe ROS-EL region showed highly significant expression differ-ences (Fig. 4I, q < 0.001; SI Appendix, Fig. S6). One transcriptderived from ROS1 and was about 10 times more abundant forsamples with a dominant ROS allele compared with those withrecessive ros, consistent with ROS conferring strong magenta.The second differential transcript encoded a MYB-like tran-scription factor with 57% protein identity to ROS1 in the MYBdomain and mapped to the EL region (SI Appendix, Figs. S5 andS6). This EL-MYB was expressed about threefold more in sam-ples with a dominant EL allele compared with those with re-cessive el, consistent with it being a repressor of magentapigmentation (SI Appendix, Fig. S6C). These results indicate thatEL encodes a MYB-like transcription factor and show that atleast some of the differences in gene activity are transcriptional.The EL-MYB gene maps to the rightmost Fst peak (Fig. 4A). Twoother transcripts showed differences in expression between el
and EL genotypes (genes 5 and 14, Fig. 4I, q < 0.01, q < 0.05,respectively) but showed a much weaker correlation with geno-type than the EL-MYB gene (SI Appendix, Fig. S6 B and C).We also analyzed recombinants, termed ROS1*, with break-
points just downstream of the ROS1 gene (Fig. 4H). ROS1* isexpressed at a similar level to A.m.pseudomajus ROS1, althoughit carries the ROS1 coding and upstream region of A.m.striatum(SI Appendix, Fig. S6C). Thus, variation in ROS1 transcript levelslargely maps to a downstream enhancer. The paler flowers ofROS1* compared with A.m.pseudomajus ROS1 (Fig. 1E vs. Fig.1H) suggests that variation in the coding region also contributesto the phenotype. Taken together with the observation of low πwfor only the left and right Fst peaks, these findings suggest thatselective sweeps at ROS and EL caused these Fst peaks.
Gene Flow Lowers Fst Outside the ROS/EL Region. Sequence pools forpopulations of A.m.pseudomajus and A.m.striatum away from thecenter of the hybrid zone (∼20 km apart instead of ∼2.5 km)showed a higher median Fst (0.048 ± 0.0008 compared with0.040 ± 0.0004) and more variable profile for chromosome 6 thanfor nearby populations (Figs. 2 H and I, 3B, and 5). By contrast, Fstvalues at ROS, EL, and the intervening region were similar to
Fig. 2. Divergence between A.m.striatum and A.m.pseudomajus. (A) Fst comparisons between pools ofA.m.striatum and A.m.pseudomajus populations ei-ther side of a hybrid zone (YP1 vs. MP2) and ∼2.5 kmapart across the whole genome summarized in 50-kbwindows with a 25-kb step size. (B) Same pools as Aat 10-kb window resolution with 1-kb step size forchromosome 6. A region of high Fst is within a ∼930-kbscaffold containing the ROS gene (red). Linked scaf-folds contain DICHOTOMA (dark gray) and PALLIDA(light gray). (C) Closeup of region of high Fst at ROScomprising three peaks: left (red, 530–575 kb), middle(blue, 663–687 kb), and right (green, 707–720 kb onthe ROS scaffold). The ∼930-kb scaffold correspondsto positions 47.088–48.015 Mb on chromosome 6. (Dand E) Pools from the same side of the hybrid zone(YP1 vs. YP2, both A.m.striatum, 0.2 km apart). (F andG) πb and mean πw for the same sequence data asused in B and C. (H and I) Pools sampled from pop-ulations either side of the hybrid zone (YP4 vs. MP11),∼20 km apart. (J and K) Pools sampled from remotepopulations (∼100 km apart, ML vs. CIN). (L) Clines forselected SNPs genotyped across the hybrid zone pop-ulation. Headings denote the SNP identifier and posi-tion within the ROS 930-kb scaffold. (M) Distribution of115 differential SNPs showing allele frequency differ-ences >0.8 between the outer pools (YP4 and MP11)and coverage of 20–200× in all pools. Enlarged Insetshows regions corresponding to ROS peak (red), in-tervening region (blue), and EL peak (green). (N) SNPallele frequencies in the pools for eight differentialSNPs within the ROS peak (red) and six within the ELpeak (green) exhibit clines centered at the hybrid zone.(O) Most of the 74 SNPs located within the intervalbetween the ROS and EL peaks, plotted in blue, exhibitclines centered at the hybrid zone. (P) SNP frequenciesoutside the ROS and EL peaks derive from flankingregions on the ROS superscaffold (n = 13) or elsewhereon LG6 (n = 14).
11008 | www.pnas.org/cgi/doi/10.1073/pnas.1801832115 Tavares et al.

those for the nearby populations (Figs. 2 H and I and 5). Moreremote populations showed a further increase in Fst for chromo-some 6, with some comparisons yielding numerous Fst peaks, sothat those at ROS and EL no longer stood out (Figs. 2 J and K and5 and SI Appendix, Fig. S3 A and D and Table S9). Such a patternof “isolation by distance” is often seen and indicates that gene flowreduces local divergence. In contrast, Fst is elevated across thewhole ROS/EL region (Fig. 5), as expected from a strong barrierto gene flow generated by selection on ROS and EL (28). Thestatistical significance of these patterns is considered in SI Ap-pendix, Supplementary Text S1.3.A barrier to gene flow is also expected to cause sharp clines at any
loci within it, regardless of whether they are selected. Indeed, weobserve sharp clines at all divergent SNPs within or near the genomicislands, including those that lie outside ROS or EL (Fig. 2L and SIAppendix, Supplementary Text S2 and Fig. S7). Of the ∼6 × 10⁵
biallelic SNPs on chromosome 6, 115 showed frequency differencesgreater than 0.8 between the outer pools (∼20 km apart). Onehundred and one of these differential SNPs were within an ∼0.5 MbpROS/EL region (Fig. 2M and SI Appendix, Fig. S3C), 14 of whichwere within the ROS and EL Fst peaks, 74 were between these peaks,and 13 were in flanking regions. Comparing SNP allele frequenciesin the pools showed that the 14 differential SNPs within the ROS andEL Fst peaks, together with most of the 74 SNPs from the interveningregion, exhibited clines centered at the hybrid zone (Fig. 2 N and O),confirmed and further refined by individual genotyping (Fig. 2L andSI Appendix, Fig. S7). The remaining differential SNPs, including 14that were distributed sparsely along the chromosome (Fig. 2M),mainly showed a frequency change over a geographic region wherethe population density is low (Fig. 2P and SI Appendix, Fig. S7C).The change in frequency for these SNPs likely reflects fluctuationscaused by the reduced gene flow created by the population density gap.These findings support the hypothesis of a selective barrier at
the ROS/EL region. The yellow flower patterning gene SULFexhibits steep SNP clines centered at the same geographical lo-cation as ROS-EL clines (12), supporting the idea that selectionon flower color is the basis of the barrier.Based on the 0.5-cM distance between ROS and EL, recombinants
should be generated at hybrid zones, at a rate of 0.5% per hetero-zygote. Genotyping 2,393 individuals at the hybrid zone, usinghaplotype-specific markers in ROS1 and EL, identified 201recombinant haplotypes, which reached ∼10% frequency at thecenter of the hybrid zone (Fig. 4 J and K). Genotyping and test-crossing of progeny grown from 27 recombinants confirmed that mostgave the expected phenotypes (SI Appendix, Supplementary Text S3).Assuming a neutral model with no selection against recombinants, weestimated a lower bound of ∼85 generations for the age of this hybridzone (SI Appendix, Supplementary Text S4). If the hybrid zone is olderthan this, then selection must have acted to eliminate recombinants. A
A B
Fig. 3. Comparison of within- and between-population divergence in theROS/EL region. Relationship between πb and πw for pools sampled either sideof the hybrid zone, separated by ∼2.5 km (A, YP1 and MP2, corresponding toFig. 2 B and C) or ∼20 km (B, YP4 and MP11, corresponding to Fig. 2 H and I),summarized in 10-kb windows, with a color gradient indicating the re-spective Fst (light colors, low; dark colors, high). The left, middle, and right Fstpeaks indicated in Fig. 2C are shown as red, light blue, and green points,respectively. The dark blue points indicate windows between those Fst peaks.Other windows from around the ROS region are shown in gray.
B
I
| | ||||||| ||| | | | | ||||| | ||| ||| | ||||| | |ROS el
ros EL
ROS el
ROS EL
ROS*
ROS el
ROS EL
ros el
ROS EL
ros el
ros ELros EL
enhancer
ROS1 2 3 EL-MYB
elC
D
E
F
ROS*enhancer
G
H
9
5
1
4
5
4
26
EL vs elROS vs ros
0 1 2 3
Fold change(log2)
***
** *** *
kb
Fst
J K
A
500 600 700 8000.00.20.40.60.8
0 5 10 15 20 25km
hapl
otyp
e fre
quen
cy
1
3.5
6.5 11
.311
.712
.112
.512
.913
.313
.714
.1
2 3 4 5 6 7 8 9 1011 12 13 1415
hapl
otyp
e co
unt
5040
3020100
1.00.80.60.40.20.0
deme centre (km)
Fig. 4. Mapping loci in relation to Fst peaks. (A) Fst profile for pools in Fig. 2B(YP1 vs. MP2) showing location of genes and markers (lines below) used formapping. (B–H) Mapping ROS and EL. Pale red and pale green boxes indicatemapping intervals for ROS and EL, respectively. Parental haplotypes shown aslines in red (A. majus JI7), magenta (A.m.pseudomajus), or yellow (A.m.stria-tum). Recombination to the left and right of the Fst peak gives parentalphenotypes (B and F); recombination 3′ of ROS1 gives pale magenta (C and H);recombination between ROS and EL gives very pale (D) or restricted (E) pat-terns. Numbers of each class recovered shown, Right. (I) Floral bud expressionof 15 genes found in or between the ROS and EL mapping intervals. Signifi-cant differential expression for ROS vs. ros or EL vs. el comparisons at q (falsediscovery rate) < 0.05, q < 0.01, and q < 0.001 is indicated by one, two, orthree asterisks, respectively. Only genes with a mean expression of >5 tran-scripts per million are shown. The sole gene in the region with significantdifferential expression in ROS vs. ros comparisons was ROS1 (q < 5.6e−29).EL-MYB showed the most significant differential expression in the EL vs. elcomparison (q < 2.3e−9) with two further genes (Gene 5, which is outside themapped EL interval) and Gene 14, which is immediately adjacent to EL-MYB)reporting differential expression at lower significance thresholds. (J) Fre-quency of A.m.pseudomajus (magenta), A.m.striatum (yellow), and recombi-nant (turquoise) haplotypes in demes with ≥8 individuals along the hybridzone transect. (K) Barplot showing counts of recombinant haplotypes for alldemes with ≥8 individuals (ross elp in green; ROSp ELs in orange). Deme centerlocations between 11.3 and 14.3 km are at 0.2-km intervals. For details ofgenotyping, see SI Appendix, Supplementary Text S3.
Tavares et al. PNAS | October 23, 2018 | vol. 115 | no. 43 | 11009
EVOLU
TION
note attached to a herbarium specimen of A.m.pseudomajus from1928 (London Natural History Museum) describes extensive colorpolymorphism at the geographic location of the hybrid zone, furthersuggesting that the hybrid zone is at least 90 y old.The barrier to gene flow observed at ROS/EL raises the ques-
tion of whether this alone could be responsible for the Fst peaks.According to this view, the drop in Fst in the intervening region be-tween the peaks would be due to gene flow. However, selection at twolinked loci (ROS and EL) generates a strong barrier to gene flowthroughout the intervening region because two recombination eventsare required to transfer a neutral allele onto the opposite geneticbackground (SI Appendix, Supplementary Text S5 and Figs. S15 andS16). A barrier of this form would therefore not be expected togenerate two separate sharp peaks in Fst, as is observed. Thus, thebarrier to gene flow alone cannot be responsible for the two sharpFst peaks. This argument illustrates the value of having two linkedloci for distinguishing hypotheses. A further advantage of havingtwo linked loci is that it allows a region of elevated Fst to be readilypicked out because the barrier extends over 0.5 cM and >200 kb.Single selected loci would generate a barrier over a narrow region,which would be harder to detect.
The observation that flower color variation under selection derivesfrom two closely-linked loci (ROS and EL) seems to lend support tothe idea that divergent loci tend to cluster because linkage hindersswamping of locally adapted alleles (5, 29). However, other pigmentloci under selection (e.g., SULF) are unlinked to ROS and EL,showing that tight linkage is not essential. Moreover, ROS and ELare both MYB-like transcription factors and so may be clustereddue to gene duplication. Thus, clustering may not be due to selec-tion for linkage (SI Appendix, Supplementary Text S1.6).
Role of Selective Sweeps and Barriers to Gene Flow in GeneratingGenomic Islands. Taken together, the clines, genetic analysis, tran-scriptional differences, and analysis of Fst peaks indicate that theROS/EL genomic island and its surround have been shaped by twoprocesses: (i) historic selective sweeps that led to different ROS andEL alleles becoming fixed in A.m.pseudomajus and A.m.striatumpopulations and (ii) selection against hybrid genotypes generated
1002.5 2.5 2.520 20 20 100100chromosome intervening ROS EL
Fst
0.0
0.2
0.4
0.6
0.8
1.0
��
�
�
�
�
��
�
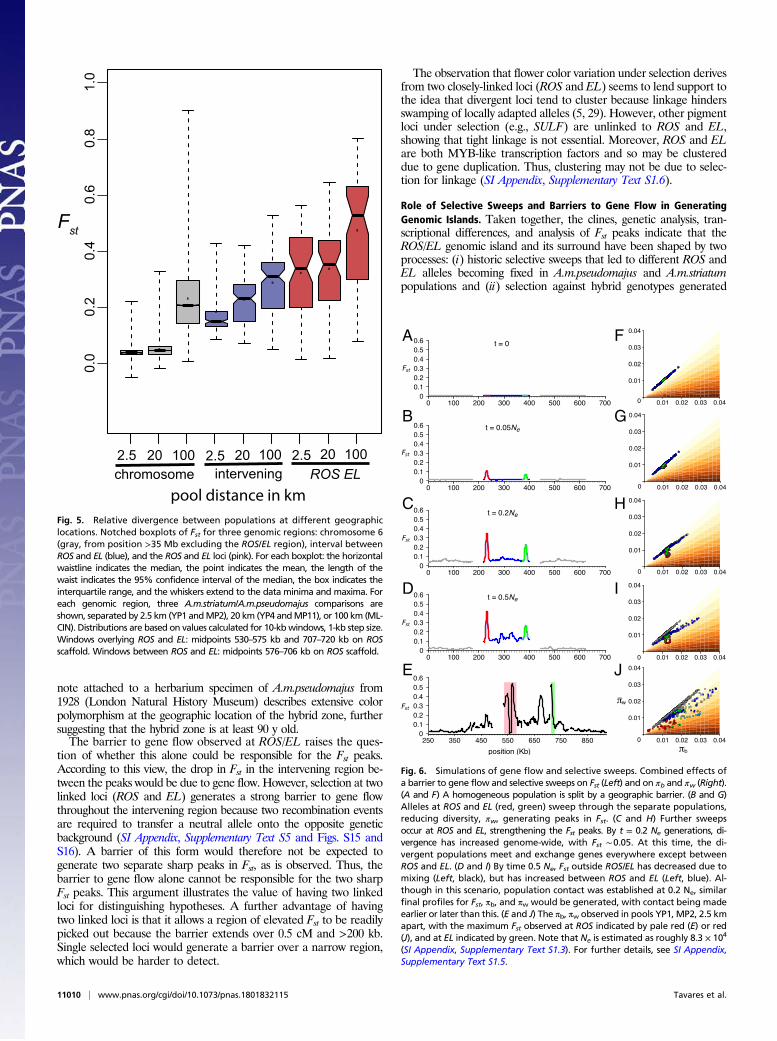
pool distance in kmFig. 5. Relative divergence between populations at different geographiclocations. Notched boxplots of Fst for three genomic regions: chromosome 6(gray, from position >35 Mb excluding the ROS/EL region), interval betweenROS and EL (blue), and the ROS and EL loci (pink). For each boxplot: the horizontalwaistline indicates the median, the point indicates the mean, the length of thewaist indicates the 95% confidence interval of the median, the box indicates theinterquartile range, and the whiskers extend to the data minima and maxima. Foreach genomic region, three A.m.striatum/A.m.pseudomajus comparisons areshown, separated by 2.5 km (YP1 andMP2), 20 km (YP4 andMP11), or 100 km (ML-CIN). Distributions are based on values calculated for 10-kbwindows, 1-kb step size.Windows overlying ROS and EL: midpoints 530–575 kb and 707–720 kb on ROSscaffold. Windows between ROS and EL: midpoints 576–706 kb on ROS scaffold.
A
B
C
D
E J
I
H
G
F
Fig. 6. Simulations of gene flow and selective sweeps. Combined effects ofa barrier to gene flow and selective sweeps on Fst (Left) and on πb and πw (Right).(A and F) A homogeneous population is split by a geographic barrier. (B and G)Alleles at ROS and EL (red, green) sweep through the separate populations,reducing diversity, πw, generating peaks in Fst. (C and H) Further sweepsoccur at ROS and EL, strengthening the Fst peaks. By t = 0.2 Ne generations, di-vergence has increased genome-wide, with Fst ∼0.05. At this time, the di-vergent populations meet and exchange genes everywhere except betweenROS and EL. (D and I) By time 0.5 Ne, Fst outside ROS/EL has decreased due tomixing (Left, black), but has increased between ROS and EL (Left, blue). Al-though in this scenario, population contact was established at 0.2 Ne, similarfinal profiles for Fst, πb, and πw would be generated, with contact being madeearlier or later than this. (E and J) The πb, πw observed in pools YP1, MP2, 2.5 kmapart, with the maximum Fst observed at ROS indicated by pale red (E) or red(J), and at EL indicated by green. Note that Ne is estimated as roughly 8.3 × 10⁴
(SI Appendix, Supplementary Text S1.3). For further details, see SI Appendix,Supplementary Text S1.5.
11010 | www.pnas.org/cgi/doi/10.1073/pnas.1801832115 Tavares et al.

where A.m.pseudomajus and A.m.striatum populations meet, creatinga local barrier to gene flow (28). We performed simulations to ex-plore scenarios consistent with the data and modes of selection.To provide constraints on simulations, we first estimated the
age of the selective sweeps. Based on the residual diversity withinthe sharp peaks at ROS and EL, we estimated the date of the mostrecent sweeps to be ∼90,000 generations ago (SI Appendix, Sup-plementary Text S1); this is an upper bound, since “soft sweeps”might not have eliminated all diversity. We also estimated the ageof the barrier to gene flow. As detailed in SI Appendix, Supple-mentary Text S1, the time required for Fst in the ROS/EL intervalto accumulate to the observed value of 0.125 is T ∼ 0.54 Ne ∼45,000 generations (where Ne = effective population size). Thus,both estimates suggest that selective sweeps and a barrier to geneflow were established roughly Ne ∼ 105 generations ago.We assume that a homogeneous ancestral population is first
split by a geographic barrier, allowing sweeps to occur independentlyin each population (Fig. 6 A and F, for simplicity assuming an initialFst ∼0.0). Geographic separation is a simple way of ensuring thatalleles swept in one population do not sweep into the other, al-though other scenarios such as environmental heterogeneity arepossible; the sequence data are also compatible with divergencein primary contact. Sweeps at ROS and EL (red, green in Fig. 6 Band G) reduce diversity, πw, generating peaks in Fst. These sweepspresumably reflect the selective advantage of a change in flower color,compared with the ancestral phenotype in each population. Giventhat both populations underwent sweeps, the ancestral flower phe-notype would have been different from both of the current pheno-types in A.m.pseudomajus or A.m.striatum. Further sweeps at ROSand EL strengthen the Fst peaks (Fig. 6 C and H). Unlike the simu-lations, in real populations, it is possible that global and/or local sweepsoccur at many other genetic loci and spatial locations, in addition toROS and EL, creating a more rugged Fst profile across the genome.After a period of time (0.2 Ne generations in the simulation
shown in Fig. 6), the divergent populations come into contact. Geneflow leads to a lowering of Fst from the chromosome-wide average,except at loci where a barrier has been established. We proposethat a barrier to gene flow occurs for only a subset of swept loci:those for which epistatic interactions or frequency dependencemaintain divergence. ROS and EL represent one such case, as theirinteractions, together with loci controlling yellow, lead to alterna-tive floral guides. Other loci that underwent sweeps, but led to noincompatibility (presumably the majority of sweeps) would undergo
gene flow, with the allele conferring higher overall fitness going tofixation in both populations. By time 0.5Ne, Fst outside ROS/EL hasdecreased due to gene flow (gray), but has further increased be-tween ROS and EL (blue) because of the local barrier to gene flow(Fig. 6 D and I). The resulting Fst, πb, and πw values are comparableto those observed (compare Fig. 6 D and I with Fig. 6 E and J).According to the above scenario, selective sweeps led to fixation ofdifferent alleles in each population, and selection maintains a localbarrier to gene flow. Multiple changes in alleles are involved, areasonable assumption given these events occurred over a period of∼105 generations, extending over glacial periods, during whichpopulations and the environment were in a state of flux.Our analysis indicates that both selective sweeps and barriers
to gene flow combine to shape genomic islands of differentiation.The barrier to gene flow at ROS/EL is insufficient to preventexchange for much of the genome. However, if the barrier weremore severe and applied to additional loci, it could prevent geneflow more completely, leading to speciation. The mechanismsthat created the genomic islands may therefore represent partialsteps toward reproductive isolation and speciation.
Materials and MethodsFull details of plant material, DNA extraction, genome sequence analysis,population genomics, genotyping, SNP analysis for geographic, and RNAseqanalysis are given in SI Appendix, Materials and Methods. Details on infer-ences from pairwise diversity and divergence, geographic cline analysis, andgenotypic screens are given in SI Appendix. Genomic sequence datasets areavailable at European Nucleotide Archive (ENA) with accession numberPRJEB28287, and RNAseq datasets are deposited in National Center forBiotechnology Information (NCBI) Gene Expression Omnibus (GEO) withaccession number GSE118621. Associated scripts are provided at linkedpublic data repositories as detailed in SI Appendix, Materials and Methods,and further information on the hybrid zone is available at www.antspec.org.
ACKNOWLEDGMENTS. Many thanks to Christophe Thébaud for sharing hisfinding of the herbarium specimen referenced in the text. This work wassupported by Biotechnology and Biological Sciences Research Council GrantsBBS/E/J/000PR9773 and BB/G009325/1 (to E.C.), ERC Grant 201252 (to N.H.B.),and a PhD scholarship (to H.T.) from the Portuguese Foundation for Scienceand Technology (FCT), through the Human Potential Operating Programme(POPH) of the National Strategic Reference Framework (QREN), within theEuropean Social Fund (Scholarship SFRH/BD/60982/2009). This research wassupported in part by the Norwich BioScience Institutes Computing infrastruc-ture for Science (CiS) group.
1. Hohenlohe PA, et al. (2010) Population genomics of parallel adaptation in threespinestickleback using sequenced RAD tags. PLoS Genet 6:e1000862.
2. Martin SH, et al. (2013) Genome-wide evidence for speciation with gene flow inHeliconius butterflies. Genome Res 23:1817–1828.
3. Poelstra JW, et al. (2014) The genomic landscape underlying phenotypic integrity inthe face of gene flow in crows. Science 344:1410–1414.
4. Clarkson CS, et al. (2014) Adaptive introgression between Anopheles sibling specieseliminates a major genomic island but not reproductive isolation. Nat Commun 5:4248.
5. Ellegren H, et al. (2012) The genomic landscape of species divergence in Ficedulaflycatchers. Nature 491:756–760.
6. Pennisi E (2014) Disputed islands. Science 345:611–613.7. Cruickshank TE, Hahn MW (2014) Reanalysis suggests that genomic islands of speci-
ation are due to reduced diversity, not reduced gene flow. Mol Ecol 23:3133–3157.8. Ma T, et al. (2018) Ancient polymorphisms and divergence hitchhiking contribute to
genomic islands of divergence within a poplar species complex. Proc Natl Acad SciUSA 115:E236–E243.
9. Wolf JB, Ellegren H (2017) Making sense of genomic islands of differentiation in lightof speciation. Nat Rev Genet 18:87–100.
10. Charlesworth B, Nordborg M, Charlesworth D (1997) The effects of local selection,balanced polymorphism and background selection on equilibrium patterns of geneticdiversity in subdivided populations. Genet Res 70:155–174.
11. Whibley AC, et al. (2006) Evolutionary paths underlying flower color variation inAntirrhinum. Science 313:963–966.
12. Bradley D, et al. (2017) Evolution of flower color pattern through selection on reg-ulatory small RNAs. Science 358:925–928.
13. Hackbarth J, Michaelis P, Scheller G (1942) Untersuchungen an dem Antirrhinum-Wildsippen-Sortiment von E. Baur. Z Indukt Abstamm Vererbungsl 80:1–102.
14. Schwinn K, et al. (2006) A small family of MYB-regulatory genes controls floral pig-mentation intensity and patterning in the genus Antirrhinum. Plant Cell 18:831–851.
15. Stubbe H (1966) Genetik und Zytologie von Antirrhinum L. sect. Antirrhinum (VebGustav Fischer Verlag, Jena, Germany).
16. Khimoun A, et al. (2012) Ecology predicts parapatric distributions in two closely-related Antirrhinum majus subspecies. Evol Ecol 27:51–64.
17. Shang Y, et al. (2011) The molecular basis for venation patterning of pigmentationand its effect on pollinator attraction in flowers of Antirrhinum. New Phytol 189:602–615.
18. Gegear RJ, Laverty TM (2005) Flower constancy in bumblebees: A test of the traitvariability hypothesis. Anim Behav 69:939–949.
19. Smithson A, Macnair MR (1996) Frequency-dependent selection by pollinators:Mechanisms and consequences with regard to behaviour of bumblebees Bombusterrestris (L.) (Hymenoptera: Apidae). J Evol Biol 9:571–588.
20. Oyama RK, Jones KN, Baum DA (2010) Sympatric sister species of Californian Antir-rhinum and their transiently specialized pollinators. Am Midl Nat 164:337–347.
21. Counterman BA, et al. (2010) Genomic hotspots for adaptation: The population ge-netics of Müllerian mimicry in Heliconius erato. PLoS Genet 6:e1000796.
22. Mallet J, Barton NH (1989) Strong natural selection in a warning-color hybrid zone.Evolution 43:421–431.
23. Joron M, Mallet JL (1998) Diversity in mimicry: Paradox or paradigm? Trends Ecol Evol13:461–466.
24. Jiggins CD (2017) The Ecology and Evolution of Heliconius Butterflies (Oxford Univ Press,Oxford).
25. Nadeau NJ, et al. (2012) Genomic islands of divergence in hybridizing Heliconiusbutterflies identified by large-scale targeted sequencing. Philos Trans R Soc Lond BBiol Sci 367:343–353.
26. Schlötterer C, Tobler R, Kofler R, Nolte V (2014) Sequencing pools of individuals–Mininggenome-wide polymorphism data without big funding. Nat Rev Genet 15:749–763.
27. Payseur BA, Rieseberg LH (2016) A genomic perspective on hybridization and speci-ation. Mol Ecol 25:2337–2360.
28. Barton N, Bengtsson BO (1986) The barrier to genetic exchange between hybridisingpopulations. Heredity (Edinb) 57:357–376.
29. Yeaman S, Aeschbacher S, Bürger R (2016) The evolution of genomic islands by in-creased establishment probability of linked alleles. Mol Ecol 25:2542–2558.
Tavares et al. PNAS | October 23, 2018 | vol. 115 | no. 43 | 11011
EVOLU
TION