selection and interpolation of head-related transfer - dafx-13
TRANSCRIPT

Proc. of the 16th Int. Conference on Digital Audio Effects (DAFx-13), Maynooth, Ireland, September 2-6, 2013
SELECTION AND INTERPOLATION OF HEAD-RELATED TRANSFER FUNCTIONS FORRENDERING MOVING VIRTUAL SOUND SOURCES
Hannes Gamper∗
Dept. of Media TechnologyAalto University
ABSTRACT
A variety of approaches have been proposed previously to interpo-late head-related transfer functions (HRTFs). However, relativelylittle attention has been given to the way a suitable set of HRTFs ischosen for interpolation and to the calculation of the interpolationweights. This paper presents an efficient and robust way to selecta minimal set of HRTFs and to calculate appropriate weights forinterpolation. The proposed method is based on grouping HRTFmeasurement points into non-overlapping triangles on the surfaceof a sphere by calculating the convex hull. The resulting Delau-nay triangulation maximises minimum angles. For interpolation,the HRTF triangle that is intersected by the desired sound sourcevector is selected. The selection is based on a point-in-triangletest than can be performed using just 9 multiplications and 6 addi-tions per triangle. A further improvement of the selection processis achieved by sorting the HRTF triangles according to their dis-tance from the sound source vector prior to performing the point-in-triangle tests. The HRTFs of the selected triangle are interpo-lated using weights derived from vector-base amplitude panning,with appropriate normalisation. The proposed method is comparedto state-of-the-art methods. It is shown to be robust with respect toirregularities in the HRTF measurement grid and to be well-suitedfor rendering moving virtual sources.
1. INTRODUCTION
The head-related transfer function (HRTF) describes the filteringthat sound travelling from a sound source to the ears of a listenerundergoes due to shadowing and reflections from the listener’storso, head, and pinnae. The HRTF changes as a function of az-imuth and elevation of the sound source and thus provides cues forthe human auditory system to determine the source direction. Torender a virtual source emanating sound from a certain direction,the directional cues corresponding to the desired azimuth and ele-vation need to be encoded in the sound. The encoding can be doneby filtering the sound with an HRTF corresponding to the desireddirection. Some databases of measured HRTFs available online in-clude the MIT KEMAR database [1], the CIPIC database [2], andthe LISTEN database [3]. These databases contain a large numberof measurement points covering a range of azimuth and elevationangles. To display a virtual sound source at a direction for whichno measured HRTF is available, an appropriate HRTF needs to
∗ This work was supported by the Helsinki Graduate School in Com-puter Science and Engineering (HeCSE), the [MIDE program] of AaltoUniversity, the Nokia Research Foundation, and Tekniikan edistämissäätiö(TES). Acknowledgements to Jonathan Botts for fruitful discussions.
be estimated from available HRTF measurements. A common ap-proach to obtain an HRTF estimate for an arbitrary azimuth andelevation angle from an HRTF measurement database is to inter-polate a subset of the measured HRTFs. Although various waysto interpolate HRTF subsets have been proposed previously, rela-tively little attention has been given to the way in which the HRTFsubset is selected.
Here, a robust and efficient way to select a minimal subsetof an HRTF measurement database for interpolation is proposed.The subset is minimal in the sense that it contains the minimumnumber of measured HRTFs that allow rendering a moving vir-tual source without abrupt spectral changes. The interpolation ofa minimal subset of HRTFs can be performed as a linear combi-nation of the selected HRTF subset with appropriate weights, inthe time or frequency domain. Here, a simple method to calcu-late interpolation weights is proposed and compared to methodsproposed previously.
2. PRIOR WORK
2.1. Subset selection
Approaches to HRTF interpolation have been proposed that takeinto account all or a large number of measurement points, for ex-ample using spherical splines [4] or via rational state-space inter-polation [5]. However, while these approaches potentially yieldmore accurate HRTF estimates than methods that use only a smallsubset of HRTF measurements for interpolation, they come at anincreased computational cost. The computational complexity ofthe HRTF interpolation algorithm becomes an issue when render-ing moving virtual sources, especially if multiple sources and/orroom reflections are to be rendered simultaneously, or if the ren-dering is done on a device with reduced computational power, forexample a mobile phone.
To minimise computational complexity, approaches have beenproposed to select a minimal subset of HRTF measurements forinterpolation. The reasoning behind such approaches is that anHRTF estimate for a desired, non-measured direction can be ob-tained by interpolating HRTFs measured at directions close to thedesired direction. Figure 1 illustrates various HRTF subset selec-tion approaches for a given source direction. One subset selectionapproach is to select the measurement points nearest to the desiredsource direction. Proposed methods include finding the 3 nearestmeasurement points [6, 7] and 4 nearest measurement points [8, 4](see fig. 1, N3 and N4). Distance measures proposed to determinethe nearest neighbouring measurement points include the great-circle distance [4] and the Euclidean distance [7]. Another subset
DAFX-1
Proc. of the 16th Int. Conference on Digital Audio Effects (DAFx-13), Maynooth, Ireland, September 2-5, 2013
Proc. of the 16th Int. Conference on Digital Audio Effects (DAFx-13), Maynooth, Ireland, September 2-6, 2013
0 5 10 15
−10
−5
0
5
10
15
20
Azimuth [deg]
Ele
va
tion
[d
eg
]
N3N3 N3
T
TT
N4N4 N4
N4
R R
RR
Figure 1: Subset selection approaches: nearest-3 (N3), nearest-4 (N4), enclosing triangle (T) and enclosing rectangle (R). Thedots denote measurement points in the MIT KEMAR HRTFdatabase [1], the cross denotes the desired source direction.
selection approach is to select the nearest measurement points thatenclose the desired source direction. Proposed approaches includefinding a rectangle [9, 10] or triangle [11, 12] enclosing the desireddirection (see fig. 1, R and T).
2.2. Calculation of interpolation weights
A straightforward way to interpolate a set of HRTF measurementsis to calculate a weighted average of the selected HRTFs. Bilin-ear interpolation can be used to calculate weights to interpolatemeasured HRTFs linearly with respect to azimuth and elevation.Bilinear interpolation has been proposed for interpolating 3 mea-surement points [11], and 4 measurement points arranged in a reg-ular grid [9]. Geometric approaches calculate weights based onthe distance of the desired direction from each measurement point.For the interpolation of 3 or more measurement points, weightscan be calculated from the inverse of the Euclidean distance [7] orthe great-circle distance (i.e., the distance along the sphere) [4, 13].The interpolation of measured HRTFs can be interpreted as a su-perposition of the signals of virtual loudspeakers positioned at themeasurement points [12]. With this interpretation, the interpola-tion weights are equivalent to the panning gains of these virtualloudspeakers. Panning gains for arbitrary loudspeaker setups canbe calculated using vector-base amplitude panning (VBAP) [14].
3. PROPOSED METHOD
3.1. Vector formulation
An HRTF database contains HRTFs measured at various directionswith respect to the measured test subject. The goal of HRTF inter-polation is to obtain an HRTF estimate corresponding to a desiredsource position. HRTFs can be considered distance-independentfor distances greater than 1 m [15]. Therefore, assuming the de-sired source is further than 1 m away, the measured directions andthe desired source position can be represented as unit vectors, de-noted as measurement vectors hi and source vector s, respectively.Given this vector formulation, the proposed methods for subset se-
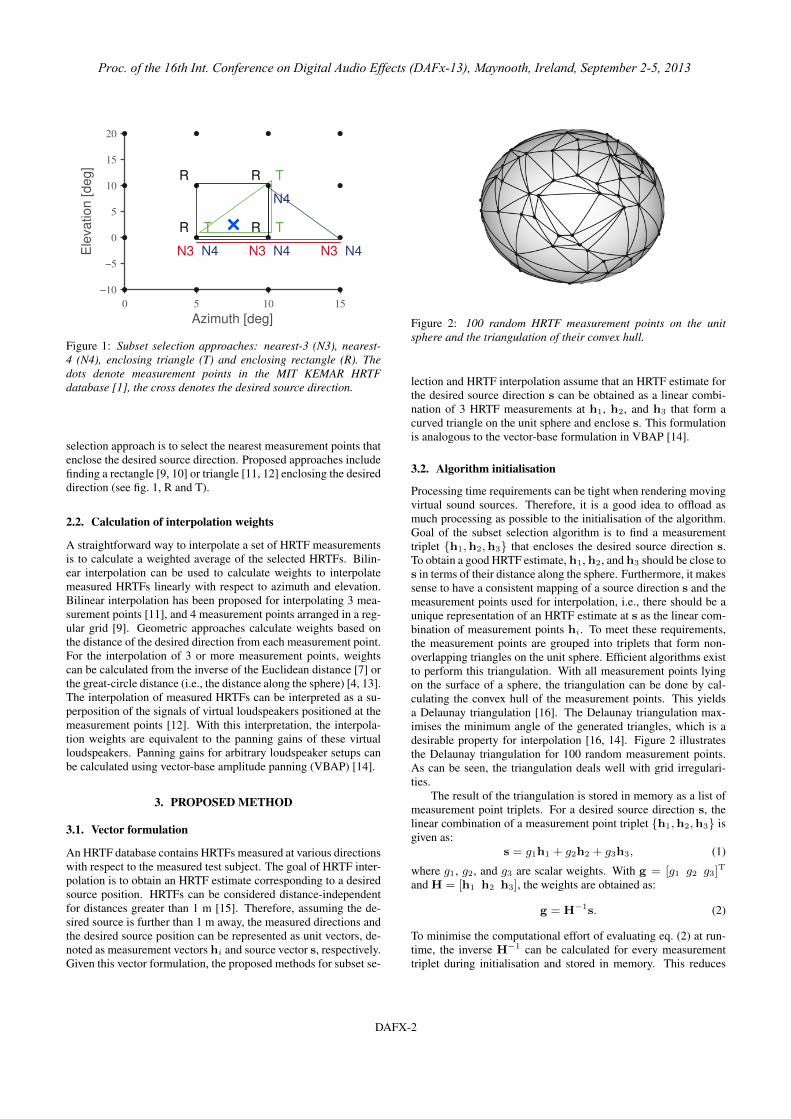
Figure 2: 100 random HRTF measurement points on the unitsphere and the triangulation of their convex hull.
lection and HRTF interpolation assume that an HRTF estimate forthe desired source direction s can be obtained as a linear combi-nation of 3 HRTF measurements at h1, h2, and h3 that form acurved triangle on the unit sphere and enclose s. This formulationis analogous to the vector-base formulation in VBAP [14].
3.2. Algorithm initialisation
Processing time requirements can be tight when rendering movingvirtual sound sources. Therefore, it is a good idea to offload asmuch processing as possible to the initialisation of the algorithm.Goal of the subset selection algorithm is to find a measurementtriplet {h1,h2,h3} that encloses the desired source direction s.To obtain a good HRTF estimate, h1, h2, and h3 should be close tos in terms of their distance along the sphere. Furthermore, it makessense to have a consistent mapping of a source direction s and themeasurement points used for interpolation, i.e., there should be aunique representation of an HRTF estimate at s as the linear com-bination of measurement points hi. To meet these requirements,the measurement points are grouped into triplets that form non-overlapping triangles on the unit sphere. Efficient algorithms existto perform this triangulation. With all measurement points lyingon the surface of a sphere, the triangulation can be done by cal-culating the convex hull of the measurement points. This yieldsa Delaunay triangulation [16]. The Delaunay triangulation max-imises the minimum angle of the generated triangles, which is adesirable property for interpolation [16, 14]. Figure 2 illustratesthe Delaunay triangulation for 100 random measurement points.As can be seen, the triangulation deals well with grid irregulari-ties.
The result of the triangulation is stored in memory as a list ofmeasurement point triplets. For a desired source direction s, thelinear combination of a measurement point triplet {h1,h2,h3} isgiven as:
s = g1h1 + g2h2 + g3h3, (1)
where g1, g2, and g3 are scalar weights. With g = [g1 g2 g3]T
and H = [h1 h2 h3], the weights are obtained as:
g = H−1s. (2)
To minimise the computational effort of evaluating eq. (2) at run-time, the inverse H−1 can be calculated for every measurementtriplet during initialisation and stored in memory. This reduces
DAFX-2
Proc. of the 16th Int. Conference on Digital Audio Effects (DAFx-13), Maynooth, Ireland, September 2-5, 2013

Proc. of the 16th Int. Conference on Digital Audio Effects (DAFx-13), Maynooth, Ireland, September 2-6, 2013
the operation count required for evaluating eq. (2) at runtime to 9multiplications and 6 additions per measurement triplet.
3.3. HRTF subset selection
The criterion for selecting a measurement triplet {h1,h2,h3} forinterpolation is that the weights calculated via eq. (2) are positive:
g1, g2, g3 ≥ 0. (3)
This is equivalent to s lying inside the curved triangle formed by{h1,h2,h3} on the unit sphere. At runtime, the subset selectionalgorithm iterates through all measurement triplets until a suitabletriplet is found. The performance of this “brute-force” implemen-tation for various publicly available HRTF databases is illustratedin fig. 3.
Next, an improvement to the subset selection algorithm is pro-posed. Instead of iterating through the triplets in an arbitrary or-der, the triplets are sorted according to their distance from the de-sired source direction s, so that the selection algorithm first iteratesthrough triplets close to s. The triplet distance is calculated as thedistance between s and the centre of the triangle formed by themeasurement triplet. A straightforward way to express the cen-tre c of a (curved) triangle is to take the arithmetic mean of thetriangle vertices {h1,h2,h3}:
c = (h1 + h2 + h3)/3. (4)
The distance d along the sphere between s and the triangle is thengiven as:
d = arccos(s • c), (5)
where • is the inner product of s and c. However, for the pur-pose of ordering the measurement triangles with respect to theirdistance to s, it is sufficient to calculate the inner product d̂ip:
d̂ip = s • c. (6)
Sorting all triangles by descending d̂ip is equivalent to sortingthem by ascending distance d. As c can be calculated via eq. (4)during initialisation and stored in memory, evaluating eq. (6) atruntime reduces to 3 multiplications and 2 additions per measure-ment triplet (whereas the brute-force approach evaluates eq. (2)which requires 9 multiplications and 6 additions per triplet). Ef-ficient algorithms exist for sorting the triangles according to dis-tance, given the list L1,N = {d̂ip,1, . . . , d̂ip,N}, where N is thenumber of measurement triplets. Assuming that a suitable trian-gle for interpolation is among the K triangles closest to s, but notnecessarily the closest, it is not necessary to sort the whole list. In-stead, quick selection can be used to partition L1,N into 2 unsortedlists: A1,K, containing the K closest triangles, and BK+1,N, con-taining the remaining triangles [17]. With K set to 0.02 N, A1,K
consists of the closest 2 percent of all triangles. To speed up thequick selection, K is set to an admissible range rather than a fixedvalue [17]. Here, K is set to 0.02 N± 0.004 N.
To find a suitable triangle for interpolation, the subset selec-tion algorithm starts by iterating over A1,K. If no suitable triangleis found among the closest triangles, the selection algorithm con-tinues to iterate over the remaining triangles BK+1,N. Figure 3 il-lustrates the effect of first iterating over the closest triangles on thetotal processing time of the subset selection algorithm (fig. 3, darkgrey dots), for 1000 random source directions s and three differ-ent HRTF databases. The brute-force implementation (fig. 3, light
100 200 300 400 500 600
0
5
10
[µs](a)
50 100 150 200 250 300 350
0
2
4
[µs](b)
500 1000 1500 2000
0
10
20
30
Triangle index j[µ
s](c)
Figure 3: Processing times of brute-force iteration (light greydots) and iteration over the K closest triangles after quick se-lection (dark grey dots), for 1000 random source directions, us-ing the HRTF databases: (a) MIT KEMAR [1]; (b) LISTEN [3];(c) CIPIC [2]. Each dot denotes the time required to find anHRTF measurement triplet j suitable for interpolation for a ran-dom source direction, averaged over 500 repetitions, on a com-puter with a 2GHz quad-core processor.
grey dots) iterates over all triangles regardless of their distance tos, until a suitable one is found. As expected, the processing timeof the brute-force implementation increases linearly with the iter-ation index j of the selected triangle. Therefore, the processingtime of the brute-force subset selection algorithm is dependent onthe desired source direction s.
By using quick selection to find the K closest triangles and it-erating over those first, the processing time of the subset selectionalgorithm is approximately constant regardless of the triangle in-dex (see fig. 3, dark grey dots), that is, a suitable triangle is foundwithin a certain time span for any source direction s. Constantprocessing time is a desirable property for spatial sound renderingalgorithms as it allows for a constant rendering update rate whenrendering for example moving sources.
3.4. Calculation of interpolation weights
The weights g, calculated via eq. (2) to check whether a measure-ment triplet {h1,h2,h3} is suitable for interpolation, can directlybe used as interpolation weights, after normalisation:
gi,int =gi∑3j=1 gj
⇒3∑
i=1
gi,int = 1 (7)
where gi,int is the interpolation weight of measurement point hi.
DAFX-3
Proc. of the 16th Int. Conference on Digital Audio Effects (DAFx-13), Maynooth, Ireland, September 2-5, 2013

Proc. of the 16th Int. Conference on Digital Audio Effects (DAFx-13), Maynooth, Ireland, September 2-6, 2013
0 30 60 90 120 150 180
−40
−20
0
20
40
60
80
Ele
vation [deg]
Azimuth [deg]
Figure 4: Dots denote measurement points in the MIT KEMARHRTF database [1]. Source directions in grey areas are not en-closed by their respective 3 nearest measurement points.
If the desired source s lies on an edge of a measurement tri-angle, the vertex opposite to that edge has a weight of zero, thuseffectively only the two measurement points forming the edge areselected for interpolation. Similarly, if s lies on a vertex, the othertwo vertices of the same triangle have zero weights, and only theHRTF measured at s is selected.
4. EXPERIMENTS
To evaluate the proposed approaches for HRTF subset selectionand calculation of interpolation weights, experiments are carriedout using both modelled and measured HRTFs.
4.1. HRTF subset selection
Even though the proposed subset selection approach is very effi-cient computationally (see fig. 3), an even faster method is to sim-ply select the 3 nearest measurement points for interpolation [6, 7].However, a drawback of this approach is that the 3 points near-est to the desired source direction s do not necessarily enclose s,and may for example form a line rather than a triangle (see N3in fig. 1). In the case of the nearest measurement points forminga line, it is questionable whether using all 3 points for interpola-tion would yield a better HRTF estimate than using for exampleonly the 2 nearest measurement points. Figure 4 shows large ar-eas for which source directions are not enclosed by their respective3 nearest measurement points (with respect to their distance alongthe sphere) in the MIT KEMAR HRTF database [1]. This is mostlydue to the nearest measurement points lying on a line with constantelevation, and the desired source direction s lying above or belowthat line (see section 4.2 for a discussion on the consequences).
Given the drawbacks of the nearest-3 selection algorithm, theadditional computational cost of the subset selection algorithmproposed here, incurred for testing whether a selected measure-ment triplet encloses the desired source direction, seems justified.
0 5 10 15
−10
0
10
20
Ele
vat
ion [
deg
]
(a)
RM
SE
[dB
]
0.005
0.01
0.015
0.02
0 5 10 15
−10
0
10
20
Ele
vat
ion [
deg
]
(b)
RM
SE
[dB
]
0.1
0.2
0.3
0 5 10 15
−10
0
10
20
Ele
vat
ion [
deg
]
(c)
RM
SE
[dB
]
0
0.01
0.02
0.03
0 5 10 15
−10
0
10
20
Azimuth [deg]
Ele
vat
ion [
deg
]
(d)
RM
SE
[dB
]
0
0.005
0.01
0.015
0.02
Figure 5: RMSE for interpolating a simple head-shadowing modelsampled at regular azimuth and elevation intervals (dark dots) us-ing (a) normalised VBAP weighting (proposed here); (b) inversedistance weighting; (c) bilinear interpolation of 3 measurementpoints; (d) bilinear interpolation of 4 measurement points.
4.2. Interpolation of modelled HRTF data
Using a simple model for the angle-dependent effect of head shad-owing on sound reaching the ears [18], the performance of the pro-posed method for calculating interpolation weights is compared tomethods proposed in the literature. The model is implemented asan IIR filter:
Hhs(z, ϕ) =
(ca+ α(ϕ)fs
)+(ca− α(ϕ)fs
)z−1(
ca+ fs
)+(ca− fs
)z−1
, (8)
with
α(ϕ) = 1.05 + 0.95 cos
(180
150
(ϕ+
π
2
)), (9)
where c denotes the speed of sound, a the head radius, ϕ the az-imuth angle, and fs the sampling rate. Note that ϕ is given ininteraural-polar coordinates [19]. In interaural-polar coordinates,
DAFX-4
Proc. of the 16th Int. Conference on Digital Audio Effects (DAFx-13), Maynooth, Ireland, September 2-5, 2013

Proc. of the 16th Int. Conference on Digital Audio Effects (DAFx-13), Maynooth, Ireland, September 2-6, 2013
Hhs is independent of elevation. Given azimuth φ and elevation δin standard vertical-polar coordinates, ϕ is obtained as
ϕ = arcsin (sin(φ) cos(δ)) . (10)
Using the head-shadowing model given by eq. (8), approxi-mate HRTFs are obtained at regular intervals of azimuth and ele-vation. Four different methods are used to calculate interpolationweights and to interpolate those approximate HRTFs:
a) the normalised VBAP weights proposed here;
b) inverse distance weighting [7];
c) bilinear interpolation of 3 measurement points [11];
d) bilinear interpolation of 4 measurement points [9].
The methods are compared in terms of the root-mean-square error(RMSE) between the interpolated and the modelled HRTF magni-tude response. The purpose of the comparison is to illustrate qual-itative, rather than quantitative, differences between the comparedinterpolation approaches.
Figure 5 illustrates the RMSE of the four methods for a rangeof azimuth and elevation angles. As expected, all algorithms arevirtually error-free at measurement points. Moving away frommeasurement points, the interpolation error increases. The inter-polation error of the bilinear interpolation of 3 measurement pointsexhibits slight discontinuities (see fig. 5c), caused by interpolationdiscontinuities. The discontinuities coincide with shared edges ofmeasurement triangles: As the source position crosses a sharededge between two measurement triangles, the measurement pointsused for interpolation switch abruptly from one triangle to theother, causing a discontinuity in the interpolated HRTF. Discon-tinuities are undesirable when rendering moving sound sources, asthey could potentially cause audible discontinuities in the sound.The inverse distance weighting shows more severe discontinuities(see fig. 5b). These are partially caused by the fact that the nearestpoints used for interpolation may form a line, rather than a trian-gle enclosing the desired source direction (see fig. 4). The otherreason why inverse distance weighting produces discontinuities inthe interpolation is the same as for the bilinear interpolation of 3measurement points: The transition between one selected subsetof measurement points to another is discontinuous. The interpola-tion of the normalised VBAP weighting proposed here (see fig. 5a)and of bilinear interpolation of 4 measurement points (see fig. 5d)is nearly identical for the tested range of azimuth and elevationangles. Both methods interpolate smoothly in azimuth and eleva-tion, without discontinuities, which makes them good candidatesfor rendering moving sound sources. The reason these two meth-ods do not produce discontinuities is that for a source moving closeto an edge of a selected measurement subset, the weights of ver-tices not lying on that edge gradually diminish, until they becomezero for a source lying on the edge. This allows for a smooth tran-sition from one selected measurement subset, across an edge, toanother subset. The advantage of the proposed VBAP weightingover the bilinear interpolation of 4 measurement points is that itselects at most 3 measurement points for interpolation and doesnot depend on a regular measurement grid (see fig. 2). As theperformance of the two methods is very similar otherwise and thebilinear interpolation is not well defined in the presence of gridirregularities, bilinear interpolation is dropped from the followingexperiments.
0 5 10 15
−10
0
10
20
Azimuth [deg]
Ele
vat
ion [
deg
]
(a)
Step index
[kH
z]
(b)
20 40 60 80 100
0
1
2
3
4
[dB
]
−15
−10
−5
0
5
10
Step index
[kH
z](c)
20 40 60 80 100
0
1
2
3
4
[dB
]
−15
−10
−5
0
5
10
Figure 6: HRTF interpolation for a moving source; (a) the sourcepath, discretised at 100 steps; (b) spectrogram of HRTF interpo-lation using the proposed methods for subset selection and calcu-lation of interpolation weights; (c) spectrogram of HRTF interpo-lation by inverse distance weighting of the nearest 3 HRTFs.
4.3. Rendering a moving virtual source
To illustrate the effect of interpolation discontinuities, the render-ing of a moving sound source is simulated using the MIT KE-MAR HRTF database [1]. After subset selection and interpolationweight calculation, the interpolation is performed on the magni-tude of the measured HRTFs in the frequency domain, as proposedby Zotkin et al. [7]. The phase of the interpolated HRTF can be de-rived from a spherical head model [7] and is not considered here.
Figure 6 shows spectrograms of the interpolated HRTFs for asource moving along a circular path (fig. 6a). The proposed meth-ods for subset selection and calculation of interpolation weightsproduce smooth HRTF estimates (fig. 6b). Interpolation using thenearest 3 measurement points and inverse distance weighting pro-duces discontinuities visible in the spectrogram (fig. 6c). Informallistening tests indicate that these discontinuities may be audible.
4.4. Interpolation of measured HRTF data
To compare the overall performance of the proposed method toother approaches, interpolation is performed on the MIT KEMAR
DAFX-5
Proc. of the 16th Int. Conference on Digital Audio Effects (DAFx-13), Maynooth, Ireland, September 2-5, 2013

Proc. of the 16th Int. Conference on Digital Audio Effects (DAFx-13), Maynooth, Ireland, September 2-6, 2013
Table 1: Average RMSE for interpolating the measured left- andright-ear HRTFs in (a) the MIT KEMAR HRTF database [1],(b) the LISTEN HRTF database [3], and (c) the CIPIC HRTFdatabase [2]. The minimum RMSE for each row is in bold.
proposed bilinear 3 nearest-3 nearest-2[dB] [dB] [dB] [dB]
(a) left 1.809 1.811 1.916 1.811right 2.015 2.017 2.142 2.017
(b) left 3.480 3.517 3.432 3.557right 3.195 3.228 3.248 3.291
(c) left 2.195 2.201 2.185 2.201right 2.217 2.222 2.226 2.222
HRTF database [1], by removing one measurement point at a timeand comparing the measured HRTF to the HRTF estimated viainterpolation for the same point. The methods compared are:
a) the method for subset selection and interpolation weightcalculation proposed here;
b) bilinear interpolation of 3 measurement points;
c) inverse distance weighting of the 3 nearest measurementpoints;
d) inverse distance weighting of the 2 nearest measurementpoints (for comparison).
The interpolation is performed on the magnitude spectra, as pro-posed by Zotkin et al. [7]. Table 1 summarises the results in termsof the RMSE averaged over all measurement points. For the MITKEMAR database (table 1a), all methods have nearly identical per-formance, except for the nearest-3 interpolation which performsslightly worse. This is due to the measurement grid structure of theMIT KEMAR database, which causes the nearest-3 subset selec-tion to perform badly (see figs. 4 and 5). The algorithm is actuallyoutperformed by interpolation using just the 2 nearest measure-ment points. As hypothesised, there is no advantage in using 3measurement points for interpolation, if all 3 points lie on a line(see section 4.1). For the LISTEN database (table 1b), the RMSEof all tested algorithms is similar. The RMSE is higher than forthe MIT KEMAR database, as the measurement grid of the LIS-TEN database is less dense. The results for the CIPIC database areanalogous (table 1c). The improved performance of the nearest-3interpolation for the LISTEN and CIPIC database indicates that forthese databases the 3 nearest measurement points are more likelyto form a triangle enclosing the point to be estimated. The methodproposed here performs well for all 3 tested HRTF databases.
Overall, for the HRTF databases used in this comparison, thedifferences between the tested methods are small. This is partlydue to the way the RMSE is calculated (by removing one measure-ment point at a time) and the fact that the tested databases exhibithighly regular measurement grids (with the exception of some ir-regularities in the MIT KEMAR and LISTEN databases at extremeelevation values, where the measurement grid is sparser). This isalso the reason for the good performance of the inverse-distanceinterpolation of the nearest 2 measurement points: After remov-ing one measurement point from the HRTF database, the near-
est measurement points usually lie to the left and right of the re-moved point, at equal distance and elevation. For this special case,all algorithms except the nearest-3 interpolation potentially selectthose two neighbouring points and calculate the same interpolationweights, thus resulting in an identical interpolation. Obviously,this is not true for any point that does not lie precisely half-waybetween 2 measurement points at equal elevation. Interpolatingat positions that do not coincide exactly with measurement points,or using an HRTF database with a more irregular grid structure,would produce larger differences with respect to the measurementpoints selected and the weights calculated for interpolation, andthus the resulting HRTF interpolation.
5. SUMMARY AND CONCLUSION
A method for selecting a subset of an HRTF measurement databasefor HRTF interpolation and calculating interpolation weights waspresented. The main steps of the algorithm are:
1. Initialisation: group HRTF measurement points into non-overlapping triangles by calculating their convex hull andpre-calculate the inverse and centres of the triangles;
2. source update: iterate through the measurement triplets (af-ter optional sorting according to distance) until a suitabletriplet for interpolation is found;
3. interpolation: calculate interpolation weights via vector-base amplitude panning (VBAP) and normalisation.
After selecting an HRTF subset and calculating appropriate inter-polation weights, the actual interpolation can be performed as alinear combination of the time- or frequency-domain responses.The proposed algorithm proves to be computationally efficient androbust with respect to irregular measurement grids. The measure-ment triangles obtained by calculating the convex hull of the mea-surement points represent a Delaunay triangulation, which max-imises the minimum angle of all triangles, a property advantageousfor interpolation [16, 14].
The interpolation weights calculated via VBAP and normali-sation change smoothly with azimuth and elevation, allowing forsmooth interpolation of moving sources without interpolation dis-continuities. The accuracy of the proposed method for interpolat-ing an HRTF database is comparable to or better than other state-of-the-art methods, while not suffering from interpolation discon-tinuities for moving sources.
6. REFERENCES
[1] W. G. Gardner and K. D. Martin, “HRTF measurementsof a KEMAR,” J. Acoust. Soc. Am., vol. 97, no. 6, pp.3907–3908, 1995.
[2] V. R. Algazi, R. O. Duda, D. M. Thompson, and C. Aven-dano, “The CIPIC HRTF database,” in Proc. IEEE WASPAA,New Paltz, NY, Oct. 2001, pp. 99–102.
[3] IRCAM, “LISTEN HRTF database,”http://recherche.ircam.fr/equipes/salles/listen/, last accessedMarch 12, 2013.
[4] K. Hartung, J. Braasch, and S. J. Sterbing, “Comparisonof different methods for the interpolation of head-relatedtransfer functions,” in Proc. 16th Conf. Audio Eng. Soc.,Helsinki, Finland, Apr. 1999, pp. 319–329.
DAFX-6
Proc. of the 16th Int. Conference on Digital Audio Effects (DAFx-13), Maynooth, Ireland, September 2-5, 2013

Proc. of the 16th Int. Conference on Digital Audio Effects (DAFx-13), Maynooth, Ireland, September 2-6, 2013
[5] F. Keyrouz and K. Diepold, “A new HRTF interpolationapproach for fast synthesis of dynamic environmentalinteraction,” J. Audio Eng. Soc., vol. 56, no. 1/2, pp. 28–35,2008.
[6] J.-M. Jot, V. Larcher, and O. Warusfel, “Digital signalprocessing issues in the context of binaural and transauralstereophony,” in Proc. 98th Conv. Audio Eng. Soc., Paris,France, Feb. 1995.
[7] D. Zotkin, R. Duraiswami, and L. Davis, “Rendering local-ized spatial audio in a virtual auditory space,” IEEE Trans.Multimedia, vol. 6, no. 4, pp. 553–564, 2004.
[8] E. Wenzel and S. Foster, “Perceptual consequences of inter-polating head-related transfer functions during spatial syn-thesis,” in Proc. IEEE WASPAA, New Paltz, NY, Oct. 1993,pp. 102–105.
[9] L. Savioja, J. Huopaniemi, T. Lokki, and R. Väänänen,“Creating interactive virtual acoustic environments,” J.Audio Eng. Soc., vol. 47, no. 9, pp. 675–705, 1999.
[10] E. H. A. Langendijk and A. W. Bronkhorst, “Fidelityof three-dimensional-sound reproduction using a virtualauditory display,” J. Acoust. Soc. Am., vol. 107, no. 1, pp.528–537, 2000.
[11] F. P. Freeland, L. W. P. Biscainho, and P. S. R. Diniz, “In-terpositional Transfer Function of 3D-Sound Generation,” J.Audio Eng. Soc., vol. 52, no. 9, pp. 915–930, 2004.
[12] M. Queiroz and G. H. M. a. de Sousa, “Efficientbinaural rendering of moving sound sources using HRTF
interpolation,” J. New Music Research, vol. 40, no. 3, pp.239–252, 2011.
[13] S. Carlile, C. T. Jin, and V. Van Raad, “Continuous virtualauditory space using HRTF interpolation: acoustic and psy-chophysical errors,” in Proc. IEEE Pacific Rim Conf. Multi-media, Sydney, Australia, Dec. 2000, pp. 220–223.
[14] V. Pulkki, “Virtual sound source positioning using vectorbase amplitude panning,” J. Audio Eng. Soc., vol. 45, no. 6,pp. 456–466, 1997.
[15] D. S. Brungart and W. M. Rabinowitz, “Auditory localizationof nearby sources. head-related transfer functions,” J. Acoust.Soc. Am., vol. 106, no. 3, pp. 1465–1479, 1999.
[16] F. Aurenhammer, “Voronoi diagrams – a survey of afundamental geometric data structure,” ACM Comput. Surv.,vol. 23, no. 3, pp. 345–405, 1991.
[17] C. Martínez, A. Panholzer, and H. Prodinger, “The analysisof range quickselect and related problems,” Theor. Comput.Sci., vol. 412, no. 46, pp. 6537–6555, 2011.
[18] V. Pulkki, T. Lokki, and D. Rocchesso, “Spatial effects,” inDAFX: Digital Audio Effects, 2nd ed., U. Zölzer, Ed. Chich-ester, UK: Wiley, March 2011, pp. 139–184.
[19] V. R. Algazi, R. O. Duda, R. Duraiswami, N. A. Gumerov,and Z. Tang, “Approximating the head-related transferfunction using simple geometric models of the head andtorso,” J. Acoust. Soc. Am., vol. 112, no. 5, pp. 2053–2064,2002.
DAFX-7
Proc. of the 16th Int. Conference on Digital Audio Effects (DAFx-13), Maynooth, Ireland, September 2-5, 2013