self-efficacy and instructional leadership: does mentoring
TRANSCRIPT
Eastern Michigan UniversityDigitalCommons@EMU
Master's Theses and Doctoral Dissertations Master's Theses, and Doctoral Dissertations, andGraduate Capstone Projects
2-12-2015
Self-efficacy and instructional leadership: Doesmentoring make a difference?Julie Diane Helber
Follow this and additional works at: http://commons.emich.edu/theses
Part of the Educational Leadership Commons
This Open Access Dissertation is brought to you for free and open access by the Master's Theses, and Doctoral Dissertations, and Graduate CapstoneProjects at DigitalCommons@EMU. It has been accepted for inclusion in Master's Theses and Doctoral Dissertations by an authorized administrator ofDigitalCommons@EMU. For more information, please contact [email protected].
Recommended CitationHelber, Julie Diane, "Self-efficacy and instructional leadership: Does mentoring make a difference?" (2015). Master's Theses andDoctoral Dissertations. 616.http://commons.emich.edu/theses/616

Self-Efficacy and Instructional Leadership: Does mentoring make a difference?
by
Julie D. Helber
Dissertation
Submitted to the Department of Leadership and Counseling
Eastern Michigan University
in partial fulfillment of the requirement for the degree of
Doctor of Education
Dissertation Committee:
Dr. Ronald Williamson, Chair
Dr. Jaclynn C. Tracy
Dr. Gary Marx Dr. Jacqueline LaRose
February 12, 2015
Copyright 2015 by Julie D. Helber
All rights reserved

ii
Dedication
Thank you to my family, especially my husband, Tim, and children, Taylor, Owen,
and Noah, for their constant support to me throughout this process. Their patience and love
have allowed me the time and resources to complete this study.

iii
Acknowledgements
The author expresses appreciation to the following individuals for their assistance and
invaluable advice: Dr. David Anderson for his consistent support with the methods and
results chapters; Dr. Norma Ross, who gave her time and talents in editing this document;
and committee members, Dr. Jacqueline LaRose, Dr. Gary Marx, and Dr. Jaclynn C. Tracy
for their belief in the study. A special note of thanks goes to Dr. Ronald Williamson,
Committee Chair, for his unconditional support throughout this process.
iv
Abstract
The responsibility of principals has shifted significantly over the past few decades.
During 1960s and 1970s school leaders were expected to be organizers and managers of
schools and to serve as buffers to the organization to protect a weak technical core.
Standards-based reform, beginning in the 1980s, was in direct conflict with this mindset.
Instead of protecting a weak technical core, school leaders had to focus on instruction guided
by standards and demonstrate alignment to such standards. Today, there is an increased
attention on academic achievement and accountability in schools (Leithwood, Jantzi, &
Steinbach, 1999). Principals are being held responsible for the quality of their teaching staff
and the results of high stakes assessments. Mentoring programs for practicing principals are
limited and those for aspiring principals are inconsistent. Given the changing role of the
principal in public education, the researcher conducted this study to determine how
mentoring impacts a principal’s self-efficacy in instructional leadership.
Data were collected through the use of a web-based quantitative survey. A sample
size of 505 principals was captured. Principals were asked to characterize their mentoring
experience and answer questions that identified their self-efficacy in instructional leadership
categories. Data were analyzed using descriptive and inferential statistics, confirmatory
factor analysis, and structural equation modeling.
Major findings included the following: 1) Principals who were mentored had higher
self-efficacy scores in each of the instructional leadership categories; culture, data, and
enactment (school improvement, evaluation and curriculum; 2) Suburban school principals
ranked their mentoring experiences at a higher level than urban or rural principals; 3)
v
Principals who held doctoral degrees were more efficacious in all three instructional
leadership categories; 4) Elementary principals were more efficacious in the use of data to
improve instruction; 5) Principals who had served longer tenures had higher self-efficacy
scores in building a positive school culture.
The results of this research will contribute to the existing knowledge base about the
effects of a mentoring program on instructional leadership self-efficacy and will be beneficial
to school districts, college and university educational administration programs, and building
leaders across the state.
vi
Table of Contents
Dedication ................................................................................................................................. ii
Acknowledgements .................................................................................................................. iii
Abstract .................................................................................................................................... iv
Table of Contents ..................................................................................................................... vi
List of Tables ........................................................................................................................... ix
List of Figures ........................................................................................................................... x
Chapter One–Research Problem ............................................................................................... 1
Introduction ........................................................................................................................... 1
Problem Statement ................................................................................................................ 3
Purpose of the Study ............................................................................................................. 4
Significance of the Proposed Inquiry .................................................................................... 4
Research Questions and Null Hypotheses ............................................................................ 5
Study Design ......................................................................................................................... 6
Conceptual Framework/ Theoretical Base ............................................................................ 6
Self-efficacy .......................................................................................................................... 7
Instructional Leadership Self-efficacy .................................................................................. 8
Social Learning Theory and Social Cognitive Theory ......................................................... 8
Mentoring .............................................................................................................................. 9
vii
Operational Definitions ....................................................................................................... 11
Delimitations/Limitations ................................................................................................... 13
Summary ............................................................................................................................. 13
Chapter Two–Literature Review ............................................................................................. 15
Instructional Leadership ...................................................................................................... 15
Self-efficacy and Social Learning/Social Cognitive Theory .............................................. 24
Contributing Factors ........................................................................................................... 31
Summary ............................................................................................................................. 37
Chapter Three – Methods ........................................................................................................ 38
Research Questions and Null Hypothesis ........................................................................... 40
Research Design and Approach .......................................................................................... 41
Data Collection ................................................................................................................... 41
Instrumentation ................................................................................................................... 42
Data Analysis ...................................................................................................................... 42
Ethical Considerations ........................................................................................................ 44
Summary ............................................................................................................................. 44
Chapter Four–Presentation and Analysis of Data ................................................................... 46
Chapter 5‒Summary, Conclusions, Inferences, Implications, and Recommendations for
Further Study .......................................................................................................................... 71
Purpose of the Study ........................................................................................................... 71
viii
Significance of the Proposed Inquiry .................................................................................. 71
Research Questions and Null Hypotheses .......................................................................... 72
Study Design ....................................................................................................................... 73
Conceptual Framework/ Theoretical Base .......................................................................... 73
Summary of Key Findings .................................................................................................. 74
Connections to Research and Theory ................................................................................. 77
Inferences and Limitations .................................................................................................. 79
Implications for School District Leaders ............................................................................ 80
Implications for Theory ...................................................................................................... 81
Recommendations for Further Study .................................................................................. 81
Summary ............................................................................................................................. 84
References ............................................................................................................................... 85
Appendices .............................................................................................................................. 94
Appendix A–Survey Instrument ......................................................................................... 95
Appendix B–Informed Consent Letter .............................................................................. 102
Appendix C–Permission to Use Survey Instruments ........................................................ 104
Appendix D – Human Subjects Approval Form ............................................................... 107
ix
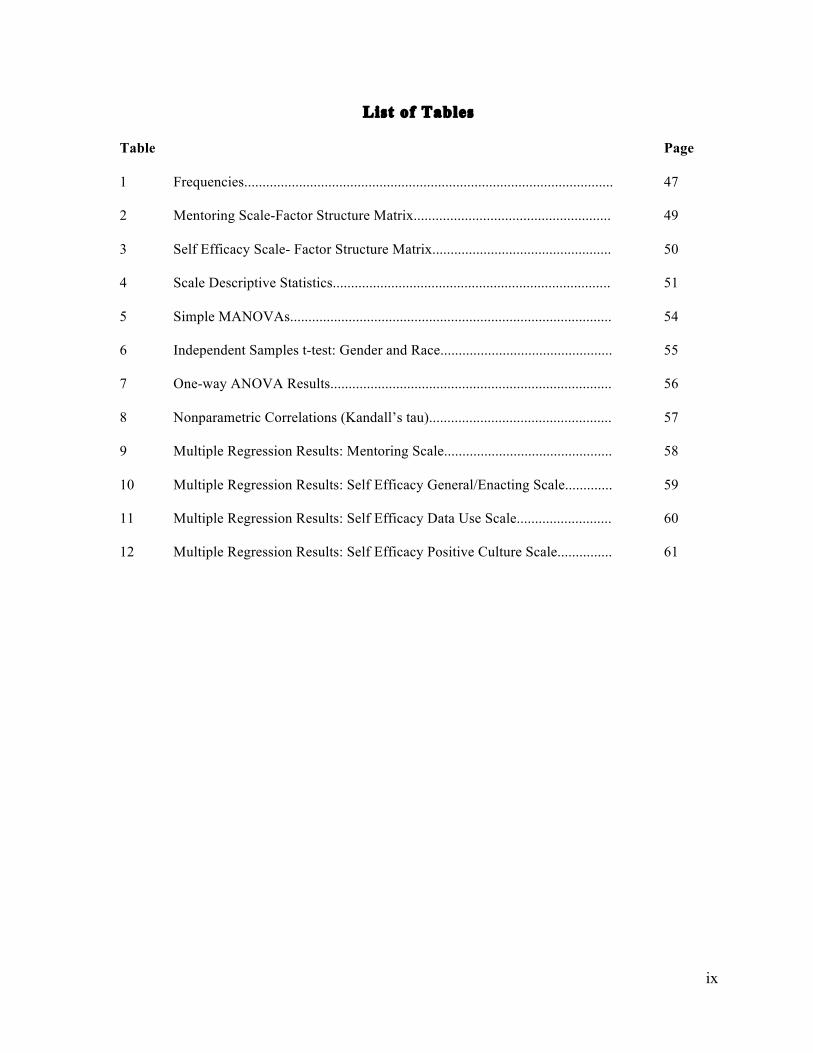
List of Tables
Table Page
1 Frequencies..................................................................................................... 47
2 Mentoring Scale-Factor Structure Matrix...................................................... 49
3 Self Efficacy Scale- Factor Structure Matrix................................................. 50
4 Scale Descriptive Statistics............................................................................ 51
5 Simple MANOVAs........................................................................................ 54
6 Independent Samples t-test: Gender and Race............................................... 55
7 One-way ANOVA Results............................................................................. 56
8 Nonparametric Correlations (Kandall’s tau).................................................. 57
9 Multiple Regression Results: Mentoring Scale.............................................. 58
10 Multiple Regression Results: Self Efficacy General/Enacting Scale............. 59
11 Multiple Regression Results: Self Efficacy Data Use Scale.......................... 60
12 Multiple Regression Results: Self Efficacy Positive Culture Scale............... 61
x
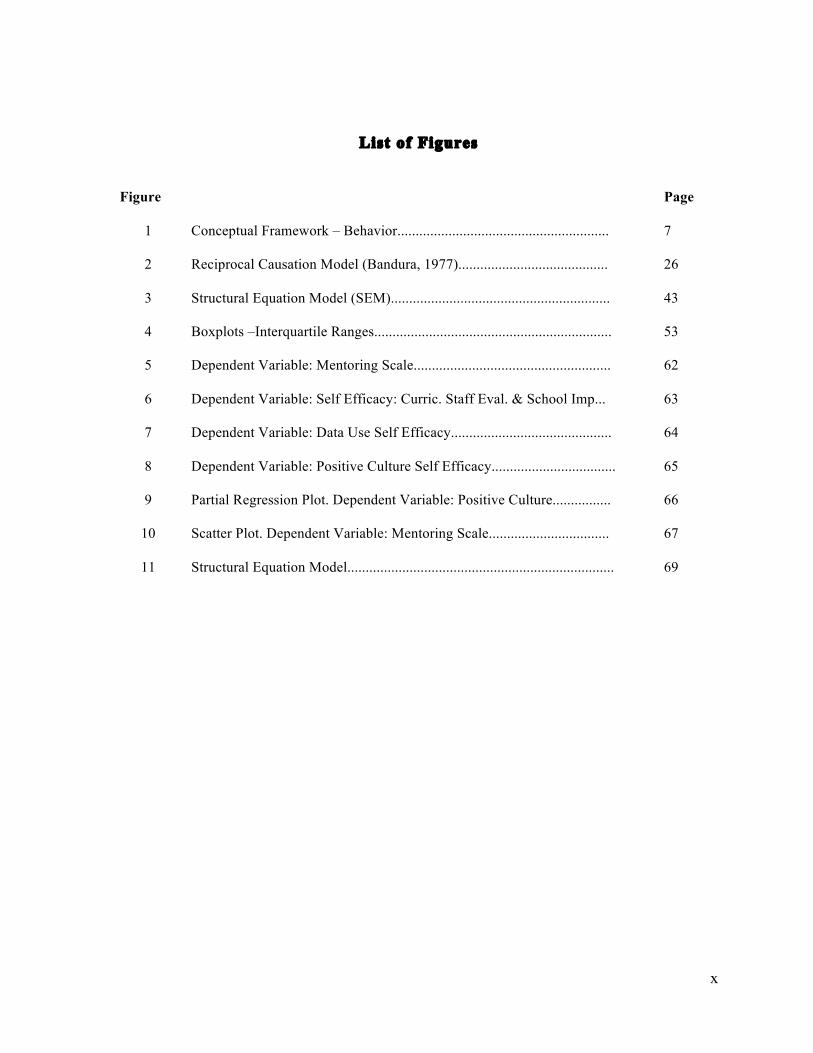
List of Figures
Figure Page
1 Conceptual Framework – Behavior.......................................................... 7
2 Reciprocal Causation Model (Bandura, 1977)......................................... 26
3 Structural Equation Model (SEM)............................................................ 43
4 Boxplots ‒Interquartile Ranges................................................................. 53
5 Dependent Variable: Mentoring Scale...................................................... 62
6 Dependent Variable: Self Efficacy: Curric. Staff Eval. & School Imp...
63
7 Dependent Variable: Data Use Self Efficacy............................................ 64
8 Dependent Variable: Positive Culture Self Efficacy.................................. 65
9 Partial Regression Plot. Dependent Variable: Positive Culture................ 66
10 Scatter Plot. Dependent Variable: Mentoring Scale................................. 67
11 Structural Equation Model......................................................................... 69
Chapter One–Research Problem
Introduction
The role of the school leader has changed drastically over the past 20 years. School
reform efforts can be traced back to the development of public schools; however, more
intensive reform began in the United States in 1983 with the publication, A Nation at Risk
(Goldberg & Harvey, 1983), submitted by the National Commission on Education. This
report identified deficiencies in the U.S. educational system compared to other countries
around the world, which led to standardization. Although many states began to expand
required state assessments and increase graduation requirements, these futile attempts to
reform education were not reflected in the achievement data.
President Bill Clinton signed the Goals 2000 Educate America Act into law on
March 31, 1994 just after the passing of the Improving America’s Schools Act and the
reauthorization of the Elementary Secondary Education Act. The purpose of the Goals 2000
law was to identify and establish National Education Goals to be met by the year 2000.
These goals were more inclusive of all aspects of education to reach the whole child,
focusing on school readiness, school completion, student achievement and citizenship,
teacher education and professional development, math and science, adult literacy and life-
long learning, safe and drug free schools, and parent involvement (U.S. Department of Ed.,
1983b). The U.S. Department of Education urged states to respond and become more
involved in their schools. In response, state politicians and policy-makers began many
reform initiatives at the state level (McCarthy & Hall, 1989).
Many states began to refine their standards and expectations for student performance.
The newly formed U.S. Department of Education began to approve subject area content

2
standards across the United States. The states also reformed their assessments and began to
focus on collecting more data from their schools. As a result, the states were becoming very
proficient in large-scale administration of tests. Although progress was being made toward
standardization, the results from the federal government’s perspective were still not at a
desirable level. Thus, on January 8, 2002 President George W. Bush signed into law the No
Child Left Behind Act of 2001 (NCLB of 2001.20. U.S.C. 6319), which changed education
in many ways. A new accountability measure was placed on states and schools, with funding
tied to performance. The pressure that NCLB put on states and local school districts to
perform required highly qualified teachers to deliver high quality instruction every day to
every student. Further, this movement, tied to teacher evaluation and performance, required
school leaders to be proficient in all aspects of education (Linn, Baker, & Bettebenner, 2002).
Prior to this period of nation-wide educational reform, the school leader served as a manager
and problem-solver for schools and served to protect the technical core of the school. With
educational reform, the technical core was subjected to microscopic scrutiny like never
before. A new skill set required building leaders to analyze their strengths and weaknesses
and adapt to the reform movement. Today, school leaders must be educational experts who
drive student performance, are data-driven leaders, and highly skilled facilitators of school
improvement.
The Interstate School Leaders Licensure Consortium (ISLLC) developed in 1995
established standards that outlined performance goals for effective leadership (Council of
Chief State School Officers (CCSSO, 1996). Principal preparation programs are currently
assessed by standards of the Educational Leadership Constituent Council (ELCC, developed
for the National Council for Accreditation of Teacher Education (NCATE) under the

3
auspices of the National Policy Board for Educational Administration (NPBE; Shipman,
Queen, & Peel, 2007, p. xi). These standards were revised in 2011 and are similar to the
ISLLC standards developed in 1995 but reflect what a 21st century leader should know and
be able to do.
The increased demands on the building principal motivated the researcher to consider
how a principal’s self-efficacy may impact his or her ability to establish and facilitate
instructional leadership priorities. Albert Bandura (1994) defined self-efficacy as “people’s
beliefs about their capabilities to produce designated levels of performance that exercise
influence over events that affect their lives. Self-efficacy beliefs determine how people feel,
think, motivate themselves, and behave” (p. 71). If a principal perceives a low self-efficacy
in his/her vision for learning and instructional leadership capabilities, is the principal capable
of being an effective leader of a school in the 21st Century?
Problem Statement
In this age of accountability and school reform, the building principal is being asked
to be the instructional leader in the school and is being held responsible for the performance
of students and teachers in the school building. Skilled principals are being sought by many
schools to effect positive instructional change. The skills of 21st century principals must be
centered on instructional leadership and establishing a culture of learning in their schools,
key skills, which are impacted by a principal’s self-efficacy (Tschannen-Moran & Gareis,
2004).
A robust sense of efficacy is necessary to sustain the productive intentional focus and
perseverance of effort needed to succeed at organizational goals (Wood & Bandura, 1989).
Empirical evidence suggested that a principal’s sense of efficacy plays a critical role in

4
meeting the expectations and demands of the position in light of increased responsibility
(Tschannen-Moran & Gareis, 2004). Many variables impact self-efficacy. Bandura (1997)
categorized these constructs as: enactive mastery experiences, vicarious experiences, verbal
persuasion, physiological and affective states, and integration of efficacy information (p. 79).
Determining how perceived self-efficacy is developed and sustained by building principals
provided valuable information to preparation programs and school districts across the
country.
Purpose of the Study
The purpose of this study was to determine if there is a significant relationship
between a principal’s sense of self-efficacy in instructional leadership and his or her
mentoring experiences, or if there is any resulting relationship in a principal’s perceived self-
efficacy in identified instructional leadership categories and gender, school type, experience,
age, educational level, and area of study. Further, the study examined how an increased or
decreased sense of self-efficacy impacts instructional leadership qualities. The study
compared responses of principals on a self-efficacy survey that was focused on instructional
leadership and the level and types of mentoring or mentoring relationships experienced by
these principals.
Significance of the Proposed Inquiry
Most principals can identify mentors who have had an influence in their professional
lives. Does this influence impact their perceived self-efficacy? “Mentoring as a critical
component of more effective leadership development programs is now being implemented in
a large number of university-based administrator pre-service preparation programs across the
U.S.A.” (Daresh, 1995, p. 7). Extreme variability exists in formal and informal mentoring
5
programs across the U. S., and there is controversy about whether a single mentor is
effective, or if multiple mentors have a greater impact on behavior. “Because enhancing
leadership self-efficacy should be an important objective for those responsible for improving
the quality of leadership in school” (Tschannen-Moran & Gareis, 2004, p. 583), attention
should be paid to developing a principal’s sense of self-efficacy. This development could be
enhanced through efficacy expectations and modeling. Social cognitive theory provided
guidance on observational learning and how “most human behavior is learned through
modeling” (Bandura, 1986, p. 47).
Self-efficacy beliefs are constructed from five principal sources of information:
enactive mastery experiences, vicarious experiences, verbal persuasion, physiological and
affective states, and integration of efficacy information (Bandura, 1997). By studying how
mentoring is associated with a principal’s self-efficacy beliefs in relation to instructional
leadership, an establishment of a research-driven mentoring program could result. In
addition, the results of this research added to the current research on self-efficacy in school
leaders and how mentoring programs, both informal and formal, career and psychosocial,
influence perceived self-efficacy.
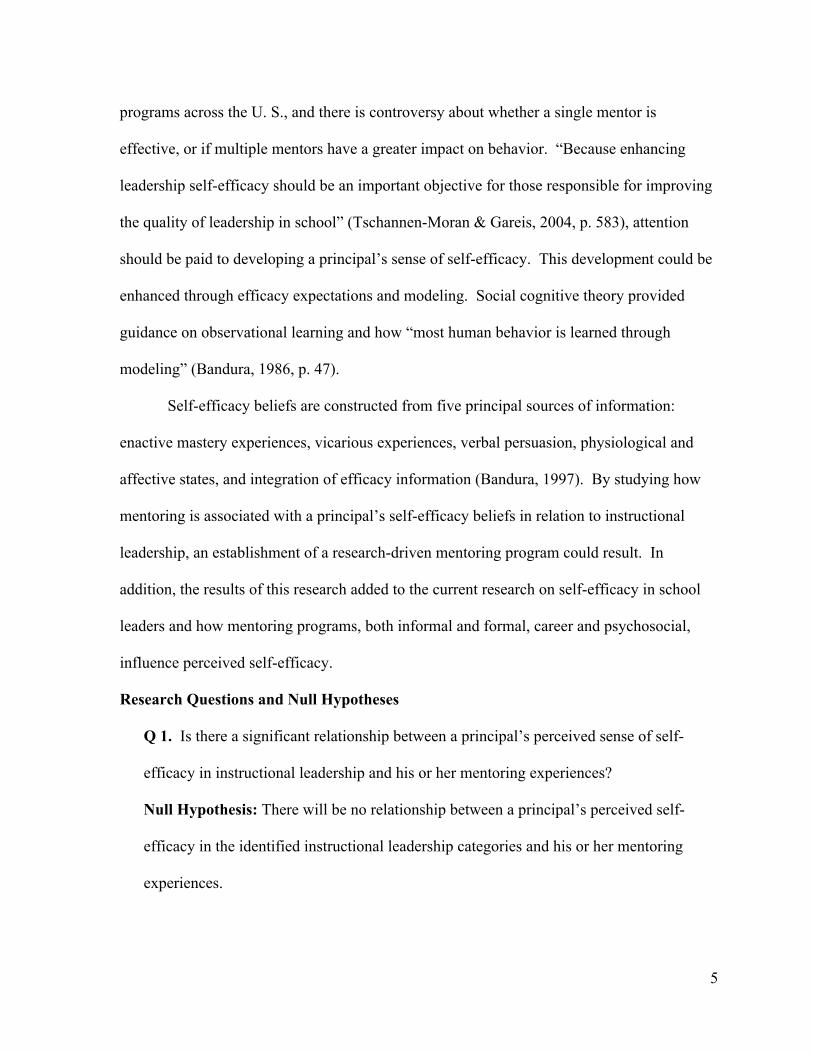
Research Questions and Null Hypotheses
Q 1. Is there a significant relationship between a principal’s perceived sense of self-
efficacy in instructional leadership and his or her mentoring experiences?
Null Hypothesis: There will be no relationship between a principal’s perceived self-
efficacy in the identified instructional leadership categories and his or her mentoring
experiences.
6
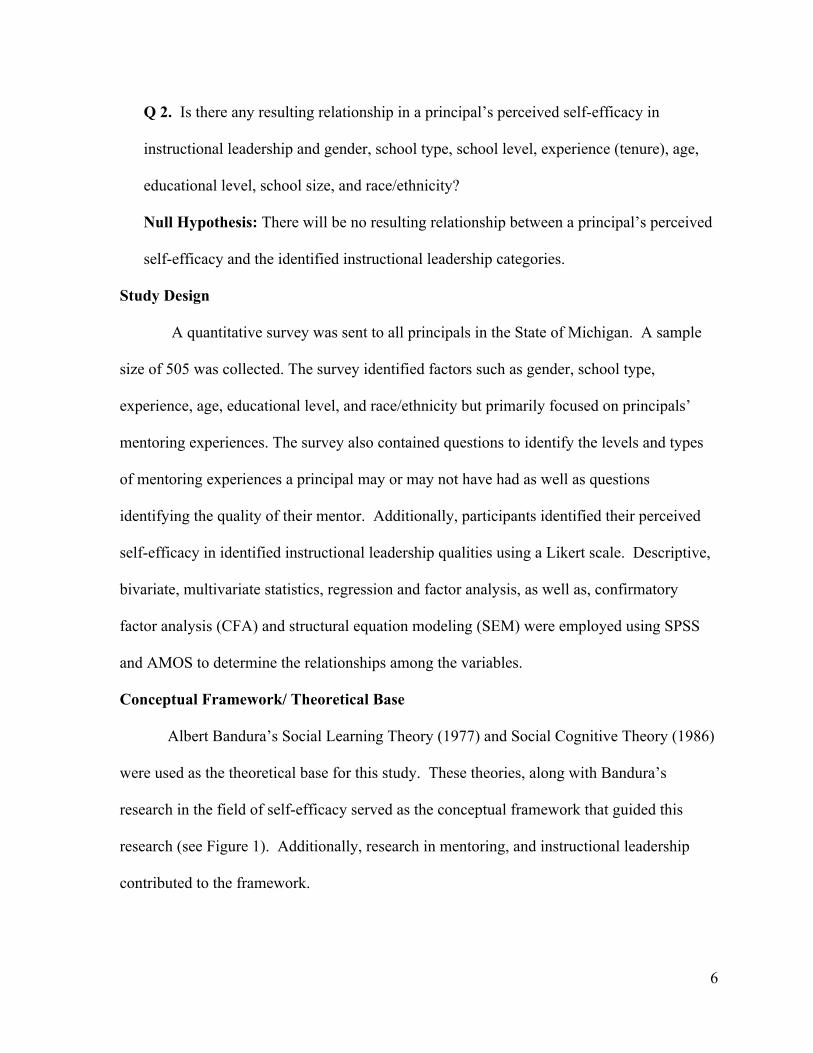
Q 2. Is there any resulting relationship in a principal’s perceived self-efficacy in
instructional leadership and gender, school type, school level, experience (tenure), age,
educational level, school size, and race/ethnicity?
Null Hypothesis: There will be no resulting relationship between a principal’s perceived
self-efficacy and the identified instructional leadership categories.
Study Design
A quantitative survey was sent to all principals in the State of Michigan. A sample
size of 505 was collected. The survey identified factors such as gender, school type,
experience, age, educational level, and race/ethnicity but primarily focused on principals’
mentoring experiences. The survey also contained questions to identify the levels and types
of mentoring experiences a principal may or may not have had as well as questions
identifying the quality of their mentor. Additionally, participants identified their perceived
self-efficacy in identified instructional leadership qualities using a Likert scale. Descriptive,
bivariate, multivariate statistics, regression and factor analysis, as well as, confirmatory
factor analysis (CFA) and structural equation modeling (SEM) were employed using SPSS
and AMOS to determine the relationships among the variables.
Conceptual Framework/ Theoretical Base
Albert Bandura’s Social Learning Theory (1977) and Social Cognitive Theory (1986)
were used as the theoretical base for this study. These theories, along with Bandura’s
research in the field of self-efficacy served as the conceptual framework that guided this
research (see Figure 1). Additionally, research in mentoring, and instructional leadership
contributed to the framework.

7
Influential Factors Instructional Leadership Self-efficacy
Figure 1. Conceptual Framework - Behavior
Self-efficacy
Albert Bandura (1997) defined self-efficacy as the “belief in one’s capabilities to
organize and execute the courses of action required to produce given attainments” (p. 3).
People with high levels of self-efficacy take on new behaviors and tasks with confidence.
Conversely, people with low levels of self-efficacy are unsure and reluctant to take on new
behaviors. Paglis and Green (2002) believed that leader self-efficacy allows managers to
accomplish the following leadership tasks: setting the direction for where the work should be
headed, gaining followers’ commitment to change goals, and overcoming obstacles standing
in the way. Bandura and Locke (2003) posited that levels of motivation and performance
rely heavily on efficacy beliefs. Thus, principals with higher levels of self-efficacy will have
higher levels of motivation and performance.
Knowledge and understanding of Curriculum Staff Evaluation Leading School Improvement Efforts Using Data to Improve Instruction Creating a positive school culture
Mentoring Experience (formal/ Informal, career/ psychosocial) Control for: gender, age, school type, race/ethnicity and experience

8
Instructional Leadership Self-efficacy
A principal’s instructional leadership self-efficacy is determined by the perceived
efficacy beliefs of his or her ability to carry out tasks that involve instructional leadership.
For example, a principal who is not knowledgeable of the curriculum in the various content
areas in their buildings may have a low sense of self-efficacy in this category. This low
sense of self-efficacy may contribute to the principal’s ability to evaluate staff in this area.
“In highly efficacious schools, in addition to serving as administrators, principals are
educational leaders who seek ways to improve instruction” (Bandura, 1997, p. 244). To
create a culture of efficacy in instructional leadership, the principal must be involved. It has
been demonstrated that academic leadership by the principal contributes to teachers’ sense of
instructional efficacy (Coladarci, 1992).
Social Learning Theory and Social Cognitive Theory
Understanding how and why people behave in certain ways is the basis for behavior
theory. “In the social cognitive view, people are neither driven by inner forces or
automatically shaped and controlled by external stimuli. Rather, human functioning is
explained in terms of a model of triadic reciprocity or reciprocal causation model in which
behavior, cognitive and other personal factors, and environmental events all operate as
interacting determinants of each other” (Bandura, 1986, p. 18). In an earlier edition, Bandura
(1977) further described social learning theory as driven by four constructs: direct
experience, observation, modeling, and self-regulatory processes. People learn how to
behave by having direct experience with situations. They learn by the positive and negative
effects that their actions produce. Positive effects reinforce behavior and negative effects
cause people to discard the behavior. People also learn how to behave through modeling.

9
They observe others to help guide new behaviors and reinforce positive outcomes. Positive
mentoring experiences rely on modeling and observation. Self-regulatory processes
contribute to personal behavior by monitoring outcomes based on personal standards
(Bandura, 1986). A person’s ability to self-regulate behavior by combining direct
experience, observation, and modeling with their own internal compass allows the behavior
to be owned.
The owned behavior can be attributed to the variety of experiences in a person’s life.
Many outside factors contribute to a person’s behavior. From a young age, children learn
through the action of those around them. As people develop new knowledge, the circle of
influence grows and behaviors develop based on experiences with a broader range of people.
In education, both informal and formal mentoring programs serve as an influence on
behavior. Malcolm Knowles (2002) described adult learning based on five assumptions: self-
concept, experience, readiness to learn, orientation to learning, and motivation to learn.
These five assumptions are based on the informal experiences that adults acquire as they
mature.
Mentoring
There are many definitions of mentoring in the documented research. “Traditionally,
mentoring is defined in terms of a parental figure who sponsors, guides, and develops a
younger person” (Ehrich, Hansford, & Tennent, 2004, p. 519). “The concept of the
experienced professional as a mentor serving as a wise guide to a younger protégé dates back
to Homer’s Odyssey” (Daresh, 1995, p. 8). More specifically, mentoring has been defined as
a “relationship between an older, more experienced mentor and a younger, less experienced
protégé for the purpose of helping and developing the protégé’s career” (Kram, 1985;
10
Levinson, 1978; Ragins & Kram, 2007, p. 5). This definition is still broadly used today and
was used for the purpose of this study.
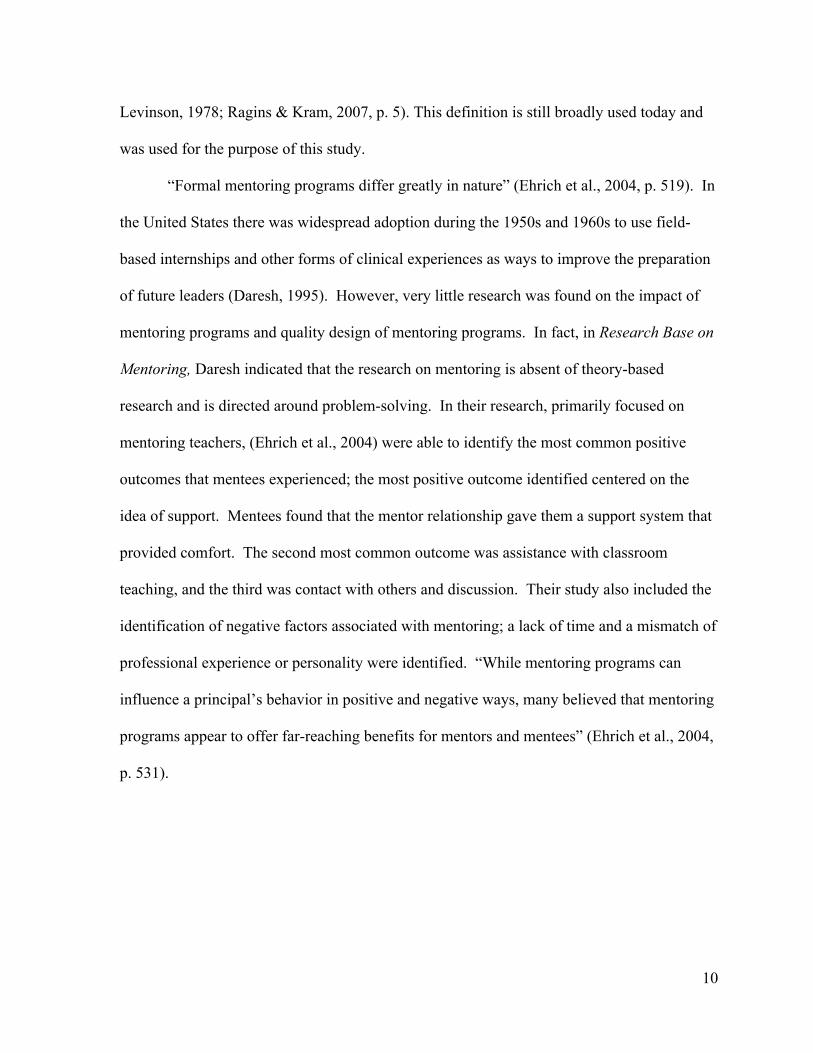
“Formal mentoring programs differ greatly in nature” (Ehrich et al., 2004, p. 519). In
the United States there was widespread adoption during the 1950s and 1960s to use field-
based internships and other forms of clinical experiences as ways to improve the preparation
of future leaders (Daresh, 1995). However, very little research was found on the impact of
mentoring programs and quality design of mentoring programs. In fact, in Research Base on
Mentoring, Daresh indicated that the research on mentoring is absent of theory-based
research and is directed around problem-solving. In their research, primarily focused on
mentoring teachers, (Ehrich et al., 2004) were able to identify the most common positive
outcomes that mentees experienced; the most positive outcome identified centered on the
idea of support. Mentees found that the mentor relationship gave them a support system that
provided comfort. The second most common outcome was assistance with classroom
teaching, and the third was contact with others and discussion. Their study also included the
identification of negative factors associated with mentoring; a lack of time and a mismatch of
professional experience or personality were identified. “While mentoring programs can
influence a principal’s behavior in positive and negative ways, many believed that mentoring
programs appear to offer far-reaching benefits for mentors and mentees” (Ehrich et al., 2004,
p. 531).

11
Operational Definitions
• Social learning theory – “emphasizes the prominent roles played by vicarious,
symbolic, and self-regulatory processes in psychological functioning” (Bandura,
1977, p. vii).
• Social cognitive theory – “People are neither driven by inner forces nor
automatically shaped and controlled by external stimuli. Rather, human functioning
is explained in terms of a model of triadic reciprocality in which behavior, cognitive
and other personal factors, and environmental events all operate as interacting
determinants” (Bandura, 1986, p. 18).
• Self-efficacy – beliefs in one’s capabilities to perform in a given situation (Bandura,
1997).
o Five modalities of influence:
§ Enactive Mastery Experience – The most influential source of self-
efficacy. Successes build self-efficacy and failures undermine self-
efficacy (Bandura, 1997).
§ Vicarious Experiences – Evaluating performance based on the
performance of others in similar situations (Bandura, 1997). A
positive comparison increases self-efficacy.
§ Verbal Persuasion – Confidence in one’s abilities expressed by others,
which contributes to an increased self-efficacy (Bandura, 1997).
§ Physiological and Affective States – Stress levels and negative
thoughts, which can have a negative effect on self-efficacy (Bandura,
1997).

12
§ Integration of Efficacy Information – The weighting of the modalities
to determine the influence each have on behavior; this is very
individualized based on the development of cognitive skills for
processing information. (Bandura, 1997).
• Instructional Leadership – The ability to lead in the identified instructional
categories.
o Curriculum- The formal basis for instruction in a school building.
o Staff Evaluation and Observation – Formal evaluation process and
implementation, as outlined by the school district.
o School Improvement – The process and implementation of school
improvement, as outlined by the school district
o Use of Data – The levels of sophistication of data use at the building level.
o Culture Building – Relationships with students, staff, and fellow
administration.
• Mentoring Relationships‒ (as used in this study) “A relationship between an older,
more experienced mentor and a younger, less experienced protégé for the purpose of
helping and developing the protégé’s career” (Kram, 1985; Levinson, 1978; Ragins &
Kram, 2007, p. 5).
o Formal Mentoring – Established when a formal mentor is typically assigned
as part of a student’s educational program in administration. These mentors
are typically given a set of criteria that the mentees needs to accomplish to
complete their program. Sometimes a school district will assign a mentor to a
new principal.
13
o Informal Mentoring – Established when informal mentors help to guide a
potential principal and, “show them the ropes” of the job. Informal mentoring
relationships are developed over the natural course of a career.
o Career functions – Aspects of the relationship that enhance career
advancement (Kram, 1985).
o Psychosocial Functions – Aspects of the relationship that enhance sense of
competence, identity, and effectiveness in a professional role (Kram, 1985).
Delimitations/Limitations
This study was limited based on the researcher’s assumption that honest answers to
the survey were given in all case, and because the researcher cannot control for the quality of
the mentoring experiences that principals identify. Quality is difficult to quantify. Principals
were asked to rank the quality of their mentoring experiences. With the wide variety of
mentoring definitions and experiences possible, it was difficult to quantify with high
reliability and validity. In addition, the data were collected at one point in time, and the
researcher could not control the quality of responses. Principals have hectic schedules and
may have rushed through the survey. The geography of the research study, which included
participants only in the State of Michigan, presented a delimiting factor. Although the survey
was piloted prior to the administration, a more rigorous validity test for the mentoring and
self-efficacy scales would reveal more detailed results.
Summary
School leadership has become increasingly more complex. That school leaders should
serve as instructional leaders, not just as generic managers, is widely accepted among
educators (Fink & Resnik, 2001). In fact, the Educational Leadership Constituents Council

14
(ELCC) defined the expectations for school leaders in relation to instructional leadership
competencies in the ELCC standards (Fiore, 2004). The movement from manager to
instructional leader has created a gap in behavioral competencies for principals. In this study,
social cognitive/learning theory has been used to identify how these behavioral competencies
impact a principal’s performance in instructional leadership efforts. Further, the theory of
self-efficacy has been applied as it relates to the confidence level a principal feels in the
identified instructional leadership competencies: curriculum, staff evaluation, school
improvement, use of data, and building school culture.
Mentoring can impact a principal’s self-efficacy in positive ways. In well-structured
mentoring programs, the mentor and protégé mutually commit to work together toward an
individually tailored development plan (Daresh, 2001). Psychosocial functions of mentoring
enhance a sense of competence, identity, and effectiveness in a professional role, and career
functions enhance career advancement. This study examined how mentoring and mentoring
relationships impact a principal’s self-efficacy in instructional leadership competencies. A
thorough review of the literature, a description of the methods employed, and the results are
included in the study.

15
Chapter Two–Literature Review
Principals of the 21st Century are required to be instructional leaders. School reform
efforts and accountability measures have placed the principal at the forefront of achievement
results in their schools. A principal’s sense of self-efficacy is a judgment of his or her
capabilities to structure a particular course of action to produce desired outcomes in the
school he or she leads (Bandura, 1997). Several factors that may contribute to self-efficacy
will be considered; however, mentoring relationships will be the primary focus of this study.
Self-efficacy is a central element in social cognitive theory (Bandura, 1986). A person’s
behavior is can be said to be dependent on his or her perceived self-efficacy. A principal
with a low sense of self-efficacy in instructional leadership would be likely to avoid this type
of leadership, opting instead for a more managerial leadership style. Conversely, a principal
with a high sense of self-efficacy in instructional leadership may lead instructionally and less
managerially. Leadership behavior is discussed in Chapter Two as well as the theories of
social cognition, social learning, and self-efficacy, and factors that may contribute to a
principal’s perceived self-efficacy.
Instructional Leadership
The role of the leader in schools has changed over the past 15 years. Strong
leadership in schools is said to have a positive impact on student achievement and school
improvement. Unfortunately, the variety of demands placed on school leaders has grown by
mammoth proportions as described by Hess and Kelly (2007):
School leaders are front-line managers, the small business executives, the battlefield
commanders charged with leading their team to new levels of effectiveness. In this
new era of accountability where school leaders are expected to demonstrate bottom

16
line results, and use data to drive decisions, the skills and knowledge of principals
matter more than ever. (p. 244)
School reform efforts and the standards movement have paved the way for principals
to acquire a sophisticated skill set. School leaders, who were once masters of a managerial
skill set, now need to understand how instructional leadership fits into their practice. In
addition to instructional responsibilities, much of the literature on principal leadership
suggested that “principals should acquire the skills that remedy all of the defects of the
schools in which they work” (Elmore, 2000, p. 14).
Studies have shown that a direct link exists between principal leadership behavior and
student achievement (Hallinger & Heck, 1998). Further, learning leaders can have a positive
impact on their staffs by modeling learning behaviors. “If principals want students and
teachers to take learning seriously, if they are interested in building a community of learners,
they must not only be head teachers, headmasters, or instructional leaders, they must, above
all be head learners” (Barth, 1990, p. 72).
There is an abundance of research in the area of instructional leadership (Blase &
Blase, 1999; DuFour, 2002; Barth, 1990; Fink & Resnik, 2001; Glickman, Gordon, & Ross-
Gordon, 2004; Hallinger & Heck, 1998; Hallinger, 2005; Liu, 1984; Spillane, Halverson, &
Diamond, 2004). A meta-analysis of the research led to the identification of the five
categories of instructional leadership used in this study: curriculum, staff
evaluation/observation, implementation of school improvement, use of data to improve
instruction, and building relationships and a positive school culture.
Research of Blase and Blase (1999) on principal instructional leadership from a
teacher’s perspective identified two broad areas that positively impact the instructional

17
leadership in the school: talking with teachers to promote reflection and promoting
professional growth. Principals have opportunities to work with their teachers to promote
reflection and professional growth in the evaluation process. Talking with teachers about
curriculum, instruction, and assessment takes time and a broad skill set. However, if the
principal does not have high-perceived self-efficacy in observation, evaluation, curriculum,
instruction, and assessment, he or she may not be able to effectively impact teachers to
promote reflection and professional growth.
DuFour, (2002) discussed the movement from instructional leader to lead learner in
his article, The Learning-Centered Principal. He contended that principals need to work with
their teachers to evaluate the inputs (students) and design instructional strategies and
programs around the inputs instead of focusing on the strategies and programs first.
Principals who do not have the knowledge and efficacy in evaluation and assessment may be
at a disadvantage when working with their teachers to evaluate their inputs and assist in
designing instructional strategies. (Barth, 2002) supported this construct by advocating for
principals to be the head learner in their institutions. He claimed that by focusing on their
own learning, principals can better serve those they lead. Barth also believed that leaders
who are not learning cannot lead a learning community.
Barth (1990) contended that principals who create a climate conducive to shared
leadership and decision-making promote positive relationships and a positive school culture.
He believed that great leaders have vision and the ability to rally their staff around this
vision. Leaders who are used to leading with a managerial skill set may find it difficult to let
go and lead collaboratively.

18
Fink and Resnik (2001) suggested that principals who are intentionally mentored and
given professional development support through a network of leaders are able to effectively
improve schools instructionally. The mentoring experience provides principals with a
support network that contributes to their self-efficacy when working to instructionally
improve their school. This would imply that principals who are not intentionally mentored
may not have a feeling of support, thus contributing to a low self-efficacy in this area
Glickman (2002) believed that certain structures enhance teaching and learning:
clinical supervision, peer coaching, critical friends, and classroom action research teams or
study groups. He believed that a leader is able to develop teacher leaders through
collaboration. In addition, Glickman et al. (2004) promoted the idea that instructional leaders
must know their clientele. They must be able to assist in teacher development that impacts
all teachers with varying characteristics. Thus, the principals must know each teacher in a
way that allows them to diversify their strategies for teacher development. Principals with
low self-efficacy in developing and maintaining a professional support network for their
teachers may have difficulty leading professional development efforts.
Hallinger and Murphy (1987) defined instructional leadership in three broad
categories: leaders define the mission of the school, manage curriculum and instruction, and
promote school climate. Further, Hallinger, Leithwood, and Murphy (1993) brought several
perspectives together in their book, Cognitive Perspectives on Educational Leadership. The
common theme is that effective educational leaders are highly skilled problem-solvers, who
develop expertise in leadership through reflective processes and study. Leaders who model
reflective processes, impact those with whom they work. Teachers see the value in reflection

19
from their leader and may begin to use reflection to improve their instructional practices in
the classroom.
Liu (1984) used two categories to define instructional leadership: direct and indirect.
He defined direct leadership activities as staff development and teacher evaluation and
monitoring and indirect activities as facilitating instruction, resource acquisition and building
maintenance, and resolution of student problems. The direct leadership activities most
closely align with improving instruction whereas the indirect activities tend to fall under the
managerial tasks. Although both are important to a school organization’s health, the leader
needs to understand how to balance these activities effectively. Having a stronger sense of
self-efficacy in the direct activities may result in a weak implementation of the indirect
activities and vice-versa.
Spillane et al. (2004) synthesized the research on instructional leadership at a macro
level into six functions: vision, culture, resource acquisition, teacher growth, monitoring
instruction, and school climate. Their research further supported the instructional leadership
categories identified in this study.
Five leadership categories will be explored in this study as a result of the meta-
analysis: knowledge and understanding of curriculum, staff evaluation and observation,
leading school improvement efforts, using data to improve instruction, and creating a positive
school culture. These categories were identified based on the cross analysis of the research
identified in this chapter.
Knowledge of curriculum. A principal’s role in curriculum development,
management, and monitoring has grown with the standard’s movement. School principals
should understand the curriculum and monitor the horizontal and vertical alignment of the

20
curriculum in their buildings. They need to be able to evaluate data on assessments to
determine weak areas in the curriculum and work with central office administrators to
modify curriculum to meet the needs of their students. In addition, a documented curriculum
is generally very different from an operational curriculum. Principals need to monitor the
operational curriculum taught in their buildings to determine consistency in implementation.
This is largely done through formal and informal observations and curricular conversations
with staff. Fiore (2004) stated that in order to turn schools around, principals must have an
understanding of the curriculum that guides classroom instruction.
Staff evaluation and observation. Principals are responsible for performing
observations and evaluating their instructional staff. These evaluations are required and
intended to keep highly qualified teachers in the classroom. It is necessary for skilled
principals to focus on improvement in these evaluations. Quality observations and debriefing
sessions are components of the evaluation process. Most recently, a value-added approach to
teacher evaluation has surfaced. The value-added model is one in which teachers are
evaluated based on student achievement growth. This has been a controversial component of
many evaluation programs across the United States.
Quality conversations regarding observations and student growth rely heavily on
trust. Principals must have a trusting relationship with their staff to be able to make
instructional improvements in teaching practice. “Trust allows individuals to focus on the
task at hand and, therefore, to work and learn more effectively” (Tschannen-Moran & Hoy,
1998, p. 341).
Many schools are adopting or creating frameworks or rubrics to be used in teacher
evaluation. Enhancing Professional Practice, a Framework for Teaching, by Charlotte
21
Danielson (2007) has been a popular model with schools across the United States. “In this
framework, the complex activity of teaching is divided into 22 components clustered into the
following four domains of teaching responsibility” (p. 1).
Domain 1: Planning and Preparation
Domain 2: The Classroom Environment
Domain 3: Instruction
Domain 4: Professional Responsibilities
In order for principals to effectively evaluate teachers, they need to be skilled in all
evaluation components.
Leading school improvement. School improvement has been a focus in public
education for decades. Accreditation programs responded by offering the ability to be
accredited by their agencies if schools met their standards. North Central Accreditation
(NCA) is a well-known accreditation system. Schools and districts that complete the NCA
process have developed goals and strategies based on data to improve their organizations.
They have also participated in an on-site external review of the system. The on-site
accreditation team reviews the organization against the identified standards. The standards
for NCA accreditation are based on research on effective schools and school systems
(AdvancEd, 2012).
Standard 1: Vision and Purpose
Standard 2: Governance and Leadership
Standard 3: Teaching and Learning
Standard 4: Documenting and Using Results
Standard 5: Resources and Support Systems

22
Standard 6: Stakeholder Communications and Relationships
Standard 7: Continuous Improvement
Many states have their own accreditation systems through their departments of
education. Schools are held accountable for submitting their school improvement plans to
the state department of education, and many plans are used to justify grant expenditures. To
effectively create, implement, and monitor school improvement plans, school principals must
have a high level of knowledge about the process and be able to work collaboratively with
their faculty. The school improvement field has consistently supported the importance of
building capacity for change (Hopkins & Jackson, 2003), and principals who lead more
managerially may not feel confident sharing leadership with their staff.
Using data to improve instruction. To be an instructional leader, school principals
must use student achievement data and understand how to make these data meaningful for
their staff. The standards movement made it essential for principals to understand the
curriculum and how it is articulated across and through grades, courses, and content areas. It
also prompted school leaders to begin discussing how the curriculum would be assessed.
Data-driven decision-making became a household word for schools around the country.
Today, assessment is the focus for schools in all aspects of their operation. More stringent
external accountability systems have forced schools to look at internal accountability systems
and question how they align to school operations. Multiple forms of assessment are being
used and taught to educators, principals, and administrators all over the world. Formative
assessment, summative assessment, benchmark assessment, common assessment, state
assessment, national assessment, and other terms of measurement are primary foci in schools

23
today. Principals and teachers have been so focused on score improvement by their students
that they have resorted to quick fixes instead of foundational learning (Senge, 2000).
Additionally, teacher evaluation systems are including the value-added model,
which uses student achievement to determine the teacher’s value, instructionally. This
practice has caused teachers to begin to use data differently. With the external accountability
systems at new heights, principals are required to be able to not only use data for student
achievement and to inform instruction but also to use data to evaluate their staff, establish
school improvement goals, and to monitor equity and consistency in curriculum
implementation. According to Wilson (2004) developing coherent accountability systems
depends on establishing a two-way information flow connecting classroom practice and
external accountability measures. Principals are responsible for their own learning regarding
the use of data and they are responsible for making sure their staff understands what data are
relevant, how to use them instructionally, and how to communicate them to parents.
“Effective teachers must see themselves not as passive dependent implementers of someone
else’s script but active members of research teams” (Schmoker, 2004, p. 225). These teams
must include a collaborative effort with the principal as a leader in this area.
Building a positive school culture. Building relationships and a positive school
culture creates an environment that is conducive to learning. School principals are
instrumental in setting the tone in their building. “Three themes surfaced in a study
conducted to determine what teachers would say about what the principals do at their schools
to create and encourage the positive school climate: respecting students, communicating with
students, and supporting students” (Harris & Lowery, 2002, p. 64).
24
Important to this ideal is establishing relationships between students and teachers,
teachers and principals, teachers and their colleagues, and students and principals.
Additionally, an environment that is safe and welcoming to families and community
members helps to create a positive school culture. Establishing a positive school culture
requires the principal to be an effective communicator and listener. Teachers must be able to
trust the principal and their colleagues to effectively work in a collaborative manner (Hoy,
Tarter, & Kottencamp, 1991).
Self-efficacy and Social Learning/Social Cognitive Theory
Self-efficacy. “Perceived self-efficacy refers to the beliefs in one’s capabilities to
organize and execute the courses of action required to produce given attainments” (Bandura,
1925, p. 3). In other words, self-efficacy is defined as the belief in one’s ability to
accomplish a specific task and produce a desired outcome. Principals with a high sense of
self-efficacy will typically out-perform those with a low sense of self-efficacy. “It is a
principal’s self-perceived capability to perform the cognitive and behavioral functions
necessary to regulate group processes in relation to goal achievement” (McCormick, 2001, p.
30). Self-efficacy beliefs are an element of social cognitive theory (Bandura, 1977, 1986,
1997). Self-efficacy is further defined within the context of social cognitive/learning theory.
Instructional leadership self-efficacy. Instructional leadership self-efficacy differs
from self-efficacy in that we are specifically identifying how efficacious a principal is in the
instructional leadership behaviors outlined in this study. The researcher identified how
efficacious principals are in each of the categories: knowledge of curriculum, staff
evaluation/observation, leading school improvement efforts, using data to improve
instruction, and creating a positive school culture and then correlated this with their
25
mentoring experience and other factors that may contribute to their self-efficacy. Although
principals can have high levels of self-efficacy in general, they may not exhibit these
behaviors when they are involved in instructional leadership. If principals learn through
mastery experiences, vicarious experiences, verbal persuasion, physiological and affective
states, and the integration of efficacy information, one may conclude that the level of these
experiences through formal and informal mentoring may impact their self-efficacy in the
identified categories. Additionally, if a principal responds to the career and psychosocial
aspects of mentoring they may have high levels of self-efficacy in certain leadership
characteristics.
Social learning / social cognitive theory. In the social cognitive view, people are
shaped by their inner being but are also shaped by external forces. Social cognitive theory
built upon Bandura’s (1977) social learning theory, which championed the idea that people
can learn by observing the behavior of others. Modeling is an important aspect of learning in
social learning theory. By observing other people and their social cues, people imitate
behavior, thus learning from modeled behavior. Additionally, symbols are used as a means
of explaining learning. “The capacity to use symbols provides humans with a powerful
means of dealing with their environment” (Bandura, 1977, p. 13). In addition, included in
social learning theory is the idea that people can control their own behaviors. This is referred
to as self-regulatory capacities. This control allows people to draw on their experiences,
observations, and modeling and to process their thoughts before they act. They are able to
self-reflect on previous decisions and apply this to their actions. Another important aspect of
social learning theory is reciprocal determinism, which proposed the idea that the personal,
behavioral and environmental condition work together continuously to induce behavior. The
26
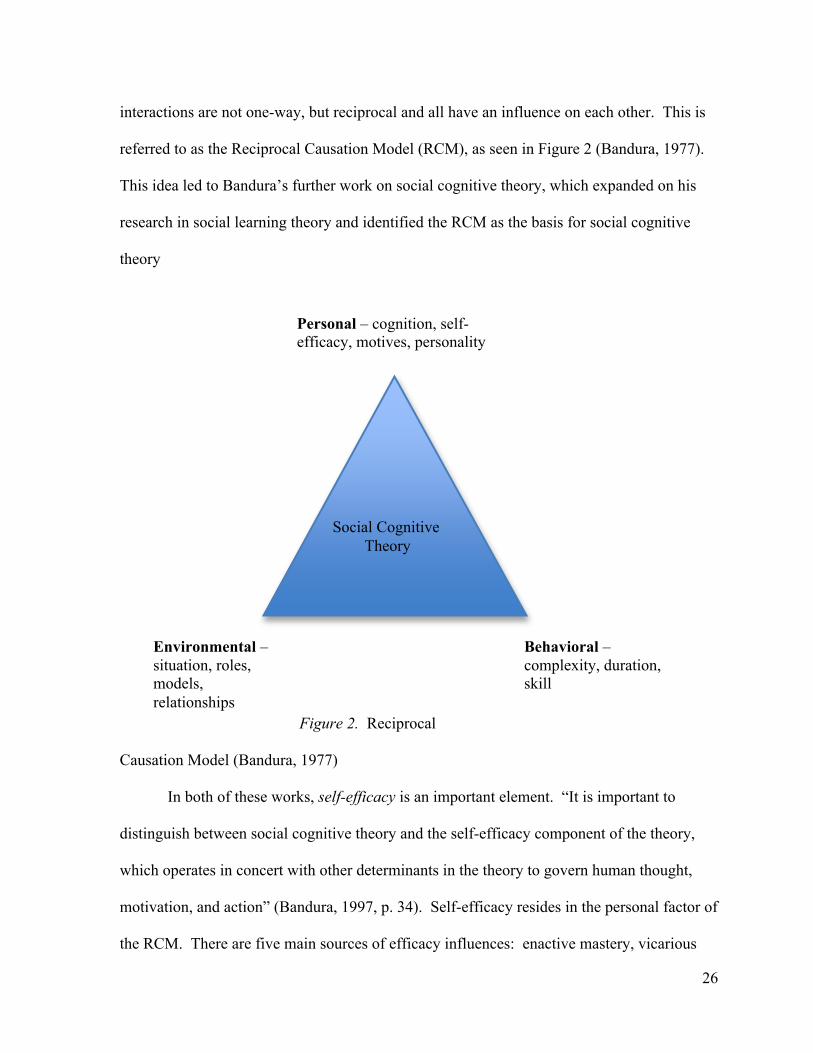
interactions are not one-way, but reciprocal and all have an influence on each other. This is
referred to as the Reciprocal Causation Model (RCM), as seen in Figure 2 (Bandura, 1977).
This idea led to Bandura’s further work on social cognitive theory, which expanded on his
research in social learning theory and identified the RCM as the basis for social cognitive
theory
Figure 2. Reciprocal
Causation Model (Bandura, 1977)
In both of these works, self-efficacy is an important element. “It is important to
distinguish between social cognitive theory and the self-efficacy component of the theory,
which operates in concert with other determinants in the theory to govern human thought,
motivation, and action” (Bandura, 1997, p. 34). Self-efficacy resides in the personal factor of
the RCM. There are five main sources of efficacy influences: enactive mastery, vicarious
Personal – cognition, self-efficacy, motives, personality
Environmental – situation, roles, models, relationships
Behavioral – complexity, duration, skill
Social Cognitive Theory
27
experience, verbal persuasion, physiological and affective states, and the integration of
efficacy information.
Enactive mastery. Enactive mastery is the idea that people who experience success
tend to have a higher level of self-efficacy than people who experience failure. Even greater,
if a person experiences success after having gone through difficulties, he or she tends to have
an even greater sense of self-efficacy. “If people experience only easy successes they come
to expect quick results and are easily discouraged by failure” (Bandura, 1997, p. 80). High-
level gymnasts work to master a skill only to be given another skill out of their reach to
master again. Those who experience success easily will have a more difficult time
conquering more difficult tasks when they fail. As the gymnast experiences adversity in
conquering the skills, they acquire the knowledge needed to be successful on future attempts,
unless they give up. “Mastery of difficult tasks conveys new efficacy information for raising
one’s beliefs in one’s capabilities” (p. 83). Enactive mastery is reliant upon success.
Vicarious experience. Vicarious experience is the ability of one to learn through the
actions of others; this is considered modeling. Self-efficacy beliefs can be reinforced if a
person witnesses another person’s behavior and compares it to his or her own. “People
appraise their own capabilities in relation to the attainments of others” (Bandura, 1997, p.
86). “Through their behavior and expressed ways of thinking, competent models transmit
knowledge and teach observers effective skills and strategies for managing environmental
demands” (Bandura, 1994, p. 72).
There are many vicarious modes of influence: effective actual modeling, symbolic
modeling, videotaped self-modeling or cognitive self-modeling. People compare themselves
to others to help determine their success or failure in a particular attainment. This is effective
28
actual modeling. If the model is more closely aligned with their abilities they are more likely
to feel more efficacious over the attainment. Conversely, if people see the models as very
different from themselves they are not particularly influenced by the behavior (Bandura,
1997).
Models can demonstrate the success of certain tasks, which will contribute to the
observer’s sense of efficacy over these tasks, especially if the model closely compares to the
observer. Sometimes observed failure can raise the self-efficacy of an observer, especially if
they can learn from what the model has done incorrectly. Symbolic modeling can come in
the form of observing others through media and learning from their successes or failures.
With the increased availability of information through technology, symbolic modeling is
available quickly and easily. Observers no longer have to directly experience the vicarious
learning but can watch it on television or through the Internet. Self-modeling can be used by
videotaping oneself and learning from reviewing the video. Athletes use this form of
vicarious learning to determine flaws in their form. For example, back to the high-level
gymnast; suppose the observing gymnast noticed another gymnast fail on a particular skill
because of an incorrect body position. The observing gymnast may learn from this mistake
and feel more efficacious over the task than they were prior to the observed behavior. By the
same token, observing a higher-level gymnast struggle with a particular task may contribute
to a lower sense of self-efficacy by the lower-level observer because they may feel that if the
more skilled gymnast cannot execute the skill successfully, the observer will also expect to
fail. This same gymnast may learn from watching a video of another gymnast across the
world or by viewing their own performance through video; all contribute to a person’s ability
to become more or less efficacious over their own behaviors.
29
Verbal persuasion. Verbal persuasion refers to the idea that people are more likely to
believe in themselves if others believe in their abilities as well; this can come in the form of
verbal persuasion. “People who are persuaded verbally that they possess the capabilities to
master given tasks are likely to mobilize greater effort and sustain it than if they harbor self-
doubts and dwell on personal deficiencies when difficulties arise” (Bandura, 1997, p. 101).
Feedback is the common mechanism for receiving verbal persuasion. Jourdan (1991) found
that when participants received feedback on attainments, as it relates to a percentage
accomplished toward the attainment, they were more efficacious than when they received
feedback on how far they had to go to achieve the attainment. Criticisms tend to lower self-
efficacy while positive reinforcement increases self-efficacy. Sometimes a negative verbal
persuasion may be discounted if the person being evaluated does not believe that the
evaluator has the knowledge and ability to judge his or her performance. This is particular
important in the principal/teacher relationship. Verbal persuasion in itself cannot be the sole
component of developing self-efficacy but should be used in combination with the other
efficacy influences. The gymnast receives verbal persuasion when they are evaluated at their
competition by the judges, which affirms or disaffirms their behavior. The feedback they
receive can alter their self-efficacy by diminishing it by low scores or by supporting it with
high scores.
Physiological and affective states. Self-efficacy can be influenced by physiological
and affective states. If people feel stress, they may relate these feelings to poor performance,
which ultimately impacts self-efficacy. Mood is another determiner of efficacy as it relates to
physiological and affective states. Mood also affects people’s judgments of their personal
efficacy. Experiencing success while in a positive mood promotes a high-level of perceived
30
self-efficacy, whereas failures while in a negative mood breed low-levels of perceived self-
efficacy (Wright & Mischel, 1982). “Positive mood enhances perceived self-efficacy and a
despondent mood diminishes it” (Bandura, 1994, p. 72).
Some people interpret their stress as a positive motivator for performance, whereas
others, typically those with low self-efficacy, interpret their stress as a preliminary to failure.
It all depends on their past experiences with the type of stress they feel. Physiological and
affective states do not contribute to our self-efficacy alone but are key indicators that prompt
our reactions and interpretations of these states that influences self-efficacy. Because
everyone reacts to stressful situations differently, it is important for the person to understand
and know their own body in terms of the physiological changes that occur in these situations.
To continue our comparison to the gymnast, some gymnasts may experience shortness of
breath or shaking prior to a performance on the balance beam but, after they begin, these
reactions go away. It is important that this gymnast knows that this is how his or her body
reacts and will be more efficacious because of the knowledge of his or her affective state in
this situation.
Integration of efficacy information. The fifth source of efficacy influence refers to
how a person integrates the four other influences to determine their efficacy judgments. How
a person uses the information retrieved from the other efficacy sources differs depending on
how much value they place on each, how they interpret their interrelatedness, and how they
weight each influence.
31
Contributing Factors
Several factors may contribute to the results of the self-efficacy survey. A principal’s
mentoring experiences along with their personal and school demographics may influence
their ratings in the self-efficacy portion of the survey.
Mentoring influences. The definition of mentoring as used in this study has been
identified as a “relationship between an older, more experienced mentor and a younger, less
experienced protégé for the purpose of helping and developing the protégé’s career” (Kram,
1985; Levinson, 1978; Ragins & Kram, 2007, p. 5).
The seminal research on mentoring dated back to 1978 with the publication of, The
Seasons of a Man’s Life, by Daniel J. Levinson (1978). This book was based on a 10-year
study that identifies a theory of adult development as Levinson and his colleagues studied the
root issues of adult life. They attempted to answer the questions: What are the essential
problems and satisfactions, the sources of disappointment, grief and fulfillment? Is there an
underlying order in the progression of our lives over the adult year, as there is in childhood
and adolescence? While researching the phases and transgressions of adulthood, Levinson
found that a man’s relationships with other people greatly influence the man he will become.
Levinson talked about the variety of relationships at different stages of a man’s life and the
importance these relationships play on his development. Kathy Kram (1985) built upon this
idea and studied relationships further as they pertained to the work life in her book,
Mentoring at Work. Kram looked at mentoring relationships in the context of a junior and
senior manager in a corporate setting. What she found inspired her to continue to research
mentoring relationships in a broader context. She discovered that mentors serve two distinct
functions: career functions and psychosocial functions. Career functions involve a range of

32
behavior that helps protégés learn the ropes and prepare them for hierarchical advancement
within their organizations. “Psychosocial functions build on trust, intimacy, and
interpersonal bonds in a relationship and include behaviors that enhance the protégé’s
professional and personal growth, identity, self-worth, and self-efficacy” (Ragins & Kram,
2007, p. 5).
More specifically career functions are those that enhance career advancement.
“Mentors provide sponsorship, exposure, coaching, protection, and challenging assignments”
(Kram, 1985, p. 23). According to Kram, mentors who provide sponsorship express
confidence in the protégé’s abilities. The sponsorship gives them credibility so that others
see them as a leader. Exposure and visibility are also benefits that a protégé might gain from
a mentoring relationship. As protégés are given responsibility, others see them as leaders and
managers. Mentors also coach their protégés. This function allows junior managers to learn
from their mentors and seek advice from them while feeling support as they learn new
aspects of their career. In addition, the mentor provides protection to their protégé; mentors
guide the protégé but take full responsibility for the protégé’s actions while under the
mentor’s guise. Finally, career function mentors provide their protégés with challenging
assignments. These assignments give the protégé an opportunity to show that they are ready
for a career change. Experience in leading or carrying out challenging assignments
demonstrates the capabilities of the protégé.
The psychosocial function of mentoring, according to Kram (1985), consists of role
modeling, acceptance and confirmation, counseling and friendship. Contributing to a sense
of self-worth or efficacy, this function seems to align to social learning theory and self-
efficacy theory as outlined by Bandura (1977). Role-modeling provides a protégé with an

33
example of what he or she might become. Protégé’s look up to mentors and have strong
admiration for them. An emotional attachment is formed by the protégé with the mentor
leading to a successful match. Mentors also provide acceptance and confirmation of their
protégés while they learn their position, which leads to a nurturing relationship. When a
protégés feel acceptance and confirmation, they are more likely to see themselves as
individuals and are more willing to express their opinions even if they are not the opinions of
the mentor. Mentors, in the psychosocial function, also serve as counselors to the protégé.
“Junior managers rely on the mentor for counseling when they have personal concerns that
may interfere with a positive sense of self in the organization” (Kram, 1985, p. 36.) Finally,
mentors in the psychosocial function, provide friendship to the protégé. These friendships
allow protégés to feel accepted by the organization and more comfortable as they learn the
aspects of their career. Although, Kram’s (1985) work is not specifically focused on
educational institutions, it is the most prominent work on mentoring to be found in the
literature. There are significant parallels to her work on mentoring in a corporate setting and
mentoring for principals.
Daresh and Playko (1990) supported mentoring as a vital part of a principal’s
developmental process. Does mentoring impact a principal’s self-efficacy? Considering the
efficacy influences outlined in this paper, one would tend to believe that principals who have
an informal or formal mentor or multiple mentor relationships would be exposed to vicarious
experiences that may influence their self-efficacy.
Mentoring is used in school districts in a variety of ways. Some school districts have
formal mentoring programs in which new administrators are assigned a formal mentor to
help guide them as they learn the numerous tasks involved in a principalship. Some school

34
districts do not follow a formal mentoring process but provide support to their new principals
through an informal mentoring process. The informal mentoring process may involve
identifying several individuals who may provide support without the identification of one
particular mentor. Informal mentors may also be identified as friends; formal mentors are
typically assigned and may or may not be considered a friend. Whereas both are valuable, it
is important to consider the mentor in the relationship as much as the mentee. In their study,
Daresh and Playko (1990) identified important characteristics for effective mentors and noted
that not all experienced administrators are capable of serving as mentors. The most
important characteristics for effective mentors are the following:
• Mentors need to be able to ask the right questions of candidates and not just provide
the right answers all the time
• Mentors must accept another way of doing things and avoid the temptation to tell
candidates that the right way to do something is the way I used to do it.
• Mentors should express the desire to see people go beyond their present levels of
performance, even if it might mean that they are able to do some things at a higher
level than the mentor.
• Mentors must model the principle of continuous learning and reflection.
The National Board for Educational Leadership and Policy Standards outlined the
competencies that are required of administrators in the Education Leadership Program
Standards of the Educational Leadership Constituent Council (ELCC),
(http://npbea.org/2012/06/2011-elcc-building-level-standards/). The national board also
recognized that “states can do much more to create standards-based mentoring programs for
educational leaders “(Council for Chief State School Officers, 2008, p. 17). It is important to
35
distinguish the process by which mentors are used. A formal mentor is typically assigned as
part of a student’s educational program in administration. These mentors are typically given a
set of criteria that the mentees need to experience to complete their program. Informal
mentors are those who help to guide potential principals and show them the ropes of the job.
The quality of either experience can vary.
Malcolm Knowles (2002) referred to adult learning in much the same way. He
maintained that adults learn both formally and informally. Formal avenues for learning are
characterized by established institutions such as universities, high schools, trade schools, and
those that offer credit toward a degree, whereas informal avenues for learning are
characterized by clubs, community centers, industries, and churches. Further, Knowles
defined informal learning in the form of lectures, forums, clubs, and programs that cost less.
It is important to distinguish the types of mentoring experiences principals have had to
identify a correlation between mentoring and self-efficacy.
“Because mentoring scholars have discovered that different mentoring functions
predict different protégé outcomes” (Ragins & Kram, 2007, p. 5), it would be important to
not only identify whether principals have had a mentoring relationship, but what type of
relationship they have had: career or psychosocial, formal or informal.
In this study, the researcher identified the mentoring experiences of the subjects.
Formal and informal mentoring were defined, and the subjects were given the opportunity to
describe the quality of the mentoring experiences they acquired and rate the value of their
mentoring experiences. Questions were focused on the career and psychosocial functions to
determine any correlation to Kram’s (1985) work on mentoring. Through structural equation
modeling, a correlation between strong mentoring influences, career and/or psychosocial,
36
formal and/or informal, and positive self-efficacy in the area of instructional leadership were
explored.
Gender, school type, school level, race/ethnicity, experience/tenure, age,
educational level, and school size. Although the focus of the study was on the impact of
mentoring and mentoring experiences relative to a principal’s self-efficacy, the researcher
controlled for other variables that may have impacted the results of the survey. A control for
gender allowed the research to examine any extant correlations between gender and self-
efficacy. Males seem to demonstrate a more self-congratulatory attitude when they achieve
something, whereas females tend to be more modest. This observation may suggest that
males have a greater perceived self-efficacy than females (Pajares, 2002), which is why a
control for gender was employed. Age may contribute to a principal’s ranking of self-
efficacy just as it does with academic motivation (Schunk, 2011). Certain age groupings
were found to be more efficacious than others in relation to academic motivation. School
type is also a contributing factor. The wide variety of school types is primarily dependent on
geographic location and academic performance. A correlation between low socioeconomic
status and low academic performance was shown in the research (Sirin, 2005). Principals
working in schools that are located in a low socioeconomic boundary may have similar self-
efficacy rankings. Controlling for levels of experience allowed the researcher to determine
whether experience impacts levels of self-efficacy in the instructional leadership categories.
The researcher also controlled for race/ethnicity to determine if there was a correlation
between this factor and self-efficacy in the sample. Cultural differences may contribute to a
person’s perceived self-efficacy (Scholtz, Gutierrez-Dona, Sud, & Schwarzer, 2002).
Because self-efficacy is partly determined by successful and unsuccessful experiences, one
37
might predict that more experienced principals with a higher level of educational experience
may have a stronger sense of self-efficacy (Bandura, 1997).
Summary
The evolution of the school leader’s role to instructional leader over the past decade
prompted the researcher to consider the impact this has had on thousands of principals across
the state and nation. Social learning theory assisted in understanding how people learn and
how they become efficacious in their behavior. Through social learning and self-efficacy
theories, the researcher sought to understand how mentoring and mentoring relationships
contribute to a principal’s self-efficacy in the identified instructional leadership behaviors.
Although many factors can contribute to an individual’s self-efficacy, the focus on mentoring
was prevalent in the study.
38
Chapter Three – Methods
Introduction
The purpose of this study was to investigate whether there is a significant relationship
between a principal’s sense of self-efficacy in instructional leadership and his or her
mentoring experiences. Data were collected to determine if there was any resulting
relationship in principals’ perceived self-efficacy in identified instructional leadership
categories and gender, school type, experience, age, educational level and area of study. The
study compared results of a self-efficacy survey for principals, which focused on identified
instructional leadership categories and the level of mentoring or mentoring relationships
these principals experienced. Questions were developed to determine the level, quality, and
type of mentoring experiences the principals acquired.
The causal-comparative quantitative design of the study used inferential statistics,
confirmatory factory analysis (CFA), and structural equation modeling (SEM) to analyze the
data. “SEM is a statistical technique that seeks to explain the covariance among a set of
variables (McQuitty & Wolf, 2013, p. 59).” A cross-sectional survey was used (Creswell,
2009); specifically, a Web-based survey using Survey Monkey© was administered to all
principals in K-12 traditional public school buildings in the State of Michigan; N was
approximately 4,300. Email addresses were obtained through the Michigan Department of
Education’s Educational Entity Master for 2013-2014. The survey was divided into two
sections; one section was used to collect data that measures factors that contribute to
perceived self-efficacy in the instructional leadership behaviors. The factors identified are:
mentoring/mentoring experiences, gender, school type, experience, age, race/ethnicity, and
39
educational level. The level of mentoring experiences was the focus of questions that were
designed to understand the quality of the mentoring experiences.
In the second section of the survey, questions sought to identify the level of
perceived self-efficacy a principal has in the following identified areas: knowledge of
curriculum, staff evaluation/observation, leading for school improvement, data use, and
culture building. The purpose of the survey examined how mentoring relations impact a
principal’s perceived self-efficacy; however, some questions controlled for the other
variables.
The dependent variable is the perceived self-efficacy in instructional leadership
categories, and the independent variables are the factors that may contribute to principals’
perceived self-efficacy; moreover, mentoring and demographic variables. The primary focus
of the independent variable is on mentoring experiences, while controlling for demographic
variables. Social cognitive theory (Bandura, 1996) was used as a theoretical base for the
research, with self-efficacy as a main component in the developed conceptual frame.
Bandura’s work in the area of self-efficacy was tested as the researcher analyzed the outside
factors that may have contributed to the identified subject’s perceived self-efficacy.
A pilot study was used to determine design inefficiencies and to test logistics prior to
the large-scale study. The survey instrument (see Appendix A) was administered to K-12
principals in local public school districts in Washtenaw County, Michigan. The pilot survey
allowed the researcher to test the accuracy of the survey, clarity of the directions, and
logistics of data collection. Data from the pilot survey were examined for validity, reliability,
and readability prior to presenting to the Human Subject’s Committee at Eastern Michigan
University. Participants in the pilot survey were asked to provide feedback on the time it took

40
to complete the survey, ease of use, and clarity of questions. The feedback from the
participants uncovered some misunderstandings regarding the sections of the survey and
whether the participants should answer based on their current position or previous position.
More clarity for each section was suggested. Thus, an informational page was inserted before
each section. One principal caught a flaw in the survey design, which prevented him or her
from answering some of the questions. In addition, participants noted that it took about 15
minutes to take the survey. When modifications and other revisions were made to address
identified concerns, enhance clarity, and to prevent difficulties for future participants, the
revised survey instrument was sent to all K-12 public school principals in the State of
Michigan.
Descriptive statistics, Confirmatory Factor Analysis, and Structural Equation
Modeling were used to analyze the survey results to determine if there is a significant
relationship between a principal’s sense of self-efficacy in instructional leadership and his or
her mentoring experiences or if there were any resulting relationship in a principal’s
perceived self-efficacy in identified instructional leadership categories and gender, school
type, experience, age, educational level and area of study.
Research Questions and Null Hypothesis
The study was guided by the following research questions and null hypotheses:
Q 1. Is there a significant relationship between a principal’s perceived sense of self-
efficacy in instructional leadership and his or her mentoring experiences?
Null Hypothesis: There will be no relationship between a principal’s perceived self-
efficacy in the identified instructional leadership categories and their mentoring
experiences.

41
Q 2. Is there any resulting relationship in a principal’s perceived self-efficacy in
instructional leadership and gender, school type, school level, experience (tenure), age,
educational level, school size, and race/ethnicity?
Null Hypothesis: There will be no resulting relationship between a principal’s
perceived self-efficacy and the identified instructional leadership categories.
Research Design and Approach
A quasi-experimental causal-comparative quantitative design using structural
equation modeling was used to determine if any relationship exists between a principal’s
mentoring and mentoring relationships and perceived self-efficacy in defined instructional
leadership behaviors.
Data Collection
The relationship between mentoring and mentoring relationships and perceived self-
efficacy in instructional leadership were studied by surveying current building administrators
from across the State of Michigan. The survey also included questions that controlled for
gender, school type, experience/tenure, age, educational level, school size and race/ethnicity.
Survey Monkey© was used to administer the online survey. The system controlled for
multiple submissions by only allowing for one submission per computer. A reminder email
was sent after the first and second week after the survey is administered, and the survey was
closed three weeks after initially administered.
Access to an email list of all principals in the State of Michigan was made available
from the Michigan Department of Education Educational Entity Master. Identified principals
were asked via email to participate in the study. An informed consent letter explaining the
study (Appendix B) and a link to the survey in Survey Monkey© were included. The survey
42
was entirely voluntarily and submitted anonymously. The researcher hoped to identify and
collect data from a significantly large sample size of at least 200 to improve the validity and
reliability of the data.
Instrumentation
The survey was developed and questions were modified from the School
Administrators Efficacy Scale (SAES) (NCPEA, 2007). The SAES was utilized as a resource
to develop a comprehensive scale tailored specifically for this study. The researcher
developed mentoring questions specific to the study, which were based on Kathy Kram’s
(1985) career and psychosocial divisions of mentoring and Bandura’s (1997) vicarious and
verbal persuasion facets of his self-efficacy theory. Permission to use the SAES was given
via email by Dr. Dan McCollum (September 26, 2013), the author of the survey (see
Appendix C).
Data Analysis
Structural equation modeling and path analysis were used to analyze the data where
the principal’s self-efficacy in instructional leadership categories is the dependent variable
and the independent variables are the factors that may contribute to their perceived self-
efficacy (see Figure 3). Mentoring is the primary focus of the study, although controlling for
other variables were deemed important. The dependent variable is regarded as completely
determined by some combination of variables in the system but will focus on perceived self-
efficacy. Structural equation modeling is comparable to common statistical methods, such as
correlation, multiple regression, and analysis of variance (ANOVA). A path diagram breaks
down the SEM into very basic conceptual parts (see Figure 3), although SEM further defined
the multiple variables involved to create a more formal model. “One difference between
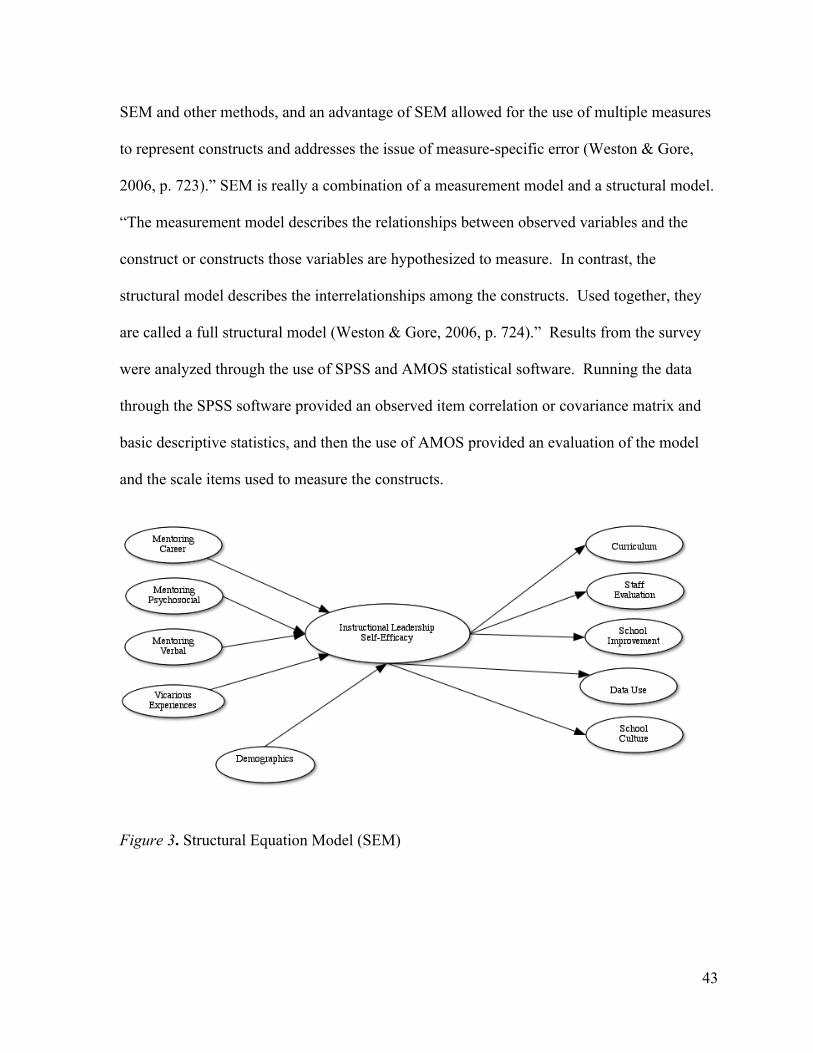
43
SEM and other methods, and an advantage of SEM allowed for the use of multiple measures
to represent constructs and addresses the issue of measure-specific error (Weston & Gore,
2006, p. 723).” SEM is really a combination of a measurement model and a structural model.
“The measurement model describes the relationships between observed variables and the
construct or constructs those variables are hypothesized to measure. In contrast, the
structural model describes the interrelationships among the constructs. Used together, they
are called a full structural model (Weston & Gore, 2006, p. 724).” Results from the survey
were analyzed through the use of SPSS and AMOS statistical software. Running the data
through the SPSS software provided an observed item correlation or covariance matrix and
basic descriptive statistics, and then the use of AMOS provided an evaluation of the model
and the scale items used to measure the constructs.
Figure 3. Structural Equation Model (SEM)
44
Ethical Considerations
Ethical issues must be considered whenever primary research is employed
(Krathwohl, 2009). Eastern Michigan University’s Human Subjects Review Committee
reviewed and approved the study prior to distributing the survey (see Appendix D).
Participants received information on the purpose of the study and confidentiality agreements
(see Appendix A). Principals were informed that participation was voluntary and the data
were collected anonymously and reported anonymously. Assurance was provided to the
subjects regarding data security.
Summary
The purpose of this study was to investigate whether there is a significant relationship
between a principal’s sense of self-efficacy in instructional leadership and his or her
mentoring experiences. The dependent variable in this study was identified as the perceived
self-efficacy in instructional leadership categories and the independent variables are the
factors that may have contributed to principals’ perceived self-efficacy; moreover, mentoring
and demographic variables. A cross-sectional survey was used (Creswell, 2009);
specifically, a Web-based survey using Survey Monkey© was administered to all K-12
traditional public school building principals in the State of Michigan. A causal-comparative
quantitative design using inferential statistics and structural equation modeling (SEM) was
used to analyze the data. Social cognitive theory (Bandura, 1996) was used as a theoretical
base for the research with self-efficacy as a main component in the developed conceptual
frame. Bandura’s work in the area of self-efficacy was tested as the researcher analyzed the
outside factors that may have contributed to the identified subject’s perceived self-efficacy.
The findings of this study will add to the body of research on self-efficacy and mentoring in

45
public schools and may assist schools and universities in developing effective mentoring
programs that impact instructional leadership.
46
Chapter Four–Presentation and Analysis of Data
The purpose of this study was to investigate whether there is a significant relationship
between a principal’s sense of self-efficacy in instructional leadership and his or her
mentoring experiences. Data determined relationships in principals’ perceived self-efficacy
in identified instructional leadership categories and gender, school type, experience, age,
educational level, and area of study. A self-efficacy survey for principals focused on
identified instructional leadership categories and the level of mentoring or mentoring
relationships these principals experienced. Questions were developed to determine the level
and quality of mentoring experiences the principals acquired.
The results of this research contributed to the existing knowledge about the effects of
mentoring programs on perceived instructional leadership self-efficacy and may be beneficial
school district and building leaders and college and university administrators across the state
and country as they strive to improve principal preparation, mentoring, and instructional
leadership programs. Data were gathered from principals in the State of Michigan through
the use of an online survey. The data were analyzed through the use of descriptive and
inferential statistics, confirmatory factor analysis, and structural equation modeling.
Description of the sample.
Variable summaries. Table 1 shows frequencies of responses for the sample
demographics.

47
1 An additional respondent was dropped when the regression diagnostics revealed an outlier, and closer inspection discovered that the respondent simply clicked the same response for all mentoring and self-‐efficacy items without giving much apparent thought to the responses.
48
The total N was 505, although only 295 completed the mentoring scale questions.
The sample had slightly more male respondents than females, with the modal age range
between 35 and 44. Nearly half of respondents were from rural schools and taught at the
elementary level. More than half of subjects had a Master’s Degree, with the remaining
having a Ph.D. or other education specialization. Only 6% of respondents were African
American. Most respondents had received tenure more than a year prior to the survey, with
the modal year range being more than ten years prior to the survey.
The primary variables of interest are mentoring and self-efficacy, with both concepts
being measured with a unique, multi-question instrument derived from existing surveys. The
a priori expectation behind those question choices was that the 12 items tapping mentoring
would form four distinct subscales: career, psychosocial, vicarious, and verbal mentoring. It
was also expected that the 27 items tapping self-efficacy would fall into five separate
subscales: curriculum, staff evaluation, school improvement, data use, and positive culture.
Exploratory factor analysis. An exploratory factor analysis was used to determine the
relationships among the variables. The results from running a principal axis factor analysis
with oblique (oblimin) rotation on the mentoring items are shown in Table 2. A screeplot
and check of eigenvalues greater than one suggested a two-factor solution. The entries in the
table represent the correlations between each item and the two factors, meaning that the
numbers can range from -1 to +1. The largest correlation for the items is highlighted in bold.
The results show that the loadings do not demonstrate any pattern that lines up with the a
priori expectations. All but three questions load most highly on the first factor. In addition,
although the eigenvalues suggested a two-factor solution, the two factors are highly
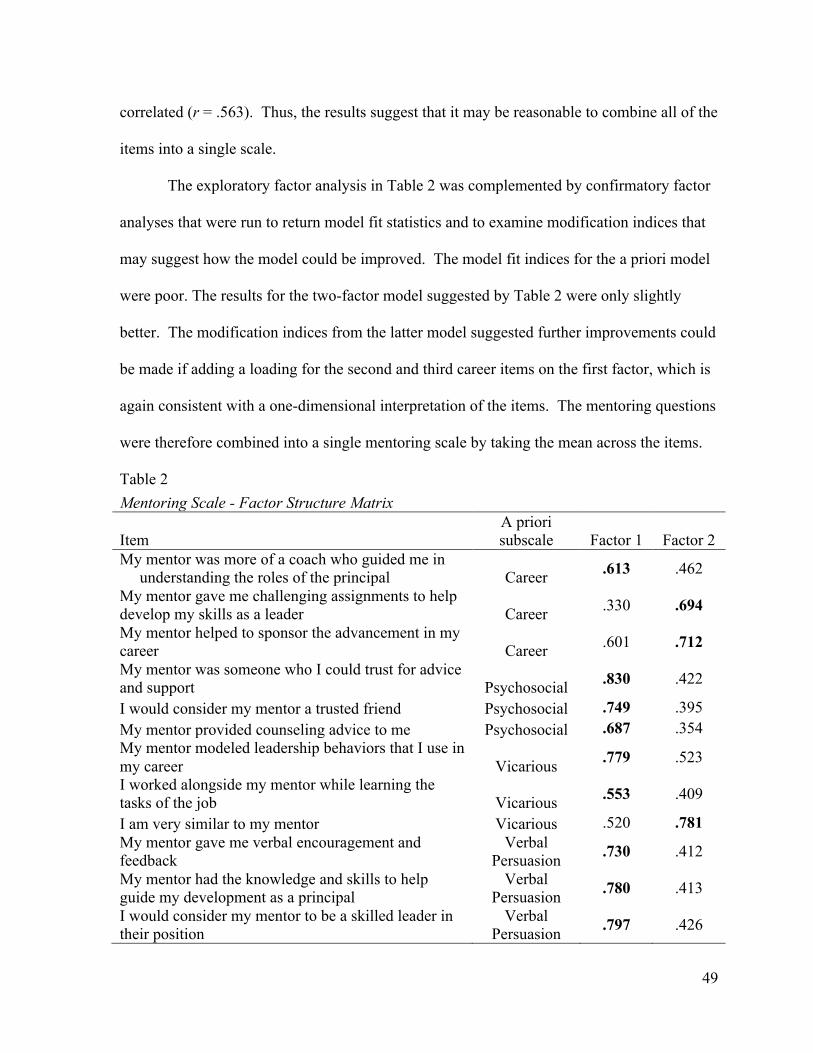
49
correlated (r = .563). Thus, the results suggest that it may be reasonable to combine all of the
items into a single scale.
The exploratory factor analysis in Table 2 was complemented by confirmatory factor
analyses that were run to return model fit statistics and to examine modification indices that
may suggest how the model could be improved. The model fit indices for the a priori model
were poor. The results for the two-factor model suggested by Table 2 were only slightly
better. The modification indices from the latter model suggested further improvements could
be made if adding a loading for the second and third career items on the first factor, which is
again consistent with a one-dimensional interpretation of the items. The mentoring questions
were therefore combined into a single mentoring scale by taking the mean across the items.
Table 2 Mentoring Scale - Factor Structure Matrix
Item A priori subscale Factor 1 Factor 2
My mentor was more of a coach who guided me in understanding the roles of the principal Career .613 .462
My mentor gave me challenging assignments to help develop my skills as a leader Career .330 .694
My mentor helped to sponsor the advancement in my career Career .601 .712
My mentor was someone who I could trust for advice and support Psychosocial .830 .422
I would consider my mentor a trusted friend Psychosocial .749 .395 My mentor provided counseling advice to me Psychosocial .687 .354 My mentor modeled leadership behaviors that I use in my career Vicarious .779 .523
I worked alongside my mentor while learning the tasks of the job Vicarious .553 .409
I am very similar to my mentor Vicarious .520 .781 My mentor gave me verbal encouragement and feedback
Verbal Persuasion .730 .412
My mentor had the knowledge and skills to help guide my development as a principal
Verbal Persuasion .780 .413
I would consider my mentor to be a skilled leader in their position
Verbal Persuasion .797 .426

50
Note. Principal factor extraction with oblique (oblimin) rotation. Entries are correlations between items and factors.
Table 3 presents the results of performing an exploratory factor analysis on the self-
efficacy items. The screeplot and eigenvalues suggested a three- or four-factor solution, with
the fourth eigenvalue being just above one (1.01). The three-factor model was chosen for
parsimony. The factor structure matrix in the table shows that the items tied to curriculum,
staff evaluation, and school improvement items all have the largest correlations with the first
factor. The data use items form their own separate factor, as do the positive culture items.
This suggests that the questions collapse into three, rather than five, subscales.
Table 3 Self-Efficacy Scale - Factor Structure Matrix
Item A priori subscale
Factor 1
Factor 2
Factor 3
I am able to understand the process of curriculum design, implementation, and evaluation Curriculum 0.685 -0.343 0.55 I am confident that I possess the skills needed to implement the effective use of resources so that priority is given to support student learning Curriculum 0.747 -0.519 0.515 I am confident in my understanding of all of the instructional programs in my school Curriculum 0.639 -0.367 0.415 I am confident in my ability to monitor the classroom curriculum to see that it covers the school's curricular objectives Curriculum 0.681 -0.372 0.533 I understand how to align curriculum in all content areas Curriculum 0.635 -0.28 0.557 I am able to develop a systematic process for mentoring teachers on my campus
Staff Evaluation 0.565 -0.478 0.352
I understand the development of a professional growth plan
Staff Evaluation 0.703 -0.557 0.474
I am confident in my abilities to evaluate my staff
Staff Evaluation 0.763 -0.552 0.41

51
Table 3 Continued I am confident in my knowledge of instruction when facilitating conversations with my staff
Staff Evaluation
0.761
-0.525
0.474 I possess the ability to facilitate meaningful dialogue to assist staff in their own professional growth
Staff Evaluation 0.775 -0.573 0.441
I have the ability to lead staff to set professional goals based on reflective practice
Staff Evaluation 0.769 -0.574 0.453
I am confident in my skills to assess the staff development needs of the school
School Improvement 0.744 -0.527 0.564
I am confident in my knowledge of best-practice research related to instructional practices
School Improvement 0.652 -0.446 0.606
Summary statistics for the four scales as well as reliabilities (Cronbach’s alpha) are
shown in Table 4. The reliabilities are very good for each of the scales, with the lowest being
.873 for the data use scale and the highest being .941 for the general (enactment) self-
efficacy scale. The mean scores, highlighted in bold in table 4 demonstrate the mean ranking
for these variables. All three mean scores in the self-efficacy ratings are in the 3 range with
the enactiment score being the highest. This indicates that principals feel more efficacious
over curriculum, staff evaluation, and school improvement rather than data use and setting a
positive school culture. Principals generally favorably ranked their mentors, however the
mentoring scale was on 5-point scale vs. the 4-point scale for self-efficacy.
Table 4 Scale Descriptive Statistics N Min. Max Mean SD Alpha Mentoring 295 1.00 5.00 3.922 0.742 0.903 Self-Efficacy: Curriculum, Staff Evaluation, and School Improvement
508 1.06 4.00 3.274 0.440 0.941
Self-Efficacy: Data Use 508 1.00 4.00 3.251 0.505 0.873 Self-Efficacy: Positive Culture 508 1.00 4.00 3.220 0.524 0.924
52
Figure 4 displays boxplots for the four measures. The boxes in these figures
represent the interquartile range of the data (from the 25th percentile to the 75th percentile),
with the line in the box representing the median (the 50th percentile). The lines extending
from the box cover the remaining observations up to 1.5 times the distance of the
interquartile range. Observations beyond the line may be considered outliers. A normally
distributed variable would have a line in the center of the box, lines extending equal distance
on each side, and very few outliers.
The results show that, for all but the enactment self-efficacy scale, there is a negative
skew to each scale’s distribution. That is, the distributions have heavy tails on the low end of
values. Given the exploratory nature of this study, and to keep interpretation simple, no
further transformations to the scales were made.
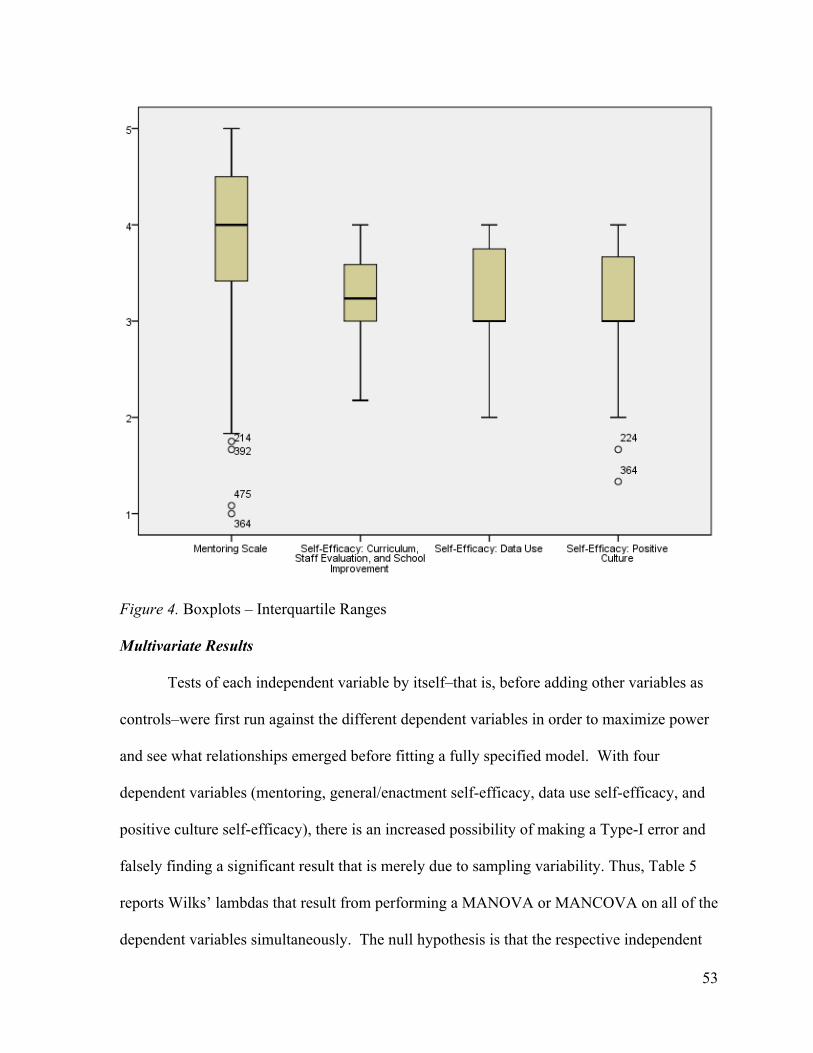
53
Figure 4. Boxplots – Interquartile Ranges
Multivariate Results
Tests of each independent variable by itself–that is, before adding other variables as
controls–were first run against the different dependent variables in order to maximize power
and see what relationships emerged before fitting a fully specified model. With four
dependent variables (mentoring, general/enactment self-efficacy, data use self-efficacy, and
positive culture self-efficacy), there is an increased possibility of making a Type-I error and
falsely finding a significant result that is merely due to sampling variability. Thus, Table 5
reports Wilks’ lambdas that result from performing a MANOVA or MANCOVA on all of the
dependent variables simultaneously. The null hypothesis is that the respective independent

54
variable does not influence any of the dependent variables. A significant result would mean
that one must follow up the ANOVA with an MANOVA or regression to find out which
dependent variables were affected by the independent variables.
Table 5 Simple MANOVAs Wilks' Lambda F df1 df2 p Gender 0.959* 3.058 4 288 0.017 African American 0.987 0.947 4 288 0.437 Urban/Suburban/Rural 0.919* 3.115 8 578 0.002 School Type 0.91 1.368 20 946 0.129 R's Education 0.905* 3.683 8 578 <.001 Age 0.948* 3.997 4 289 0.004 Tenure 0.927* 5.711 4 288 <.001 Note. Each IV entered by itself in separate MANOVAs.
Shown with an asterisk in the table, five of the predictors yield significant results:
gender school setting, the respondent’s education, age, and tenure. Neither race nor school
type appear to play a significant role in affecting mentoring or self-efficacy scores.
Table 6 presents independent samples t tests for gender. The dichotomously coded
race is also included for completeness, although the multivariate test in Table 5 did not
indicate any difference (and none of the t tests are significant in Table 6). According to
Table 6, gender has a significant effect on the general self-efficacy scale and the data use
scale, as shown by an asterisk. In both cases, females have higher average scores than males.
A confirmatory factor analysis was again run to examine model fit statistics and
modification indices. The model fit statistics for the a priori model were poor, χ2(314) =
1026.226, p < .001, RMSEA = .067. The model fit for the three factor model suggested by
Table 3 did not offer an improvement, χ2(321) = 1376.545, p < .001, RMSEA = .08. The
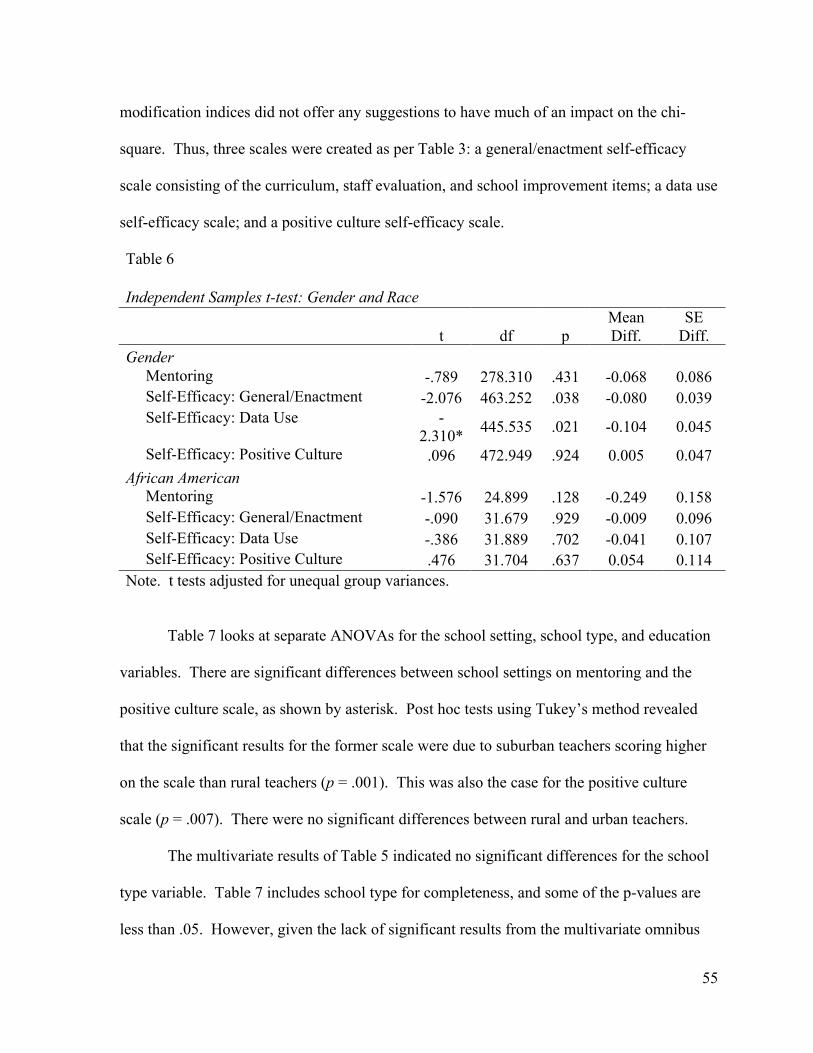
55
modification indices did not offer any suggestions to have much of an impact on the chi-
square. Thus, three scales were created as per Table 3: a general/enactment self-efficacy
scale consisting of the curriculum, staff evaluation, and school improvement items; a data use
self-efficacy scale; and a positive culture self-efficacy scale. Table 6
Independent Samples t-test: Gender and Race
t df p Mean Diff.
SE Diff.
Gender Mentoring -.789 278.310 .431 -0.068 0.086 Self-Efficacy: General/Enactment -2.076 463.252 .038 -0.080 0.039 Self-Efficacy: Data Use -
2.310* 445.535 .021 -0.104 0.045
Self-Efficacy: Positive Culture .096 472.949 .924 0.005 0.047 African American Mentoring -1.576 24.899 .128 -0.249 0.158 Self-Efficacy: General/Enactment -.090 31.679 .929 -0.009 0.096 Self-Efficacy: Data Use -.386 31.889 .702 -0.041 0.107 Self-Efficacy: Positive Culture .476 31.704 .637 0.054 0.114 Note. t tests adjusted for unequal group variances.
Table 7 looks at separate ANOVAs for the school setting, school type, and education
variables. There are significant differences between school settings on mentoring and the
positive culture scale, as shown by asterisk. Post hoc tests using Tukey’s method revealed
that the significant results for the former scale were due to suburban teachers scoring higher
on the scale than rural teachers (p = .001). This was also the case for the positive culture
scale (p = .007). There were no significant differences between rural and urban teachers.
The multivariate results of Table 5 indicated no significant differences for the school
type variable. Table 7 includes school type for completeness, and some of the p-values are
less than .05. However, given the lack of significant results from the multivariate omnibus
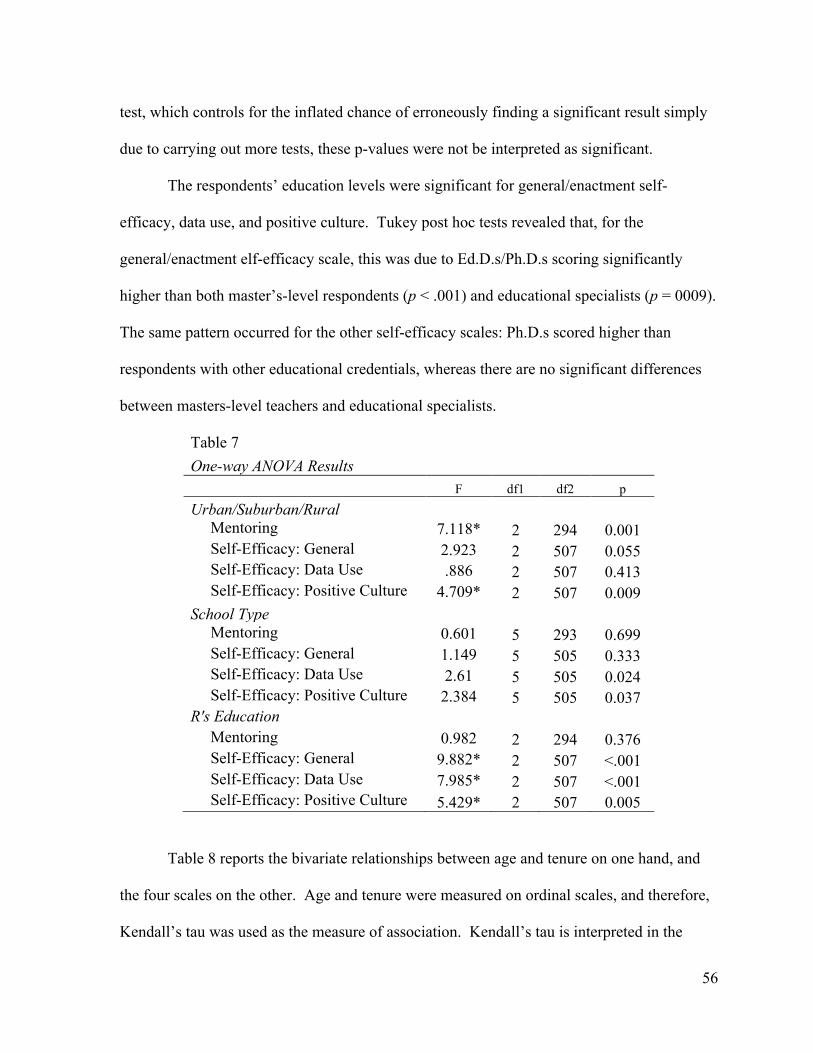
56
test, which controls for the inflated chance of erroneously finding a significant result simply
due to carrying out more tests, these p-values were not be interpreted as significant.
The respondents’ education levels were significant for general/enactment self-
efficacy, data use, and positive culture. Tukey post hoc tests revealed that, for the
general/enactment elf-efficacy scale, this was due to Ed.D.s/Ph.D.s scoring significantly
higher than both master’s-level respondents (p < .001) and educational specialists (p = 0009).
The same pattern occurred for the other self-efficacy scales: Ph.D.s scored higher than
respondents with other educational credentials, whereas there are no significant differences
between masters-level teachers and educational specialists.
Table 7 One-way ANOVA Results F df1 df2 p Urban/Suburban/Rural Mentoring 7.118* 2 294 0.001 Self-Efficacy: General 2.923 2 507 0.055 Self-Efficacy: Data Use .886 2 507 0.413 Self-Efficacy: Positive Culture 4.709* 2 507 0.009 School Type Mentoring 0.601 5 293 0.699 Self-Efficacy: General 1.149 5 505 0.333 Self-Efficacy: Data Use 2.61 5 505 0.024 Self-Efficacy: Positive Culture 2.384 5 505 0.037 R's Education Mentoring 0.982 2 294 0.376 Self-Efficacy: General 9.882* 2 507 <.001 Self-Efficacy: Data Use 7.985* 2 507 <.001 Self-Efficacy: Positive Culture 5.429* 2 507 0.005
Table 8 reports the bivariate relationships between age and tenure on one hand, and
the four scales on the other. Age and tenure were measured on ordinal scales, and therefore,
Kendall’s tau was used as the measure of association. Kendall’s tau is interpreted in the

57
same manner as Pearson’s correlation, ranging from -1 to +1 and with zero indicating no
relationship. Age has a positive correlation with general/enactment self-efficacy and positive
culture. That is, being older leads to higher levels of self-efficacy on both scales. Likewise,
longer tenure leads to higher general/enactment self-efficacy and positive culture self-
efficacy.
Although these results indicate that there may be systematic differences in mentoring
and self-efficacy due to variation in demographics, it remains to be seen if these differences
remain when controlling for other factors. For example, the significant result for tenure may
really be due to age, as longer tenure is more common among older respondents. The next
section presents the full regression models with mentoring and the three self-efficacy scales
being the dependent variables.
Table 8
Nonparametric Correlations (Kendall's tau)
tau p Age Mentoring -0.057 0.203 Self-Efficacy: General 0.119* 0.001 Self-Efficacy: Data Use 0.035 0.345 Self-Efficacy: Positive Culture 0.105* 0.004 Tenure Mentoring -0.015 0.736 Self-Efficacy: General 0.144* <.001 Self-Efficacy: Data Use 0.035 0.335 Self-Efficacy: Positive Culture 0.157* <.001
Regression Results
Table 9 shows the results for the mentoring scale. The bivariate results only found
school setting to predict mentoring scores, and this same variable turns out to produce the
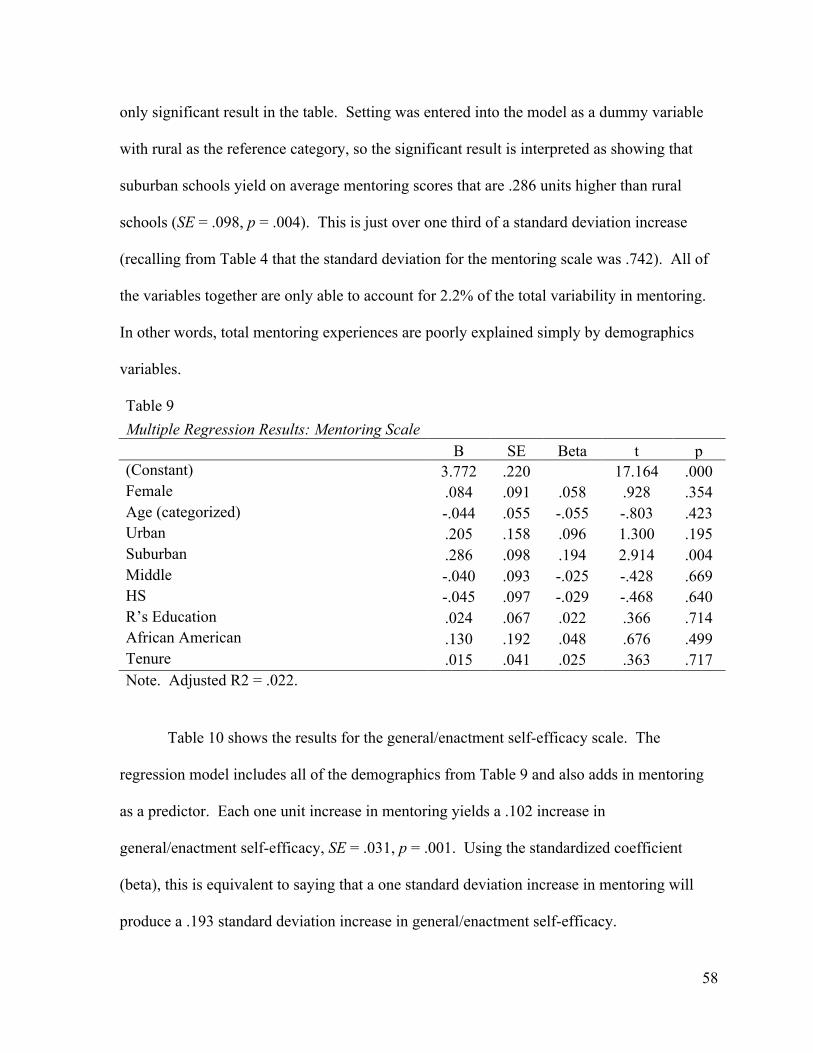
58
only significant result in the table. Setting was entered into the model as a dummy variable
with rural as the reference category, so the significant result is interpreted as showing that
suburban schools yield on average mentoring scores that are .286 units higher than rural
schools (SE = .098, p = .004). This is just over one third of a standard deviation increase
(recalling from Table 4 that the standard deviation for the mentoring scale was .742). All of
the variables together are only able to account for 2.2% of the total variability in mentoring.
In other words, total mentoring experiences are poorly explained simply by demographics
variables.
Table 9 Multiple Regression Results: Mentoring Scale B SE Beta t p (Constant) 3.772 .220 17.164 .000 Female .084 .091 .058 .928 .354 Age (categorized) -.044 .055 -.055 -.803 .423 Urban .205 .158 .096 1.300 .195 Suburban .286 .098 .194 2.914 .004 Middle -.040 .093 -.025 -.428 .669 HS -.045 .097 -.029 -.468 .640 R’s Education .024 .067 .022 .366 .714 African American .130 .192 .048 .676 .499 Tenure .015 .041 .025 .363 .717 Note. Adjusted R2 = .022.
Table 10 shows the results for the general/enactment self-efficacy scale. The
regression model includes all of the demographics from Table 9 and also adds in mentoring
as a predictor. Each one unit increase in mentoring yields a .102 increase in
general/enactment self-efficacy, SE = .031, p = .001. Using the standardized coefficient
(beta), this is equivalent to saying that a one standard deviation increase in mentoring will
produce a .193 standard deviation increase in general/enactment self-efficacy.
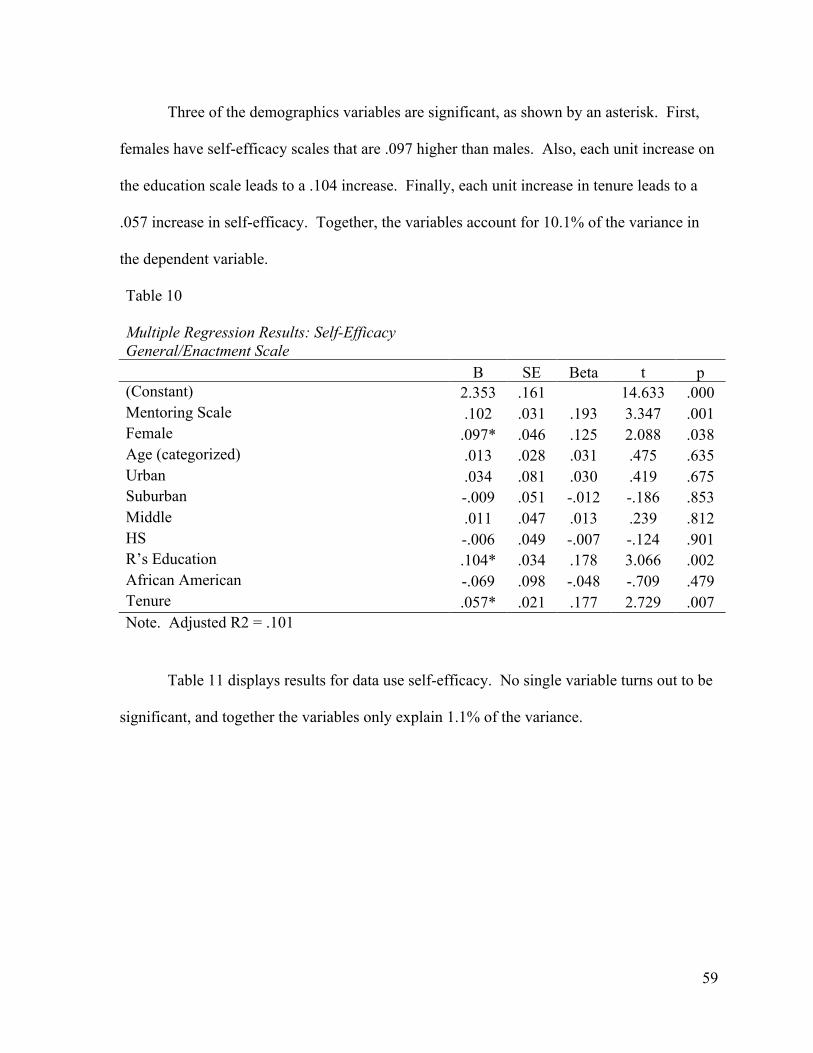
59
Three of the demographics variables are significant, as shown by an asterisk. First,
females have self-efficacy scales that are .097 higher than males. Also, each unit increase on
the education scale leads to a .104 increase. Finally, each unit increase in tenure leads to a
.057 increase in self-efficacy. Together, the variables account for 10.1% of the variance in
the dependent variable.
Table 10 Multiple Regression Results: Self-Efficacy General/Enactment Scale B SE Beta t p (Constant) 2.353 .161 14.633 .000 Mentoring Scale .102 .031 .193 3.347 .001 Female .097* .046 .125 2.088 .038 Age (categorized) .013 .028 .031 .475 .635 Urban .034 .081 .030 .419 .675 Suburban -.009 .051 -.012 -.186 .853 Middle .011 .047 .013 .239 .812 HS -.006 .049 -.007 -.124 .901 R’s Education .104* .034 .178 3.066 .002 African American -.069 .098 -.048 -.709 .479 Tenure .057* .021 .177 2.729 .007 Note. Adjusted R2 = .101
Table 11 displays results for data use self-efficacy. No single variable turns out to be
significant, and together the variables only explain 1.1% of the variance.
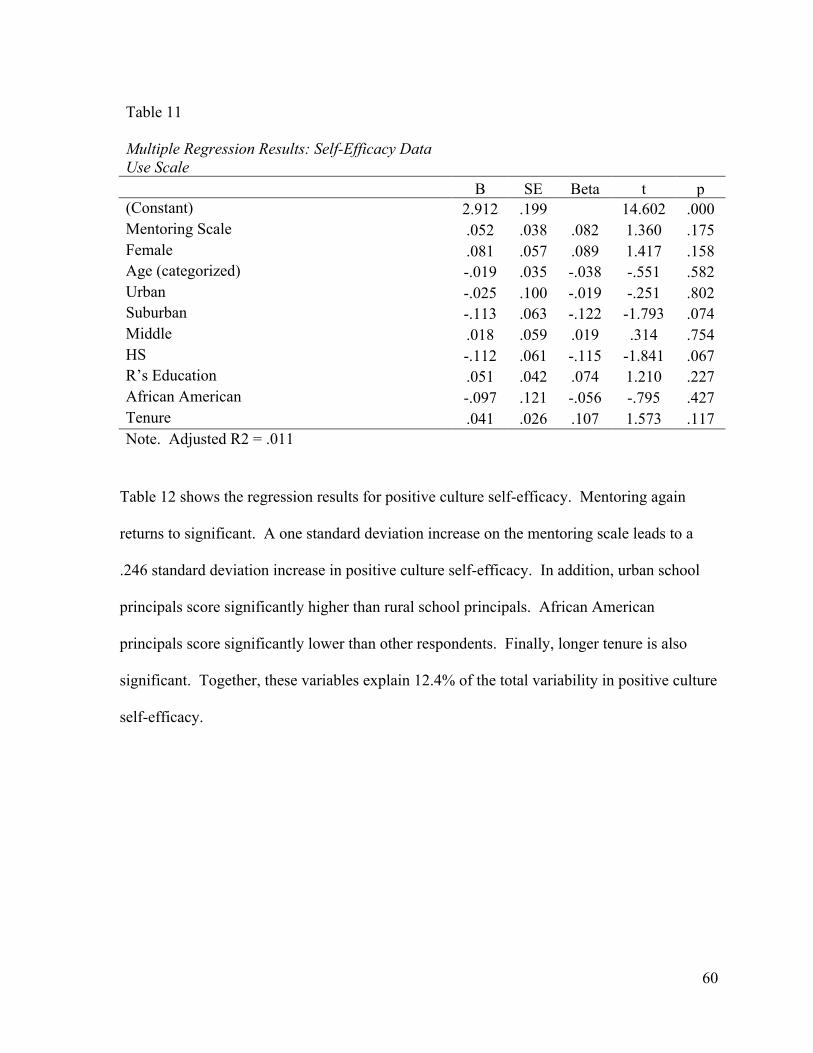
60
Table 11 Multiple Regression Results: Self-Efficacy Data Use Scale B SE Beta t p (Constant) 2.912 .199 14.602 .000 Mentoring Scale .052 .038 .082 1.360 .175 Female .081 .057 .089 1.417 .158 Age (categorized) -.019 .035 -.038 -.551 .582 Urban -.025 .100 -.019 -.251 .802 Suburban -.113 .063 -.122 -1.793 .074 Middle .018 .059 .019 .314 .754 HS -.112 .061 -.115 -1.841 .067 R’s Education .051 .042 .074 1.210 .227 African American -.097 .121 -.056 -.795 .427 Tenure .041 .026 .107 1.573 .117 Note. Adjusted R2 = .011
Table 12 shows the regression results for positive culture self-efficacy. Mentoring again
returns to significant. A one standard deviation increase on the mentoring scale leads to a
.246 standard deviation increase in positive culture self-efficacy. In addition, urban school
principals score significantly higher than rural school principals. African American
principals score significantly lower than other respondents. Finally, longer tenure is also
significant. Together, these variables explain 12.4% of the total variability in positive culture
self-efficacy.
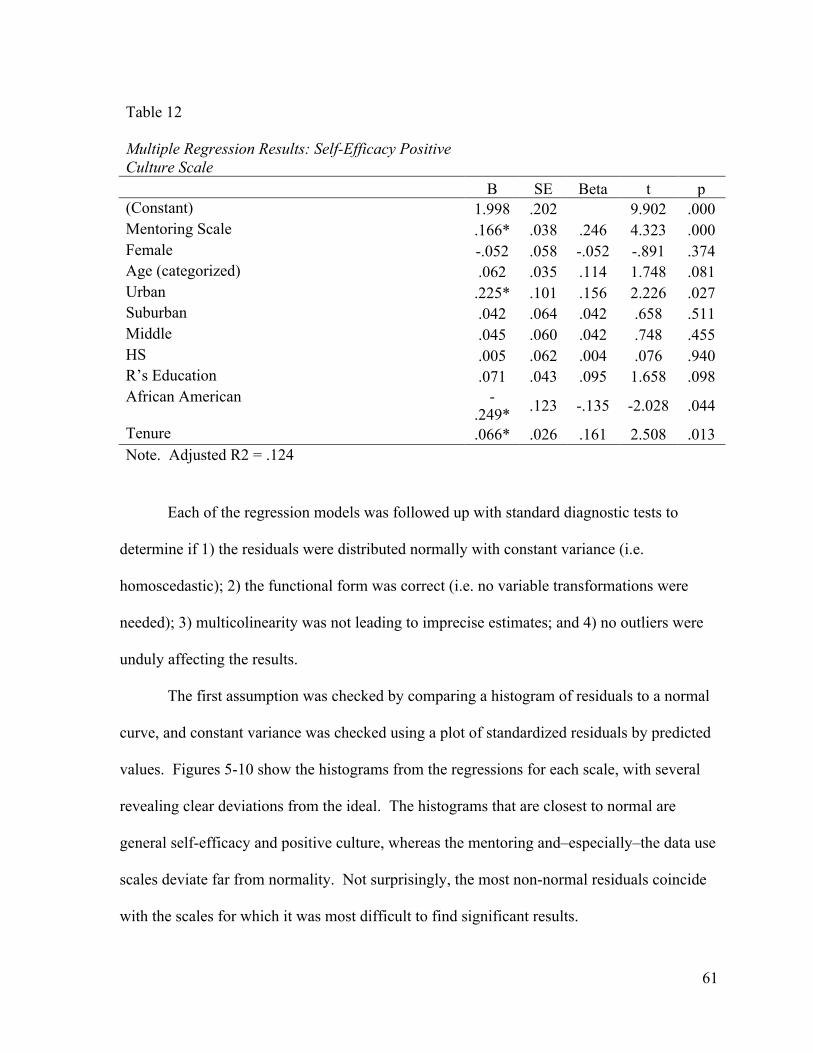
61
Table 12 Multiple Regression Results: Self-Efficacy Positive Culture Scale B SE Beta t p (Constant) 1.998 .202 9.902 .000 Mentoring Scale .166* .038 .246 4.323 .000 Female -.052 .058 -.052 -.891 .374 Age (categorized) .062 .035 .114 1.748 .081 Urban .225* .101 .156 2.226 .027 Suburban .042 .064 .042 .658 .511 Middle .045 .060 .042 .748 .455 HS .005 .062 .004 .076 .940 R’s Education .071 .043 .095 1.658 .098 African American -
.249* .123 -.135 -2.028 .044
Tenure .066* .026 .161 2.508 .013 Note. Adjusted R2 = .124
Each of the regression models was followed up with standard diagnostic tests to
determine if 1) the residuals were distributed normally with constant variance (i.e.
homoscedastic); 2) the functional form was correct (i.e. no variable transformations were
needed); 3) multicolinearity was not leading to imprecise estimates; and 4) no outliers were
unduly affecting the results.
The first assumption was checked by comparing a histogram of residuals to a normal
curve, and constant variance was checked using a plot of standardized residuals by predicted
values. Figures 5-10 show the histograms from the regressions for each scale, with several
revealing clear deviations from the ideal. The histograms that are closest to normal are
general self-efficacy and positive culture, whereas the mentoring and–especially–the data use
scales deviate far from normality. Not surprisingly, the most non-normal residuals coincide
with the scales for which it was most difficult to find significant results.

62
Figure 5. Dependent Variable: Mentoring Scale
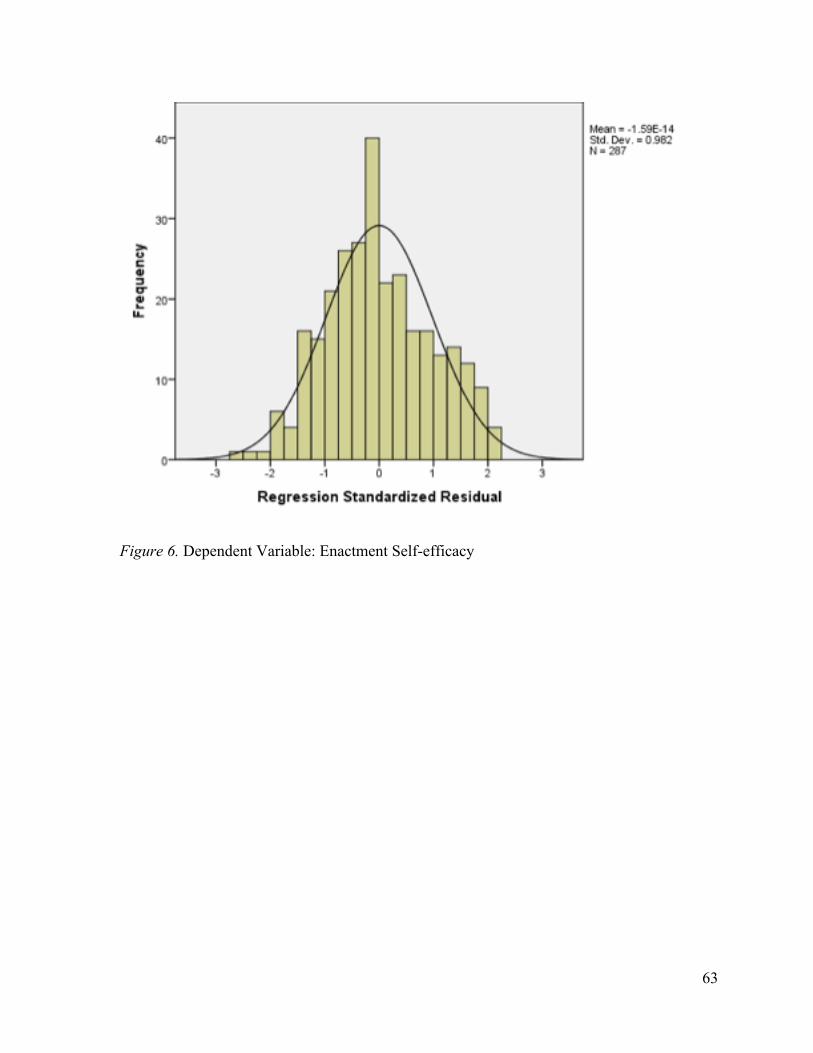
63
Figure 6. Dependent Variable: Enactment Self-efficacy
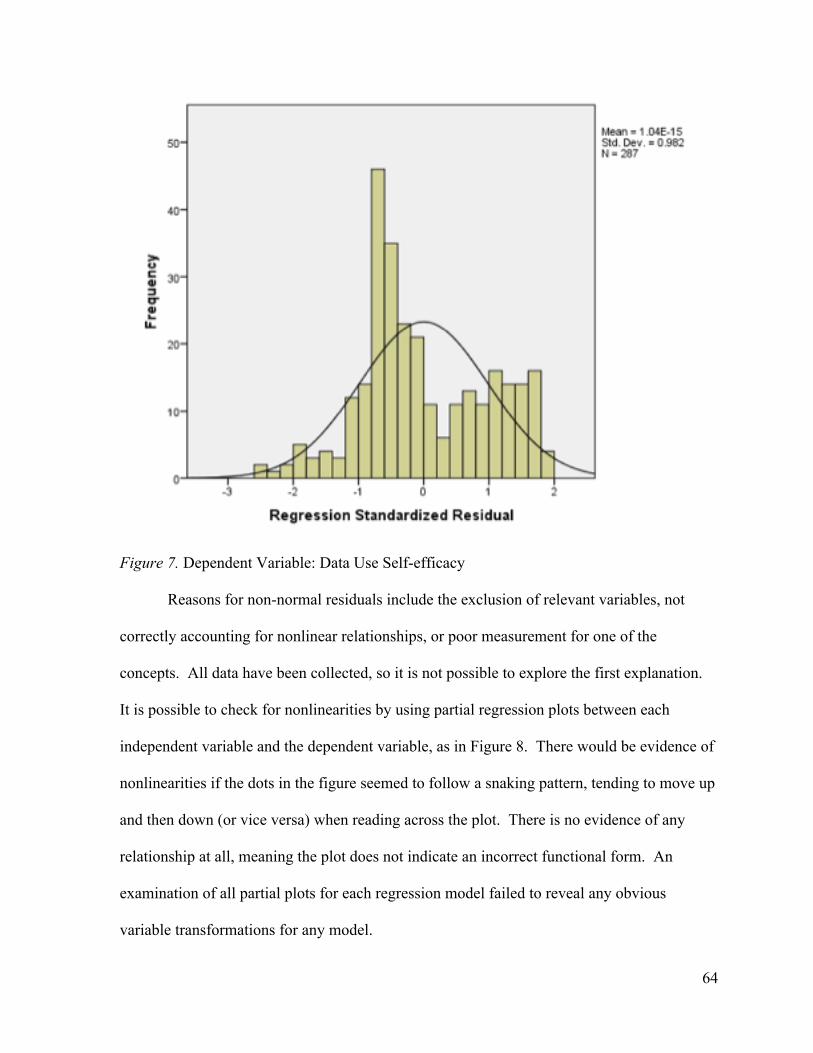
64
Figure 7. Dependent Variable: Data Use Self-efficacy
Reasons for non-normal residuals include the exclusion of relevant variables, not
correctly accounting for nonlinear relationships, or poor measurement for one of the
concepts. All data have been collected, so it is not possible to explore the first explanation.
It is possible to check for nonlinearities by using partial regression plots between each
independent variable and the dependent variable, as in Figure 8. There would be evidence of
nonlinearities if the dots in the figure seemed to follow a snaking pattern, tending to move up
and then down (or vice versa) when reading across the plot. There is no evidence of any
relationship at all, meaning the plot does not indicate an incorrect functional form. An
examination of all partial plots for each regression model failed to reveal any obvious
variable transformations for any model.
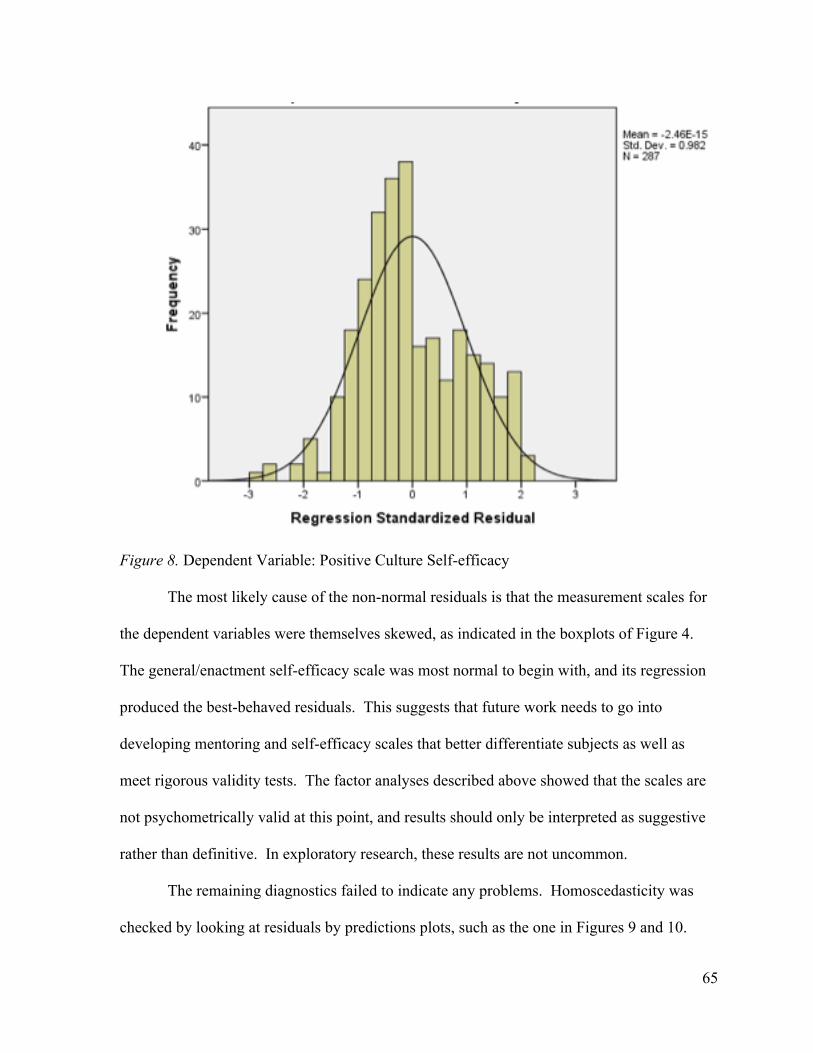
65
Figure 8. Dependent Variable: Positive Culture Self-efficacy
The most likely cause of the non-normal residuals is that the measurement scales for
the dependent variables were themselves skewed, as indicated in the boxplots of Figure 4.
The general/enactment self-efficacy scale was most normal to begin with, and its regression
produced the best-behaved residuals. This suggests that future work needs to go into
developing mentoring and self-efficacy scales that better differentiate subjects as well as
meet rigorous validity tests. The factor analyses described above showed that the scales are
not psychometrically valid at this point, and results should only be interpreted as suggestive
rather than definitive. In exploratory research, these results are not uncommon.
The remaining diagnostics failed to indicate any problems. Homoscedasticity was
checked by looking at residuals by predictions plots, such as the one in Figures 9 and 10.
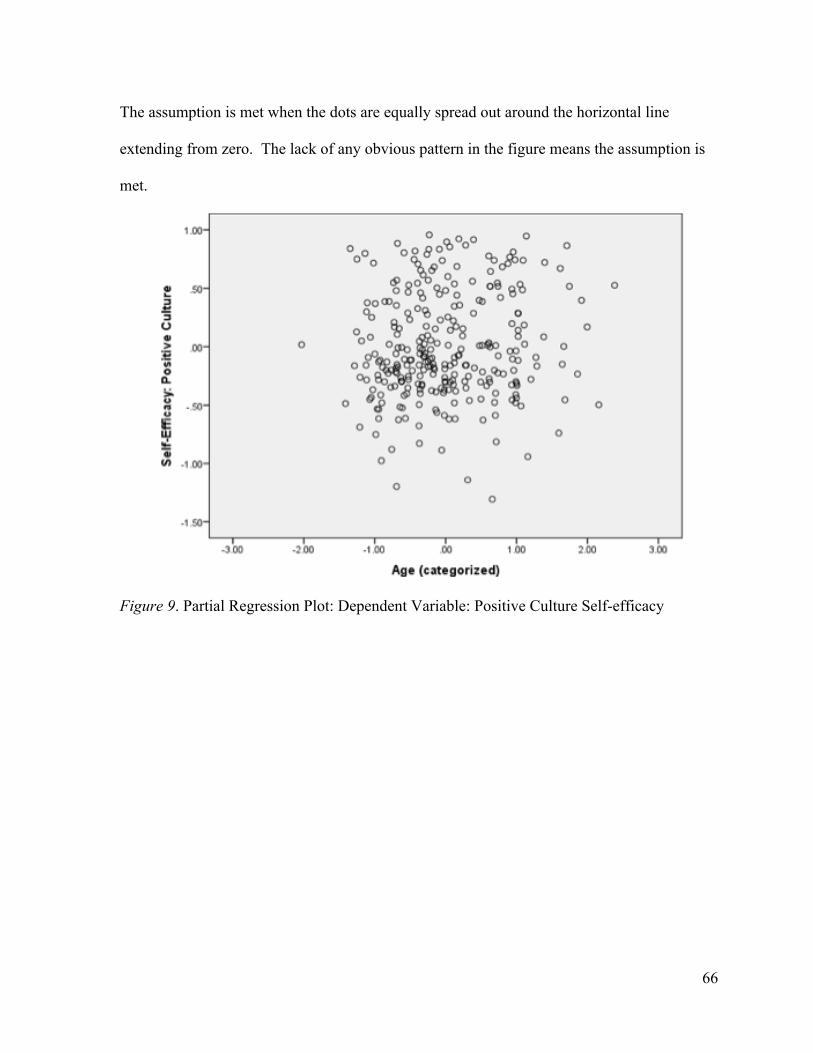
66
The assumption is met when the dots are equally spread out around the horizontal line
extending from zero. The lack of any obvious pattern in the figure means the assumption is
met.
Figure 9. Partial Regression Plot: Dependent Variable: Positive Culture Self-efficacy

67
Figure 10. Scatterplot: Dependent Variable: Mentoring Scale
Variance inflation factors (VIF) and tolerance statistics were also explored to see if
multicolinearity was an issue. Multicolinearity occurs when one independent variable is
nearly perfectly predicted by the other independent variables, making it difficult to determine
the partial effect of the one variable and hence causing problems for finding a significant
result. The tolerance statistics were always .625 or higher, and the VIFs were always 1.6 or
less, both indicating that multicolinearity was not a problem.
Finally, outliers were assessed by looking at the size of standardized residuals (with
anything larger than 3 being suspect) and calculating DFfit statistics, a measure of how much
one observation is affecting the estimates. Neither examination revealed any problems.

68
Structural Equation Modeling (SEM)
AMOS was used to analyze the data through a confirmatory factor analysis (CFA)
and structural equation model (SEM). Figure 11 outlines the final SEM. This final analysis
supported the findings in the previous multi-variate analysis. The measurement model (CFA)
supported the decision to collapse the mentoring scale. The latent variables are all highly
correlated indicating they are acting as one scale. Additionally, the latent variables in the
other scales: culture, data use and enactment demonstrate estimates that would support a
relatively good model fit. Once the model fit was determined, a structural model was
developed with the SEM. The SEM revealed that mentoring impacts self-efficacy in all three
areas; SE Culture p = < .01, SE Data p = .022, and SE Enactment p = .004. The
standardized estimates here show that for every one standard deviation in mentoring there is
a .25 increase in a principal’s self-efficacy in culture, .15 increase in a principal’s self-
efficacy in using data, and a .19 increase in a principal’s self-efficacy in enactment.
Principals with EdDs/PhDs were more efficacious in all three self-efficacy categories; SE
Culture – p = .020 , SE Data – p = .027, and SE Enactment p = .004 than those who have
not earned this degree. Elementary principals felt more efficacious in the use of data than
middle school or high school principals p = .002. In addition, there was a significant
correlation between tenure and self-efficacy in building a positive school culture p = .003.
For every unit of change in tenure there was a .17 increase in self-efficacy in building
positive school culture. These results use the most sophisticated software and are the most
reliable when interpreting the results of this study because they control for all other variables.

69
Figure 11. Structural Equation Model

70
Summary
The findings in this study indicated that mentoring has a significant impact on a
principal’s self-efficacy in the instructional leadership categories of building a positive
school culture, using data, and enactment (school improvement, curriculum and instruction,
and evaluation of personnel). Therefore, the null hypothesis: There will be no relationship
between a principal’s perceived self-efficacy in the identified instructional leadership
categories and his or her mentoring experiences is refuted. Additionally, the data indicated a
significant finding in the demographic variables. Suburban principals felt more positive
about their mentoring experiences. Principals with doctorate degrees were more efficacious
in all three self-efficacy categories. Elementary principals felt more efficacious over the use
of data in their buildings and principals who have served longer tenures felt more efficacious
over building positive school cultures. The findings in the demographic variables refute the
second null hypothesis: There will be no resulting relationship between a principal’s
perceived self-efficacy and the identified instructional leadership categories.

71
Chapter 5‒Summary, Conclusions, Inferences, Implications, and
Recommendations for Further Study
This chapter includes a summary of the key findings from the study, a review of the
methods employed and connections to previous research on mentoring, self-efficacy, and
instructional leadership. In addition, recommendations for future research, higher education,
and practitioners are discussed.
Purpose of the Study
The purpose of this study was to determine if there is a significant relationship
between a principal’s sense of self-efficacy in instructional leadership and his or her
mentoring experiences, or if there is any resulting relationship in a principal’s perceived self-
efficacy in identified instructional leadership categories and gender, school type, experience,
age, educational level, and race/ethnicity. Further, the study examined how an increased or
decreased sense of self-efficacy impacts instructional leadership qualities. The study
compared the responses of principals on a self-efficacy survey that focused on instructional
leadership and the level and types of mentoring or mentoring relationships experienced by
these principals.
Significance of the Proposed Inquiry
Most principals can identify mentors who have had an influence in their professional
lives. Does this influence impact their perceived self-efficacy? “Mentoring as a critical
component of more effective leadership development programs is now being implemented in
a large number of university-based administrator pre-service preparation programs across the
U.S.A.” (Daresh, 1995, p. 7). Extreme variability exists in formal and informal mentoring
72
programs across the U. S., and there is controversy about whether a single mentor is
effective, or if multiple mentors have a greater impact on behavior. “Because enhancing
leadership self-efficacy should be an important objective for those responsible for improving
the quality of leadership in school” (Tschannen-Moran & Gareis, 2004, p. 583), attention
should be paid to developing a principal’s sense of self-efficacy. This development could be
enhanced through efficacy expectations and modeling.
Social cognitive theory provided guidance on observational learning and how “most
human behavior is learned through modeling” (Bandura, 1986, p. 47). Self-efficacy beliefs
are constructed from five principal sources of information: enactive mastery experiences,
vicarious experiences, verbal persuasion, physiological and affective states, and integration
of efficacy information (Bandura, 1997). By studying how mentoring is associated with a
principal’s self-efficacy, beliefs in relation to instructional leadership, an establishment of a
research-driven theory-based mentoring program could result. In addition, the results of this
research add to the current research on self-efficacy in school leaders and how mentoring
programs, both informal and formal, career and psychosocial, influence perceived self-
efficacy.
Research Questions and Null Hypotheses
This study was guided by two research questions:
Q 1. Is there a significant relationship between a principal’s perceived sense of self-efficacy
in instructional leadership and his or her mentoring experiences?
Null Hypothesis: There will be no relationship between a principal’s perceived self-efficacy
in the identified instructional leadership categories and his or her mentoring experiences.

73
Q 2. Is there any resulting relationship in a principal’s perceived self-efficacy in
instructional leadership and gender, school type, experience, age, educational level, and
race/ethnicity?
Null Hypothesis: There will be no resulting relationship between a principal’s perceived
self-efficacy and the identified instructional leadership and gender, school type, experience,
age, educational level, and race/ethnicity.
Study Design
A quantitative survey was sent to all principals in the State of Michigan using the
2013-2014 Michigan Department of Education Educational Entity Master. The survey was
completed by 505 kindergarten through twelfth grade public school principals. The survey
identified factors such as gender, school type, experience, age, educational level, and
race/ethnicity, but primarily focused on principals’ mentoring experiences. The survey also
contained questions to identify the levels and types of mentoring experiences a principal may
or may not have had and questions identifying the quality of their mentor. Additionally,
participants identified their perceived self-efficacy in identified instructional leadership
qualities using a Likert scale. Descriptive, bivariate, multivariate statistics, regression and
factor analysis, and confirmatory factor analysis (CFA) and structural equation modeling
(SEM) were employed using SPSS and AMOS statistical software to determine the
relationships among the variables.
Conceptual Framework/ Theoretical Base
Albert Bandura’s (1977) Social Learning Theory and Social Cognitive Theory (1986)
were used as the theoretical base for this study. These theories, along with Bandura’s
research in the field of self-efficacy served as the conceptual framework that guided the
74
research. Additionally, research in mentoring and instructional leadership contributed to the
framework. Finally, Kathy Kram’s (1995), Mentoring at Work influenced the researcher to
look at two components of mentoring defined as career and psychosocial.
Summary of Key Findings
In this study, the researcher examined effective types of mentoring as portrayed in the
self-efficacy ratings of the five instructional leadership subscales. The data supported the
combining of the mentoring subscales into one subscale and the five instructional leadership
subscales into three. Self-efficacy Enactment represented the results when combining the
curriculum, staff evaluation, and school improvement self-efficacy scales into one. Self-
efficacy Curriculum and self-efficacy Data round out the three scales represented in the
results. Although changes to the original structural equation model were necessary, there
were significant results identified in the data.
Research Question 1. “Is there a significant relationship between a principal’s
perceived sense of self-efficacy in instructional leadership and his or her mentoring
experiences?”
The Structural Equation Model (SEM) revealed the mentoring was statistically
significant in all three self-efficacy categories; positive school culture, data use, and
enactment. This means that those who were mentored felt more efficacious over leading
instructionally in their profession. This evidence supports the notion that formal and
informal mentoring programs should be instituted for new and practicing principals. Those
who have a higher sense of self-efficacy tend to perform at higher levels than those who do
not. Building a principal’s self-efficacy in instructional leadership could have a positive
impact on student achievement and teacher development.

75
Research Question 2. “Is there any resulting relationship in a principal’s perceived
self-efficacy in instructional leadership and gender, school type, experience, age, educational
level, and race/ethnicity?”
The Structural Equation Model indicated that principals from suburban schools
scored higher on the mentoring scale than principals from urban and rural schools, with a
significant positive correlation (p < .001). Principals from suburban schools have the
resources to implement mentoring programs that their urban or rural counterparts may not.
Principals from suburban schools may have more time to dedicate to a mentoring program
than principals from urban or rural schools. Rural principals tend to “wear more hats” and
principals from urban schools have higher discipline rates and more urgency for increasing
student achievement, which may limit the time they can dedicate to a mentoring program
(Canales, Tejeda-Delgado, & Slate, 2008).
Interestingly, the SEM indicated that urban and rural principals felt more efficacious
over using data in instructional leadership. This finding is interesting because in previous
analysis, just the opposite was found. Once a control for other variables was in place, the
results reversed. Principals of rural and urban schools tend to have lower student
achievement than principals from suburban schools. Perhaps, less of a focus on student
achievement exists in the suburban schools because there is a lack of urgency to improve like
there is in urban and rural schools.
Elementary principals had higher ratings of self-efficacy than secondary principals in
the using data in their building. Elementary principals may interpret use of data to improve
instruction differently than secondary principals. With the focus on reading at the elementary
grades, perhaps elementary principals consider running records or progress monitoring as

76
their primary use of data. Readers’ and writers’ workshops have become very popular at the
elementary level. With these programs, a system of progress monitoring is typically used to
determine growth in student achievement. It would make sense that a principal from an
elementary school who implemented such programs would feel efficacious over using data
because they use it constantly to assess reading and writing levels, as students are learning to
read and write. After students are fluent readers and writers, they read to learn in content
areas so there is a shift of focus to other measures of assessment. Principals at the secondary
level may interpret these measures differently, as they rank their efficacy in using data to
improve instruction and achievement.
Principals with doctorate degrees were more efficacious in all three self-efficacy
categories. It makes sense that principals with a Ph.D or Ed.D. would be more efficacious in
the three SE categories; of interest, the strongest correlation was in the area of enactment
first, culture second, and then data use. One might conclude that principals who have earned
the highest degree in their field would feel more efficacious in their job, in general.
Bandura’s (1977) Reciprocal Causation Model would support the fact that personal,
environmental, and behavioral experiences are intertwined, and the more knowledge a
principal acquires over the course of their career and the more experiences they have in the
field, the more efficacious they would feel about their career and their ability to carry out
instructional leadership functions.
There was a significant correlation between tenure and self-efficacy in building a
positive school culture. For every unit of change in tenure there was an increase in self-
efficacy in building a positive school culture. For example, a principal who has served 4-6
years in their position felt more efficacious over building culture than principals who had
77
served 1-3 years. Principals who have served longer terms may be more efficacious over the
culture in their schools because of a comfort level they have maintained. Staff, parents, and
students may feel more comfortable with the leadership; thus, creating a positive school
culture. The older the age of principal, or the longer a school principal served impacted their
self-efficacy ratings resulting in higher scores for setting a positive school culture. Since
self-efficacy is built through career, psychosocial, verbal persuasion, and vicarious
experiences, it makes sense that a higher self-efficacy can be attributed with longer tenure.
Principals who have been in the business of education for a long period of time have
experiences that far outweigh their younger counterparts. Often, more experienced principals
are asked to serve as mentors to the younger aspiring principals. Although, tenure impacted
self-efficacy ratings in positive school culture, there was no correlation with a stronger or
more impactful mentoring experience. More experienced principals did not report a
significant mentoring experience that focused on enactment or positive school culture. This
may be an area for future development in terms of a mentoring program.
Connections to Research and Theory
Albert Bandura’s (1977) social learning and self-efficacy theories provided the
foundation for this study. Kathy Kram’s (1985) research outlined in Mentoring at Work
provided an application for the study. The goal was to determine how mentoring experiences
impacted how a principal feels about the work they do on a daily basis. There are many tasks
required of a principal and many more continue to be layered on. This study focused on the
instructional leadership aspects of a principal’s job. Bandura (1977) posited that behavior is
determined by the idea that the personal, behavioral and environmental conditions work
together continuously to induce behavior. Self-efficacy resides in the personal domain of
78
the Reciprocal Causation Model (Bandura, 1997). Five main sources of efficacy influences
include enactive mastery, vicarious experience, verbal persuasion, physiological and
affective states, and the integration of efficacy information (Bandura, 1997). Self-efficacy is
determined by a person’s experiences with theses efficacy influences. Principals who are
intentionally mentored, and even those who identify informal mentors, are able to build their
knowledge through the efficacy influences. Additionally, Levinson, (1978) described the
phases that man goes through in his book, Seasons of a Man’s Life. He found that a man’s
relationships with other people greatly influence the man he will become. Levinson
referenced the importance that relationships play in different stages of a man’s life and how
these relationships impact his development. Both Albert Bandura (1977) and Knowles
(2002) would agree that direct and indirect knowledge and experience impact self-efficacy
and behavior.
The conceptual framework used in this study as outlined in Chapter Two
demonstrated how social learning theory and the theory of self-efficacy work together to
produce behavior. A strong mentoring program, as outlined by Kathy Kram (1985), would
facilitate a means for these experiences to take place. Focusing on the career and
psychosocial aspects of mentoring while combining what we know about social learning
theory, self-efficacy, and adult learning and development would be a sound basis for a
mentoring program for principals and others in leadership positions.
79
Inferences and Limitations
As stated in Chapter One, this study was limited based on the researcher’s assumption
that honest answers to the survey were given in all cases. In addition, the data were collected
at one point in time, and the researcher could not control the quality of responses. Principals
were asked to rank the quality of their mentoring experiences. Because quality is difficult to
quantify, the researcher cannot control for the quality of the mentoring experiences that
principals identified. Principals have hectic schedules and may have rushed through the
survey causing results to be skewed. The geography of the research study, which included
participants only in the State of Michigan, presented a delimiting factor. Expanding the
study to other states in the region or to all states would provide a larger sample size and may
reveal expanded results. It would also provide a more diverse sample of participants.
Although the survey was piloted prior to the administration, there is a need to
develop better scales to differentiate the types of mentoring outlined: verbal, vicarious, career
and psychosocial. This would help to identify which type of mentoring makes the most
impact on self-efficacy in instructional leadership. Further, the study identified three
dimensions of instructional leadership self-efficacy: enactment, culture, and data use instead
of the anticipated five areas. School improvement, curriculum, and staff evaluation collapsed
into one scale identified as enactment. This study focused on how mentoring impacted self-
efficacy. For those who study theory, this study could be expanded by focusing on
leadership behavior instead of how leaders feel about their behavior. In other words,
studying principal’s leadership behaviors as it relates to their mentoring experience would
provide actual examples of which behaviors seem most prevalent. This could lead to an

80
identification of what successful mentoring programs provide and what they might improve
upon.
Implications for School District Leaders
New principals need to be mentored. Intentional mentoring is very inconsistent
across school districts. District leaders should put efforts into their local-based mentoring
programs by investing in the development of a quality mentoring program. With limited
funding and resources, along with other priorities, it will be difficult for local school districts
to make this investment. This study proved that there is a direct correlation to a principal’s
self-efficacy in instructional leadership and their mentoring experiences. I would suggest
that an investment in leadership development for new principals would pay dividends far into
the future for school buildings and districts.
Instructional leadership has become more important over the past several years.
Teacher evaluation, school improvement, knowledge of curriculum and instruction, using
data for instruction and building positive school cultures have dominated the landscape in
schools during this time. As a building leader, an investment in learning as much as possible
about these components of instructional leadership is a necessity. School districts should
recognize this and support their principals accordingly. Current building principals need to
seek out information, training, and guidance to instructionally lead their staff. Teachers rely
on the principals’ leadership and knowledge to help them develop in their profession. They
also rely on principals to provide guidance through their evaluations and observations of their
teaching. Parents rely on building principals to provide a positive school culture that
promotes increased levels of teaching and learning. Students expect their principals to be
instructional role models who monitor teaching and learning in the school to provide them

81
with the best possible learning experiences available. It is imperative that building leaders
focus on instructional leadership and for district leaders to make this a priority in their hiring
practices.
Implications for Theory
The confirmatory factor analysis revealed that the mentoring and self-efficacy scales
were supported by the latent variables identified in the study.
Mentoring: Interestingly, the findings demonstrate the need for all types of
mentoring; career, psychosocial, verbal and vicarious. The latent variables acted as one
indicator for the mentoring variable. This means that although there may be perceived
dimensions of mentoring working independent of one another, this study shows that the types
of mentoring identified all work together and without one the other may not be possible.
Self-efficacy: Instructional leadership self-efficacy was divided into three
dimensions: culture, data use, and enactment. While the three dimensions are separate, each
dimension has its own set of latent variables that must exist to inform the dimension.
Without one latent variable, the others do not act in the same manner. More specifically the
enactment dimension includes curriculum, school improvement and staff evaluation as
instructional leadership qualities that all act in the same manner inform the dimension.
Recommendations for Further Study
The current research on mentoring for principals is extremely limited. Although
there are mentoring/internship programs for aspiring principals, there is no proven mentoring
program for school leaders that place a focus on instructional leadership. The changing
landscape of principal leadership gives credence to the development of local and state
mentoring guidance. Local school districts should evaluate their current administration to

82
determine if there are needs in the area of instructional leadership with their current building
principals. Mentoring programs should be developed at the local levels that focus on theory-
based research regarding behavior and self-efficacy. Institutes of higher education should
consider their internship requirements and determine if they are providing effective mentors
for their aspiring principals. Based on this study, the researcher recommends several topics
for further research.
Institutions of higher education typically have a component that requires the aspiring
principal to serve as an intern to an experienced administrator. By designing these internship
programs to reflect the theoretical research on mentoring, a solid mentoring program could
be developed. Connecting their mentoring programs to behavior theory may reveal solid
evidence of how leadership behaviors are developed and impacted through the influence of a
mentor. Further research on the mentoring and internship programs at colleges and
universities would be recommended.
Research outlining the mentoring programs that state departments of education
around the United States and local school districts would provide a springboard to learning
about best-practice mentoring programs. By looking at what makes these mentoring
programs successful, a researcher could identify components of a solid mentoring program.
This may lead to the development of a model mentoring program for districts to use.
Mentoring programs are unique to different school settings. Conducting research on
mentoring programs in rural, urban, and suburban settings would provide information on the
differences that may exist in these settings and help district administrators, state boards of
education, and higher education develop specific mentoring programs to meet the needs of
principals working at schools in a variety of settings.
83
Research on specific types of mentoring that increase a principal’s self-efficacy in
instructional leadership would contribute to the development of a strong mentoring program
that maintains a focus on instructional leadership. This would provide a resource that school
leaders could use to develop their own mentoring programs. Using the research that exists on
mentoring in the private sector could influence the development of a mentoring program for
principals.
This study indicated that principals with longer tenure do not feel more efficacious
over using data to improve instruction. By studying this phenomenon, a researcher may be
able to identify exactly why this is true. This could lead to professional development
associated with data use for longer-tenured principals; thus, increasing self-efficacy of
principals in the area of data use in schools.
Because principals of urban and rural schools feel more efficacious than principals
from suburban schools over using data to improve instruction, a study identifying why this is
true could contribute to the research on data use in schools and perhaps promote stronger
self-efficacy in this area.
A study involving self-efficacy in instructional leadership with principals who have
doctoral degrees may identify why these principals feel more efficacious about using data to
improve instruction, building positive school cultures, and enactment processes.
Further research identifying why elementary principals feel more efficacious than
secondary principals about using data to improve instruction and student achievement could
reveal important information about data use at these levels of schooling. This may lead to
further guidance for principals at all levels on the importance of the use of data and the
application of how results can be used to inform instruction.

84
Summary
Although the focus educator effectiveness at the local, state and national level has
increased, our building principals are being neglected. Increased attention on principal
leadership will pay dividends in the area of teacher effectiveness. The principal should and
must be the learning leader in the school. They must lead by example, know what research
says about teaching and learning, understand curriculum, be able to evaluate their staff from
an improvement-based mindset, build a positive school culture, and use data to improve
instruction. To do these things well, principals need guidance. Because levels of motivation
and performance rely heavily on efficacy beliefs (Bandura & Locke, 2003), and we know
that mentoring increases levels of self-efficacy, the development a quality mentoring
program is valid. According to the research in this study, a structured and theory-based
mentoring program would improve a principal’s self-efficacy in instructional leadership
principles; thus, giving him or her the confidence to lead their staff to instructional
improvements and their students to higher levels of achievement.
85
References
Bandura, A. (1977). Social learning theory. Englewood Cliffs, NJ: Prentice-Hall.
Bandura, A. (1986). Social foundations of thought and action: A social cognitive theory.
Englewood Cliffs, NJ: Prentice-Hall.
Bandura, A. (1994). Encyclopedia of human psychology. In Self-Efficacy (4). Retrieved from
www.des.emory.edu/mfp/BanEncy.html
Bandura, A. (1994). Self-Efficacy. Encyclopedia of Human Behavior, 4, 71-81.
Bandura, A. (1997). Self-efficacy, the exercise of control. New York: Freeman.
Bandura, A., & Locke, E. A. (2003). Negative self-efficacy and goal effects revisited.
Journal of Applied Psychology, 88, 87-99. http://dx.doi.org/10.1037/0021-
9010.88.1.87
Barth, R. (1990). Improving schools from within. San Francisco: Jossey-Bass.
Blase, J., & Blase, J. (1999, August). Principals’ instructional leadership and teacher
development: Teachers’ perspectives. Educational Administration Quarterly, 35, 349-
378. http://dx.doi.org/10.1177/0013161X99353003
Canales, M., Tejeda-Delgado, C., & Slate, J. (2008). Leadership behaviors of
superintendent/principals in small, rural school districts in Texas. Rural Educator,
29(3), 1-7. Retrieved December 16, 2014, from http://eric.ed.gov/?id=EJ869292
Coladarci, T. (1992). Teachers' sense of efficacy and commitment to teaching. The Journal of
Experimental Education, 60 (4), pp. 323-337.
Cotton, K. (2003). Principals and student achievement: What the research says. Association
for Supervision and Curriculum Development. Alexandria, VA: ASCD.
86
Council for Chief State School Officers. (1996). Interstate school leaders’ licensure
consortium: Standards for school leaders. Washington DC
Creswell, J. W. (2009). Research design: Qualitative, quantitative, and mixed methods
approaches (3rd ed.). Thousand Oaks, CA: Sage.
Danielson, C. (2007). Enhancing professional practice: A framework for teaching (2nd ed.).
Association for Supervision and Curriculum Development. Alexandria, VA: ASCD.
Daresh, J. C. (1995). Research base on mentoring for educational leaders: What do we know?
Journal of Educational Administration, 33(5), 7-16.
Daresh, J. C. (2001). Leaders helping leaders: A practical guide to administrative mentoring.
Thousand Oaks, CA: Corwin.
Daresh, J. C., & Playko, M. A. (April 1, 1990). Mentoring for effective school
administration. Urban Education, 25, 43.
http://dx.doi.org/10.1177/0042085990025001005
Darling-Hammond, L.; LaPoint, M.; Meyerson, D.; Orr, M. T., & Cohen, C. (2007).
Preparing school leaders for a changing world: Lessons from exemplary leadership
development programs. Stanford Educational Leadership Institute. Retrieved from
http://seli.standford.edu
DuFour, R. (2002, May). The learning centered principal. Educational Leadership, 59(8), 12-
15.
87
Duncan, O. D. (1966, July). Path analysis: Sociological examples. The American Journal of
Sociology, 72(1), 1-33. Retrieved from
http://www.jstor.org/discover/10.2307/2775755?uid=3739728&uid=2134&uid=4575
101287&uid=2&uid=70&uid=3&uid=4575101277&uid=3739256&uid=60&purchas
e-type=article&accessType=none&sid=21101244160037&showMyJstorPss
=false&seq=2&showAccess=false
Educational Leadership Policy Standards. (2008). Retrieved from
http://www.ccsso.org/documents/2008/educational_leadership_policy_standards_200
8.pdf
Ehrich, L. C., Hansford, B., & Tennent, L. (2004, October). Formal mentoring programs in
education and other professions: A review of the literature. Educational
Administration Quarterly, 40, 518-540.
http://dx.doi.org/10.1177/0013161X04267118
Elmore, R. F. (2000). Building a new structure for leadership [Research paper].
Fink, E., & Resnik, L. B. (2001). Developing principals as instructional leaders. Phi Delta
Kappan. Retrieved from http://www.lrdc.pitt.edu/hplc/publications/finkresnick.pdf
Fiore, D. J. (2004). Introduction to educational administration standards, theories, and
practices. Larchmont, NY: Eye on Education.
Glickman, C. D. (2002). Leadership for learning, “How to help teachers succeed.”
Alexandria, VA: ASCD
Glickman, C. D., Gordon, S. P., & Ross-Gordon, J. M. (2004). Supervision and instructional
leadership: A developmental approach (6th ed.). Boston: Pearson.
88
Goldberg, M., & Harvey, J. (1983). A nation at risk: The report of the national commission
on excellence in education. Phi Delta Kapan, 65(1), 14-18. Retrieved from
http://www.jstor.org/discover/10.2307/20386898?uid=3739728&uid=2134&uid=2&u
id=70&uid=4&uid=3739256&sid=47699038106387
Hallinger, P. (2005). Instructional leadership and the school principal: A passing fancy that
refuses to fade away. Leadership and Policy in Schools, 4, 221-239.
http://dx.doi.org/10.1080/15700760500244793
Hallinger, P., Chung, W., & Wen, C. (2012). Assessing the measurement properties of the
principal instructional management rating scale: A meta-analysis of reliability studies
[Monograph]. Gateways to Leading Learning: APCLC Monograph Series, 4.
Hallinger, P., & Heck, R. H. (1998). Exploring the principal’s contribution to school
effectiveness: 1980-1995. School Effectiveness and School Improvement: An
International Journal of Research, Policy, and Practice, 9(2), 157-191. Retrieved
from http://dx.doi.org/10.1080/0924345980090203
Hallinger, P., Leithwood, K., & Murphy, J. (1993). Cognitive perspectives on educational
leadership. New York: Teachers College, Columbia University.
Hallinger, P., & McCary, C. E. (1990, November). Developing the strategic thinking of
instructional leaders. The Elementary School Journal, 91(2), 89-108. Retrieved from
http://www.jstor.org/stable/1001745
Hallinger, P., & Murphy, J. F. (1987). Assessing and developing principal instructional
leadership. Educational leadership, 45(1), 54-61.
Harris, S. L., & Lowery, S. (2002, May). A view from the classroom. Educational
Leadership, 59(8), 64-65.
89
Healy, C. C., & Welchert, A. J. (1990, December). Mentoring relations: A definition to
advance research and practice. American Educational Research Association, 19(9),
17-21. Retrieved from http://www.jstor.org/stable/1176974.
Hess, F. M., & Kelly, A. P. (2007). Learning to lead: What gets taught in principal-
preparation programs [Featured article]. Teachers College Record, 109(1), 244-274.
Retrieved from http://corwin.emich.edu.ezproxy.emich.edu/sfx_local?sid=CSA
Hopkins, D., & Jackson, D. (2003). Building the capacity for leading and learning, in A.
Harris, C. Day, M. Hadfield, D. Hopkins, A. Hargreaves, and C. Chapman, (EDS).
Effective Leadership for School Improvement, 84-101.
Hoy, W. K., Tarter, C. J., & Kottencamp (1991). Faculty trust in colleagues: Linking the
principal with school effectiveness. Journal of Research and Development in
Education, 26, 38-45.
Hoyle, R. H. (2007). Encyclopedia of social science research methods: Confirmatory factor
analysis (1 ed.). http://dx.doi.org/http://dx.doi.org/10.4135/9781412950589.n156
Interstate school leaders’ licensure consortium: Standards for school leaders. (1996).
Retrieved from www.ccsso.org/.../educational_leadership_policy_standards_2008.pd
Jourdan, F. (1991). The influence of feedback framing on the self-regulatory mechanizms
governing complex decision making (Doctoral dissertation). Retrieved from Ph.D.
diss, Stanford, CA: Stanford University.
Knowles, M. (2002). Malcolm Knowles, informal adult education, self-direction, and
andragogy. The Encyclopedia of Informal Education. Retrieved from
www.infed.org/thinkers/et-knowl.htm
90
Knowles, M.S. (1980). The modern practice of adult education: From pedagogy to
andragogy. Chicago: Follett.
Kram, K. E. (1985). Mentoring at work. Lanham, MD: University Press of America.
Krathwohl, D. R. (2009). Methods of educational and social science research (3rd ed.). Long
Grove, IL: Waveland.
Leithwood, K., Jantzi, D., & Steinbach, R. (1999). Changing leadership for changing times.
Philadelphia: Open University Press.
Levinson, D. J. (1978). The seasons of a man’s life. NY: Ballantine Books.
Linn, R. L., Baker, E. L., & Bettebenner, D. W. (2002, August). Accountability systems:
Implications of requirements of the no child left behind act of 2001. Educational
Researcher, 31(6), 3-16. doi:10.3102/0013189X031006003
Liu, C. J. (1984). An identification of principals’ instructional leadership in effective high
schools (Unpublished doctoral dissertation). University of Cincinnati, Ohio.
McCormick, M. J. (2001). Self-efficacy and leadership effectiveness: Applying social
cognitive theory to leadership. Journal of Leadership Studies, 8(1), 22-33.
McQuitty, S., & Wolf, M. (2013). Structural equation modeling: A practical introduction.
Journal of African Business, 14, 58-69.
http://dx.doi.org/10.1080/15228916.2013.765325
Paglis, L. L., & Green, S. G. (2002, March). Leadership self-efficacy and managers’
motivation for leading change. Journal of Organizational Behavior, 23, 215-235.
http://dx.doi.org/10.1002/job.137
91
Pajares, F. (2002, Spring). Gender and perceived self-efficacy in self-regulated learning.
Theory into Practice, 41, 116-125. Retrieved from URL:
http://www.jstor.org/stable/1477463
Ragins, B. R., & Kram, K. E. (2007). The handbook of mentoring at work: Theory, research,
and practice. Thousand Oaks, CA: Sage.
Schmoker, M. (2004). The tipping point: From feckless reform to substantive instructional
improvement. Phi Delta Kappan, 85(6), 224-232.
Scholtz, U., Gutierrez-Dona, B., Sud, S., & Schwarzer, R. (2002). Is general self-efficacy a
universal construct? Psychometric findings from 25 countries. European Journal of
Psychological Assessment, 18, 242-251.
http://dx.doi.org/http://dx.doi.org/10.1027//1015-5759.18.3.242
School administrators’ efficacy: A model and measure [Connexions]. (2007, August 7).
National Council of Professors of Educational Administration. Retrieved from
http://cnx.org/content/m14845/1.1/
Schunk, D. H. (2011, November 21). Self-Efficacy and academic motivation. Educational
Psychologist, 26(3-4), 207-231. http://dx.doi.org/10.1080/00461520.1991.9653133
Senge, P. (2000). Schools that learn: A fifth discipline fieldbook for educators, parents, and
everyone who cares about education. New York: Doubleday.
Shipman, N. J., Queen, J. A., & Peel, H. A. (2007). Transforming school leadership with the
ISLLC and ELCC. Retrieved from www.eyeoneducation.com
Sirin, S. R. (2005). Socioeconomic status and academic achievement: A meta-analytic review
of the research. Review of Educational Research, 75(3), 417-453.
http://dx.doi.org/0.3102/00346543075003417
92
Spillane, J. P., Halverson, R., & Diamond, J. B. (April 1, 2001). Investigating school
leadership practice: A distributed perspective. Educational Researcher, 23-27.
http://dx.doi.org/10.3102/0013189X030003023
Spillane, J. P., Halverson, R., & Diamond, J. B. (2004). Towards a theory of leadership
practice: Toward a distributed perspective. Journal of Curriculum Studies, 36, 3-34.
http://dx.doi.org/10.1080/0022027032000106726
Thompson, J. D. (2008). Organizations in action: Social science bases of administrative
theory (2nd ed.). New Brunswick, NJ: McGraw-Hill.
Tschannen-Moran, M., & Gareis, C. R. (2004). Principals’ sense of efficacy: Assessing a
promising construct. Journal of Educational Administration, 42(5), 573-585.
doi:10.1108/09578230410554070
Tschannen-Moran, M., & Hoy, W. (1998). Trust in schools: A conceptual and empirical
analysis. Journal of Educational Administration, 36(4), 334-352.
doi:10.1108/09578239810211518
Wasden, D. (1988). The mentoring handbook. Provo, UT: Brigham Young University,
College of Education.
Weick, K. E. (1982, June). Administering education in loosely coupled schools. The Phi
Delta Kappan, 63(10), 673-676. Retrieved from http://.jstor.org/stable/20386508
Weston, R., & Gore, P. A., Jr., (2006, August 10). A brief guide to structural equation
modeling. The Counseling Psychologist, 34, 719-751.
http://dx.doi.org/10.1177/0011000006286345
Wilson, M. (2004). Toward coherence between classroom assessment and accountability.
Chicago: University of Chicago Press.
93
Wood, M. (1997). Gender differences in mentoring: A biographical reflection. Educational
Management and Administration, 25(1), 25-34.
Wood, R., & Bandura, A. (1989). Social cognitive theory of organizational management.
Academy of Management Review, 14(3), 361-84.
Wright, J., & Mischel, W. (1982). Influence of affect on cognitive social learning person
variables. Journal of Personality and Social Psychology, 43, 901-914.

94
Appendices
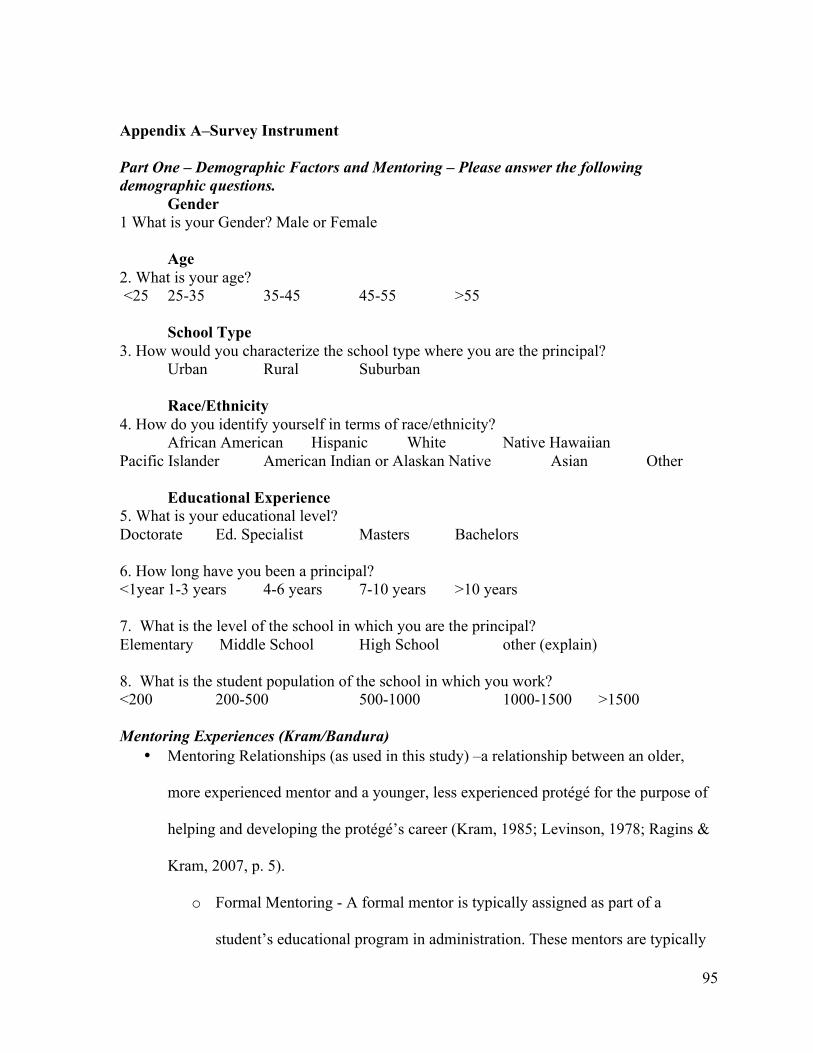
95
Appendix A–Survey Instrument
Part One – Demographic Factors and Mentoring – Please answer the following demographic questions. Gender 1 What is your Gender? Male or Female Age 2. What is your age? <25 25-35 35-45 45-55 >55 School Type 3. How would you characterize the school type where you are the principal? Urban Rural Suburban Race/Ethnicity 4. How do you identify yourself in terms of race/ethnicity? African American Hispanic White Native Hawaiian Pacific Islander American Indian or Alaskan Native Asian Other Educational Experience 5. What is your educational level? Doctorate Ed. Specialist Masters Bachelors 6. How long have you been a principal? <1year 1-3 years 4-6 years 7-10 years >10 years 7. What is the level of the school in which you are the principal? Elementary Middle School High School other (explain) 8. What is the student population of the school in which you work? <200 200-500 500-1000 1000-1500 >1500 Mentoring Experiences (Kram/Bandura)
• Mentoring Relationships (as used in this study) –a relationship between an older,
more experienced mentor and a younger, less experienced protégé for the purpose of
helping and developing the protégé’s career (Kram, 1985; Levinson, 1978; Ragins &
Kram, 2007, p. 5).
o Formal Mentoring - A formal mentor is typically assigned as part of a
student’s educational program in administration. These mentors are typically

96
given a set of criteria that the mentees needs to accomplish to complete their
program. Sometimes a school district will assign a mentor to a new principal.
o Informal Mentoring - Informal mentors are those who help to guide a potential
principal and, “show them the ropes” of the job. Informal mentoring
relationships are developed over the natural course of a career.
Please answer the following questions regarding your mentoring experiences based upon
the above definitions.
1. Did you have a formal supervised educational leadership mentoring experience? Yes No 2. If not, did you have any other supervised educational leadership mentoring experience? No Yes, if so please describe ____________________________ 3. Did you have a formal mentor at your internship site(s)? No, I did not have a mentor at any internship site Yes, the principal served as my mentor Yes, someone else served as my mentor (specify role):_________________ 4. Did you have a mentor (either formal or informal, based on the above definitions) work with you regularly? No, my mentor was rarely available to work with me directly on my personal development Yes, a mentor was available to work with me regularly in at least one of my internship sites I did not have a mentor If you did not have a formal or informal mentor that assisted you in learning the position of principal, move on to the Section II Self-efficacy and Instructional Leadership. If you answered yes, continue with the survey. (All answers will be selected from a Likert Scale: Strongly Disagree, Disagree, Agree, Strongly Agree, Neutral Career

97
6. My mentor was more of a coach who guided me in understanding the roles of the principal.
1 2 3 4 5 7. My mentor gave me challenging assignments to help develop my skills as a leader.
1 2 3 4 5 8. My mentor helped to sponsor the advancement in my career.
1 2 3 4 5 Psychosocial 9. My mentor was someone I could trust for advice and support.
1 2 3 4 5 10. I would consider my mentor to be a trusted friend.
1 2 3 4 5 11. My mentor provided counseling advice to me.
1 2 3 4 5 Vicarious 12. My mentor modeled leadership behaviors that I use in my career.
1 2 3 4 5 13. I worked alongside my mentor while learning the tasks of the job.
1 2 3 4 5 14. I am very similar to my mentor.
1 2 3 4 5 Verbal 15. My mentor gave me verbal encouragement and feedback.
1 2 3 4 5 16. My mentor had the knowledge and skills to help guide my development as a principal.

98
1 2 3 4 5 17. I would consider my mentor to be a skilled leader in their position.
1 2 3 4 5 Quality 18. Rank the quality of your mentoring experience? Extremely Low Quality, Low Quality, Average Quality, High Quality, Extremely High Quality
1 2 3 4 5 Section Two – Self-efficacy in Instructional Leadership categories (School Administrators Efficacy Scale, Dr. Dan McCollum – email permission). Some self developed. Principals are required to have a broad skill set and have many responsibilities. Please answer the following questions about how you perceive your abilities in your current position of principal. Curriculum 1. I am able to understand the process of curriculum design, implementation, and evaluation
1 2 3 4 5
2. I am confident that I possess the skills needed to implement the effective use of resources
so that priority is given to supporting student learning.
1 2 3 4 5
3. I am confident in my understanding of all of the instructional programs in my school
1 2 3 4 5
4. I am confident in my ability to monitor the classroom curriculum to see that it covers the
school’s curricular objectives
1 2 3 4 5
5. I understand how to align curriculum in all content areas
1 2 3 4 5
Staff Evaluation 1. I am able to develop a systematic process for mentoring teachers on my campus.

99
1 2 3 4 5
2. I understand the development of a professional growth plan
1 2 3 4 5
3. I am confident in my abilities to evaluate my staff
1 2 3 4 5
4. I am confident in my knowledge of instruction when facilitating conversations with my
staff
1 2 3 4 5
5. I possess the ability to facilitate meaningful dialogue to assist staff in their own
professional growth
1 2 3 4 5
6. I have the ability to lead staff to set professional goals based on reflective practice
1 2 3 4 5
School Improvement 1. I am confident in my skills to assess the staff development needs of a school
1 2 3 4 5
2. I am confident in my knowledge of best-practice research related to instructional
practices
1 2 3 4 5
3. I am confident in my skills to engage staff in the development of effective campus improvement plans that result in improved student learning 1 2 3 4 5
4. I am confident that I understand and can communicate to staff the complex instructional and motivational issues that are presented by a diverse student population 1 2 3 4 5

100
5. I am able to use strategic planning processes to develop the vision of the school
1 2 3 4 5
6. I am confident that I possess the skills to lead a school community in the development of a clear vision 1 2 3 4 5
7. I am confident in my ability to lead teacher staff development activities centered on instruction 1 2 3 4 5
Use of Data to Improve Instruction 1. I am confident that I know how to use data about our school climate to encourage
appropriate student behavior 1 2 3 4 5
2. I am confident that I know how to use data about our school climate to support a positive learning environment 1 2 3 4 5
3. I am confident that I know how to use data about our school climate to improve the school culture in ways that promotes staff and student morale.
1 2 3 4 5
4. I can explain to staff and parents how student data is used to increase student achievement.
1 2 3 4 5
5. I am confident in my ability to examine student performance data to extract the information necessary for school improvement planning
1 2 3 4 5
Creating a Positive School Culture 1. I have the ability to assess school climate using multiple methods
1 2 3 4 5

101
2. I have the ability to engage parents in the assessment of our school climate
1 2 3 4 5
3. I have the ability to engage staff in the assessment of our school climate
1 2 3 4 5
4. I have the ability to engage students in the assessment of our school climate
1 2 3 4 5
Thank you for taking part in this important research. You have made a valuable
contribution to my study and to the understanding of how mentoring impacts self-efficacy
in instructional leadership behavior.

102
Appendix B–Informed Consent Letter
To: K-12 Grade Public School Principals
Researcher: Julie D. Helber Principal – Saline High School, Saline, Michigan Eastern Michigan University Doctoral Student Dissertation Title: Mentoring and its impact on K-12 public school principals’
instructional leadership self-efficacy. I am a doctoral student at Eastern Michigan University. To complete my degree program I have chosen to conduct a study that I believe has significant relevance in education today. The current literature lacks information on the impact of mentoring and mentoring relationships to a principal’s self-efficacy in instructional leadership tasks. The purpose of this study is to attempt to provide greater clarity on the influence of mentors on educational practice.
This survey is divided into two sections. It is important that both sections are completed to perform a thorough analysis of the survey results.
Only a code number will identify your questionnaire response. The survey is anonymous. At no time will your name be associated with your responses to the questionnaire. All information will be secure at all times.
There are no foreseeable risks to you by completing this survey, as all results will be kept completely confidential. The expected benefits to this study will be that the research will provide information on how mentoring influences self-efficacy in instructional leadership for principals.
Participation in this study is voluntary. Once the completed questionnaire is returned to me, your participation will have been completed. You may choose not to participate. If you do decide to participate, you can change your mind at any time and withdraw from the study without negative consequences.
Results will be presented in aggregate form only. No names or individually identifying information will be revealed. Results may be presented at research meetings and conferences, in scientific publications, and as part of a doctoral thesis being conducted by the principal researcher.
This research protocol and informed consent document has been reviewed and approved by the Eastern Michigan University Human Subjects Review Committee for use from April 13, 2014 to April 13, 2017. If you have questions about the approval process, please contact the USHRC at [email protected] or call 734-486-0042.

103
If you have any questions concerning your participation now or in the future, you can contact the principal researcher, Julie D. Helber at [email protected] or 734-429-8032 or you may contact the dissertation chair, Dr. Ron Williamson at [email protected].
Sincerely,
Julie D. Helber
Consent to Participate:
I have read or had read to me all of the above information about this research study, including the research procedures, possible risks, side effects, and the likelihood of any benefit to me.
By clicking “I agree” in the electronic version of the survey (Survey Monkey) your completion and returning of the survey constitutes consent to participate and no other signature is needed. Further, by agreeing, you are indicating that you are a building principal and understand the consent form and agree to participate in the research study.

104
Appendix C–Permission to Use Survey Instruments
RE: Feedback on Connexions module: School Administrators' Efficacy: A Model and Measure 3 messages
Kajs, Lawrence <[email protected]> Thu, Sep 26, 2013 at 4:37 PM To: Julie Helber <[email protected]> Cc: Dan McCollum <[email protected]> Julie,
I am sending a cc to Dr. Dan McCollum at the University of Maryland, who is first author on this work,
asking him to respond to your email.
The very best in your research.
Sincerely,
Larry Kajs
Lawrence T. Kajs, EdD
Professor & Chair
Educational Leadership
University of Houston-Clear Lake
2700 Bay Area Blvd.
Houston, TX 77059
281.283.3555 (office)
281.283.3630 (fax)
From: Theodore Creighton [mailto:[email protected]]
Sent: Tuesday, September 24, 2013 6:21 AM To: Julie Helber; Kajs, Lawrence
Subject: Re: Feedback on Connexions module: School Administrators' Efficacy: A Model and Measure
Julie - I represent the publisher, and we do not have the rights to this publication, so I am
forwarding your request to author, Dr. Larry Kajs, who owns the rights to the survey instrument

105
you reference. You may contact him directly at the University of Houston Clear Lake
(email: [email protected])
School Administrators' Efficacy: A Model and Measure
On Mon, Sep 23, 2013 at 7:48 PM, Julie Helber <[email protected]> wrote:
Hello, I am interested in using parts of the ELCC Questionnaire for a survey I am developing
for my dissertation research. I am studying how mentoring impacts a principal's self efficacy
in instructional leadership. How might I obtain permission to use parts of your survey?
Feedback on Connexions module: School Administrators' Efficacy: A Model and Measure
(http://cnx.org/content/m14845/latest/)
Julie Helber Principal Saline High School
Dan McCollum <[email protected]> Thu, Sep 26, 2013 at 4:45 PM To: Julie Helber <[email protected]> Cc: "Kajs, Lawrence" <[email protected]> Thank you Larry.
Hi Julie,
You have my permission to use parts of the instrument for your research work. You cannot use the instrument for any work that would lead to making a profit. If you are not already, be aware that using parts of the instrument rather than using it how it currently exists will change its psychometric properties (e.g., reliability). With that said, I see that you are creating a new survey instrument so you will probably evaluate all of that anyway.
Please cite and reference our work appropriately in your paper.
Best wishes,
Dr. Dan McCollum, Ph.D. [Quoted text hidden] -- Dr. Dan McCollum, Ph.D. Senior Research Associate Institutional Research Office
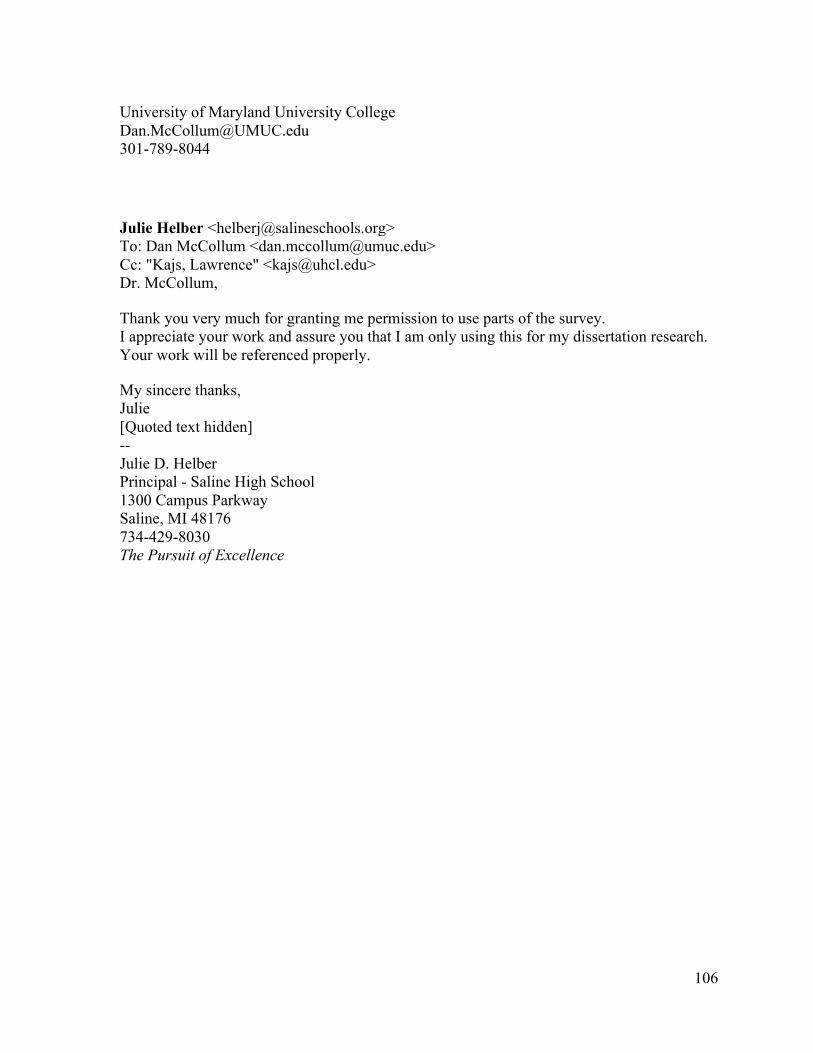
106
University of Maryland University College [email protected] 301-789-8044
Julie Helber <[email protected]> Thu, Sep 26, 2013 at 6:56 PM To: Dan McCollum <[email protected]> Cc: "Kajs, Lawrence" <[email protected]> Dr. McCollum,
Thank you very much for granting me permission to use parts of the survey. I appreciate your work and assure you that I am only using this for my dissertation research. Your work will be referenced properly.
My sincere thanks, Julie [Quoted text hidden] -- Julie D. Helber Principal - Saline High School 1300 Campus Parkway Saline, MI 48176 734-429-8030 The Pursuit of Excellence
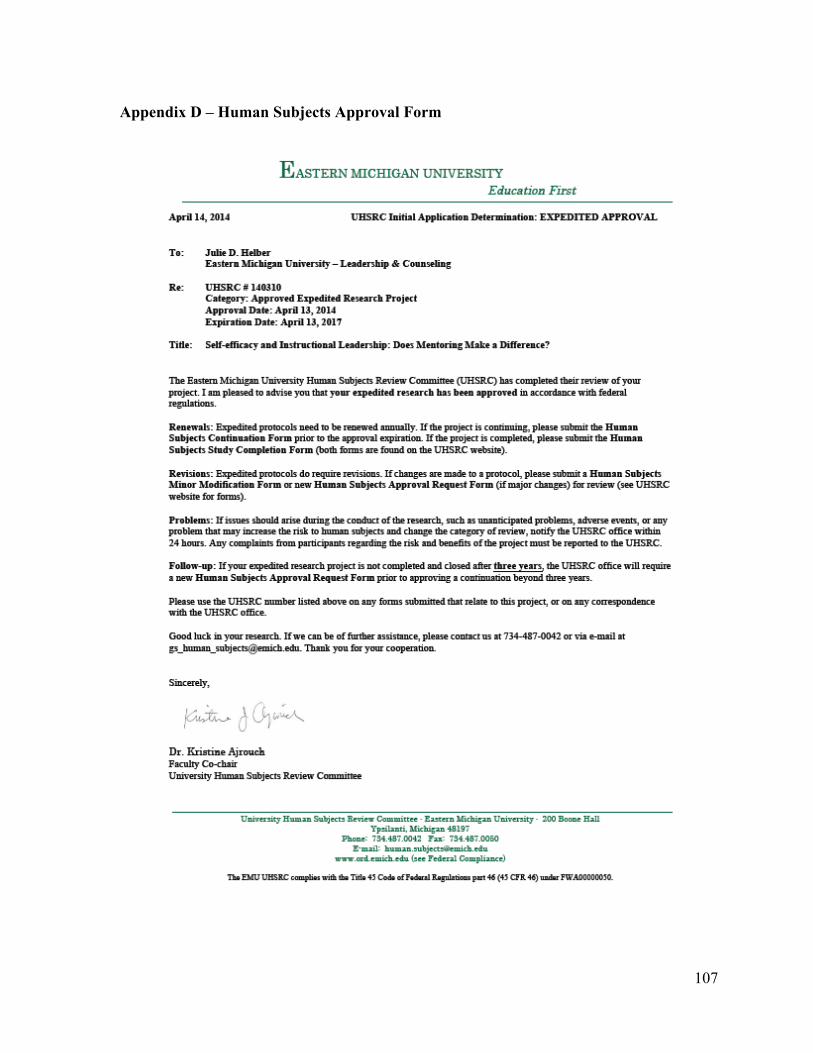
107
Appendix D – Human Subjects Approval Form
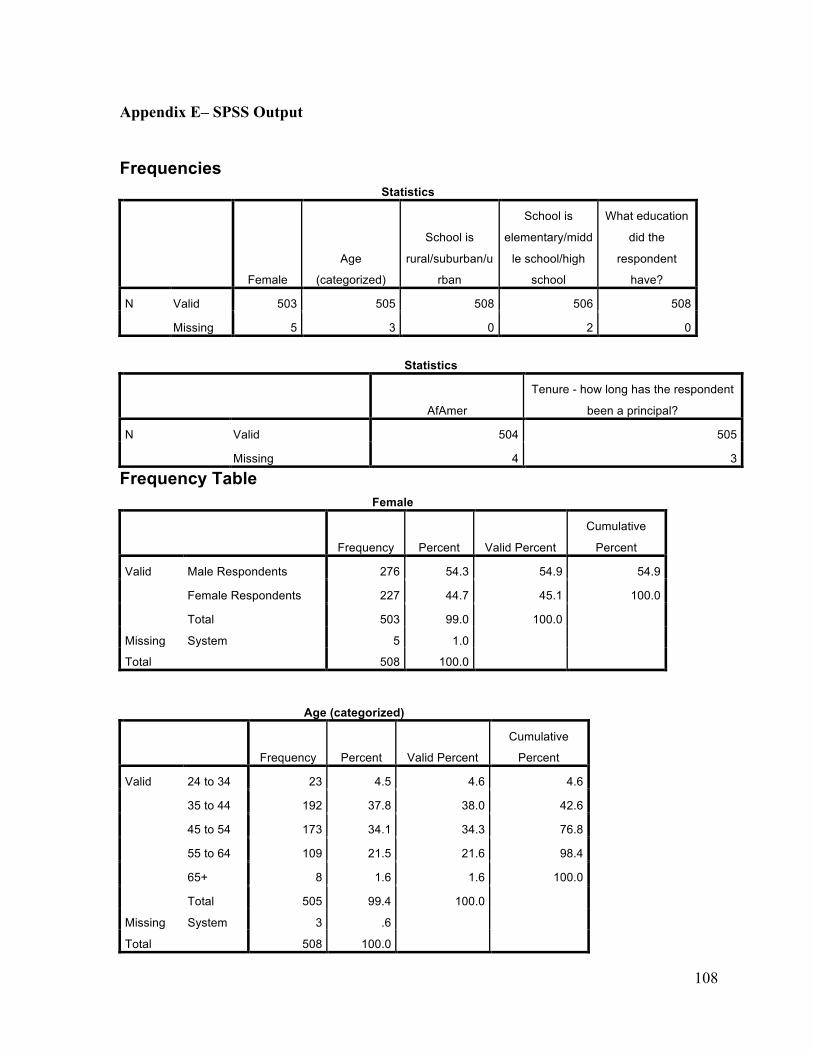
108
Appendix E‒ SPSS Output
Frequencies
Statistics
Female
Age
(categorized)
School is
rural/suburban/u
rban
School is
elementary/midd
le school/high
school
What education
did the
respondent
have?
N Valid 503 505 508 506 508
Missing 5 3 0 2 0
Statistics
AfAmer
Tenure - how long has the respondent
been a principal?
N Valid 504 505
Missing 4 3
Frequency Table Female
Frequency Percent Valid Percent
Cumulative
Percent
Valid Male Respondents 276 54.3 54.9 54.9
Female Respondents 227 44.7 45.1 100.0
Total 503 99.0 100.0 Missing System 5 1.0 Total 508 100.0
Age (categorized)
Frequency Percent Valid Percent
Cumulative
Percent
Valid 24 to 34 23 4.5 4.6 4.6
35 to 44 192 37.8 38.0 42.6
45 to 54 173 34.1 34.3 76.8
55 to 64 109 21.5 21.6 98.4
65+ 8 1.6 1.6 100.0
Total 505 99.4 100.0 Missing System 3 .6 Total 508 100.0
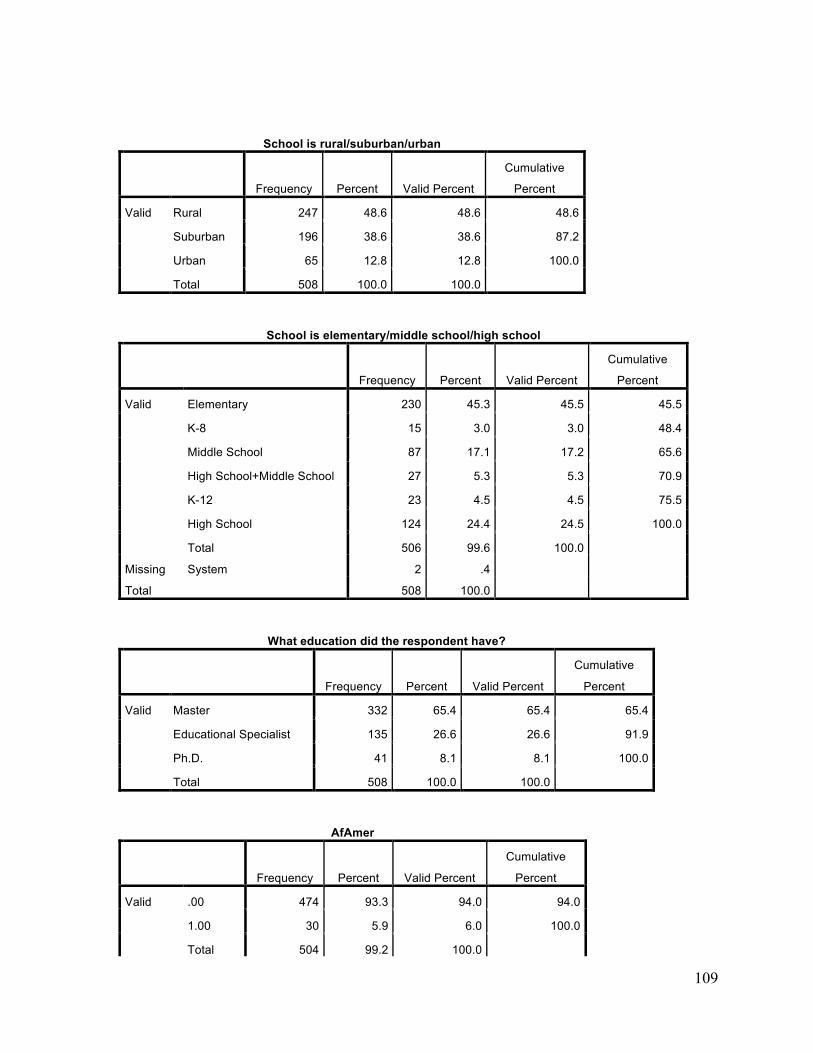
109
School is rural/suburban/urban
Frequency Percent Valid Percent
Cumulative
Percent
Valid Rural 247 48.6 48.6 48.6
Suburban 196 38.6 38.6 87.2
Urban 65 12.8 12.8 100.0
Total 508 100.0 100.0
School is elementary/middle school/high school
Frequency Percent Valid Percent
Cumulative
Percent
Valid Elementary 230 45.3 45.5 45.5
K-8 15 3.0 3.0 48.4
Middle School 87 17.1 17.2 65.6
High School+Middle School 27 5.3 5.3 70.9
K-12 23 4.5 4.5 75.5
High School 124 24.4 24.5 100.0
Total 506 99.6 100.0 Missing System 2 .4 Total 508 100.0
What education did the respondent have?
Frequency Percent Valid Percent
Cumulative
Percent
Valid Master 332 65.4 65.4 65.4
Educational Specialist 135 26.6 26.6 91.9
Ph.D. 41 8.1 8.1 100.0
Total 508 100.0 100.0
AfAmer
Frequency Percent Valid Percent
Cumulative
Percent
Valid .00 474 93.3 94.0 94.0
1.00 30 5.9 6.0 100.0
Total 504 99.2 100.0
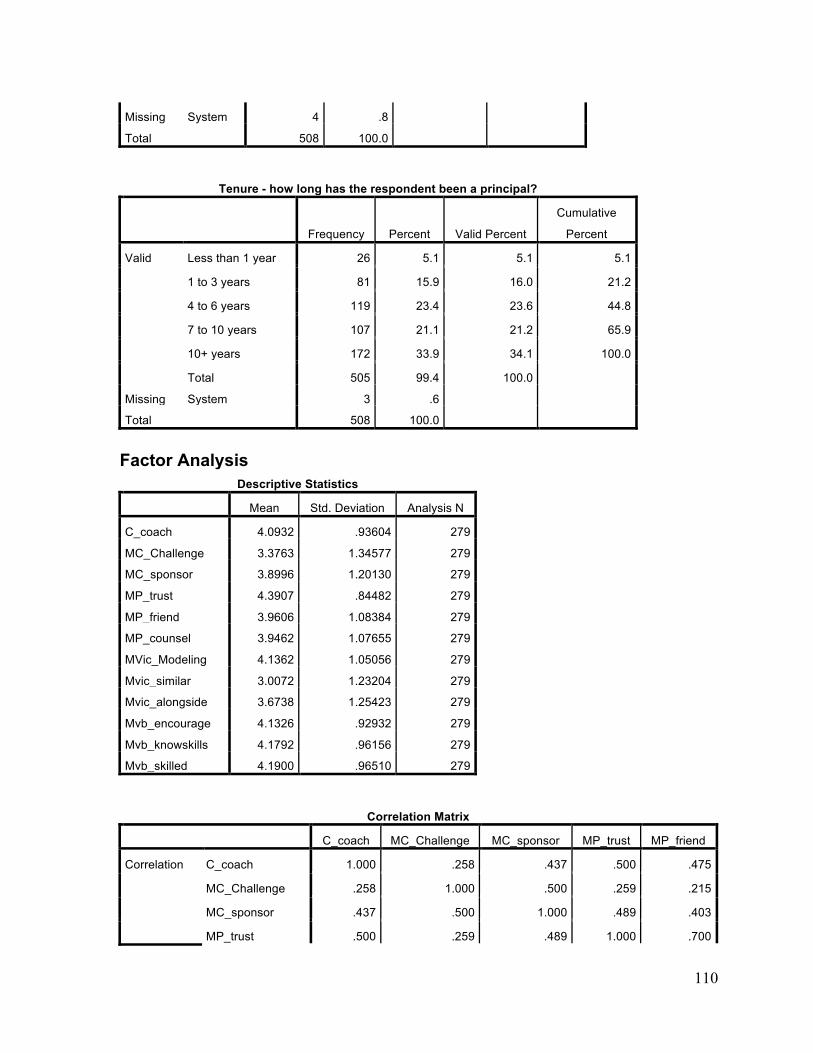
110
Missing System 4 .8 Total 508 100.0
Tenure - how long has the respondent been a principal?
Frequency Percent Valid Percent
Cumulative
Percent
Valid Less than 1 year 26 5.1 5.1 5.1
1 to 3 years 81 15.9 16.0 21.2
4 to 6 years 119 23.4 23.6 44.8
7 to 10 years 107 21.1 21.2 65.9
10+ years 172 33.9 34.1 100.0
Total 505 99.4 100.0 Missing System 3 .6 Total 508 100.0
Factor Analysis
Descriptive Statistics
Mean Std. Deviation Analysis N
C_coach 4.0932 .93604 279
MC_Challenge 3.3763 1.34577 279
MC_sponsor 3.8996 1.20130 279
MP_trust 4.3907 .84482 279
MP_friend 3.9606 1.08384 279
MP_counsel 3.9462 1.07655 279
MVic_Modeling 4.1362 1.05056 279
Mvic_similar 3.0072 1.23204 279
Mvic_alongside 3.6738 1.25423 279
Mvb_encourage 4.1326 .92932 279
Mvb_knowskills 4.1792 .96156 279
Mvb_skilled 4.1900 .96510 279
Correlation Matrix
C_coach MC_Challenge MC_sponsor MP_trust MP_friend
Correlation C_coach 1.000 .258 .437 .500 .475
MC_Challenge .258 1.000 .500 .259 .215
MC_sponsor .437 .500 1.000 .489 .403
MP_trust .500 .259 .489 1.000 .700
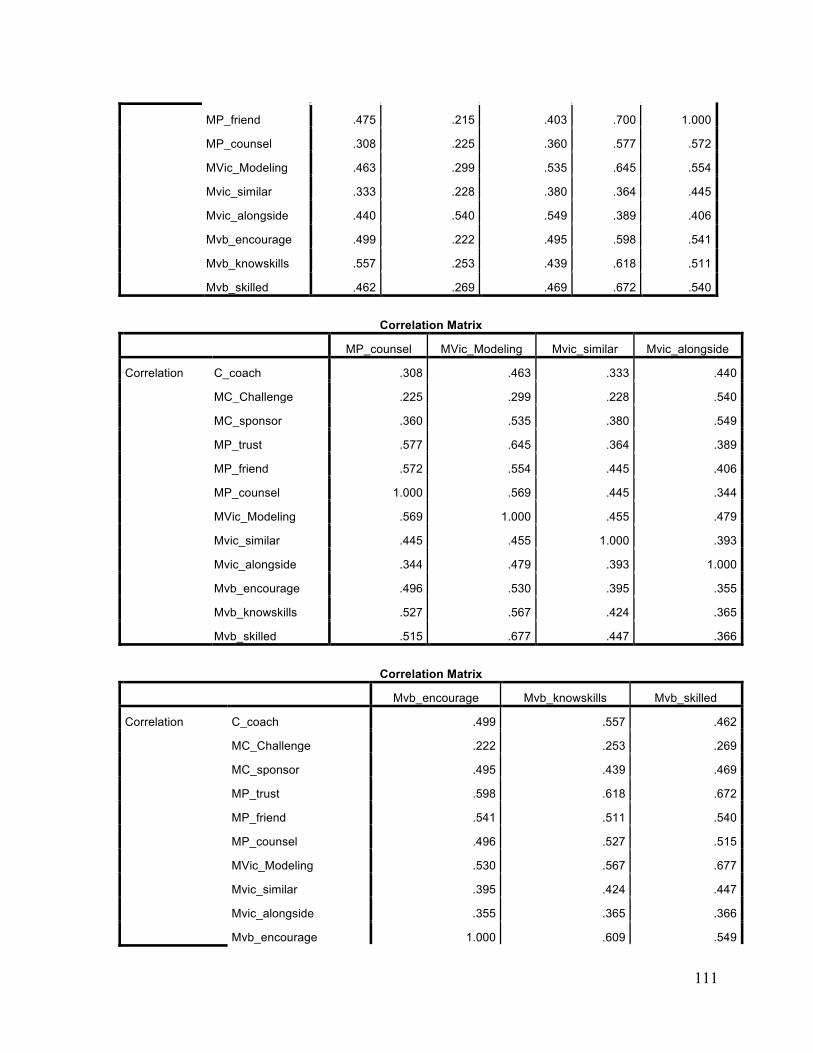
111
MP_friend .475 .215 .403 .700 1.000
MP_counsel .308 .225 .360 .577 .572
MVic_Modeling .463 .299 .535 .645 .554
Mvic_similar .333 .228 .380 .364 .445
Mvic_alongside .440 .540 .549 .389 .406
Mvb_encourage .499 .222 .495 .598 .541
Mvb_knowskills .557 .253 .439 .618 .511
Mvb_skilled .462 .269 .469 .672 .540
Correlation Matrix
MP_counsel MVic_Modeling Mvic_similar Mvic_alongside
Correlation C_coach .308 .463 .333 .440
MC_Challenge .225 .299 .228 .540
MC_sponsor .360 .535 .380 .549
MP_trust .577 .645 .364 .389
MP_friend .572 .554 .445 .406
MP_counsel 1.000 .569 .445 .344
MVic_Modeling .569 1.000 .455 .479
Mvic_similar .445 .455 1.000 .393
Mvic_alongside .344 .479 .393 1.000
Mvb_encourage .496 .530 .395 .355
Mvb_knowskills .527 .567 .424 .365
Mvb_skilled .515 .677 .447 .366
Correlation Matrix
Mvb_encourage Mvb_knowskills Mvb_skilled
Correlation C_coach .499 .557 .462
MC_Challenge .222 .253 .269
MC_sponsor .495 .439 .469
MP_trust .598 .618 .672
MP_friend .541 .511 .540
MP_counsel .496 .527 .515
MVic_Modeling .530 .567 .677
Mvic_similar .395 .424 .447
Mvic_alongside .355 .365 .366
Mvb_encourage 1.000 .609 .549
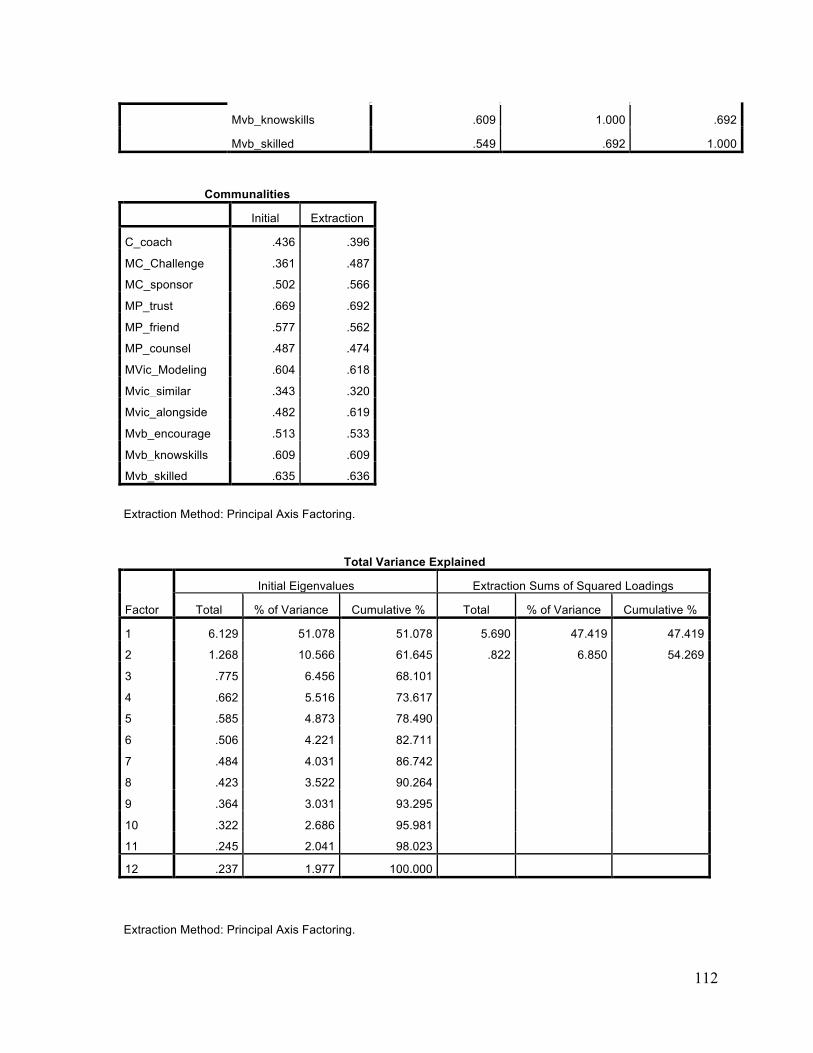
112
Mvb_knowskills .609 1.000 .692
Mvb_skilled .549 .692 1.000
Communalities
Initial Extraction
C_coach .436 .396
MC_Challenge .361 .487
MC_sponsor .502 .566
MP_trust .669 .692
MP_friend .577 .562
MP_counsel .487 .474
MVic_Modeling .604 .618
Mvic_similar .343 .320
Mvic_alongside .482 .619
Mvb_encourage .513 .533
Mvb_knowskills .609 .609
Mvb_skilled .635 .636
Extraction Method: Principal Axis Factoring.
Total Variance Explained
Factor
Initial Eigenvalues Extraction Sums of Squared Loadings
Total % of Variance Cumulative % Total % of Variance Cumulative %
1 6.129 51.078 51.078 5.690 47.419 47.419
2 1.268 10.566 61.645 .822 6.850 54.269
3 .775 6.456 68.101 4 .662 5.516 73.617 5 .585 4.873 78.490 6 .506 4.221 82.711 7 .484 4.031 86.742 8 .423 3.522 90.264 9 .364 3.031 93.295 10 .322 2.686 95.981 11 .245 2.041 98.023 12 .237 1.977 100.000
Extraction Method: Principal Axis Factoring.
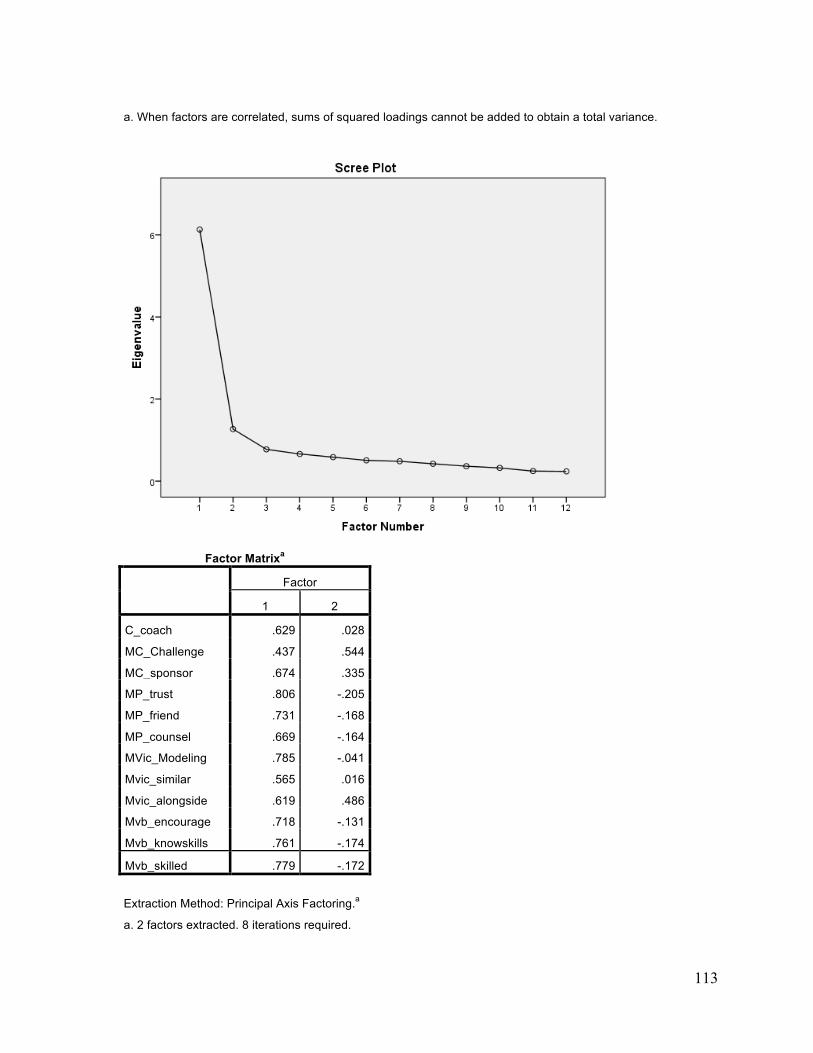
113
a. When factors are correlated, sums of squared loadings cannot be added to obtain a total variance.
Factor Matrixa
Factor
1 2
C_coach .629 .028
MC_Challenge .437 .544
MC_sponsor .674 .335
MP_trust .806 -.205
MP_friend .731 -.168
MP_counsel .669 -.164
MVic_Modeling .785 -.041
Mvic_similar .565 .016
Mvic_alongside .619 .486
Mvb_encourage .718 -.131
Mvb_knowskills .761 -.174
Mvb_skilled .779 -.172
Extraction Method: Principal Axis Factoring.a
a. 2 factors extracted. 8 iterations required.
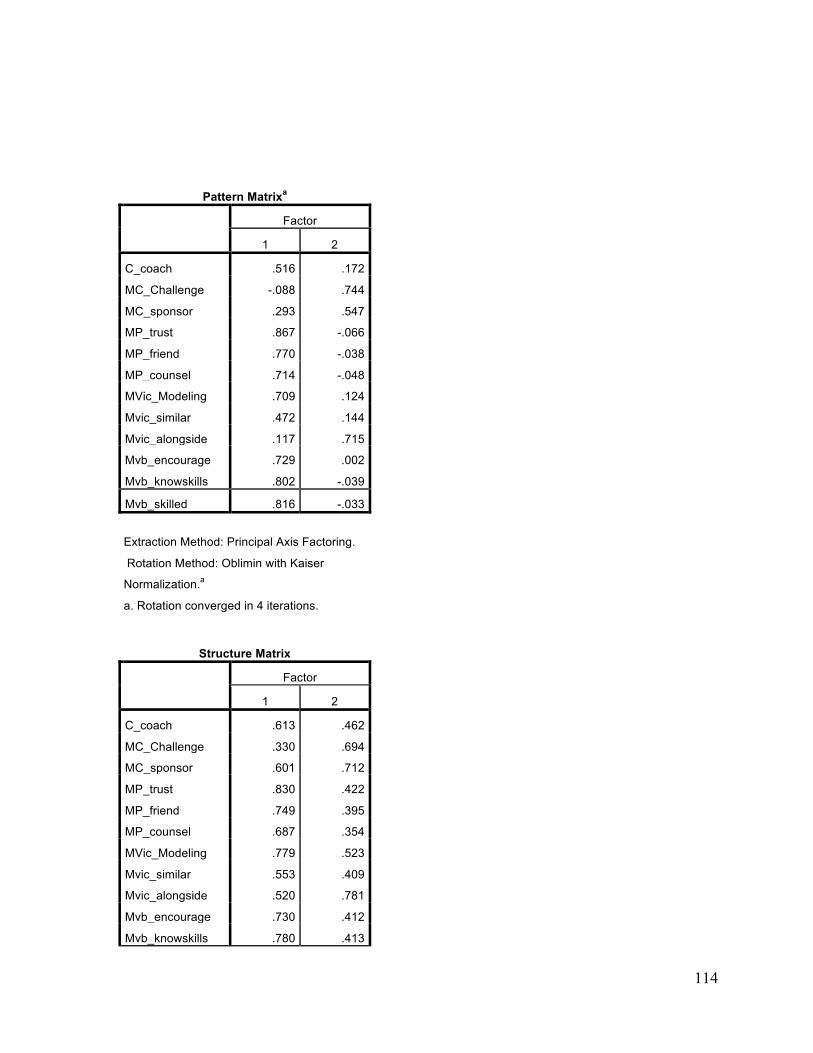
114
Pattern Matrixa
Factor
1 2
C_coach .516 .172
MC_Challenge -.088 .744
MC_sponsor .293 .547
MP_trust .867 -.066
MP_friend .770 -.038
MP_counsel .714 -.048
MVic_Modeling .709 .124
Mvic_similar .472 .144
Mvic_alongside .117 .715
Mvb_encourage .729 .002
Mvb_knowskills .802 -.039
Mvb_skilled .816 -.033
Extraction Method: Principal Axis Factoring.
Rotation Method: Oblimin with Kaiser
Normalization.a
a. Rotation converged in 4 iterations.
Structure Matrix
Factor
1 2
C_coach .613 .462
MC_Challenge .330 .694
MC_sponsor .601 .712
MP_trust .830 .422
MP_friend .749 .395
MP_counsel .687 .354
MVic_Modeling .779 .523
Mvic_similar .553 .409
Mvic_alongside .520 .781
Mvb_encourage .730 .412
Mvb_knowskills .780 .413
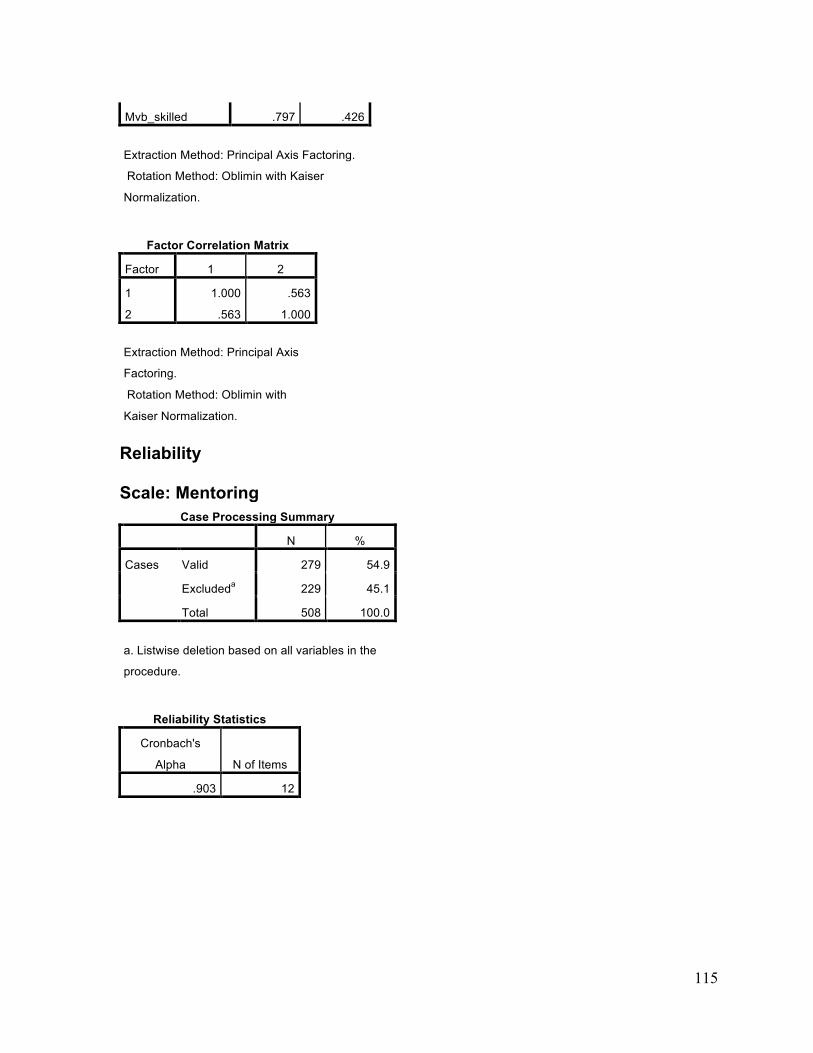
115
Mvb_skilled .797 .426
Extraction Method: Principal Axis Factoring.
Rotation Method: Oblimin with Kaiser
Normalization.
Factor Correlation Matrix
Factor 1 2
1 1.000 .563
2 .563 1.000
Extraction Method: Principal Axis
Factoring.
Rotation Method: Oblimin with
Kaiser Normalization. Reliability Scale: Mentoring
Case Processing Summary
N %
Cases Valid 279 54.9
Excludeda 229 45.1
Total 508 100.0
a. Listwise deletion based on all variables in the
procedure.
Reliability Statistics
Cronbach's
Alpha N of Items
.903 12
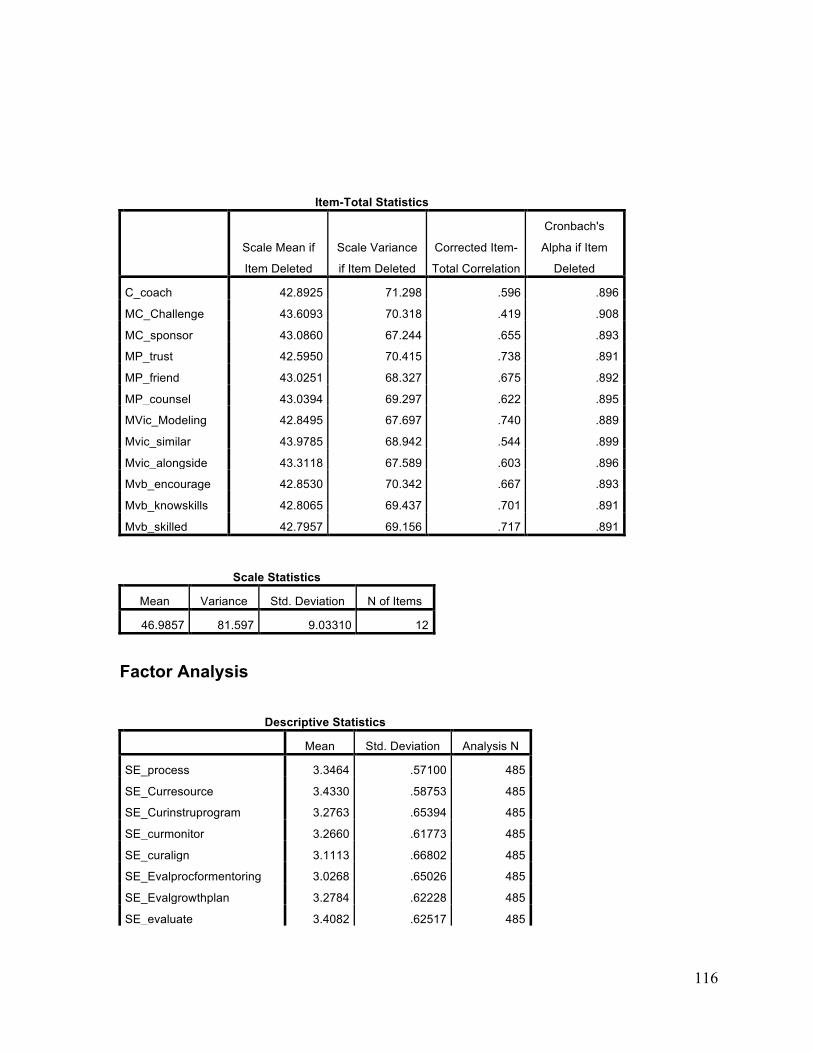
116
Item-Total Statistics
Scale Mean if
Item Deleted
Scale Variance
if Item Deleted
Corrected Item-
Total Correlation
Cronbach's
Alpha if Item
Deleted
C_coach 42.8925 71.298 .596 .896
MC_Challenge 43.6093 70.318 .419 .908
MC_sponsor 43.0860 67.244 .655 .893
MP_trust 42.5950 70.415 .738 .891
MP_friend 43.0251 68.327 .675 .892
MP_counsel 43.0394 69.297 .622 .895
MVic_Modeling 42.8495 67.697 .740 .889
Mvic_similar 43.9785 68.942 .544 .899
Mvic_alongside 43.3118 67.589 .603 .896
Mvb_encourage 42.8530 70.342 .667 .893
Mvb_knowskills 42.8065 69.437 .701 .891
Mvb_skilled 42.7957 69.156 .717 .891
Scale Statistics
Mean Variance Std. Deviation N of Items
46.9857 81.597 9.03310 12
Factor Analysis
Descriptive Statistics
Mean Std. Deviation Analysis N
SE_process 3.3464 .57100 485
SE_Curresource 3.4330 .58753 485
SE_Curinstruprogram 3.2763 .65394 485
SE_curmonitor 3.2660 .61773 485
SE_curalign 3.1113 .66802 485
SE_Evalprocformentoring 3.0268 .65026 485
SE_Evalgrowthplan 3.2784 .62228 485
SE_evaluate 3.4082 .62517 485
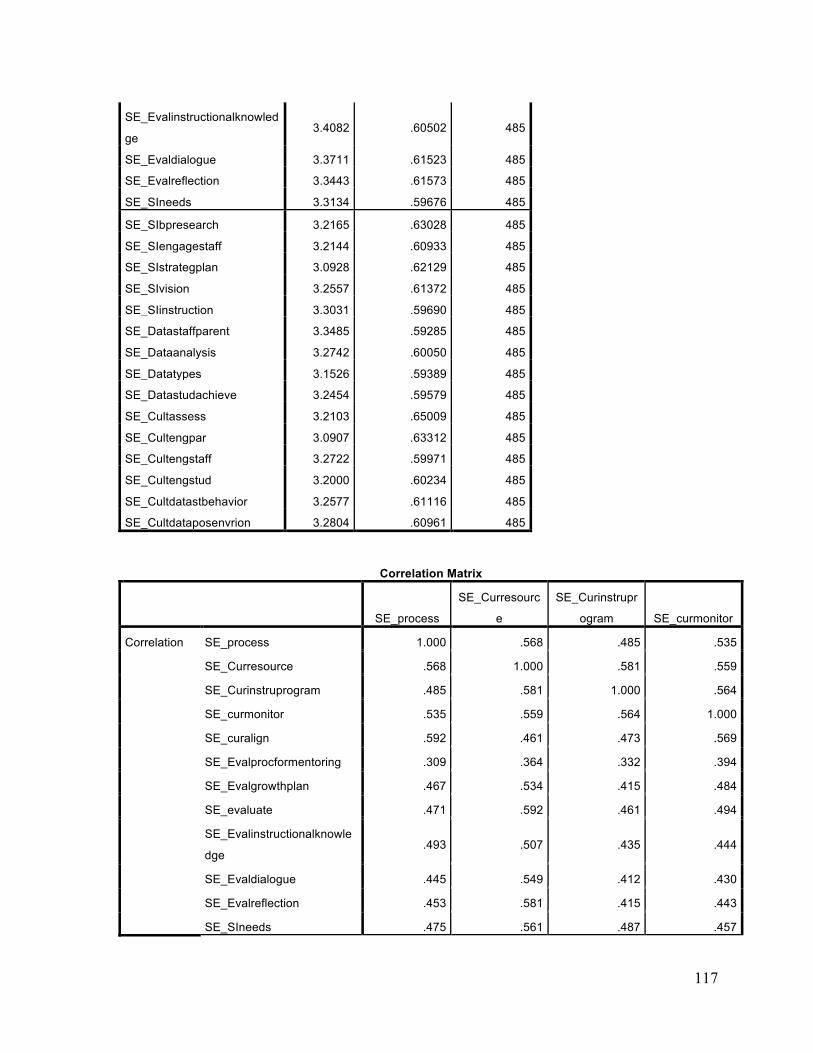
117
SE_Evalinstructionalknowled
ge 3.4082 .60502 485
SE_Evaldialogue 3.3711 .61523 485
SE_Evalreflection 3.3443 .61573 485
SE_SIneeds 3.3134 .59676 485
SE_SIbpresearch 3.2165 .63028 485
SE_SIengagestaff 3.2144 .60933 485
SE_SIstrategplan 3.0928 .62129 485
SE_SIvision 3.2557 .61372 485
SE_SIinstruction 3.3031 .59690 485
SE_Datastaffparent 3.3485 .59285 485
SE_Dataanalysis 3.2742 .60050 485
SE_Datatypes 3.1526 .59389 485
SE_Datastudachieve 3.2454 .59579 485
SE_Cultassess 3.2103 .65009 485
SE_Cultengpar 3.0907 .63312 485
SE_Cultengstaff 3.2722 .59971 485
SE_Cultengstud 3.2000 .60234 485
SE_Cultdatastbehavior 3.2577 .61116 485
SE_Cultdataposenvrion 3.2804 .60961 485
Correlation Matrix
SE_process
SE_Curresourc
e
SE_Curinstrupr
ogram SE_curmonitor
Correlation SE_process 1.000 .568 .485 .535
SE_Curresource .568 1.000 .581 .559
SE_Curinstruprogram .485 .581 1.000 .564
SE_curmonitor .535 .559 .564 1.000
SE_curalign .592 .461 .473 .569
SE_Evalprocformentoring .309 .364 .332 .394
SE_Evalgrowthplan .467 .534 .415 .484
SE_evaluate .471 .592 .461 .494
SE_Evalinstructionalknowle
dge .493 .507 .435 .444
SE_Evaldialogue .445 .549 .412 .430
SE_Evalreflection .453 .581 .415 .443
SE_SIneeds .475 .561 .487 .457
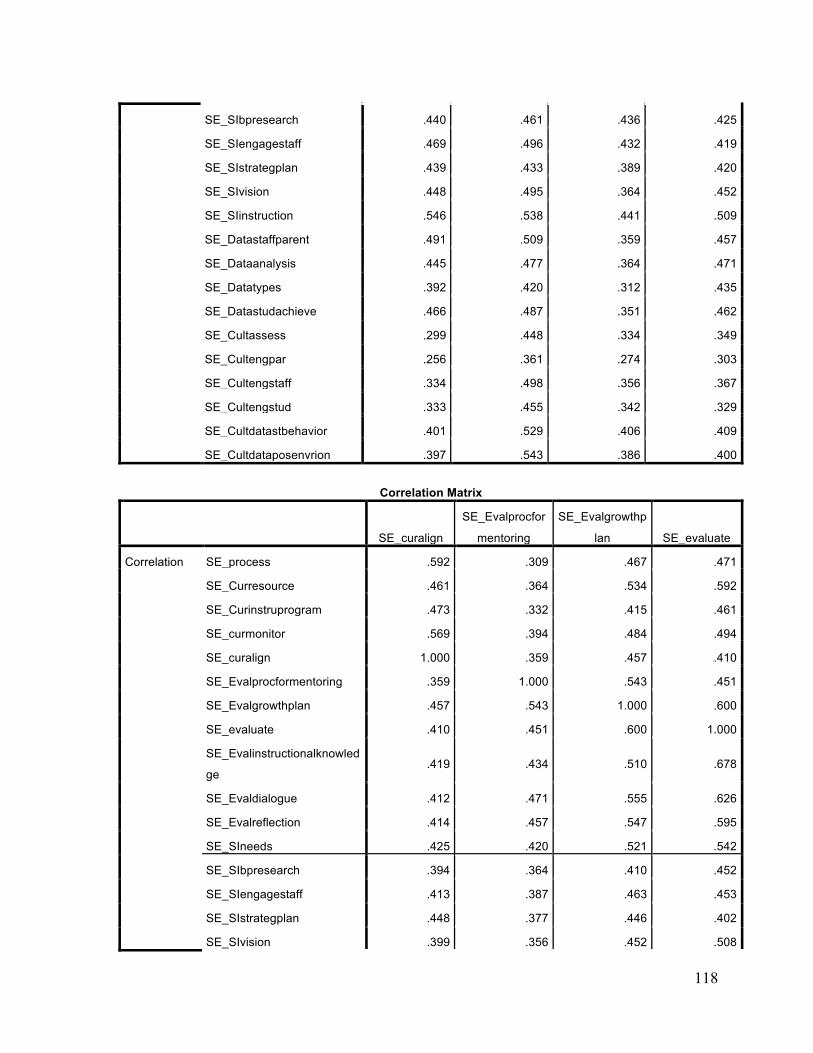
118
SE_SIbpresearch .440 .461 .436 .425
SE_SIengagestaff .469 .496 .432 .419
SE_SIstrategplan .439 .433 .389 .420
SE_SIvision .448 .495 .364 .452
SE_SIinstruction .546 .538 .441 .509
SE_Datastaffparent .491 .509 .359 .457
SE_Dataanalysis .445 .477 .364 .471
SE_Datatypes .392 .420 .312 .435
SE_Datastudachieve .466 .487 .351 .462
SE_Cultassess .299 .448 .334 .349
SE_Cultengpar .256 .361 .274 .303
SE_Cultengstaff .334 .498 .356 .367
SE_Cultengstud .333 .455 .342 .329
SE_Cultdatastbehavior .401 .529 .406 .409
SE_Cultdataposenvrion .397 .543 .386 .400
Correlation Matrix
SE_curalign
SE_Evalprocfor
mentoring
SE_Evalgrowthp
lan SE_evaluate
Correlation SE_process .592 .309 .467 .471
SE_Curresource .461 .364 .534 .592
SE_Curinstruprogram .473 .332 .415 .461
SE_curmonitor .569 .394 .484 .494
SE_curalign 1.000 .359 .457 .410
SE_Evalprocformentoring .359 1.000 .543 .451
SE_Evalgrowthplan .457 .543 1.000 .600
SE_evaluate .410 .451 .600 1.000
SE_Evalinstructionalknowled
ge .419 .434 .510 .678
SE_Evaldialogue .412 .471 .555 .626
SE_Evalreflection .414 .457 .547 .595
SE_SIneeds .425 .420 .521 .542
SE_SIbpresearch .394 .364 .410 .452
SE_SIengagestaff .413 .387 .463 .453
SE_SIstrategplan .448 .377 .446 .402
SE_SIvision .399 .356 .452 .508
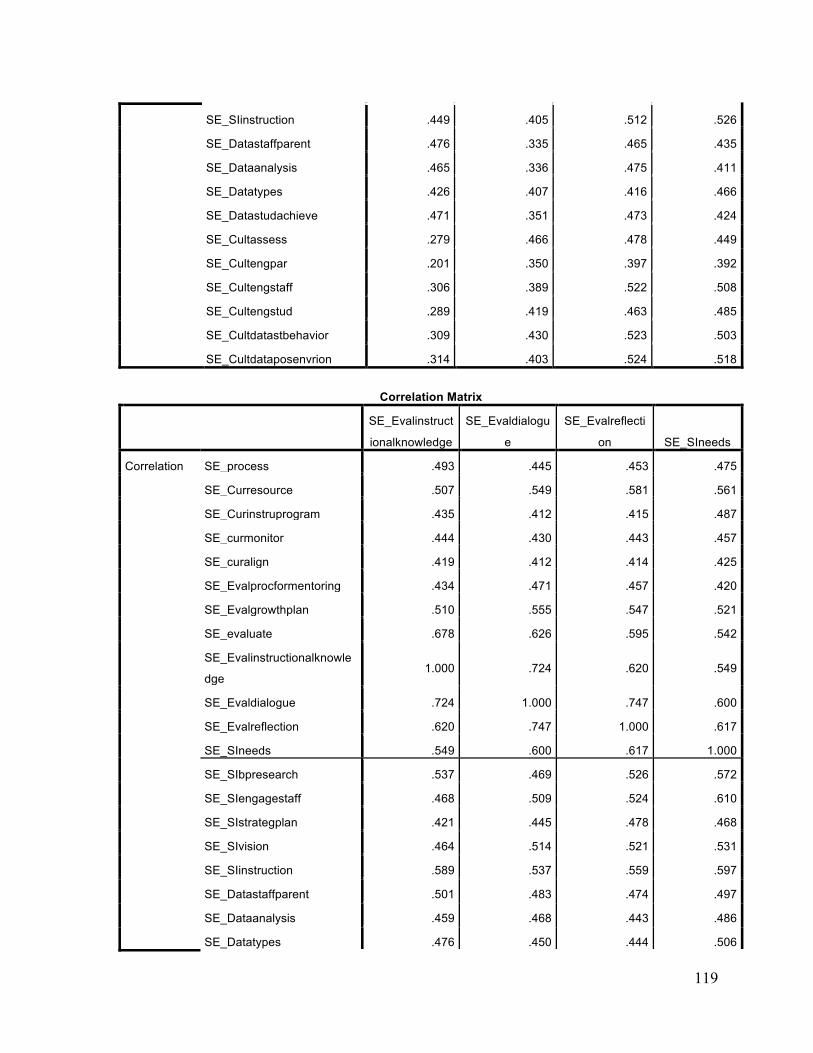
119
SE_SIinstruction .449 .405 .512 .526
SE_Datastaffparent .476 .335 .465 .435
SE_Dataanalysis .465 .336 .475 .411
SE_Datatypes .426 .407 .416 .466
SE_Datastudachieve .471 .351 .473 .424
SE_Cultassess .279 .466 .478 .449
SE_Cultengpar .201 .350 .397 .392
SE_Cultengstaff .306 .389 .522 .508
SE_Cultengstud .289 .419 .463 .485
SE_Cultdatastbehavior .309 .430 .523 .503
SE_Cultdataposenvrion .314 .403 .524 .518
Correlation Matrix
SE_Evalinstruct
ionalknowledge
SE_Evaldialogu
e
SE_Evalreflecti
on SE_SIneeds
Correlation SE_process .493 .445 .453 .475
SE_Curresource .507 .549 .581 .561
SE_Curinstruprogram .435 .412 .415 .487
SE_curmonitor .444 .430 .443 .457
SE_curalign .419 .412 .414 .425
SE_Evalprocformentoring .434 .471 .457 .420
SE_Evalgrowthplan .510 .555 .547 .521
SE_evaluate .678 .626 .595 .542
SE_Evalinstructionalknowle
dge 1.000 .724 .620 .549
SE_Evaldialogue .724 1.000 .747 .600
SE_Evalreflection .620 .747 1.000 .617
SE_SIneeds .549 .600 .617 1.000
SE_SIbpresearch .537 .469 .526 .572
SE_SIengagestaff .468 .509 .524 .610
SE_SIstrategplan .421 .445 .478 .468
SE_SIvision .464 .514 .521 .531
SE_SIinstruction .589 .537 .559 .597
SE_Datastaffparent .501 .483 .474 .497
SE_Dataanalysis .459 .468 .443 .486
SE_Datatypes .476 .450 .444 .506
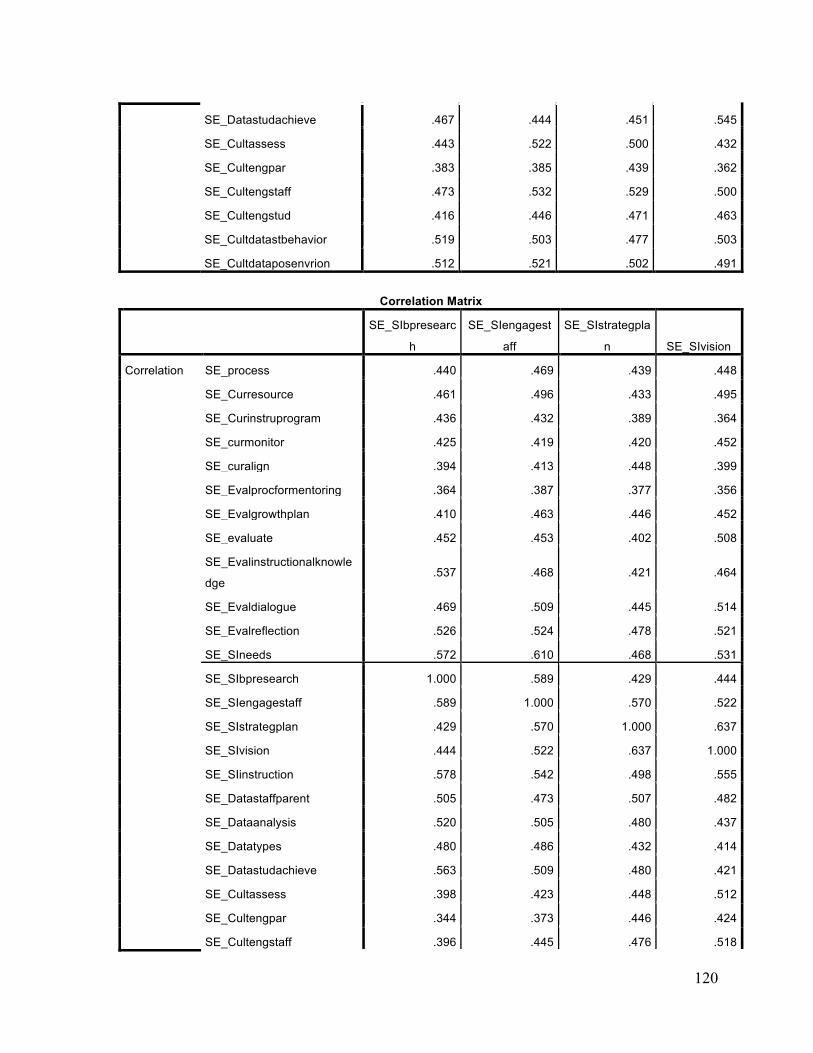
120
SE_Datastudachieve .467 .444 .451 .545
SE_Cultassess .443 .522 .500 .432
SE_Cultengpar .383 .385 .439 .362
SE_Cultengstaff .473 .532 .529 .500
SE_Cultengstud .416 .446 .471 .463
SE_Cultdatastbehavior .519 .503 .477 .503
SE_Cultdataposenvrion .512 .521 .502 .491
Correlation Matrix
SE_SIbpresearc
h
SE_SIengagest
aff
SE_SIstrategpla
n SE_SIvision
Correlation SE_process .440 .469 .439 .448
SE_Curresource .461 .496 .433 .495
SE_Curinstruprogram .436 .432 .389 .364
SE_curmonitor .425 .419 .420 .452
SE_curalign .394 .413 .448 .399
SE_Evalprocformentoring .364 .387 .377 .356
SE_Evalgrowthplan .410 .463 .446 .452
SE_evaluate .452 .453 .402 .508
SE_Evalinstructionalknowle
dge .537 .468 .421 .464
SE_Evaldialogue .469 .509 .445 .514
SE_Evalreflection .526 .524 .478 .521
SE_SIneeds .572 .610 .468 .531
SE_SIbpresearch 1.000 .589 .429 .444
SE_SIengagestaff .589 1.000 .570 .522
SE_SIstrategplan .429 .570 1.000 .637
SE_SIvision .444 .522 .637 1.000
SE_SIinstruction .578 .542 .498 .555
SE_Datastaffparent .505 .473 .507 .482
SE_Dataanalysis .520 .505 .480 .437
SE_Datatypes .480 .486 .432 .414
SE_Datastudachieve .563 .509 .480 .421
SE_Cultassess .398 .423 .448 .512
SE_Cultengpar .344 .373 .446 .424
SE_Cultengstaff .396 .445 .476 .518
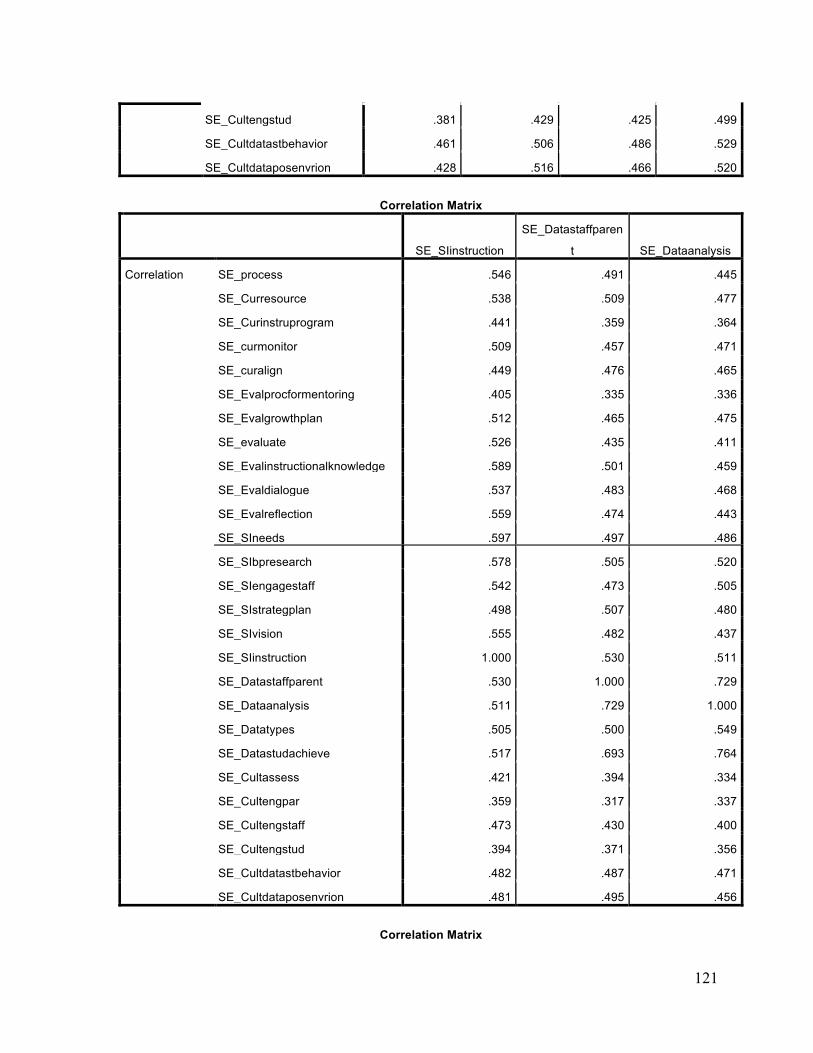
121
SE_Cultengstud .381 .429 .425 .499
SE_Cultdatastbehavior .461 .506 .486 .529
SE_Cultdataposenvrion .428 .516 .466 .520
Correlation Matrix
SE_SIinstruction
SE_Datastaffparen
t SE_Dataanalysis
Correlation SE_process .546 .491 .445
SE_Curresource .538 .509 .477
SE_Curinstruprogram .441 .359 .364
SE_curmonitor .509 .457 .471
SE_curalign .449 .476 .465
SE_Evalprocformentoring .405 .335 .336
SE_Evalgrowthplan .512 .465 .475
SE_evaluate .526 .435 .411
SE_Evalinstructionalknowledge .589 .501 .459
SE_Evaldialogue .537 .483 .468
SE_Evalreflection .559 .474 .443
SE_SIneeds .597 .497 .486
SE_SIbpresearch .578 .505 .520
SE_SIengagestaff .542 .473 .505
SE_SIstrategplan .498 .507 .480
SE_SIvision .555 .482 .437
SE_SIinstruction 1.000 .530 .511
SE_Datastaffparent .530 1.000 .729
SE_Dataanalysis .511 .729 1.000
SE_Datatypes .505 .500 .549
SE_Datastudachieve .517 .693 .764
SE_Cultassess .421 .394 .334
SE_Cultengpar .359 .317 .337
SE_Cultengstaff .473 .430 .400
SE_Cultengstud .394 .371 .356
SE_Cultdatastbehavior .482 .487 .471
SE_Cultdataposenvrion .481 .495 .456
Correlation Matrix

122
SE_Datatypes
SE_Datastudachie
ve SE_Cultassess
Correlation SE_process .392 .466 .299
SE_Curresource .420 .487 .448
SE_Curinstruprogram .312 .351 .334
SE_curmonitor .435 .462 .349
SE_curalign .426 .471 .279
SE_Evalprocformentoring .407 .351 .466
SE_Evalgrowthplan .416 .473 .478
SE_evaluate .466 .424 .449
SE_Evalinstructionalknowledge .476 .467 .443
SE_Evaldialogue .450 .444 .522
SE_Evalreflection .444 .451 .500
SE_SIneeds .506 .545 .432
SE_SIbpresearch .480 .563 .398
SE_SIengagestaff .486 .509 .423
SE_SIstrategplan .432 .480 .448
SE_SIvision .414 .421 .512
SE_SIinstruction .505 .517 .421
SE_Datastaffparent .500 .693 .394
SE_Dataanalysis .549 .764 .334
SE_Datatypes 1.000 .571 .393
SE_Datastudachieve .571 1.000 .389
SE_Cultassess .393 .389 1.000
SE_Cultengpar .353 .335 .616
SE_Cultengstaff .382 .391 .685
SE_Cultengstud .371 .381 .636
SE_Cultdatastbehavior .398 .484 .643
SE_Cultdataposenvrion .412 .447 .643
Correlation Matrix
SE_Cultengpar SE_Cultengstaff SE_Cultengstud
Correlation SE_process .256 .334 .333
SE_Curresource .361 .498 .455
SE_Curinstruprogram .274 .356 .342
SE_curmonitor .303 .367 .329
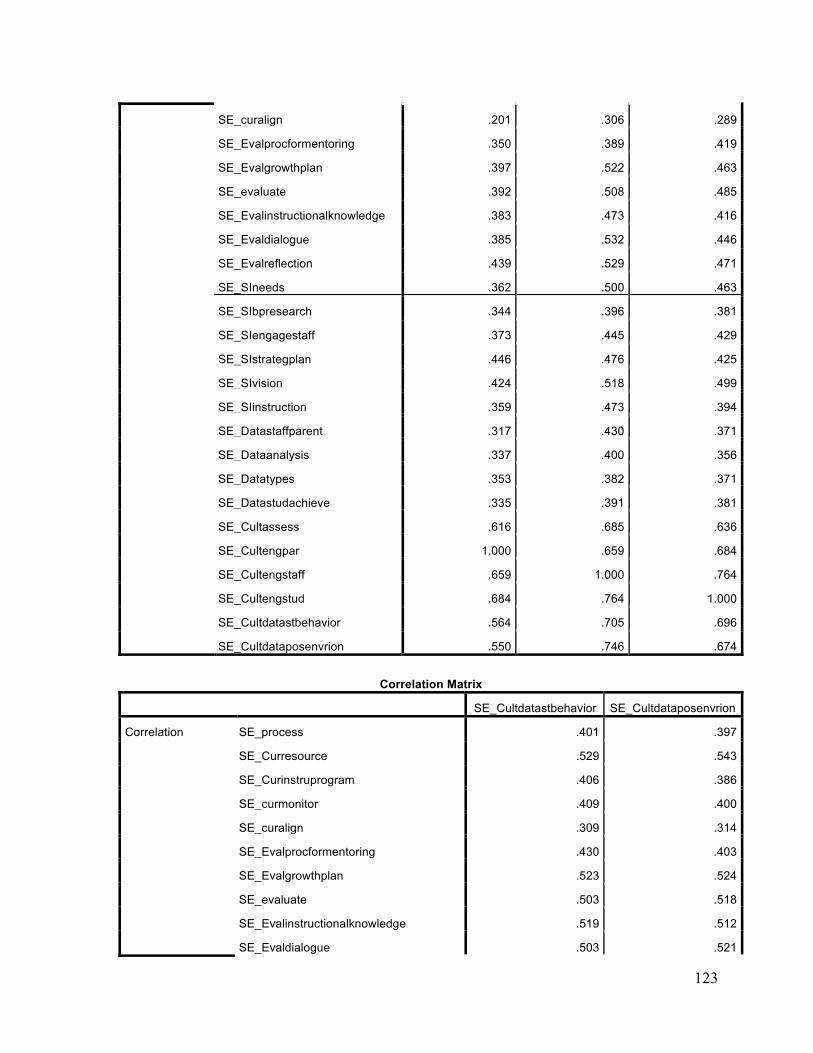
123
SE_curalign .201 .306 .289
SE_Evalprocformentoring .350 .389 .419
SE_Evalgrowthplan .397 .522 .463
SE_evaluate .392 .508 .485
SE_Evalinstructionalknowledge .383 .473 .416
SE_Evaldialogue .385 .532 .446
SE_Evalreflection .439 .529 .471
SE_SIneeds .362 .500 .463
SE_SIbpresearch .344 .396 .381
SE_SIengagestaff .373 .445 .429
SE_SIstrategplan .446 .476 .425
SE_SIvision .424 .518 .499
SE_SIinstruction .359 .473 .394
SE_Datastaffparent .317 .430 .371
SE_Dataanalysis .337 .400 .356
SE_Datatypes .353 .382 .371
SE_Datastudachieve .335 .391 .381
SE_Cultassess .616 .685 .636
SE_Cultengpar 1.000 .659 .684
SE_Cultengstaff .659 1.000 .764
SE_Cultengstud .684 .764 1.000
SE_Cultdatastbehavior .564 .705 .696
SE_Cultdataposenvrion .550 .746 .674
Correlation Matrix
SE_Cultdatastbehavior SE_Cultdataposenvrion
Correlation SE_process .401 .397
SE_Curresource .529 .543
SE_Curinstruprogram .406 .386
SE_curmonitor .409 .400
SE_curalign .309 .314
SE_Evalprocformentoring .430 .403
SE_Evalgrowthplan .523 .524
SE_evaluate .503 .518
SE_Evalinstructionalknowledge .519 .512
SE_Evaldialogue .503 .521
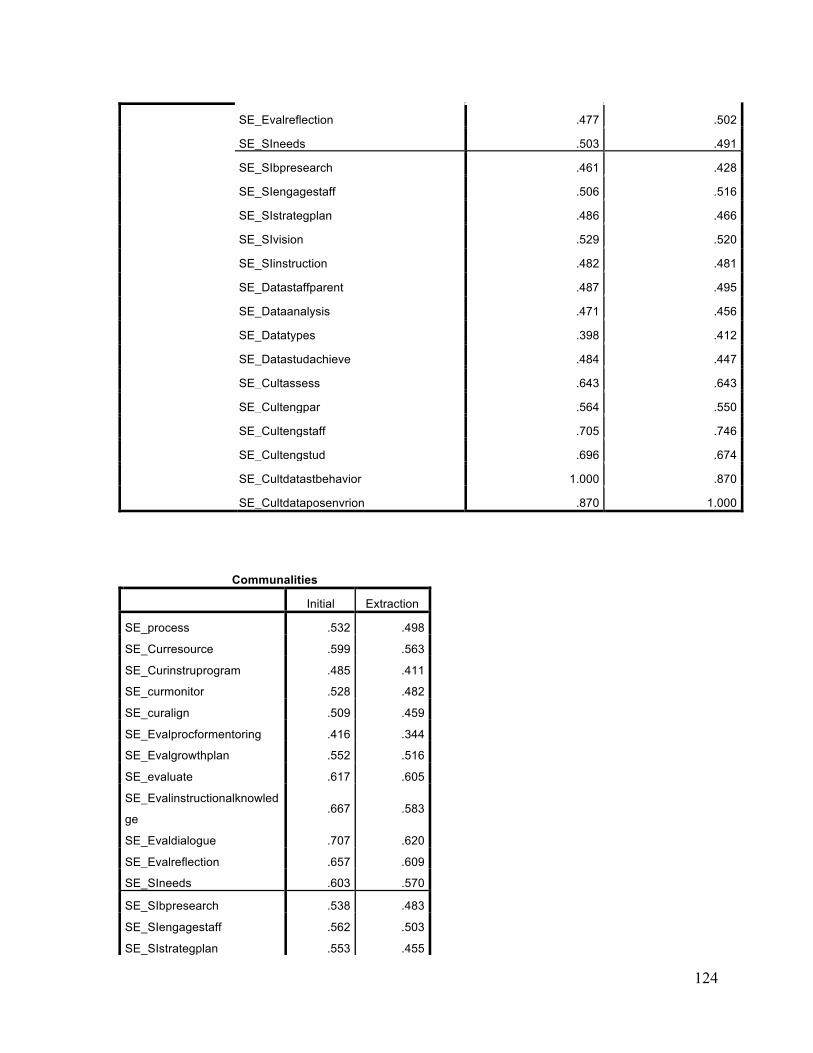
124
SE_Evalreflection .477 .502
SE_SIneeds .503 .491
SE_SIbpresearch .461 .428
SE_SIengagestaff .506 .516
SE_SIstrategplan .486 .466
SE_SIvision .529 .520
SE_SIinstruction .482 .481
SE_Datastaffparent .487 .495
SE_Dataanalysis .471 .456
SE_Datatypes .398 .412
SE_Datastudachieve .484 .447
SE_Cultassess .643 .643
SE_Cultengpar .564 .550
SE_Cultengstaff .705 .746
SE_Cultengstud .696 .674
SE_Cultdatastbehavior 1.000 .870
SE_Cultdataposenvrion .870 1.000
Communalities
Initial Extraction
SE_process .532 .498
SE_Curresource .599 .563
SE_Curinstruprogram .485 .411
SE_curmonitor .528 .482
SE_curalign .509 .459
SE_Evalprocformentoring .416 .344
SE_Evalgrowthplan .552 .516
SE_evaluate .617 .605
SE_Evalinstructionalknowled
ge .667 .583
SE_Evaldialogue .707 .620
SE_Evalreflection .657 .609
SE_SIneeds .603 .570
SE_SIbpresearch .538 .483
SE_SIengagestaff .562 .503
SE_SIstrategplan .553 .455
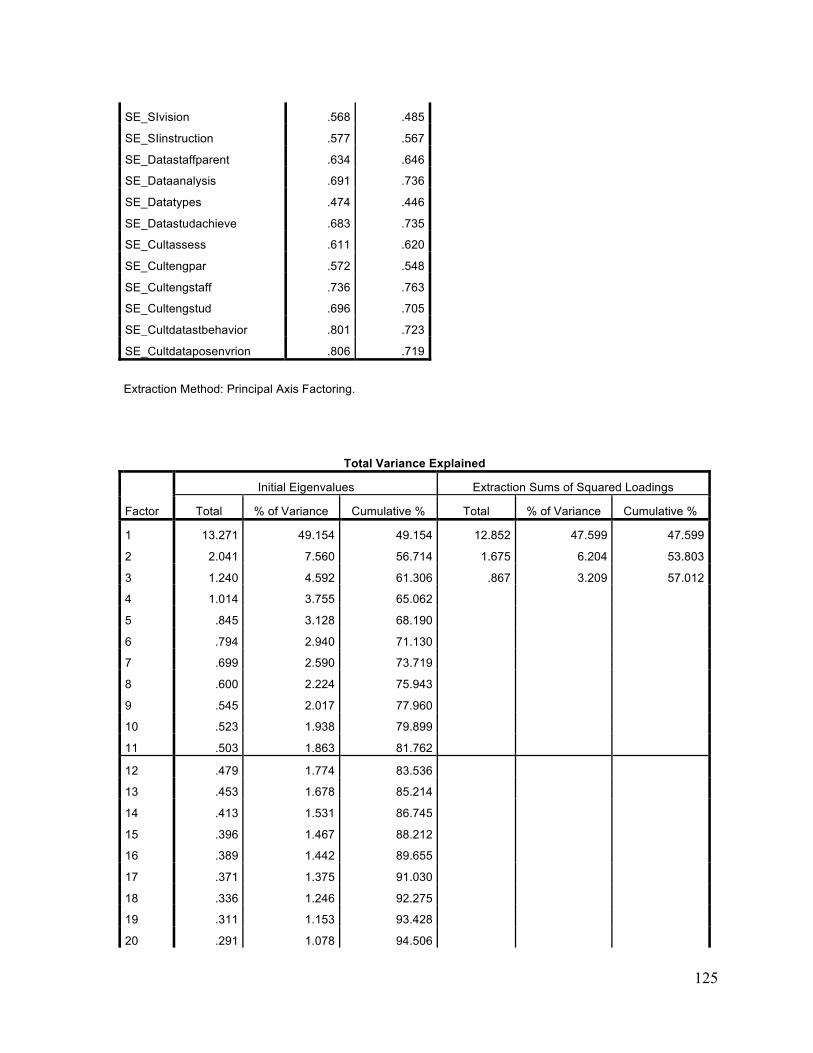
125
SE_SIvision .568 .485
SE_SIinstruction .577 .567
SE_Datastaffparent .634 .646
SE_Dataanalysis .691 .736
SE_Datatypes .474 .446
SE_Datastudachieve .683 .735
SE_Cultassess .611 .620
SE_Cultengpar .572 .548
SE_Cultengstaff .736 .763
SE_Cultengstud .696 .705
SE_Cultdatastbehavior .801 .723
SE_Cultdataposenvrion .806 .719
Extraction Method: Principal Axis Factoring.
Total Variance Explained
Factor
Initial Eigenvalues Extraction Sums of Squared Loadings
Total % of Variance Cumulative % Total % of Variance Cumulative %
1 13.271 49.154 49.154 12.852 47.599 47.599
2 2.041 7.560 56.714 1.675 6.204 53.803
3 1.240 4.592 61.306 .867 3.209 57.012
4 1.014 3.755 65.062 5 .845 3.128 68.190 6 .794 2.940 71.130 7 .699 2.590 73.719 8 .600 2.224 75.943 9 .545 2.017 77.960 10 .523 1.938 79.899 11 .503 1.863 81.762 12 .479 1.774 83.536 13 .453 1.678 85.214 14 .413 1.531 86.745 15 .396 1.467 88.212 16 .389 1.442 89.655 17 .371 1.375 91.030 18 .336 1.246 92.275 19 .311 1.153 93.428 20 .291 1.078 94.506
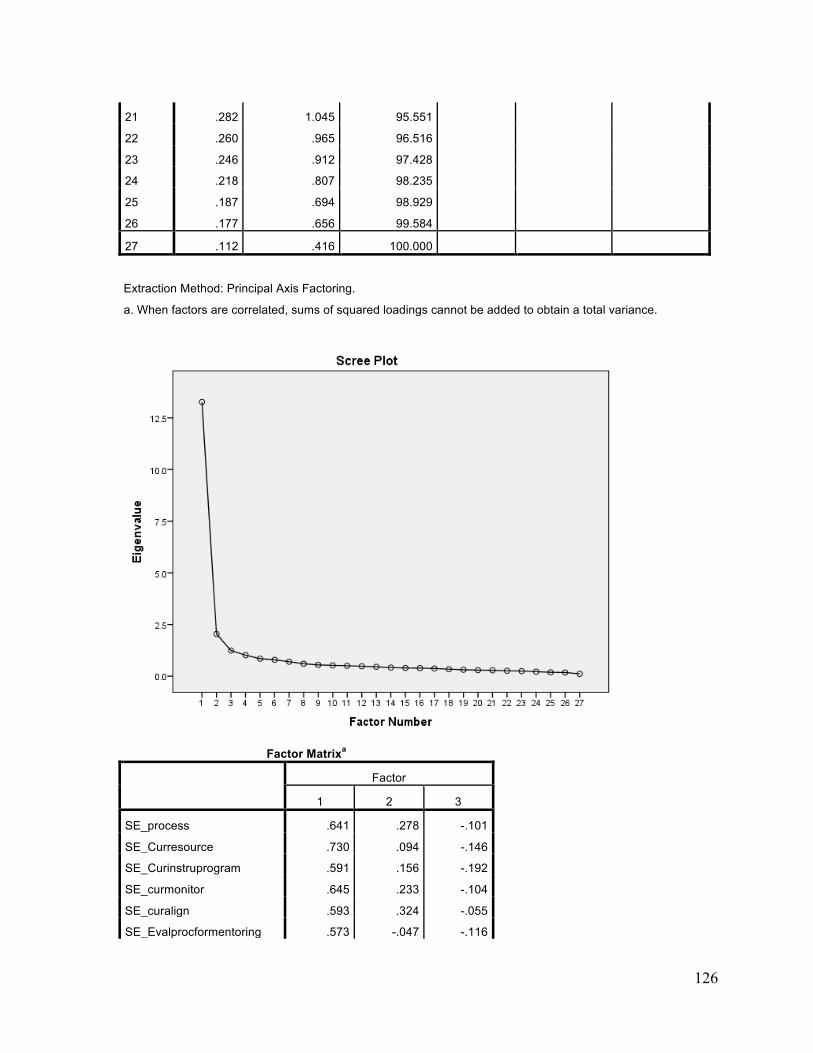
126
21 .282 1.045 95.551 22 .260 .965 96.516 23 .246 .912 97.428 24 .218 .807 98.235 25 .187 .694 98.929 26 .177 .656 99.584 27 .112 .416 100.000
Extraction Method: Principal Axis Factoring.
a. When factors are correlated, sums of squared loadings cannot be added to obtain a total variance.
Factor Matrixa
Factor
1 2 3
SE_process .641 .278 -.101
SE_Curresource .730 .094 -.146
SE_Curinstruprogram .591 .156 -.192
SE_curmonitor .645 .233 -.104
SE_curalign .593 .324 -.055
SE_Evalprocformentoring .573 -.047 -.116
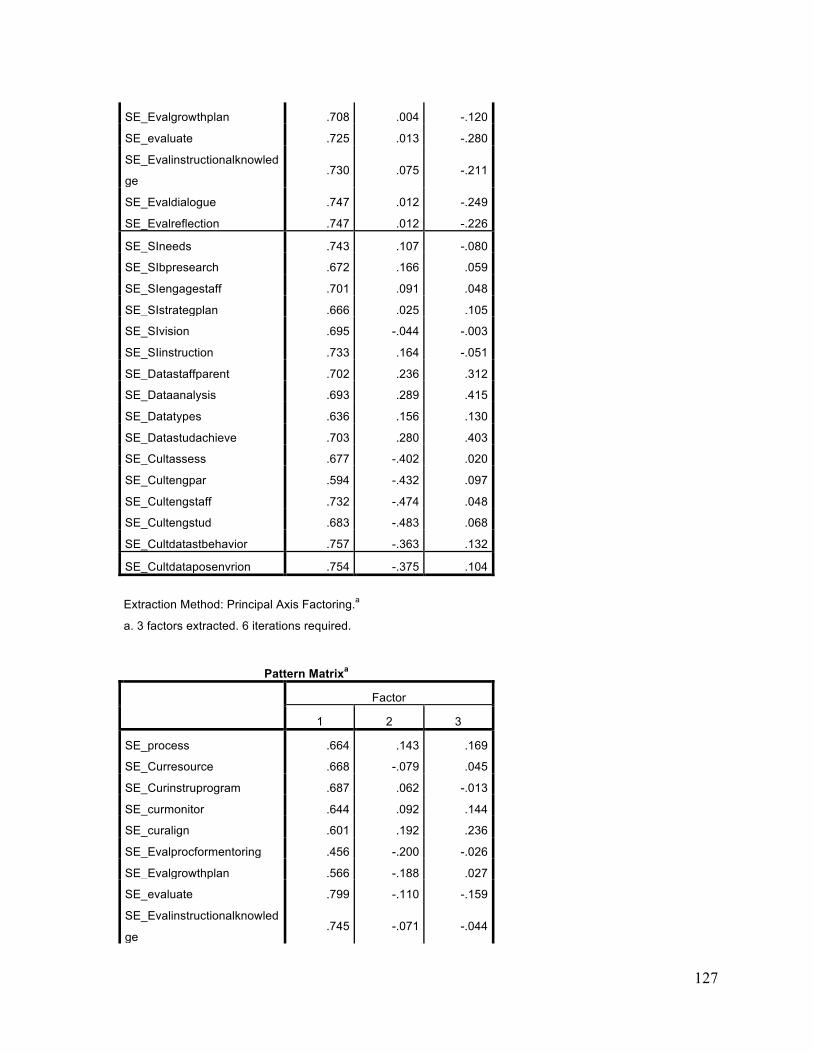
127
SE_Evalgrowthplan .708 .004 -.120
SE_evaluate .725 .013 -.280
SE_Evalinstructionalknowled
ge .730 .075 -.211
SE_Evaldialogue .747 .012 -.249
SE_Evalreflection .747 .012 -.226
SE_SIneeds .743 .107 -.080
SE_SIbpresearch .672 .166 .059
SE_SIengagestaff .701 .091 .048
SE_SIstrategplan .666 .025 .105
SE_SIvision .695 -.044 -.003
SE_SIinstruction .733 .164 -.051
SE_Datastaffparent .702 .236 .312
SE_Dataanalysis .693 .289 .415
SE_Datatypes .636 .156 .130
SE_Datastudachieve .703 .280 .403
SE_Cultassess .677 -.402 .020
SE_Cultengpar .594 -.432 .097
SE_Cultengstaff .732 -.474 .048
SE_Cultengstud .683 -.483 .068
SE_Cultdatastbehavior .757 -.363 .132
SE_Cultdataposenvrion .754 -.375 .104
Extraction Method: Principal Axis Factoring.a
a. 3 factors extracted. 6 iterations required.
Pattern Matrixa
Factor
1 2 3
SE_process .664 .143 .169
SE_Curresource .668 -.079 .045
SE_Curinstruprogram .687 .062 -.013
SE_curmonitor .644 .092 .144
SE_curalign .601 .192 .236
SE_Evalprocformentoring .456 -.200 -.026
SE_Evalgrowthplan .566 -.188 .027
SE_evaluate .799 -.110 -.159
SE_Evalinstructionalknowled
ge .745 -.071 -.044
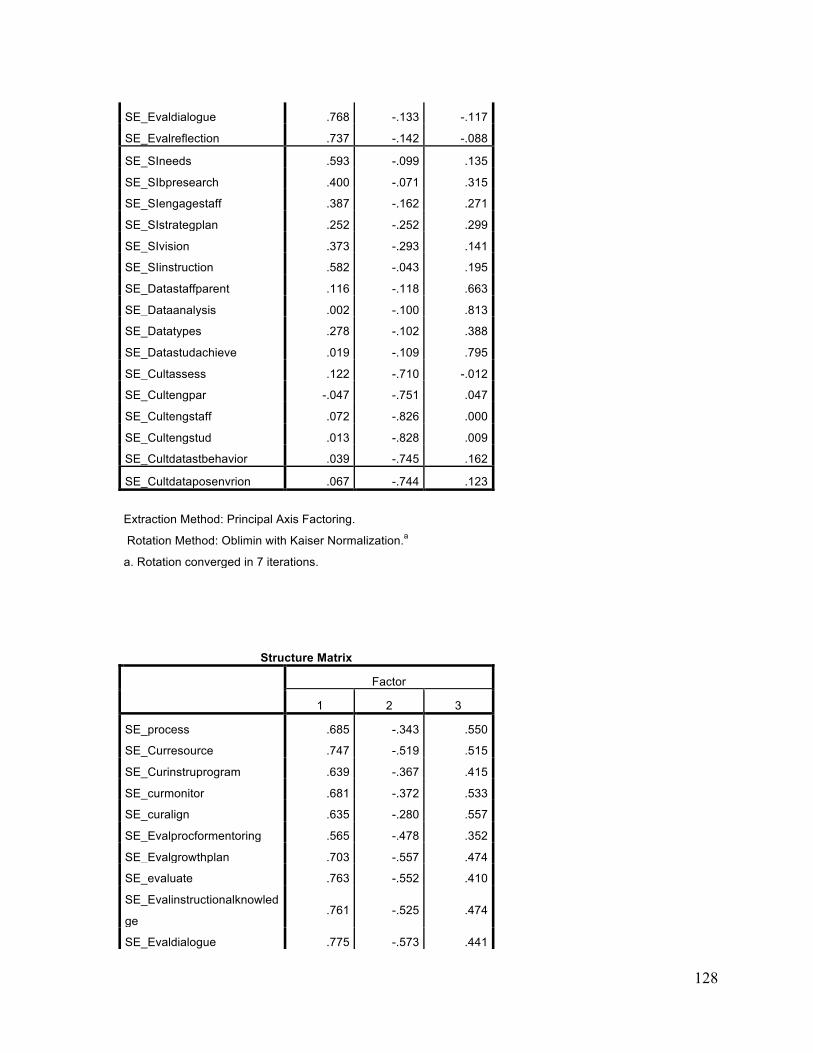
128
SE_Evaldialogue .768 -.133 -.117
SE_Evalreflection .737 -.142 -.088
SE_SIneeds .593 -.099 .135
SE_SIbpresearch .400 -.071 .315
SE_SIengagestaff .387 -.162 .271
SE_SIstrategplan .252 -.252 .299
SE_SIvision .373 -.293 .141
SE_SIinstruction .582 -.043 .195
SE_Datastaffparent .116 -.118 .663
SE_Dataanalysis .002 -.100 .813
SE_Datatypes .278 -.102 .388
SE_Datastudachieve .019 -.109 .795
SE_Cultassess .122 -.710 -.012
SE_Cultengpar -.047 -.751 .047
SE_Cultengstaff .072 -.826 .000
SE_Cultengstud .013 -.828 .009
SE_Cultdatastbehavior .039 -.745 .162
SE_Cultdataposenvrion .067 -.744 .123
Extraction Method: Principal Axis Factoring.
Rotation Method: Oblimin with Kaiser Normalization.a
a. Rotation converged in 7 iterations.
Structure Matrix
Factor
1 2 3
SE_process .685 -.343 .550
SE_Curresource .747 -.519 .515
SE_Curinstruprogram .639 -.367 .415
SE_curmonitor .681 -.372 .533
SE_curalign .635 -.280 .557
SE_Evalprocformentoring .565 -.478 .352
SE_Evalgrowthplan .703 -.557 .474
SE_evaluate .763 -.552 .410
SE_Evalinstructionalknowled
ge .761 -.525 .474
SE_Evaldialogue .775 -.573 .441
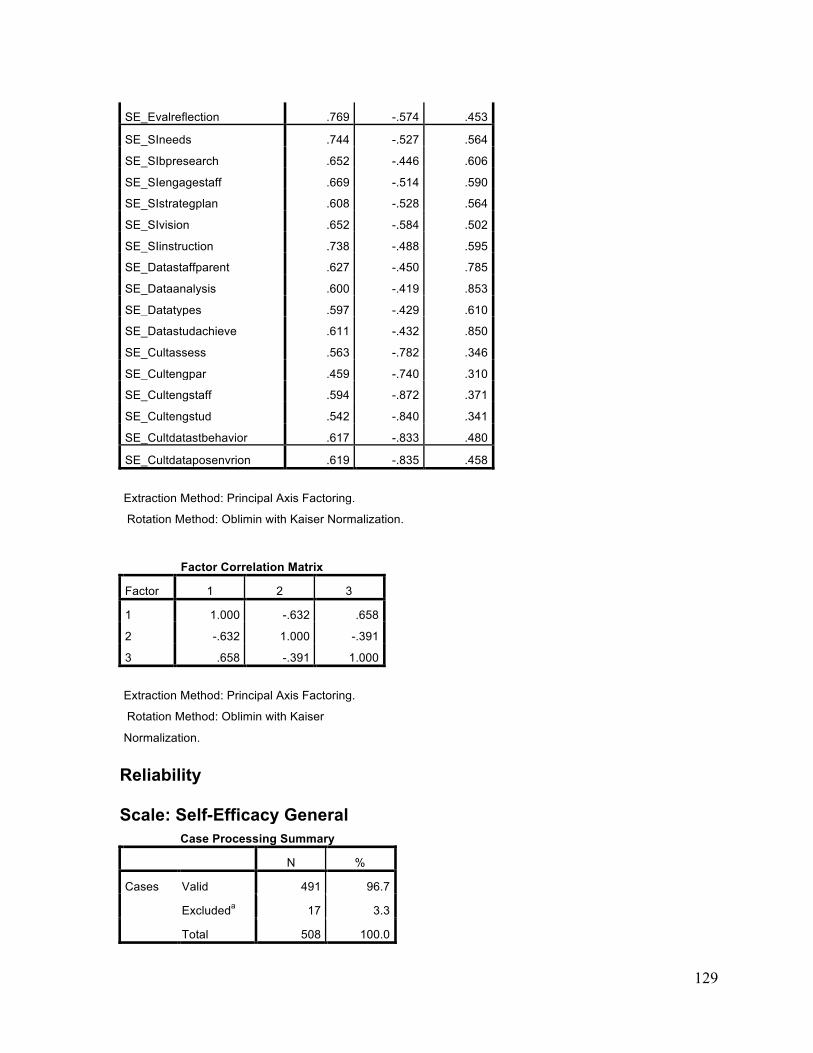
129
SE_Evalreflection .769 -.574 .453
SE_SIneeds .744 -.527 .564
SE_SIbpresearch .652 -.446 .606
SE_SIengagestaff .669 -.514 .590
SE_SIstrategplan .608 -.528 .564
SE_SIvision .652 -.584 .502
SE_SIinstruction .738 -.488 .595
SE_Datastaffparent .627 -.450 .785
SE_Dataanalysis .600 -.419 .853
SE_Datatypes .597 -.429 .610
SE_Datastudachieve .611 -.432 .850
SE_Cultassess .563 -.782 .346
SE_Cultengpar .459 -.740 .310
SE_Cultengstaff .594 -.872 .371
SE_Cultengstud .542 -.840 .341
SE_Cultdatastbehavior .617 -.833 .480
SE_Cultdataposenvrion .619 -.835 .458
Extraction Method: Principal Axis Factoring.
Rotation Method: Oblimin with Kaiser Normalization.
Factor Correlation Matrix
Factor 1 2 3
1 1.000 -.632 .658
2 -.632 1.000 -.391
3 .658 -.391 1.000
Extraction Method: Principal Axis Factoring.
Rotation Method: Oblimin with Kaiser
Normalization. Reliability Scale: Self-Efficacy General
Case Processing Summary
N %
Cases Valid 491 96.7
Excludeda 17 3.3
Total 508 100.0
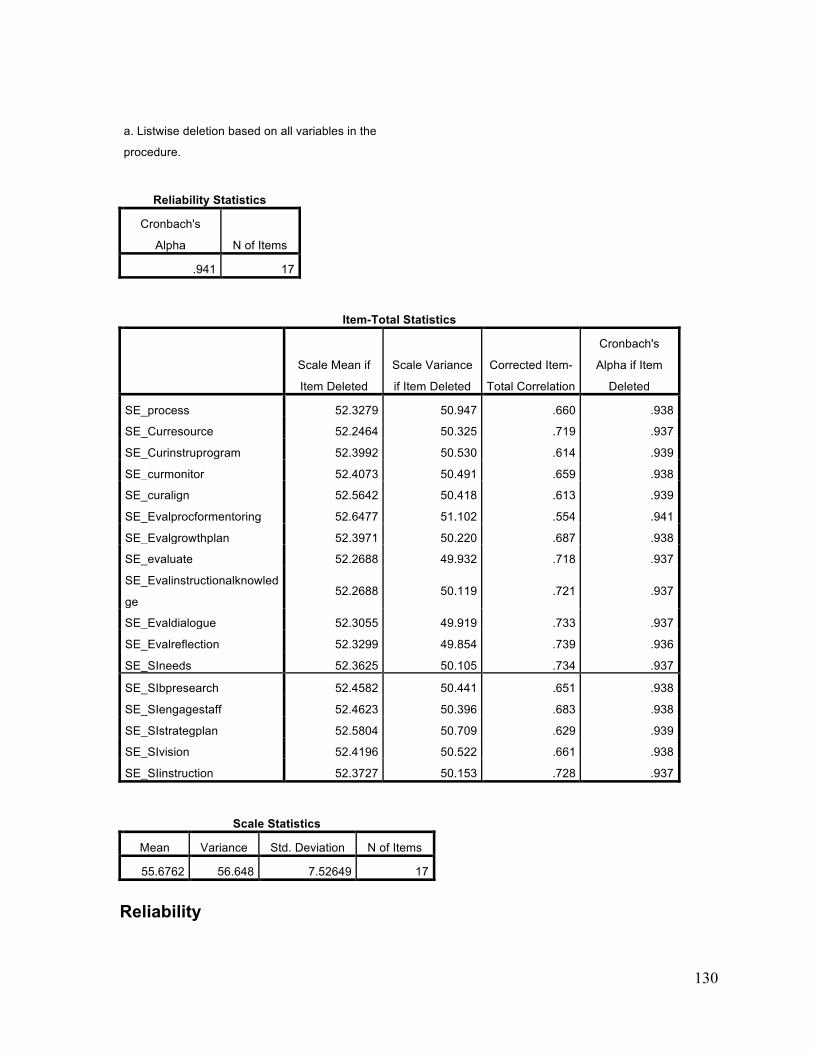
130
a. Listwise deletion based on all variables in the
procedure.
Reliability Statistics
Cronbach's
Alpha N of Items
.941 17
Item-Total Statistics
Scale Mean if
Item Deleted
Scale Variance
if Item Deleted
Corrected Item-
Total Correlation
Cronbach's
Alpha if Item
Deleted
SE_process 52.3279 50.947 .660 .938
SE_Curresource 52.2464 50.325 .719 .937
SE_Curinstruprogram 52.3992 50.530 .614 .939
SE_curmonitor 52.4073 50.491 .659 .938
SE_curalign 52.5642 50.418 .613 .939
SE_Evalprocformentoring 52.6477 51.102 .554 .941
SE_Evalgrowthplan 52.3971 50.220 .687 .938
SE_evaluate 52.2688 49.932 .718 .937
SE_Evalinstructionalknowled
ge 52.2688 50.119 .721 .937
SE_Evaldialogue 52.3055 49.919 .733 .937
SE_Evalreflection 52.3299 49.854 .739 .936
SE_SIneeds 52.3625 50.105 .734 .937
SE_SIbpresearch 52.4582 50.441 .651 .938
SE_SIengagestaff 52.4623 50.396 .683 .938
SE_SIstrategplan 52.5804 50.709 .629 .939
SE_SIvision 52.4196 50.522 .661 .938
SE_SIinstruction 52.3727 50.153 .728 .937
Scale Statistics
Mean Variance Std. Deviation N of Items
55.6762 56.648 7.52649 17
Reliability
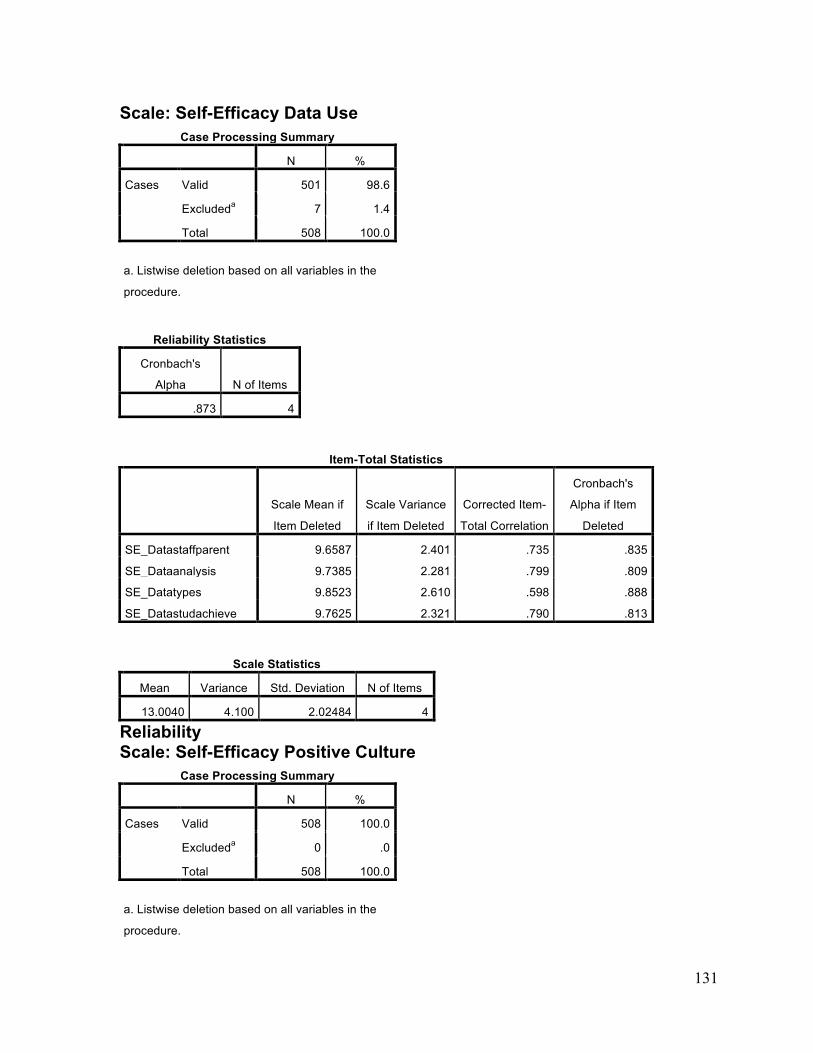
131
Scale: Self-Efficacy Data Use Case Processing Summary
N %
Cases Valid 501 98.6
Excludeda 7 1.4
Total 508 100.0
a. Listwise deletion based on all variables in the
procedure.
Reliability Statistics
Cronbach's
Alpha N of Items
.873 4
Item-Total Statistics
Scale Mean if
Item Deleted
Scale Variance
if Item Deleted
Corrected Item-
Total Correlation
Cronbach's
Alpha if Item
Deleted
SE_Datastaffparent 9.6587 2.401 .735 .835
SE_Dataanalysis 9.7385 2.281 .799 .809
SE_Datatypes 9.8523 2.610 .598 .888
SE_Datastudachieve 9.7625 2.321 .790 .813
Scale Statistics
Mean Variance Std. Deviation N of Items
13.0040 4.100 2.02484 4
Reliability Scale: Self-Efficacy Positive Culture
Case Processing Summary
N %
Cases Valid 508 100.0
Excludeda 0 .0
Total 508 100.0
a. Listwise deletion based on all variables in the
procedure.
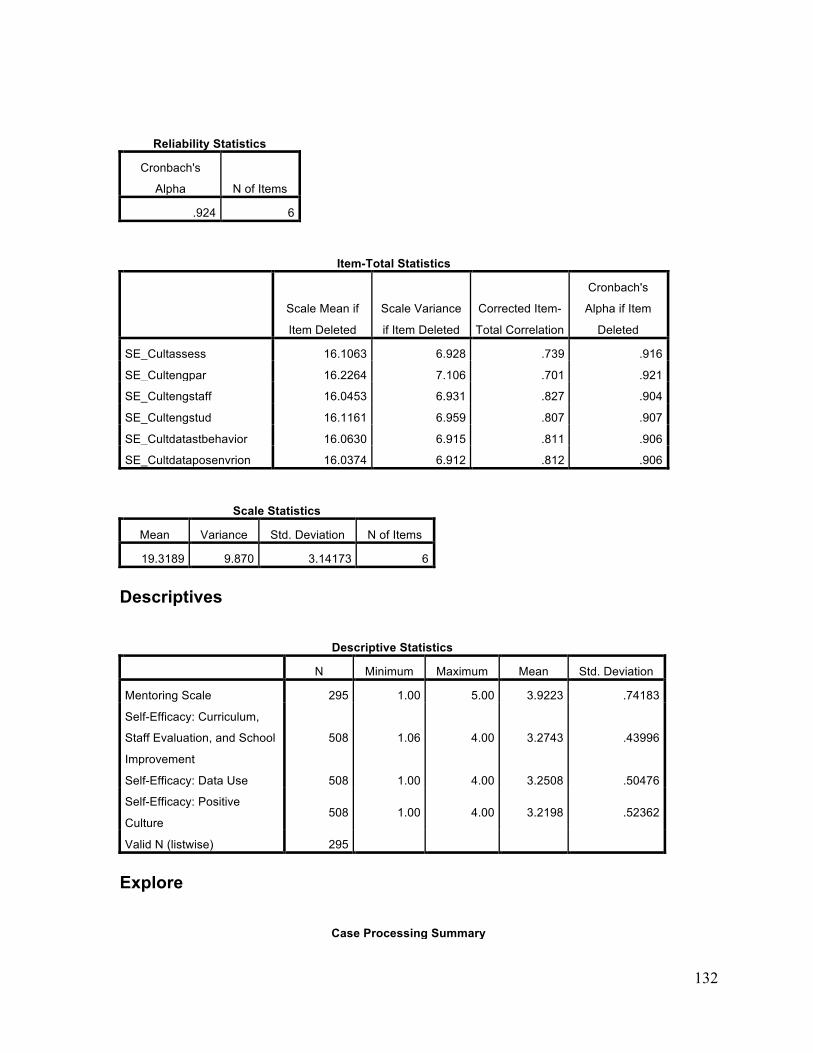
132
Reliability Statistics
Cronbach's
Alpha N of Items
.924 6
Item-Total Statistics
Scale Mean if
Item Deleted
Scale Variance
if Item Deleted
Corrected Item-
Total Correlation
Cronbach's
Alpha if Item
Deleted
SE_Cultassess 16.1063 6.928 .739 .916
SE_Cultengpar 16.2264 7.106 .701 .921
SE_Cultengstaff 16.0453 6.931 .827 .904
SE_Cultengstud 16.1161 6.959 .807 .907
SE_Cultdatastbehavior 16.0630 6.915 .811 .906
SE_Cultdataposenvrion 16.0374 6.912 .812 .906
Scale Statistics
Mean Variance Std. Deviation N of Items
19.3189 9.870 3.14173 6
Descriptives
Descriptive Statistics
N Minimum Maximum Mean Std. Deviation
Mentoring Scale 295 1.00 5.00 3.9223 .74183
Self-Efficacy: Curriculum,
Staff Evaluation, and School
Improvement
508 1.06 4.00 3.2743 .43996
Self-Efficacy: Data Use 508 1.00 4.00 3.2508 .50476
Self-Efficacy: Positive
Culture 508 1.00 4.00 3.2198 .52362
Valid N (listwise) 295 Explore
Case Processing Summary
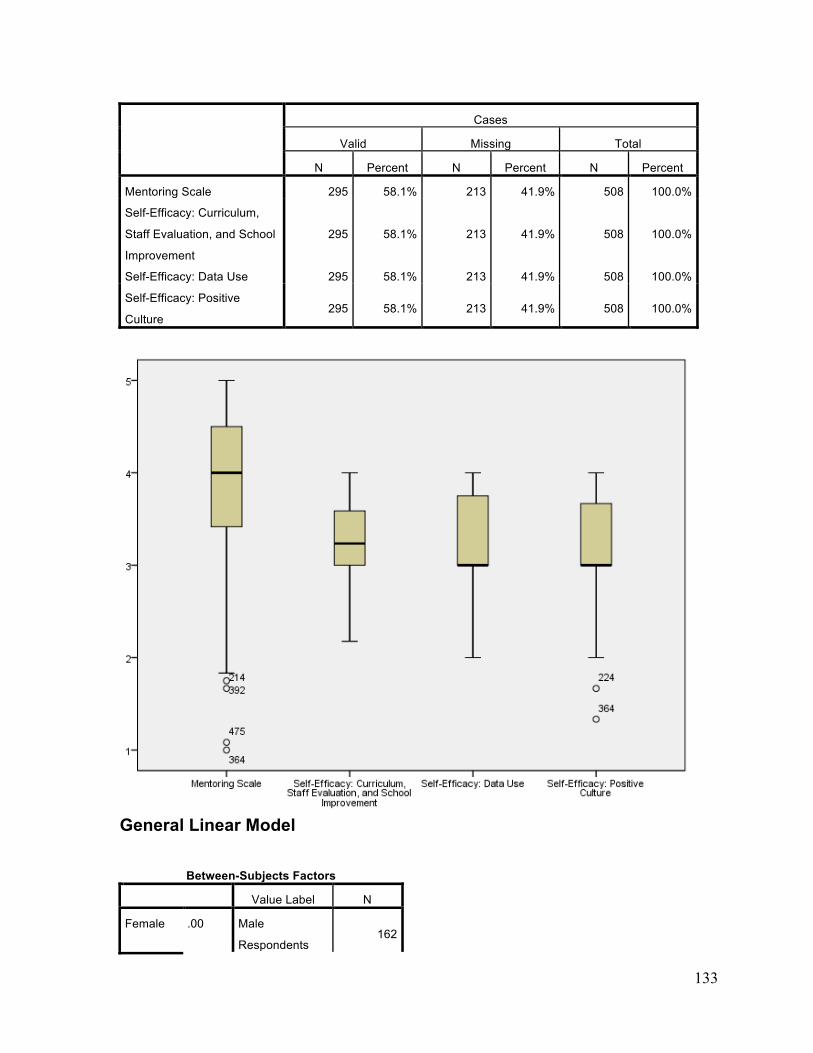
133
Cases
Valid Missing Total
N Percent N Percent N Percent
Mentoring Scale 295 58.1% 213 41.9% 508 100.0%
Self-Efficacy: Curriculum,
Staff Evaluation, and School
Improvement
295 58.1% 213 41.9% 508 100.0%
Self-Efficacy: Data Use 295 58.1% 213 41.9% 508 100.0%
Self-Efficacy: Positive
Culture 295 58.1% 213 41.9% 508 100.0%
General Linear Model
Between-Subjects Factors
Value Label N
Female .00 Male
Respondents 162
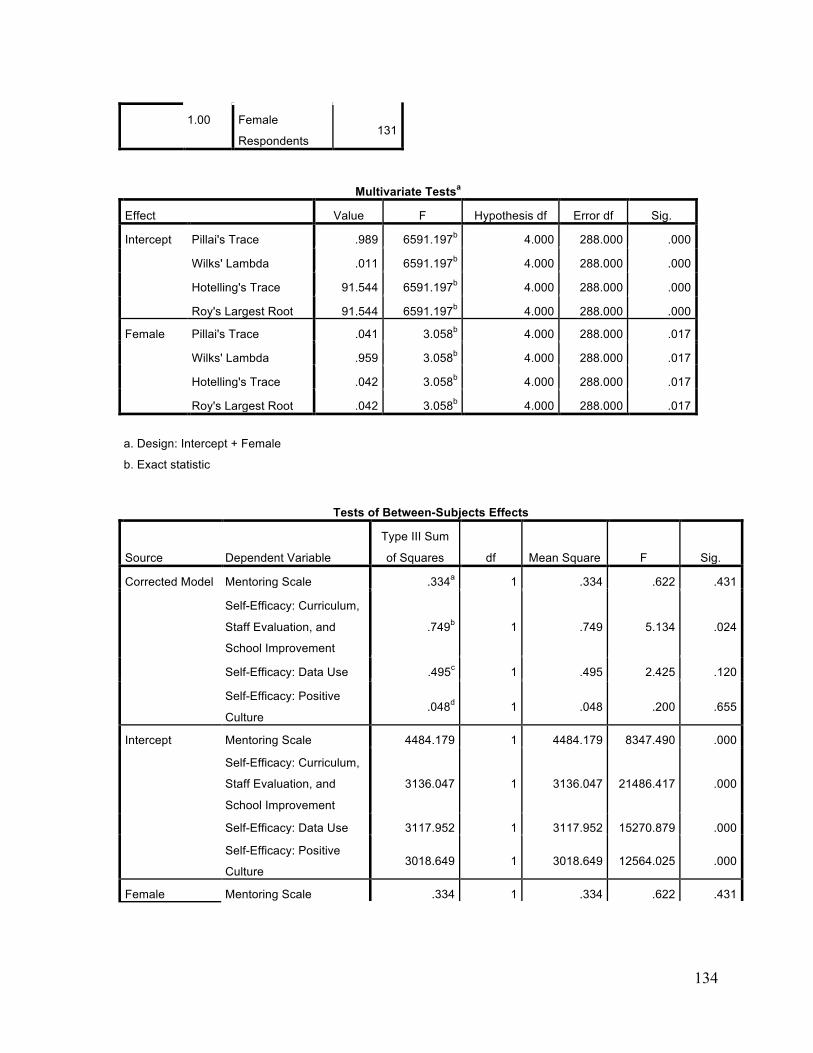
134
1.00 Female
Respondents 131
Multivariate Testsa
Effect Value F Hypothesis df Error df Sig.
Intercept Pillai's Trace .989 6591.197b 4.000 288.000 .000
Wilks' Lambda .011 6591.197b 4.000 288.000 .000
Hotelling's Trace 91.544 6591.197b 4.000 288.000 .000
Roy's Largest Root 91.544 6591.197b 4.000 288.000 .000
Female Pillai's Trace .041 3.058b 4.000 288.000 .017
Wilks' Lambda .959 3.058b 4.000 288.000 .017
Hotelling's Trace .042 3.058b 4.000 288.000 .017
Roy's Largest Root .042 3.058b 4.000 288.000 .017
a. Design: Intercept + Female
b. Exact statistic
Tests of Between-Subjects Effects
Source Dependent Variable
Type III Sum
of Squares df Mean Square F Sig.
Corrected Model Mentoring Scale .334a 1 .334 .622 .431
Self-Efficacy: Curriculum,
Staff Evaluation, and
School Improvement
.749b 1 .749 5.134 .024
Self-Efficacy: Data Use .495c 1 .495 2.425 .120
Self-Efficacy: Positive
Culture .048d 1 .048 .200 .655
Intercept Mentoring Scale 4484.179 1 4484.179 8347.490 .000
Self-Efficacy: Curriculum,
Staff Evaluation, and
School Improvement
3136.047 1 3136.047 21486.417 .000
Self-Efficacy: Data Use 3117.952 1 3117.952 15270.879 .000
Self-Efficacy: Positive
Culture 3018.649 1 3018.649 12564.025 .000
Female Mentoring Scale .334 1 .334 .622 .431
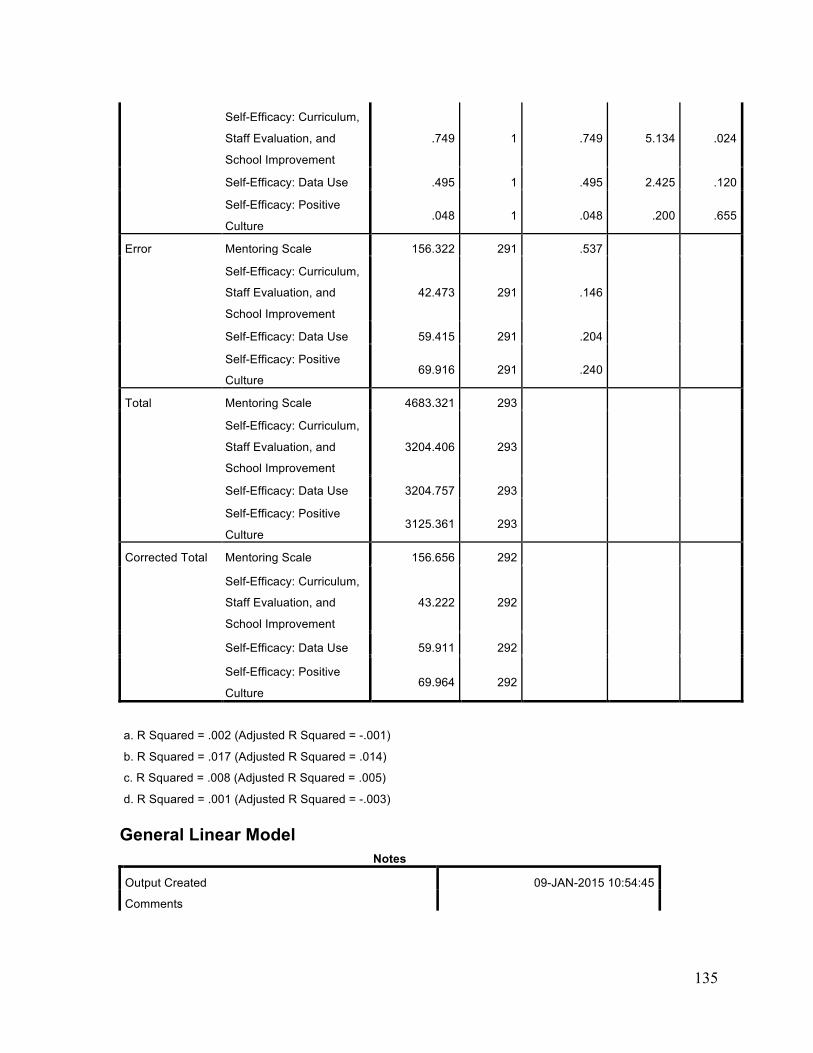
135
Self-Efficacy: Curriculum,
Staff Evaluation, and
School Improvement
.749 1 .749 5.134 .024
Self-Efficacy: Data Use .495 1 .495 2.425 .120
Self-Efficacy: Positive
Culture .048 1 .048 .200 .655
Error Mentoring Scale 156.322 291 .537 Self-Efficacy: Curriculum,
Staff Evaluation, and
School Improvement
42.473 291 .146
Self-Efficacy: Data Use 59.415 291 .204 Self-Efficacy: Positive
Culture 69.916 291 .240
Total Mentoring Scale 4683.321 293 Self-Efficacy: Curriculum,
Staff Evaluation, and
School Improvement
3204.406 293
Self-Efficacy: Data Use 3204.757 293 Self-Efficacy: Positive
Culture 3125.361 293
Corrected Total Mentoring Scale 156.656 292
Self-Efficacy: Curriculum,
Staff Evaluation, and
School Improvement
43.222 292
Self-Efficacy: Data Use 59.911 292 Self-Efficacy: Positive
Culture 69.964 292
a. R Squared = .002 (Adjusted R Squared = -.001)
b. R Squared = .017 (Adjusted R Squared = .014)
c. R Squared = .008 (Adjusted R Squared = .005)
d. R Squared = .001 (Adjusted R Squared = -.003) General Linear Model
Notes
Output Created 09-JAN-2015 10:54:45
Comments
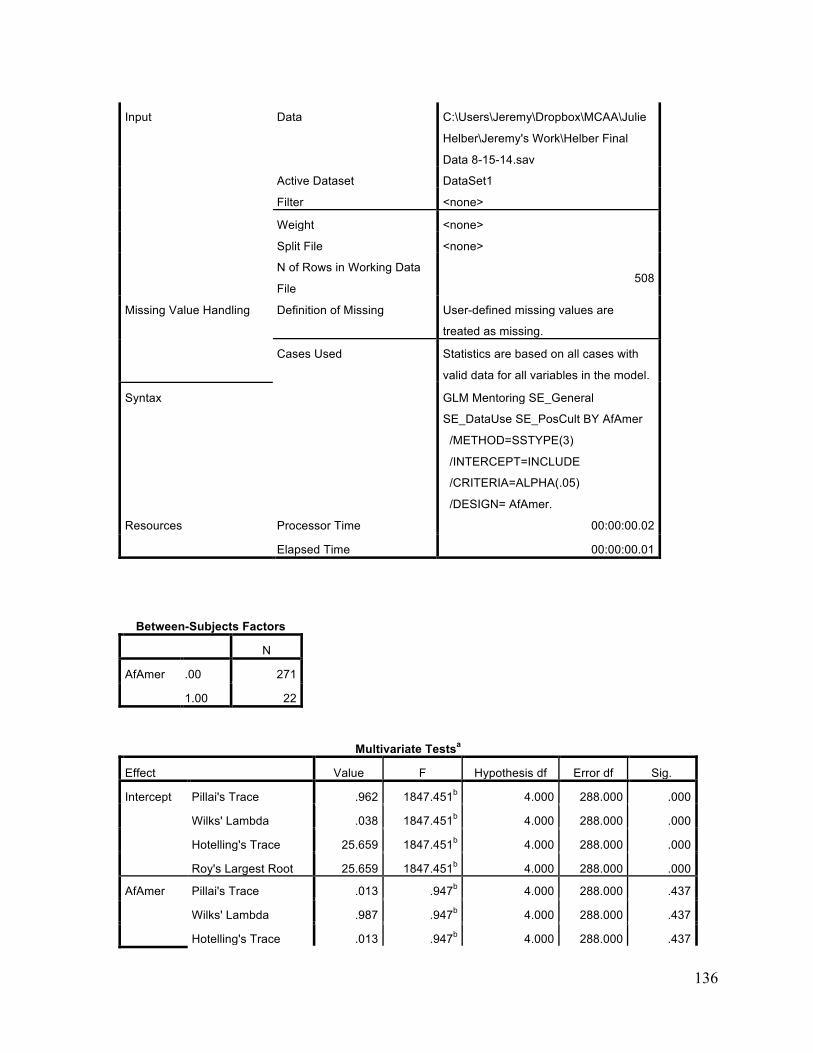
136
Input Data C:\Users\Jeremy\Dropbox\MCAA\Julie
Helber\Jeremy's Work\Helber Final
Data 8-15-14.sav
Active Dataset DataSet1
Filter <none>
Weight <none>
Split File <none>
N of Rows in Working Data
File 508
Missing Value Handling Definition of Missing User-defined missing values are
treated as missing.
Cases Used Statistics are based on all cases with
valid data for all variables in the model.
Syntax GLM Mentoring SE_General
SE_DataUse SE_PosCult BY AfAmer
/METHOD=SSTYPE(3)
/INTERCEPT=INCLUDE
/CRITERIA=ALPHA(.05)
/DESIGN= AfAmer.
Resources Processor Time 00:00:00.02
Elapsed Time 00:00:00.01
Between-Subjects Factors
N
AfAmer .00 271
1.00 22
Multivariate Testsa
Effect Value F Hypothesis df Error df Sig.
Intercept Pillai's Trace .962 1847.451b 4.000 288.000 .000
Wilks' Lambda .038 1847.451b 4.000 288.000 .000
Hotelling's Trace 25.659 1847.451b 4.000 288.000 .000
Roy's Largest Root 25.659 1847.451b 4.000 288.000 .000
AfAmer Pillai's Trace .013 .947b 4.000 288.000 .437
Wilks' Lambda .987 .947b 4.000 288.000 .437
Hotelling's Trace .013 .947b 4.000 288.000 .437
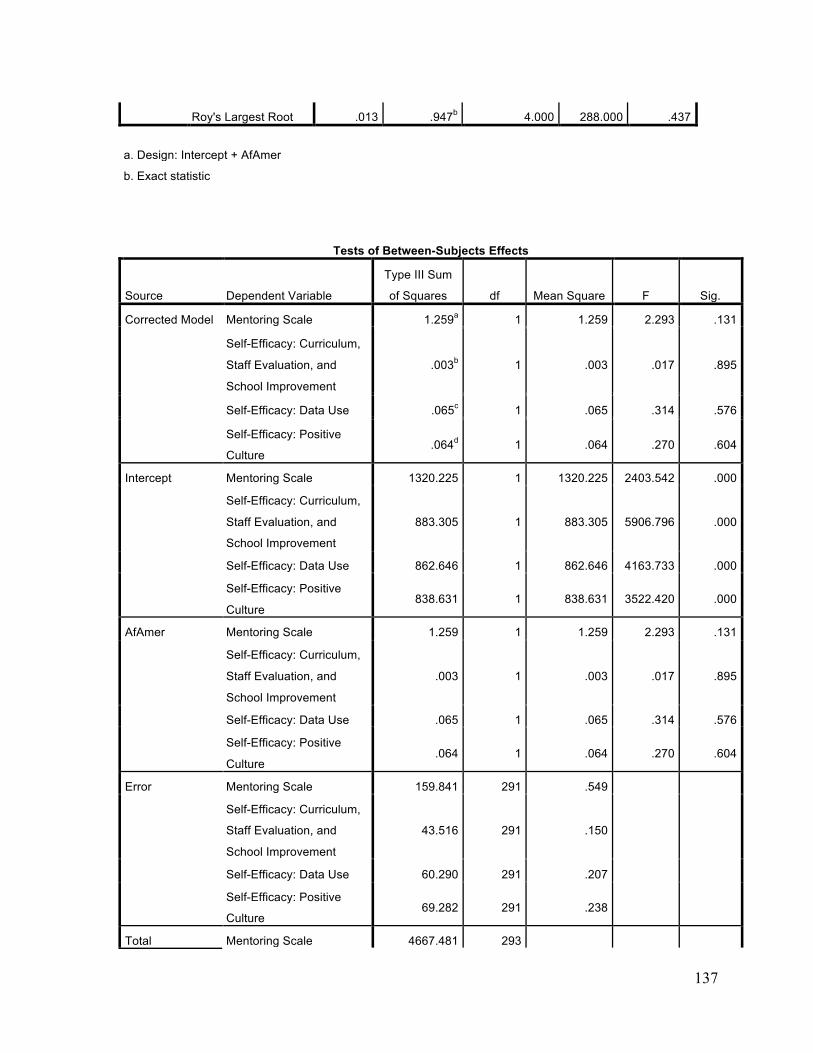
137
Roy's Largest Root .013 .947b 4.000 288.000 .437
a. Design: Intercept + AfAmer
b. Exact statistic
Tests of Between-Subjects Effects
Source Dependent Variable
Type III Sum
of Squares df Mean Square F Sig.
Corrected Model Mentoring Scale 1.259a 1 1.259 2.293 .131
Self-Efficacy: Curriculum,
Staff Evaluation, and
School Improvement
.003b 1 .003 .017 .895
Self-Efficacy: Data Use .065c 1 .065 .314 .576
Self-Efficacy: Positive
Culture .064d 1 .064 .270 .604
Intercept Mentoring Scale 1320.225 1 1320.225 2403.542 .000
Self-Efficacy: Curriculum,
Staff Evaluation, and
School Improvement
883.305 1 883.305 5906.796 .000
Self-Efficacy: Data Use 862.646 1 862.646 4163.733 .000
Self-Efficacy: Positive
Culture 838.631 1 838.631 3522.420 .000
AfAmer Mentoring Scale 1.259 1 1.259 2.293 .131
Self-Efficacy: Curriculum,
Staff Evaluation, and
School Improvement
.003 1 .003 .017 .895
Self-Efficacy: Data Use .065 1 .065 .314 .576
Self-Efficacy: Positive
Culture .064 1 .064 .270 .604
Error Mentoring Scale 159.841 291 .549 Self-Efficacy: Curriculum,
Staff Evaluation, and
School Improvement
43.516 291 .150
Self-Efficacy: Data Use 60.290 291 .207 Self-Efficacy: Positive
Culture 69.282 291 .238
Total Mentoring Scale 4667.481 293
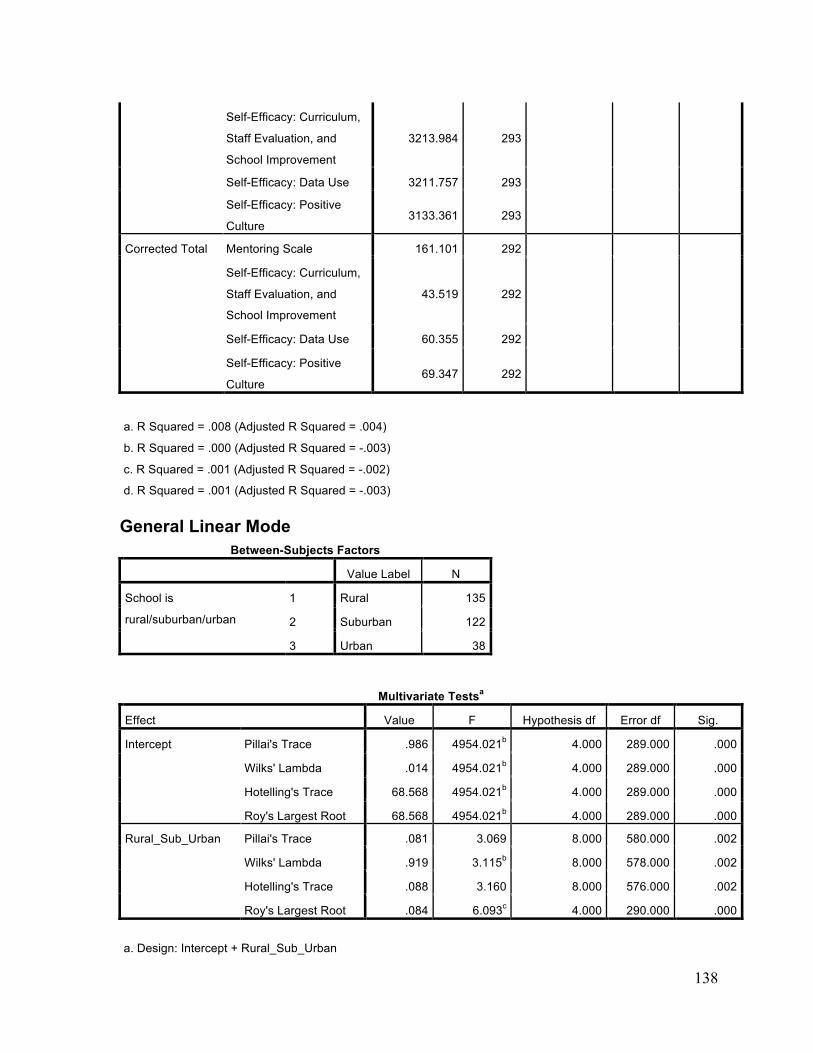
138
Self-Efficacy: Curriculum,
Staff Evaluation, and
School Improvement
3213.984 293
Self-Efficacy: Data Use 3211.757 293 Self-Efficacy: Positive
Culture 3133.361 293
Corrected Total Mentoring Scale 161.101 292 Self-Efficacy: Curriculum,
Staff Evaluation, and
School Improvement
43.519 292
Self-Efficacy: Data Use 60.355 292 Self-Efficacy: Positive
Culture 69.347 292
a. R Squared = .008 (Adjusted R Squared = .004)
b. R Squared = .000 (Adjusted R Squared = -.003)
c. R Squared = .001 (Adjusted R Squared = -.002)
d. R Squared = .001 (Adjusted R Squared = -.003) General Linear Mode
Between-Subjects Factors
Value Label N
School is
rural/suburban/urban
1 Rural 135
2 Suburban 122
3 Urban 38
Multivariate Testsa
Effect Value F Hypothesis df Error df Sig.
Intercept Pillai's Trace .986 4954.021b 4.000 289.000 .000
Wilks' Lambda .014 4954.021b 4.000 289.000 .000
Hotelling's Trace 68.568 4954.021b 4.000 289.000 .000
Roy's Largest Root 68.568 4954.021b 4.000 289.000 .000
Rural_Sub_Urban Pillai's Trace .081 3.069 8.000 580.000 .002
Wilks' Lambda .919 3.115b 8.000 578.000 .002
Hotelling's Trace .088 3.160 8.000 576.000 .002
Roy's Largest Root .084 6.093c 4.000 290.000 .000
a. Design: Intercept + Rural_Sub_Urban
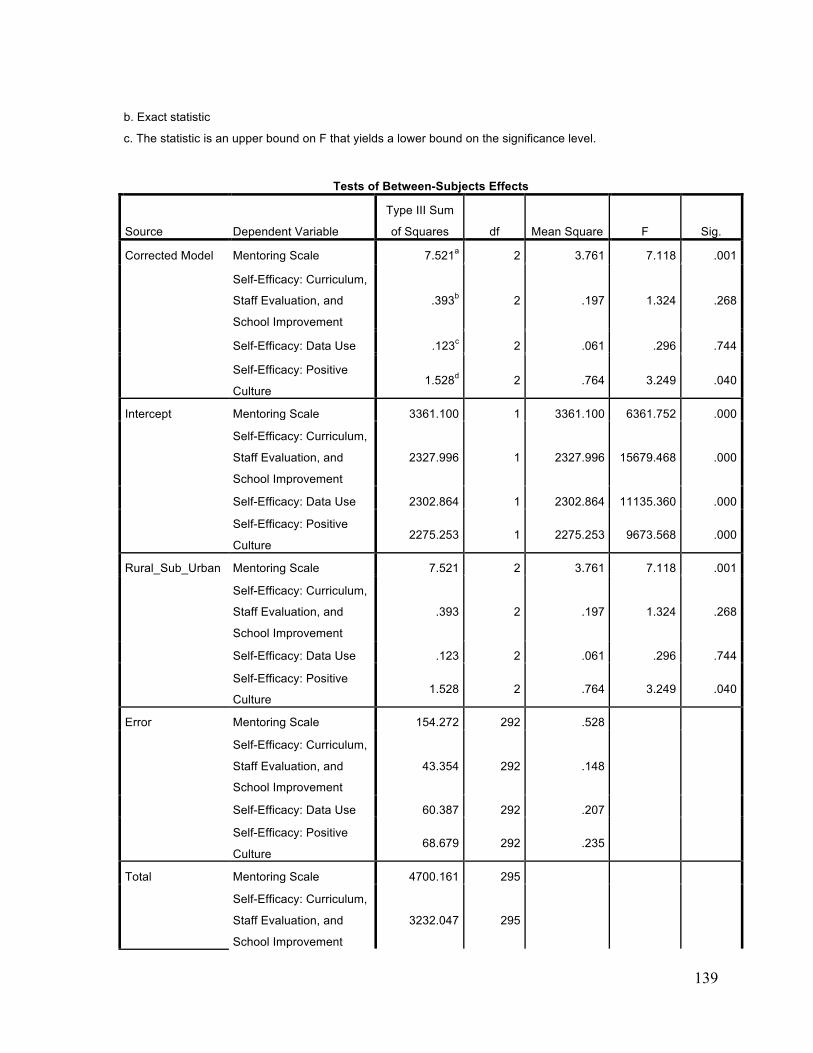
139
b. Exact statistic
c. The statistic is an upper bound on F that yields a lower bound on the significance level.
Tests of Between-Subjects Effects
Source Dependent Variable
Type III Sum
of Squares df Mean Square F Sig.
Corrected Model Mentoring Scale 7.521a 2 3.761 7.118 .001
Self-Efficacy: Curriculum,
Staff Evaluation, and
School Improvement
.393b 2 .197 1.324 .268
Self-Efficacy: Data Use .123c 2 .061 .296 .744
Self-Efficacy: Positive
Culture 1.528d 2 .764 3.249 .040
Intercept Mentoring Scale 3361.100 1 3361.100 6361.752 .000
Self-Efficacy: Curriculum,
Staff Evaluation, and
School Improvement
2327.996 1 2327.996 15679.468 .000
Self-Efficacy: Data Use 2302.864 1 2302.864 11135.360 .000
Self-Efficacy: Positive
Culture 2275.253 1 2275.253 9673.568 .000
Rural_Sub_Urban Mentoring Scale 7.521 2 3.761 7.118 .001
Self-Efficacy: Curriculum,
Staff Evaluation, and
School Improvement
.393 2 .197 1.324 .268
Self-Efficacy: Data Use .123 2 .061 .296 .744
Self-Efficacy: Positive
Culture 1.528 2 .764 3.249 .040
Error Mentoring Scale 154.272 292 .528 Self-Efficacy: Curriculum,
Staff Evaluation, and
School Improvement
43.354 292 .148
Self-Efficacy: Data Use 60.387 292 .207 Self-Efficacy: Positive
Culture 68.679 292 .235
Total Mentoring Scale 4700.161 295 Self-Efficacy: Curriculum,
Staff Evaluation, and
School Improvement
3232.047 295

140
Self-Efficacy: Data Use 3229.757 295 Self-Efficacy: Positive
Culture 3147.806 295
Corrected Total Mentoring Scale 161.794 294
Self-Efficacy: Curriculum,
Staff Evaluation, and
School Improvement
43.748 294
Self-Efficacy: Data Use 60.510 294 Self-Efficacy: Positive
Culture 70.208 294
a. R Squared = .046 (Adjusted R Squared = .040)
b. R Squared = .009 (Adjusted R Squared = .002)
c. R Squared = .002 (Adjusted R Squared = -.005) General Linear Model
Between-Subjects Factors
Value Label N
School is elementary/middle
school/high school
1 Elementary 134
2 K-8 9
3 Middle School 55
4 High
School+Middle
School
14
5 K-12 11
6 High School 71
Multivariate Testsa
Effect Value F Hypothesis df Error df Sig.
Intercept Pillai's Trace .974 2625.899b 4.000 285.000 .000
Wilks' Lambda .026 2625.899b 4.000 285.000 .000
Hotelling's Trace 36.855 2625.899b 4.000 285.000 .000
Roy's Largest Root 36.855 2625.899b 4.000 285.000 .000
Elem_Middle_HS Pillai's Trace .092 1.363 20.000 1152.000 .131
Wilks' Lambda .910 1.368 20.000 946.188 .129
Hotelling's Trace .097 1.370 20.000 1134.000 .127
Roy's Largest Root .059 3.426c 5.000 288.000 .005
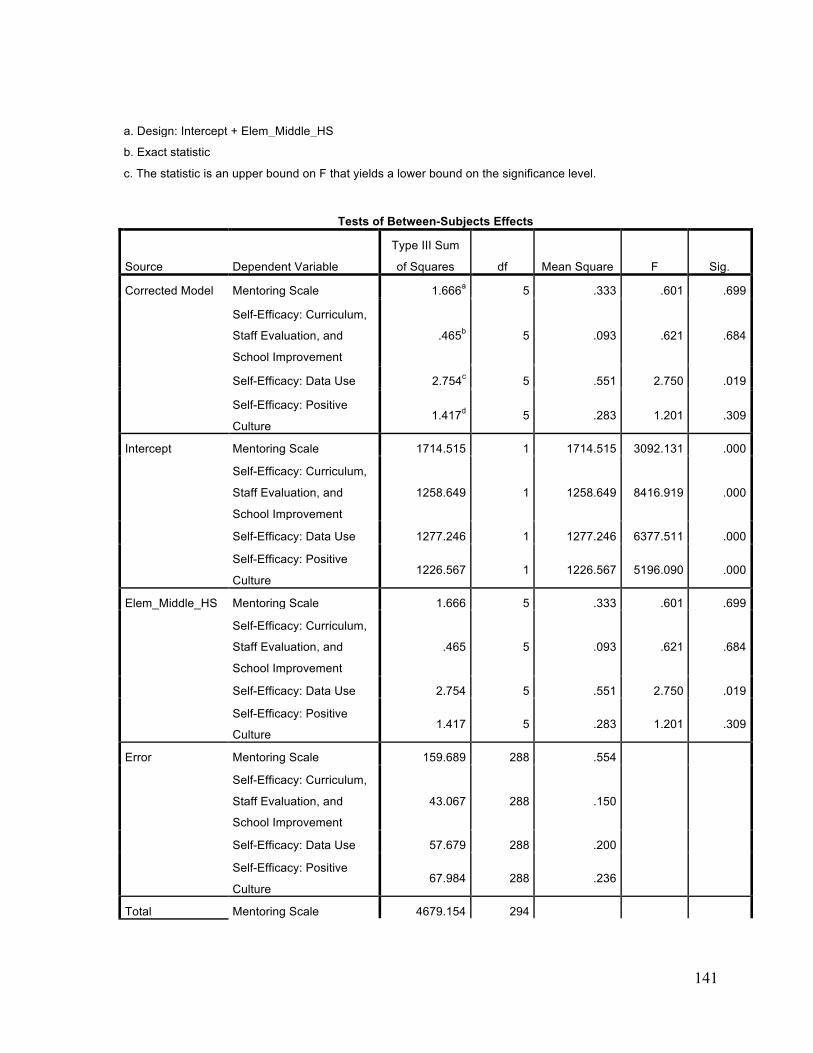
141
a. Design: Intercept + Elem_Middle_HS
b. Exact statistic
c. The statistic is an upper bound on F that yields a lower bound on the significance level.
Tests of Between-Subjects Effects
Source Dependent Variable
Type III Sum
of Squares df Mean Square F Sig.
Corrected Model Mentoring Scale 1.666a 5 .333 .601 .699
Self-Efficacy: Curriculum,
Staff Evaluation, and
School Improvement
.465b 5 .093 .621 .684
Self-Efficacy: Data Use 2.754c 5 .551 2.750 .019
Self-Efficacy: Positive
Culture 1.417d 5 .283 1.201 .309
Intercept Mentoring Scale 1714.515 1 1714.515 3092.131 .000
Self-Efficacy: Curriculum,
Staff Evaluation, and
School Improvement
1258.649 1 1258.649 8416.919 .000
Self-Efficacy: Data Use 1277.246 1 1277.246 6377.511 .000
Self-Efficacy: Positive
Culture 1226.567 1 1226.567 5196.090 .000
Elem_Middle_HS Mentoring Scale 1.666 5 .333 .601 .699
Self-Efficacy: Curriculum,
Staff Evaluation, and
School Improvement
.465 5 .093 .621 .684
Self-Efficacy: Data Use 2.754 5 .551 2.750 .019
Self-Efficacy: Positive
Culture 1.417 5 .283 1.201 .309
Error Mentoring Scale 159.689 288 .554 Self-Efficacy: Curriculum,
Staff Evaluation, and
School Improvement
43.067 288 .150
Self-Efficacy: Data Use 57.679 288 .200 Self-Efficacy: Positive
Culture 67.984 288 .236
Total Mentoring Scale 4679.154 294
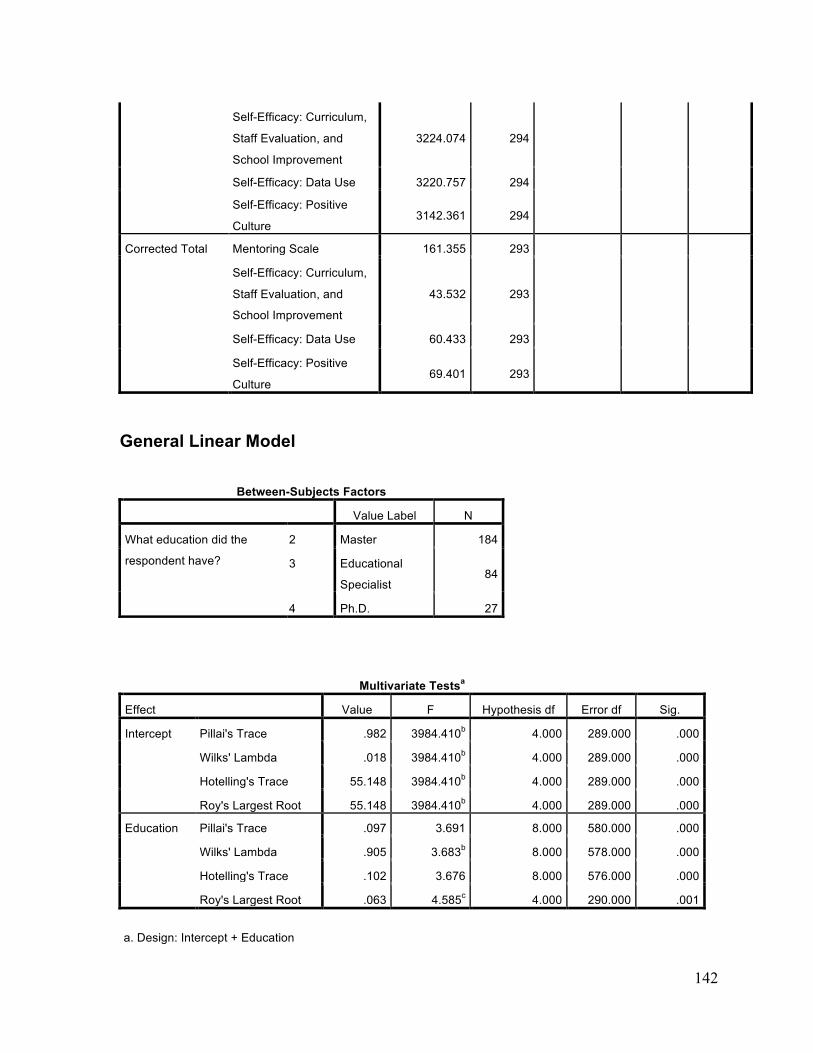
142
Self-Efficacy: Curriculum,
Staff Evaluation, and
School Improvement
3224.074 294
Self-Efficacy: Data Use 3220.757 294 Self-Efficacy: Positive
Culture 3142.361 294
Corrected Total Mentoring Scale 161.355 293 Self-Efficacy: Curriculum,
Staff Evaluation, and
School Improvement
43.532 293
Self-Efficacy: Data Use 60.433 293 Self-Efficacy: Positive
Culture 69.401 293
General Linear Model
Between-Subjects Factors
Value Label N
What education did the
respondent have?
2 Master 184
3 Educational
Specialist 84
4 Ph.D. 27
Multivariate Testsa
Effect Value F Hypothesis df Error df Sig.
Intercept Pillai's Trace .982 3984.410b 4.000 289.000 .000
Wilks' Lambda .018 3984.410b 4.000 289.000 .000
Hotelling's Trace 55.148 3984.410b 4.000 289.000 .000
Roy's Largest Root 55.148 3984.410b 4.000 289.000 .000
Education Pillai's Trace .097 3.691 8.000 580.000 .000
Wilks' Lambda .905 3.683b 8.000 578.000 .000
Hotelling's Trace .102 3.676 8.000 576.000 .000
Roy's Largest Root .063 4.585c 4.000 290.000 .001
a. Design: Intercept + Education
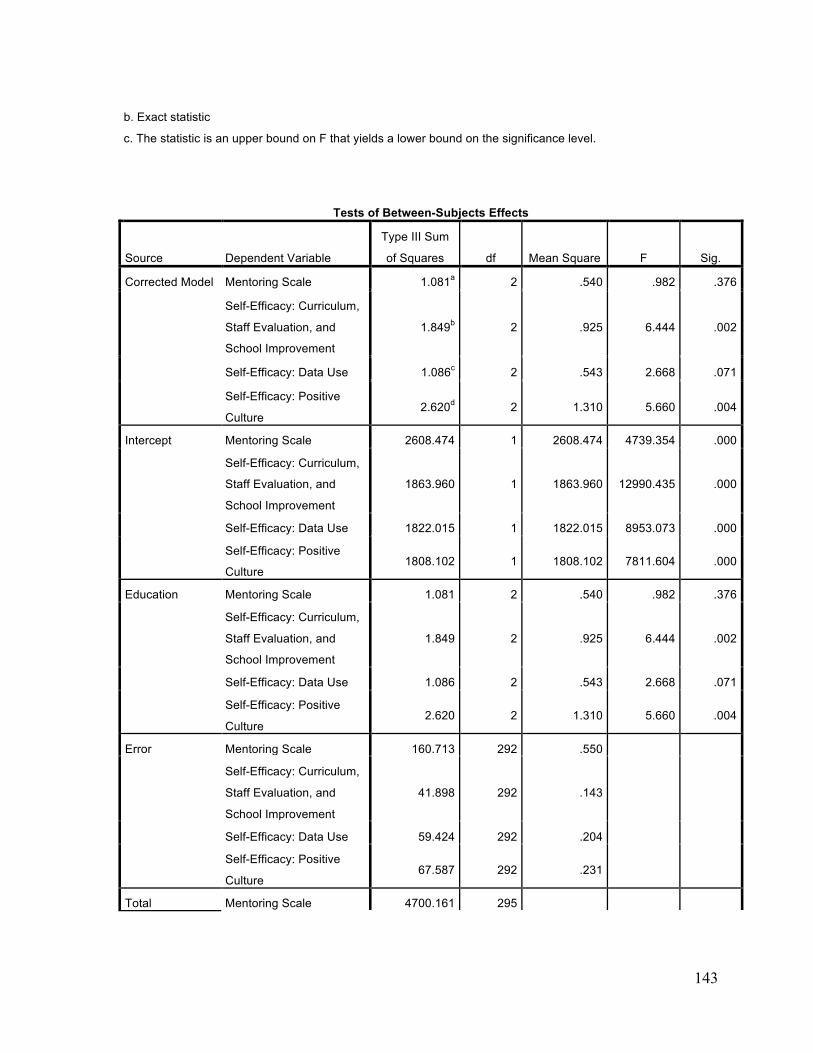
143
b. Exact statistic
c. The statistic is an upper bound on F that yields a lower bound on the significance level.
Tests of Between-Subjects Effects
Source Dependent Variable
Type III Sum
of Squares df Mean Square F Sig.
Corrected Model Mentoring Scale 1.081a 2 .540 .982 .376
Self-Efficacy: Curriculum,
Staff Evaluation, and
School Improvement
1.849b 2 .925 6.444 .002
Self-Efficacy: Data Use 1.086c 2 .543 2.668 .071
Self-Efficacy: Positive
Culture 2.620d 2 1.310 5.660 .004
Intercept Mentoring Scale 2608.474 1 2608.474 4739.354 .000
Self-Efficacy: Curriculum,
Staff Evaluation, and
School Improvement
1863.960 1 1863.960 12990.435 .000
Self-Efficacy: Data Use 1822.015 1 1822.015 8953.073 .000
Self-Efficacy: Positive
Culture 1808.102 1 1808.102 7811.604 .000
Education Mentoring Scale 1.081 2 .540 .982 .376
Self-Efficacy: Curriculum,
Staff Evaluation, and
School Improvement
1.849 2 .925 6.444 .002
Self-Efficacy: Data Use 1.086 2 .543 2.668 .071
Self-Efficacy: Positive
Culture 2.620 2 1.310 5.660 .004
Error Mentoring Scale 160.713 292 .550 Self-Efficacy: Curriculum,
Staff Evaluation, and
School Improvement
41.898 292 .143
Self-Efficacy: Data Use 59.424 292 .204 Self-Efficacy: Positive
Culture 67.587 292 .231
Total Mentoring Scale 4700.161 295
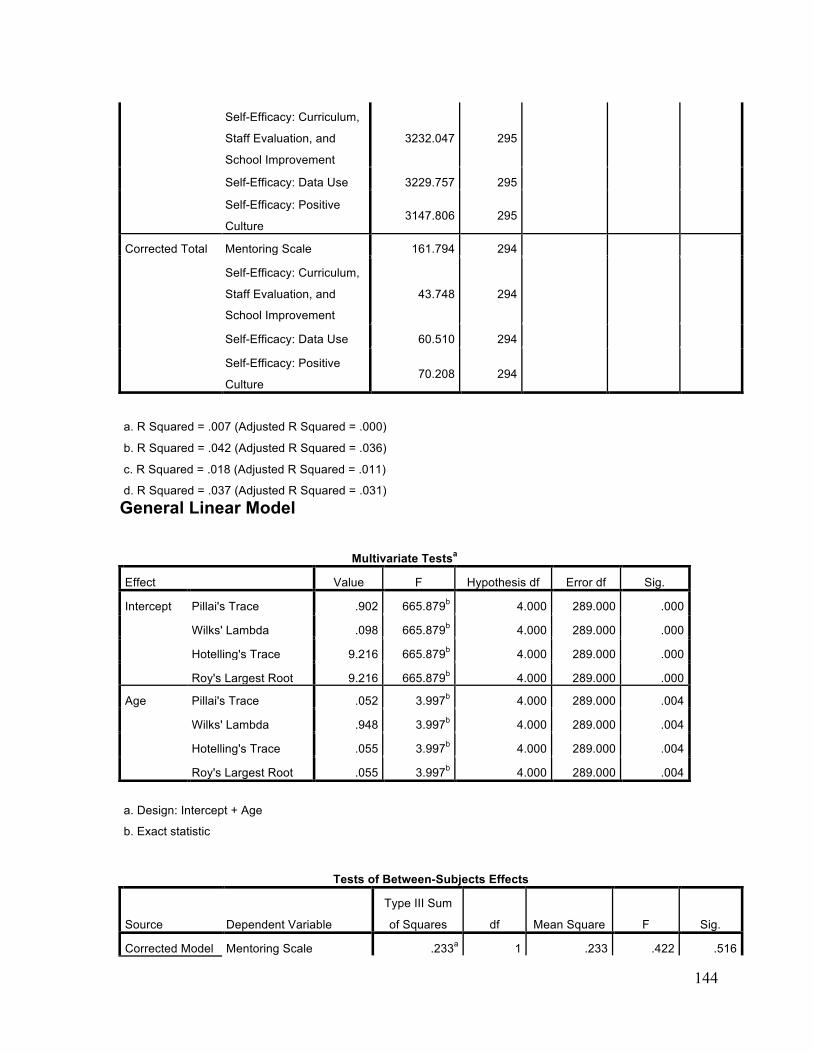
144
Self-Efficacy: Curriculum,
Staff Evaluation, and
School Improvement
3232.047 295
Self-Efficacy: Data Use 3229.757 295 Self-Efficacy: Positive
Culture 3147.806 295
Corrected Total Mentoring Scale 161.794 294 Self-Efficacy: Curriculum,
Staff Evaluation, and
School Improvement
43.748 294
Self-Efficacy: Data Use 60.510 294 Self-Efficacy: Positive
Culture 70.208 294
a. R Squared = .007 (Adjusted R Squared = .000)
b. R Squared = .042 (Adjusted R Squared = .036)
c. R Squared = .018 (Adjusted R Squared = .011)
d. R Squared = .037 (Adjusted R Squared = .031) General Linear Model
Multivariate Testsa
Effect Value F Hypothesis df Error df Sig.
Intercept Pillai's Trace .902 665.879b 4.000 289.000 .000
Wilks' Lambda .098 665.879b 4.000 289.000 .000
Hotelling's Trace 9.216 665.879b 4.000 289.000 .000
Roy's Largest Root 9.216 665.879b 4.000 289.000 .000
Age Pillai's Trace .052 3.997b 4.000 289.000 .004
Wilks' Lambda .948 3.997b 4.000 289.000 .004
Hotelling's Trace .055 3.997b 4.000 289.000 .004
Roy's Largest Root .055 3.997b 4.000 289.000 .004
a. Design: Intercept + Age
b. Exact statistic
Tests of Between-Subjects Effects
Source Dependent Variable
Type III Sum
of Squares df Mean Square F Sig.
Corrected Model Mentoring Scale .233a 1 .233 .422 .516

145
Self-Efficacy: Curriculum,
Staff Evaluation, and
School Improvement
.883b 1 .883 6.019 .015
Self-Efficacy: Data Use .031c 1 .031 .149 .700
Self-Efficacy: Positive
Culture 1.870d 1 1.870 7.997 .005
Intercept Mentoring Scale 495.389 1 495.389 896.295 .000
Self-Efficacy: Curriculum,
Staff Evaluation, and
School Improvement
302.289 1 302.289 2060.849 .000
Self-Efficacy: Data Use 326.106 1 326.106 1574.495 .000
Self-Efficacy: Positive
Culture 277.869 1 277.869 1188.227 .000
Age Mentoring Scale .233 1 .233 .422 .516
Self-Efficacy: Curriculum,
Staff Evaluation, and
School Improvement
.883 1 .883 6.019 .015
Self-Efficacy: Data Use .031 1 .031 .149 .700
Self-Efficacy: Positive
Culture 1.870 1 1.870 7.997 .005
Error Mentoring Scale 161.391 292 .553 Self-Efficacy: Curriculum,
Staff Evaluation, and
School Improvement
42.831 292 .147
Self-Efficacy: Data Use 60.478 292 .207 Self-Efficacy: Positive
Culture 68.285 292 .234
Total Mentoring Scale 4681.384 294 Self-Efficacy: Curriculum,
Staff Evaluation, and
School Improvement
3220.002 294
Self-Efficacy: Data Use 3219.194 294 Self-Efficacy: Positive
Culture 3138.806 294
Corrected Total Mentoring Scale 161.624 293 Self-Efficacy: Curriculum,
Staff Evaluation, and
School Improvement
43.714 293
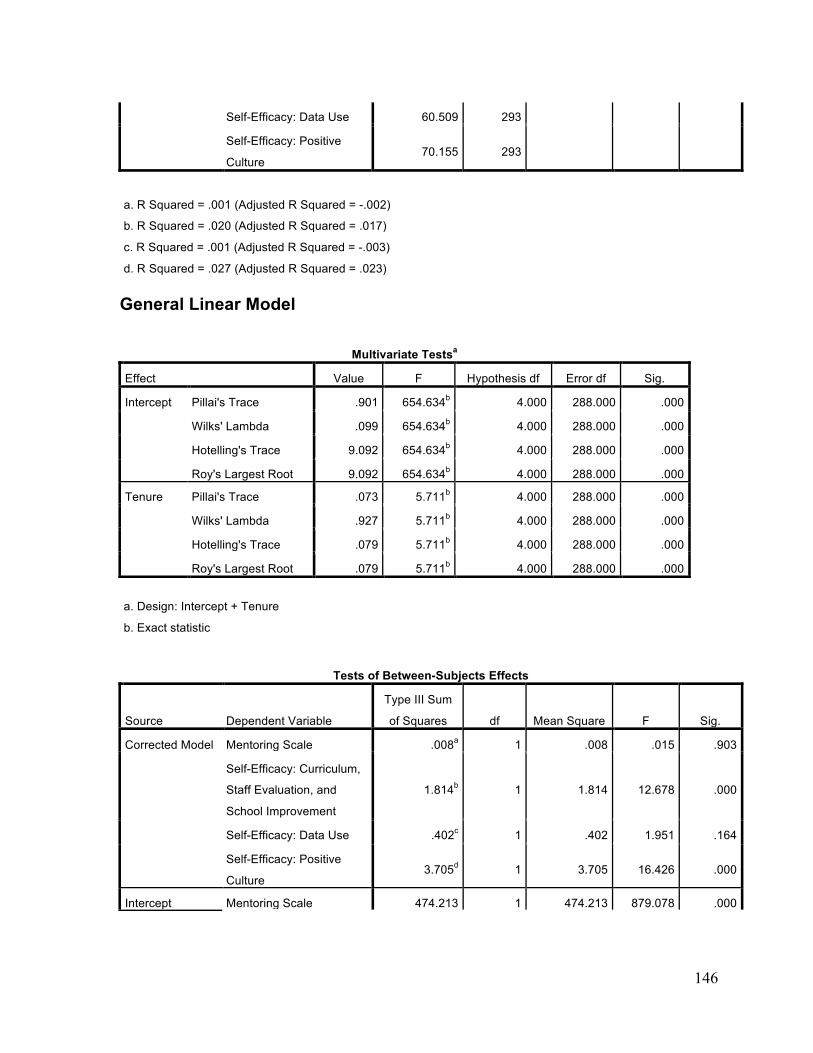
146
Self-Efficacy: Data Use 60.509 293 Self-Efficacy: Positive
Culture 70.155 293
a. R Squared = .001 (Adjusted R Squared = -.002)
b. R Squared = .020 (Adjusted R Squared = .017)
c. R Squared = .001 (Adjusted R Squared = -.003)
d. R Squared = .027 (Adjusted R Squared = .023) General Linear Model
Multivariate Testsa
Effect Value F Hypothesis df Error df Sig.
Intercept Pillai's Trace .901 654.634b 4.000 288.000 .000
Wilks' Lambda .099 654.634b 4.000 288.000 .000
Hotelling's Trace 9.092 654.634b 4.000 288.000 .000
Roy's Largest Root 9.092 654.634b 4.000 288.000 .000
Tenure Pillai's Trace .073 5.711b 4.000 288.000 .000
Wilks' Lambda .927 5.711b 4.000 288.000 .000
Hotelling's Trace .079 5.711b 4.000 288.000 .000
Roy's Largest Root .079 5.711b 4.000 288.000 .000
a. Design: Intercept + Tenure
b. Exact statistic
Tests of Between-Subjects Effects
Source Dependent Variable
Type III Sum
of Squares df Mean Square F Sig.
Corrected Model Mentoring Scale .008a 1 .008 .015 .903
Self-Efficacy: Curriculum,
Staff Evaluation, and
School Improvement
1.814b 1 1.814 12.678 .000
Self-Efficacy: Data Use .402c 1 .402 1.951 .164
Self-Efficacy: Positive
Culture 3.705d 1 3.705 16.426 .000
Intercept Mentoring Scale 474.213 1 474.213 879.078 .000
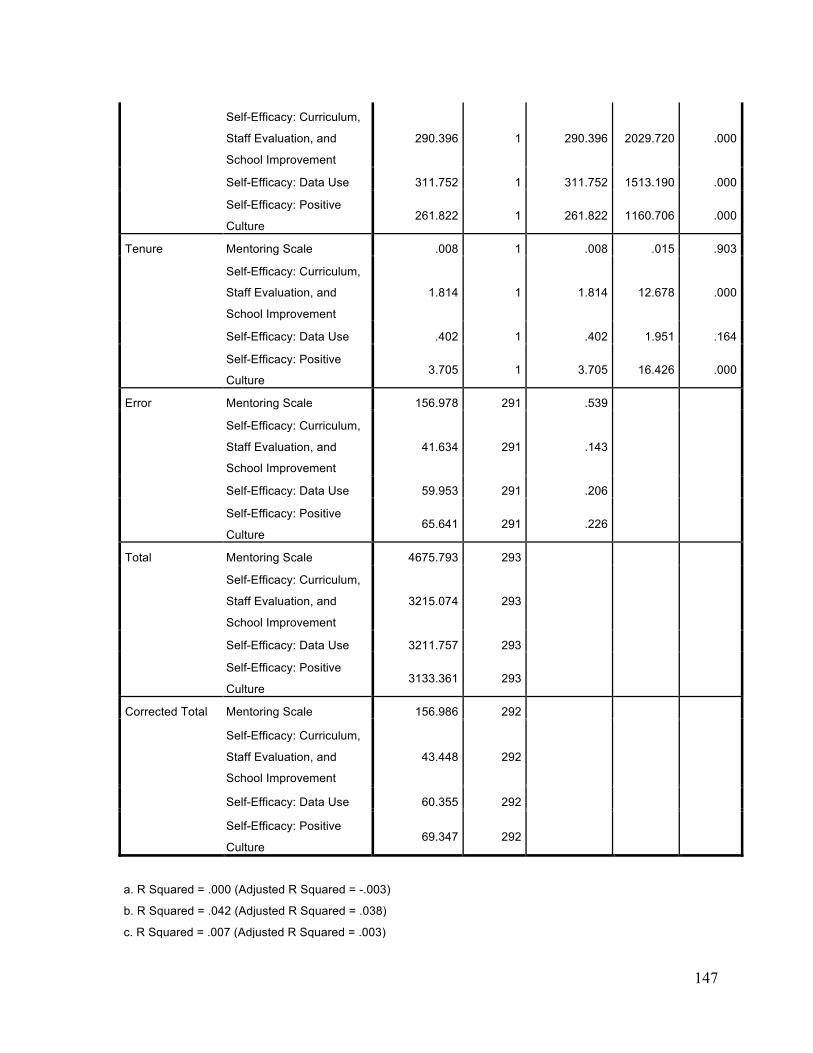
147
Self-Efficacy: Curriculum,
Staff Evaluation, and
School Improvement
290.396 1 290.396 2029.720 .000
Self-Efficacy: Data Use 311.752 1 311.752 1513.190 .000
Self-Efficacy: Positive
Culture 261.822 1 261.822 1160.706 .000
Tenure Mentoring Scale .008 1 .008 .015 .903
Self-Efficacy: Curriculum,
Staff Evaluation, and
School Improvement
1.814 1 1.814 12.678 .000
Self-Efficacy: Data Use .402 1 .402 1.951 .164
Self-Efficacy: Positive
Culture 3.705 1 3.705 16.426 .000
Error Mentoring Scale 156.978 291 .539 Self-Efficacy: Curriculum,
Staff Evaluation, and
School Improvement
41.634 291 .143
Self-Efficacy: Data Use 59.953 291 .206 Self-Efficacy: Positive
Culture 65.641 291 .226
Total Mentoring Scale 4675.793 293 Self-Efficacy: Curriculum,
Staff Evaluation, and
School Improvement
3215.074 293
Self-Efficacy: Data Use 3211.757 293 Self-Efficacy: Positive
Culture 3133.361 293
Corrected Total Mentoring Scale 156.986 292 Self-Efficacy: Curriculum,
Staff Evaluation, and
School Improvement
43.448 292
Self-Efficacy: Data Use 60.355 292 Self-Efficacy: Positive
Culture 69.347 292
a. R Squared = .000 (Adjusted R Squared = -.003)
b. R Squared = .042 (Adjusted R Squared = .038)
c. R Squared = .007 (Adjusted R Squared = .003)
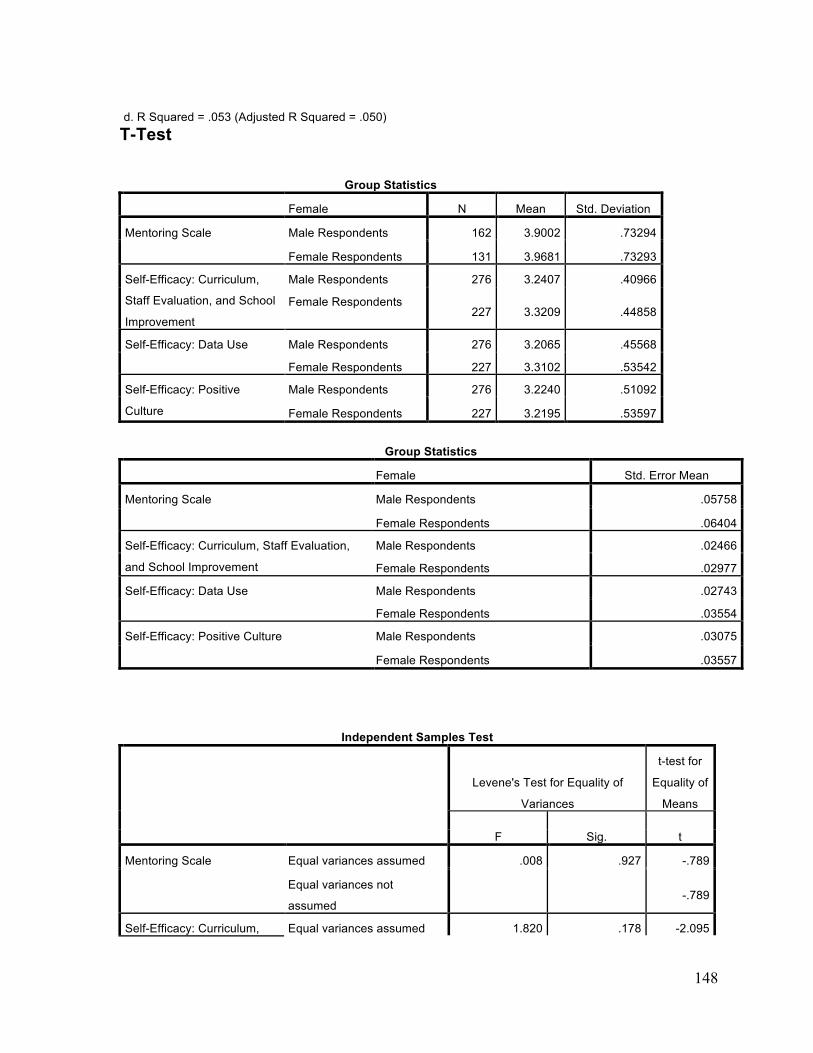
148
d. R Squared = .053 (Adjusted R Squared = .050) T-Test
Group Statistics
Female N Mean Std. Deviation
Mentoring Scale Male Respondents 162 3.9002 .73294
Female Respondents 131 3.9681 .73293
Self-Efficacy: Curriculum,
Staff Evaluation, and School
Improvement
Male Respondents 276 3.2407 .40966
Female Respondents 227 3.3209 .44858
Self-Efficacy: Data Use Male Respondents 276 3.2065 .45568
Female Respondents 227 3.3102 .53542
Self-Efficacy: Positive
Culture
Male Respondents 276 3.2240 .51092
Female Respondents 227 3.2195 .53597
Group Statistics
Female Std. Error Mean
Mentoring Scale Male Respondents .05758
Female Respondents .06404
Self-Efficacy: Curriculum, Staff Evaluation,
and School Improvement
Male Respondents .02466
Female Respondents .02977
Self-Efficacy: Data Use Male Respondents .02743
Female Respondents .03554
Self-Efficacy: Positive Culture Male Respondents .03075
Female Respondents .03557
Independent Samples Test
Levene's Test for Equality of
Variances
t-test for
Equality of
Means
F Sig. t
Mentoring Scale Equal variances assumed .008 .927 -.789
Equal variances not
assumed -.789
Self-Efficacy: Curriculum, Equal variances assumed 1.820 .178 -2.095
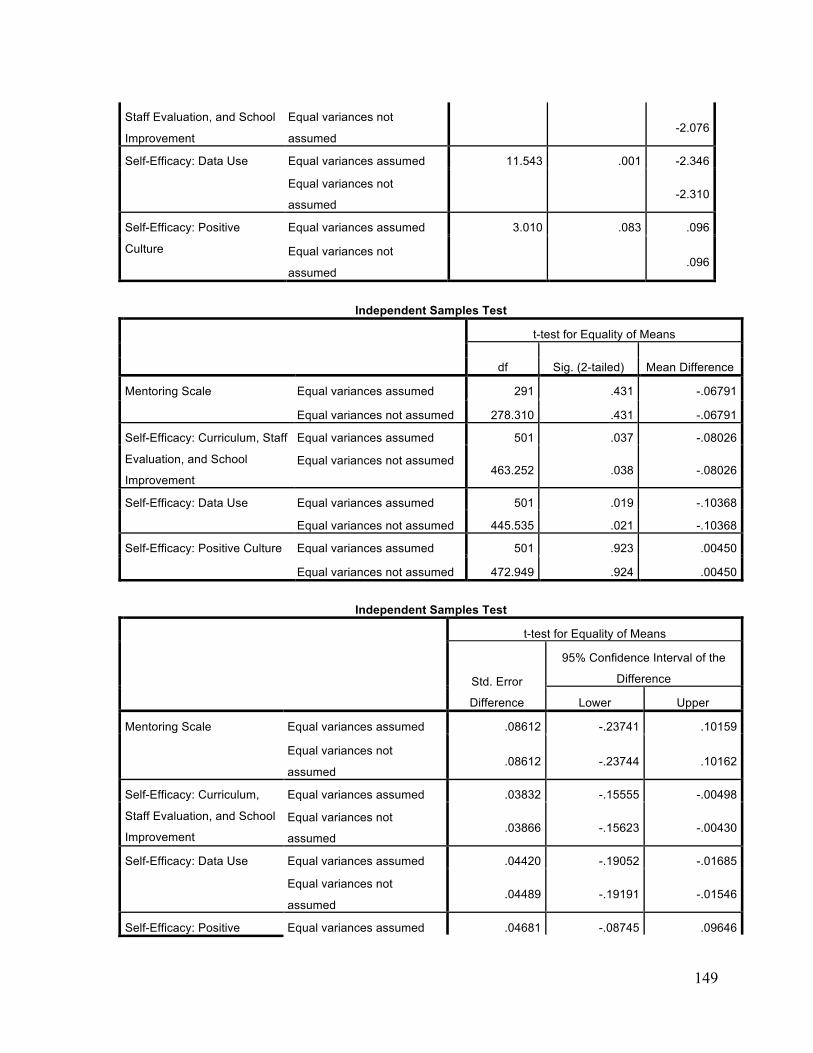
149
Staff Evaluation, and School
Improvement
Equal variances not
assumed -2.076
Self-Efficacy: Data Use Equal variances assumed 11.543 .001 -2.346
Equal variances not
assumed -2.310
Self-Efficacy: Positive
Culture
Equal variances assumed 3.010 .083 .096
Equal variances not
assumed .096
Independent Samples Test
t-test for Equality of Means
df Sig. (2-tailed) Mean Difference
Mentoring Scale Equal variances assumed 291 .431 -.06791
Equal variances not assumed 278.310 .431 -.06791
Self-Efficacy: Curriculum, Staff
Evaluation, and School
Improvement
Equal variances assumed 501 .037 -.08026
Equal variances not assumed 463.252 .038 -.08026
Self-Efficacy: Data Use Equal variances assumed 501 .019 -.10368
Equal variances not assumed 445.535 .021 -.10368
Self-Efficacy: Positive Culture Equal variances assumed 501 .923 .00450
Equal variances not assumed 472.949 .924 .00450
Independent Samples Test
t-test for Equality of Means
Std. Error
Difference
95% Confidence Interval of the
Difference
Lower Upper
Mentoring Scale Equal variances assumed .08612 -.23741 .10159
Equal variances not
assumed .08612 -.23744 .10162
Self-Efficacy: Curriculum,
Staff Evaluation, and School
Improvement
Equal variances assumed .03832 -.15555 -.00498
Equal variances not
assumed .03866 -.15623 -.00430
Self-Efficacy: Data Use Equal variances assumed .04420 -.19052 -.01685
Equal variances not
assumed .04489 -.19191 -.01546
Self-Efficacy: Positive Equal variances assumed .04681 -.08745 .09646
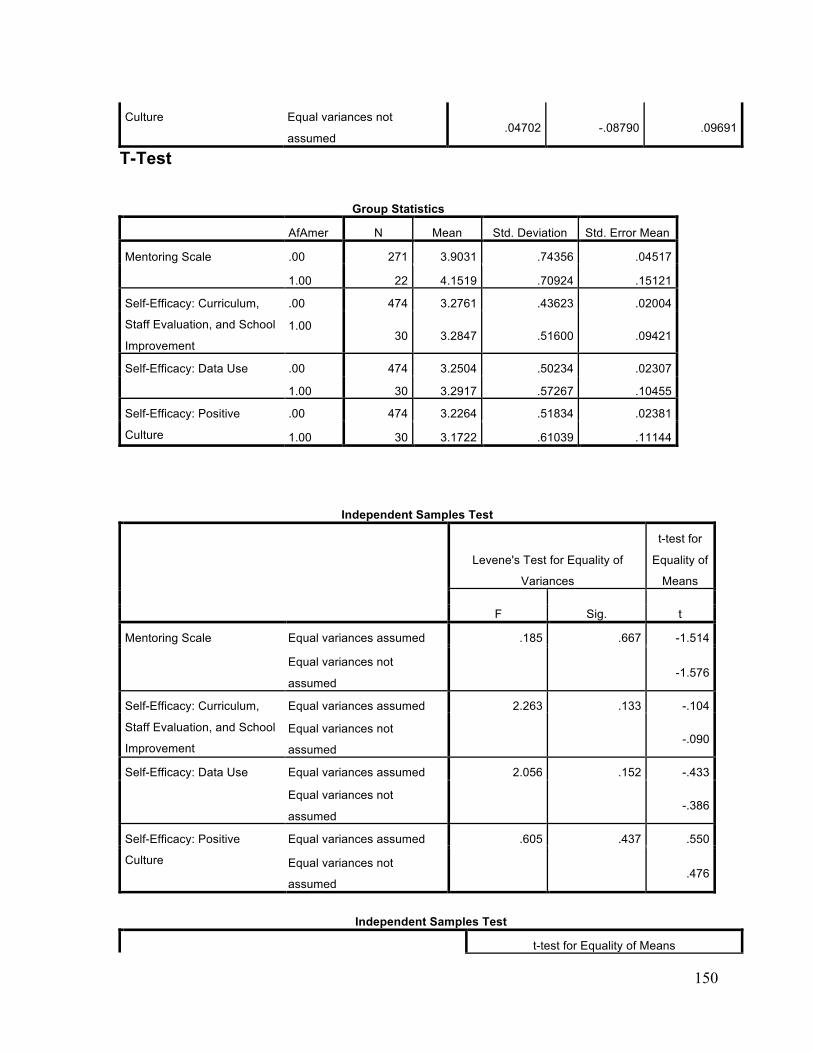
150
Culture Equal variances not
assumed .04702 -.08790 .09691
T-Test
Group Statistics
AfAmer N Mean Std. Deviation Std. Error Mean
Mentoring Scale .00 271 3.9031 .74356 .04517
1.00 22 4.1519 .70924 .15121
Self-Efficacy: Curriculum,
Staff Evaluation, and School
Improvement
.00 474 3.2761 .43623 .02004
1.00 30 3.2847 .51600 .09421
Self-Efficacy: Data Use .00 474 3.2504 .50234 .02307
1.00 30 3.2917 .57267 .10455
Self-Efficacy: Positive
Culture
.00 474 3.2264 .51834 .02381
1.00 30 3.1722 .61039 .11144
Independent Samples Test
Levene's Test for Equality of
Variances
t-test for
Equality of
Means
F Sig. t
Mentoring Scale Equal variances assumed .185 .667 -1.514
Equal variances not
assumed -1.576
Self-Efficacy: Curriculum,
Staff Evaluation, and School
Improvement
Equal variances assumed 2.263 .133 -.104
Equal variances not
assumed -.090
Self-Efficacy: Data Use Equal variances assumed 2.056 .152 -.433
Equal variances not
assumed -.386
Self-Efficacy: Positive
Culture
Equal variances assumed .605 .437 .550
Equal variances not
assumed .476
Independent Samples Test
t-test for Equality of Means
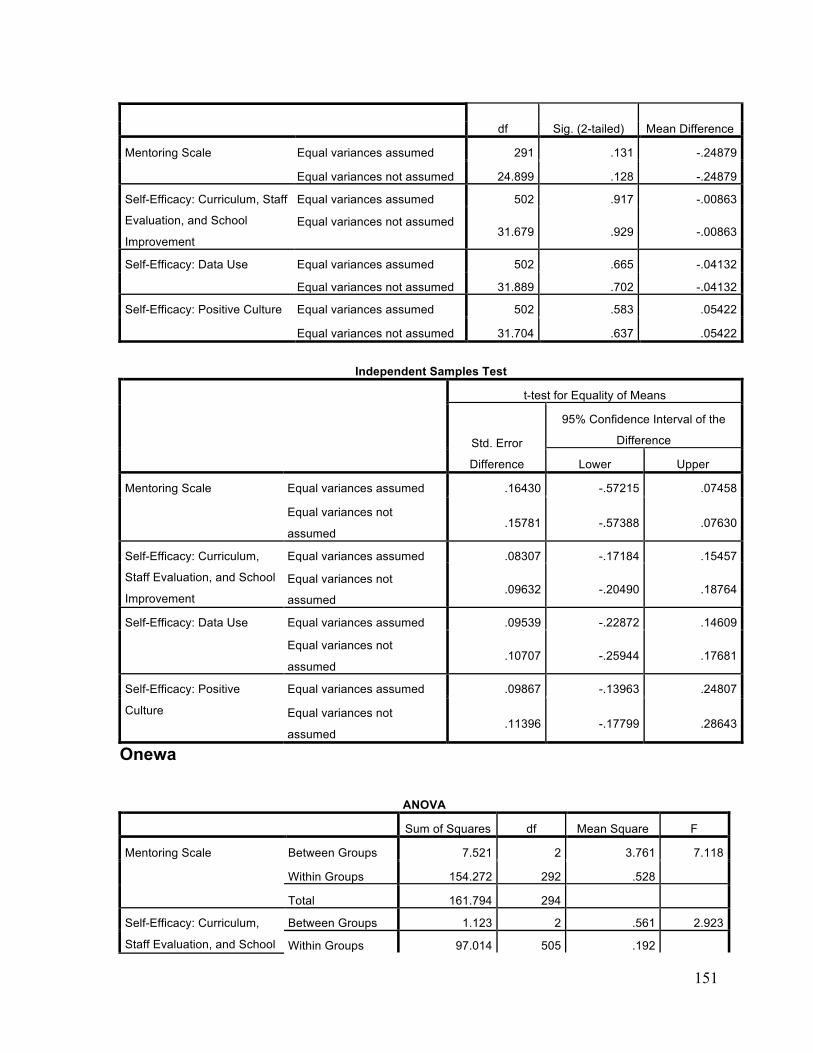
151
df Sig. (2-tailed) Mean Difference
Mentoring Scale Equal variances assumed 291 .131 -.24879
Equal variances not assumed 24.899 .128 -.24879
Self-Efficacy: Curriculum, Staff
Evaluation, and School
Improvement
Equal variances assumed 502 .917 -.00863
Equal variances not assumed 31.679 .929 -.00863
Self-Efficacy: Data Use Equal variances assumed 502 .665 -.04132
Equal variances not assumed 31.889 .702 -.04132
Self-Efficacy: Positive Culture Equal variances assumed 502 .583 .05422
Equal variances not assumed 31.704 .637 .05422
Independent Samples Test
t-test for Equality of Means
Std. Error
Difference
95% Confidence Interval of the
Difference
Lower Upper
Mentoring Scale Equal variances assumed .16430 -.57215 .07458
Equal variances not
assumed .15781 -.57388 .07630
Self-Efficacy: Curriculum,
Staff Evaluation, and School
Improvement
Equal variances assumed .08307 -.17184 .15457
Equal variances not
assumed .09632 -.20490 .18764
Self-Efficacy: Data Use Equal variances assumed .09539 -.22872 .14609
Equal variances not
assumed .10707 -.25944 .17681
Self-Efficacy: Positive
Culture
Equal variances assumed .09867 -.13963 .24807
Equal variances not
assumed .11396 -.17799 .28643
Onewa
ANOVA
Sum of Squares df Mean Square F
Mentoring Scale Between Groups 7.521 2 3.761 7.118
Within Groups 154.272 292 .528
Total 161.794 294 Self-Efficacy: Curriculum,
Staff Evaluation, and School
Between Groups 1.123 2 .561 2.923
Within Groups 97.014 505 .192
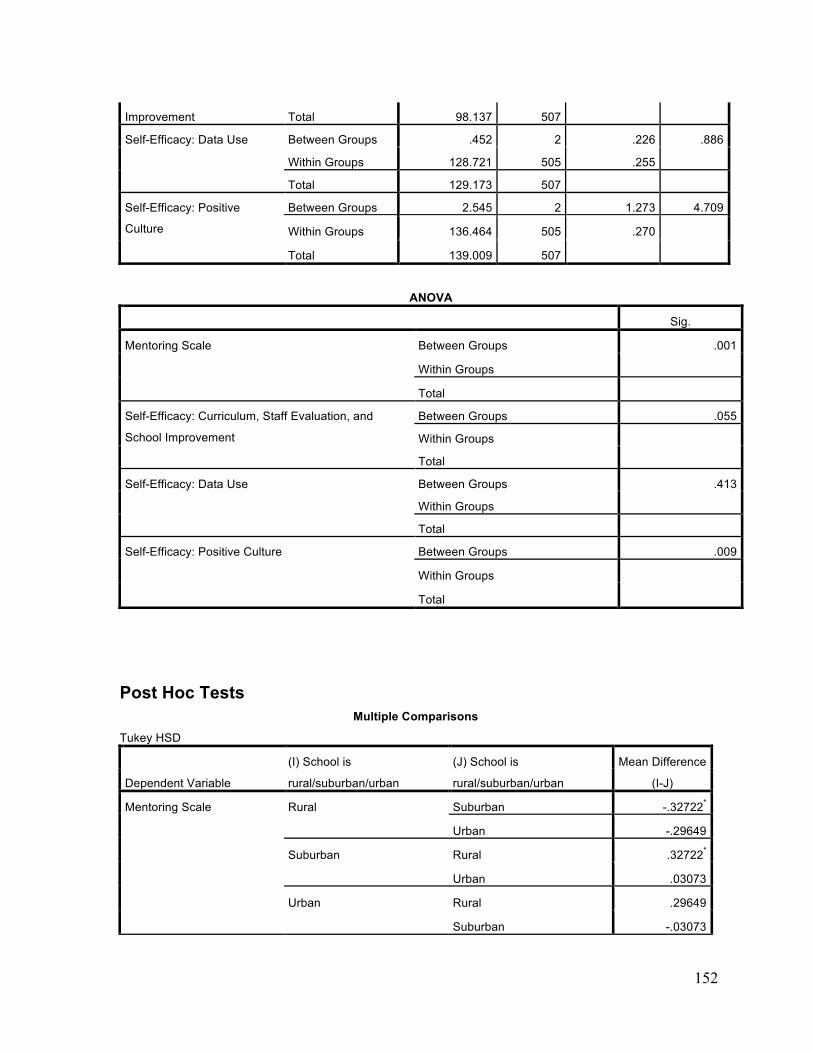
152
Improvement Total 98.137 507 Self-Efficacy: Data Use Between Groups .452 2 .226 .886
Within Groups 128.721 505 .255 Total 129.173 507
Self-Efficacy: Positive
Culture
Between Groups 2.545 2 1.273 4.709
Within Groups 136.464 505 .270
Total 139.009 507
ANOVA
Sig.
Mentoring Scale Between Groups .001
Within Groups Total
Self-Efficacy: Curriculum, Staff Evaluation, and
School Improvement
Between Groups .055
Within Groups Total
Self-Efficacy: Data Use Between Groups .413
Within Groups Total
Self-Efficacy: Positive Culture Between Groups .009
Within Groups Total
Post Hoc Tests
Multiple Comparisons
Tukey HSD
Dependent Variable
(I) School is
rural/suburban/urban
(J) School is
rural/suburban/urban
Mean Difference
(I-J)
Mentoring Scale Rural Suburban -.32722*
Urban -.29649
Suburban Rural .32722*
Urban .03073
Urban Rural .29649
Suburban -.03073
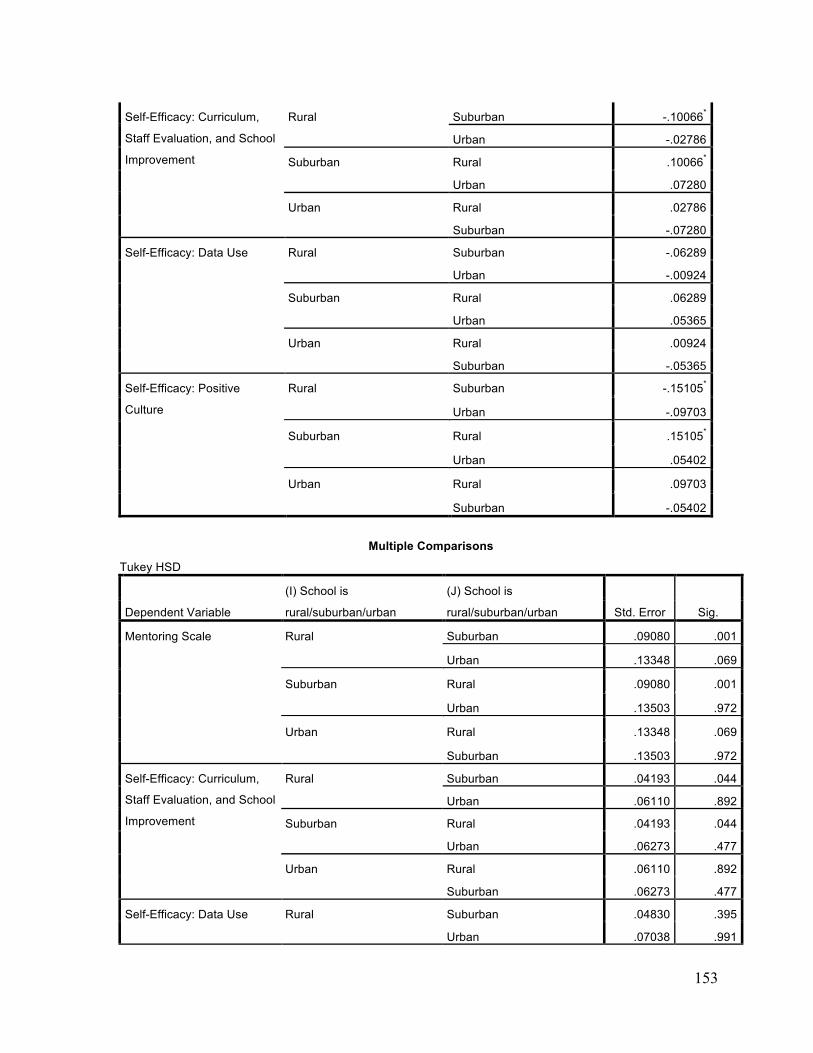
153
Self-Efficacy: Curriculum,
Staff Evaluation, and School
Improvement
Rural Suburban -.10066*
Urban -.02786
Suburban Rural .10066*
Urban .07280
Urban Rural .02786
Suburban -.07280
Self-Efficacy: Data Use Rural Suburban -.06289
Urban -.00924
Suburban Rural .06289
Urban .05365
Urban Rural .00924
Suburban -.05365
Self-Efficacy: Positive
Culture
Rural Suburban -.15105*
Urban -.09703
Suburban Rural .15105*
Urban .05402
Urban Rural .09703
Suburban -.05402
Multiple Comparisons
Tukey HSD
Dependent Variable
(I) School is
rural/suburban/urban
(J) School is
rural/suburban/urban Std. Error Sig.
Mentoring Scale Rural Suburban .09080 .001
Urban .13348 .069
Suburban Rural .09080 .001
Urban .13503 .972
Urban Rural .13348 .069
Suburban .13503 .972
Self-Efficacy: Curriculum,
Staff Evaluation, and School
Improvement
Rural Suburban .04193 .044
Urban .06110 .892
Suburban Rural .04193 .044
Urban .06273 .477
Urban Rural .06110 .892
Suburban .06273 .477
Self-Efficacy: Data Use Rural Suburban .04830 .395
Urban .07038 .991
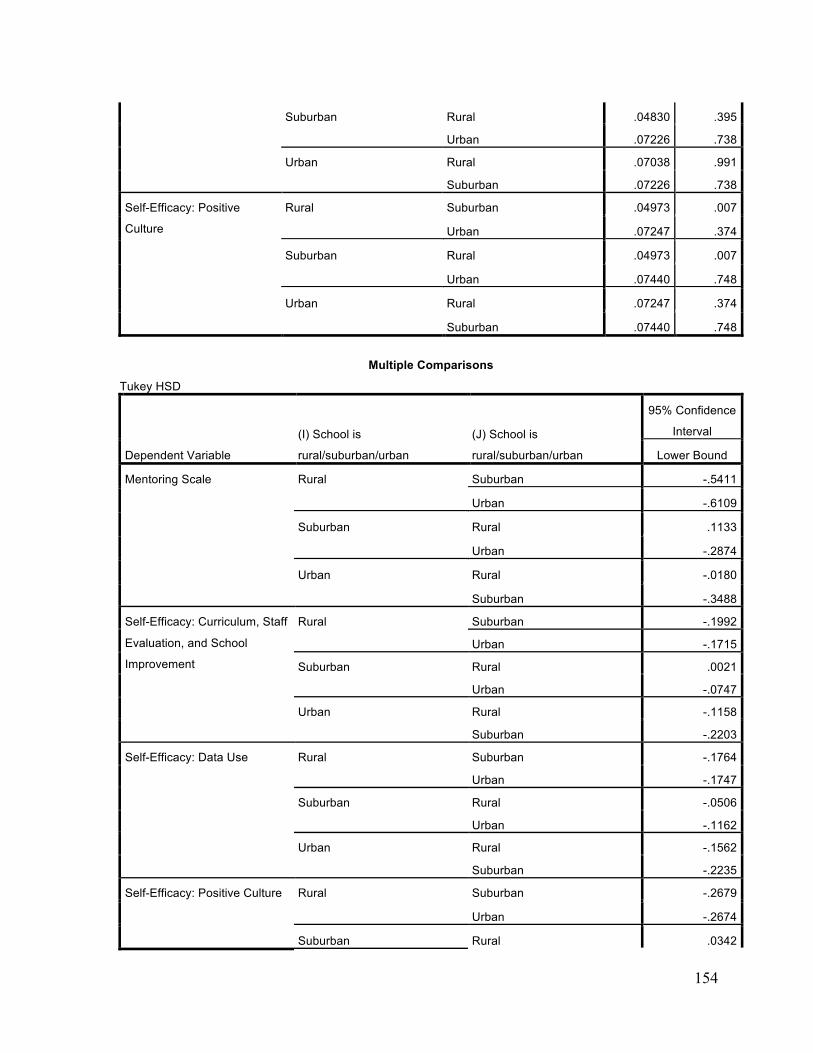
154
Suburban Rural .04830 .395
Urban .07226 .738
Urban Rural .07038 .991
Suburban .07226 .738
Self-Efficacy: Positive
Culture
Rural Suburban .04973 .007
Urban .07247 .374
Suburban Rural .04973 .007
Urban .07440 .748
Urban Rural .07247 .374
Suburban .07440 .748
Multiple Comparisons
Tukey HSD
Dependent Variable
(I) School is
rural/suburban/urban
(J) School is
rural/suburban/urban
95% Confidence
Interval
Lower Bound
Mentoring Scale Rural Suburban -.5411
Urban -.6109
Suburban Rural .1133
Urban -.2874
Urban Rural -.0180
Suburban -.3488
Self-Efficacy: Curriculum, Staff
Evaluation, and School
Improvement
Rural Suburban -.1992
Urban -.1715
Suburban Rural .0021
Urban -.0747
Urban Rural -.1158
Suburban -.2203
Self-Efficacy: Data Use Rural Suburban -.1764
Urban -.1747
Suburban Rural -.0506
Urban -.1162
Urban Rural -.1562
Suburban -.2235
Self-Efficacy: Positive Culture Rural Suburban -.2679
Urban -.2674
Suburban Rural .0342
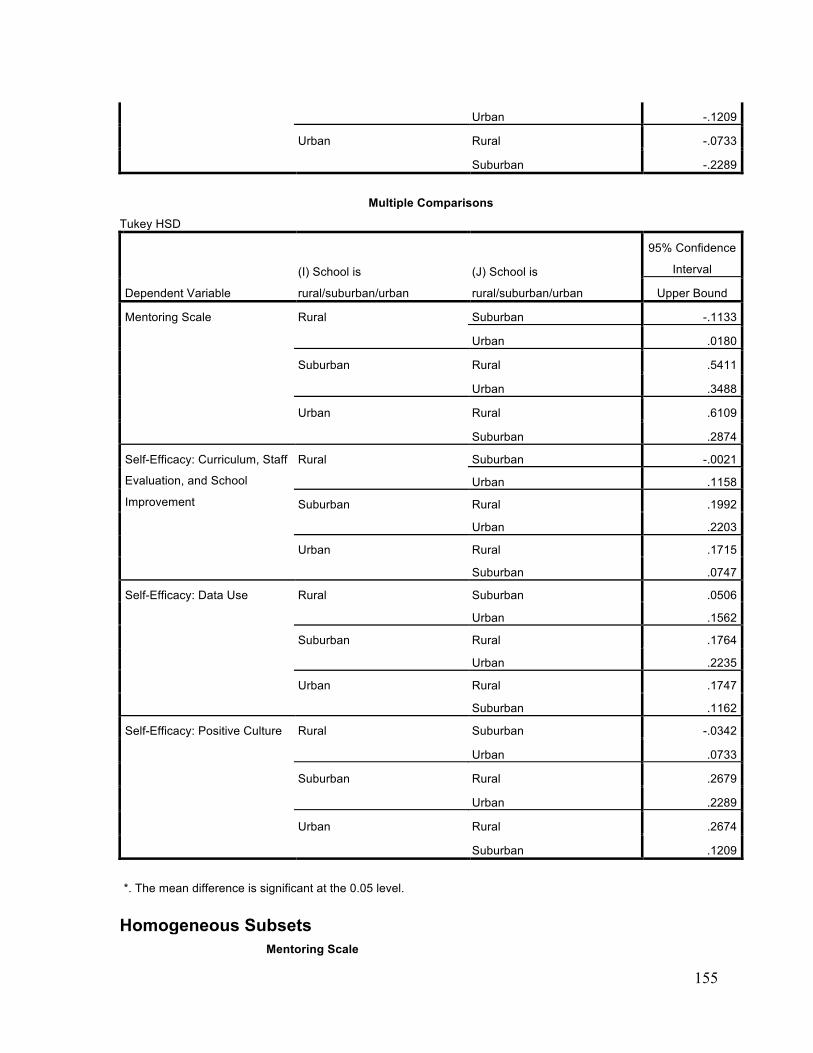
155
Urban -.1209
Urban Rural -.0733
Suburban -.2289
Multiple Comparisons
Tukey HSD
Dependent Variable
(I) School is
rural/suburban/urban
(J) School is
rural/suburban/urban
95% Confidence
Interval
Upper Bound
Mentoring Scale Rural Suburban -.1133
Urban .0180
Suburban Rural .5411
Urban .3488
Urban Rural .6109
Suburban .2874
Self-Efficacy: Curriculum, Staff
Evaluation, and School
Improvement
Rural Suburban -.0021
Urban .1158
Suburban Rural .1992
Urban .2203
Urban Rural .1715
Suburban .0747
Self-Efficacy: Data Use Rural Suburban .0506
Urban .1562
Suburban Rural .1764
Urban .2235
Urban Rural .1747
Suburban .1162
Self-Efficacy: Positive Culture Rural Suburban -.0342
Urban .0733
Suburban Rural .2679
Urban .2289
Urban Rural .2674
Suburban .1209
*. The mean difference is significant at the 0.05 level. Homogeneous Subsets
Mentoring Scale
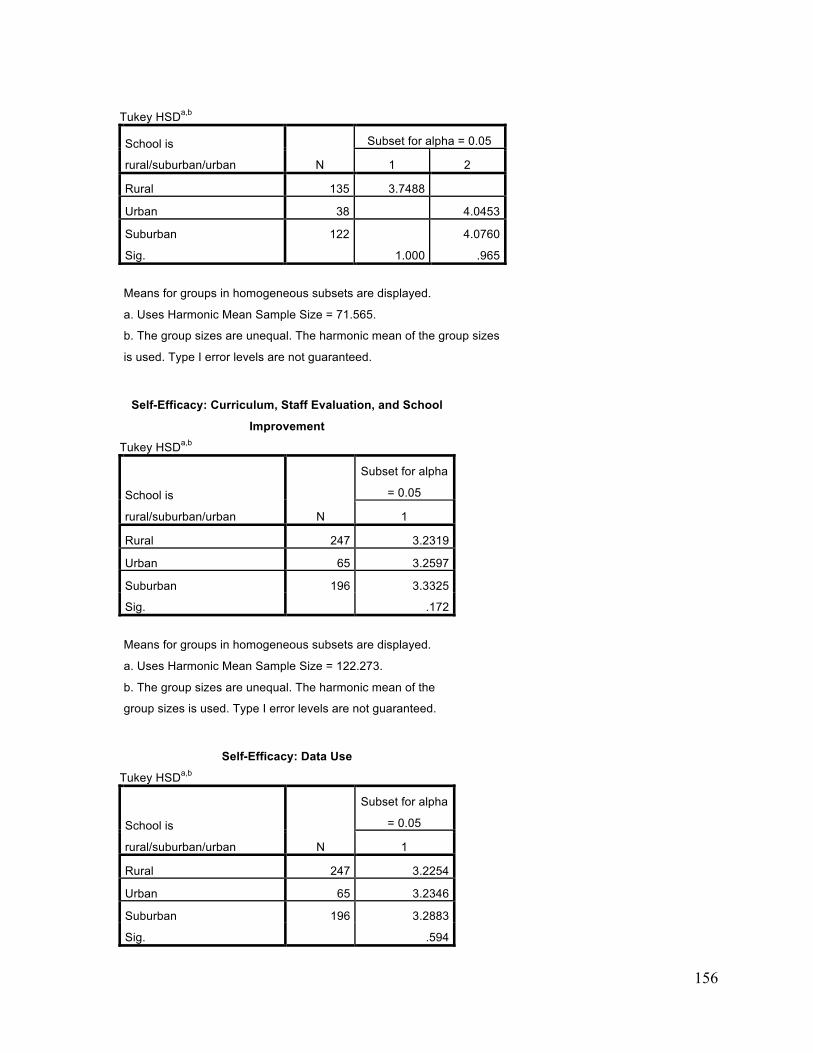
156
Tukey HSDa,b
School is
rural/suburban/urban N
Subset for alpha = 0.05
1 2
Rural 135 3.7488 Urban 38 4.0453
Suburban 122 4.0760
Sig. 1.000 .965
Means for groups in homogeneous subsets are displayed.
a. Uses Harmonic Mean Sample Size = 71.565.
b. The group sizes are unequal. The harmonic mean of the group sizes
is used. Type I error levels are not guaranteed.
Self-Efficacy: Curriculum, Staff Evaluation, and School
Improvement
Tukey HSDa,b
School is
rural/suburban/urban N
Subset for alpha
= 0.05
1
Rural 247 3.2319
Urban 65 3.2597
Suburban 196 3.3325
Sig. .172
Means for groups in homogeneous subsets are displayed.
a. Uses Harmonic Mean Sample Size = 122.273.
b. The group sizes are unequal. The harmonic mean of the
group sizes is used. Type I error levels are not guaranteed.
Self-Efficacy: Data Use
Tukey HSDa,b
School is
rural/suburban/urban N
Subset for alpha
= 0.05
1
Rural 247 3.2254
Urban 65 3.2346
Suburban 196 3.2883
Sig. .594
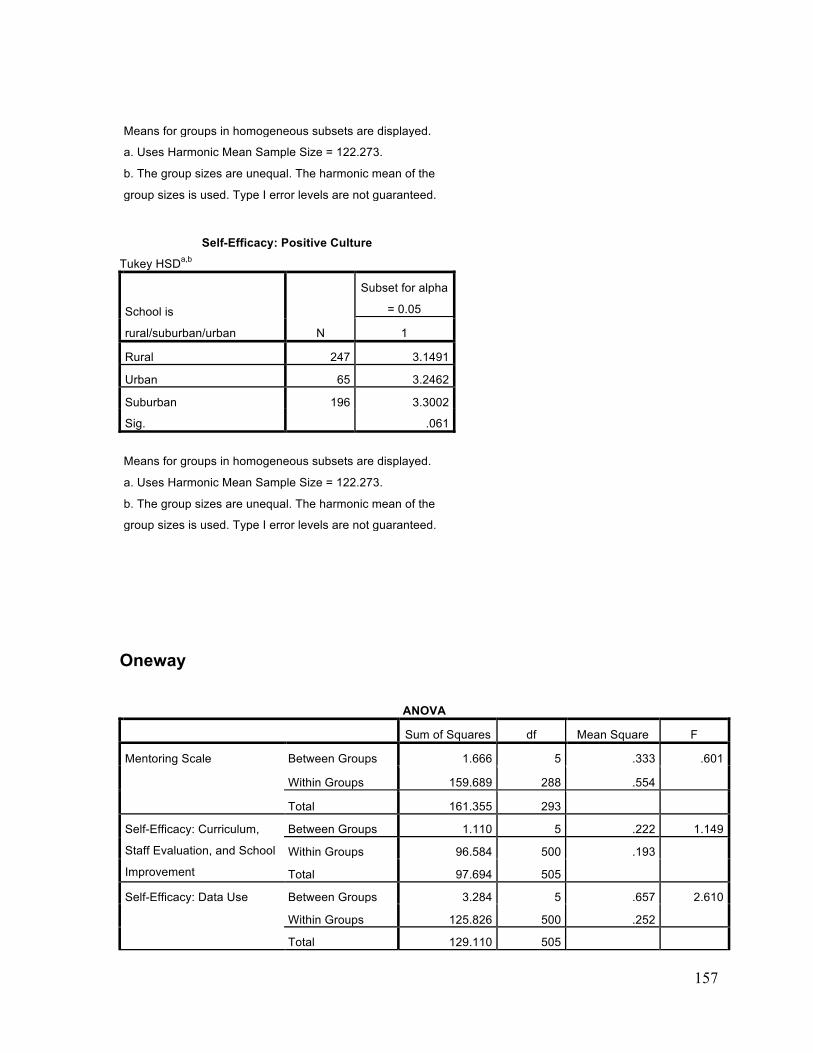
157
Means for groups in homogeneous subsets are displayed.
a. Uses Harmonic Mean Sample Size = 122.273.
b. The group sizes are unequal. The harmonic mean of the
group sizes is used. Type I error levels are not guaranteed.
Self-Efficacy: Positive Culture
Tukey HSDa,b
School is
rural/suburban/urban N
Subset for alpha
= 0.05
1
Rural 247 3.1491
Urban 65 3.2462
Suburban 196 3.3002
Sig. .061
Means for groups in homogeneous subsets are displayed.
a. Uses Harmonic Mean Sample Size = 122.273.
b. The group sizes are unequal. The harmonic mean of the
group sizes is used. Type I error levels are not guaranteed.
Oneway
ANOVA
Sum of Squares df Mean Square F
Mentoring Scale Between Groups 1.666 5 .333 .601
Within Groups 159.689 288 .554 Total 161.355 293
Self-Efficacy: Curriculum,
Staff Evaluation, and School
Improvement
Between Groups 1.110 5 .222 1.149
Within Groups 96.584 500 .193 Total 97.694 505
Self-Efficacy: Data Use Between Groups 3.284 5 .657 2.610
Within Groups 125.826 500 .252 Total 129.110 505
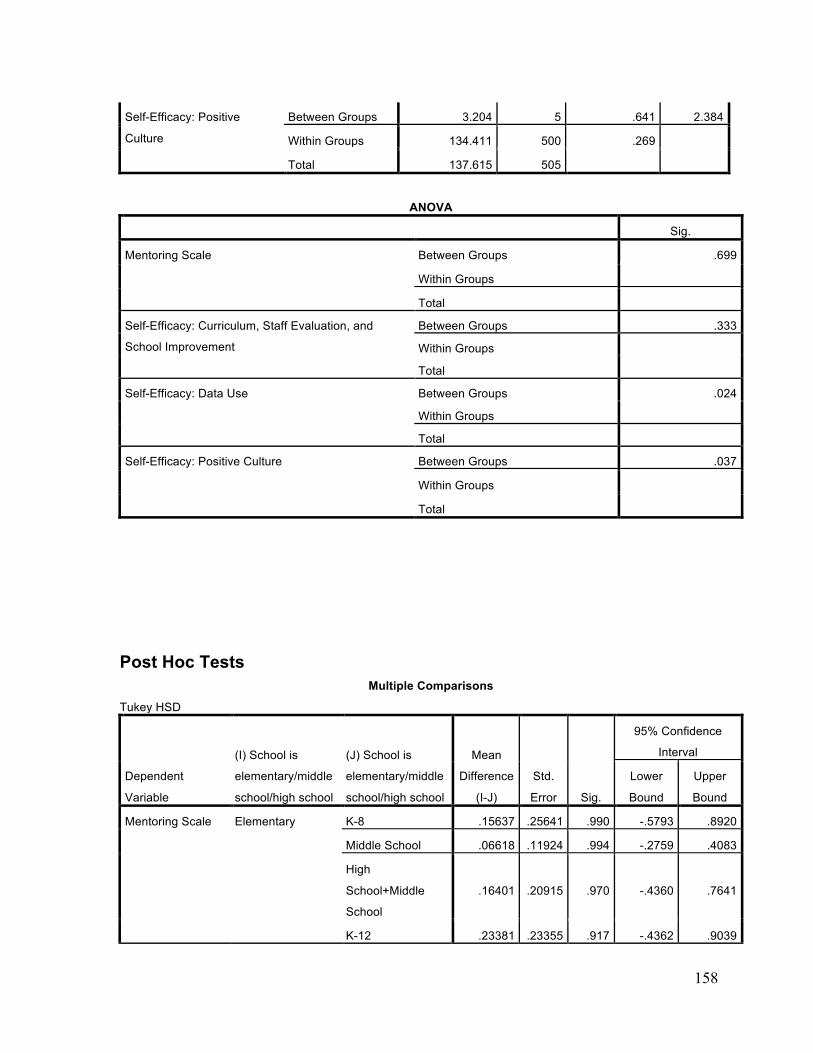
158
Self-Efficacy: Positive
Culture
Between Groups 3.204 5 .641 2.384
Within Groups 134.411 500 .269 Total 137.615 505
ANOVA
Sig.
Mentoring Scale Between Groups .699
Within Groups Total
Self-Efficacy: Curriculum, Staff Evaluation, and
School Improvement
Between Groups .333
Within Groups Total
Self-Efficacy: Data Use Between Groups .024
Within Groups Total
Self-Efficacy: Positive Culture Between Groups .037
Within Groups
Total
Post Hoc Tests
Multiple Comparisons
Tukey HSD
Dependent
Variable
(I) School is
elementary/middle
school/high school
(J) School is
elementary/middle
school/high school
Mean
Difference
(I-J)
Std.
Error Sig.
95% Confidence
Interval
Lower
Bound
Upper
Bound
Mentoring Scale Elementary K-8 .15637 .25641 .990 -.5793 .8920
Middle School .06618 .11924 .994 -.2759 .4083
High
School+Middle
School
.16401 .20915 .970 -.4360 .7641
K-12 .23381 .23355 .917 -.4362 .9039
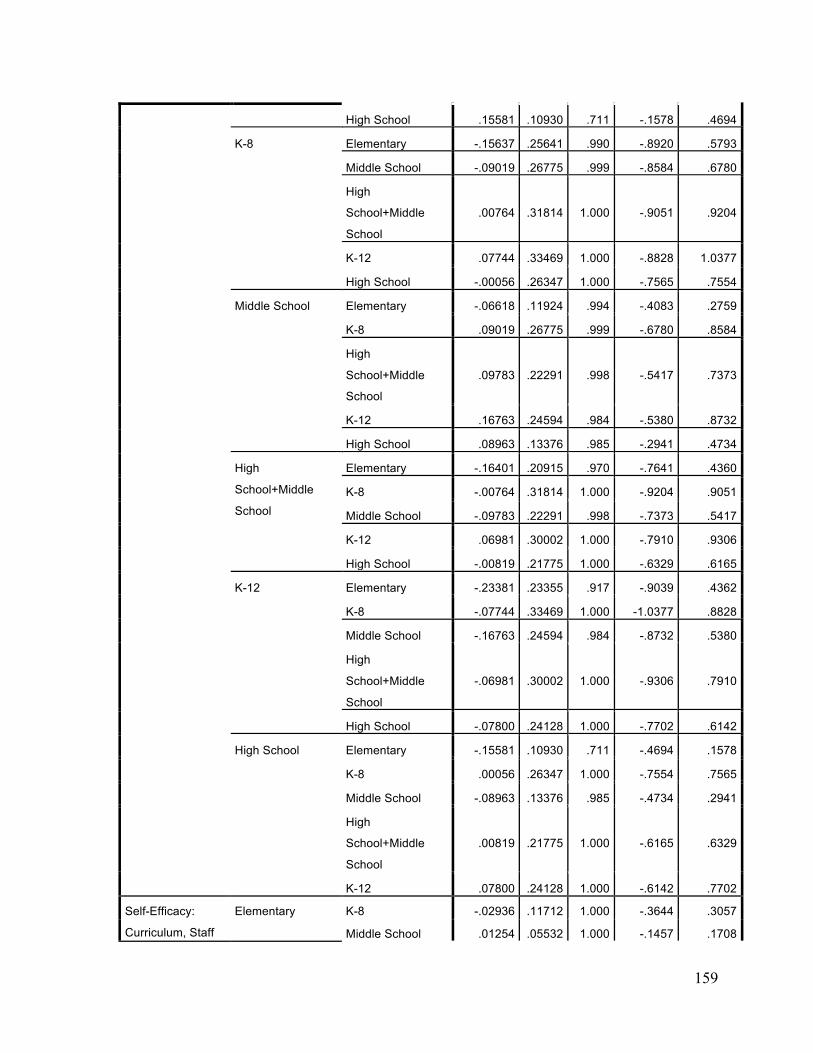
159
High School .15581 .10930 .711 -.1578 .4694
K-8 Elementary -.15637 .25641 .990 -.8920 .5793
Middle School -.09019 .26775 .999 -.8584 .6780
High
School+Middle
School
.00764 .31814 1.000 -.9051 .9204
K-12 .07744 .33469 1.000 -.8828 1.0377
High School -.00056 .26347 1.000 -.7565 .7554
Middle School Elementary -.06618 .11924 .994 -.4083 .2759
K-8 .09019 .26775 .999 -.6780 .8584
High
School+Middle
School
.09783 .22291 .998 -.5417 .7373
K-12 .16763 .24594 .984 -.5380 .8732
High School .08963 .13376 .985 -.2941 .4734
High
School+Middle
School
Elementary -.16401 .20915 .970 -.7641 .4360
K-8 -.00764 .31814 1.000 -.9204 .9051
Middle School -.09783 .22291 .998 -.7373 .5417
K-12 .06981 .30002 1.000 -.7910 .9306
High School -.00819 .21775 1.000 -.6329 .6165
K-12 Elementary -.23381 .23355 .917 -.9039 .4362
K-8 -.07744 .33469 1.000 -1.0377 .8828
Middle School -.16763 .24594 .984 -.8732 .5380
High
School+Middle
School
-.06981 .30002 1.000 -.9306 .7910
High School -.07800 .24128 1.000 -.7702 .6142
High School Elementary -.15581 .10930 .711 -.4694 .1578
K-8 .00056 .26347 1.000 -.7554 .7565
Middle School -.08963 .13376 .985 -.4734 .2941
High
School+Middle
School
.00819 .21775 1.000 -.6165 .6329
K-12 .07800 .24128 1.000 -.6142 .7702
Self-Efficacy:
Curriculum, Staff
Elementary K-8 -.02936 .11712 1.000 -.3644 .3057
Middle School .01254 .05532 1.000 -.1457 .1708

160
Evaluation, and
School
Improvement
High
School+Middle
School
.19060 .08941 .273 -.0652 .4464
K-12 -.02772 .09612 1.000 -.3027 .2473
High School -.02709 .04897 .994 -.1672 .1130
K-8 Elementary .02936 .11712 1.000 -.3057 .3644
Middle School .04189 .12287 .999 -.3096 .3934
High
School+Middle
School
.21996 .14154 .629 -.1849 .6249
K-12 .00164 .14586 1.000 -.4156 .4189
High School .00227 .12015 1.000 -.3415 .3460
Middle School Elementary -.01254 .05532 1.000 -.1708 .1457
K-8 -.04189 .12287 .999 -.3934 .3096
High
School+Middle
School
.17807 .09682 .442 -.0989 .4551
K-12 -.04025 .10305 .999 -.3351 .2545
High School -.03963 .06147 .988 -.2155 .1362
High
School+Middle
School
Elementary -.19060 .08941 .273 -.4464 .0652
K-8 -.21996 .14154 .629 -.6249 .1849
Middle School -.17807 .09682 .442 -.4551 .0989
K-12 -.21832 .12471 .499 -.5751 .1385
High School -.21769 .09334 .183 -.4847 .0493
K-12 Elementary .02772 .09612 1.000 -.2473 .3027
K-8 -.00164 .14586 1.000 -.4189 .4156
Middle School .04025 .10305 .999 -.2545 .3351
High
School+Middle
School
.21832 .12471 .499 -.1385 .5751
High School .00063 .09978 1.000 -.2848 .2861
High School Elementary .02709 .04897 .994 -.1130 .1672
K-8 -.00227 .12015 1.000 -.3460 .3415
Middle School .03963 .06147 .988 -.1362 .2155
High
School+Middle
School
.21769 .09334 .183 -.0493 .4847
K-12 -.00063 .09978 1.000 -.2861 .2848
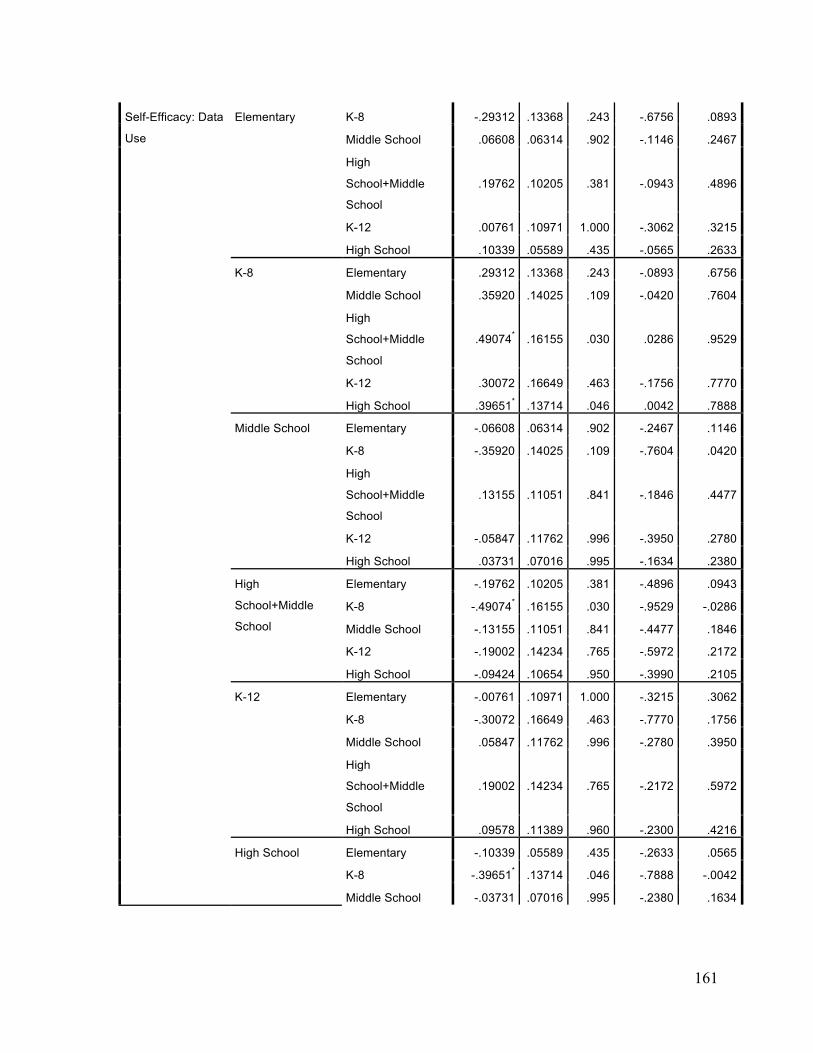
161
Self-Efficacy: Data
Use
Elementary K-8 -.29312 .13368 .243 -.6756 .0893
Middle School .06608 .06314 .902 -.1146 .2467
High
School+Middle
School
.19762 .10205 .381 -.0943 .4896
K-12 .00761 .10971 1.000 -.3062 .3215
High School .10339 .05589 .435 -.0565 .2633
K-8 Elementary .29312 .13368 .243 -.0893 .6756
Middle School .35920 .14025 .109 -.0420 .7604
High
School+Middle
School
.49074* .16155 .030 .0286 .9529
K-12 .30072 .16649 .463 -.1756 .7770
High School .39651* .13714 .046 .0042 .7888
Middle School Elementary -.06608 .06314 .902 -.2467 .1146
K-8 -.35920 .14025 .109 -.7604 .0420
High
School+Middle
School
.13155 .11051 .841 -.1846 .4477
K-12 -.05847 .11762 .996 -.3950 .2780
High School .03731 .07016 .995 -.1634 .2380
High
School+Middle
School
Elementary -.19762 .10205 .381 -.4896 .0943
K-8 -.49074* .16155 .030 -.9529 -.0286
Middle School -.13155 .11051 .841 -.4477 .1846
K-12 -.19002 .14234 .765 -.5972 .2172
High School -.09424 .10654 .950 -.3990 .2105
K-12 Elementary -.00761 .10971 1.000 -.3215 .3062
K-8 -.30072 .16649 .463 -.7770 .1756
Middle School .05847 .11762 .996 -.2780 .3950
High
School+Middle
School
.19002 .14234 .765 -.2172 .5972
High School .09578 .11389 .960 -.2300 .4216
High School Elementary -.10339 .05589 .435 -.2633 .0565
K-8 -.39651* .13714 .046 -.7888 -.0042
Middle School -.03731 .07016 .995 -.2380 .1634

162
High
School+Middle
School
.09424 .10654 .950 -.2105 .3990
K-12 -.09578 .11389 .960 -.4216 .2300
Self-Efficacy:
Positive Culture
Elementary K-8 -.26546 .13817 .390 -.6607 .1298
Middle School -.03941 .06526 .991 -.2261 .1473
High
School+Middle
School
.16047 .10548 .651 -.1413 .4622
K-12 -.08188 .11339 .979 -.4063 .2425
High School -.12747 .05776 .236 -.2927 .0378
K-8 Elementary .26546 .13817 .390 -.1298 .6607
Middle School .22605 .14495 .626 -.1886 .6407
High
School+Middle
School
.42593 .16697 .112 -.0517 .9036
K-12 .18357 .17207 .894 -.3087 .6758
High School .13799 .14174 .926 -.2675 .5435
Middle School Elementary .03941 .06526 .991 -.1473 .2261
K-8 -.22605 .14495 .626 -.6407 .1886
High
School+Middle
School
.19987 .11422 .499 -.1269 .5266
K-12 -.04248 .12156 .999 -.3902 .3053
High School -.08806 .07251 .830 -.2955 .1194
High
School+Middle
School
Elementary -.16047 .10548 .651 -.4622 .1413
K-8 -.42593 .16697 .112 -.9036 .0517
Middle School -.19987 .11422 .499 -.5266 .1269
K-12 -.24235 .14712 .567 -.6632 .1785
High School -.28793 .11011 .096 -.6029 .0271
K-12 Elementary .08188 .11339 .979 -.2425 .4063
K-8 -.18357 .17207 .894 -.6758 .3087
Middle School .04248 .12156 .999 -.3053 .3902
High
School+Middle
School
.24235 .14712 .567 -.1785 .6632
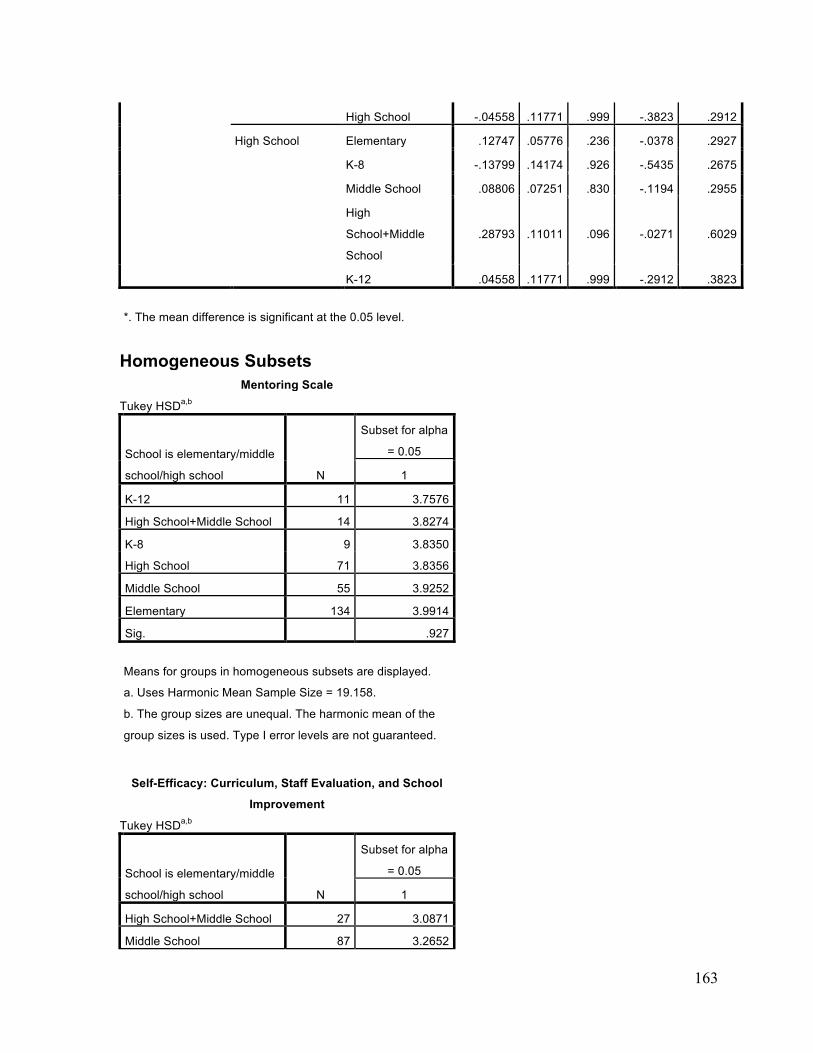
163
High School -.04558 .11771 .999 -.3823 .2912
High School Elementary .12747 .05776 .236 -.0378 .2927
K-8 -.13799 .14174 .926 -.5435 .2675
Middle School .08806 .07251 .830 -.1194 .2955
High
School+Middle
School
.28793 .11011 .096 -.0271 .6029
K-12 .04558 .11771 .999 -.2912 .3823
*. The mean difference is significant at the 0.05 level.
Homogeneous Subsets
Mentoring Scale
Tukey HSDa,b
School is elementary/middle
school/high school N
Subset for alpha
= 0.05
1
K-12 11 3.7576
High School+Middle School 14 3.8274
K-8 9 3.8350
High School 71 3.8356
Middle School 55 3.9252
Elementary 134 3.9914
Sig. .927
Means for groups in homogeneous subsets are displayed.
a. Uses Harmonic Mean Sample Size = 19.158.
b. The group sizes are unequal. The harmonic mean of the
group sizes is used. Type I error levels are not guaranteed.
Self-Efficacy: Curriculum, Staff Evaluation, and School
Improvement
Tukey HSDa,b
School is elementary/middle
school/high school N
Subset for alpha
= 0.05
1
High School+Middle School 27 3.0871
Middle School 87 3.2652

164
Elementary 230 3.2777
High School 124 3.3048
K-12 23 3.3055
K-8 15 3.3071
Sig. .291
Means for groups in homogeneous subsets are displayed.
a. Uses Harmonic Mean Sample Size = 35.070.
b. The group sizes are unequal. The harmonic mean of the
group sizes is used. Type I error levels are not guaranteed.
Self-Efficacy: Data Use
Tukey HSDa,b
School is elementary/middle
school/high school N
Subset for alpha = 0.05
1 2
High School+Middle School 27 3.0926 High School 124 3.1868 Middle School 87 3.2241 K-12 23 3.2826 3.2826
Elementary 230 3.2902 3.2902
K-8 15 3.5833
Sig. .566 .123
Means for groups in homogeneous subsets are displayed.
a. Uses Harmonic Mean Sample Size = 35.070.
b. The group sizes are unequal. The harmonic mean of the group sizes
is used. Type I error levels are not guaranteed.
Self-Efficacy: Positive Culture
Tukey HSDa,b
School is elementary/middle
school/high school N
Subset for alpha = 0.05
1 2
High School+Middle School 27 3.0185 Elementary 230 3.1790 3.1790
Middle School 87 3.2184 3.2184
K-12 23 3.2609 3.2609
High School 124 3.3065 3.3065
K-8 15 3.4444
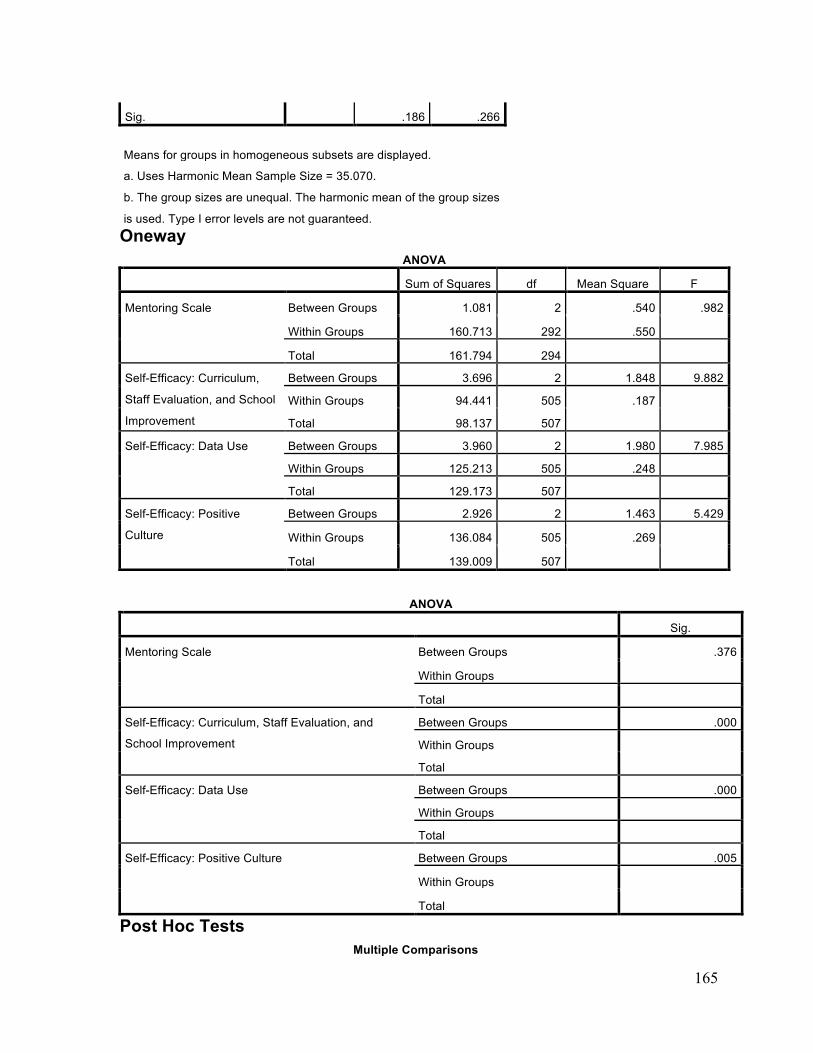
165
Sig. .186 .266
Means for groups in homogeneous subsets are displayed.
a. Uses Harmonic Mean Sample Size = 35.070.
b. The group sizes are unequal. The harmonic mean of the group sizes
is used. Type I error levels are not guaranteed. Oneway
ANOVA
Sum of Squares df Mean Square F
Mentoring Scale Between Groups 1.081 2 .540 .982
Within Groups 160.713 292 .550
Total 161.794 294 Self-Efficacy: Curriculum,
Staff Evaluation, and School
Improvement
Between Groups 3.696 2 1.848 9.882
Within Groups 94.441 505 .187 Total 98.137 507
Self-Efficacy: Data Use Between Groups 3.960 2 1.980 7.985
Within Groups 125.213 505 .248 Total 129.173 507
Self-Efficacy: Positive
Culture
Between Groups 2.926 2 1.463 5.429
Within Groups 136.084 505 .269 Total 139.009 507
ANOVA
Sig.
Mentoring Scale Between Groups .376
Within Groups
Total Self-Efficacy: Curriculum, Staff Evaluation, and
School Improvement
Between Groups .000
Within Groups Total
Self-Efficacy: Data Use Between Groups .000
Within Groups Total
Self-Efficacy: Positive Culture Between Groups .005
Within Groups
Total Post Hoc Tests
Multiple Comparisons
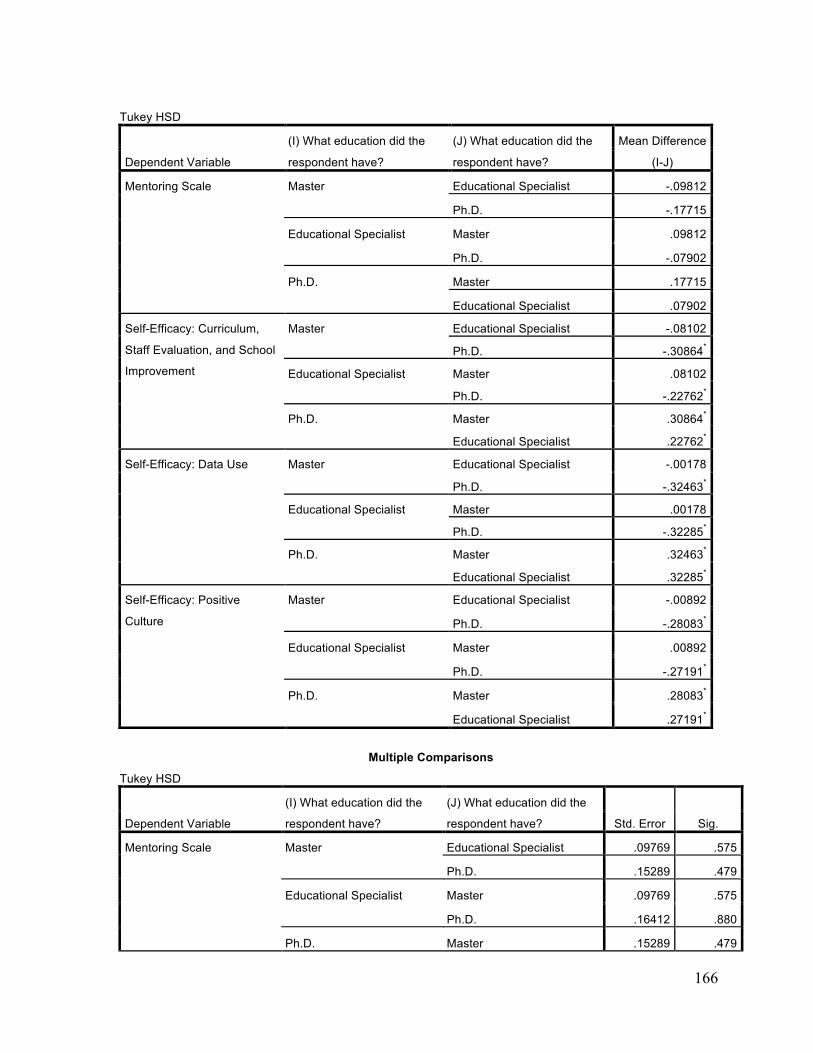
166
Tukey HSD
Dependent Variable
(I) What education did the
respondent have?
(J) What education did the
respondent have?
Mean Difference
(I-J)
Mentoring Scale Master Educational Specialist -.09812
Ph.D. -.17715
Educational Specialist Master .09812
Ph.D. -.07902
Ph.D. Master .17715
Educational Specialist .07902
Self-Efficacy: Curriculum,
Staff Evaluation, and School
Improvement
Master Educational Specialist -.08102
Ph.D. -.30864*
Educational Specialist Master .08102
Ph.D. -.22762*
Ph.D. Master .30864*
Educational Specialist .22762*
Self-Efficacy: Data Use Master Educational Specialist -.00178
Ph.D. -.32463*
Educational Specialist Master .00178
Ph.D. -.32285*
Ph.D. Master .32463*
Educational Specialist .32285*
Self-Efficacy: Positive
Culture
Master Educational Specialist -.00892
Ph.D. -.28083*
Educational Specialist Master .00892
Ph.D. -.27191*
Ph.D. Master .28083*
Educational Specialist .27191*
Multiple Comparisons
Tukey HSD
Dependent Variable
(I) What education did the
respondent have?
(J) What education did the
respondent have? Std. Error Sig.
Mentoring Scale Master Educational Specialist .09769 .575
Ph.D. .15289 .479
Educational Specialist Master .09769 .575
Ph.D. .16412 .880
Ph.D. Master .15289 .479
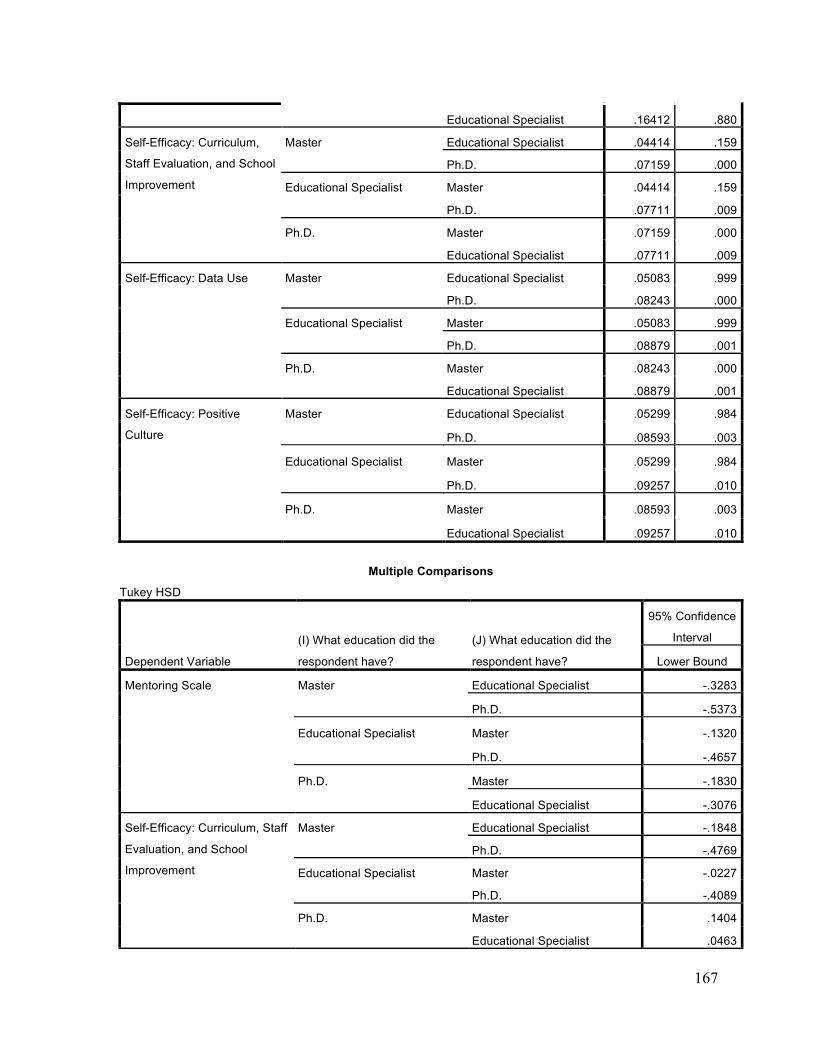
167
Educational Specialist .16412 .880
Self-Efficacy: Curriculum,
Staff Evaluation, and School
Improvement
Master Educational Specialist .04414 .159
Ph.D. .07159 .000
Educational Specialist Master .04414 .159
Ph.D. .07711 .009
Ph.D. Master .07159 .000
Educational Specialist .07711 .009
Self-Efficacy: Data Use Master Educational Specialist .05083 .999
Ph.D. .08243 .000
Educational Specialist Master .05083 .999
Ph.D. .08879 .001
Ph.D. Master .08243 .000
Educational Specialist .08879 .001
Self-Efficacy: Positive
Culture
Master Educational Specialist .05299 .984
Ph.D. .08593 .003
Educational Specialist Master .05299 .984
Ph.D. .09257 .010
Ph.D. Master .08593 .003
Educational Specialist .09257 .010
Multiple Comparisons
Tukey HSD
Dependent Variable
(I) What education did the
respondent have?
(J) What education did the
respondent have?
95% Confidence
Interval
Lower Bound
Mentoring Scale Master Educational Specialist -.3283
Ph.D. -.5373
Educational Specialist Master -.1320
Ph.D. -.4657
Ph.D. Master -.1830
Educational Specialist -.3076
Self-Efficacy: Curriculum, Staff
Evaluation, and School
Improvement
Master Educational Specialist -.1848
Ph.D. -.4769
Educational Specialist Master -.0227
Ph.D. -.4089
Ph.D. Master .1404
Educational Specialist .0463
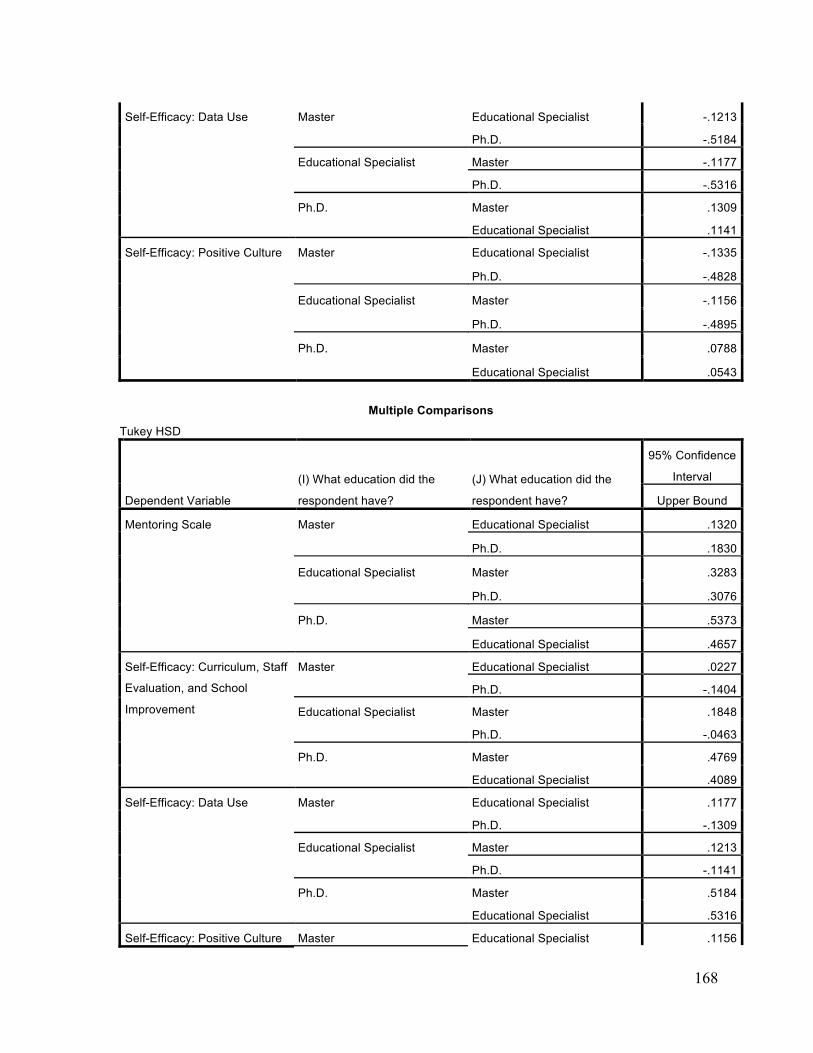
168
Self-Efficacy: Data Use Master Educational Specialist -.1213
Ph.D. -.5184
Educational Specialist Master -.1177
Ph.D. -.5316
Ph.D. Master .1309
Educational Specialist .1141
Self-Efficacy: Positive Culture Master Educational Specialist -.1335
Ph.D. -.4828
Educational Specialist Master -.1156
Ph.D. -.4895
Ph.D. Master .0788
Educational Specialist .0543
Multiple Comparisons
Tukey HSD
Dependent Variable
(I) What education did the
respondent have?
(J) What education did the
respondent have?
95% Confidence
Interval
Upper Bound
Mentoring Scale Master Educational Specialist .1320
Ph.D. .1830
Educational Specialist Master .3283
Ph.D. .3076
Ph.D. Master .5373
Educational Specialist .4657
Self-Efficacy: Curriculum, Staff
Evaluation, and School
Improvement
Master Educational Specialist .0227
Ph.D. -.1404
Educational Specialist Master .1848
Ph.D. -.0463
Ph.D. Master .4769
Educational Specialist .4089
Self-Efficacy: Data Use Master Educational Specialist .1177
Ph.D. -.1309
Educational Specialist Master .1213
Ph.D. -.1141
Ph.D. Master .5184
Educational Specialist .5316
Self-Efficacy: Positive Culture Master Educational Specialist .1156
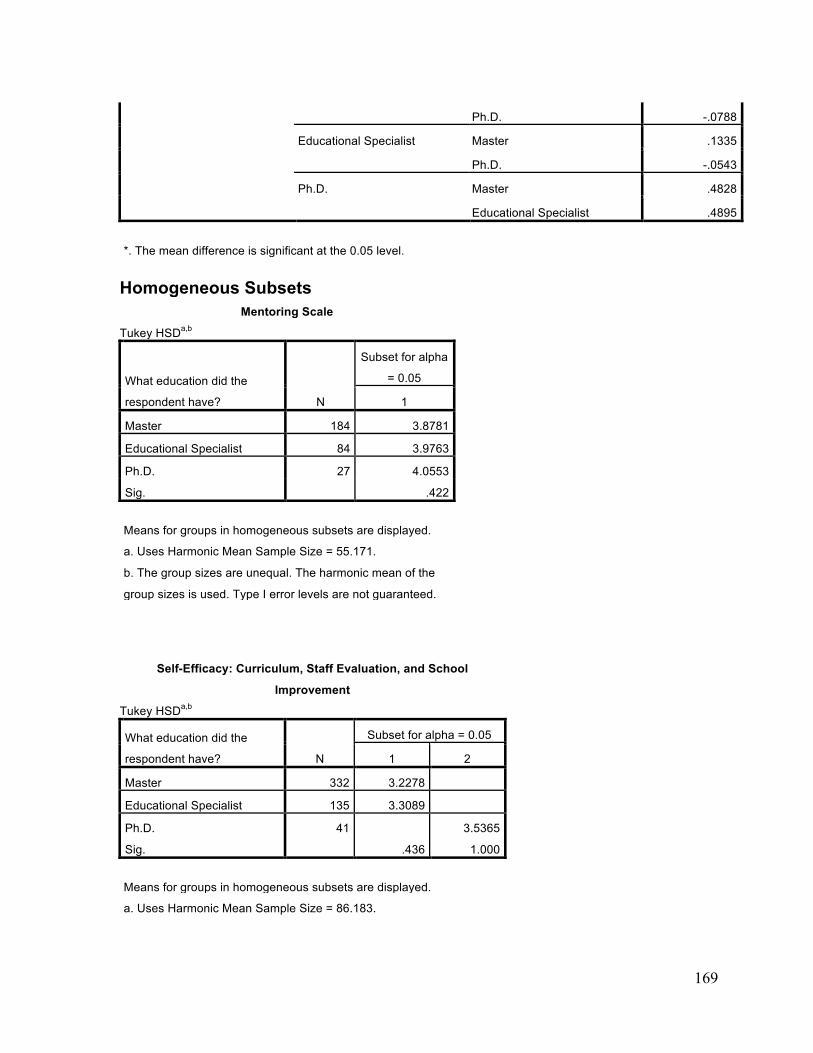
169
Ph.D. -.0788
Educational Specialist Master .1335
Ph.D. -.0543
Ph.D. Master .4828
Educational Specialist .4895
*. The mean difference is significant at the 0.05 level. Homogeneous Subsets
Mentoring Scale
Tukey HSDa,b
What education did the
respondent have? N
Subset for alpha
= 0.05
1
Master 184 3.8781
Educational Specialist 84 3.9763
Ph.D. 27 4.0553
Sig. .422
Means for groups in homogeneous subsets are displayed.
a. Uses Harmonic Mean Sample Size = 55.171.
b. The group sizes are unequal. The harmonic mean of the
group sizes is used. Type I error levels are not guaranteed.
Self-Efficacy: Curriculum, Staff Evaluation, and School
Improvement
Tukey HSDa,b
What education did the
respondent have? N
Subset for alpha = 0.05
1 2
Master 332 3.2278 Educational Specialist 135 3.3089 Ph.D. 41 3.5365
Sig. .436 1.000
Means for groups in homogeneous subsets are displayed.
a. Uses Harmonic Mean Sample Size = 86.183.

170
b. The group sizes are unequal. The harmonic mean of the group sizes
is used. Type I error levels are not guaranteed.
Self-Efficacy: Data Use
Tukey HSDa,b
What education did the
respondent have? N
Subset for alpha = 0.05
1 2
Master 332 3.2241 Educational Specialist 135 3.2259 Ph.D. 41 3.5488
Sig. 1.000 1.000
Means for groups in homogeneous subsets are displayed.
a. Uses Harmonic Mean Sample Size = 86.183.
b. The group sizes are unequal. The harmonic mean of the group sizes
is used. Type I error levels are not guaranteed.
Self-Efficacy: Positive Culture
Tukey HSDa,b
What education did the
respondent have? N
Subset for alpha = 0.05
1 2
Master 332 3.1948 Educational Specialist 135 3.2037 Ph.D. 41 3.4756
Sig. .993 1.000
Means for groups in homogeneous subsets are displayed.
a. Uses Harmonic Mean Sample Size = 86.183.
b. The group sizes are unequal. The harmonic mean of the group sizes
is used. Type I error levels are not guaranteed. Nonparametric Correlations
Correlations
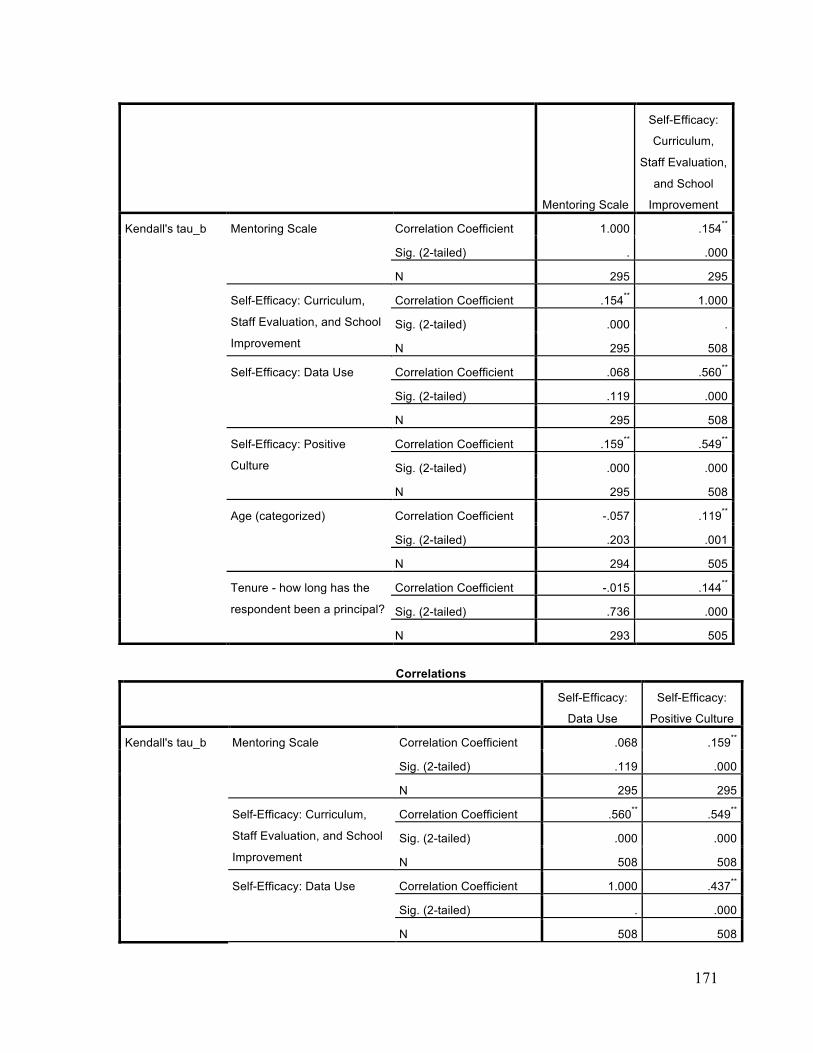
171
Mentoring Scale
Self-Efficacy:
Curriculum,
Staff Evaluation,
and School
Improvement
Kendall's tau_b Mentoring Scale Correlation Coefficient 1.000 .154**
Sig. (2-tailed) . .000
N 295 295
Self-Efficacy: Curriculum,
Staff Evaluation, and School
Improvement
Correlation Coefficient .154** 1.000
Sig. (2-tailed) .000 .
N 295 508
Self-Efficacy: Data Use Correlation Coefficient .068 .560**
Sig. (2-tailed) .119 .000
N 295 508
Self-Efficacy: Positive
Culture
Correlation Coefficient .159** .549**
Sig. (2-tailed) .000 .000
N 295 508
Age (categorized) Correlation Coefficient -.057 .119**
Sig. (2-tailed) .203 .001
N 294 505
Tenure - how long has the
respondent been a principal?
Correlation Coefficient -.015 .144**
Sig. (2-tailed) .736 .000
N 293 505
Correlations
Self-Efficacy:
Data Use
Self-Efficacy:
Positive Culture
Kendall's tau_b Mentoring Scale Correlation Coefficient .068 .159**
Sig. (2-tailed) .119 .000
N 295 295
Self-Efficacy: Curriculum,
Staff Evaluation, and School
Improvement
Correlation Coefficient .560** .549**
Sig. (2-tailed) .000 .000
N 508 508
Self-Efficacy: Data Use Correlation Coefficient 1.000 .437**
Sig. (2-tailed) . .000
N 508 508
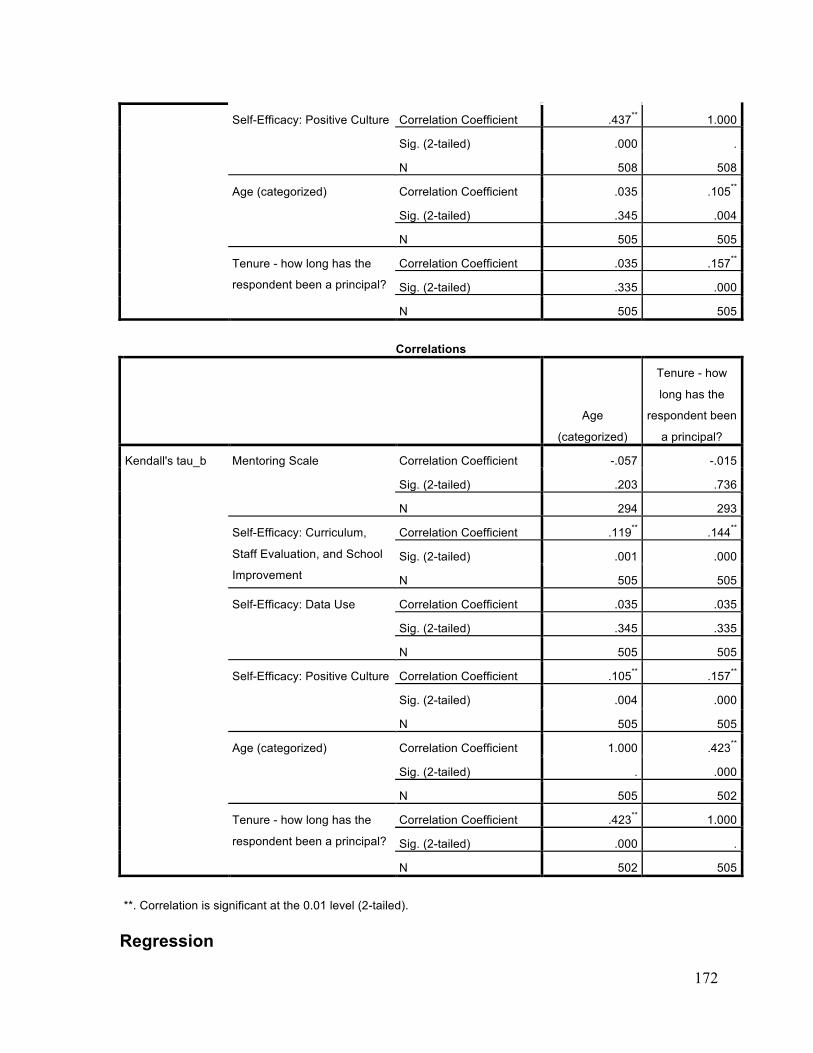
172
Self-Efficacy: Positive Culture Correlation Coefficient .437** 1.000
Sig. (2-tailed) .000 .
N 508 508
Age (categorized) Correlation Coefficient .035 .105**
Sig. (2-tailed) .345 .004
N 505 505
Tenure - how long has the
respondent been a principal?
Correlation Coefficient .035 .157**
Sig. (2-tailed) .335 .000
N 505 505
Correlations
Age
(categorized)
Tenure - how
long has the
respondent been
a principal?
Kendall's tau_b Mentoring Scale Correlation Coefficient -.057 -.015
Sig. (2-tailed) .203 .736
N 294 293
Self-Efficacy: Curriculum,
Staff Evaluation, and School
Improvement
Correlation Coefficient .119** .144**
Sig. (2-tailed) .001 .000
N 505 505
Self-Efficacy: Data Use Correlation Coefficient .035 .035
Sig. (2-tailed) .345 .335
N 505 505
Self-Efficacy: Positive Culture Correlation Coefficient .105** .157**
Sig. (2-tailed) .004 .000
N 505 505
Age (categorized) Correlation Coefficient 1.000 .423**
Sig. (2-tailed) . .000
N 505 502
Tenure - how long has the
respondent been a principal?
Correlation Coefficient .423** 1.000
Sig. (2-tailed) .000 .
N 502 505
**. Correlation is significant at the 0.01 level (2-tailed). Regression

173
Variables Entered/Removeda
Model
Variables
Entered
Variables
Removed Method
1 Tenure - how
long has the
respondent
been a
principal?,
AfAmer, HS,
Middle, What
education did
the respondent
have?, Female,
Suburban, Age
(categorized),
Urbanb
. Enter
a. Dependent Variable: Mentoring Scale
b. All requested variables entered.
Model Summaryb
Model R R Square
Adjusted R
Square
Std. Error of the
Estimate
1 .230a .053 .022 .71857
a. Predictors: (Constant), Tenure - how long has the respondent been a
principal?, AfAmer, HS, Middle, What education did the respondent
have?, Female, Suburban, Age (categorized), Urban
b. Dependent Variable: Mentoring Scale
ANOVAa
Model Sum of Squares df Mean Square F Sig.
1 Regression 7.980 9 .887 1.717 .085b
Residual 143.026 277 .516 Total 151.006 286

174
a. Dependent Variable: Mentoring Scale
b. Predictors: (Constant), Tenure - how long has the respondent been a principal?, AfAmer, HS,
Middle, What education did the respondent have?, Female, Suburban, Age (categorized), Urban
Coefficientsa
Model
Unstandardized Coefficients
Standardized
Coefficients
t Sig. B Std. Error Beta
1 (Constant) 3.772 .220 17.164 .000
Female .084 .091 .058 .928 .354
Age (categorized) -.044 .055 -.055 -.803 .423
Urban .205 .158 .096 1.300 .195
Suburban .286 .098 .194 2.914 .004
Middle -.040 .093 -.025 -.428 .669
HS -.045 .097 -.029 -.468 .640
What education did the
respondent have? .024 .067 .022 .366 .714
AfAmer .130 .192 .048 .676 .499
Tenure - how long has the
respondent been a
principal?
.015 .041 .025 .363 .717
Coefficientsa
Model
Collinearity Statistics
Tolerance VIF
1 (Constant)
Female .886 1.128
Age (categorized) .728 1.374
Urban .628 1.591
Suburban .771 1.298
Middle .983 1.018
HS .881 1.135
What education did the respondent have? .937 1.067
AfAmer .689 1.452
Tenure - how long has the respondent been a
principal? .746 1.341

175
a. Dependent Variable: Mentoring Scale
Collinearity Diagnosticsa
Model Dimension Eigenvalue Condition Index
Variance Proportions
(Constant) Female
Age
(categorized) Urban
1 1 5.687 1.000 .00 .01 .00 .00
2 1.422 1.999 .00 .00 .00 .17
3 .828 2.621 .00 .06 .00 .00
4 .703 2.844 .00 .02 .00 .01
5 .543 3.235 .00 .51 .00 .01
6 .383 3.852 .00 .13 .00 .56
7 .262 4.657 .01 .17 .03 .24
8 .093 7.839 .04 .00 .19 .01
9 .052 10.422 .00 .08 .69 .00
10 .027 14.648 .95 .01 .09 .00
Collinearity Diagnosticsa
Model Dimension
Variance Proportions
Suburban Middle HS
What education
did the
respondent
have? AfAmer
Tenure - how
long has the
respondent been
a principal?
1 1 .01 .01 .01 .00 .00 .00
2 .03 .00 .00 .00 .19 .00
3 .09 .00 .47 .00 .06 .00
4 .02 .84 .04 .00 .01 .00
5 .23 .00 .01 .00 .15 .00
6 .01 .09 .14 .00 .52 .00
7 .57 .04 .32 .01 .07 .03
8 .04 .01 .01 .33 .00 .15
9 .00 .00 .00 .00 .00 .78
10 .00 .01 .01 .65 .00 .03
a. Dependent Variable: Mentoring Scale
Residuals Statisticsa
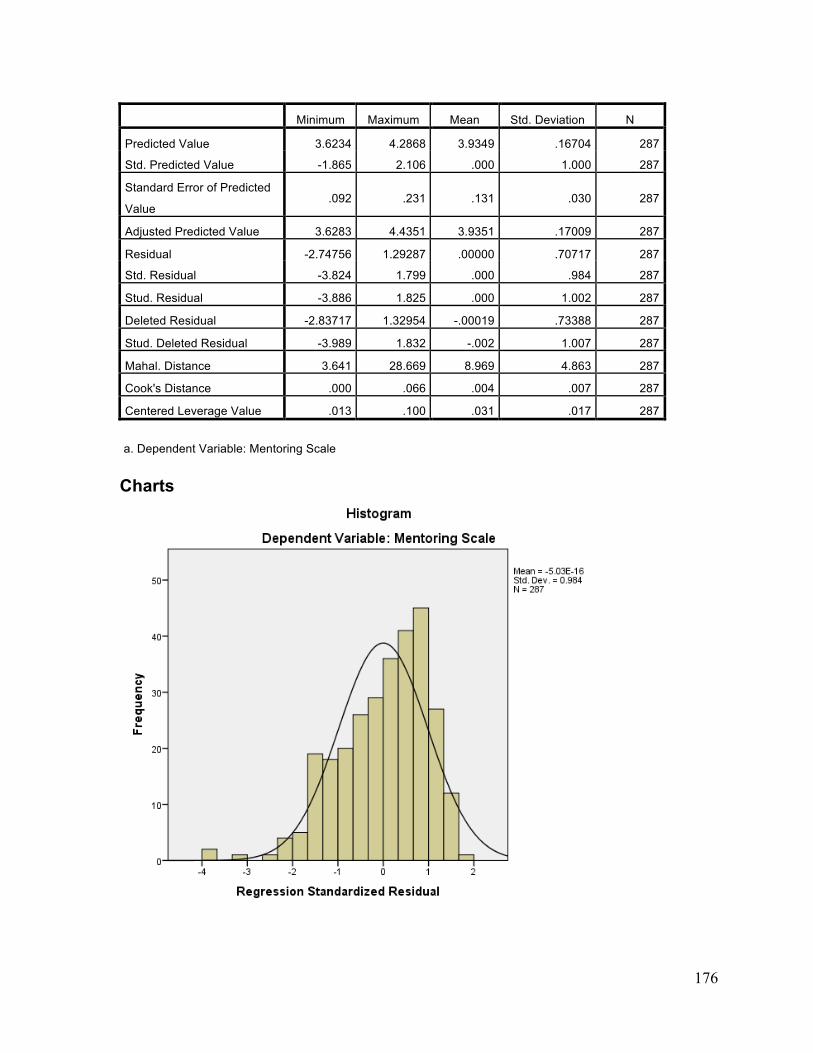
176
Minimum Maximum Mean Std. Deviation N
Predicted Value 3.6234 4.2868 3.9349 .16704 287
Std. Predicted Value -1.865 2.106 .000 1.000 287
Standard Error of Predicted
Value .092 .231 .131 .030 287
Adjusted Predicted Value 3.6283 4.4351 3.9351 .17009 287
Residual -2.74756 1.29287 .00000 .70717 287
Std. Residual -3.824 1.799 .000 .984 287
Stud. Residual -3.886 1.825 .000 1.002 287
Deleted Residual -2.83717 1.32954 -.00019 .73388 287
Stud. Deleted Residual -3.989 1.832 -.002 1.007 287
Mahal. Distance 3.641 28.669 8.969 4.863 287
Cook's Distance .000 .066 .004 .007 287
Centered Leverage Value .013 .100 .031 .017 287
a. Dependent Variable: Mentoring Scale Charts
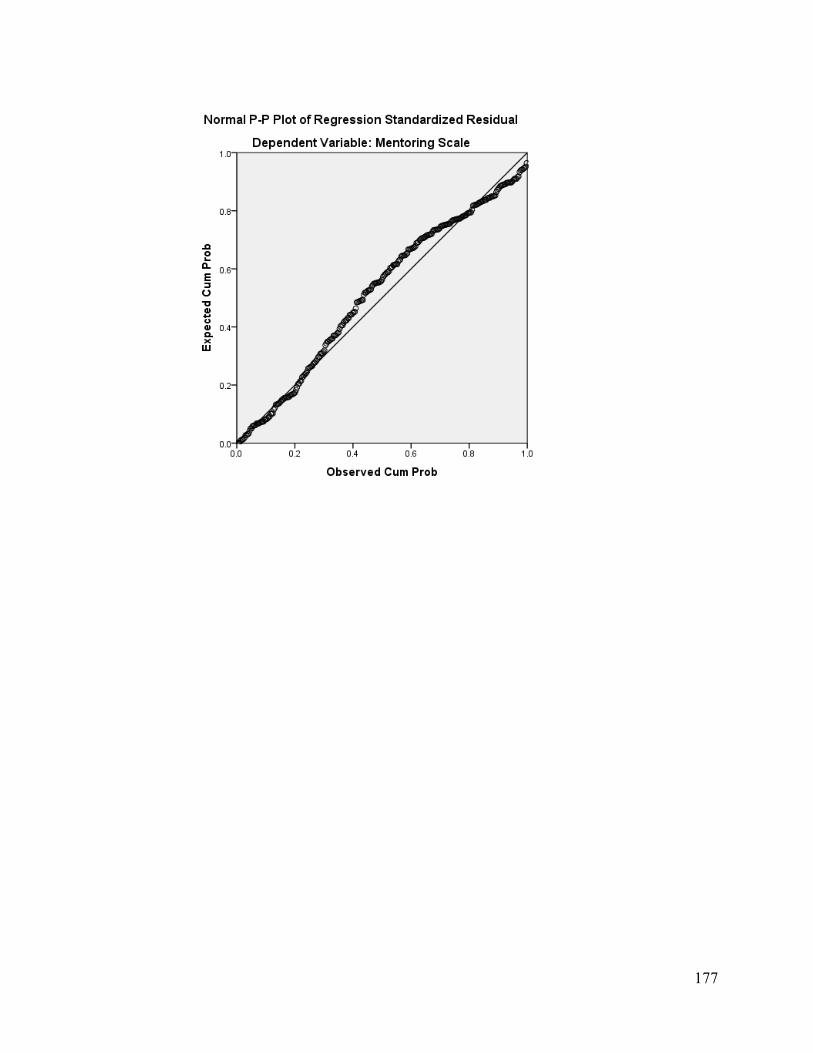
177
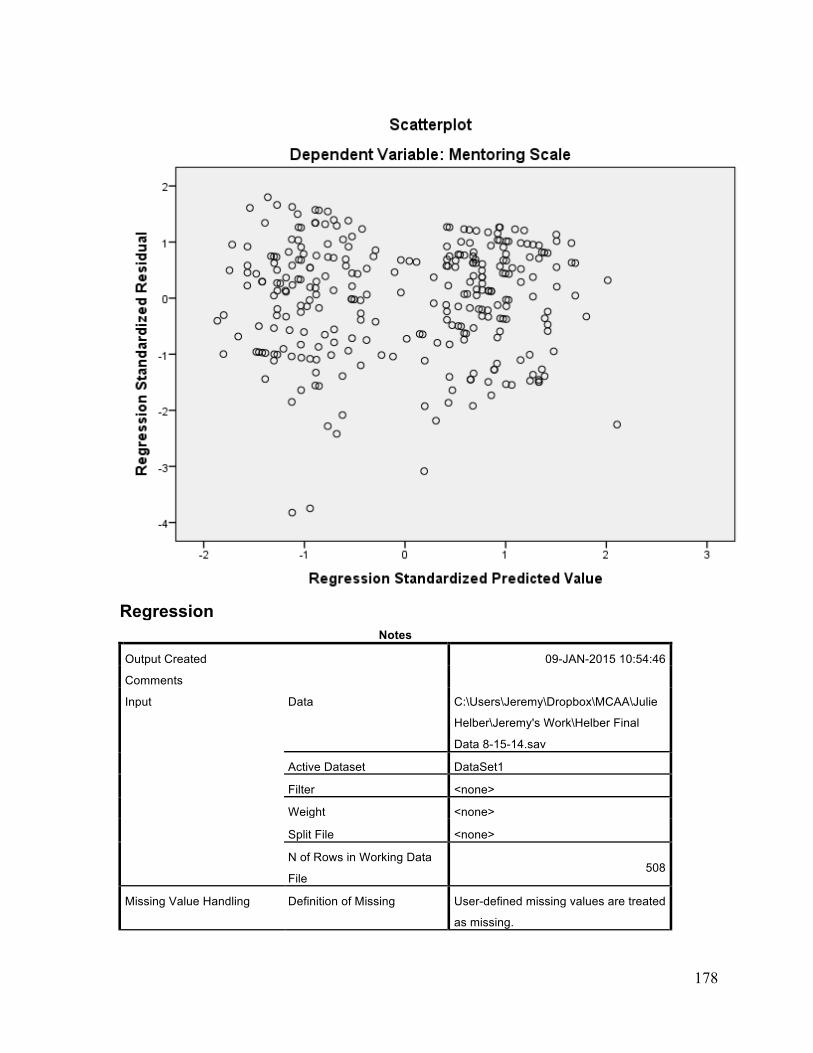
178
Regression
Notes
Output Created 09-JAN-2015 10:54:46
Comments Input Data C:\Users\Jeremy\Dropbox\MCAA\Julie
Helber\Jeremy's Work\Helber Final
Data 8-15-14.sav
Active Dataset DataSet1
Filter <none>
Weight <none>
Split File <none>
N of Rows in Working Data
File 508
Missing Value Handling Definition of Missing User-defined missing values are treated
as missing.
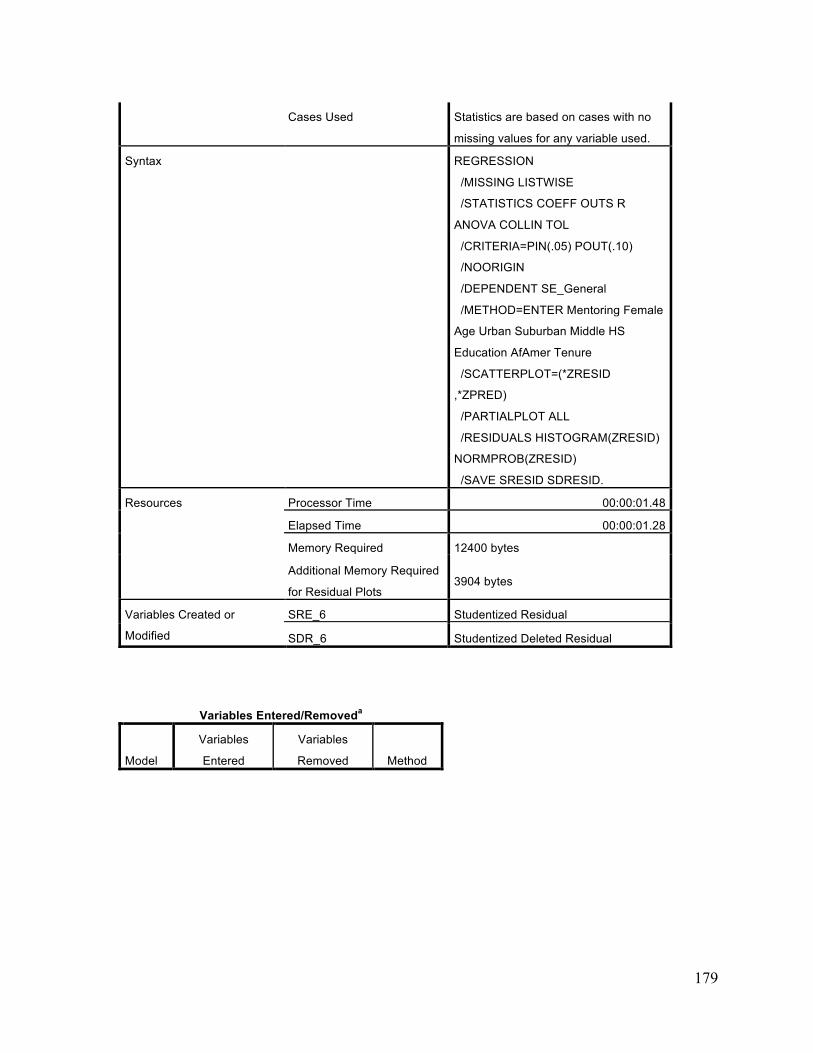
179
Cases Used Statistics are based on cases with no
missing values for any variable used.
Syntax REGRESSION
/MISSING LISTWISE
/STATISTICS COEFF OUTS R
ANOVA COLLIN TOL
/CRITERIA=PIN(.05) POUT(.10)
/NOORIGIN
/DEPENDENT SE_General
/METHOD=ENTER Mentoring Female
Age Urban Suburban Middle HS
Education AfAmer Tenure
/SCATTERPLOT=(*ZRESID
,*ZPRED)
/PARTIALPLOT ALL
/RESIDUALS HISTOGRAM(ZRESID)
NORMPROB(ZRESID)
/SAVE SRESID SDRESID.
Resources Processor Time 00:00:01.48
Elapsed Time 00:00:01.28
Memory Required 12400 bytes
Additional Memory Required
for Residual Plots 3904 bytes
Variables Created or
Modified
SRE_6 Studentized Residual
SDR_6 Studentized Deleted Residual
Variables Entered/Removeda
Model
Variables
Entered
Variables
Removed Method
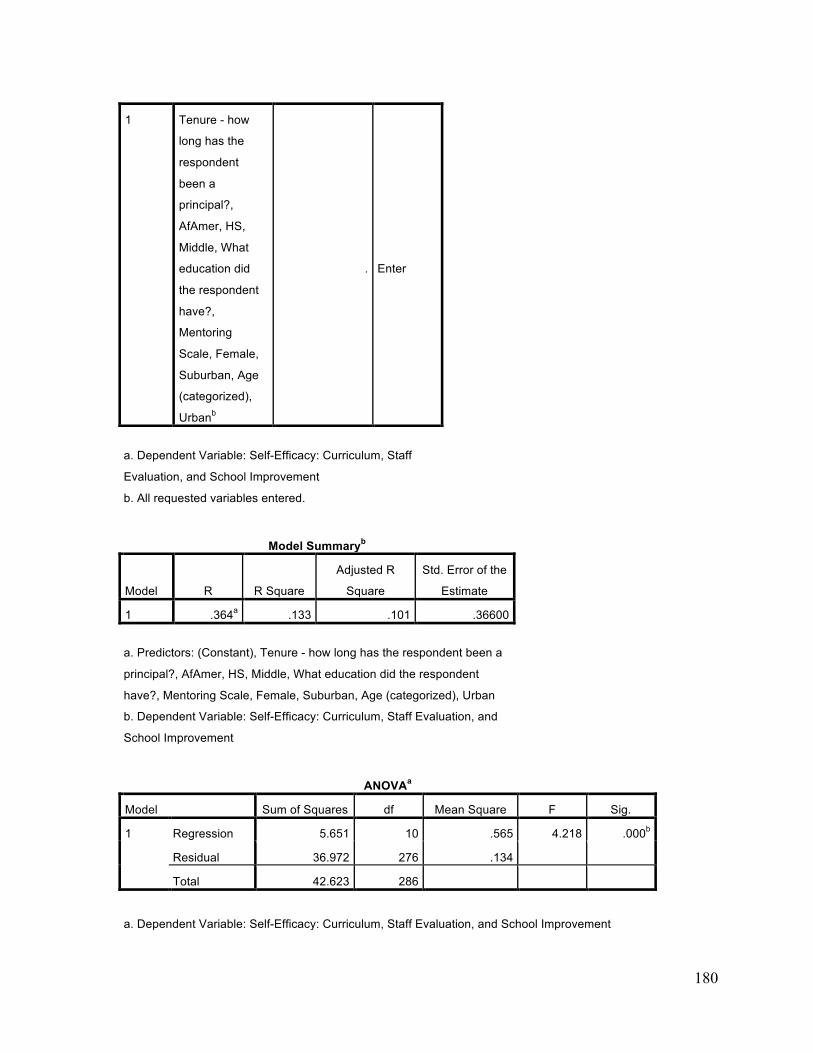
180
1 Tenure - how
long has the
respondent
been a
principal?,
AfAmer, HS,
Middle, What
education did
the respondent
have?,
Mentoring
Scale, Female,
Suburban, Age
(categorized),
Urbanb
. Enter
a. Dependent Variable: Self-Efficacy: Curriculum, Staff
Evaluation, and School Improvement
b. All requested variables entered.
Model Summaryb
Model R R Square
Adjusted R
Square
Std. Error of the
Estimate
1 .364a .133 .101 .36600
a. Predictors: (Constant), Tenure - how long has the respondent been a
principal?, AfAmer, HS, Middle, What education did the respondent
have?, Mentoring Scale, Female, Suburban, Age (categorized), Urban
b. Dependent Variable: Self-Efficacy: Curriculum, Staff Evaluation, and
School Improvement
ANOVAa
Model Sum of Squares df Mean Square F Sig.
1 Regression 5.651 10 .565 4.218 .000b
Residual 36.972 276 .134 Total 42.623 286
a. Dependent Variable: Self-Efficacy: Curriculum, Staff Evaluation, and School Improvement
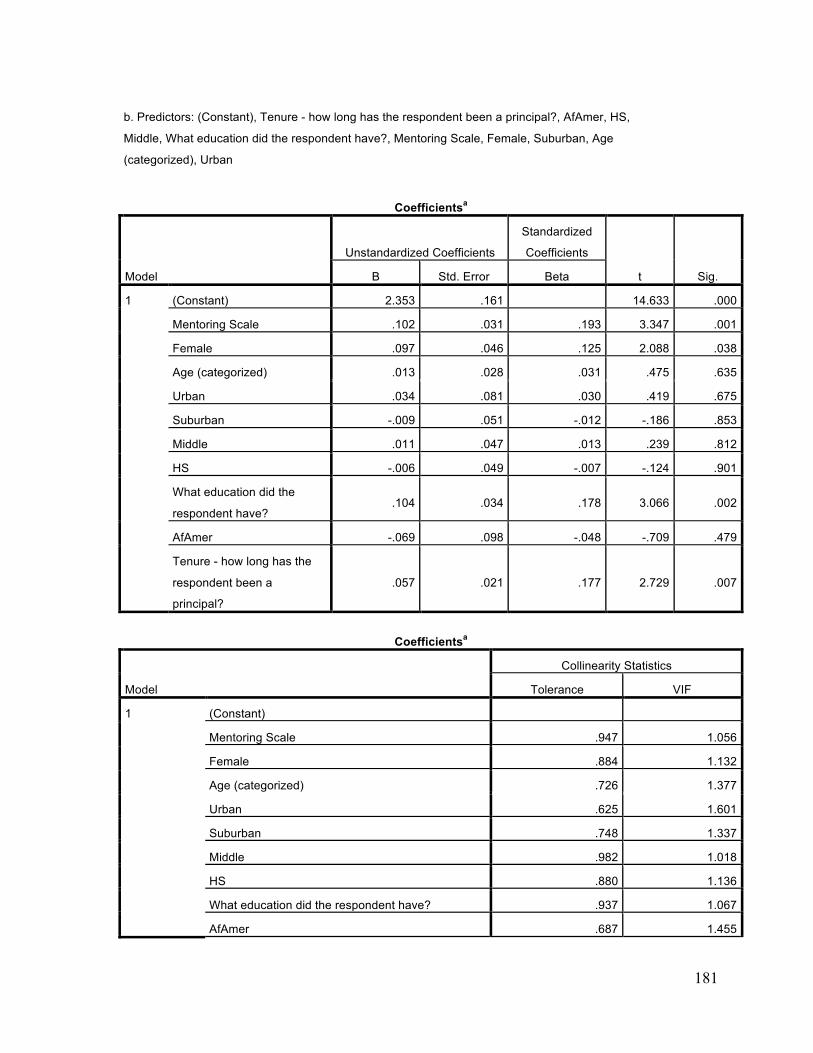
181
b. Predictors: (Constant), Tenure - how long has the respondent been a principal?, AfAmer, HS,
Middle, What education did the respondent have?, Mentoring Scale, Female, Suburban, Age
(categorized), Urban
Coefficientsa
Model
Unstandardized Coefficients
Standardized
Coefficients
t Sig. B Std. Error Beta
1 (Constant) 2.353 .161 14.633 .000
Mentoring Scale .102 .031 .193 3.347 .001
Female .097 .046 .125 2.088 .038
Age (categorized) .013 .028 .031 .475 .635
Urban .034 .081 .030 .419 .675
Suburban -.009 .051 -.012 -.186 .853
Middle .011 .047 .013 .239 .812
HS -.006 .049 -.007 -.124 .901
What education did the
respondent have? .104 .034 .178 3.066 .002
AfAmer -.069 .098 -.048 -.709 .479
Tenure - how long has the
respondent been a
principal?
.057 .021 .177 2.729 .007
Coefficientsa
Model
Collinearity Statistics
Tolerance VIF
1 (Constant)
Mentoring Scale .947 1.056
Female .884 1.132
Age (categorized) .726 1.377
Urban .625 1.601
Suburban .748 1.337
Middle .982 1.018
HS .880 1.136
What education did the respondent have? .937 1.067
AfAmer .687 1.455
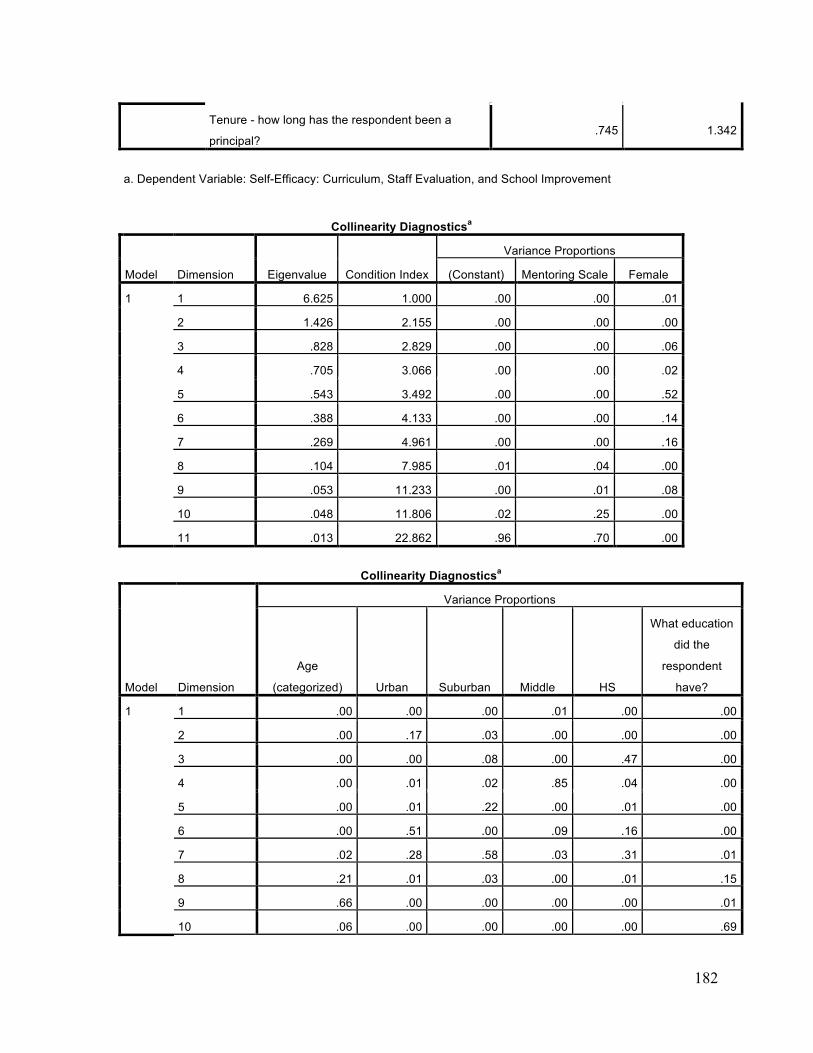
182
Tenure - how long has the respondent been a
principal? .745 1.342
a. Dependent Variable: Self-Efficacy: Curriculum, Staff Evaluation, and School Improvement
Collinearity Diagnosticsa
Model Dimension Eigenvalue Condition Index
Variance Proportions
(Constant) Mentoring Scale Female
1 1 6.625 1.000 .00 .00 .01
2 1.426 2.155 .00 .00 .00
3 .828 2.829 .00 .00 .06
4 .705 3.066 .00 .00 .02
5 .543 3.492 .00 .00 .52
6 .388 4.133 .00 .00 .14
7 .269 4.961 .00 .00 .16
8 .104 7.985 .01 .04 .00
9 .053 11.233 .00 .01 .08
10 .048 11.806 .02 .25 .00
11 .013 22.862 .96 .70 .00
Collinearity Diagnosticsa
Model Dimension
Variance Proportions
Age
(categorized) Urban Suburban Middle HS
What education
did the
respondent
have?
1 1 .00 .00 .00 .01 .00 .00
2 .00 .17 .03 .00 .00 .00
3 .00 .00 .08 .00 .47 .00
4 .00 .01 .02 .85 .04 .00
5 .00 .01 .22 .00 .01 .00
6 .00 .51 .00 .09 .16 .00
7 .02 .28 .58 .03 .31 .01
8 .21 .01 .03 .00 .01 .15
9 .66 .00 .00 .00 .00 .01
10 .06 .00 .00 .00 .00 .69
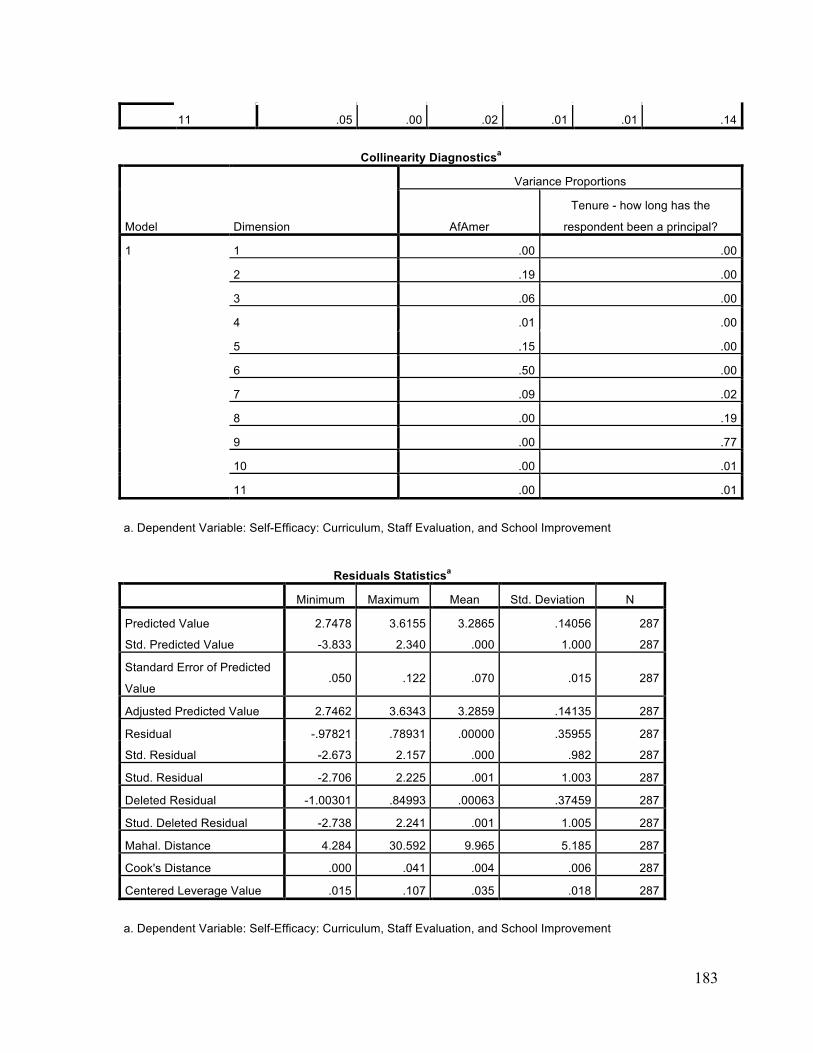
183
11 .05 .00 .02 .01 .01 .14
Collinearity Diagnosticsa
Model Dimension
Variance Proportions
AfAmer
Tenure - how long has the
respondent been a principal?
1 1 .00 .00
2 .19 .00
3 .06 .00
4 .01 .00
5 .15 .00
6 .50 .00
7 .09 .02
8 .00 .19
9 .00 .77
10 .00 .01
11 .00 .01
a. Dependent Variable: Self-Efficacy: Curriculum, Staff Evaluation, and School Improvement
Residuals Statisticsa
Minimum Maximum Mean Std. Deviation N
Predicted Value 2.7478 3.6155 3.2865 .14056 287
Std. Predicted Value -3.833 2.340 .000 1.000 287
Standard Error of Predicted
Value .050 .122 .070 .015 287
Adjusted Predicted Value 2.7462 3.6343 3.2859 .14135 287
Residual -.97821 .78931 .00000 .35955 287
Std. Residual -2.673 2.157 .000 .982 287
Stud. Residual -2.706 2.225 .001 1.003 287
Deleted Residual -1.00301 .84993 .00063 .37459 287
Stud. Deleted Residual -2.738 2.241 .001 1.005 287
Mahal. Distance 4.284 30.592 9.965 5.185 287
Cook's Distance .000 .041 .004 .006 287
Centered Leverage Value .015 .107 .035 .018 287
a. Dependent Variable: Self-Efficacy: Curriculum, Staff Evaluation, and School Improvement
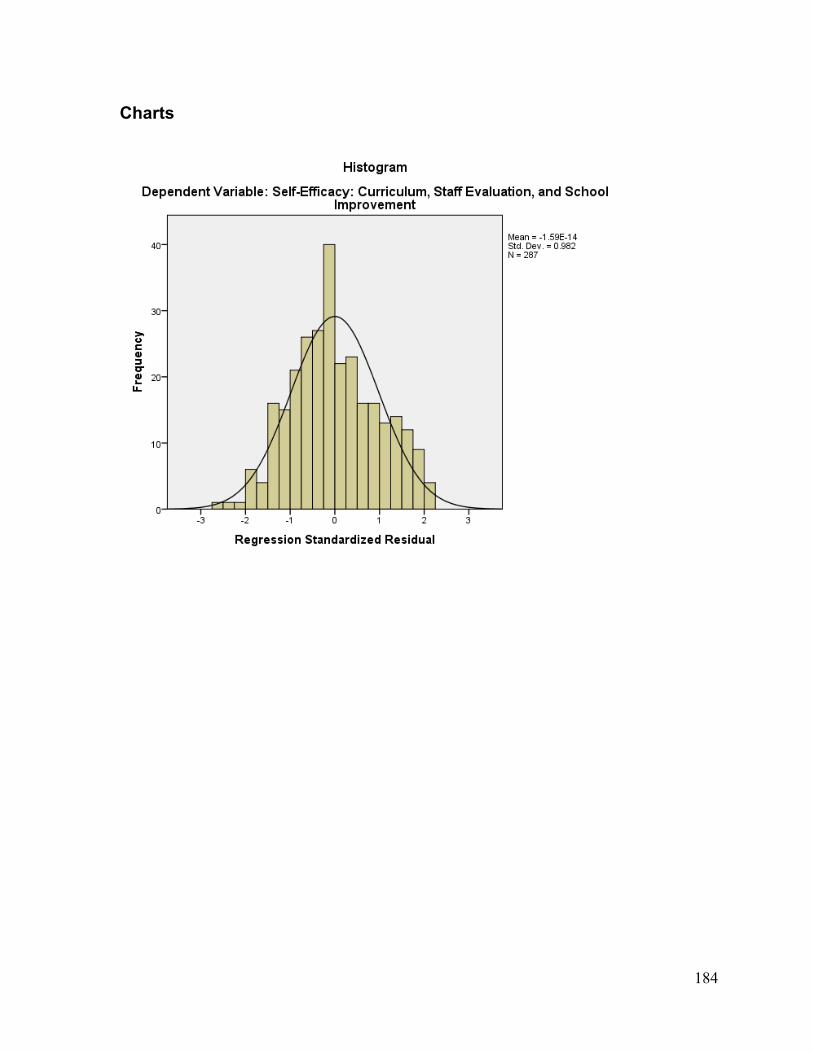
184
Charts

185
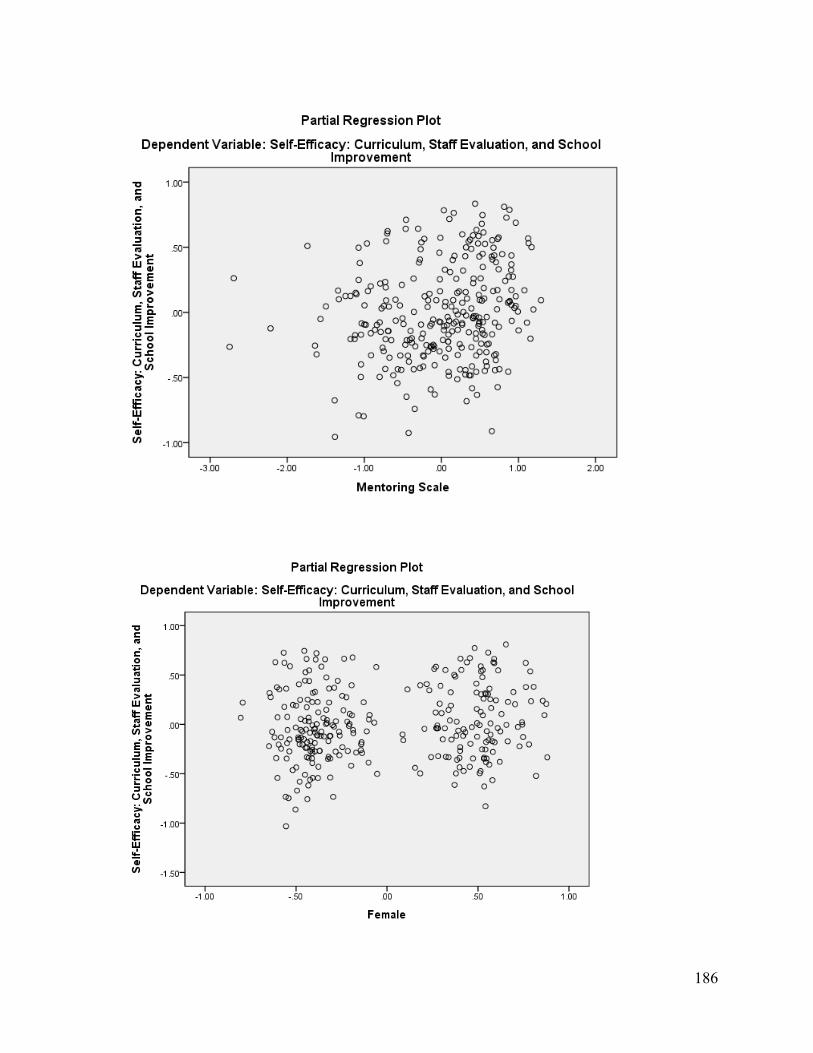
186
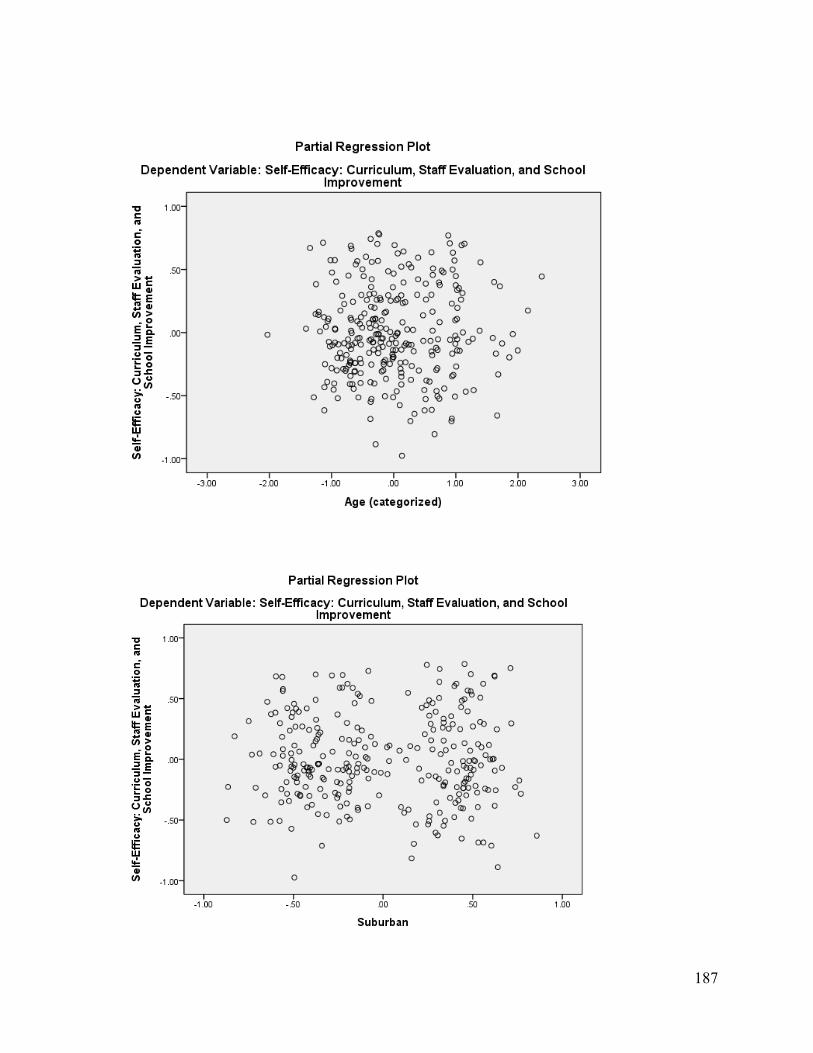
187
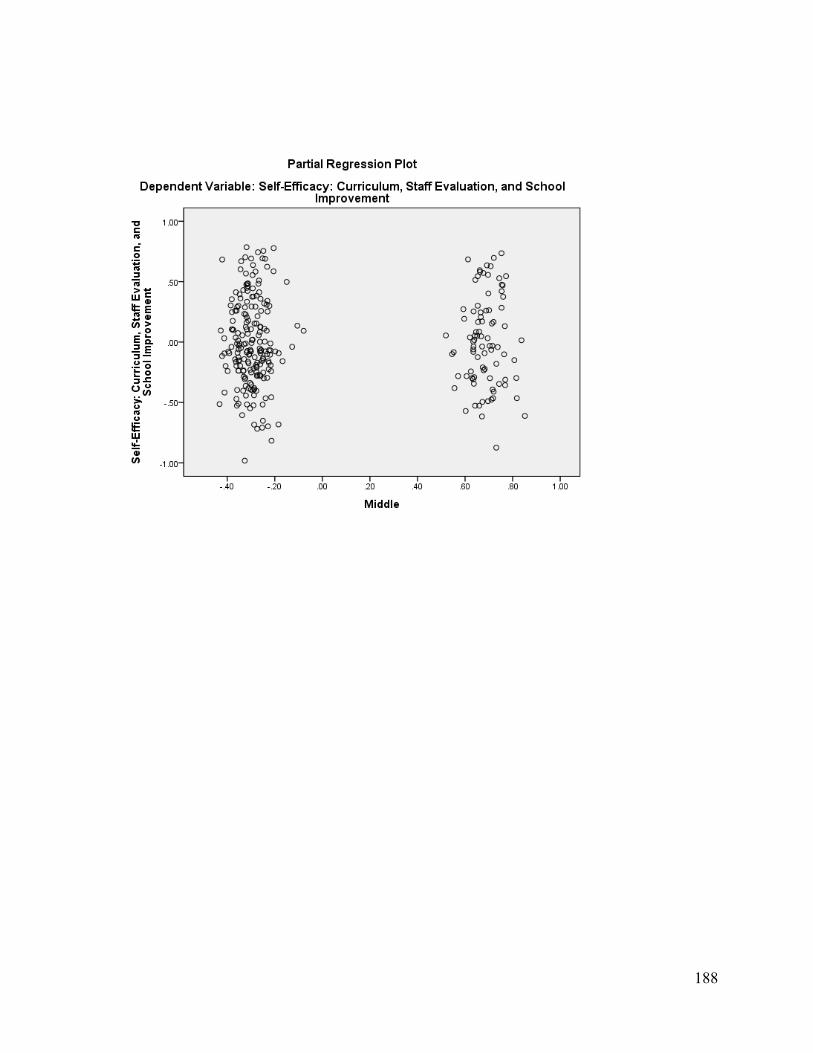
188

189
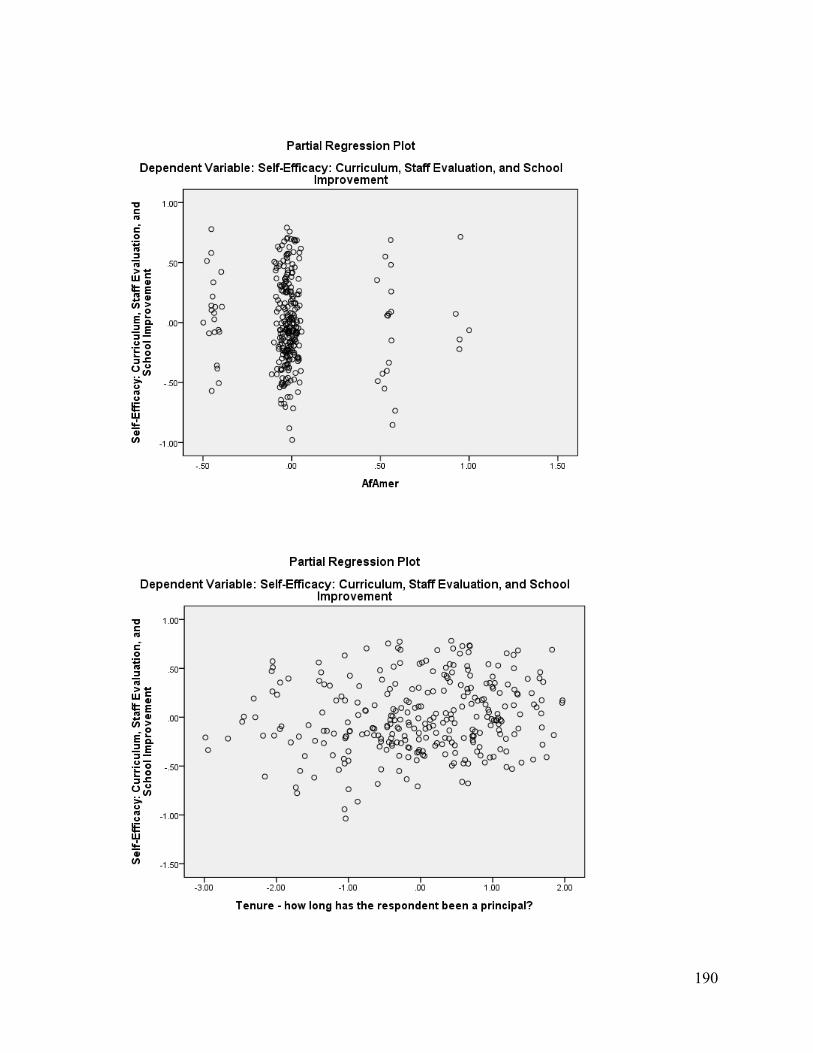
190
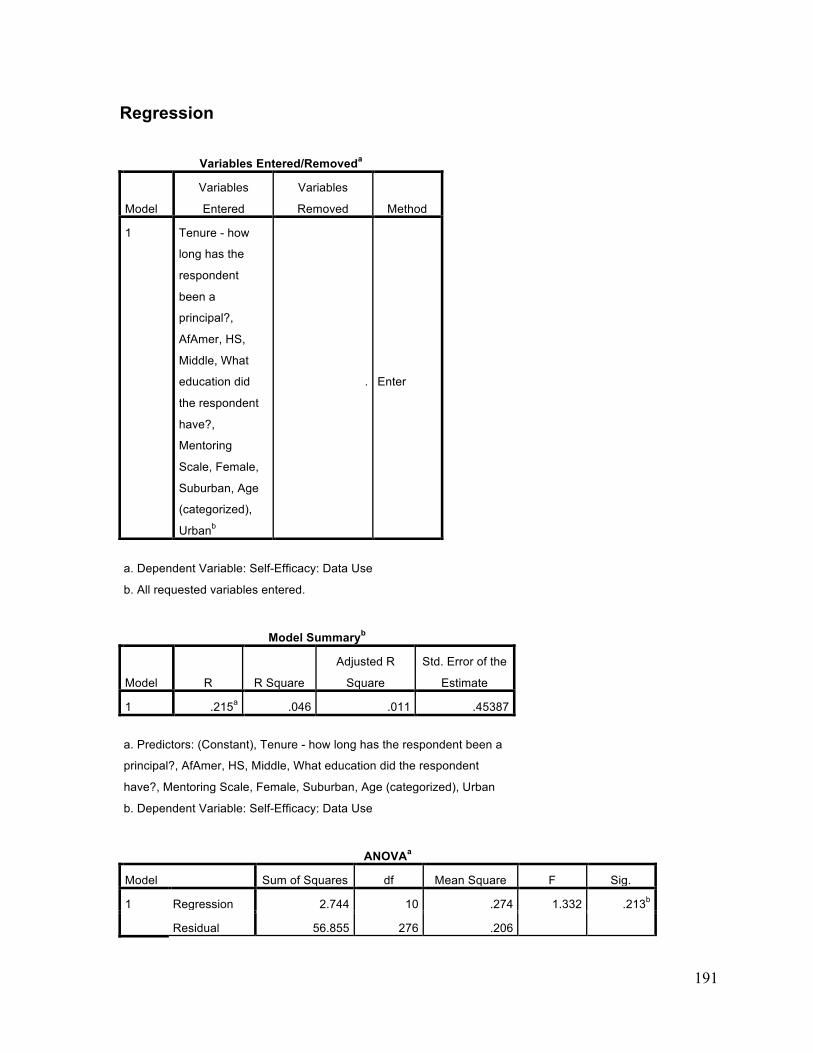
191
Regression
Variables Entered/Removeda
Model
Variables
Entered
Variables
Removed Method
1 Tenure - how
long has the
respondent
been a
principal?,
AfAmer, HS,
Middle, What
education did
the respondent
have?,
Mentoring
Scale, Female,
Suburban, Age
(categorized),
Urbanb
. Enter
a. Dependent Variable: Self-Efficacy: Data Use
b. All requested variables entered.
Model Summaryb
Model R R Square
Adjusted R
Square
Std. Error of the
Estimate
1 .215a .046 .011 .45387
a. Predictors: (Constant), Tenure - how long has the respondent been a
principal?, AfAmer, HS, Middle, What education did the respondent
have?, Mentoring Scale, Female, Suburban, Age (categorized), Urban
b. Dependent Variable: Self-Efficacy: Data Use
ANOVAa
Model Sum of Squares df Mean Square F Sig.
1 Regression 2.744 10 .274 1.332 .213b
Residual 56.855 276 .206

192
Total 59.599 286 a. Dependent Variable: Self-Efficacy: Data Use
b. Predictors: (Constant), Tenure - how long has the respondent been a principal?, AfAmer, HS,
Middle, What education did the respondent have?, Mentoring Scale, Female, Suburban, Age
(categorized), Urban
Coefficientsa
Model
Unstandardized Coefficients
Standardized
Coefficients
t Sig. B Std. Error Beta
1 (Constant) 2.912 .199 14.602 .000
Mentoring Scale .052 .038 .082 1.360 .175
Female .081 .057 .089 1.417 .158
Age (categorized) -.019 .035 -.038 -.551 .582
Urban -.025 .100 -.019 -.251 .802
Suburban -.113 .063 -.122 -1.793 .074
Middle .018 .059 .019 .314 .754
HS -.112 .061 -.115 -1.841 .067
What education did the
respondent have? .051 .042 .074 1.210 .227
AfAmer -.097 .121 -.056 -.795 .427
Tenure - how long has the
respondent been a
principal?
.041 .026 .107 1.573 .117
Coefficientsa
Model
Collinearity Statistics
Tolerance VIF
1 (Constant) Mentoring Scale .947 1.056
Female .884 1.132
Age (categorized) .726 1.377
Urban .625 1.601
Suburban .748 1.337
Middle .982 1.018
HS .880 1.136
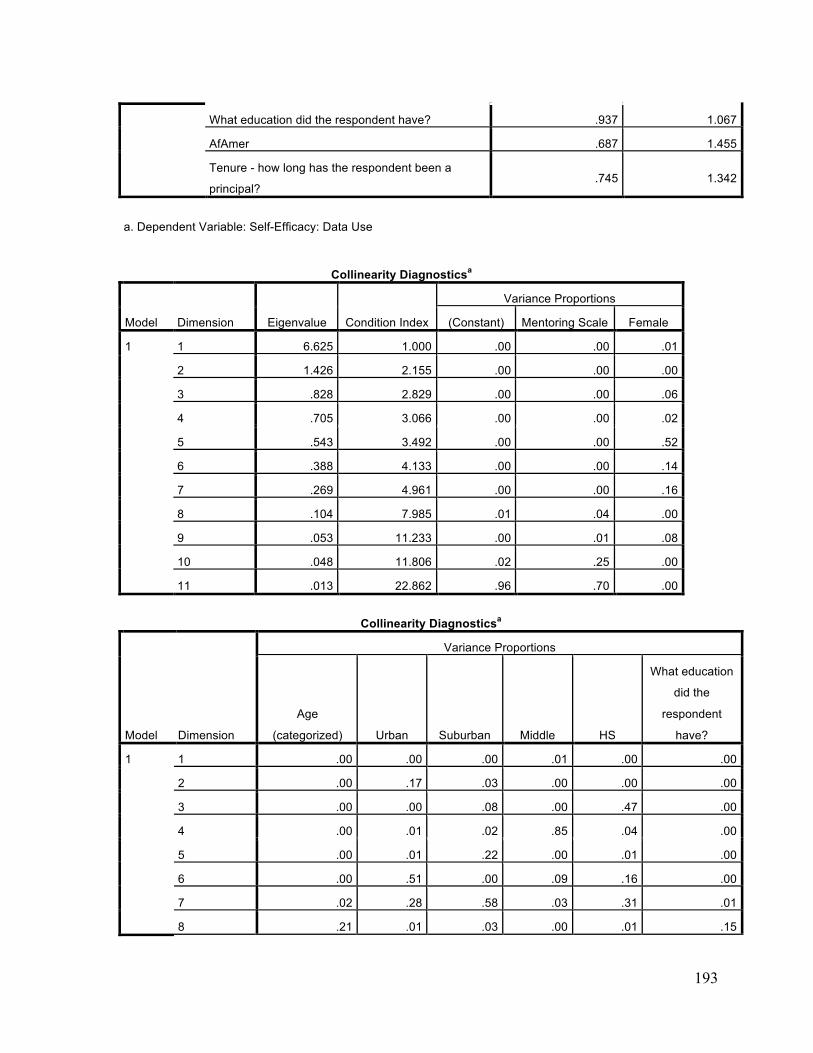
193
What education did the respondent have? .937 1.067
AfAmer .687 1.455
Tenure - how long has the respondent been a
principal? .745 1.342
a. Dependent Variable: Self-Efficacy: Data Use
Collinearity Diagnosticsa
Model Dimension Eigenvalue Condition Index
Variance Proportions
(Constant) Mentoring Scale Female
1 1 6.625 1.000 .00 .00 .01
2 1.426 2.155 .00 .00 .00
3 .828 2.829 .00 .00 .06
4 .705 3.066 .00 .00 .02
5 .543 3.492 .00 .00 .52
6 .388 4.133 .00 .00 .14
7 .269 4.961 .00 .00 .16
8 .104 7.985 .01 .04 .00
9 .053 11.233 .00 .01 .08
10 .048 11.806 .02 .25 .00
11 .013 22.862 .96 .70 .00
Collinearity Diagnosticsa
Model Dimension
Variance Proportions
Age
(categorized) Urban Suburban Middle HS
What education
did the
respondent
have?
1 1 .00 .00 .00 .01 .00 .00
2 .00 .17 .03 .00 .00 .00
3 .00 .00 .08 .00 .47 .00
4 .00 .01 .02 .85 .04 .00
5 .00 .01 .22 .00 .01 .00
6 .00 .51 .00 .09 .16 .00
7 .02 .28 .58 .03 .31 .01
8 .21 .01 .03 .00 .01 .15

194
9 .66 .00 .00 .00 .00 .01
10 .06 .00 .00 .00 .00 .69
11 .05 .00 .02 .01 .01 .14
Collinearity Diagnosticsa
Model Dimension
Variance Proportions
AfAmer
Tenure - how long has the
respondent been a principal?
1 1 .00 .00
2 .19 .00
3 .06 .00
4 .01 .00
5 .15 .00
6 .50 .00
7 .09 .02
8 .00 .19
9 .00 .77
10 .00 .01
11 .00 .01
a. Dependent Variable: Self-Efficacy: Data Use
Residuals Statisticsa
Minimum Maximum Mean Std. Deviation N
Predicted Value 3.0289 3.5185 3.2802 .09796 287
Std. Predicted Value -2.565 2.432 .000 1.000 287
Standard Error of Predicted
Value .062 .151 .087 .019 287
Adjusted Predicted Value 2.9935 3.5281 3.2796 .09981 287
Residual -1.11443 .87599 .00000 .44586 287
Std. Residual -2.455 1.930 .000 .982 287
Stud. Residual -2.522 1.970 .001 1.004 287
Deleted Residual -1.19123 .91675 .00060 .46573 287
Stud. Deleted Residual -2.547 1.980 .001 1.006 287
Mahal. Distance 4.284 30.592 9.965 5.185 287
Cook's Distance .000 .054 .004 .006 287
Centered Leverage Value .015 .107 .035 .018 287
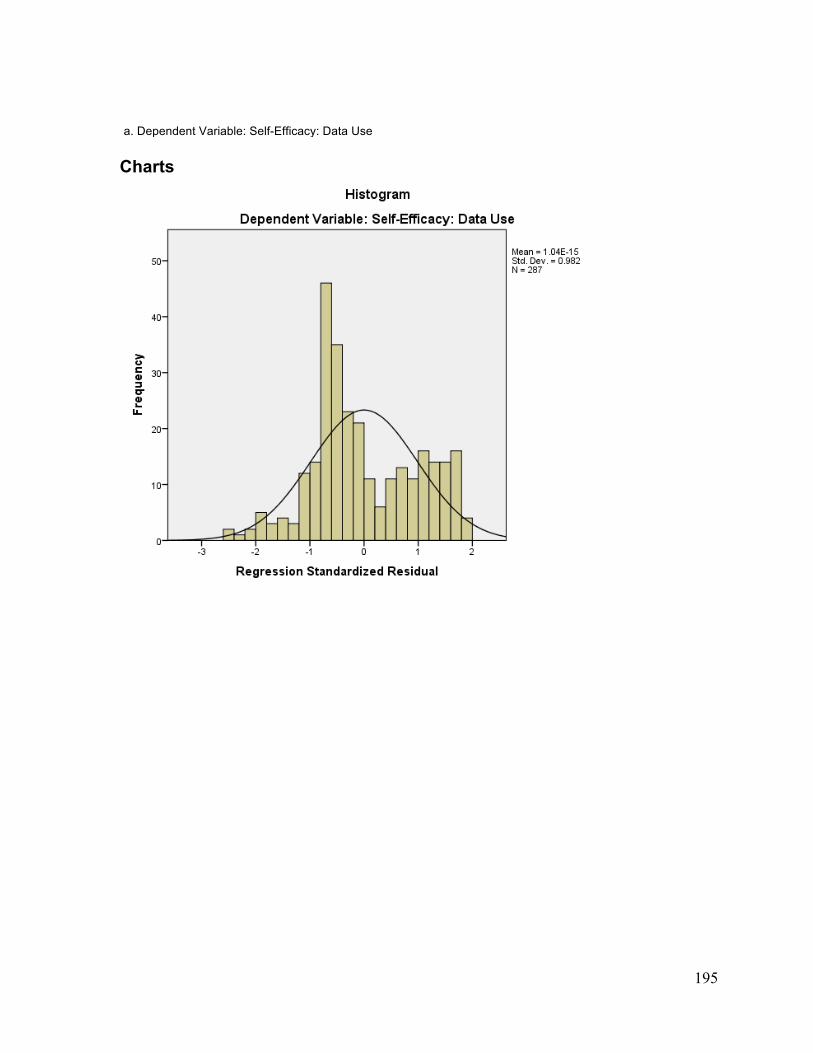
195
a. Dependent Variable: Self-Efficacy: Data Use Charts
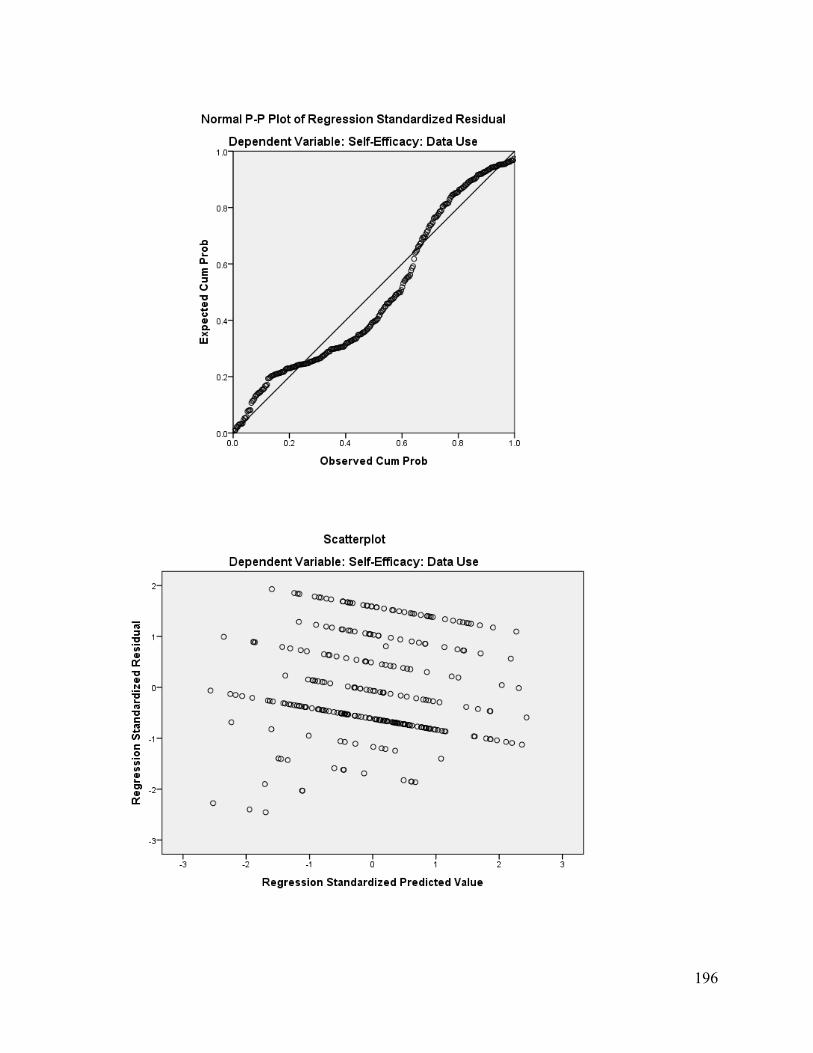
196
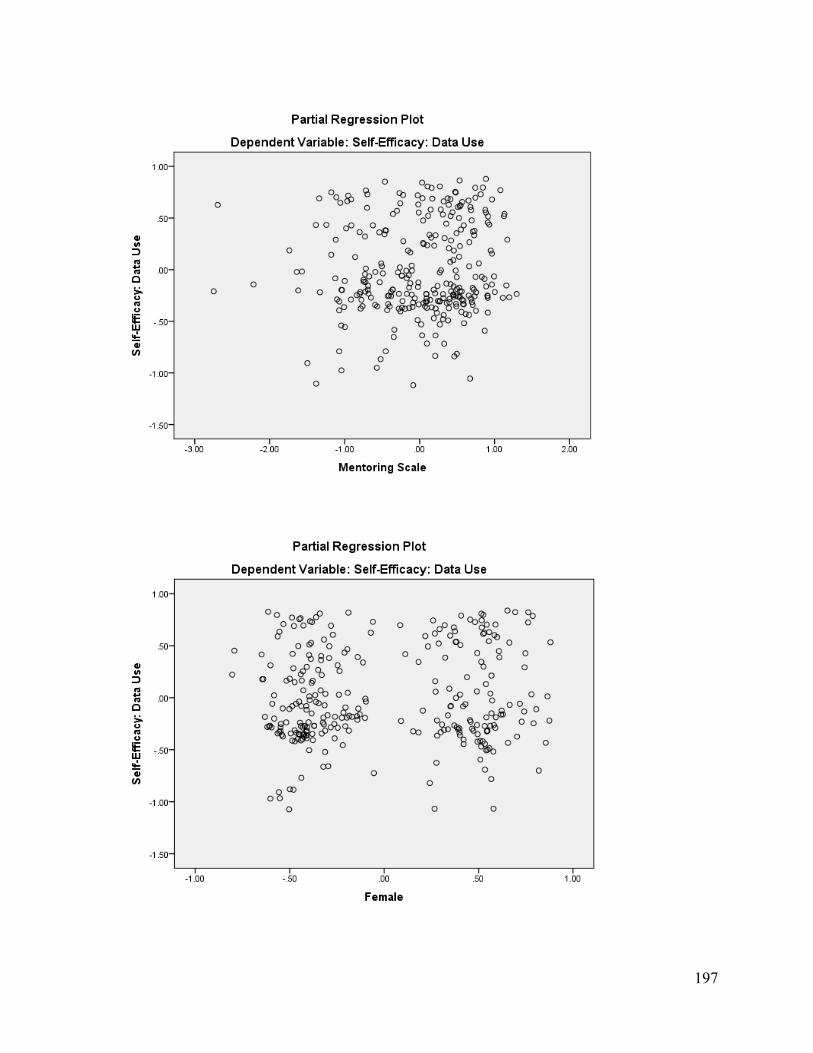
197
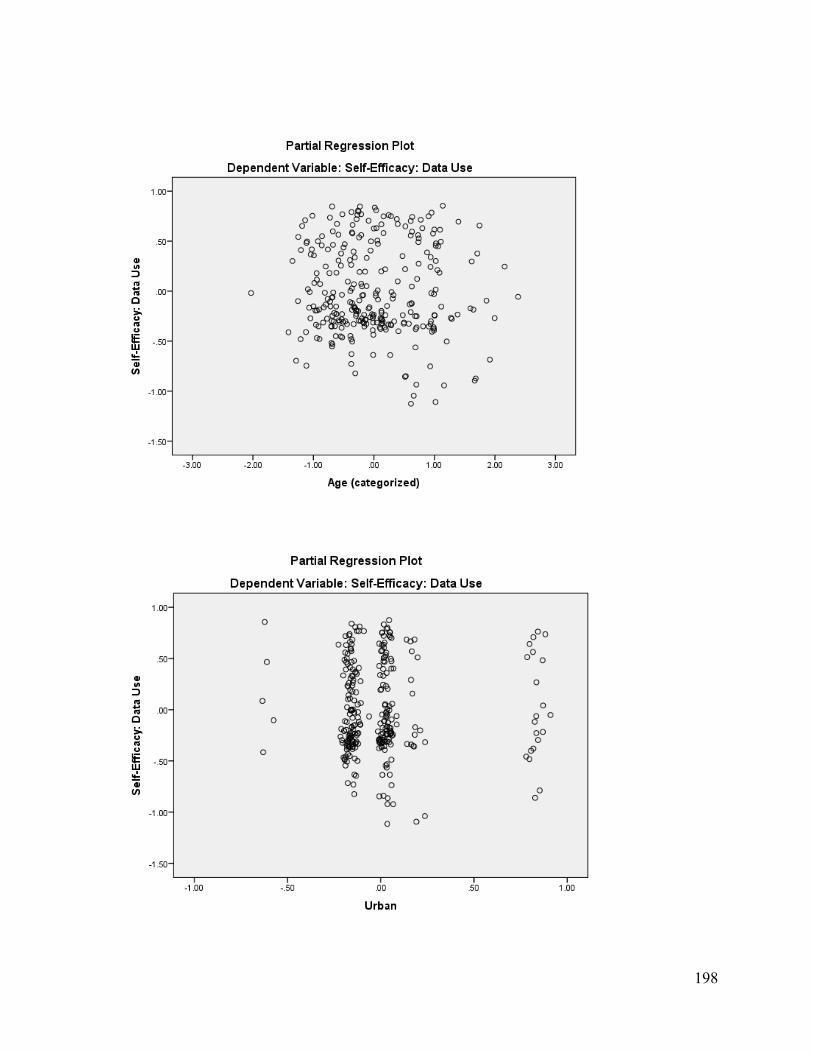
198
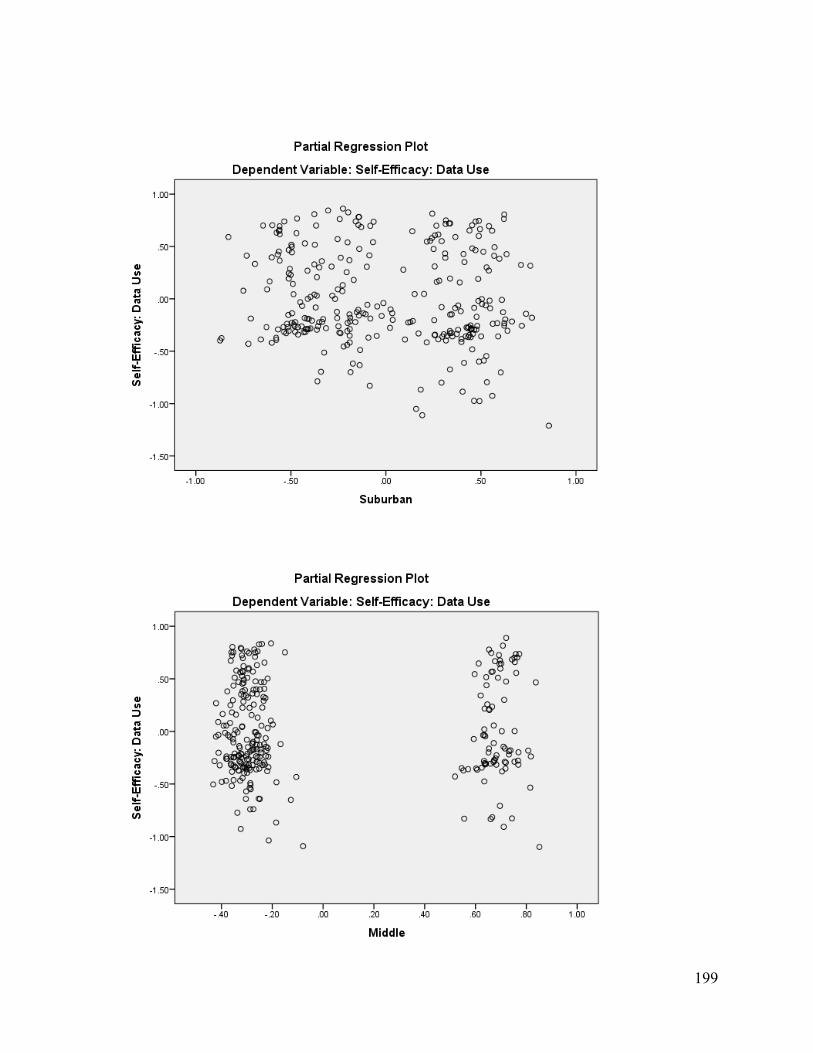
199
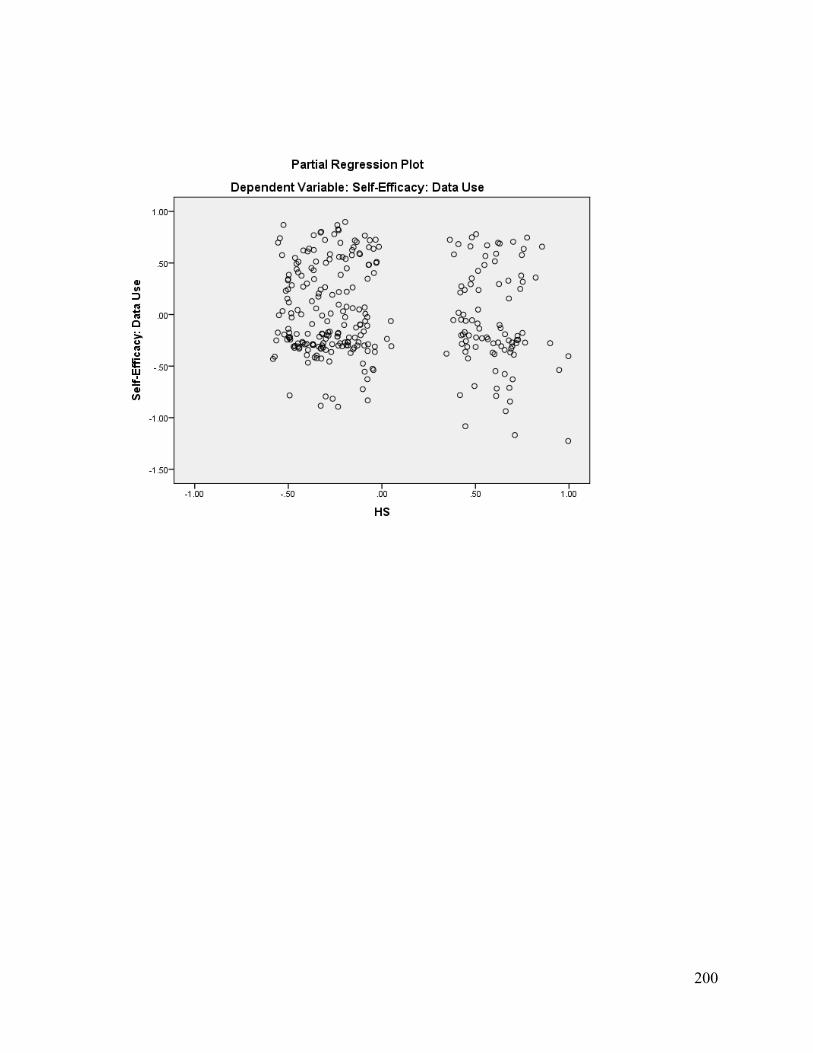
200
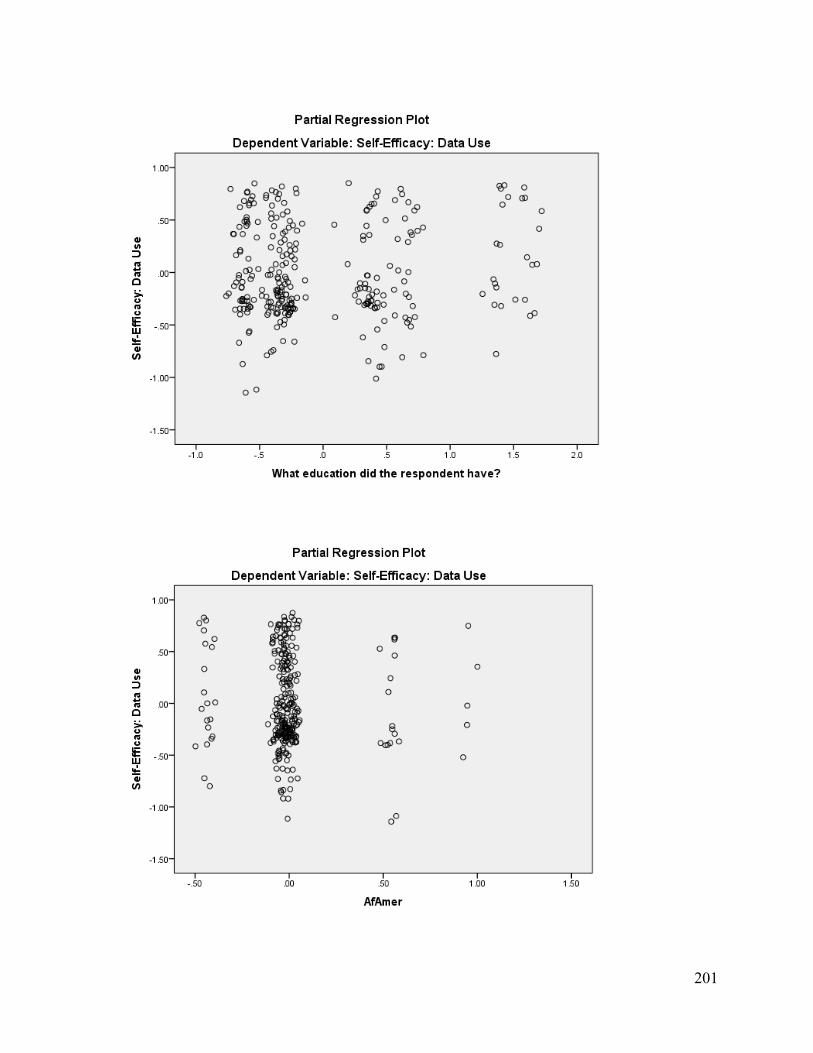
201
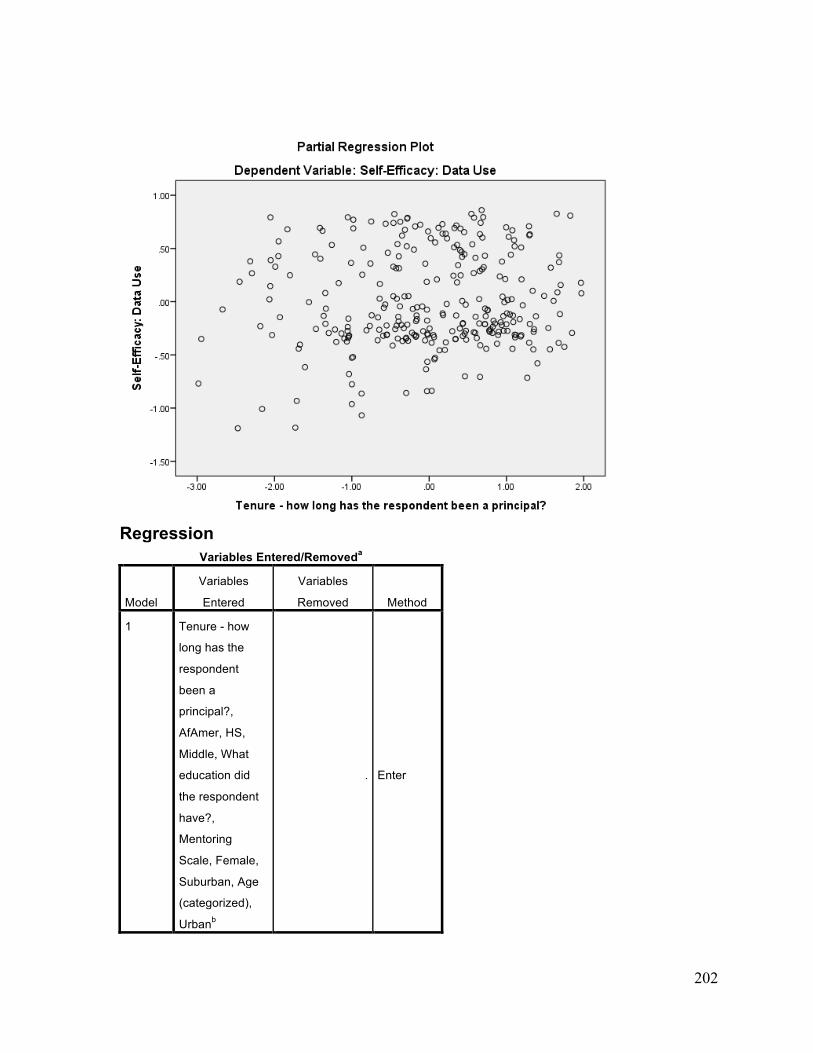
202
Regression
Variables Entered/Removeda
Model
Variables
Entered
Variables
Removed Method
1 Tenure - how
long has the
respondent
been a
principal?,
AfAmer, HS,
Middle, What
education did
the respondent
have?,
Mentoring
Scale, Female,
Suburban, Age
(categorized),
Urbanb
. Enter

203
a. Dependent Variable: Self-Efficacy: Positive Culture
b. All requested variables entered.
Model Summaryb
Model R R Square
Adjusted R
Square
Std. Error of the
Estimate
1 .393a .155 .124 .45931
a. Predictors: (Constant), Tenure - how long has the respondent been a
principal?, AfAmer, HS, Middle, What education did the respondent
have?, Mentoring Scale, Female, Suburban, Age (categorized), Urban
b. Dependent Variable: Self-Efficacy: Positive Culture
ANOVAa
Model Sum of Squares df Mean Square F Sig.
1 Regression 10.658 10 1.066 5.052 .000b
Residual 58.226 276 .211 Total 68.884 286
a. Dependent Variable: Self-Efficacy: Positive Culture
b. Predictors: (Constant), Tenure - how long has the respondent been a principal?, AfAmer, HS,
Middle, What education did the respondent have?, Mentoring Scale, Female, Suburban, Age
(categorized), Urban
Coefficientsa
Model
Unstandardized Coefficients
Standardized
Coefficients
t Sig. B Std. Error Beta
1 (Constant) 1.998 .202 9.902 .000
Mentoring Scale .166 .038 .246 4.323 .000
Female -.052 .058 -.052 -.891 .374
Age (categorized) .062 .035 .114 1.748 .081
Urban .225 .101 .156 2.226 .027
Suburban .042 .064 .042 .658 .511
Middle .045 .060 .042 .748 .455
HS .005 .062 .004 .076 .940
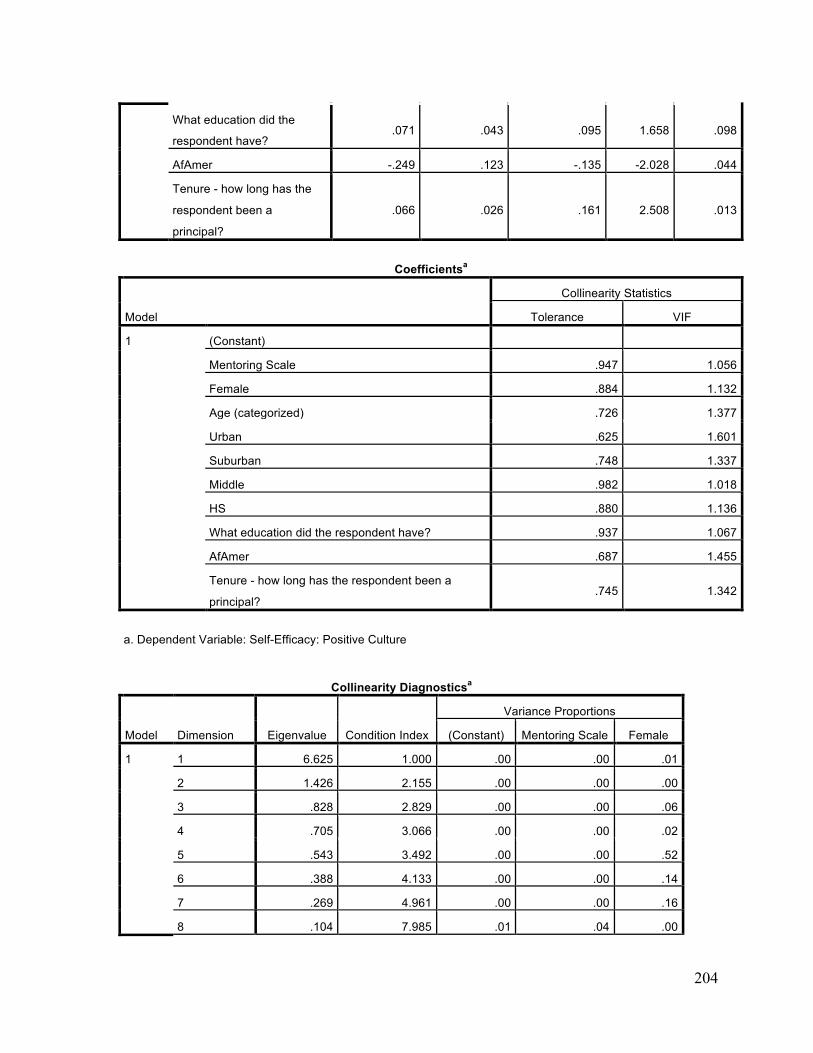
204
What education did the
respondent have? .071 .043 .095 1.658 .098
AfAmer -.249 .123 -.135 -2.028 .044
Tenure - how long has the
respondent been a
principal?
.066 .026 .161 2.508 .013
Coefficientsa
Model
Collinearity Statistics
Tolerance VIF
1 (Constant) Mentoring Scale .947 1.056
Female .884 1.132
Age (categorized) .726 1.377
Urban .625 1.601
Suburban .748 1.337
Middle .982 1.018
HS .880 1.136
What education did the respondent have? .937 1.067
AfAmer .687 1.455
Tenure - how long has the respondent been a
principal? .745 1.342
a. Dependent Variable: Self-Efficacy: Positive Culture
Collinearity Diagnosticsa
Model Dimension Eigenvalue Condition Index
Variance Proportions
(Constant) Mentoring Scale Female
1 1 6.625 1.000 .00 .00 .01
2 1.426 2.155 .00 .00 .00
3 .828 2.829 .00 .00 .06
4 .705 3.066 .00 .00 .02
5 .543 3.492 .00 .00 .52
6 .388 4.133 .00 .00 .14
7 .269 4.961 .00 .00 .16
8 .104 7.985 .01 .04 .00
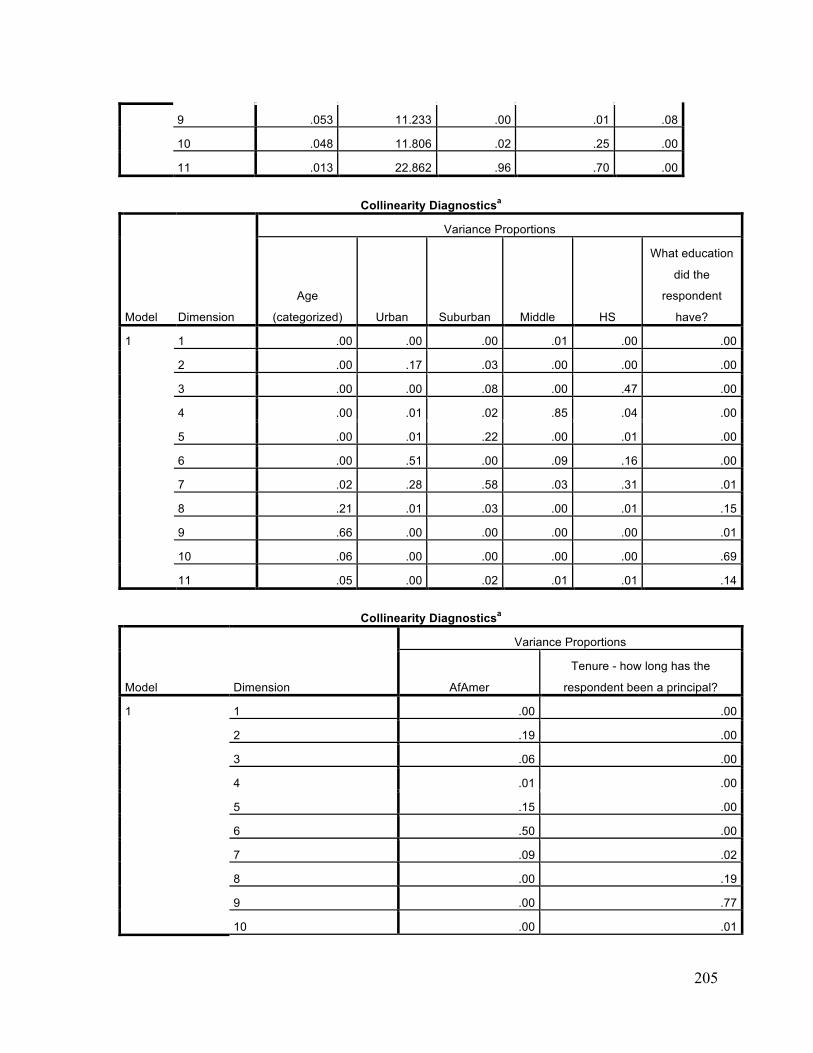
205
9 .053 11.233 .00 .01 .08
10 .048 11.806 .02 .25 .00
11 .013 22.862 .96 .70 .00
Collinearity Diagnosticsa
Model Dimension
Variance Proportions
Age
(categorized) Urban Suburban Middle HS
What education
did the
respondent
have?
1 1 .00 .00 .00 .01 .00 .00
2 .00 .17 .03 .00 .00 .00
3 .00 .00 .08 .00 .47 .00
4 .00 .01 .02 .85 .04 .00
5 .00 .01 .22 .00 .01 .00
6 .00 .51 .00 .09 .16 .00
7 .02 .28 .58 .03 .31 .01
8 .21 .01 .03 .00 .01 .15
9 .66 .00 .00 .00 .00 .01
10 .06 .00 .00 .00 .00 .69
11 .05 .00 .02 .01 .01 .14
Collinearity Diagnosticsa
Model Dimension
Variance Proportions
AfAmer
Tenure - how long has the
respondent been a principal?
1 1 .00 .00
2 .19 .00
3 .06 .00
4 .01 .00
5 .15 .00
6 .50 .00
7 .09 .02
8 .00 .19
9 .00 .77
10 .00 .01
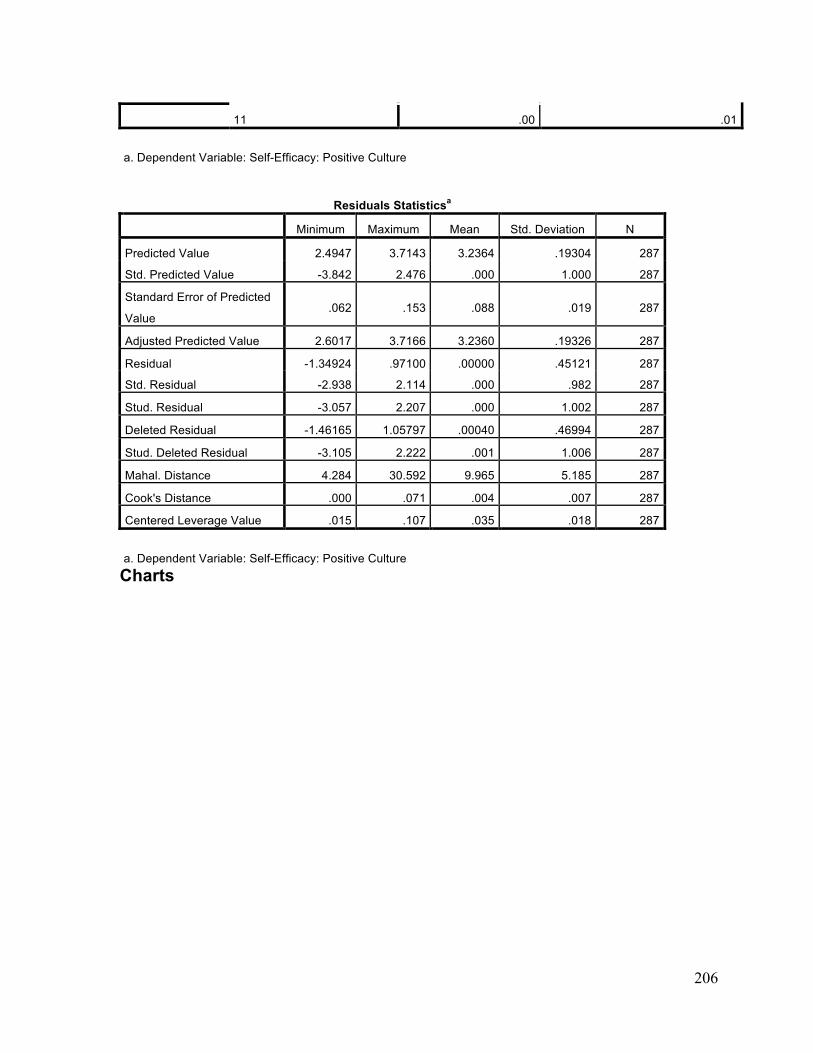
206
11 .00 .01
a. Dependent Variable: Self-Efficacy: Positive Culture
Residuals Statisticsa
Minimum Maximum Mean Std. Deviation N
Predicted Value 2.4947 3.7143 3.2364 .19304 287
Std. Predicted Value -3.842 2.476 .000 1.000 287
Standard Error of Predicted
Value .062 .153 .088 .019 287
Adjusted Predicted Value 2.6017 3.7166 3.2360 .19326 287
Residual -1.34924 .97100 .00000 .45121 287
Std. Residual -2.938 2.114 .000 .982 287
Stud. Residual -3.057 2.207 .000 1.002 287
Deleted Residual -1.46165 1.05797 .00040 .46994 287
Stud. Deleted Residual -3.105 2.222 .001 1.006 287
Mahal. Distance 4.284 30.592 9.965 5.185 287
Cook's Distance .000 .071 .004 .007 287
Centered Leverage Value .015 .107 .035 .018 287
a. Dependent Variable: Self-Efficacy: Positive Culture Charts
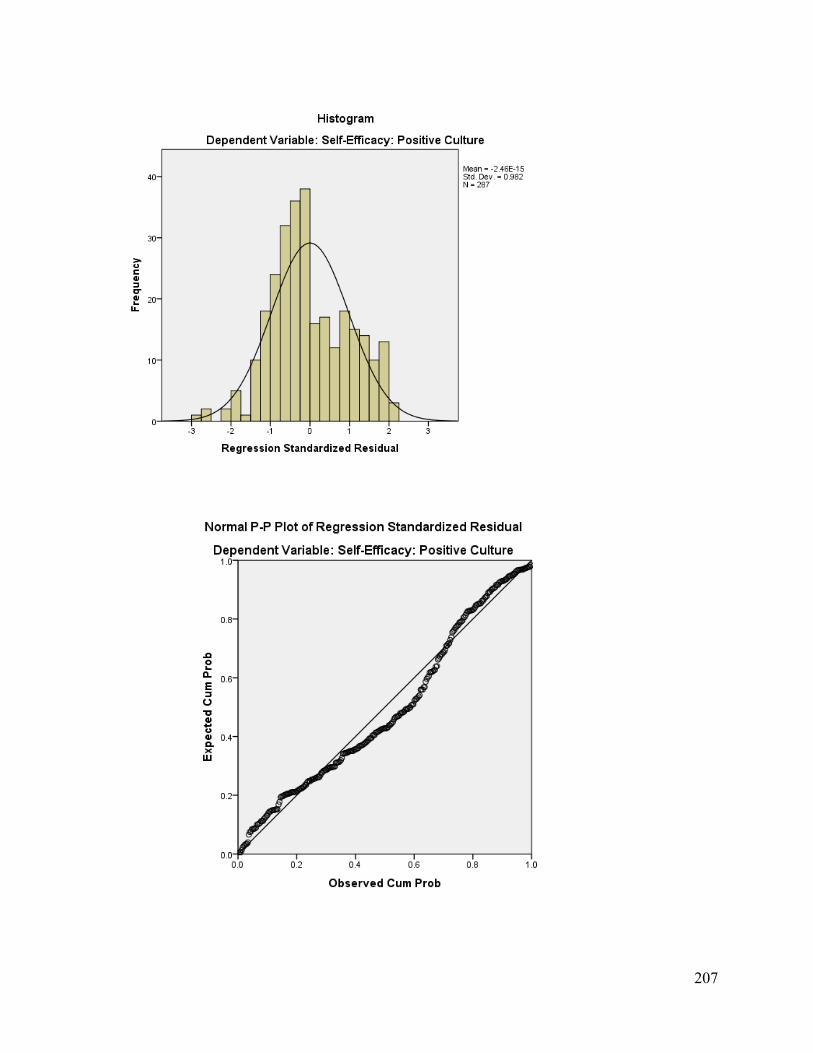
207
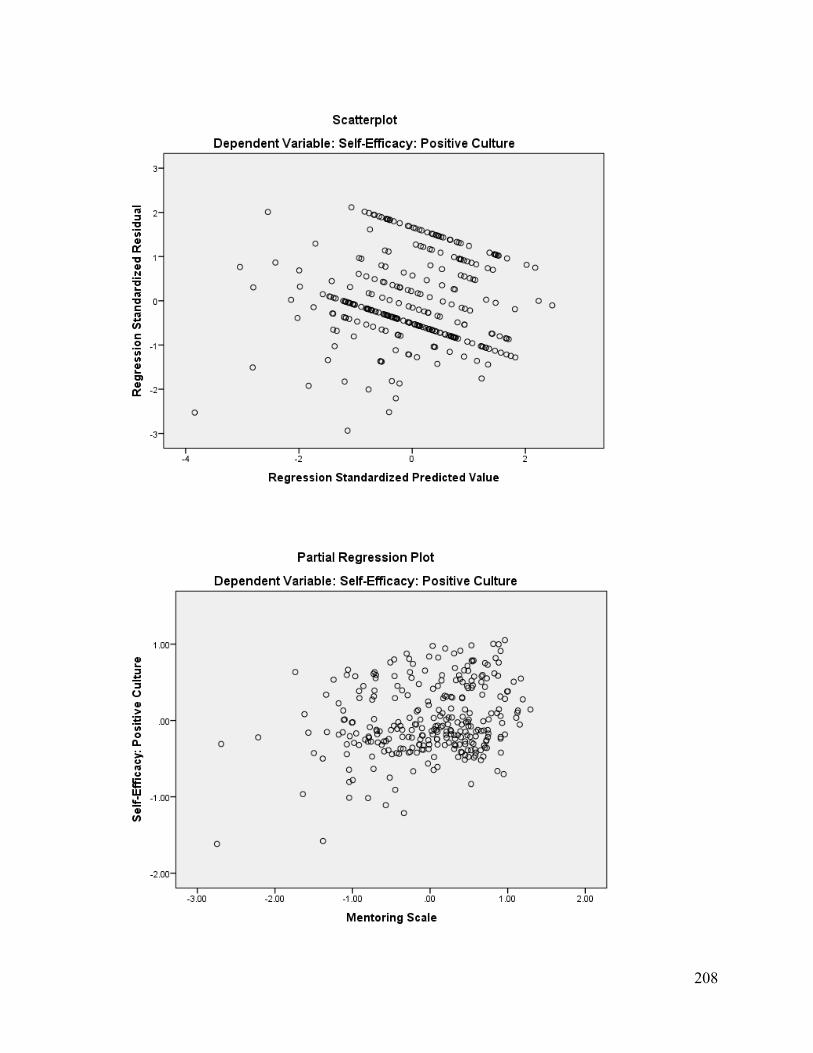
208
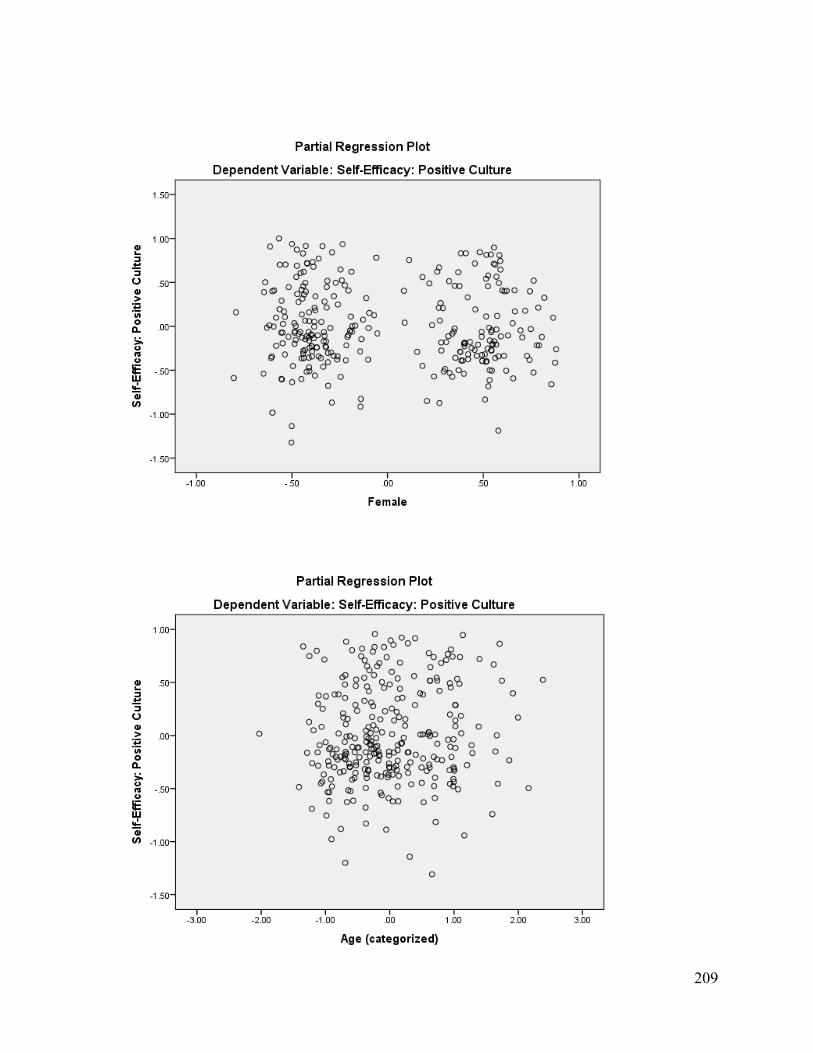
209
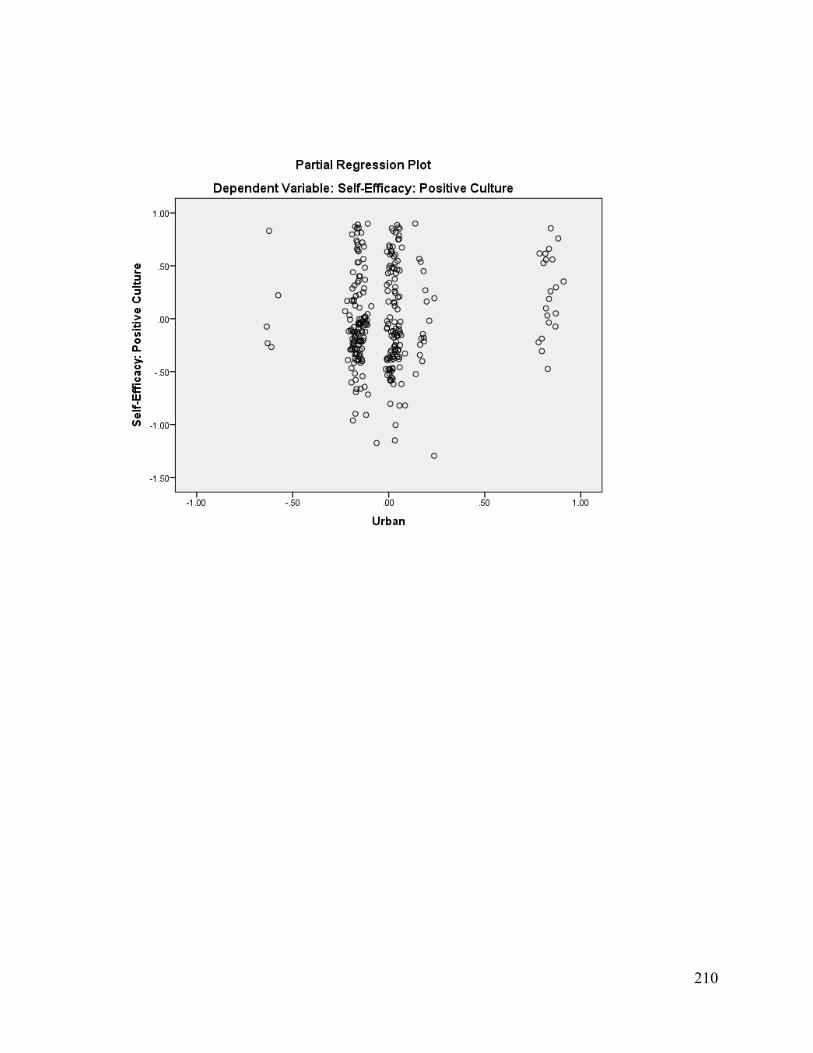
210
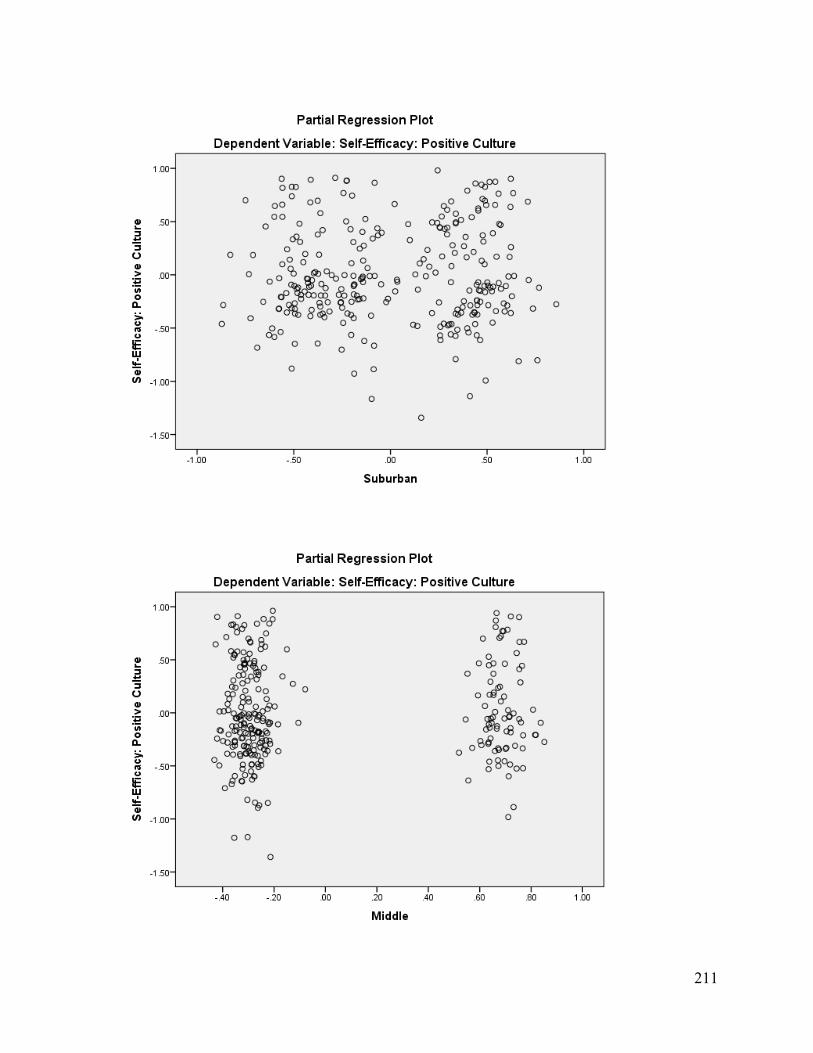
211
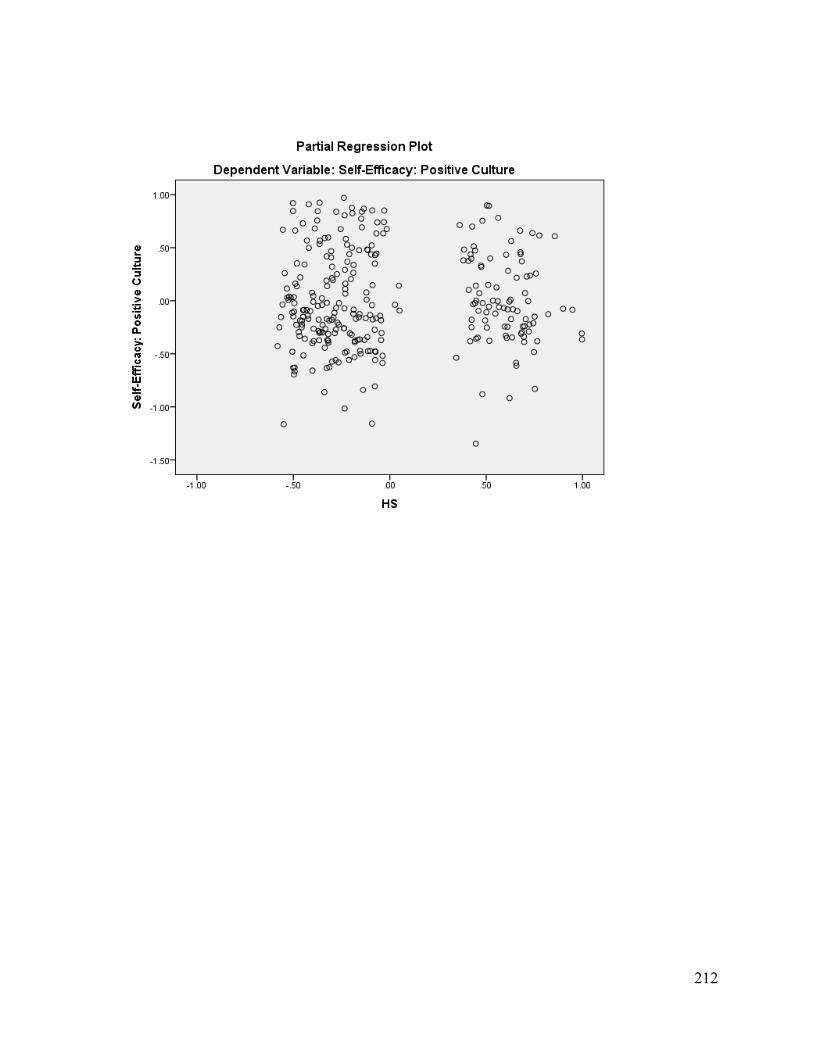
212
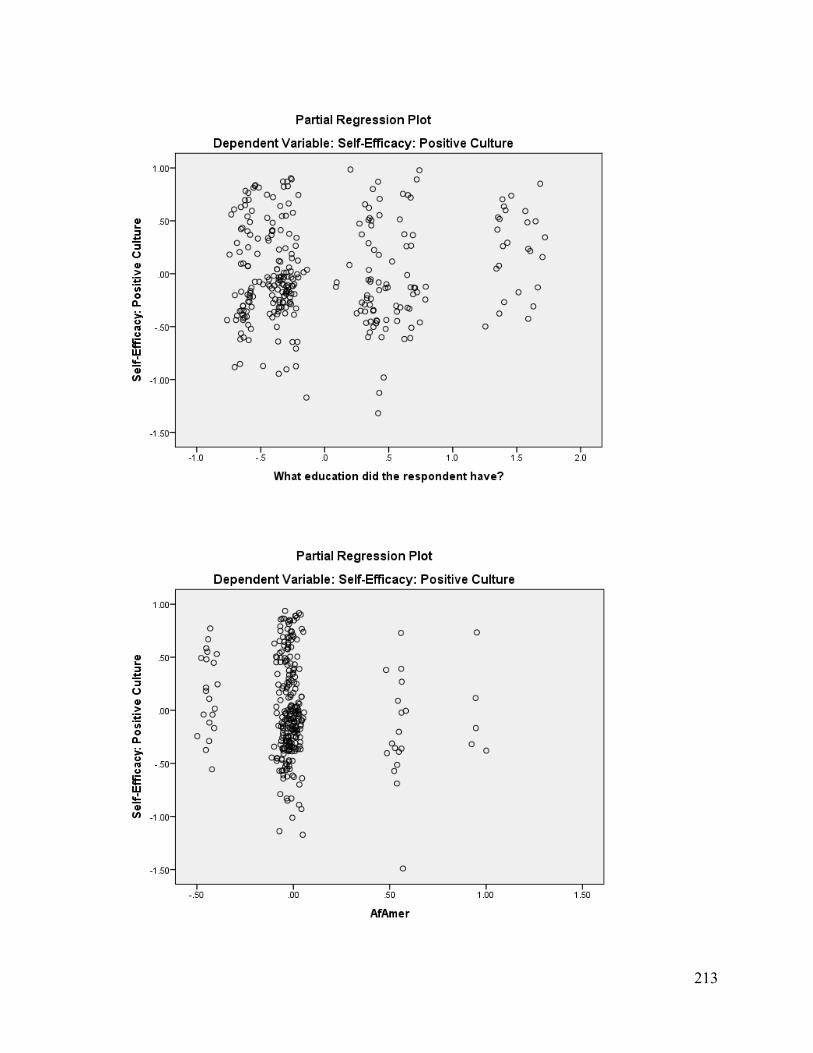
213
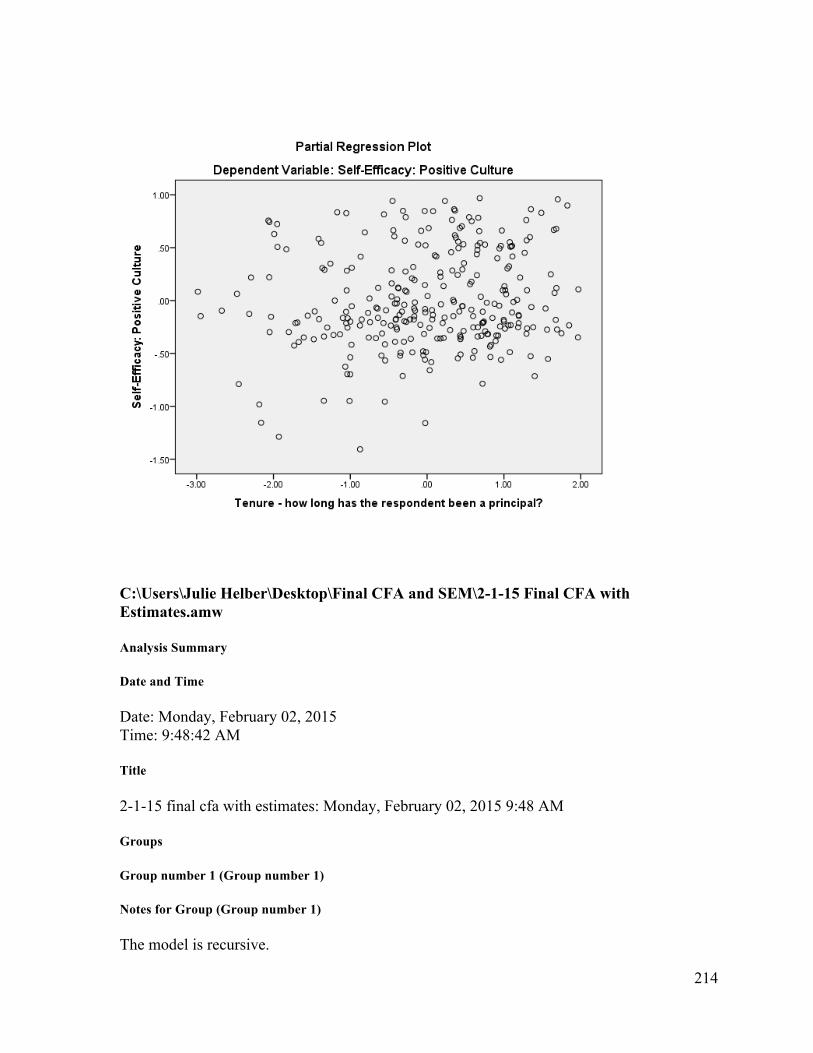
214
C:\Users\Julie Helber\Desktop\Final CFA and SEM\2-1-15 Final CFA with Estimates.amw
Analysis Summary
Date and Time
Date: Monday, February 02, 2015 Time: 9:48:42 AM
Title
2-1-15 final cfa with estimates: Monday, February 02, 2015 9:48 AM
Groups
Group number 1 (Group number 1)
Notes for Group (Group number 1)
The model is recursive.

215
Sample size = 311
Variable Summary (Group number 1)
Your model contains the following variables (Group number 1)
Observed, endogenous variables MC_sponsor MP_friend MVic_Modeling SE_Datastaffparent SE_Dataanalysis SE_Datastudachieve SE_SIinstruction SE_SIneeds SE_Evalreflection SE_Evaldialogue SE_Evalinstructknowledge SE_evaluate SE_Cultengstaff SE_Cultdatastbehavior SE_Cultengstud SE_Cultdataposenviron MP_trust MP_counsel Mvb_skilled Mvb_knowskills Unobserved, exogenous variables Mentoring1 e3 e5 e7 SE_Data1 e19 e20 e22 SE_Enactment1 e23 e28 e29 e30 e31 e32 SE_Culture1 e15 e17

216
e16 e18 e42 e43 e40 e41
Variable counts (Group number 1)
Number of variables in your model: 44 Number of observed variables: 20 Number of unobserved variables: 24 Number of exogenous variables: 24 Number of endogenous variables: 20
Parameter Summary (Group number 1)
Weights Covariances Variances Means Intercepts Total Fixed 24 0 0 0 0 24
Labeled 0 0 0 0 0 0 Unlabeled 16 6 24 0 20 66
Total 40 6 24 0 20 90
Models
Default model (Default model)
Notes for Model (Default model)
Computation of degrees of freedom (Default model)
Number of distinct sample moments: 230 Number of distinct parameters to be estimated: 66
Degrees of freedom (230 - 66): 164
Result (Default model)
Minimum was achieved Chi-square = 370.444 Degrees of freedom = 164 Probability level = .000
Group number 1 (Group number 1 - Default model)
Estimates (Group number 1 - Default model)
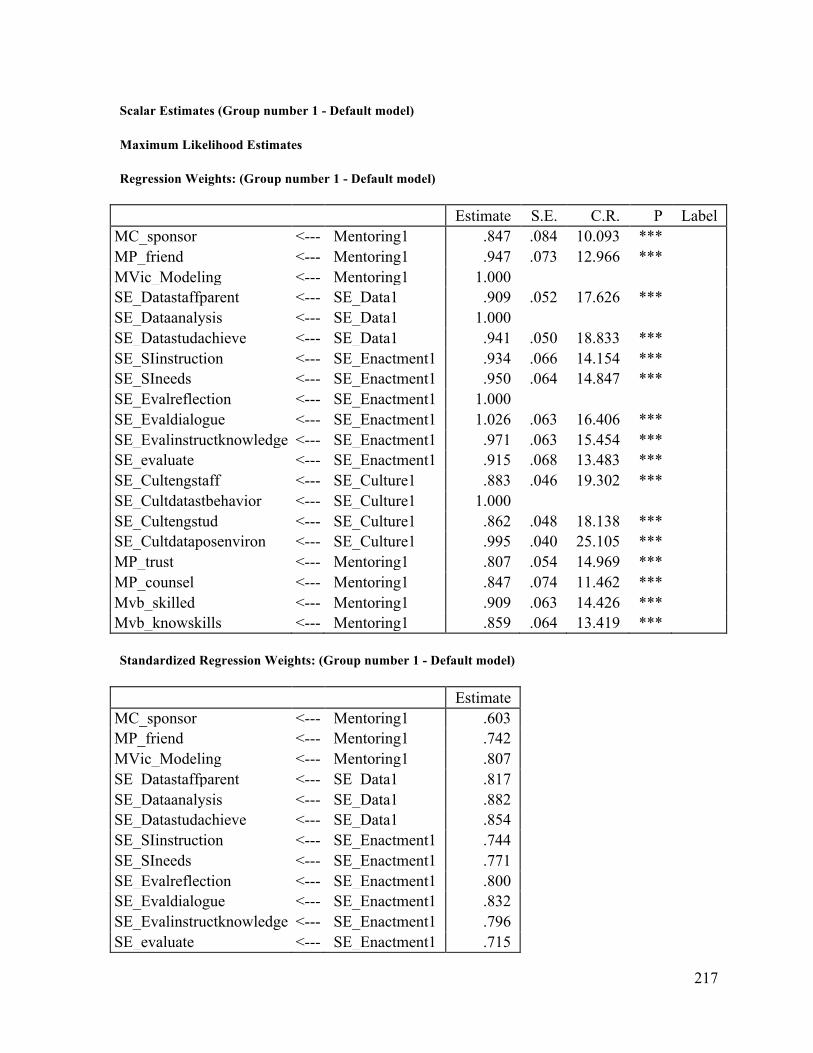
217
Scalar Estimates (Group number 1 - Default model)
Maximum Likelihood Estimates
Regression Weights: (Group number 1 - Default model)
Estimate S.E. C.R. P Label MC_sponsor <--- Mentoring1 .847 .084 10.093 *** MP_friend <--- Mentoring1 .947 .073 12.966 *** MVic_Modeling <--- Mentoring1 1.000 SE_Datastaffparent <--- SE_Data1 .909 .052 17.626 *** SE_Dataanalysis <--- SE_Data1 1.000 SE_Datastudachieve <--- SE_Data1 .941 .050 18.833 *** SE_SIinstruction <--- SE_Enactment1 .934 .066 14.154 *** SE_SIneeds <--- SE_Enactment1 .950 .064 14.847 *** SE_Evalreflection <--- SE_Enactment1 1.000 SE_Evaldialogue <--- SE_Enactment1 1.026 .063 16.406 *** SE_Evalinstructknowledge <--- SE_Enactment1 .971 .063 15.454 *** SE_evaluate <--- SE_Enactment1 .915 .068 13.483 *** SE_Cultengstaff <--- SE_Culture1 .883 .046 19.302 *** SE_Cultdatastbehavior <--- SE_Culture1 1.000 SE_Cultengstud <--- SE_Culture1 .862 .048 18.138 *** SE_Cultdataposenviron <--- SE_Culture1 .995 .040 25.105 *** MP_trust <--- Mentoring1 .807 .054 14.969 *** MP_counsel <--- Mentoring1 .847 .074 11.462 *** Mvb_skilled <--- Mentoring1 .909 .063 14.426 *** Mvb_knowskills <--- Mentoring1 .859 .064 13.419 ***
Standardized Regression Weights: (Group number 1 - Default model)
Estimate MC_sponsor <--- Mentoring1 .603 MP_friend <--- Mentoring1 .742 MVic_Modeling <--- Mentoring1 .807 SE_Datastaffparent <--- SE_Data1 .817 SE_Dataanalysis <--- SE_Data1 .882 SE_Datastudachieve <--- SE_Data1 .854 SE_SIinstruction <--- SE_Enactment1 .744 SE_SIneeds <--- SE_Enactment1 .771 SE_Evalreflection <--- SE_Enactment1 .800 SE_Evaldialogue <--- SE_Enactment1 .832 SE_Evalinstructknowledge <--- SE_Enactment1 .796 SE_evaluate <--- SE_Enactment1 .715
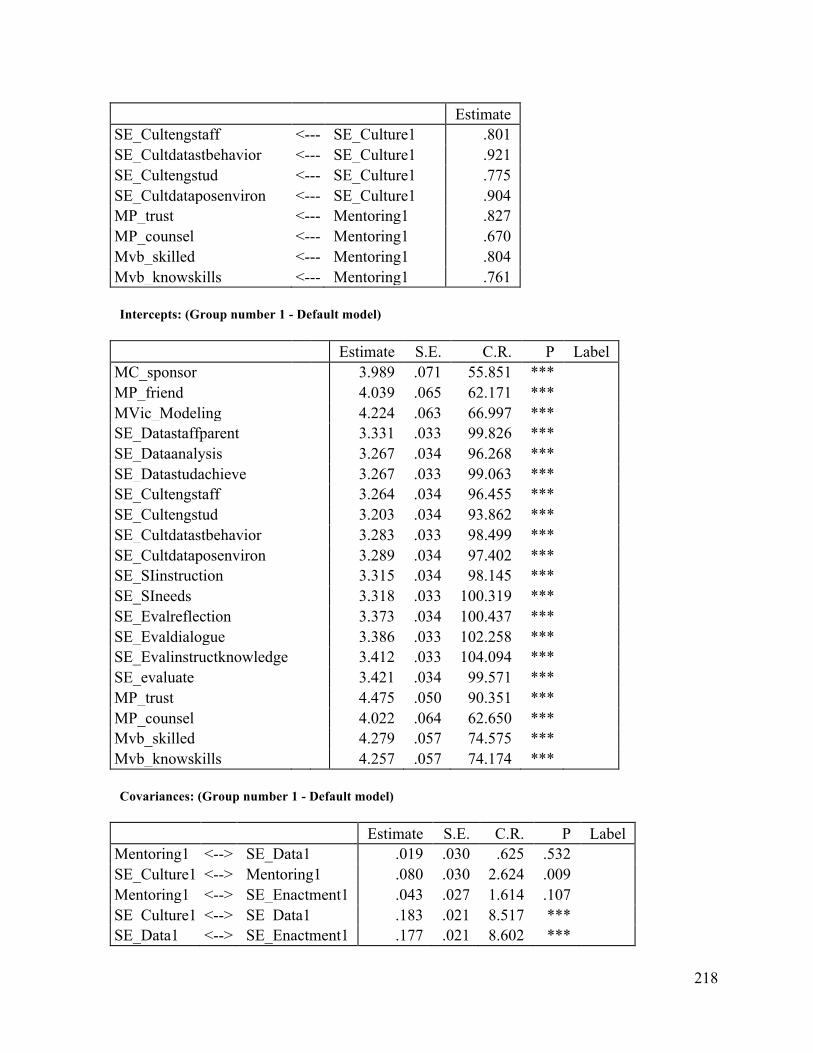
218
Estimate SE_Cultengstaff <--- SE_Culture1 .801 SE_Cultdatastbehavior <--- SE_Culture1 .921 SE_Cultengstud <--- SE_Culture1 .775 SE_Cultdataposenviron <--- SE_Culture1 .904 MP_trust <--- Mentoring1 .827 MP_counsel <--- Mentoring1 .670 Mvb_skilled <--- Mentoring1 .804 Mvb_knowskills <--- Mentoring1 .761
Intercepts: (Group number 1 - Default model)
Estimate S.E. C.R. P Label MC_sponsor 3.989 .071 55.851 *** MP_friend 4.039 .065 62.171 *** MVic_Modeling 4.224 .063 66.997 *** SE_Datastaffparent 3.331 .033 99.826 *** SE_Dataanalysis 3.267 .034 96.268 *** SE_Datastudachieve 3.267 .033 99.063 *** SE_Cultengstaff 3.264 .034 96.455 *** SE_Cultengstud 3.203 .034 93.862 *** SE_Cultdatastbehavior 3.283 .033 98.499 *** SE_Cultdataposenviron 3.289 .034 97.402 *** SE_SIinstruction 3.315 .034 98.145 *** SE_SIneeds 3.318 .033 100.319 *** SE_Evalreflection 3.373 .034 100.437 *** SE_Evaldialogue 3.386 .033 102.258 *** SE_Evalinstructknowledge 3.412 .033 104.094 *** SE_evaluate 3.421 .034 99.571 *** MP_trust 4.475 .050 90.351 *** MP_counsel 4.022 .064 62.650 *** Mvb_skilled 4.279 .057 74.575 *** Mvb_knowskills 4.257 .057 74.174 ***
Covariances: (Group number 1 - Default model)
Estimate S.E. C.R. P Label Mentoring1 <--> SE_Data1 .019 .030 .625 .532 SE_Culture1 <--> Mentoring1 .080 .030 2.624 .009 Mentoring1 <--> SE_Enactment1 .043 .027 1.614 .107 SE_Culture1 <--> SE_Data1 .183 .021 8.517 *** SE_Data1 <--> SE_Enactment1 .177 .021 8.602 ***
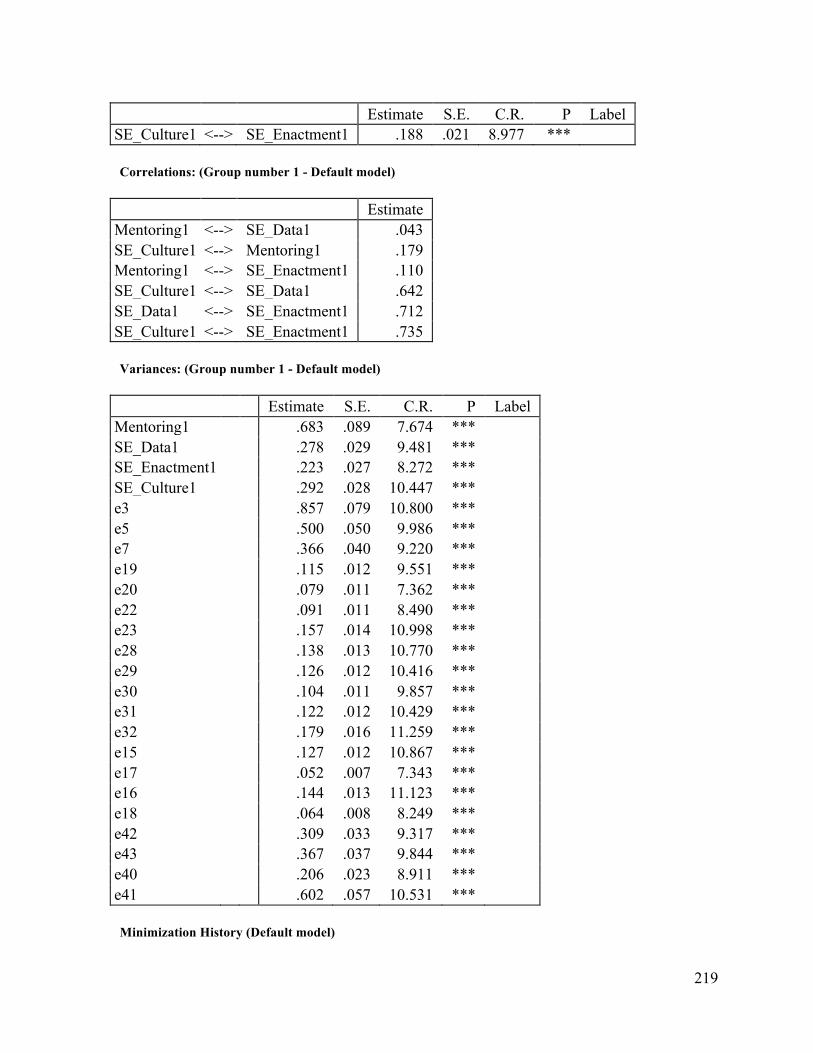
219
Estimate S.E. C.R. P Label SE_Culture1 <--> SE_Enactment1 .188 .021 8.977 ***
Correlations: (Group number 1 - Default model)
Estimate Mentoring1 <--> SE_Data1 .043 SE_Culture1 <--> Mentoring1 .179 Mentoring1 <--> SE_Enactment1 .110 SE_Culture1 <--> SE_Data1 .642 SE_Data1 <--> SE_Enactment1 .712 SE_Culture1 <--> SE_Enactment1 .735
Variances: (Group number 1 - Default model)
Estimate S.E. C.R. P Label Mentoring1 .683 .089 7.674 *** SE_Data1 .278 .029 9.481 *** SE_Enactment1 .223 .027 8.272 *** SE_Culture1 .292 .028 10.447 *** e3 .857 .079 10.800 *** e5 .500 .050 9.986 *** e7 .366 .040 9.220 *** e19 .115 .012 9.551 *** e20 .079 .011 7.362 *** e22 .091 .011 8.490 *** e23 .157 .014 10.998 *** e28 .138 .013 10.770 *** e29 .126 .012 10.416 *** e30 .104 .011 9.857 *** e31 .122 .012 10.429 *** e32 .179 .016 11.259 *** e15 .127 .012 10.867 *** e17 .052 .007 7.343 *** e16 .144 .013 11.123 *** e18 .064 .008 8.249 *** e42 .309 .033 9.317 *** e43 .367 .037 9.844 *** e40 .206 .023 8.911 *** e41 .602 .057 10.531 ***
Minimization History (Default model)

220
Iteration
Negative eigenvalu
es
Condition #
Smallest eigenval
ue
Diameter F NTrie
s Ratio
0 e 9 -.881 9999.000
4009.488 0 9999.00
0
1 e* 12 -.316 4.035 1657.98
2 20 .310
2 e* 3 -.133 .938 941.574 5 .902
3 e 1 -.053 .712 562.586 5 .828
4 e 0 4764.333 .667 410.916 6 .820
5 e 0 1012.711 .761 378.265 2 .000
6 e 0 1175.230 .186 370.694 1 1.101
7 e 0 1214.047 .049 370.445 1 1.031
8 e 0 1213.355 .003 370.444 1 1.002
9 e 0 1211.671 .000 370.444 1 1.000
Model Fit Summary
CMIN
Model NPAR CMIN DF P CMIN/DF Default model 66 370.444 164 .000 2.259 Saturated model 230 .000 0 Independence model 20 4113.351 210 .000 19.587
Baseline Comparisons
Model NFI Delta1
RFI rho1
IFI Delta2
TLI rho2 CFI
Default model .910 .885 .948 .932 .947 Saturated model 1.000 1.000 1.000 Independence model .000 .000 .000 .000 .000
Parsimony-Adjusted Measures
Model PRATIO PNFI PCFI Default model .781 .711 .740
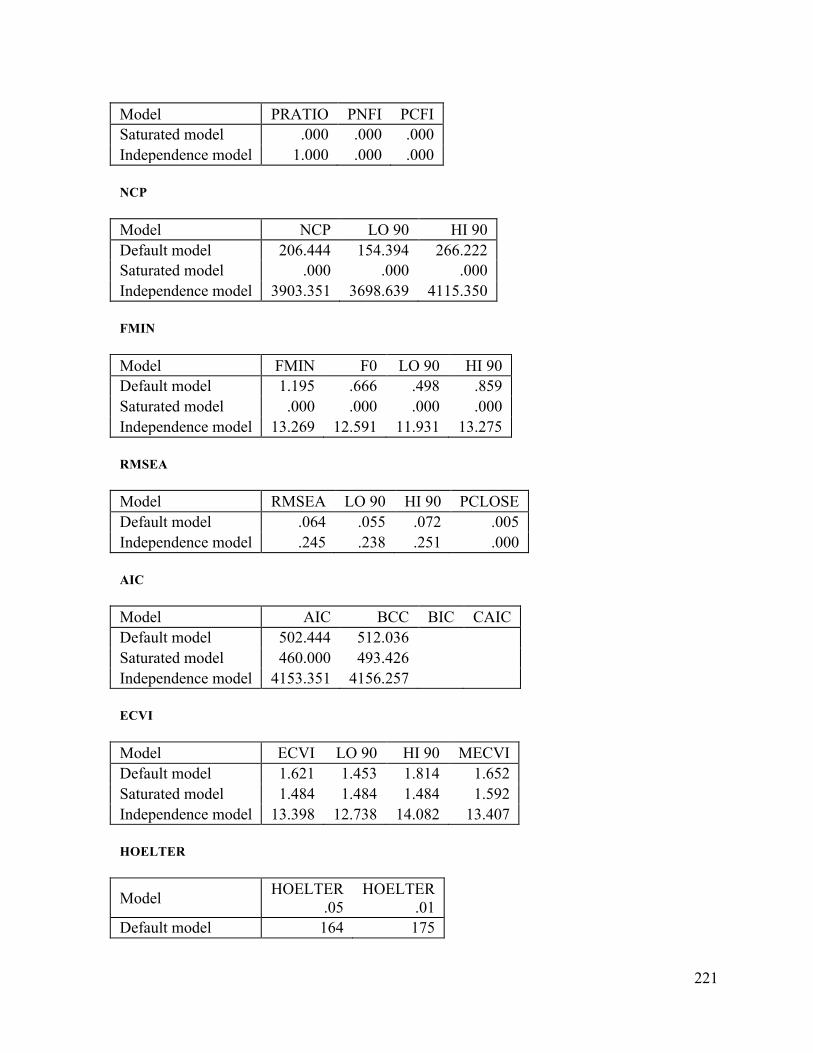
221
Model PRATIO PNFI PCFI Saturated model .000 .000 .000 Independence model 1.000 .000 .000
NCP
Model NCP LO 90 HI 90 Default model 206.444 154.394 266.222 Saturated model .000 .000 .000 Independence model 3903.351 3698.639 4115.350
FMIN
Model FMIN F0 LO 90 HI 90 Default model 1.195 .666 .498 .859 Saturated model .000 .000 .000 .000 Independence model 13.269 12.591 11.931 13.275
RMSEA
Model RMSEA LO 90 HI 90 PCLOSE Default model .064 .055 .072 .005 Independence model .245 .238 .251 .000
AIC
Model AIC BCC BIC CAIC Default model 502.444 512.036 Saturated model 460.000 493.426 Independence model 4153.351 4156.257
ECVI
Model ECVI LO 90 HI 90 MECVI Default model 1.621 1.453 1.814 1.652 Saturated model 1.484 1.484 1.484 1.592 Independence model 13.398 12.738 14.082 13.407
HOELTER
Model HOELTER .05
HOELTER .01
Default model 164 175
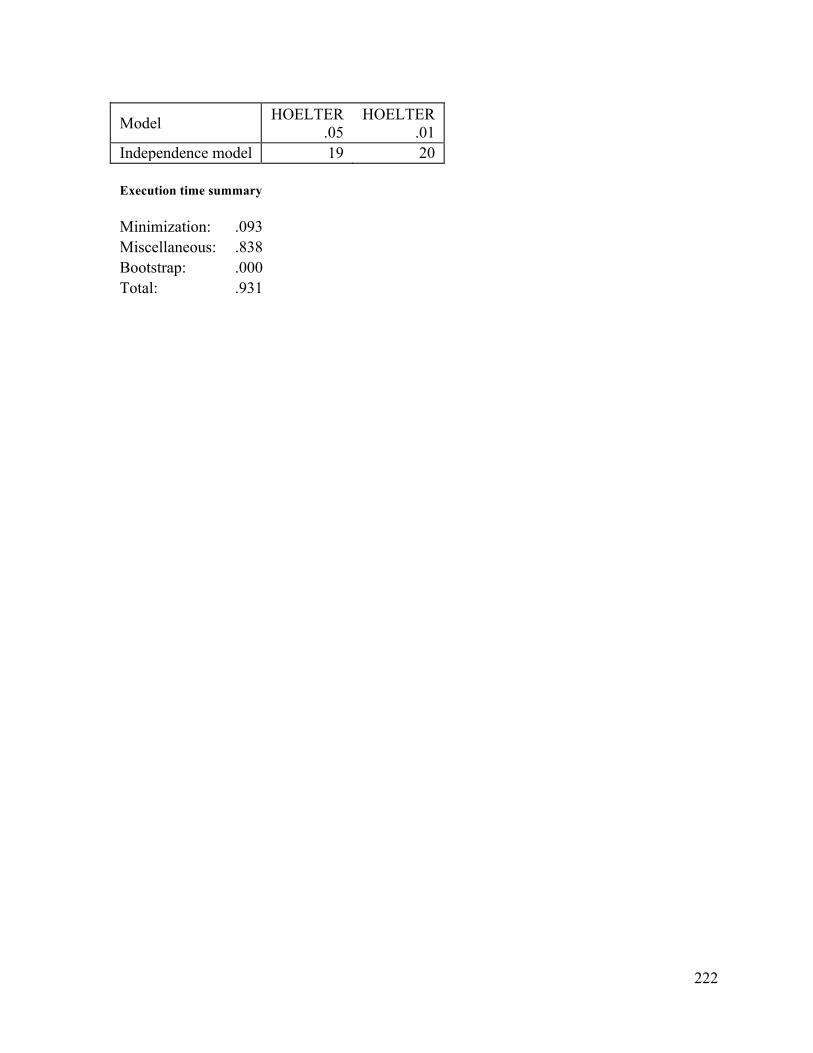
222
Model HOELTER .05
HOELTER .01
Independence model 19 20
Execution time summary
Minimization: .093 Miscellaneous: .838 Bootstrap: .000 Total: .931
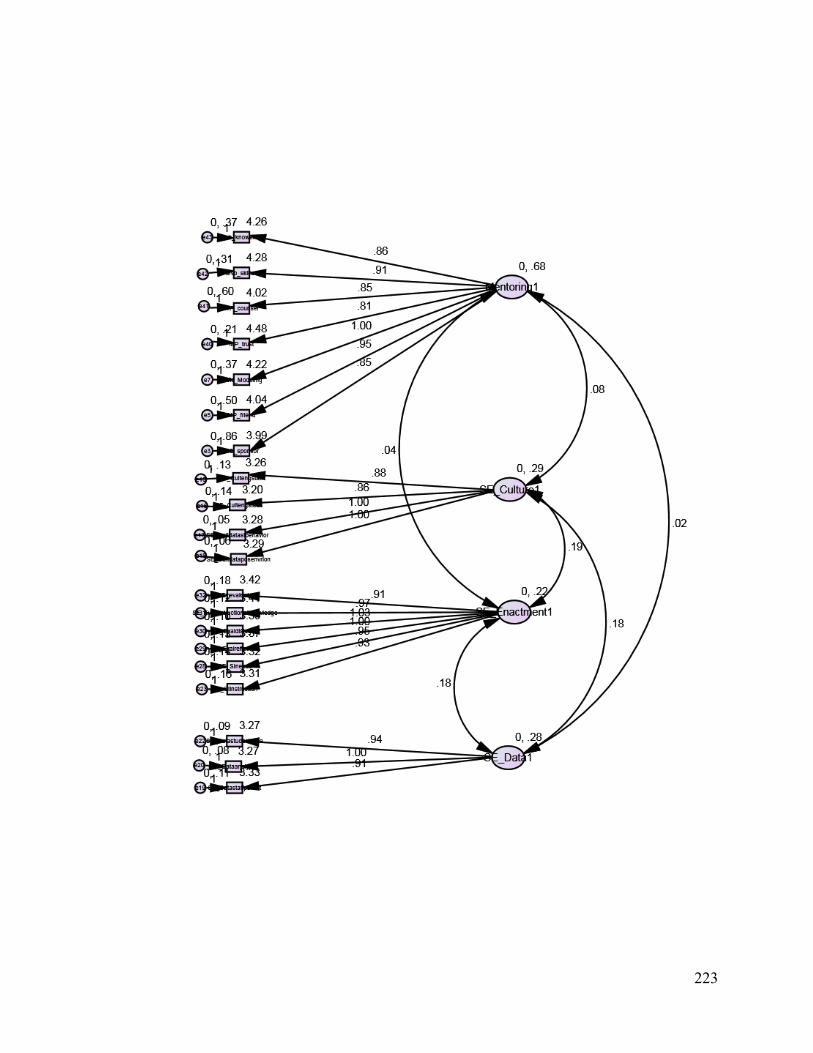
223

224
C:\Users\Julie Helber\Desktop\Final CFA and SEM\2-1-15 Final SEM with Estimates OUTPUT.amw
Analysis Summary
Date and Time
Date: Monday, February 02, 2015 Time: 9:52:50 AM Title 2-1-15 final sem with estimates output: Monday, February 02, 2015 9:52 AM
Groups
Group number 1 (Group number 1)
Notes for Group (Group number 1)
The model is recursive. Sample size = 311
Variable Summary (Group number 1)
Your model contains the following variables (Group number 1)
Observed, endogenous variables SE_Datastaffparent SE_Dataanalysis SE_Datastudachieve SE_Cultengstaff SE_Cultengstud SE_Cultdatastbehavior SE_Cultdataposenviron SE_SIneeds SE_evaluate SE_Evalinstructknowledge SE_Evalreflection SE_Evaldialogue SE_SIinstruction MP_friend MVic_Modeling MC_sponsor Mvb_skilled Mvb_knowskills MP_counsel MP_trust Observed, exogenous variables

225
Suburban Doctorate Elem Tenure Unobserved, endogenous variables SE_Data1 SE_Culture1 Mentoring1 SE_Enactment1 Unobserved, exogenous variables e20 e22 e15 e16 e17 e18 D1 D2 D4 e28 e32 e31 e29 e5 e7 e3 e40 e41 e42 e43 e19 e30 D3 e23
Variable counts (Group number 1)
Number of variables in your model: 52 Number of observed variables: 24 Number of unobserved variables: 28 Number of exogenous variables: 28 Number of endogenous variables: 24
Parameter Summary (Group number 1)
Weights Covariances Variances Means Intercepts Total
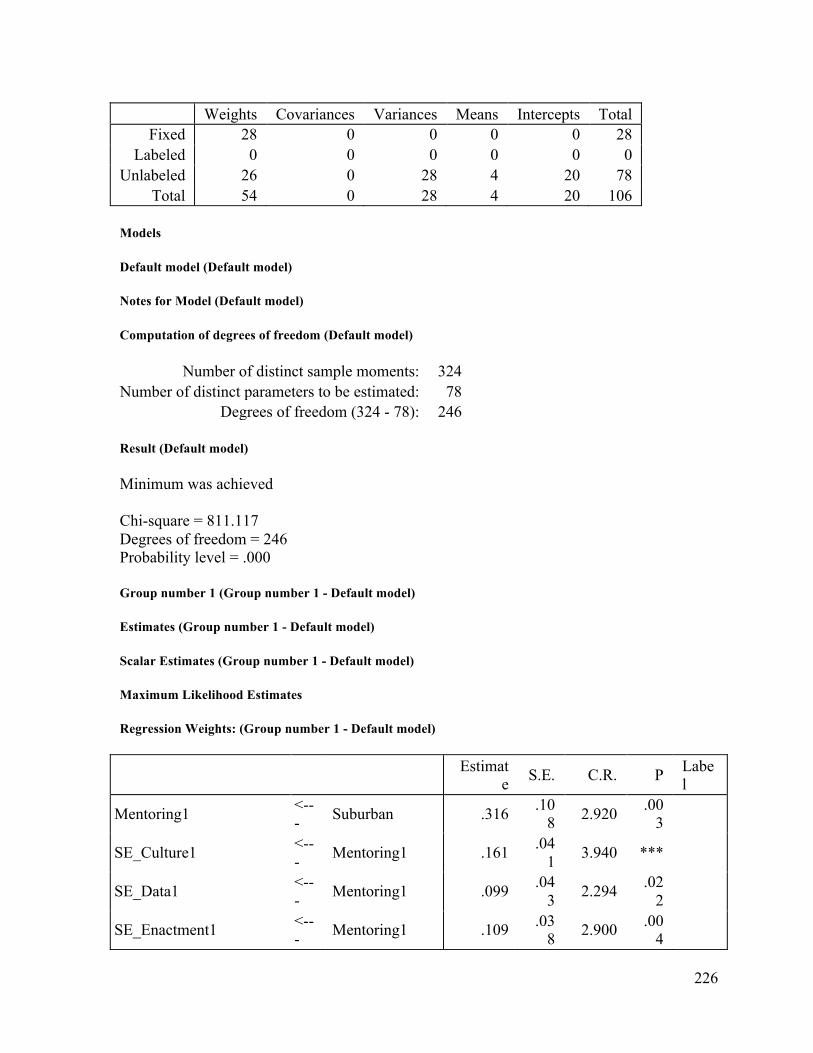
226
Weights Covariances Variances Means Intercepts Total Fixed 28 0 0 0 0 28
Labeled 0 0 0 0 0 0 Unlabeled 26 0 28 4 20 78
Total 54 0 28 4 20 106
Models
Default model (Default model)
Notes for Model (Default model)
Computation of degrees of freedom (Default model)
Number of distinct sample moments: 324 Number of distinct parameters to be estimated: 78
Degrees of freedom (324 - 78): 246
Result (Default model)
Minimum was achieved
Chi-square = 811.117 Degrees of freedom = 246 Probability level = .000
Group number 1 (Group number 1 - Default model)
Estimates (Group number 1 - Default model)
Scalar Estimates (Group number 1 - Default model)
Maximum Likelihood Estimates
Regression Weights: (Group number 1 - Default model)
Estimat
e S.E. C.R. P Label
Mentoring1 <--- Suburban .316 .10
8 2.920 .003
SE_Culture1 <--- Mentoring1 .161 .04
1 3.940 ***
SE_Data1 <--- Mentoring1 .099 .04
3 2.294 .022
SE_Enactment1 <--- Mentoring1 .109 .03
8 2.900 .004

227
Estimat
e S.E. C.R. P Label
SE_Data1 <--- Suburban -.164 .06
5 -2.514 .012
SE_Culture1 <--- Doctorate .238 .10
2 2.327 .020
SE_Data1 <--- Doctorate .235 .10
6 2.216 .027
SE_Enactment1 <--- Doctorate .271 .09
4 2.867 .004
SE_Data1 <--- Elem .197 .06
3 3.134 .002
SE_Culture1 <--- Tenure .075 .02
5 2.981 .003
SE_Datastaffparent <--- SE_Data1 .859 .05
1 16.74
1 ***
SE_Dataanalysis <--- SE_Data1 1.000
SE_Datastudachieve <--- SE_Data1 .906 .05
0 18.07
8 ***
SE_Cultengstaff <--- SE_Culture1 .887 .04
7 18.95
4 ***
SE_Cultengstud <--- SE_Culture1 .864 .04
9 17.77
8 ***
SE_Cultdatastbehavior <--- SE_Culture1 1.000
SE_Cultdataposenviron <--- SE_Culture1 1.005 .04
1 24.41
5 ***
SE_evaluate <---
SE_Enactment1 .902 .06
7 13.38
9 *** SE_Evalinstructknowledge
<---
SE_Enactment1 .963 .06
2 15.46
2 ***
SE_Evaldialogue <---
SE_Enactment1 1.023 .06
2 16.51
3 ***
SE_Evalreflection <---
SE_Enactment1 1.000
SE_SIneeds <---
SE_Enactment1 .931 .06
4 14.62
6 ***
SE_SIinstruction <---
SE_Enactment1 .912 .06
6 13.87
1 ***
MP_friend <--- Mentoring1 .948 .07
2 13.17
2 ***
MVic_Modeling <--- Mentoring1 1.000
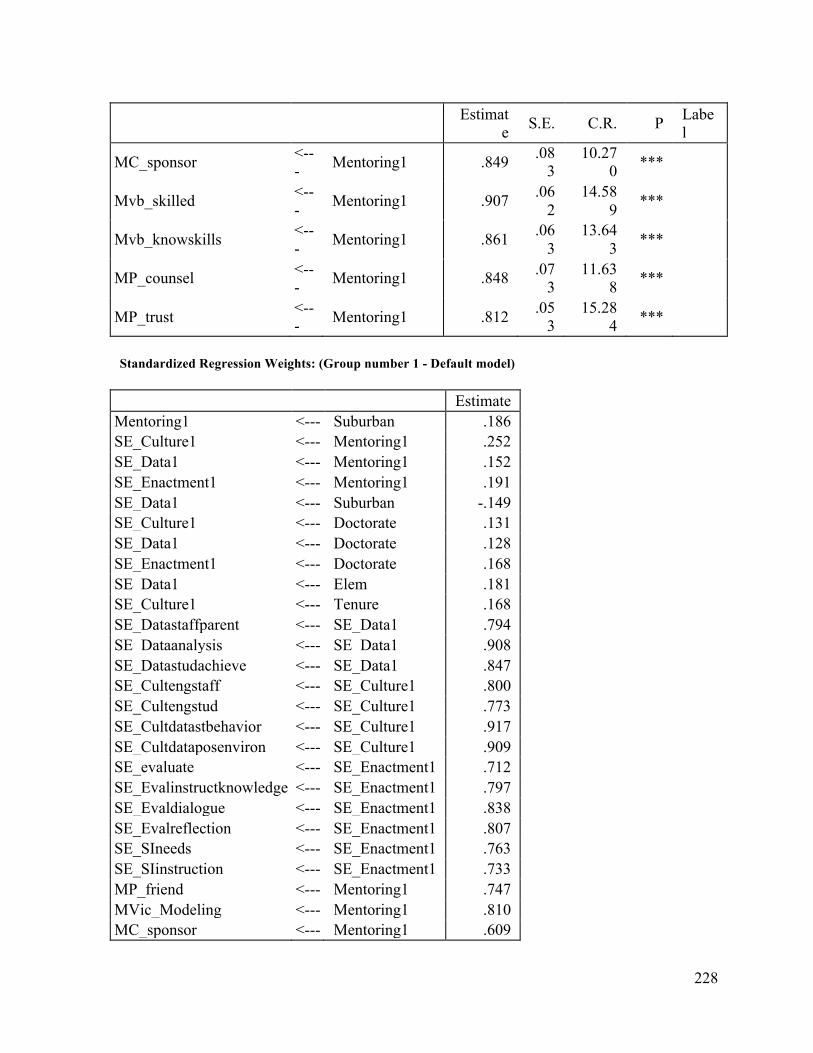
228
Estimat
e S.E. C.R. P Label
MC_sponsor <--- Mentoring1 .849 .08
3 10.27
0 ***
Mvb_skilled <--- Mentoring1 .907 .06
2 14.58
9 ***
Mvb_knowskills <--- Mentoring1 .861 .06
3 13.64
3 ***
MP_counsel <--- Mentoring1 .848 .07
3 11.63
8 ***
MP_trust <--- Mentoring1 .812 .05
3 15.28
4 ***
Standardized Regression Weights: (Group number 1 - Default model)
Estimate Mentoring1 <--- Suburban .186 SE_Culture1 <--- Mentoring1 .252 SE_Data1 <--- Mentoring1 .152 SE_Enactment1 <--- Mentoring1 .191 SE_Data1 <--- Suburban -.149 SE_Culture1 <--- Doctorate .131 SE_Data1 <--- Doctorate .128 SE_Enactment1 <--- Doctorate .168 SE_Data1 <--- Elem .181 SE_Culture1 <--- Tenure .168 SE_Datastaffparent <--- SE_Data1 .794 SE_Dataanalysis <--- SE_Data1 .908 SE_Datastudachieve <--- SE_Data1 .847 SE_Cultengstaff <--- SE_Culture1 .800 SE_Cultengstud <--- SE_Culture1 .773 SE_Cultdatastbehavior <--- SE_Culture1 .917 SE_Cultdataposenviron <--- SE_Culture1 .909 SE_evaluate <--- SE_Enactment1 .712 SE_Evalinstructknowledge <--- SE_Enactment1 .797 SE_Evaldialogue <--- SE_Enactment1 .838 SE_Evalreflection <--- SE_Enactment1 .807 SE_SIneeds <--- SE_Enactment1 .763 SE_SIinstruction <--- SE_Enactment1 .733 MP_friend <--- Mentoring1 .747 MVic_Modeling <--- Mentoring1 .810 MC_sponsor <--- Mentoring1 .609
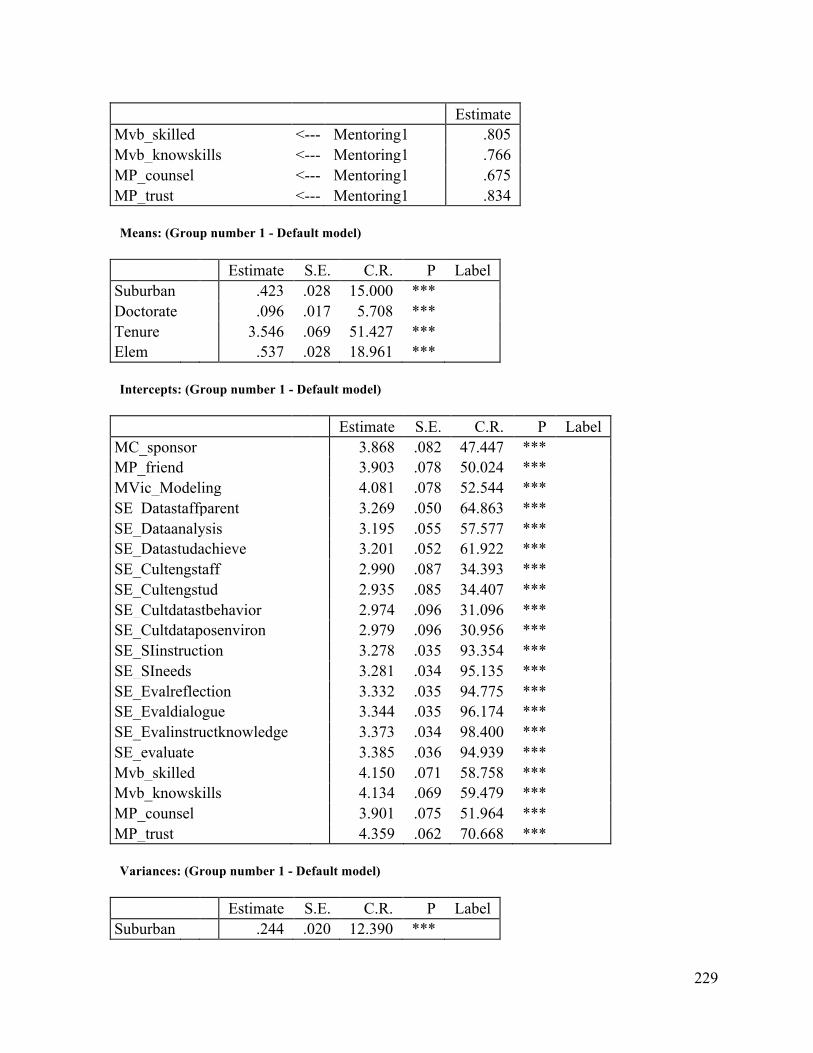
229
Estimate Mvb_skilled <--- Mentoring1 .805 Mvb_knowskills <--- Mentoring1 .766 MP_counsel <--- Mentoring1 .675 MP_trust <--- Mentoring1 .834
Means: (Group number 1 - Default model)
Estimate S.E. C.R. P Label Suburban .423 .028 15.000 *** Doctorate .096 .017 5.708 *** Tenure 3.546 .069 51.427 *** Elem .537 .028 18.961 ***
Intercepts: (Group number 1 - Default model)
Estimate S.E. C.R. P Label MC_sponsor 3.868 .082 47.447 *** MP_friend 3.903 .078 50.024 *** MVic_Modeling 4.081 .078 52.544 *** SE_Datastaffparent 3.269 .050 64.863 *** SE_Dataanalysis 3.195 .055 57.577 *** SE_Datastudachieve 3.201 .052 61.922 *** SE_Cultengstaff 2.990 .087 34.393 *** SE_Cultengstud 2.935 .085 34.407 *** SE_Cultdatastbehavior 2.974 .096 31.096 *** SE_Cultdataposenviron 2.979 .096 30.956 *** SE_SIinstruction 3.278 .035 93.354 *** SE_SIneeds 3.281 .034 95.135 *** SE_Evalreflection 3.332 .035 94.775 *** SE_Evaldialogue 3.344 .035 96.174 *** SE_Evalinstructknowledge 3.373 .034 98.400 *** SE_evaluate 3.385 .036 94.939 *** Mvb_skilled 4.150 .071 58.758 *** Mvb_knowskills 4.134 .069 59.479 *** MP_counsel 3.901 .075 51.964 *** MP_trust 4.359 .062 70.668 ***
Variances: (Group number 1 - Default model)
Estimate S.E. C.R. P Label Suburban .244 .020 12.390 ***

230
Estimate S.E. C.R. P Label D1 .678 .088 7.716 *** Doctorate .088 .007 12.410 *** Elem .249 .020 12.450 *** Tenure 1.465 .118 12.410 *** D2 .257 .025 10.098 *** D4 .213 .026 8.267 *** D3 .270 .028 9.588 *** e20 .063 .012 5.232 *** e22 .096 .012 8.100 *** e15 .127 .012 10.726 *** e16 .145 .013 11.021 *** e17 .055 .008 7.028 *** e18 .061 .008 7.484 *** e28 .141 .013 10.611 *** e32 .180 .016 11.101 *** e31 .121 .012 10.104 *** e29 .121 .012 9.964 *** e5 .501 .050 10.005 *** e7 .369 .040 9.270 *** e3 .858 .079 10.806 *** e40 .314 .033 9.387 *** e41 .367 .037 9.860 *** e42 .604 .057 10.545 *** e43 .203 .023 8.881 *** e19 .127 .013 9.724 *** e30 .101 .011 9.319 *** e23 .163 .015 10.886 ***
Minimization History (Default model)
Iteration
Negative eigenvalu
es
Condition #
Smallest eigenval
ue
Diameter F NTrie
s Ratio
0 e 9 -.767 9999.000
4138.998 0 9999.00
0
1 e 8 -.329 3.814 2023.200 20 .333
2 e* 4 -.724 1.245 1311.10
4 5 .714
3 e 1 -.061 .559 1001.514 5 .859
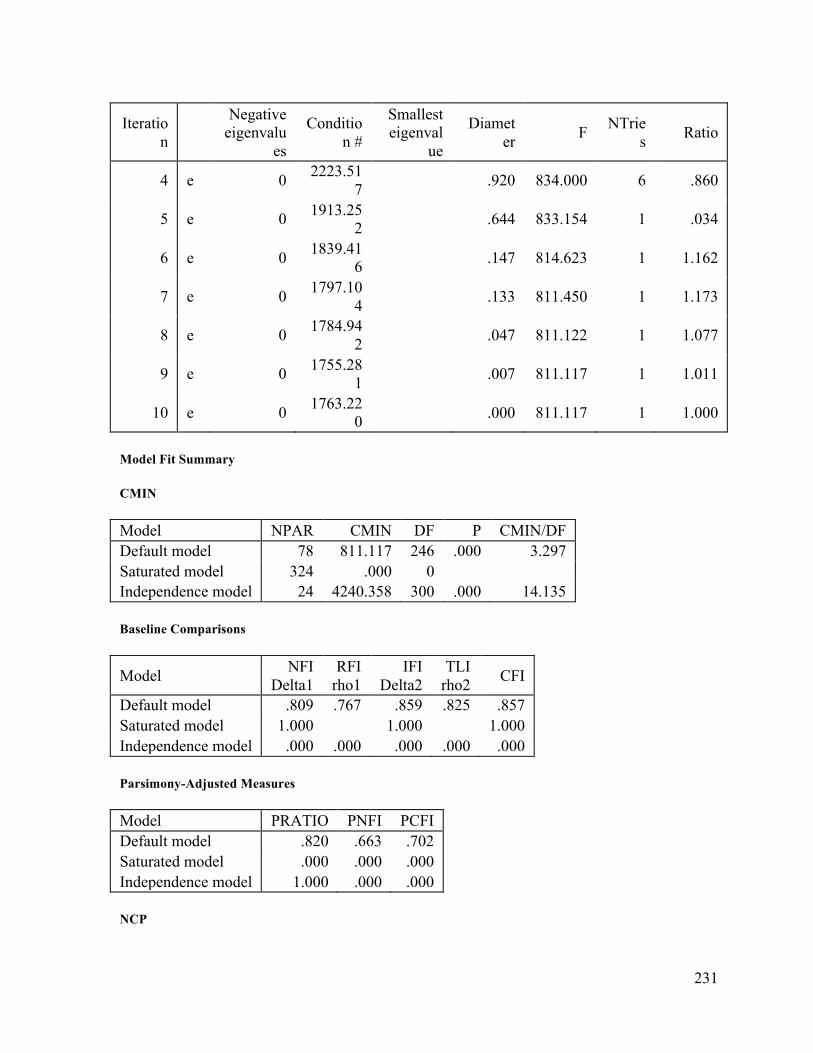
231
Iteration
Negative eigenvalu
es
Condition #
Smallest eigenval
ue
Diameter F NTrie
s Ratio
4 e 0 2223.517 .920 834.000 6 .860
5 e 0 1913.252 .644 833.154 1 .034
6 e 0 1839.416 .147 814.623 1 1.162
7 e 0 1797.104 .133 811.450 1 1.173
8 e 0 1784.942 .047 811.122 1 1.077
9 e 0 1755.281 .007 811.117 1 1.011
10 e 0 1763.220 .000 811.117 1 1.000
Model Fit Summary
CMIN
Model NPAR CMIN DF P CMIN/DF Default model 78 811.117 246 .000 3.297 Saturated model 324 .000 0 Independence model 24 4240.358 300 .000 14.135
Baseline Comparisons
Model NFI Delta1
RFI rho1
IFI Delta2
TLI rho2 CFI
Default model .809 .767 .859 .825 .857 Saturated model 1.000 1.000 1.000 Independence model .000 .000 .000 .000 .000
Parsimony-Adjusted Measures
Model PRATIO PNFI PCFI Default model .820 .663 .702 Saturated model .000 .000 .000 Independence model 1.000 .000 .000
NCP
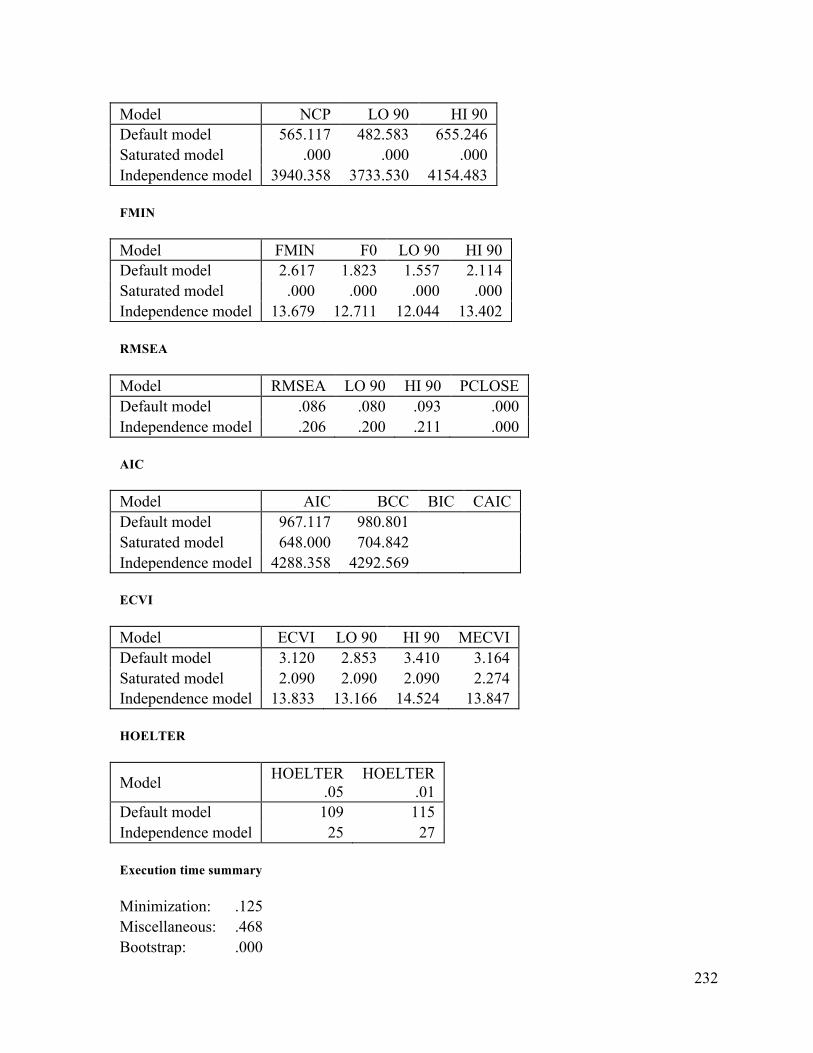
232
Model NCP LO 90 HI 90 Default model 565.117 482.583 655.246 Saturated model .000 .000 .000 Independence model 3940.358 3733.530 4154.483
FMIN
Model FMIN F0 LO 90 HI 90 Default model 2.617 1.823 1.557 2.114 Saturated model .000 .000 .000 .000 Independence model 13.679 12.711 12.044 13.402
RMSEA
Model RMSEA LO 90 HI 90 PCLOSE Default model .086 .080 .093 .000 Independence model .206 .200 .211 .000
AIC
Model AIC BCC BIC CAIC Default model 967.117 980.801 Saturated model 648.000 704.842 Independence model 4288.358 4292.569
ECVI
Model ECVI LO 90 HI 90 MECVI Default model 3.120 2.853 3.410 3.164 Saturated model 2.090 2.090 2.090 2.274 Independence model 13.833 13.166 14.524 13.847
HOELTER
Model HOELTER .05
HOELTER .01
Default model 109 115 Independence model 25 27
Execution time summary
Minimization: .125 Miscellaneous: .468 Bootstrap: .000

233
Total: .593

234