seltzer-grant, malcolm and giussani, riccardo and siew, w
TRANSCRIPT

Seltzer-Grant, Malcolm and Giussani, Riccardo and Siew, W H and Corr,
Edward and Hu, Xiao and Zhu, Minan and Judd, Martin and Reid, Alistair
and Neumann, Alex and Awodola, Joseph (2015) Laboratory and field
partial discharge measurement in HVDC power cables. In: JICABLE
2015, 2015-06-21 - 2015-06-25, Palais des Congrès de Versailles. ,
This version is available at http://strathprints.strath.ac.uk/60175/
Strathprints is designed to allow users to access the research output of the University of
Strathclyde. Unless otherwise explicitly stated on the manuscript, Copyright © and Moral Rights
for the papers on this site are retained by the individual authors and/or other copyright owners.
Please check the manuscript for details of any other licences that may have been applied. You
may not engage in further distribution of the material for any profitmaking activities or any
commercial gain. You may freely distribute both the url (http://strathprints.strath.ac.uk/) and the
content of this paper for research or private study, educational, or not-for-profit purposes without
prior permission or charge.
Any correspondence concerning this service should be sent to the Strathprints administrator:
The Strathprints institutional repository (http://strathprints.strath.ac.uk) is a digital archive of University of Strathclyde research
outputs. It has been developed to disseminate open access research outputs, expose data about those outputs, and enable the
management and persistent access to Strathclyde's intellectual output.
brought to you by COREView metadata, citation and similar papers at core.ac.uk
provided by University of Strathclyde Institutional Repository
Laboratory and Field Partial Discharge Measurement in HVDC Power Cables
Malcolm SELTZER-GRANT, Riccardo GIUSSANI ; HVPD Ltd, Manchester, United Kingdom,
[email protected], [email protected]
W H SIEW, Edward CORR, Xiao HU, Minan ZHU; University of Strathclyde, Glasgow, United Kingdom, [email protected], [email protected], [email protected], [email protected]
Martin JUDD, High Frequency Diagnostics and Engineering Ltd, Glasgow, United Kingdom, [email protected]
Alistair REID, Glasgow Caledonian University, Glasgow, United Kingdom, [email protected]
Alex NEUMANN, ORE Catapult, Blythe, United Kingdom, [email protected]
Joseph AWODOLA, Mutual Energy, [email protected]
ABSTRACT
A range of experimental and field measurements of partial discharge (PD) activity under high voltage direct current (HVDC) conditions have been conducted with the goal of developing effective monitoring techniques for PD in HVDC cables and ancillary equipment, particularly in offshore renewable energy HVDC grid installations. Laboratory measurements on insulation test objects and cross linked polyethylene (XLPE) cable samples have been conducted to better understand the characteristics of PD activity under direct current (DC) stress in comparison with AC. In addition, long-term PD measurements carried out at both an HVDC cable aging laboratory and an in-service HVDC interconnector circuit are presented together with a description of the monitoring system architecture.
KEYWORDS
HVDC, cables, partial discharge, on-line PD monitoring, OLPD, offshore, renewables, electricity transmission.
INTRODUCTION
Monitoring for HVDC Transmission Cables
HVDC technology for transmission of electrical power is developing rapidly. Applications in which HVDC excels include the transmission of power over long distances on land (typically from remote renewable energy sources to urban load centres) and as a key enabling technology for international subsea supergrids. For example, to achieve the scale and capacity required to make offshore wind renewable energy more affordable, large OEMs are in the process of developing and proving the technical capability of new HVDC hardware required to operate at these higher voltages in the offshore environment at distances much further from shore (100 – 500 km) than the present generation of HVAC systems (typically 10 – 50 km).
The technologies required to form the backbone of this infrastructure, including HV AC/DC power converters, long HVDC XLPE/Paper insulated subsea cables and interconnectors, are relatively new and untried over the long term in the offshore environment. The cables are distributed sub-sea components in which, should a failure occur, it would be necessary to locate the fault and then to raise the cable from the seabed for repair. This involves onerous logistical challenges and major expense due to the fact that it is difficult to accurately „pinpoint‟ the location of any subsea fault and hire a lift/repair vessel needed to make the repair. A preferable situation is to
avoid „blindness‟ with regard to the condition of these critical cables through an ability to locate incipient insulation faults, which are in most cases preceded by partial discharge (PD) activity in the cable. Such systems provide the operator with an early warning of cable degradation to support preventative maintenance interventions and avoid unplanned outages / downtime. Effective condition monitoring systems, including PD monitoring, therefore have the potential to improve system availability and reduce the ownership and operating costs of these key assets. This paper outlines a number of research activities and measurement campaigns that are being carried out in order to advance PD monitoring for offshore HVDC cables and equipment.
PD under HVDC Conditions
Partial discharge phenomena under DC conditions have generally received less attention than AC PD until recently. A review of previous research in this field can be found in [1], which includes investigations into the physics of PD at DC voltages and practical measurements in which PD events were characterised by their time of occurrence and magnitude, leading to possible classification methods for PD under DC conditions.
Some early research carried out in 1960 [2] analysed the PD behaviour of dielectrics under DC stress through both calculation and accelerated aging to assess the suitability of various materials for use in HVDC cables. More recent research has demonstrated that PD under DC conditions can contribute to degradation [3] and showed that the PD repetition rate tends to increase with conductivity of the insulation. This is manifest through higher PD repetition rate at high operating temperatures, for example. Studies of PD activity in lapped polypropylene film insulation [4] have shown that under DC excitation PD activity at butt gaps in the lapped insulation increased with the temperature and the applied electric stress.
Testing of mass impregnated cables under DC load cycle conditions [5] led to a suggestion that the repetition rate of the PD activity as a function of discharge magnitude could be used to eliminate poor cables. Similarly, investigations of PD in mass impregnated non-draining (MIND) cables [6] during Cigre type testing [7] studied the repetition rate of PD activity as a function of time during the “current off” stage of the type test for warm and cold cables. The main findings were that the number of defect sites increased as a cable cooled and that the time to reach the maximum in the repetition rate was longer for a warm cable than for a
cool cable.
In this paper, we present some laboratory and field-based investigations that are being carried out to advance the practical application of PD diagnostics to HVDC cable assets. This includes testing defective insulation samples, trialling an online PD monitoring system under DC conditions in a controlled laboratory environment and reporting on both the installation and operational experience gained with a monitoring system at an in-service HVDC converter station.
EXPERIMENTAL INVESTIGATIONS OF PD UNDER DC STRESS
Under the influence of AC electric fields (usually 50 or 60 Hz), PD generally occurs in every half cycle of the applied voltage. In contrast, under DC stress PD tends to occur infrequently (or not at all) but is more likely to become evident during voltage changes, particularly when the voltage is initially applied or removed. The repetition rate of PD under DC conditions is influenced considerably by the energising time, temperature, applied stress and ripple components superposed on DC voltages [8]. However, individual PD pulses are essentially the same as those that occur with AC voltages so similar detection techniques can be utilised for DC monitoring applications. Since the frequency of PD occurrence with DC is usually several orders of magnitude lower than with AC, correspondingly longer recording times are employed (for example, 30 – 60 minutes is not unusual). Consequently, interference that might be regarded as relatively sparse and therefore tolerable in the context of an AC PD measurement can dominate the captured data for DC PD. Anti-interference measures therefore become more important in PD testing at DC to distinguish PD pulses from interference pulses [1,8].
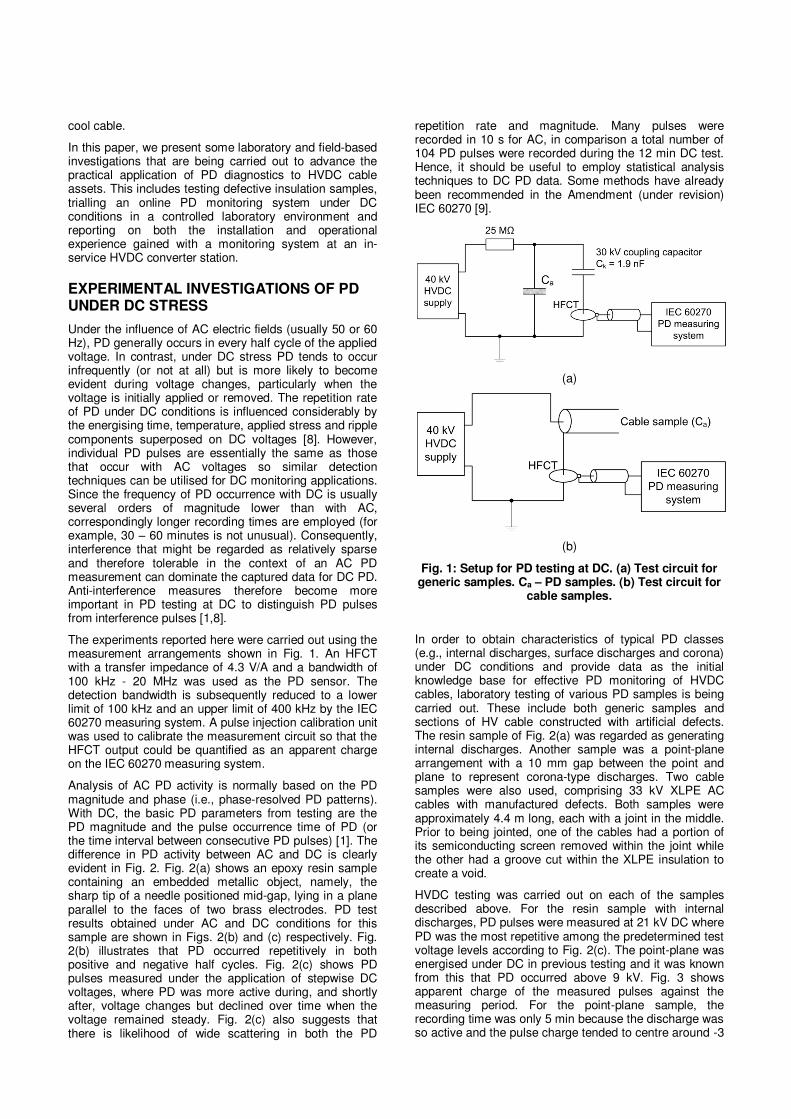
The experiments reported here were carried out using the measurement arrangements shown in Fig. 1. An HFCT with a transfer impedance of 4.3 V/A and a bandwidth of 100 kHz - 20 MHz was used as the PD sensor. The detection bandwidth is subsequently reduced to a lower limit of 100 kHz and an upper limit of 400 kHz by the IEC 60270 measuring system. A pulse injection calibration unit was used to calibrate the measurement circuit so that the HFCT output could be quantified as an apparent charge on the IEC 60270 measuring system.
Analysis of AC PD activity is normally based on the PD magnitude and phase (i.e., phase-resolved PD patterns). With DC, the basic PD parameters from testing are the PD magnitude and the pulse occurrence time of PD (or the time interval between consecutive PD pulses) [1]. The difference in PD activity between AC and DC is clearly evident in Fig. 2. Fig. 2(a) shows an epoxy resin sample containing an embedded metallic object, namely, the sharp tip of a needle positioned mid-gap, lying in a plane parallel to the faces of two brass electrodes. PD test results obtained under AC and DC conditions for this sample are shown in Figs. 2(b) and (c) respectively. Fig. 2(b) illustrates that PD occurred repetitively in both positive and negative half cycles. Fig. 2(c) shows PD pulses measured under the application of stepwise DC voltages, where PD was more active during, and shortly after, voltage changes but declined over time when the voltage remained steady. Fig. 2(c) also suggests that there is likelihood of wide scattering in both the PD
repetition rate and magnitude. Many pulses were recorded in 10 s for AC, in comparison a total number of 104 PD pulses were recorded during the 12 min DC test. Hence, it should be useful to employ statistical analysis techniques to DC PD data. Some methods have already been recommended in the Amendment (under revision) IEC 60270 [9].
(a)
(b)
Fig. 1: Setup for PD testing at DC. (a) Test circuit for generic samples. Ca – PD samples. (b) Test circuit for
cable samples.
In order to obtain characteristics of typical PD classes (e.g., internal discharges, surface discharges and corona) under DC conditions and provide data as the initial knowledge base for effective PD monitoring of HVDC cables, laboratory testing of various PD samples is being carried out. These include both generic samples and sections of HV cable constructed with artificial defects. The resin sample of Fig. 2(a) was regarded as generating internal discharges. Another sample was a point-plane arrangement with a 10 mm gap between the point and plane to represent corona-type discharges. Two cable samples were also used, comprising 33 kV XLPE AC cables with manufactured defects. Both samples were approximately 4.4 m long, each with a joint in the middle. Prior to being jointed, one of the cables had a portion of its semiconducting screen removed within the joint while the other had a groove cut within the XLPE insulation to create a void.
HVDC testing was carried out on each of the samples described above. For the resin sample with internal discharges, PD pulses were measured at 21 kV DC where PD was the most repetitive among the predetermined test voltage levels according to Fig. 2(c). The point-plane was energised under DC in previous testing and it was known from this that PD occurred above 9 kV. Fig. 3 shows apparent charge of the measured pulses against the measuring period. For the point-plane sample, the recording time was only 5 min because the discharge was so active and the pulse charge tended to centre around -3

nC. Statistical analysis methods suggested in the Amendment (under revision) to IEC 60270 [9] were performed on the measurement results. The analysis outcome in Fig. 4(a) and (c) for the resin sample is comparable to that reported in [1] in that, as the discharge magnitude increases, the probability of occurrence decreases exponentially for internal discharges. Fig. 4(d) shows that the discharges from the point-plane sample had a narrow distribution of discharge magnitude, which also agrees with the observation of corona in [1].
Fig. 2: Comparing PD under AC and DC voltages for an epoxy resin sample with a sharp embedded
metallic inclusion. (a) Resin sample containing an embedded metallic object. (b) PD pulse pattern
measured with 50 Hz AC (10.8 kV rms for 10 s). (c) PD pulses under the application of DC voltage steps.
Test results for the cable samples are shown in Fig. 5. The applied voltage was increased in a steady manner (e.g., at an average rate of 60 V/s between 30-40 kV) aiming to avoid the effect that sudden changes in voltage might have on the PD behaviour. For both cable samples, nearly all the measured pulses were negative on increasing the voltage and the pulses became positive when the voltage was decreased and continued to occur after the voltage was decreased, which accords well with the descriptions in [8]. However, PD activity ceased in both the samples once the applied voltage had stabilised, at least up to 40 kV.
Fig. 3: PD test results of defect samples energised with DC. (a) Resin with metallic inclusion. (b) Point-
plane arrangement.
Fig. 4: PD analysis results for the resin (left) and point-plane (right) samples. (a) and (b) are counts of
PD pulses exceeding certain charge levels. (c) and (d) are counts of PD pulses falling into certain charge
ranges.
(b) (a)
(d) (c)
(b)
(a)
Vac
PD pulses
(b)
(c) PD pulses
Vdc
(a)

Fig. 5: PD testing of defective cables subjected to ramped DC excitation. (a) Cut on cable insulation
screen. (b) Void in cable insulation.
INFLUENCE OF SUPERIMPOSED RIPPLE
It is proposed that existing AC PD analysis techniques will retain a relevance to DC monitoring applications in certain circumstances. For instance, the effects of Voltage Source Converter (VSC) ripple are being analysed in the laboratory using solid dielectric insulation samples containing voids. Harmonics have been superimposed on the DC voltage with harmonic numbers and relative amplitudes corresponding to those generated by an ideal 6-pulse converter under no-load [10], which are listed in Table 1. Table 1: Theoretical harmonic frequency content and
amplitudes relative to the DC voltage for a 6-pulse converter fed at 50 Hz [10].
No-Load DC DC 1.0000 6th 300 Hz 0.0404 12th 600 Hz 0.0099
18th 900 Hz 0.0044 24th 1200 Hz 0.0025 A previous study [11] investigated the effect of DC applied voltage with a superimposed AC sinusoid at power frequency with amplitude between 3% and 7% of the DC voltage. The cited study examined PD from bounded cavities using conventional IEC60270 measurements, and showed that discharge repetition rates decreased from about 30 per minute to around 10 per minute over a 4.5 hour period. As the AC voltage component amplitudes increased, so did the PD repetition rate and PD amplitude. Initial investigation on the effect of voltage harmonics utilised an HFCT sensor for PD measurements, having a
bandwidth of 200kHz-19 MHz and a sensitivity of 4.3 . A LeCroy Wavepro 7300 oscilloscope, with input impedance matched to that the PD sensor cable, was used to capture the data shown in Fig. 6 at a sampling rate of 250 MSa/s. Results suggest high initial repetition rates than those reported in the cited study on initial activation of the sample. Significantly, features correlated to the phase of the dominant harmonic appear in the discharge pattern
that may provide an additional metrics for PD classification. Fig. 6 shows 2 cycles of the dominant 300 Hz harmonic that was superimposed on the HVDC input along with the less visible 12
th, 18
th and 24
th harmonics.
The data shown was recorded immediately after application of the test voltage to the sample, with the high discharge rates persisting for around 1 min, then decreasing noticeably thereafter.
Fig. 6: VSC ‘ripple’ applied to artificial sample containing a 3 mm void and corresponding output from the HFCT PD sensor (harmonic amplitude has been magnified somewhat to emphasise the phase
correlation of the PD pulses).
Given the apparent phase-dependence of this PD data, it is suggested, based on these preliminary results, that the 0 to 5 min epoch immediately after the application or removal of voltage on the DC cable may afford an opportunity to acquire diagnostic data that will allow conventional PD rules to be applied in a suitably adapted form, yielding a better understanding of the type and severity of the defect in an in-service HVDC cable.
FIELD TRIALS
Cable Aging Laboratory
A PD monitoring system was installed on a ±200kV HVDC cable loom at a cable aging laboratory where cables are undergoing a sequence of prequalification tests as per Cigre TB 496 [8]. The cable loom consists of XLPE insulated cable, two joints and two terminations. Equipment for space charge measurement using the PEA technique is also installed for a separate project. PD sensors have been installed at the cable joints and terminations.
A newly developed PD monitoring system has been installed which acquires data synchronously on all of the sensors at 100MS/s sampling rate and 14 bit vertical resolution. A schematic of the system is shown in Fig. 7.
The signals are being continuously captured from all sensors; an example trend is shown in Fig 8. Some interference was detected from a PEA measurement as highlighted in red. There was also some corona detected which was identified as being from some sharp edges on some of the high voltage connections.
PD pulses
Voltage
PD pulses
Voltage
(a)
(b)
Applied Voltage
PD Pulses (HFCT)
PD
Pu
lse A
mplit
ude
(m
V)
20
40
60
0
-20
-40
-60
80
-1.5
-3.0
-4.5
0
1.5
3.0
4.5
6.0
0
Time (ms) 1.0 2.0 3.0 4.0 5.0 6.0 7.0 8.0

Fig. 7: Sensor Installation Schematic
Fig. 8: PD Monitoring trend showing pulses from PEA system (red highlight) and corona discharges (green highlight)
Fig. 9: Cable terminations showing source of corona discharge
HVDC Interconnector
In order to better understand PD measurements in a field environment a continuous monitoring system has been installed on an operating HVDC cable interconnector. The system is a monopole with LCC convertor stations. The cable is paper-insulated with a concentric return conductor. The cable operates at ±250kV with ±1kV on the return conductor.
HFCT and coupling capacitor sensors were installed on the return conductor and connected to a monitoring system similar to that described in the previous section.
The main signals of interest detected are form the power convertor station. These resulted in large impulses up to several hundred mV in amplitude. When measurements are synchronised to the AC mains, there is a clear correlation to the power convertor valve switching as shown in Fig 10. The phase correlation also allows the signals to be more easily discounted from the PD measurements.
Fig. 10: Data collected showing interference from convertor station
CONCLUSIONS AND FUTURE WORK
The paper has presented laboratory and field investigator work for making PD measurements on HVDC cables. Laboratory measurements have focussed on gaining a better understanding of PD occurrence under DC stress in comparison to AC and the behaviour of different defects under DC stress. Observing the pulse count distribution shows different patterns for different types of defect. Measurements with superimposed rippled and the field measurements have highlighted the relevance of existing AC PD measurement techniques with regards to both identification of some occurrences of PD and also for discounting noise from the power convertor station. Further work is being undertaken to quantify discharge rates and determine harmonic phase correlations for additional insulation defects. Higher test voltages will be used in future laboratory work along with testing more generic PD samples representative of different PD classes to further investigate PD phenomena under DC conditions as well as contribute to the reference database for the HVDC PD monitoring systems.
Sharp edges generating Corona

Acknowledgments
This work was carried out in the context of the project “On-Line HVDC Cable Monitor Proposal (OLPD-HVDC) for Offshore Wind Component Technologies Development and Demonstration Scheme” supported by the UK Government Department of Energy & Climate Change. The project has been supported by Scottish Power Energy Networks through NIA funding. The authors wish to acknowledge the valuable practical assistance and advice provided by Dr A. Tzimas and Mr G. Lucas of ALSTOM Grid UK.
REFERENCES
[1] P.H.F. Morshuis, J.J. Smit, 2005, “Partial discharges at DC voltage: their mechanism, detection and analysis,” IEEE Transactions on Dielectric and Electrical Insulation, Vol. 12, No. 2, 328-340
[2] E.C. Rogers, D.J. Skipper, 1960, “Gaseous discharge phenomena in high voltage DC cable dielectrics”, The Proceedings of the Institution of Electrical Engineers, Vol. 107 part A, No. 33, 241-251
[3] P. Morshuis, A. Cavallini, D. Fabiani, G.C. Montanari, C. Azcarraga, 2015, “Stress Conditions in HVDC Equipment and Routes to in service failure”, IEEE Transactions on Dielectrics and Electrical Insulation Vol. 22, No. 1, 81-91
[4] E. Ilstad, T. Haave, 2001, “Conduction and Partial Discharge Activity in HVDC Cable Insulation of Lapped Polypropylene Films”, Proc. IEEE 7th International Conference on Solid Dielectrics, 137-140
[5] M.J.P. Jeroense, F.H. Kreuger, 1996, “Partial Discharge Measurements on a High Voltage Direct Current Mass Impregnated Paper Cable”, Proc. IEEE International Symposium on Electrical Insulation, Vol. 1, 134-137
[6] M.J.P. Jeroense, M. Bergkvist, P.Nordberg, 1999, “Partial Discharges in High Voltage Direct Current Mass-Impregnated Cables”, Proc. 11
th International
Symposium on High Voltage Engineering, Vol. 5, 53-57
[7] CIGRE Working Group 21-02, 1980, “Recommendations for Tests of Power Transmission DC Cables for a Rated Voltage up to 600 kV”, Electra No. 72, 105-114
[8] R. Bartnikas, E.J. McMahon, 1979, Engineering Dielectrics Volume I: Corona Measurement and Interpretation, ASTM, 430-442
[9] W. Hauschild, E. Lemke, 2014, High-Voltage Test and Measuring Techniques, Springer, 281-283
[10] Alstom Grid Ltd, 2010, HVDC for Beginners and Beyond. Systems-L4-HVDC Basics -2165-V2-EN
[11] P.K. Olsen, F. Mauseth, E. Ildstad, 2014, “The effect of DC superimposed AC voltage on partial discharges in dielectric bounded cavities”, Proc. International Conference on High Voltage Engineering and Application (ICHVE), Poznan, Poland, 8-11 Sept.
[8] Cigre WG B1.32, 2012, “Recommendations for testing DC extruded cable systems for power transmission at a rated voltage up to 500 kV”, Technical Brochure 496