semi-annual report april 30, 2018 - sbhfunds.com · segall bryant & hamill funds each a series...
TRANSCRIPT

Segall Bryant & Hamill Emerging Markets Fund (Class A: SBHEX) (Class I: SBEMX)
Segall Bryant & Hamill International Small Cap Fund (Class A: SBHSX) (Class I: SBSIX)
SEMI-ANNUAL REPORT April 30, 2018

Segall Bryant & Hamill Funds Each a series of Investment Managers Series Trust
This report and the financial statements contained herein are provided for the general information of the shareholders of the Segall Bryant & Hamill Funds. This report is not authorized for distribution to prospective investors in the Funds unless preceded or accompanied by an effective prospectus.
www.sbhfunds.com
Table of Contents Segall Bryant & Hamill Emerging Markets Fund
Schedule of Investments .......................................................................................................................... 1
Statement of Assets and Liabilities ......................................................................................................... 15
Statement of Operations ........................................................................................................................ 16
Statements of Changes in Net Assets ..................................................................................................... 17
Financial Highlights ................................................................................................................................. 18
Segall Bryant & Hamill International Small Cap Fund
Schedule of Investments ......................................................................................................................... 20
Statement of Assets and Liabilities ......................................................................................................... 35
Statement of Operations ........................................................................................................................ 36
Statements of Changes in Net Assets ..................................................................................................... 37
Financial Highlights ................................................................................................................................. 38
Notes to Financial Statements .................................................................................................................... 40
Expense Examples ....................................................................................................................................... 52

Segall Bryant & Hamill Emerging Markets Fund SCHEDULE OF INVESTMENTS As of April 30, 2018 (Unaudited)
Number of Shares Value __________ ____________
COMMON STOCKS – 96.7%
BRAZIL – 5.6%
8,140 Banco Bradesco S.A. - ADR $ 79,772
22,000 Banestes S.A. Banco do Estado do Espirito Santo 25,120
9,700 CCR S.A. 33,116
7,900 Cia de Saneamento Basico do Estado de Sao Paulo - ADR 78,842
6,000 Cia de Saneamento de Minas Gerais-COPASA 86,321
5,600 Cosan S.A. Industria e Comercio 63,590
5,400 EcoRodovias Infraestrutura e Logistica S.A. 15,337
4,400 Fibria Celulose S.A. - ADR 86,064
22,200 Fras-Le S.A. 34,791
14,100 Itau Unibanco Holding S.A. - ADR 204,873
16,317 Itausa - Investimentos Itau S.A. 64,976
49,400 JBS S.A. 123,387
5,900 Petroleo Brasileiro S.A. - ADR * 83,131
45,500 QGEP Participacoes S.A. 165,858
12,700 Qualicorp S.A. 88,275
25,600 SLC Agricola S.A. 326,796
13,400 Tupy S.A. 72,294
33,974 Vale S.A. - ADR 470,200
26,100 Via Varejo S.A. 60,422 ____________ 2,163,165 ____________ CHILE – 1.2%
87,831 AES Gener S.A. 24,545
7,412 AntarChile S.A. 134,220
9,207 Enersis Chile S.A. - ADR 57,268
80,000 Grupo Security S.A. 40,694
1,330 Inversiones La Construccion S.A. 26,439
34,306 Salfacorp S.A. 65,467
239,282 Sociedad Matriz SAAM S.A. 24,909
103,232 Socovesa S.A. 69,174 ____________ 442,716 ____________ CHINA – 29.7%
24,000 Agile Property Holdings Ltd. 47,342
319,000 Agricultural Bank of China Ltd. - Class H 179,856
6,400 Alibaba Group Holding Ltd. - ADR * 1,142,656
13,500 Anhui Conch Cement Co., Ltd. - Class H 84,260
24,000 Anhui Expressway Co., Ltd. - Class H 17,743
282,000 AVIC International Holdings Ltd. - Class H 190,944
49,000 BAIC Motor Corp. Ltd. - Class H 1 47,299
500 Baidu, Inc. - ADR * 125,450
681,000 Bank of China Ltd. - Class H 369,666
194,000 Bank of Communications Co., Ltd. - Class H 158,746
124,000 Beijing Jingneng Clean Energy Co., Ltd. - Class H 31,155
88,000 BYD Electronic International Co., Ltd. 134,182
1

Segall Bryant & Hamill Emerging Markets Fund SCHEDULE OF INVESTMENTS – Continued As of April 30, 2018 (Unaudited)
Number of Shares Value __________ ____________
COMMON STOCKS (Continued) CHINA (Continued) 130,000 China Aoyuan Property Group Ltd. $ 104,435
38,000 China Communications Services Corp. Ltd. - Class H 23,857
697,000 China Construction Bank Corp. - Class H 730,213
839,000 China Datang Corp. Renewable Power Co., Ltd. - Class H 173,408
412,000 China Dongxiang Group Co., Ltd. 75,411
112,000 China Everbright Ltd. 246,462
18,000 China Evergrande Group * 57,016
16,000 China Hongqiao Group Ltd. 17,405
24 China Literature Ltd. * 1 193
68,000 China Lumena New Materials Corp. * 2 -
29,000 China Machinery Engineering Corp. - Class H 16,848
6,000 China Metal Recycling Holdings Ltd. * 2 -
49,500 China Mobile Ltd. 471,558
122,000 China Petroleum & Chemical Corp. - Class H 118,810
18,000 China Railway Construction Corp. Ltd. - Class H 21,316
88,000 China Resources Cement Holdings Ltd. 92,318
65,500 China Shenhua Energy Co., Ltd. - Class H 160,661
229,000 China Suntien Green Energy Corp. Ltd. - Class H 76,566
12,600 China Vanke Co., Ltd. - Class H 52,074
63,500 China Yongda Automobiles Services Holdings Ltd. 72,568
2,400 China Yuchai International Ltd. 49,944
178,000 Chongqing Machinery & Electric Co., Ltd. - Class H 17,154
48,000 CIFI Holdings Group Co., Ltd. 37,797
92,000 CNOOC Ltd. 155,637
102,000 Dah Chong Hong Holdings Ltd. 54,178
32,000 Future Land Development Holdings Ltd. 26,498
302,000 GCL-Poly Energy Holdings Ltd. * 37,354
156,000 Guangzhou Automobile Group Co., Ltd. - Class H 285,746
26,000 Guangzhou R&F Properties Co., Ltd. - Class H 61,817
578,000 Industrial & Commercial Bank of China Ltd. - Class H 507,413
36,500 Kingboard Chemical Holdings Ltd. 148,492
133,000 Kingboard Laminates Holdings Ltd. 177,274
20,000 Logan Property Holdings Co., Ltd. 29,323
50,000 Lonking Holdings Ltd. 22,721
30,000 Nine Dragons Paper Holdings Ltd. 44,743
100,000 Overseas Chinese Town Asia Holdings Ltd. 61,066
166,000 PICC Property & Casualty Co., Ltd. - Class H 297,166
10,000 Ping An Insurance Group Co. of China Ltd. - Class H 97,713
36,000 Qingdao Port International Co., Ltd. - Class H 1 29,576
59,000 Qinhuangdao Port Co., Ltd. - Class H 15,621
28,000 Shandong Weigao Group Medical Polymer Co., Ltd. - Class H 17,207
20,000 Shandong Xinhua Pharmaceutical Co., Ltd. - Class H 20,365
238,000 Shanghai Prime Machinery Co., Ltd. - Class H 39,327
66,000 Shengjing Bank Co., Ltd. - Class H 1 44,092
2

Segall Bryant & Hamill Emerging Markets Fund SCHEDULE OF INVESTMENTS – Continued As of April 30, 2018 (Unaudited)
Number of Shares Value __________ ____________
COMMON STOCKS (Continued) CHINA (Continued) 28,000 Shenzhen International Holdings Ltd. $ 61,177
37,000 Shimao Property Holdings Ltd. 97,867
66,000 Shougang Fushan Resources Group Ltd. 16,179
695,000 Sihuan Pharmaceutical Holdings Group Ltd. 167,970
129,500 Sino-Ocean Group Holding Ltd. 89,919
36,000 Sinopec Shanghai Petrochemical Co., Ltd. - Class H 23,904
3,600 Sinopharm Group Co., Ltd. - Class H 15,182
463,000 Sinosoft Technology Group Ltd. 193,891
106,500 Sinotrans Shipping Ltd. 27,577
108,000 Sinotruk Hong Kong Ltd. 126,535
25,000 Spring Real Estate Investment Trust - REIT 10,384
689,000 Springland International Holdings Ltd. 194,014
34,700 Tencent Holdings Ltd. 1,705,943
30,500 Texhong Textile Group Ltd. 42,492
70,000 Tianneng Power International Ltd. 101,002
430,000 Time Watch Investments Ltd. 56,978
20,000 Tingyi Cayman Islands Holding Corp. 37,917
88,000 Tomson Group Ltd. 43,855
53,000 Tonly Electronics Holdings Ltd. 53,751
80,000 Weichai Power Co., Ltd. - Class H 92,612
140,000 Weiqiao Textile Co. - Class H 67,650
468,000 Xinyi Solar Holdings Ltd. 213,247
76,000 Yanzhou Coal Mining Co., Ltd. - Class H 95,100
28,000 Yuzhou Properties Co., Ltd. 20,368
4,200 YY, Inc. - ADR * 404,838
74,000 Zhongsheng Group Holdings Ltd. 212,132 ____________ 11,491,126 ____________ COLOMBIA – 0.8%
2,200 Avianca Holdings S.A. - ADR 17,974
4,640 Banco de Bogota S.A. 114,804
4,724 Bancolombia S.A. 55,835
500 Bancolombia S.A. - ADR 23,830
4,500 Ecopetrol S.A. - ADR 99,360 ____________ 311,803 ____________ CZECH REPUBLIC – 0.1%
10,871 Moneta Money Bank A.S. 1 39,075 ____________ EGYPT – 0.4%
8,826 ElSewedy Electric Co. 125,714
28,493 Telecom Egypt Co. 25,999 ____________ 151,713 ____________ GREECE – 0.4%
2,693 Bank of Greece 49,106
3

Segall Bryant & Hamill Emerging Markets Fund SCHEDULE OF INVESTMENTS – Continued As of April 30, 2018 (Unaudited)
Number of Shares Value __________ ____________
COMMON STOCKS (Continued) GREECE (Continued) 2,307 Motor Oil Hellas Corinth Refineries S.A. $ 54,968
2,310 Mytilineos Holdings S.A. * 27,854
7,232 Public Power Corp. S.A. * 23,858 ____________ 155,786 ____________ HUNGARY – 0.1%
11,641 Magyar Telekom Telecommunications PLC 20,135
428 OTP Bank Nyrt 18,662 ____________ 38,797 ____________ INDIA – 8.5%
6,993 Adani Transmission Ltd. * 17,550
11,780 Aurobindo Pharma Ltd. 113,020
63,817 Balrampur Chini Mills Ltd. 66,529
11,619 Bharat Petroleum Corp. Ltd. 67,198
2,448 Cadila Healthcare Ltd. * 15,088
11,579 Cox & Kings Ltd. 37,986
2,046 Cyient Ltd. 23,239
8,313 DCM Shriram Ltd. 41,220
11,022 Dewan Housing Finance Corp. Ltd. 105,132
9,984 FDC Ltd. 37,100
58,120 Future Enterprises Ltd. 33,171
1,370 GAIL India Ltd. - GDR 40,261
2,303 Goodyear India Ltd. 43,725
14,917 Gujarat Ambuja Exports Ltd. 64,278
22,239 HCL Technologies Ltd. 349,954
14,858 Hindalco Industries Ltd. 52,032
11,468 Hindustan Petroleum Corp. Ltd. 52,117
25,670 HT Media Ltd. 34,599
5,416 Indiabulls Housing Finance Ltd. 105,546
6,326 Indiabulls Housing Finance Ltd. - GDR 123,885
13,454 Indian Oil Corp. Ltd. 32,557
4,000 Infosys Ltd. - ADR 70,680
3,161 InterGlobe Aviation Ltd. 1 66,245
14,678 IRB Infrastructure Developers Ltd. 61,778
7,712 ITC Ltd. 32,440
8,550 Jindal Saw Ltd. 15,737
18,916 JM Financial Ltd. 40,064
12,647 JSW Steel Ltd. 61,208
11,972 JTEKT India Ltd. 20,202
4,064 Jubilant Life Sciences Ltd. 53,395
5,752 Kaveri Seed Co., Ltd. 45,926
1,144 Maharashtra Scooters Ltd. 41,733
24,638 Mangalore Refinery & Petrochemicals Ltd. 39,707
15,673 Muthoot Finance Ltd. 105,273
4

Segall Bryant & Hamill Emerging Markets Fund SCHEDULE OF INVESTMENTS – Continued As of April 30, 2018 (Unaudited)
Number of Shares Value __________ ____________
COMMON STOCKS (Continued) INDIA (Continued)
59,289 NHPC Ltd. $ 25,2166,426 NIIT Technologies Ltd. 111,278
16,631 Oil & Natural Gas Corp. Ltd. 44,8677,826 PC Jeweller Ltd. 16,865
12,614 Petronet LNG Ltd. 42,74788,983 Power Finance Corp. Ltd. 116,68410,462 Power Grid Corp. of India Ltd. 32,49721,189 Redington India Ltd. 43,761
5,500 Reliance Industries Ltd. - GDR 1 158,95019,341 Suven Life Sciences Ltd. 51,887
7,471 Tata Investment Corp. Ltd. 96,5947,389 Tata Steel Ltd. - GDR 65,3466,745 Tech Mahindra Ltd. 67,4812,878 TV Today Network Ltd. 20,5523,693 Vaibhav Global Ltd. * 39,973
16,894 Vedanta Ltd. 74,9898,500 Vedanta Ltd. - ADR 150,6208,344 Welspun Enterprises Ltd. 18,755 ____________
3,289,637 ____________INDONESIA – 2.4%
372,500 Adaro Energy Tbk P.T. 48,77992,000 Adira Dinamika Multi Finance Tbk P.T. 56,704
1,719,100 Bank Bukopin Tbk 52,690250,400 Bank Negara Indonesia Persero Tbk P.T. 144,159
1,306,300 Bank Pembangunan Daerah Jawa Timur Tbk P.T. 66,9681,255,800 BFI Finance Indonesia Tbk P.T. 73,114
520,300 Global Mediacom Tbk P.T. 21,614106,500 Indofood Sukses Makmur Tbk P.T. 53,247166,300 Link Net Tbk P.T. 64,548474,300 Mitra Pinasthika Mustika Tbk P.T. 39,205469,300 Paninvest Tbk P.T. * 38,508820,600 Perusahaan Perkebunan London Sumatra Indonesia Tbk P.T. 74,209126,300 PP Persero Tbk P.T. * 21,922
3,200 Telekomunikasi Indonesia Persero Tbk P.T. - ADR 87,20021,900 United Tractors Tbk P.T. 53,434
137,900 Waskita Karya Persero Tbk P.T. 21,784 ____________ 918,085 ____________
MALAYSIA – 2.7%64,600 AirAsia Group Bhd 63,10834,900 Berjaya Sports Toto Bhd 18,657
118,400 CIMB Group Holdings Bhd 215,77927,900 Genting Bhd 63,36085,200 Kim Loong Resources Bhd 28,137
5

Segall Bryant & Hamill Emerging Markets Fund SCHEDULE OF INVESTMENTS – Continued As of April 30, 2018 (Unaudited)
Number of Shares Value __________ ____________
COMMON STOCKS (Continued) MALAYSIA (Continued) 70,900 Magnum Bhd $ 32,346
25,500 Malayan Banking Bhd 69,908
117,100 Malayan Flour Mills Bhd 45,649
99,375 Matrix Concepts Holdings Bhd 50,988
22,300 Oriental Holdings BHD 35,637
241,800 OSK Holdings Bhd 61,327
2,200 Panasonic Manufacturing Malaysia BHD 19,625
27,400 Petronas Chemicals Group Bhd 58,866
63,500 Sarawak Oil Palms Bhd 58,128
50,600 Supermax Corp. Bhd 36,921
38,000 Tenaga Nasional Bhd 153,014
60,600 UOA Development Bhd 37,532 ____________ 1,048,982 ____________ MEXICO – 2.7%
15,300 America Movil S.A.B. de C.V. - ADR 282,897
24,000 Credito Real S.A.B. de C.V. SOFOM ER 35,213
4,830 Gruma S.A.B. de C.V. - Class B 58,994
31,200 Grupo Comercial Chedraui S.A. de C.V. 65,413
83,700 Grupo Famsa S.A.B. de C.V. - Class A * 54,779
7,900 Grupo Financiero Banorte S.A.B. de C.V. - Class O 49,431
41,000 Grupo Mexico S.A.B. de C.V. 136,293
3,244 Grupo Sanborns S.A.B. de C.V. 3,351
37,500 Industrias Bachoco S.A.B. de C.V. 193,194
2,520 Industrias Penoles S.A.B. de C.V. 52,892
18,000 Mexichem S.A.B. de C.V. 56,227
25,460 Rassini S.A.B. de C.V. - Class A 53,964 ____________ 1,042,648 ____________ PERU – 0.2%
100 Credicorp Ltd. 23,249
61,923 Ferreycorp S.A.A. 50,063
697 Sociedad Minera Cerro Verde S.A.A. 19,795 ____________ 93,107 ____________ PHILIPPINES – 1.1%
25,220 Cebu Air, Inc. 43,130
273,700 DMCI Holdings, Inc. 58,178
226,500 East West Banking Corp. 76,070
20,230 First Philippine Holdings Corp. 25,390
2,900 PLDT, Inc. - ADR 79,721
36,100 San Miguel Corp. 97,286
48,480 Semirara Mining & Power Corp. 28,901
177,500 Vista Land & Lifescapes, Inc. 22,257 ____________ 430,933 ____________
6

Segall Bryant & Hamill Emerging Markets Fund SCHEDULE OF INVESTMENTS – Continued As of April 30, 2018 (Unaudited)
Number of Shares Value __________ ____________
COMMON STOCKS (Continued) POLAND – 1.0%
531 Bank Polska Kasa Opieki S.A. $ 17,622
1,407 Dom Development S.A. 35,969
6,423 Enea S.A. 19,026
7,781 Energa S.A. 22,736
2,038 Jastrzebska Spolka Weglowa S.A. * 47,788
741 Polski Koncern Naftowy ORLEN S.A. 18,873
24,043 Polskie Gornictwo Naftowe i Gazownictwo S.A. 42,198
9,034 Powszechny Zaklad Ubezpieczen S.A. 109,825
51,549 Tauron Polska Energia S.A. * 34,401
3,965 Warsaw Stock Exchange 44,484 ____________ 392,922 ____________ QATAR – 0.4%
6,616 Doha Bank QSC 49,225
3,592 Ooredoo QSC 78,143
900 Qatar Industrial Manufacturing Co. QSC 9,566
7,971 Salam International Investment Ltd. QSC * 12,413 ____________ 149,347 ____________ RUSSIA – 3.0%
1,156 Cherkizovo Group PJSC 20,652
1,764,000 ENEL RUSSIA PJSC 41,878
25,400 Gazprom Neft PJSC 124,036
43,881 Gazprom PJSC - ADR 202,489
3,422 Lukoil PJSC - ADR 228,096
2,600 Mobile TeleSystems PJSC - ADR 27,300
118,190 Sberbank of Russia PJSC 421,288
45,100 Surgutneftegas OJSC 21,051
276 VSMPO-AVISMA Corp. PJSC 75,715 ____________ 1,162,505 ____________ SOUTH AFRICA – 6.3%
2,828 African Rainbow Minerals Ltd. 23,230
13,382 Astral Foods Ltd. 329,918
21,413 Barclays Africa Group Ltd. 313,642
23,028 Blue Label Telecoms Ltd. 22,963
133,889 Delta Property Fund Ltd. - REIT 70,219
5,299 Exxaro Resources Ltd. 47,002
4,317 Kumba Iron Ore Ltd. 92,222
377,577 Merafe Resources Ltd. 48,466
32,707 Metair Investments Ltd. 56,361
3,051 Naspers Ltd. - N Shares 743,283
23,843 Netcare Ltd. 59,278
26,041 Raubex Group Ltd. 43,245
10,200 RMB Holdings Ltd. 63,977
7

Segall Bryant & Hamill Emerging Markets Fund SCHEDULE OF INVESTMENTS – Continued As of April 30, 2018 (Unaudited)
Number of Shares Value __________ ____________
COMMON STOCKS (Continued) SOUTH AFRICA (Continued) 13,521 Standard Bank Group Ltd. $ 231,893
34,443 Stenprop Ltd. 51,119
45,137 Telkom S.A. SOC Ltd. 206,134
2,340 Truworths International Ltd. 19,131
1,501 Wilson Bayly Holmes-Ovcon Ltd. 19,179 ____________ 2,441,262 ____________ SOUTH KOREA – 14.6%
986 Aekyung Petrochemical Co., Ltd. 13,397
1,473 BGF Co., Ltd. 17,428
3 Celltrion, Inc. * 753
1,775 Chongkundang Holdings Corp. 115,792
206 Com2uSCorp 30,695
4,689 COWELL FASHION Co., Ltd. 23,747
420 Cuckoo Holdings Co., Ltd. 46,671
562 Dongwon Industries Co., Ltd. 177,360
6,217 Eugene Corp. 46,873
1,967 F&F Co., Ltd. 80,154
861 GS Holdings Corp. 49,285
3,752 Hana Financial Group, Inc. 166,713
1,580 Hanwha Chemical Corp. 42,474
3,364 HMC Investment Securities Co., Ltd. 36,974
5,933 Huvis Corp. 74,552
1,131 Hyundai Development Co.-Engineering & Construction 49,924
919 Hyundai Marine & Fire Insurance Co., Ltd. 32,833
6,934 Industrial Bank of Korea 108,738
683 IS Dongseo Co., Ltd. 20,824
1,096 Jahwa Electronics Co., Ltd. 17,350
1,350 Jeju Air Co., Ltd. 61,384
4,100 KB Financial Group, Inc. - ADR 231,240
18,222 Korea Real Estate Investment & Trust Co., Ltd. 52,310
2,217 Korea United Pharm, Inc. 58,508
2,043 Korean Air Lines Co., Ltd. 64,928
384 KT&G Corp. 35,114
2,488 Kumho Industrial Co., Ltd. 30,609
2,440 LF Corp. 64,167
1,779 LG Corp. 134,572
2,614 LG Electronics, Inc. 247,856
6,797 LG Uplus Corp. 77,814
195 Lotte Chemical Corp. 75,090
404 LS Corp. 29,294
3,051 Meritz Financial Group, Inc. 39,723
2,299 Meritz Fire & Marine Insurance Co., Ltd. 44,936
4,655 NH Investment & Securities Co., Ltd. 67,173
8

Segall Bryant & Hamill Emerging Markets Fund SCHEDULE OF INVESTMENTS – Continued As of April 30, 2018 (Unaudited)
Number of Shares Value __________ ____________
COMMON STOCKS (Continued) SOUTH KOREA (Continued) 196 OCI Co., Ltd. $ 28,412
2,500 POSCO - ADR 212,125
1,903 PSK, Inc. 40,834
1,359 Sajo Industries Co., Ltd. 89,694
2,959 Samjin Pharmaceutical Co., Ltd. 123,363
710 Samsung Electronics Co., Ltd. 1,761,622
1,564 Samsung Securities Co., Ltd. 53,791
873 Sangsangin Co., Ltd. * 17,647
1,418 SFA Engineering Corp. 42,865
1,000 Shinhan Financial Group Co., Ltd. - ADR 44,620
382 Shinyoung Securities Co., Ltd. * 20,862
5,173 SK Hynix, Inc. 406,826
541 SK Innovation Co., Ltd. 99,136
5,500 SK Telecom Co., Ltd. - ADR 130,625
1,088 SL Corp. 22,517
2,582 Taeyoung Engineering & Construction Co., Ltd. 28,098
1,329 TechWing, Inc. 22,640
1,960 WiSoL Co., Ltd. 25,016 ____________ 5,637,948 ____________ TAIWAN – 11.5%
47,000 Acer, Inc. * 35,844
260,000 AU Optronics Corp. 107,213
90,000 Bank of Kaohsiung Co., Ltd. 28,416
12,000 Catcher Technology Co., Ltd. 133,082
4,000 Chang Wah Electromaterials, Inc. 19,819
14,000 Cheng Uei Precision Industry Co., Ltd. 18,172
6,000 Chilisin Electronics Corp. 18,653
74,000 China Airlines Ltd. * 26,994
126,000 China Bills Finance Corp. 61,466
412,000 China Development Financial Holding Corp. 155,776
37,080 China General Plastics Corp. 39,658
44,000 China Motor Corp. 41,396
9,000 Chipbond Technology Corp. 17,834
2,400 Chunghwa Telecom Co., Ltd. - ADR 91,176
126,000 Compal Electronics, Inc. 82,070
17,000 Compeq Manufacturing Co., Ltd. 16,938
43,000 Continental Holdings Corp. 19,062
11,000 Coretronic Corp. 14,641
57,000 CTBC Financial Holding Co., Ltd. 40,650
13,000 E Ink Holdings, Inc. 14,384
13,000 Elan Microelectronics Corp. 18,816
12,000 Epistar Corp. * 16,332
53,000 Eva Airways Corp. 28,461
9
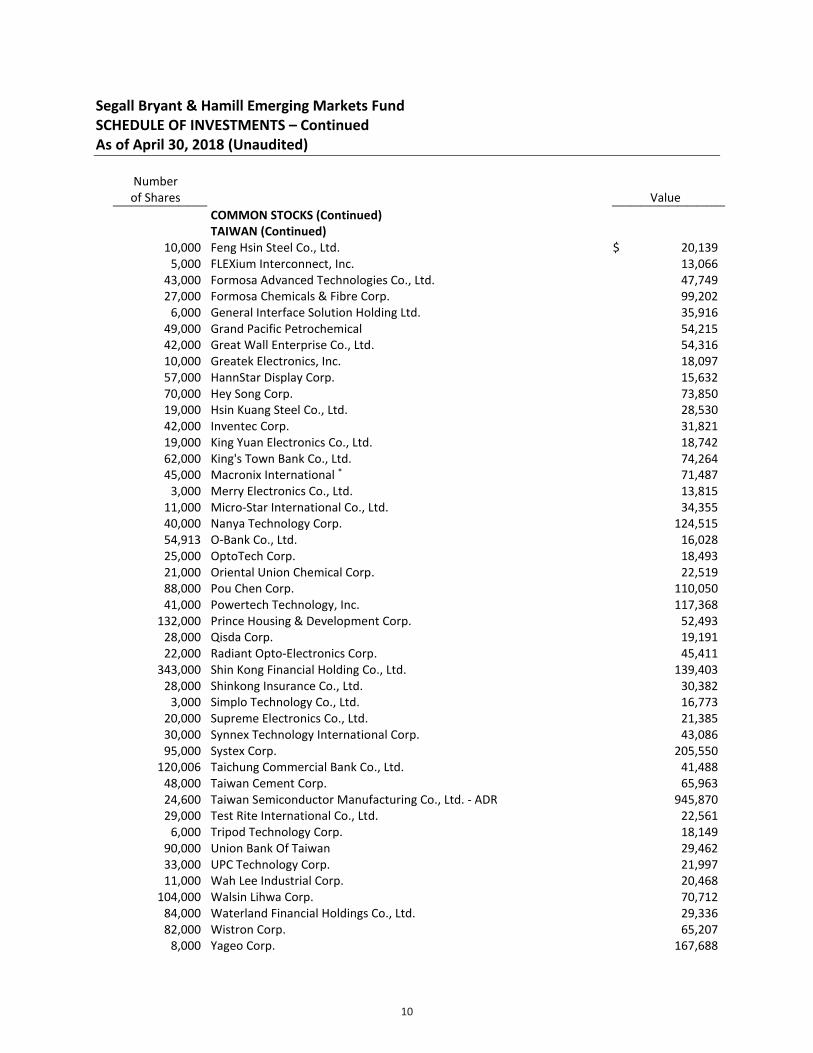
Segall Bryant & Hamill Emerging Markets Fund SCHEDULE OF INVESTMENTS – Continued As of April 30, 2018 (Unaudited)
Number of Shares Value __________ ____________
COMMON STOCKS (Continued) TAIWAN (Continued) 10,000 Feng Hsin Steel Co., Ltd. $ 20,139
5,000 FLEXium Interconnect, Inc. 13,066
43,000 Formosa Advanced Technologies Co., Ltd. 47,749
27,000 Formosa Chemicals & Fibre Corp. 99,202
6,000 General Interface Solution Holding Ltd. 35,916
49,000 Grand Pacific Petrochemical 54,215
42,000 Great Wall Enterprise Co., Ltd. 54,316
10,000 Greatek Electronics, Inc. 18,097
57,000 HannStar Display Corp. 15,632
70,000 Hey Song Corp. 73,850
19,000 Hsin Kuang Steel Co., Ltd. 28,530
42,000 Inventec Corp. 31,821
19,000 King Yuan Electronics Co., Ltd. 18,742
62,000 King's Town Bank Co., Ltd. 74,264
45,000 Macronix International * 71,487
3,000 Merry Electronics Co., Ltd. 13,815
11,000 Micro-Star International Co., Ltd. 34,355
40,000 Nanya Technology Corp. 124,515
54,913 O-Bank Co., Ltd. 16,028
25,000 OptoTech Corp. 18,493
21,000 Oriental Union Chemical Corp. 22,519
88,000 Pou Chen Corp. 110,050
41,000 Powertech Technology, Inc. 117,368
132,000 Prince Housing & Development Corp. 52,493
28,000 Qisda Corp. 19,191
22,000 Radiant Opto-Electronics Corp. 45,411
343,000 Shin Kong Financial Holding Co., Ltd. 139,403
28,000 Shinkong Insurance Co., Ltd. 30,382
3,000 Simplo Technology Co., Ltd. 16,773
20,000 Supreme Electronics Co., Ltd. 21,385
30,000 Synnex Technology International Corp. 43,086
95,000 Systex Corp. 205,550
120,006 Taichung Commercial Bank Co., Ltd. 41,488
48,000 Taiwan Cement Corp. 65,963
24,600 Taiwan Semiconductor Manufacturing Co., Ltd. - ADR 945,870
29,000 Test Rite International Co., Ltd. 22,561
6,000 Tripod Technology Corp. 18,149
90,000 Union Bank Of Taiwan 29,462
33,000 UPC Technology Corp. 21,997
11,000 Wah Lee Industrial Corp. 20,468
104,000 Walsin Lihwa Corp. 70,712
84,000 Waterland Financial Holdings Co., Ltd. 29,336
82,000 Wistron Corp. 65,207
8,000 Yageo Corp. 167,688
10

Segall Bryant & Hamill Emerging Markets Fund SCHEDULE OF INVESTMENTS – Continued As of April 30, 2018 (Unaudited)
Number of Shares Value __________ ____________
COMMON STOCKS (Continued) TAIWAN (Continued)
22,000 YC INOX Co., Ltd. $ 19,707375,000 Yuanta Financial Holding Co., Ltd. 178,969
12,000 Zhen Ding Technology Holding Ltd. 26,112 ____________ 4,458,385 ____________
THAILAND – 2.2%18,600 Glow Energy PCL 50,66642,100 Indorama Ventures PCL 79,907
253,900 IRPC PCL 56,50159,400 JWD Infologistics PCL 16,427
1,300 Kang Yong Electric PCL 18,948123,700 KGI Securities Thailand PCL 17,232
33,200 Kiatnakin Bank PCL 77,376135,700 PCS Machine Group Holding PCL 30,130
31,600 PTT Global Chemical PCL 97,66379,000 PTT PCL 140,90222,400 Saha-Union PCL 30,52055,800 SPCG PCL 37,19121,500 Thai Oil PCL 64,004
8,200 Thai Stanley Electric PCL 59,23942,800 Thai Vegetable Oil PCL 47,80453,000 Thaicom PCL 15,202 ____________
839,712 ____________TURKEY – 1.1%
21,642 Akbank Turk A.S. 45,03017,411 Eczacibasi Yatirim Holding Ortakligi A.S. 43,42169,567 EIS Eczacibasi Ilac ve Sinai ve Finansal Yatirimlar Sanayi ve Ticaret A.S. 69,88721,710 Eregli Demir ve Celik Fabrikalari TAS 54,194
4,446 TAV Havalimanlari Holding A.S. 23,93114,005 Tekfen Holding A.S. 52,998
7,000 Turkcell Iletisim Hizmetleri A.S. - ADR 60,55027,032 Turkiye Garanti Bankasi A.S. 61,21210,288 Turkiye Vakiflar Bankasi TAO 15,138 ____________
426,361 ____________UNITED ARAB EMIRATES – 0.7%
43,379 DAMAC Properties Dubai Co. PJSC 32,626118,504 Dubai Islamic Bank PJSC 177,440
41,113 Emaar Properties PJSC 64,806 ____________ 274,872 ____________
TOTAL COMMON STOCKS (Cost $31,364,877) 37,400,887 ____________
11
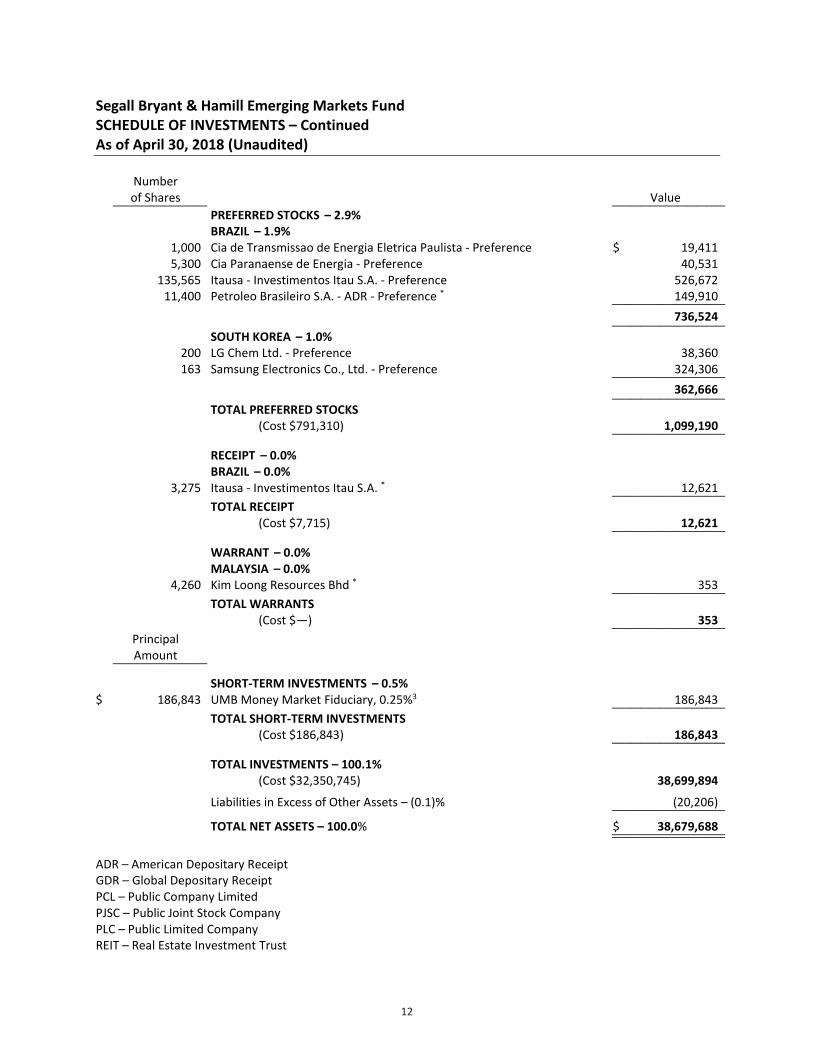
Segall Bryant & Hamill Emerging Markets Fund SCHEDULE OF INVESTMENTS – Continued As of April 30, 2018 (Unaudited)
Number of Shares Value __________ ____________
PREFERRED STOCKS – 2.9%
BRAZIL – 1.9%
1,000 Cia de Transmissao de Energia Eletrica Paulista - Preference $ 19,411
5,300 Cia Paranaense de Energia - Preference 40,531
135,565 Itausa - Investimentos Itau S.A. - Preference 526,672
11,400 Petroleo Brasileiro S.A. - ADR - Preference * 149,910 ____________ 736,524 ____________ SOUTH KOREA – 1.0%
200 LG Chem Ltd. - Preference 38,360
163 Samsung Electronics Co., Ltd. - Preference 324,306 ____________ 362,666 ____________
TOTAL PREFERRED STOCKS (Cost $791,310) 1,099,190 ____________
RECEIPT – 0.0%
BRAZIL – 0.0%
3,275 Itausa - Investimentos Itau S.A. * 12,621 ____________
TOTAL RECEIPT (Cost $7,715) 12,621 ____________
WARRANT – 0.0%
MALAYSIA – 0.0%
4,260 Kim Loong Resources Bhd * 353 ____________
TOTAL WARRANTS (Cost $—) 353 ____________
Principal Amount __________
SHORT-TERM INVESTMENTS – 0.5%
$ 186,843 UMB Money Market Fiduciary, 0.25%3 186,843 ____________
TOTAL SHORT-TERM INVESTMENTS (Cost $186,843) 186,843 ____________
TOTAL INVESTMENTS – 100.1% (Cost $32,350,745) 38,699,894
Liabilities in Excess of Other Assets – (0.1)% (20,206) ____________ TOTAL NET ASSETS – 100.0% $ 38,679,688 ________________________ ADR – American Depositary Receipt GDR – Global Depositary Receipt PCL – Public Company Limited PJSC – Public Joint Stock Company PLC – Public Limited Company REIT – Real Estate Investment Trust
12

Segall Bryant & Hamill Emerging Markets Fund SCHEDULE OF INVESTMENTS – Continued As of April 30, 2018 (Unaudited)
* Non-income producing security. 1 Security exempt from registration under Rule 144A of the Securities Act of 1933. Thesesecurities are restricted and may be resold in transactions exempt from registration normally to qualified institutional buyers. The total value of these securities is $385,430 which represents 1.0% of Net Assets. 2 Level 3 securities fair valued under procedures established by the Board of Trustees, represents 0.0% of Net Assets. The total value of these securities is $0. 3 The rate is the annualized seven-day yield at period end. See accompanying Notes to Financial Statements.
13

Segall Bryant & Hamill Emerging Markets Fund SUMMARY OF INVESTMENTS As of April 30, 2018 (Unaudited)
Security Type/Sector Percent of Total
Net Assets Common Stocks
Financials 25.1% Technology 20.3% Consumer Discretionary 11.8% Materials 8.1% Energy 8.0% Communications 8.0% Consumer Staples 5.5% Industrials 5.0% Utilities 2.7% Health Care 2.2% __________
Total Common Stocks 96.7% Preferred Stocks
Financials 1.4% Technology 0.8% Energy 0.4% Utilities 0.2% Materials 0.1% __________
Total Preferred Stocks 2.9% Warrants
Consumer Staples 0.0% __________Total Warrants 0.0% Receipt
Financials 0.0% __________Total Receipt 0.0% Short-Term Investments 0.5% __________Total Investments 100.1% Liabilities in Excess of Other Assets (0.1)% __________Total Net Assets 100.0% ____________________
See accompanying Notes to Financial Statements.
14

Segall Bryant & Hamill Emerging Markets FundSTATEMENT OF ASSETS AND LIABILITIESAs of April 30, 2018 (Unaudited)
Assets:Investments, at value (cost $32,350,745) $ 38,699,894Receivables: Dividends and interest 62,005 Due from Advisor 1,209Prepaid expenses 1,069 Total assets 38,764,177
Liabilities:Payables: Distribution fees (Note 8) 710 Fund administration fees 25,295 Fund accounting fees 20,827 Registration fees 9,777 Auditing fees 9,166 Transfer agent fees and expenses 6,384 Custody fees 5,930 Trustees' fees and expenses 1,434 Chief Compliance Officer fees 1,355 Trustees' deferred compensation (Note 4) 871Accrued other expenses 2,740 Total liabilities 84,489 Net Assets $ 38,679,688
Components of Net Assets:Paid-in capital (par value of $0.01 per share with an unlimited number of shares authorized) $ 30,952,145 Accumulated net investment income 18,965 Accumulated net realized gain on investments and foreign currency transactions 1,359,715 Net unrealized appreciation (depreciation) on: Investments 6,349,149 Foreign currency translations (286) Net Assets $ 38,679,688
Maximum Offering Price per Share: Class A Shares: Net assets applicable to shares outstanding $ 3,456,866 Shares of beneficial interest issued and outstanding 362,364 Redemption Price $ 9.54 Maximum sales charge (5.75% of offering price)* 0.58 Maximum public offering price to public $ 10.12
Class I Shares: Net assets applicable to shares outstanding $ 35,222,822 Shares of beneficial interest issued and outstanding 3,677,324 Offering and redemption price per share $ 9.58
See accompanying Notes to Financial Statements.
* No sales charge applies on investments of $1,000,000 or more, but a Contingent Deferred Sales Charge ("CDSC") of 1% will be imposed oncertain redemptions of such shares within 12 months of the date of purchase.
15

Segall Bryant & Hamill Emerging Markets FundSTATEMENT OF OPERATIONSFor the Six Months Ended April 30, 2018 (Unaudited)
Investment Income:Dividend (net of foreign withholding taxes of $59,775) 416,414$ Interest 46
Total investment income 416,460
Expenses:Advisory fees 168,415 Custody fees 71,500 Fund accounting fees 68,092 Fund administration fees 44,748 Transfer agent fees and expenses 18,784 Legal fees 9,383 Auditing fees 9,038 Registration fees 6,305 Distribution fees (Note 8) 4,124 Shareholder reporting fees 3,968 Trustees' fees and expenses 3,397 Chief Compliance Officer fees 2,572 Miscellaneous 1,224 Insurance fees 619
Total expenses 412,169 Advisory fees waived (168,415) Other expenses absorbed (9,464)
Net expenses 234,290 Net investment income 182,170
Realized and Unrealized Gain (Loss):Net realized gain (loss) on:
Investments 1,477,338 1
Foreign currency transactions (37,924) Net realized gain 1,439,414
Net change in unrealized appreciation/depreciation on:Investments 207,067 Foreign currency translations (1,687)
Net change in unrealized appreciation/depreciation 205,380 Net realized and unrealized gain 1,644,794
Net Increase in Net Assets from Operations 1,826,964$
1 Net of non-U.S. taxes $8,453.
See accompanying Notes to Financial Statements.
16

Segall Bryant & Hamill Emerging Markets FundSTATEMENTS OF CHANGES IN NET ASSETS
Operations: $ 182,170 $ 471,161
1,439,414 1,799,602
205,380 4,387,409 1,826,964 6,658,172
From net investment income: Class A (42,936) (17,094) Class I (513,089) (365,702)
Class A (101,236) - Class I (1,059,917) - Total distributions to shareholders (1,717,178) (382,796)
Class A 253,500 1,818,190 Class I 2,533,539 8,212,581 Reinvestment of distributions: Class A 138,847 17,094 Class I 704,841 156,205 Cost of shares redeemed: Class A (61,874) (137,832) Class I1 (259,116) (211,797) Net increase in net assets from capital transactions 3,309,737 9,854,441
3,419,523 16,129,817
35,260,165 19,130,348 $ 38,679,688 $ 35,260,165
$ 18,965 $ 392,820
Capital Share Transactions: Shares sold: Class A 25,410 221,972 Class I 257,411 986,247 Shares reinvested: Class A 15,207 2,401 Class I 76,948 21,877 Shares redeemed: Class A (6,409) (17,434) Class I (27,085) (25,756) Net increase from capital share transactions 341,482 1,189,307
1 Net of redemption fees of $141 and $0, respectively.
See accompanying Notes to Financial Statements.
For the Year Ended
October 31, 2017
Six Months Ended
From net realized gain
Distributions to Shareholders:
For the
(Unaudited)April 30, 2018
currency translations
Total increase in net assets
Net Assets:
Increase in Net Assets from:
Net investment income
Beginning of period End of period
Accumulated net investment income
Net realized gain on investments and foreign currency transactions Net change in unrealized appreciation/depreciation on investments and foreign
Net increase in net assets resulting from operations
Net proceeds from shares sold:Capital Transactions:
17

Sega
ll Br
yant
& H
amill
Em
ergi
ng M
arke
ts F
und
FIN
ANCI
AL H
IGHL
IGHT
S Cl
ass A
Per s
hare
ope
ratin
g pe
rform
ance
.Fo
r a ca
pita
l sha
re o
utst
andi
ng th
roug
hout
eac
h pe
riod.
For t
heSi
x M
onth
s End
edFo
r the
Per
iod
April
30,
201
8Ju
ne 3
0, 2
014*
thro
ugh
(Una
udite
d)20
1720
1620
15O
ctob
er 3
1, 2
014
Net
ass
et v
alue
, beg
inni
ng o
f per
iod
9.49
$
7.
60$
6.91
$
8.
43$
9.40
$
In
com
e fr
om In
vest
men
t Ope
ratio
ns:
Net i
nves
tmen
t inc
ome1
0.04
0.
13
0.14
0.
12
0.08
Ne
t rea
lized
and
unr
ealiz
ed g
ain
(loss
) on
inve
stm
ents
0.45
1.
90
0.58
(1
.50)
(0
.50)
Tota
l fro
m in
vest
men
t ope
ratio
ns0.
49
2.03
0.
72
(1.3
8)
(0.4
2)
Less
Dist
ribut
ions
:Fr
om n
et in
vest
men
t inc
ome
(0.1
3)
(0
.14)
(0
.03)
(0
.14)
(0
.13)
From
net
real
ized
gain
(0.3
1)
-
-
-
(0.3
4)
Ta
x ret
urn
of ca
pita
l-
-
-
-
(0
.08)
Tota
l dist
ribut
ions
(0.4
4)
(0
.14)
(0
.03)
(0
.14)
(0
.55)
Net
ass
et v
alue
, end
of p
erio
d9.
54$
9.49
$
7.
60$
6.91
$
8.
43$
Tota
l ret
urn2
5.36
%3
27.2
7%10
.42%
(16.
47)%
(4.4
9)%
3
Ratio
s and
Sup
plem
enta
l Dat
a:Ne
t ass
ets,
end
of p
erio
d (in
thou
sand
s)3,
457
$
3,11
6$
92
1$
8
$
10
7$
Ratio
of e
xpen
ses t
o av
erag
e ne
t ass
ets:
Befo
re fe
es w
aive
d an
d ex
pens
es a
bsor
bed
2.43
%4
2.87
%5.
58%
5.76
%1.
48%
4
Afte
r fee
s wai
ved
and
expe
nses
abs
orbe
d 1.
48%
41.
48%
1.48
%1.
48%
1.48
%4
Ratio
of n
et in
vest
men
t inc
ome
(loss
) to
aver
age
net a
sset
s:Be
fore
fees
wai
ved
and
expe
nses
abs
orbe
d(0
.20)
%4
0.15
%(2
.00)
%(2
.92)
%2.
34%
4,5
Afte
r fee
s wai
ved
and
expe
nses
abs
orbe
d0.
75%
41.
54%
2.10
%1.
36%
2.34
%4
Port
folio
turn
over
rate
49%
397
%84
%95
%13
1%
*Co
mm
ence
men
t of o
pera
tions
.1
Base
d on
ave
rage
shar
es o
utst
andi
ng fo
r the
per
iod.
2 3No
t ann
ualiz
ed.
4An
nual
ized.
5Un
audi
ted.
See
acco
mpa
nyin
g No
tes t
o Fi
nanc
ial S
tate
men
ts.
For t
he Y
ear E
nded
Oct
ober
31,
Tota
lret
urns
wou
ldha
vebe
enlo
wer
had
expe
nses
notb
een
wai
ved
orab
sorb
edby
the
Advi
sor.
Retu
rns
show
ndo
notr
efle
ctth
ede
duct
ion
ofta
xes
that
ash
areh
olde
rw
ould
pay
onFu
nddi
strib
utio
nsor
the
rede
mpt
ion
ofFu
ndsh
ares
. Ret
urns
show
n do
not
incl
ude
paym
ent o
f sal
es lo
ad o
f 5.7
5% o
f offe
ring
pric
e w
hich
is re
duce
d on
sale
s of $
1,00
0,00
0 or
mor
e. If
the
sale
s cha
rge
was
incl
uded
tota
l ret
urns
wou
ld b
e lo
wer
.
18

Sega
ll Br
yant
& H
amill
Em
ergi
ng M
arke
ts F
und
FIN
ANCI
AL H
IGHL
IGHT
S Cl
ass I
Per s
hare
ope
ratin
g pe
rform
ance
.Fo
r a ca
pita
l sha
re o
utst
andi
ng th
roug
hout
eac
h pe
riod.
For t
heSi
x M
onth
s End
edAp
ril 3
0, 2
018
(Una
udite
d)20
1720
1620
1520
1420
13N
et a
sset
val
ue, b
egin
ning
of p
erio
d9.
54$
7.63
$
6.92
$
8.44
$
9.35
$
8.74
$
Inco
me
from
Inve
stm
ent O
pera
tions
:Ne
t inv
estm
ent i
ncom
e10.
05
0.15
0.16
0.13
0.20
0.22
Net r
ealiz
ed a
nd u
nrea
lized
gai
n (lo
ss) o
n in
vest
men
ts0.
45
1.91
0.58
(1.4
9)
(0.3
4)
0.65
Tota
l fro
m in
vest
men
t ope
ratio
ns0.
50
2.06
0.74
(1.3
6)
(0.1
4)
0.87
Less
Dist
ribut
ions
:Fr
om n
et in
vest
men
t inc
ome
(0.1
5)
(0
.15)
(0
.03)
(0
.16)
(0
.21)
(0
.19)
Fr
om n
et re
alize
d ga
in(0
.31)
-
-
-
(0.4
6)
(0.0
8)
Tax r
etur
n of
capi
tal
-
-
-
-
(0.1
0)
-
Tota
l dist
ribut
ions
(0.4
6)
(0
.15)
(0
.03)
(0
.16)
(0
.77)
(0
.27)
Purc
hase
Pre
miu
m-
-
-
-
-
0.
01
Rede
mpt
ion
fee
proc
eeds
1-
2
-
-
2-
-
2
-
2
Net
ass
et v
alue
, end
of p
erio
d9.
58$
9.54
$
7.63
$
6.92
$
8.44
$
9.35
$
Tota
l ret
urn3
5.44
%6
27.6
8%10
.54%
(16.
19)%
(1.4
4)%
410
.49%
Ratio
s and
Sup
plem
enta
l Dat
a:Ne
t ass
ets,
end
of p
erio
d (in
thou
sand
s)35
,223
$
32
,144
$
18,2
09$
98
2$
7,
882
$
52
,245
$
Ratio
of e
xpen
ses t
o av
erag
e ne
t ass
ets:
Befo
re fe
es w
aive
d an
d ex
pens
es a
bsor
bed
2.18
%7
2.62
%5.
33%
5.42
%1.
12%
1.11
%Af
ter f
ees w
aive
d an
d ex
pens
es a
bsor
bed
1.23
%7
1.23
%1.
23%
1.25
%1.
12%
1.11
%Ra
tio o
f net
inve
stm
ent i
ncom
e (lo
ss) t
o av
erag
e ne
t ass
ets:
Befo
re fe
es w
aive
d an
d ex
pens
es a
bsor
bed
0.04
%7
0.40
%(1
.75)
%(2
.59)
%2.
21%
52.
50%
5
Afte
r fee
s wai
ved
and
expe
nses
abs
orbe
d0.
99%
71.
79%
2.35
%1.
58%
2.21
%2.
50%
Port
folio
turn
over
rate
49%
697
%84
%95
%13
1%97
%
1Ba
sed
on a
vera
ge sh
ares
out
stan
ding
for t
he p
erio
d.2
Amou
nt re
pres
ents
less
than
$0.
01 p
er sh
are.
3 4 5Un
audi
ted.
6No
t ann
ualiz
ed.
7An
nual
ized.
See
acco
mpa
nyin
g No
tes t
o Fi
nanc
ial S
tate
men
ts.
Tota
l ret
urns
wou
ld h
ave
been
low
er h
ad fe
es n
ot b
een
wai
ved
by th
e Ad
viso
r. Th
ese
retu
rns d
o no
t ref
lect
the
dedu
ctio
n of
taxe
s tha
t a sh
areh
olde
r wou
ld p
ay o
n th
e Fu
nd d
istrib
utio
ns o
r red
empt
ion
of F
und
shar
es.
For t
he Y
ear E
nded
Oct
ober
31,
Inclu
desa
djus
tmen
tsin
acco
rdan
cew
ithac
coun
ting
prin
ciple
sgen
eral
lyac
cept
edin
the
Unite
dSt
ates
ofAm
erica
and
assu
ch,t
hene
tass
etva
lue
forf
inan
cialr
epor
ting
purp
oses
and
the
retu
rnsb
ased
upon
thos
ene
tass
etva
lues
may
diffe
rfro
mth
ene
tass
etva
lue
and
retu
rns f
or sh
areh
olde
r tra
nsac
tions
as s
how
n in
the
man
agem
ent d
iscus
sion
and
anal
ysis
and
as o
ther
wise
repo
rted
to sh
areh
olde
rs.
19

Segall Bryant & Hamill International Small Cap Fund SCHEDULE OF INVESTMENTS As of April 30, 2018 (Unaudited)
Number of Shares Value __________ ____________
COMMON STOCKS – 94.4%
AUSTRALIA – 5.7%
555,128 Beach Energy Ltd. $ 654,719
85,934 Blue Sky Alternative Investments Ltd. 199,260
20,036 Brickworks Ltd. 240,274
36,909 Cedar Woods Properties Ltd. 170,054
79,399 CSR Ltd. 335,014
611,520 Donaco International Ltd. 117,396
481,703 Downer EDI Ltd. 2,479,195
63,421 Estia Health Ltd. 169,021
121,662 Hansen Technologies Ltd. 392,052
43,081 HT&E Ltd. 75,715
402,997 Inghams Group Ltd. 1,137,057
11,368 JB Hi-Fi Ltd. 219,168
374,328 Link Administration Holdings Ltd. 2,329,187
704,394 Metcash Ltd. 1,901,222
173,258 Mineral Resources Ltd. 2,320,063
129,028 MYOB Group Ltd. 314,600
1,310,761 Nine Entertainment Co. Holdings Ltd. 2,321,141
48,714 Perpetual Ltd. 1,469,617
207,603 Sandfire Resources NL 1,228,660
946,557 Seven West Media Ltd. 393,645
73,354 Sims Metal Management Ltd. 886,527
46,414 SpeedCast International Ltd. 206,146
60,961 St Barbara Ltd. 194,480
209,193 Super Retail Group Ltd. 1,131,009
169,195 Virtus Health Ltd. 717,579
465,975 Westgold Resources Ltd. * 515,754
432,121 Whitehaven Coal Ltd. * 1,490,058 ____________ 23,608,613 ____________ AUSTRIA – 1.3%
43,056 Austria Technologie & Systemtechnik A.G. 1,063,152
44,982 EVN A.G. 922,346
3,289 Kapsch TrafficCom A.G. 146,359
31,046 S IMMO A.G. 614,846
144,936 Telekom Austria A.G. * 1,382,046
99,540 UNIQA Insurance Group A.G. 1,191,920 ____________ 5,320,669 ____________ BELGIUM – 1.4%
165,254 AGFA-Gevaert N.V. * 589,155
902 Barco N.V. 116,520
20,235 Befimmo S.A. - REIT 1,314,628
4,651 bpost S.A. 102,051
3,475 Cie d'Entreprises CFE 438,099
23,904 D'ieteren S.A. 1,017,818
20

Segall Bryant & Hamill International Small Cap Fund SCHEDULE OF INVESTMENTS – Continued As of April 30, 2018 (Unaudited)
Number of Shares Value __________ ____________
COMMON STOCKS (Continued) BELGIUM (Continued)
2,913 Elia System Operator S.A. $ 184,0347,163 EVS Broadcast Equipment S.A. 234,715
65,744 Fagron * 1,131,97030,598 Orange Belgium S.A. 635,109
8,361 Recticel S.A. 104,396 ____________ 5,868,495 ____________
DENMARK – 1.1%22,194 Alm Brand A/S 234,553
6,411 Dfds A/S 399,14242,234 GN Store Nord A/S 1,483,84819,869 Matas A/S 228,81811,459 NNIT A/S 1 318,34226,327 PER Aarsleff A/S - Class B 987,84424,347 Scandinavian Tobacco Group A/S 1 407,250
4,027 Topdanmark A/S 189,38915,158 TORM PLC 120,922 ____________
4,370,108 ____________FINLAND – 1.9%
10,953 Atria OYJ 155,79657,592 Cramo OYJ 1,351,997
168,672 Finnair OYJ 2,299,0803,419 Kesko OYJ - B Shares 200,760
34,248 Outokumpu OYJ 221,642129,809 Ramirent OYJ 1,128,277
95,956 Sanoma OYJ 1,066,698151,922 Technopolis OYJ 710,608
27,004 Tieto OYJ 967,253 ____________ 8,102,111 ____________
FRANCE – 3.8%172,053 Air France-KLM * 1,686,165
4,152 Boiron S.A. 370,0582,514 Bonduelle SCA 111,889
10,818 Cie des Alpes 385,181110,194 Coface S.A. * 1,396,088106,025 Derichebourg S.A. 938,323
6,070 Elis S.A. 145,1708,747 Eramet * 1,522,454
21 Euronext N.V. 1 1,50522,428 Faurecia 1,831,42121,449 Gaztransport Et Technigaz S.A. 1,329,73213,902 Jacquet Metal Service 536,69262,273 Korian S.A. 2,177,344
21

Segall Bryant & Hamill International Small Cap Fund SCHEDULE OF INVESTMENTS – Continued As of April 30, 2018 (Unaudited)
Number of Shares Value __________ ____________
COMMON STOCKS (Continued) FRANCE (Continued) 5,231 LNA Sante S.A. $ 337,031
29,744 Neopost S.A. 802,582
19,960 Plastivaloire 456,438
29,923 Rallye S.A. 466,927
6,545 Sopra Steria Group 1,397,063
200 Synergie S.A. 12,239 ____________ 15,904,302 ____________ GERMANY – 4.8%
1,804 Bertrandt A.G. 201,287
1,654 bet-at-home.com A.G. 164,677
1,906 Bijou Brigitte A.G. 109,323
13,077 CECONOMY A.G. 146,536
24,512 Deutsche Beteiligungs A.G. 1,088,873
49,070 Deutsche Pfandbriefbank A.G. 1 793,754
98,671 Deutz A.G. 953,252
85,444 DIC Asset A.G. 1,051,268
3,640 Draegerwerk A.G. & Co. KGaA 223,622
37,749 Elmos Semiconductor A.G. 1,223,686
27,689 Gerresheimer A.G. 2,252,335
12,377 GFT Technologies S.E. 195,543
9,558 H&R GmbH & Co. KGaA * 140,583
33,118 Hamburger Hafen und Logistik A.G. 795,232
35,050 Kloeckner & Co. S.E. 427,224
13,476 LEG Immobilien A.G. 1,553,805
19,036 Leoni A.G. 1,192,158
38,894 Salzgitter A.G. 2,135,859
17,585 Siltronic A.G. 2,815,791
2,000 Sixt S.E. 235,337
17,804 Software A.G. 875,206
2,535 Stroeer S.E. & Co. KGaA 185,546
7,355 Surteco S.E. 234,937
1,135 Wacker Chemie A.G. 203,960
21,084 Zeal Network S.E. 680,692 ____________ 19,880,486 ____________ HONG KONG – 2.0%
2,065,000 CITIC Telecom International Holdings Ltd. 608,237
6,140,000 CSI Properties Ltd. 396,780
7,824,000 Emperor Capital Group Ltd. 602,996
541,100 Emperor International Holdings Ltd. 164,143
45,356 Fairwood Holdings Ltd. 172,964
157,100 Far East Consortium International Ltd. 89,716
154,000 Giordano International Ltd. 94,105
22

Segall Bryant & Hamill International Small Cap Fund SCHEDULE OF INVESTMENTS – Continued As of April 30, 2018 (Unaudited)
Number of Shares Value __________ ____________
COMMON STOCKS (Continued) HONG KONG (Continued) 371,000 Haitong International Securities Group Ltd. $ 216,270
492,700 IT Ltd. 239,096
425,500 Johnson Electric Holdings Ltd. 1,481,381
902,000 K Wah International Holdings Ltd. 553,655
140,000 Kowloon Development Co., Ltd. 157,887
67,000 Melco International Development Ltd. 248,055
2,086,000 Nameson Holdings Ltd. 414,346
949,000 Pacific Basin Shipping Ltd. * 252,331
975,400 Shun Tak Holdings Ltd. 401,447
725,000 Sun Hung Kai & Co., Ltd. 447,274
1,168,500 VSTECS Holdings Ltd. 608,182
744,000 Xinyi Glass Holdings Ltd. 1,069,566 ____________ 8,218,431 ____________ IRELAND – 0.9%
59,158 C&C Group PLC 222,394
88,334 Dalata Hotel Group PLC * 704,027
133,164 Green REIT PLC 244,104
37,513 Hibernia REIT PLC 67,225
510,636 Irish Residential Properties REIT PLC 838,378
13,202 Kingspan Group PLC 597,844
57,516 Origin Enterprises PLC 370,892
679 Paddy Power Betfair PLC 67,195
12,561 Smurfit Kappa Group PLC 535,444 ____________ 3,647,503 ____________ ISRAEL – 1.4%
24,585 Discount Investment Corp. Ltd. 66,767
119,952 Gazit-Globe Ltd. 1,134,048
157,673 Harel Insurance Investments & Financial Services Ltd. 1,144,525
82,718 Israel Discount Bank Ltd. - Class A * 229,036
19,353 Matrix IT Ltd. 212,487
616,427 Migdal Insurance & Financial Holding Ltd. 603,358
9,533 Norstar Holdings, Inc. 168,122
7,687 Rami Levy Chain Stores Hashikma Marketing 2006 Ltd. 350,812
110,837 Shufersal Ltd. 634,490
56,230 Tower Semiconductor Ltd. * 1,466,433 ____________ 6,010,078 ____________ ITALY – 4.4%
873,403 A2A S.p.A. 1,756,193
96,538 ACEA S.p.A. 1,693,618
376,329 Anima Holding S.p.A. 1 2,700,107
155,535 Astaldi S.p.A. 440,892
45,000 Azimut Holding S.p.A. 944,761
23

Segall Bryant & Hamill International Small Cap Fund SCHEDULE OF INVESTMENTS – Continued As of April 30, 2018 (Unaudited)
Number of Shares Value __________ ____________
COMMON STOCKS (Continued) ITALY (Continued) 29,287 Banca Farmafactoring S.p.A. 1 $ 183,248
13,084 Banca Generali S.p.A. 424,428
216,627 Cairo Communication S.p.A. 978,366
116,873 Credito Emiliano S.p.A. 1,027,808
273,226 GEDI Gruppo Editoriale S.p.A. * 138,576
64,636 Immobiliare Grande Distribuzione SIIQ S.p.A. - REIT 604,687
98,905 Iren S.p.A. 300,489
9,586 La Doria S.p.A. 139,782
313,817 Maire Tecnimont S.p.A. 1,594,968
293,869 OVS S.p.A. 1 1,248,154
224,429 Salini Impregilo S.p.A. 642,120
334,223 Saras S.p.A. 797,639
16,869 Societa Cattolica di Assicurazioni SCRL 179,601
88,181 Societa Iniziative Autostradali e Servizi S.p.A. 1,867,912
85,368 Sogefi S.p.A. * 334,225
61,971 Unione di Banche Italiane S.p.A. 319,195 ____________ 18,316,769 ____________ JAPAN – 30.1%
13,550 Achilles Corp. 281,541
826 AEON REIT Investment Corp. 857,579
51,000 Aisan Industry Co., Ltd. 526,186
20,700 Akatsuki, Inc. 889,165
5,384 AOI Electronics Co., Ltd. 208,645
118,100 AOKI Holdings, Inc. 1,812,018
39,300 Arcs Co., Ltd. 1,076,578
103,800 Asahi Diamond Industrial Co., Ltd. 994,283
9,400 Avex Group Holdings, Inc. 129,756
15,044 Axial Retailing, Inc. 613,277
34,600 Canon Electronics, Inc. 804,792
7,200 Canon Marketing Japan, Inc. 156,463
7,000 Chori Co., Ltd. 134,059
37,000 Chudenko Corp. 1,028,872
180,900 Citizen Watch Co., Ltd. 1,347,853
15,900 Cleanup Corp. 129,500
13,012 Corona Corp. 153,444
11,800 Cosmo Energy Holdings Co., Ltd. 388,730
2,533 Dai-Dan Co., Ltd. 61,290
41,300 Daido Metal Co., Ltd. 490,019
13,000 Daido Steel Co., Ltd. 702,008
174,000 Daiho Corp. 1,058,735
27,000 Daikyonishikawa Corp. 485,295
40,800 DIC Corp. 1,384,545
24,800 Eagle Industry Co., Ltd. 447,252
24

Segall Bryant & Hamill International Small Cap Fund SCHEDULE OF INVESTMENTS – Continued As of April 30, 2018 (Unaudited)
Number of Shares Value __________ ____________
COMMON STOCKS (Continued) JAPAN (Continued) 13,800 EDION Corp. $ 161,756
20,700 Elematec Corp. 461,305
67,500 EPS Holdings, Inc. 1,375,211
16,600 Exedy Corp. 562,207
8,200 FCC Co., Ltd. 231,946
82,700 Financial Products Group Co., Ltd. 1,052,996
73,400 Foster Electric Co., Ltd. 1,719,493
57,000 Fuji Machine Manufacturing Co., Ltd. 1,023,000
33,943 Fujimi, Inc. 734,800
6,000 Fuso Pharmaceutical Industries Ltd. 161,092
67,300 Futaba Industrial Co., Ltd. 537,881
69,500 Geo Holdings Corp. 1,135,723
52,000 Godo Steel Ltd. 1,213,909
12,700 Hakuto Co., Ltd. 185,740
162,100 Haseko Corp. 2,549,770
26,900 Hibiya Engineering Ltd. 522,146
78,500 Hosiden Corp. 935,894
1,245 Ichigo Office REIT Investment 923,535
68,200 Inabata & Co., Ltd. 1,046,838
2,725 Invincible Investment Corp. - REIT 1,216,418
35,600 Itochu Enex Co., Ltd. 349,176
5,200 Itochu-Shokuhin Co., Ltd. 289,407
19,000 J-Oil Mills, Inc. 655,755
16,782 Jaccs Co., Ltd. 379,965
73,000 Japan Aviation Electronics Industry Ltd. 1,243,466
1,930 Japan Hotel REIT Investment Corp. 1,460,263
213,700 Japan Securities Finance Co., Ltd. 1,404,239
214,500 JVC Kenwood Corp. 747,268
30,500 Kaga Electronics Co., Ltd. 754,290
37,200 Kaken Pharmaceutical Co., Ltd. 2,199,840
23,166 Kamei Corp. 321,390
35,100 Kanamoto Co., Ltd. 1,199,372
81,140 Kanematsu Corp. 1,239,298
17,824 Kasai Kogyo Co., Ltd. 250,485
31,300 Kato Sangyo Co., Ltd. 1,152,414
31,600 Keihin Corp. 624,228
511 Kenedix Retail REIT Corp. 1,081,612
44,900 Koa Corp. 979,514
6,800 Kumagai Gumi Co., Ltd. 231,393
165,649 Kurabo Industries Ltd. 546,624
56,500 Kyokuto Kaihatsu Kogyo Co., Ltd. 893,375
166,000 Leopalace21 Corp. 1,439,707
63,200 Macnica Fuji Electronics Holdings, Inc. 1,081,249
26,000 Maruha Nichiro Corp. 875,167
25

Segall Bryant & Hamill International Small Cap Fund SCHEDULE OF INVESTMENTS – Continued As of April 30, 2018 (Unaudited)
Number of Shares Value __________ ____________
COMMON STOCKS (Continued) JAPAN (Continued) 125,200 Matsui Securities Co., Ltd. $ 1,220,657
1,611 MCUBS MidCity Investment Corp. - REIT 1,215,439
4,321 Ministop Co., Ltd. 89,647
11,300 Mirait Holdings Corp. 179,211
30,200 Mitsubishi Steel Manufacturing Co., Ltd. 729,733
33,200 Mitsui Sugar Co., Ltd. 1,326,236
14,120 Miyazaki Bank Ltd. 457,050
72,600 Monex Group, Inc. 412,941
56,500 Nagase & Co., Ltd. 964,859
33,180 NEC Capital Solutions Ltd. 633,107
30,291 NEC Networks & System Integration Corp. 792,546
37,085 Nihon Chouzai Co., Ltd. 1,155,330
8,780 Nippo Corp. 201,369
10,120 Nippon Beet Sugar Manufacturing Co., Ltd. 224,232
6,562 Nippon Koei Co., Ltd. 192,367
355,400 Nippon Light Metal Holdings Co., Ltd. 949,992
551 NIPPON REIT Investment Corp. 1,673,199
15,800 Nippon Road Co., Ltd. 787,952
20,800 Nippon Steel & Sumikin Bussan Corp. 1,140,946
184,100 Nippon Suisan Kaisha Ltd. 997,746
97,700 Nishi-Nippon Financial Holdings, Inc. 1,173,178
31,980 Nishio Rent All Co., Ltd. 949,489
95,100 Nisshinbo Holdings, Inc. 1,340,195
1,597 Nissin Corp. 41,396
36,705 Nitto Boseki Co., Ltd. 792,773
26,300 Okumura Corp. 1,088,791
3,800 Paramount Bed Holdings Co., Ltd. 189,069
173,100 Penta-Ocean Construction Co., Ltd. 1,364,171
23,000 Pressance Corp. 351,403
187,000 Prima Meat Packers Ltd. 1,140,914
58,700 Qol Co., Ltd. 1,203,213
81,800 Raito Kogyo Co., Ltd. 888,864
7,300 Riken Corp. 419,870
2,600 Ryosan Co., Ltd. 96,752
62,900 Ryoyo Electro Corp. 1,041,469
133,200 San-In Godo Bank Ltd. 1,252,337
20,400 Sanoh Industrial Co., Ltd. 145,742
84,500 Shikoku Electric Power Co., Inc. 1,077,385
12,500 Shindengen Electric Manufacturing Co., Ltd. 784,215
27,100 Shinko Plantech Co., Ltd. 254,398
10,800 Shinko Shoji Co., Ltd. 187,726
51,600 Ship Healthcare Holdings, Inc. 1,791,711
35,300 Showa Corp. 530,591
47,400 Showa Denko KK 1,577,035
26

Segall Bryant & Hamill International Small Cap Fund SCHEDULE OF INVESTMENTS – Continued As of April 30, 2018 (Unaudited)
Number of Shares Value __________ ____________
COMMON STOCKS (Continued) JAPAN (Continued)
10,200 Sinanen Holdings Co., Ltd. $ 262,34712,300 SKY Perfect JSAT Holdings, Inc. 56,05186,600 Sodick Co., Ltd. 1,065,865
474,200 Sojitz Corp. 1,560,95319,300 Starzen Co., Ltd. 971,50043,300 Sumitomo Densetsu Co., Ltd. 918,80621,700 Sumitomo Forestry Co., Ltd. 359,574
180,700 Sumitomo Mitsui Construction Co., Ltd. 1,106,89249,276 Sumitomo Rubber Industries Ltd. 879,95526,500 Taiho Kogyo Co., Ltd. 357,72772,500 Taiyo Yuden Co., Ltd. 1,285,749
1,773 Takamatsu Construction Group Co., Ltd. 47,84313,900 Takasago Thermal Engineering Co., Ltd. 263,523
150,000 Tatsuta Electric Wire and Cable Co., Ltd. 926,1088,680 Toenec Corp. 271,150
105,900 Tokai Carbon Co., Ltd. 1,325,27723,000 Tokai Rika Co., Ltd. 459,473
160,800 Tokai Tokyo Financial Holdings, Inc. 1,164,73418,600 Token Corp. 1,771,28631,000 Tokyo Seimitsu Co., Ltd. 1,177,424
106,900 Tokyu Construction Co., Ltd. 1,141,6595,900 Topy Industries Ltd. 174,749
61,900 Tosei Corp. 758,77276,000 Tosoh Corp. 1,344,31326,500 Towa Pharmaceutical Co., Ltd. 1,686,180
225,878 Toyo Construction Co., Ltd. 1,080,233190,000 Toyo Ink SC Holdings Co., Ltd. 1,174,243
16,200 Toyo Kanetsu KK 494,22719,600 TS Tech Co., Ltd. 793,00847,900 Ube Industries Ltd. 1,459,23424,500 Ulvac, Inc. 1,310,60827,800 Unipres Corp. 654,57246,500 Valor Holdings Co., Ltd. 1,297,40036,300 Vital KSK Holdings, Inc. 355,76923,700 Wakita & Co., Ltd. 250,41451,000 Xebio Holdings Co., Ltd. 960,83112,266 Yellow Hat Ltd. 363,80847,500 Yokogawa Bridge Holdings Corp. 1,034,38919,500 Yorozu Corp. 335,767
101,691 Yurtec Corp. 888,95222,200 Zenkoku Hosho Co., Ltd. 916,139 ____________
125,047,792 ____________
27

Segall Bryant & Hamill International Small Cap Fund SCHEDULE OF INVESTMENTS – Continued As of April 30, 2018 (Unaudited)
Number of Shares Value __________ ____________
COMMON STOCKS (Continued) NETHERLANDS – 1.8%
8,578 Arcadis N.V. $ 168,686
50,285 ASR Nederland N.V. 2,371,599
19,755 BE Semiconductor Industries N.V. 1,365,314
15,010 Eurocommercial Properties N.V. 629,080
4,518 Kendrion N.V. 182,346
124,558 Koninklijke BAM Groep N.V. 593,249
22,015 NSI N.V. - REIT 947,754
45,875 Philips Lighting N.V. 1 1,395,124 ____________ 7,653,152 ____________ NEW ZEALAND – 0.7%
552,516 Air New Zealand Ltd. 1,267,758
235,450 Infratil Ltd. 527,820
108,881 New Zealand Refining Co., Ltd. 179,949
351,434 SKY Network Television Ltd. 561,706
40,915 Summerset Group Holdings Ltd. 198,069
36,280 Z Energy Ltd. 184,655 ____________ 2,919,957 ____________ NORWAY – 2.4%
27,310 Aker BP A.S.A. 895,756
66,417 Atea A.S.A. * 985,843
143,046 Austevoll Seafood A.S.A. 1,721,596
323,828 B2Holding A.S.A. 812,402
137,791 DNO A.S.A. * 255,160
105,083 Evry A.S. * 1 392,966
158,467 Kongsberg Automotive A.S.A. * 185,268
219,606 Leroy Seafood Group A.S.A. 1,610,879
28,111 Norwegian Finans Holding A.S.A. * 341,587
1,000 SpareBank 1 Nord Norge 7,375
123,311 SpareBank 1 SMN 1,234,337
194,511 Wallenius Wilhelmsen Logistics * 1,345,669 ____________ 9,788,838 ____________ PORTUGAL – 0.6%
121,475 Mota-Engil SGPS S.A. 526,284
146,323 NOS SGPS S.A. 869,757
844,485 Sonae SGPS S.A. 1,148,381 ____________ 2,544,422 ____________ SINGAPORE – 1.5%
546,100 Accordia Golf Trust 253,282
1,632,700 Asian Pay Television Trust 602,474
1,017,500 Best World International Ltd. 1,142,117
183,516 Bumitama Agri Ltd. 99,301
1,120,900 Cache Logistics Trust - REIT 705,254
28

Segall Bryant & Hamill International Small Cap Fund SCHEDULE OF INVESTMENTS – Continued As of April 30, 2018 (Unaudited)
Number of Shares Value __________ ____________
COMMON STOCKS (Continued) SINGAPORE (Continued) 1,119,266 ESR-REIT - REIT $ 446,102
1,191,400 Frasers Logistics & Industrial Trust - REIT 940,900
658,000 M1 Ltd./Singapore 896,190
93,667 Sabana Shari'ah Compliant Industrial Real Estate Investment Trust 29,972
953,400 Yanlord Land Group Ltd. 1,215,765 ____________ 6,331,357 ____________ SPAIN – 2.3%
66,339 Atresmedia Corp. de Medios de Comunicacion S.A. 621,324
61,045 CIE Automotive S.A. 2,281,945
9,105 Corp Financiera Alba S.A. 566,618
6,108 Ebro Foods S.A. 147,291
274,887 Ence Energia y Celulosa S.A. 2,120,690
56,222 Euskaltel S.A. 1 521,294
34,234 Global Dominion Access S.A. * 1 199,343
16,559 Grupo Catalana Occidente S.A. 729,112
22,018 Hispania Activos Inmobiliarios SOCIMI S.A. - REIT 466,805
314,306 Liberbank S.A. * 179,793
4,723 Miquel y Costas & Miquel S.A. 190,259
42,571 Obrascon Huarte Lain S.A. * 198,492
73,552 Papeles y Cartones de Europa S.A. 1,423,202 ____________ 9,646,168 ____________ SWEDEN – 4.8%
176,348 Bilia A.B. - A Shares 1,453,917
199,345 Capio A.B. 1 900,334
231,557 Dios Fastigheter A.B. 1,469,058
25,359 Gunnebo A.B. 87,522
158,469 Hemfosa Fastigheter A.B. 1,962,966
48,879 Inwido A.B. 425,483
63,682 JM A.B. 1,259,900
216,295 KappAhl A.B. 628,628
31,905 Klovern A.B. - A Shares 39,560
21,900 Lindab International A.B. 169,028
43,346 Loomis A.B. - Class B 1,578,515
124,627 Mycronic A.B. 1,430,907
246,888 Nobina A.B. 1 1,620,210
185,796 Peab A.B. 1,644,910
200,710 Resurs Holding A.B. 1 1,293,098
592,696 SAS A.B. * 1,479,131
13,076 Scandic Hotels Group A.B. 1 128,706
427,093 SSAB A.B. 1,932,271
58,641 Tethys Oil A.B. 523,872
29

Segall Bryant & Hamill International Small Cap Fund SCHEDULE OF INVESTMENTS – Continued As of April 30, 2018 (Unaudited)
Number of Shares Value __________ ____________
COMMON STOCKS (Continued) SWEDEN (Continued)
2,378 Wihlborgs Fastigheter A.B. $ 55,109 ____________ 20,083,125 ____________
SWITZERLAND – 4.0%1,138 Allreal Holding A.G. 187,098
10,564 ALSO Holding A.G. * 1,301,6031,304 Autoneum Holding A.G. 341,4531,326 Bachem Holding A.G. 170,039
14,270 BKW A.G. 930,06714,695 Bobst Group S.A. 1,567,784
5,248 Cembra Money Bank A.G. 444,83818,764 EFG International A.G. * 152,422
4,008 Feintool International Holding A.G. * 457,01735,109 Galenica A.G. * 1 1,887,426
119,383 GAM Holding A.G. * 1,905,623532 Georg Fischer A.G. 661,306307 Gurit Holding A.G. 260,668
17,234 Implenia A.G. 1,315,57721,129 Kudelski S.A. * 194,38923,134 Landis+Gyr Group A.G. * 1,738,736
4,128 Orior A.G. 341,501242 Rieter Holding A.G. 46,731
5,532 Siegfried Holding A.G. * 1,922,264252 St. Galler Kantonalbank A.G. 135,282
4,356 Sunrise Communications Group A.G. * 1 341,44780 Vetropack Holding A.G. 164,682 ____________
16,467,953 ____________UNITED KINGDOM – 17.5%
25,579 Aggreko PLC 257,25540,021 Arrow Global Group PLC 203,49913,439 Barratt Developments PLC 103,04862,552 Bellway PLC 2,850,172
6,305 Berkeley Group Holdings PLC 352,96715,152 BGEO Group PLC 724,299
239,966 Biffa PLC 1 686,797236,403 Britvic PLC 2,336,627301,060 Central Asia Metals PLC 1,186,584
1,444 Clinigen Group PLC 17,402386,729 CMC Markets PLC 1 1,008,349284,313 Conviviality PLC -261,070 Crest Nicholson Holdings PLC 1,750,434
19,523 CVS Group PLC 265,00189,902 Dart Group PLC 1,059,269
663,416 Debenhams PLC 210,788
30
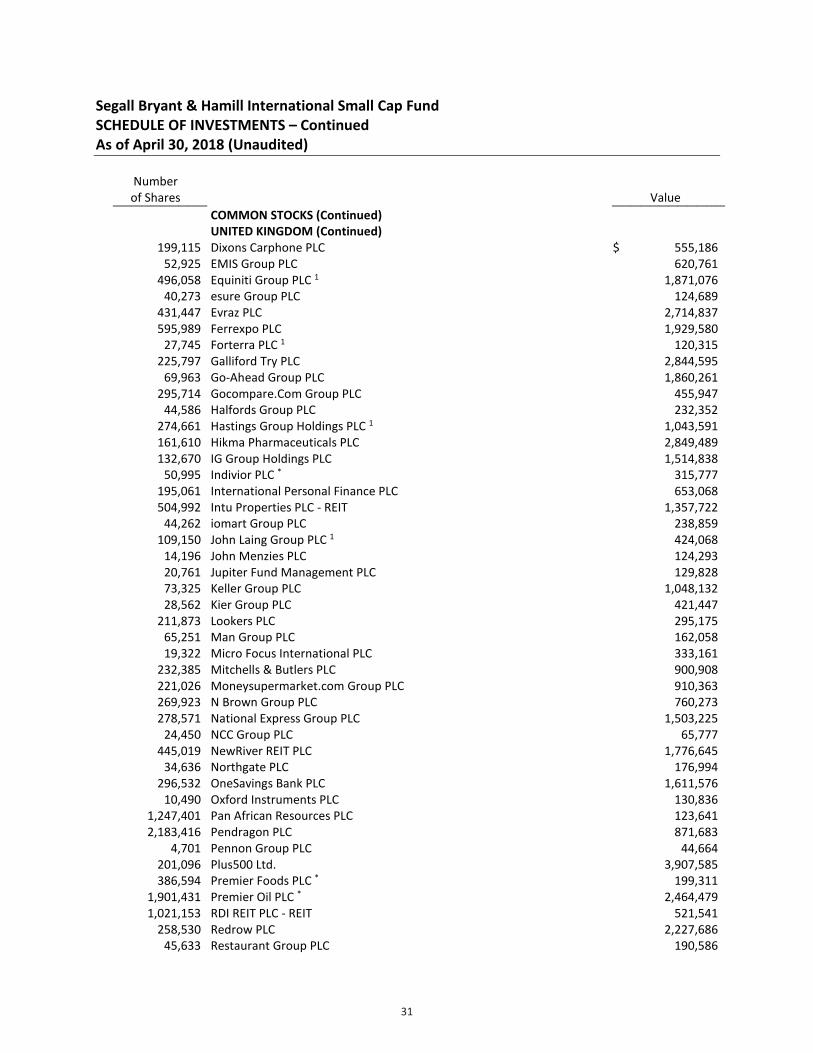
Segall Bryant & Hamill International Small Cap Fund SCHEDULE OF INVESTMENTS – Continued As of April 30, 2018 (Unaudited)
Number of Shares Value __________ ____________
COMMON STOCKS (Continued) UNITED KINGDOM (Continued) 199,115 Dixons Carphone PLC $ 555,186
52,925 EMIS Group PLC 620,761
496,058 Equiniti Group PLC 1 1,871,076
40,273 esure Group PLC 124,689
431,447 Evraz PLC 2,714,837
595,989 Ferrexpo PLC 1,929,580
27,745 Forterra PLC 1 120,315
225,797 Galliford Try PLC 2,844,595
69,963 Go-Ahead Group PLC 1,860,261
295,714 Gocompare.Com Group PLC 455,947
44,586 Halfords Group PLC 232,352
274,661 Hastings Group Holdings PLC 1 1,043,591
161,610 Hikma Pharmaceuticals PLC 2,849,489
132,670 IG Group Holdings PLC 1,514,838
50,995 Indivior PLC * 315,777
195,061 International Personal Finance PLC 653,068
504,992 Intu Properties PLC - REIT 1,357,722
44,262 iomart Group PLC 238,859
109,150 John Laing Group PLC 1 424,068
14,196 John Menzies PLC 124,293
20,761 Jupiter Fund Management PLC 129,828
73,325 Keller Group PLC 1,048,132
28,562 Kier Group PLC 421,447
211,873 Lookers PLC 295,175
65,251 Man Group PLC 162,058
19,322 Micro Focus International PLC 333,161
232,385 Mitchells & Butlers PLC 900,908
221,026 Moneysupermarket.com Group PLC 910,363
269,923 N Brown Group PLC 760,273
278,571 National Express Group PLC 1,503,225
24,450 NCC Group PLC 65,777
445,019 NewRiver REIT PLC 1,776,645
34,636 Northgate PLC 176,994
296,532 OneSavings Bank PLC 1,611,576
10,490 Oxford Instruments PLC 130,836
1,247,401 Pan African Resources PLC 123,641
2,183,416 Pendragon PLC 871,683
4,701 Pennon Group PLC 44,664
201,096 Plus500 Ltd. 3,907,585
386,594 Premier Foods PLC * 199,311
1,901,431 Premier Oil PLC * 2,464,479
1,021,153 RDI REIT PLC - REIT 521,541
258,530 Redrow PLC 2,227,686
45,633 Restaurant Group PLC 190,586
31

Segall Bryant & Hamill International Small Cap Fund SCHEDULE OF INVESTMENTS – Continued As of April 30, 2018 (Unaudited)
Number of Shares Value __________ ____________
COMMON STOCKS (Continued) UNITED KINGDOM (Continued)
59,989 RPC Group PLC $ 650,910280,793 Safestore Holdings PLC - REIT 2,111,900
90,118 Saga PLC 168,028131,644 Savills PLC 1,773,497
24,242 Spectris PLC 894,42860,127 Spire Healthcare Group PLC 1 188,079
8,873 Staffline Group PLC 119,097803,346 Stagecoach Group PLC 1,715,626
57,209 Tate & Lyle PLC 451,812171,743 Telford Homes PLC 1,068,665279,356 Telit Communications PLC * 619,167
1,200,928 Thomas Cook Group PLC 2,039,62737,137 TT Electronics PLC 113,49757,265 UDG Healthcare PLC 719,44710,984 UNITE Group PLC 126,097
219,984 Vesuvius PLC 1,776,498158,429 Watkin Jones PLC 442,746260,170 William Hill PLC 1,046,411
12,363 Workspace Group PLC - REIT 188,817159,846 ZPG PLC 1 789,988 ____________
72,645,706 ____________TOTAL COMMON STOCKS
(Cost $360,266,149) 392,376,035 ____________PREFERRED STOCKS – 0.6%GERMANY – 0.6%
9,199 Draegerwerk A.G. & Co. KGaA 676,76617,677 Sixt S.E. 1,444,487
1,458 STO S.E. & Co. KGaA 194,376 ____________ 2,315,629 ____________
TOTAL PREFERRED STOCKS (Cost $1,898,271) 2,315,629 ____________
UNITS – 0.9%AUSTRALIA – 0.7%
290,368 Abacus Property Group - REIT 787,839200,143 Aventus Retail Property Fund Ltd. - REIT 323,532
1,686,057 Cromwell Property Group - REIT 1,372,277324,212 GDI Property Group - REIT 304,759 ____________
2,788,407 ____________
32
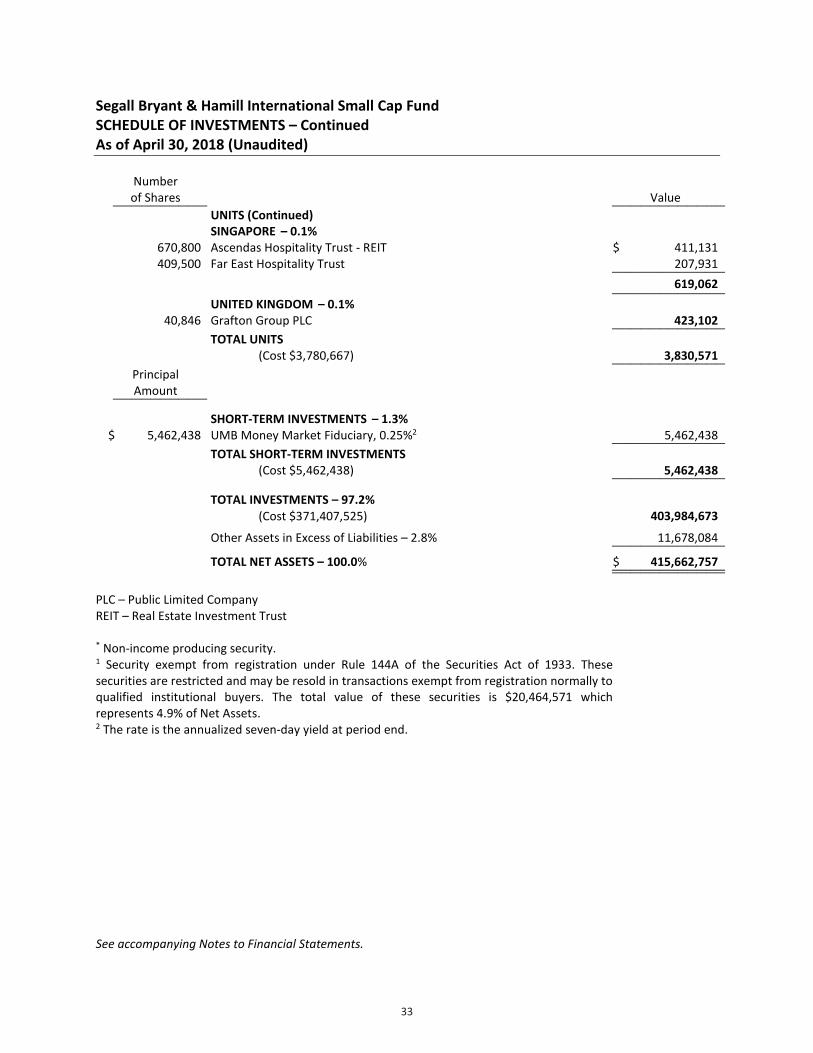
Segall Bryant & Hamill International Small Cap Fund SCHEDULE OF INVESTMENTS – Continued As of April 30, 2018 (Unaudited)
Number of Shares Value __________ ____________
UNITS (Continued) SINGAPORE – 0.1%
670,800 Ascendas Hospitality Trust - REIT $ 411,131
409,500 Far East Hospitality Trust 207,931 ____________ 619,062 ____________ UNITED KINGDOM – 0.1%
40,846 Grafton Group PLC 423,102 ____________
TOTAL UNITS (Cost $3,780,667) 3,830,571 ____________
Principal Amount __________
SHORT-TERM INVESTMENTS – 1.3%
$ 5,462,438 UMB Money Market Fiduciary, 0.25%2 5,462,438 ____________
TOTAL SHORT-TERM INVESTMENTS (Cost $5,462,438) 5,462,438 ____________
TOTAL INVESTMENTS – 97.2% (Cost $371,407,525) 403,984,673
Other Assets in Excess of Liabilities – 2.8% 11,678,084 ____________ TOTAL NET ASSETS – 100.0% $ 415,662,757 ________________________ PLC – Public Limited Company REIT – Real Estate Investment Trust * Non-income producing security. 1 Security exempt from registration under Rule 144A of the Securities Act of 1933. Thesesecurities are restricted and may be resold in transactions exempt from registration normally to qualified institutional buyers. The total value of these securities is $20,464,571 which represents 4.9% of Net Assets. 2 The rate is the annualized seven-day yield at period end. See accompanying Notes to Financial Statements.
33

Segall Bryant & Hamill International Small Cap Fund SUMMARY OF INVESTMENTS As of April 30, 2018 (Unaudited)
Security Type/Sector Percent of Total
Net Assets Common Stocks
Financials 21.6% Consumer Discretionary 18.3% Industrials 14.1% Materials 11.7% Technology 8.2% Consumer Staples 7.7% Health Care 4.8% Communications 3.5% Energy 2.7% Utilities 1.8% __________
Total Common Stocks 94.4% Preferred Stocks
Consumer Discretionary 0.4% Health Care 0.2% Materials 0.0% __________
Total Preferred Stocks 0.6% Units
Financials 0.8% Consumer Discretionary 0.1% __________
Total Units 0.9% __________Short-Term Investments 1.3% __________Total Investments 97.2% Other Assets in Excess of Liabilities 2.8% __________Total Net Assets 100.0% ____________________
See accompanying Notes to Financial Statements.
34

Segall Bryant & Hamill International Small Cap FundSTATEMENT OF ASSETS AND LIABILITIESAs of April 30, 2018 (Unaudited)
Assets:Investments, at value (cost $371,407,525) $ 403,984,673Foreign currency, at value (cost $739,517) 739,517 Receivables: Investment securities sold 1,202,072 Fund shares sold 9,450,676 Dividends and interest 2,742,233Prepaid expenses 33,146 Total assets 418,152,317
Liabilities:Payables: Investment securities purchased 1,973,239 Fund shares redeemed 176,110 Advisory fees 242,615 Distribution fees (Note 8) 5,599 Fund administration fees 27,956 Fund accounting fees 26,248 Auditing fees 9,161 Custody fees 7,505 Transfer agent fees and expenses 7,320 Trustees' deferred compensation (Note 4) 1,007 Trustees' fees and expenses 639 Chief Compliance Officer fees 607Accrued other expenses 11,554 Total liabilities 2,489,560 Net Assets $ 415,662,757
Components of Net Assets:Paid-in capital (par value of $0.01 per share with an unlimited number of shares authorized) $ 371,846,123 Accumulated net investment income 1,055,724 Accumulated net realized gain on investments and foreign currency transactions 10,236,133 Net unrealized appreciation (depreciation) on: Investments 32,577,148 Foreign currency translations (52,371) Net Assets $ 415,662,757
Maximum Offering Price per Share: Class A Shares: Net assets applicable to shares outstanding $ 27,854,347 Shares of beneficial interest issued and outstanding 1,985,518 Redemption Price $ 14.03 Maximum sales charge (5.75% of offering price)* 0.86 Maximum public offering price to public $ 14.89
Class I Shares: Net assets applicable to shares outstanding $ 387,808,410 Shares of beneficial interest issued and outstanding 27,601,796 Offering and redemption price per share $ 14.05
See accompanying Notes to Financial Statements.
* No sales charge applies on investments of $1,000,000 or more, but a Contingent Deferred Sales Charge ("CDSC") of 1% will be imposed on certainredemptions of such shares within 12 months of the date of purchase.
35

Segall Bryant & Hamill International Small Cap FundSTATEMENT OF OPERATIONSFor the Six Months Ended April 30, 2018 (Unaudited)
Investment Income:Dividends (net of foreign withholding taxes of $760,218) 5,606,932$ Interest 1,913
Total investment income 5,608,845
Expenses:Advisory fees 1,629,767 Fund administration fees 179,579 Fund accounting fees 139,604 Custody fees 70,974 Registration fees 40,911 Transfer agent fees and expenses 36,752 Distribution fees (Note 8) 32,646 Miscellaneous 14,793 Legal fees 10,926 Auditing fees 9,040 Shareholder reporting fees 8,319 Trustees' fees and expenses 3,697 Chief Compliance Officer fees 2,575 Insurance fees 743
Total expenses 2,180,326 Advisory fees waived (282,504)
Net expenses 1,897,822 Net investment income 3,711,023
Realized and Unrealized Gain (Loss):Net realized gain on:
Investments 10,445,668 Foreign currency transactions 1,725
Net realized gain 10,447,393 Net change in unrealized appreciation/depreciation on:
Investments (6,774,097) Foreign currency translations (41,231)
Net change in unrealized appreciation/depreciation (6,815,328) Net realized and unrealized gain 3,632,065
Net Increase in Net Assets from Operations 7,343,088$
See accompanying Notes to Financial Statements.
36

Segall Bryant & Hamill International Small Cap FundSTATEMENTS OF CHANGES IN NET ASSETS
Increase (Decrease) in Net Assets from:Operations:
$ 3,711,023 $ 4,292,939 10,447,393 11,838,795
(6,815,328) 35,283,482 7,343,088 51,415,216
From net investment income: Class A (513,645) (193,992) Class I (7,051,248) (1,463,062)
Class A (772,845) - Class I (9,639,620) - Total distributions to shareholders (17,977,358) (1,657,054)
Class A 2,954,028 9,704,399 Class I 101,279,833 187,886,686 Reinvestment of distributions: Class A 991,942 192,273 Class I 14,728,849 1,388,281 Cost of shares redeemed: Class A1 (544,954) (687,138) Class I2 (17,080,689) (8,141,061) Net increase in net assets from capital transactions 102,329,009 190,343,440
91,694,739 240,101,602
323,968,018 83,866,416 $ 415,662,757 $ 323,968,018
$ 1,055,724 $ 4,909,594
Capital Share Transactions: Shares sold: Class A 207,609 758,525 Class I 7,154,131 14,969,379 Shares reinvested: Class A 71,776 16,940 Class I 1,064,993 122,315 Shares redeemed: Class A (38,699) (54,176) Class I (1,222,020) (597,593) Net increase from capital share transactions 7,237,790 15,215,390
1 Net of redemption fees of $424 and $0, respectively.2 Net of redemption fees of $3,933 and $14,270, respectively.
See accompanying Notes to Financial Statements.
Net investment income
currency translations
Distributions to Shareholders:
From net realized gain:
For the Year Ended
October 31, 2017
Six Months Ended
Beginning of period End of period
Net change in unrealized appreciation/depreciation on investments and foreign
Net increase in net assets resulting from operations
Capital Transactions: Net proceeds from shares sold:
For the
(Unaudited)April 30, 2018
Accumulated net investment income
Net realized gain on investments and foreign currency transactions
Total increase in net assets
Net Assets:
37

Sega
ll Br
yant
& H
amill
Inte
rnat
iona
l Sm
all C
ap F
und
FIN
ANCI
AL H
IGHL
IGHT
S Cl
ass A
Per s
hare
ope
ratin
g pe
rform
ance
.Fo
r a ca
pita
l sha
re o
utst
andi
ng th
roug
hout
eac
h pe
riod.
For t
heSi
x M
onth
s End
edFo
r the
Per
iod
April
30,
201
8Ju
ne 3
0, 2
014*
thro
ugh
(Una
udite
d)20
1720
1620
15O
ctob
er 3
1, 2
014
Net
ass
et v
alue
, beg
inni
ng o
f per
iod
14.4
7$
11.7
4$
11.3
6$
11.5
7$
12.7
6$
Inco
me
from
Inve
stm
ent O
pera
tions
:Ne
t inv
estm
ent i
ncom
e10.
13
0.
23
0.
26
0.
21
0.
07
Ne
t rea
lized
and
unr
ealiz
ed g
ain
(loss
) on
inve
stm
ents
0.16
2.69
0.35
0.28
(1.0
9)
To
tal f
rom
inve
stm
ent o
pera
tions
0.29
2.92
0.61
0.49
(1.0
2)
Less
Dist
ribut
ions
:Fr
om n
et in
vest
men
t inc
ome
(0.2
9)
(0
.19)
(0.1
7)
(0
.22)
(0.1
7)
Fr
om n
et re
alize
d ga
in(0
.44)
-
(0.0
6)
(0
.48)
-
Tota
l dist
ribut
ions
(0.7
3)
(0
.19)
(0.2
3)
(0
.70)
(0.1
7)
Rede
mpt
ion
fee
proc
eeds
1-
3
-
-
-
-
Net
ass
et v
alue
, end
of p
erio
d14
.03
$
14
.47
$
11
.74
$
11
.36
$
11
.57
$
Tota
l ret
urn2
2.05
%4
25.2
7%5.
43%
4.47
%(8
.10)
%4
Ratio
s and
Sup
plem
enta
l Dat
a:Ne
t ass
ets,
end
of p
erio
d (in
thou
sand
s)27
,854
$
25
,240
$
12
,013
$
11
,927
$
9
$
Ratio
of e
xpen
ses t
o av
erag
e ne
t ass
ets:
Befo
re fe
es w
aive
d an
d ex
pens
es a
bsor
bed
1.44
%5
1.47
%2.
09%
1.29
%1.
16%
5
Afte
r fee
s wai
ved
and
expe
nses
abs
orbe
d 1.
28%
51.
28%
1.28
%1.
29%
1.16
%5
Ratio
of n
et in
vest
men
t inc
ome
to a
vera
ge n
et a
sset
s:Be
fore
fees
wai
ved
and
expe
nses
abs
orbe
d1.
66%
51.
61%
1.55
%2.
11%
1.65
%5,
6
Afte
r fee
s wai
ved
and
expe
nses
abs
orbe
d1.
82%
51.
80%
2.36
%2.
11%
1.65
%5
Port
folio
turn
over
rate
49%
410
1%94
%13
0%10
1%
*Co
mm
ence
men
t of o
pera
tions
.1
Base
d on
ave
rage
shar
es o
utst
andi
ng fo
r the
per
iod.
2 3Am
ount
repr
esen
ts le
ss th
an $
0.01
per
shar
e.4
Not a
nnua
lized
.5
Annu
alize
d.6
Unau
dite
d.
See
acco
mpa
nyin
g No
tes t
o Fi
nanc
ial S
tate
men
ts.
For t
he Y
ear E
nded
Oct
ober
31,
Tota
lret
urns
wou
ldha
vebe
enlo
wer
had
expe
nses
notb
een
wai
ved
orab
sorb
edby
the
Advi
sor.
Retu
rns
show
ndo
notr
efle
ctth
ede
duct
ion
ofta
xes
that
ash
areh
olde
rwou
ldpa
yon
Fund
dist
ribut
ions
orth
ere
dem
ptio
nof
Fund
shar
es.
Retu
rns s
how
n do
not
inclu
de p
aym
ent o
f sal
es lo
ad o
f 5.7
5% o
f offe
ring
price
whi
ch is
redu
ced
on sa
les o
f $1,
000,
000
or m
ore.
If th
e sa
les c
harg
e w
as in
clude
d to
tal r
etur
ns w
ould
be
low
er.
38

Sega
ll Br
yant
& H
amill
Inte
rnat
iona
l Sm
all C
ap F
und
FINA
NCIA
L HIG
HLIG
HTS
Clas
s I
Per s
hare
ope
ratin
g pe
rform
ance
.Fo
r a ca
pita
l sha
re o
utst
andi
ng th
roug
hout
eac
h pe
riod.
For t
heSi
x M
onth
s End
edAp
ril 3
0, 2
018
(Una
udite
d)20
1720
1620
1520
1420
13Ne
t ass
et v
alue
, beg
inni
ng o
f per
iod
14.5
0$
11
.76
$
11.3
6$
11
.57
$
11.7
7$
8.
88$
In
com
e fr
om In
vest
men
t Ope
ratio
ns:
Net i
nves
tmen
t inc
ome1
0.15
0.
27
0.29
0.
27
0.30
0.
26
Net r
ealiz
ed a
nd u
nrea
lized
gai
n on
inve
stm
ents
0.16
2.
68
0.34
0.
23
0.16
2
2.85
To
tal f
rom
inve
stm
ent o
pera
tions
0.31
2.
95
0.63
0.
50
0.46
3.
11
Less
Dist
ribut
ions
:Fr
om n
et in
vest
men
t inc
ome
(0.3
2)
(0.2
1)
(0.1
7)
(0.2
3)
(0.3
3)
(0.2
5)
From
net
real
ized
gain
(0.4
4)
- (0
.06)
(0
.48)
(0
.33)
-
Tota
l dist
ribut
ions
(0.7
6)
(0.2
1)
(0.2
3)
(0.7
1)
(0.6
6)
(0.2
5)
Purc
hase
Pre
miu
m-
- -
- -
0.03
Rede
mpt
ion
fee
proc
eeds
1-
3-
3-
- -
3-
3
Net
ass
et v
alue
, end
of p
erio
d14
.05
$
14.5
0$
11
.76
$
11.3
6$
11
.57
$
11.7
7$
Tota
l ret
urn4
2.18
%6
25.6
0%5.
66%
4.61
%3.
96%
35.9
7%
Ratio
s and
Sup
plem
enta
l Dat
a:Ne
t ass
ets,
end
of p
erio
d (in
thou
sand
s)38
7,80
9$
29
8,72
8$
71,8
53$
35
,367
$
45,0
74$
22
,049
$
Ratio
of e
xpen
ses t
o av
erag
e ne
t ass
ets:
Befo
re fe
es w
aive
d an
d ex
pens
es a
bsor
bed
1.19
%7
1.22
%1.
84%
1.06
%0.
97%
1.35
%Af
ter f
ees w
aive
d an
d ex
pens
es a
bsor
bed
1.03
%7
1.03
%1.
03%
1.06
%0.
97%
1.10
%Ra
tio o
f net
inve
stm
ent i
ncom
e to
ave
rage
net
ass
ets:
Befo
re fe
es w
aive
d an
d ex
pens
es a
bsor
bed
1.91
%7
1.86
%1.
80%
2.34
%2.
44%
52.
30%
5
Afte
r fee
s wai
ved
and
expe
nses
abs
orbe
d2.
07%
72.
05%
2.61
%2.
34%
2.44
%2.
55%
Port
folio
turn
over
rate
49%
610
1%94
%13
0%10
1%10
3%
1Ba
sed
on a
vera
ge sh
ares
out
stan
ding
for t
he p
erio
d.2 3
Amou
nt re
pres
ents
less
than
$0.
01 p
er sh
are.
4 5Un
audi
ted.
6No
t ann
ualiz
ed.
7An
nual
ized.
See
acco
mpa
nyin
g No
tes t
o Fi
nanc
ial S
tate
men
ts.
For t
he Y
ear E
nded
Oct
ober
31,
The
amou
ntsh
own
fora
shar
eou
tsta
ndin
gdo
esno
tcor
resp
ond
with
the
aggr
egat
ene
trea
lized
and
unre
alize
dga
info
rthe
perio
ddu
eto
the
timin
gof
purc
hase
sand
rede
mpt
ions
ofPo
rtfo
liosh
ares
inre
latio
nto
the
fluct
uatin
gne
tass
etva
lue
per s
hare
of t
he P
ortfo
lio.
Tota
l ret
urns
wou
ld h
ave
been
low
er h
ad fe
es n
ot b
een
wai
ved
by th
e Ad
viso
r. Th
ese
retu
rns d
o no
t ref
lect
the
dedu
ctio
n of
taxe
s tha
t a sh
areh
olde
r wou
ld p
ay o
n th
e Fu
nd d
istrib
utio
ns o
r red
empt
ion
of F
und
shar
es.
39

Segall Bryant & Hamill Funds NOTES TO FINANCIAL STATEMENTS April 30, 2018 (Unaudited)
Note 1 – Organization Segall Bryant & Hamill Emerging Markets Fund (the “Emerging Markets Fund”) and Segall Bryant & Hamill International Small Cap Fund (the “International Small Cap Fund”) (each a “Fund” and collectively the “Funds”) are organized as a diversified series of Investment Managers Series Trust, a Delaware statutory trust (the “Trust”) which is registered as an open-end management investment company under the Investment Company Act of 1940, as amended (the “1940 Act”). The Emerging Markets Fund’s primary investment objective is to seek long-term capital appreciation. The Fund currently offers two classes of shares: Class A and Class I. The Fund’s Class A shares commenced investment operations on June 30, 2014. The Fund’s Class I shares commenced investment operations on June 30, 2011. The Emerging Markets Fund (the “Successor Fund”) acquired the assets and liabilities of the Philadelphia International Emerging Markets Fund (the “Predecessor Fund”), a series of the Glenmede Fund Inc., on October 29, 2015. With respect to the Philadelphia International Emerging Markets Fund, Class I shareholders received Class A shares of the Successor Fund, and Class IV shareholders received Class I shares of the Successor Fund. As a result of the reorganization, the Fund is the accounting successor of the Predecessor Fund and accordingly, certain financial history of the Predecessor Fund is included in these financial statements. The International Small Cap Fund’s primary investment objective is to seek long-term capital appreciation. The Fund currently offers two classes of shares: Class A and Class I. The Fund’s Class A shares commenced investment operations on June 30, 2014. The Fund’s Class I shares commenced investment operations on May 31, 2011. The International Small Cap Fund (the “Successor Fund”) acquired the assets and liabilities of the Philadelphia International Small Cap Fund (the “Predecessor Fund”), a series of the Glenmede Fund Inc., on October 29, 2015. With respect to the Philadelphia International Small Cap Fund, Class I shareholders received Class A shares of the Successor Fund, and Class IV shareholders received Class I shares of the Successor Fund. As a result of the reorganization, the Fund is the accounting successor of the Predecessor Fund and accordingly, certain financial history of the Predecessor Fund is included in these financial statements. The shares of each class represent an interest in the same portfolio of investments of the Fund and have equal rights as to voting, redemptions, dividends and liquidation, subject to the approval of the Trustees. Income, expenses (other than expenses attributable to a specific class) and realized and unrealized gains and losses on investments are allocated to each class of shares in proportion to their relative shares outstanding. Shareholders of a class that bears distribution and service expenses under the terms of a distribution plan have exclusive voting rights to that distribution plan. Each Fund is an investment company and accordingly follows the investment company accounting and reporting guidance of the Financial Accounting Standards Board (FASB) Accounting Standard Codification Topic 946 “Financial Services—Investment Companies.” Note 2 – Accounting Policies The following is a summary of the significant accounting policies consistently followed by the Funds in the preparation of their financial statements. The preparation of financial statements in conformity with accounting principles generally accepted in the United States of America (“GAAP”) requires management to make estimates and assumptions that affect the reported amounts and disclosures in the financial statements. Actual results could differ from these estimates. (a) Valuation of Investments The Funds value equity securities at the last reported sale price on the principal exchange or in the principal over the counter (“OTC”) market in which such securities are traded, as of the close of regular trading on the NYSE on
40

Segall Bryant & Hamill Funds NOTES TO FINANCIAL STATEMENTS – Continued April 30, 2018 (Unaudited)
the day the securities are being valued or, if the last-quoted sales price is not readily available, the securities will be valued at the last bid or the mean between the last available bid and ask price. Securities traded on the NASDAQ are valued at the NASDAQ Official Closing Price (“NOCP”). Investments in open-end investment companies are valued at the daily closing net asset value of the respective investment company. Debt securities are valued by utilizing a price supplied by independent pricing service providers. The independent pricing service providers may use various valuation methodologies including matrix pricing and other analytical pricing models as well as market transactions and dealer quotations. These models generally consider such factors as yields or prices of bonds of comparable quality, type of issue, coupon, maturity, ratings and general market conditions. If a price is not readily available for a portfolio security, the security will be valued at fair value (the amount which the Fund might reasonably expect to receive for the security upon its current sale) as determined in good faith by the Fund’s advisor, subject to review and approval by the Valuation Committee, pursuant to procedures adopted by the Board of Trustees. The actions of the Valuation Committee are subsequently reviewed by the Board at its next regularly scheduled board meeting. The Valuation Committee meets as needed. The Valuation Committee is comprised of all the Trustees, but action may be taken by any one of the Trustees. Fair value pricing may be applied to foreign securities held by the Funds upon the occurrence of an event after the close of trading on non-U.S. markets but before the close of trading on the NYSE when each Fund’s NAV is determined. If the event may result in a material adjustment to the price of the Fund’s foreign securities once non-U.S. markets open on the following business day (such as, for example, a significant surge or decline in the U.S. market), the Fund may value such foreign securities at fair value, taking into account the effect of such event, in order to calculate the Fund’s NAV. Other types of portfolio securities that the Fund may fair value include, but are not limited to: (1) investments that are illiquid or traded infrequently, including “restricted” securities and private placements for which there is no public market; (2) investments for which, in the judgment of the Advisor, the market price is stale; (3) securities of an issuer that has entered into a restructuring; (4) securities for which trading has been halted or suspended; and (5) fixed income securities for which there is not a current market value quotation. A Fund’s assets are valued at their fair market value. If a market quotation is not readily available for a portfolio security, the security will be valued at fair value (the amount which the Fund might reasonably expect to receive for the security upon its current sale) as determined in good faith by the Funds’ advisor, subject to review and approval by the Valuation Committee, pursuant to procedures adopted by the Board of Trustees. The actions of the Valuation Committee are subsequently reviewed by the Board at its next regularly scheduled board meeting. The Valuation Committee meets as needed. The Valuation Committee is comprised of all the Trustees, but action may be taken by any one of the Trustees. Foreign securities traded in countries outside the U.S. are fair valued by utilizing the quotations of an independent pricing service or from a brokerage firm. The pricing service will use a statistical analyses and quantitative models to adjust local prices using factors such as subsequent movement and changes in the prices of indexes, securities and exchange rates in other markets in determining fair value as of the time the Fund calculates the NAVs. The Board reviews the independent third party fair valuation analysis report quarterly. (b) Investment Transactions, Investment Income and Expenses Investment transactions are accounted for on the trade date. Realized gains and losses on investments are determined on the identified cost basis. Dividend income is recorded net of applicable withholding taxes on the ex-dividend date and interest income is recorded on an accrual basis. Withholding taxes on foreign dividends, if applicable, are paid (a portion of which may be reclaimable) or provided for in accordance with the applicable country’s tax rules and rates and are disclosed in the Statement of Operations. Withholding tax reclaims are filed in certain countries to recover a portion of the amounts previously withheld. The Funds record a reclaim receivable
41

Segall Bryant & Hamill Funds NOTES TO FINANCIAL STATEMENTS – Continued April 30, 2018 (Unaudited)
based on a number of factors, including a jurisdiction’s legal obligation to pay reclaims as well as payment history and market convention. Discounts or premiums on debt securities are accreted or amortized to interest income over the lives of the respective securities using the effective interest method. Income and expenses of the Funds are allocated on a pro rata basis to each class of shares, except for distribution and service fees which are unique to each class of shares. Expenses incurred by the Trust with respect to more than one fund are allocated in proportion to the net assets of each fund except where allocation of direct expenses to each fund or an alternative allocation method can be more appropriately made. (c) Foreign Currency Translation The Funds’ records are maintained in U.S. dollars. The value of securities, currencies and other assets and liabilities denominated in currencies other than U.S. dollars are translated into U.S. dollars based upon foreign exchange rates prevailing at the end of the reporting period. The currencies are translated into U.S. dollars by using the exchange rates quoted at the close of the London Stock Exchange prior to when the Funds’ NAV is next determined. Purchases and sales of investment securities, income and expenses are translated on the respective dates of such transactions. The Funds do not isolate that portion of their net realized and unrealized gains and losses on investments resulting from changes in foreign exchange rates from the impact arising from changes in market prices. Such fluctuations are included with net realized and unrealized gain or loss from investments and foreign currency. Net realized foreign currency transaction gains and losses arise from sales of foreign currencies, currency gains or losses realized between the trade and settlement dates on securities transactions, and the differences between the amounts of dividends, interest, and foreign withholding taxes recorded on the Funds’ books and the U.S. dollar equivalent of the amounts actually received or paid. Net unrealized foreign currency translation gains and losses arise from changes in the value of assets and liabilities, other than investments in securities, resulting from changes in the exchange rates. (d) Federal Income Taxes The Funds intend to comply with the requirements of Subchapter M of the Internal Revenue Code applicable to regulated investment companies and to distribute substantially all of its net investment income and any net realized gains to its shareholders. Therefore, no provision is made for federal income or excise taxes. Due to the timing of dividend distributions and the differences in accounting for income and realized gains and losses for financial statement and federal income tax purposes, the fiscal year in which amounts are distributed may differ from the year in which the income and realized gains and losses are recorded by the Funds. Accounting for Uncertainty in Income Taxes (the “Income Tax Statement”) requires an evaluation of tax positions taken (or expected to be taken) in the course of preparing a Fund’s tax returns to determine whether these positions meet a “more-likely-than-not” standard that, based on the technical merits, have a more than fifty percent likelihood of being sustained by a taxing authority upon examination. A tax position that meets the “more-likely-than-not” recognition threshold is measured to determine the amount of benefit to recognize in the financial statements. The Funds recognize interest and penalties, if any, related to unrecognized tax benefits as income tax expense in the Statement of Operations. The Income Tax Statement requires management of the Funds to analyze tax positions taken in the prior three open tax years, if any, and tax positions expected to be taken in the Funds’ current tax year, as defined by the IRS statute of limitations for all major jurisdictions, including federal tax authorities and certain state tax authorities. As of and during the six months ended April 30, 2018 and as of and during the open tax years ended October 31, 2015 – 2017, the Funds did not have a liability for any unrecognized tax benefits. The Funds have no examination
42

Segall Bryant & Hamill Funds NOTES TO FINANCIAL STATEMENTS – Continued April 30, 2018 (Unaudited)
in progress and are not aware of any tax positions for which it is reasonably possible that the total amounts of unrecognized tax benefits will significantly change in the next twelve months. (e) Distributions to Shareholders The Funds declare and pay dividends at least annually from net investment income and from net realized gains, if any. Distributions to shareholders are recorded on the ex-dividend date. The amount and timing of distributions are determined in accordance with federal income tax regulations, which may differ from GAAP. The character of distributions made during the year from net investment income or net realized gains may differ from the characterization for federal income tax purposes due to differences in the recognition of income, expense and gain (loss) items for financial statement and tax purposes. (f) Preferred Stocks Preferred stocks are a class of stock having a preference over common stock as to the payment of dividends and the recovery of investment in the event a company is liquidated, although preferred stock is usually subordinate to the debt securities of the issuer. Preferred stock typically does not possess voting rights and its market value may change based on changes in interest rates. If interest rates rise, the fixed dividend on preferred stocks may be less attractive, causing the price of preferred stocks to decline. Preferred stock may have mandatory sinking fund provisions, as well as call/redemption provisions prior to maturity, a negative feature when interest rates decline. Note 3 – Reorganization Information On June 30, 2015, Philadelphia International Advisors LP (“Philadelphia International”), the investment adviser to the Philadelphia International Emerging Markets Fund and the Philadelphia International Small Cap Fund (each a “Portfolio” and collectively, the “Portfolios”), sold certain of its assets (the “Transaction”), including those assets relating to the management of the Portfolios to Segall Bryant & Hamill, LLC (“Segall”), the portfolio management team that has managed the Portfolios joined Segall and continued to manage the Portfolios in the same capacity at Segall. On May 18, 2015, the Board of Directors (the “Board”) of The Glenmede Fund, Inc. approved an Interim Investment Advisory Agreements (the “Interim Advisory Agreements”), on behalf of each Portfolio, with Segall effective upon the closing of the Transaction. The fee rates under the Interim Advisory Agreements are the same as the prior investment advisory agreements with Philadelphia International. On May 18, 2015, the Board also approved proposed new investment advisory agreements with Segall, subject to shareholder approval (the “New Advisory Agreements”) prior to the expiration of the Interim Advisory Agreements. On May 18, 2015, the Board also approved an Agreement and Plan of Reorganization for each Portfolio relating to the reorganization of each Portfolio (each, a “Reorganization”) into a newly created series of the Investment Managers Series Trust (each an “Acquiring Fund”). Each Acquiring Fund will have substantially similar investment objectives, investment policies and restrictions as its corresponding Portfolio and will continue to be managed by the same investment management team that currently manages each Portfolio. Each Reorganization is subject to the completion of certain conditions, including approval by the applicable Portfolio’s shareholders. This tax-free reorganization was accomplished on October 29, 2015 (the “Closing Date”), by exchanging the assets and liabilities of the Philadelphia International Emerging Markets Fund and the Philadelphia International Small Cap Fund for shares of the Emerging Markets Fund and International Small Cap Value Fund, respectively. Class I and Class IV shares of the Philadelphia International Emerging Markets Fund were exchanged for 1,154 shares of Class A of the Emerging Markets Fund (valued at $7,950) and 141,832 shares of Class I of the Emerging Markets Fund (valued at $978,111), respectively. Class I and Class IV shares of the Philadelphia International Small Cap Fund
43

Segall Bryant & Hamill Funds NOTES TO FINANCIAL STATEMENTS – Continued April 30, 2018 (Unaudited)
were exchanged for 1,049,760 shares of Class A of the International Small Cap Fund (valued at $11,853,058) and 3,113,307 shares of Class I of the International Small Cap Fund (valued at $35,143,444), respectively.
Note 4 – Investment Advisory and Other Agreements The Trust, on behalf of the Funds, entered into an Investment Advisory Agreement (the “Agreement”) with Segall (the “Advisor”). Under the terms of the Agreement, the Funds pay a monthly investment advisory fee to the Advisor at the annual rate of 0.90% of each Fund’s average daily net assets. The Advisor has contractually agreed to waive its fees and/or pay for operating expenses to ensure that total annual fund operating expenses (excluding any taxes, leverage interest, brokerage commissions, dividend and interest expenses on short sales, acquired fund fees and expenses as determined in accordance with Form N-1A, expenses incurred in connection with any merger or reorganization, and extraordinary expenses such as litigation expenses) do not exceed 1.48% and 1.23% of the average daily net assets of the Emerging Markets Fund’s Class A shares and Class I shares, respectively. The Advisor has contractually agreed to waive its fees and/or pay for operating expenses to ensure that total annual fund operating expenses (excluding any taxes, leverage interest, brokerage commissions, dividend and interest expenses on short sales, acquired fund fees and expenses as determined in accordance with Form N-1A, expenses incurred in connection with any merger or reorganization, and extraordinary expenses such as litigation expenses) do not exceed 1.28% and 1.03% of the average daily net assets of the International Small Cap Fund’s Class A shares and Class I shares, respectively. These agreements are in effect until February 28, 2019, and they may be terminated before that date only by the Trust’s Board of Trustees.
For the six months ended April 30, 2018, the Advisor waived fees and absorbed other expenses as follows:
Advisory fees waived
Other expenses absorbed Total
Emerging Markets Fund $ 168,415 $ 9,464 $ 177,879 International Small Cap Fund 282,504 - 282,504
$ 450,919 $ 9,464 $ 460,383
Each Fund’s advisor is permitted to seek reimbursement from the Fund, subject to certain limitations, of fees waived or payments made to the Fund for a period ending three full fiscal years after the date of the waiver or payment. This reimbursement may be requested from the Fund if the reimbursement will not cause the Fund’s annual expense ratio to exceed the lesser of (a) the expense limitation amount in effect at the time such fees were waived or payments made, or (b) the expense limitation amount in effect at the time of the reimbursement. The Advisor may recapture all or a portion of this amount no later than October 31, of the years stated below:
Emerging Markets Fund
International Small Cap Fund
2018 $ 1,387 $ 1,564 2019 490,840 446,934 2020 369,919 406,979 2021 177,879 282,504 Total $ 1,040,025 $ 1,137,981
44

Segall Bryant & Hamill Funds NOTES TO FINANCIAL STATEMENTS – Continued April 30, 2018 (Unaudited)
From November 1, 2014 to the close of business on October 29, 2015, the Previous Advisor contractually agreed to waive a portion of its fees in amounts necessary to limit the Predecessor Funds’ operating expenses to an annual rate (as a percentage of the average daily net assets) as follows: For the period November 1, 2014 through October 29, 2015, the Previous Advisor waived it advisory fees and absorbed other expenses totaling $190,845 and $0 for the Philadelphia International Emerging Markets Fund and Philadelphia International Small Cap Fund, respectively. IMST Distributors, LLC serves as the Funds’ distributor; UMB Fund Services, Inc. (“UMBFS”) serves as the Funds’ fund accountant, transfer agent and co-administrator; and Mutual Fund Administration, LLC (“MFAC”) serves as the Funds’ other co-administrator. UMB Bank, n.a., an affiliate of UMBFS, serves as the Funds’ custodian. Certain trustees and officers of the Trust are employees of UMBFS or MFAC. The Funds do not compensate trustees and officers affiliated with the Funds’ co-administrators. For the six months ended April 30, 2018, the Funds’ allocated fees incurred to Trustees who are not affiliated with the Funds’ co-administrators are reported on the Statement of Operations. The Funds’ Board of Trustees has adopted a Deferred Compensation Plan (the “Plan”) for the Independent Trustees that enables Trustees to elect to receive payment in cash or the option to select various Fund in the Trust in which their deferred accounts shall be deemed to be invested. If a trustee elects to defer payment, the Plan provides for the creation of a deferred payment account. The Funds’ liability for these amounts is adjusted for market value changes in the invested Fund and remains a liability to the Fund until distributed in accordance with the Plan. The Trustees Deferred compensation liability under the Plan constitutes a general unsecured obligation of the Fund and is disclosed in the Statement of Assets and Liabilities. Contributions made under the plan and the change in unrealized appreciation/depreciation and income are included in the Trustees' fees and expenses in the Statement of Operations. Dziura Compliance Consulting, LLC provides Chief Compliance Officer (“CCO”) services to the Trust. Each Fund’s allocated fees incurred for CCO services for the six months ended April 30, 2018, are reported on the Statement of Operations.
Predecessor Fund (Philadelphia International Emerging Markets Fund )
Predecessor Fund (Philadelphia International
Small Cap Fund ) Class I 1.48% 1.33% Class IV 1.25% 1.10%
45

Segall Bryant & Hamill Funds NOTES TO FINANCIAL STATEMENTS – Continued April 30, 2018 (Unaudited)
Note 5 – Federal Income Taxes At April 30, 2018, gross unrealized appreciation and depreciation on investments owned by the Funds, based on cost for federal income tax purposes were as follows:
Emerging Markets
Fund International Small
Cap Fund Cost of investments $ 32,357,342 $ 371,607,367
Gross unrealized appreciation $ 7,786,516 $ 50,466,445 Gross unrealized depreciation (1,443,964) (18,089,139)
Net unrealized appreciation on investments $ 6,342,552 $ 32,377,306 The difference between cost amounts for financial statement and federal income tax purposes is due primarily to timing differences in recognizing certain gains and losses in security transactions. As of October 31, 2017, the components of accumulated earnings (deficit) on a tax basis were as follows:
Emerging Markets Fund
International Small Cap Fund
Undistributed ordinary income $ 1,052,895 $ 13,661,680 Undistributed long-term capital gains 603,009 3,997,211 Accumulated earnings 1,655,904 17,658,891
Accumulated capital losses - - Other losses (74,036) (8,177) Unrealized appreciation on investments 6,080,959 36,811,330 Unrealized depreciation on foreign currency translations (45,070) (11,140) Total accumulated earnings $ 7,617,757 $ 54,450,904
Emerging Markets Fund and International Small Cap Fund utilized $599,368 and $313,425, respectively of its capital loss carryforward during the year ended October 31, 2017. The tax character of distributions paid during the fiscal years ended October 31, 2017, and October 31, 2016 were as follows:
Emerging Markets Fund International Small Cap Fund 2017 2016 2017 2016
Distributions paid from: Ordinary Income $ 382,796 $ 42,778 $ 1,657,054 $ 816,814 Net long-term capital gains - - - 88,025 Total distributions paid $ 382,796 $ 42,778 $ 1,657,054 $ 904,839
46

Segall Bryant & Hamill Funds NOTES TO FINANCIAL STATEMENTS – Continued April 30, 2018 (Unaudited)
Note 6 – Redemption Fee The Funds may impose a redemption fee of 2.00% of the total redemption amount on all shares redeemed within 90 days of purchase. For the six months ended April 30, 2018 and for the year ended October 31, 2017, redemption fees were as follows:
April 30, 2018 October 31, 2017 Emerging Markets Fund $ 141 $ - International Small Cap Fund 4,357 14,271
Note 7 – Investment Transactions For the six months ended April 30, 2018, purchases and sales of investments, excluding short-term investments, were as follows:
Purchases Sales Emerging Markets Fund $ 19,941,088 $ 18,433,679 International Small Cap Fund 254,346,073 178,217,708
Note 8 – Distribution Plan The Trust, on behalf of the Funds, has adopted a Distribution Plan (the “Plan”) pursuant to Rule 12b-1 under the 1940 Act which allows each Fund to pay distribution fees for the sale and distribution of its Class A shares. The Plan provides for the payment of distribution fees at the annual rate of up to 0.25% of each Fund’s average daily net assets attributable to Class A shares, payable to IMST Distributors, LLC. Class I shares do not pay any distribution fees. For the six months ended April 30, 2018, distribution fees incurred by each Fund’s Class A shares are disclosed on the Statement of Operations. Note 9 – Indemnifications In the normal course of business, the Funds enter into contracts that contain a variety of representations which provide general indemnifications. The Funds’ maximum exposure under these arrangements is unknown, as this would involve future claims that may be made against the Funds that have not yet occurred. However, the Funds expect the risk of loss to be remote.
47

Segall Bryant & Hamill Funds NOTES TO FINANCIAL STATEMENTS – Continued April 30, 2018 (Unaudited)
Note 10 – Fair Value Measurements and Disclosure Fair Value Measurements and Disclosures defines fair value, establishes a framework for measuring fair value in accordance with GAAP, and expands disclosure about fair value measurements. It also provides guidance on determining when there has been a significant decrease in the volume and level of activity for an asset or a liability, when a transaction is not orderly, and how that information must be incorporated into a fair value measurement. Under Fair Value Measurements and Disclosures, various inputs are used in determining the value of each Fund’s investments. These inputs are summarized into three broad Levels as described below:
Level 1 – Unadjusted quoted prices in active markets for identical assets or liabilities that the Fund has the ability to access. Level 2 – Observable inputs other than quoted prices included in Level 1 that are observable for the asset or liability, either directly or indirectly. These inputs may include quoted prices for the identical instrument on an inactive market, prices for similar instruments, interest rates, prepayment speeds, credit risk, yield curves, default rates and similar data. Level 3 – Unobservable inputs for the asset or liability, to the extent relevant observable inputs are not available, representing the Fund’s own assumptions about the assumptions a market participant would use in valuing the asset or liability, and would be based on the best information available.
The availability of observable inputs can vary from security to security and is affected by a wide variety of factors, including, for example, the type of security, whether the security is new and not yet established in the marketplace, the liquidity of markets, and other characteristics particular to the security. To the extent that valuation is based on models or inputs that are less observable or unobservable in the market, the determination of fair value requires more judgment. Accordingly, the degree of judgment exercised in determining fair value is greatest for instruments categorized in Level 3. The inputs used to measure fair value may fall into different Levels of the fair value hierarchy. In such cases, for disclosure purposes, the Level in the fair value hierarchy within which the fair value measurement falls in its entirety, is determined based on the lowest Level input that is significant to the fair value measurement in its entirety.
48

Segall Bryant & Hamill Funds NOTES TO FINANCIAL STATEMENTS – Continued April 30, 2018 (Unaudited)
The inputs or methodology used for valuing securities are not an indication of the risk associated with investing in those securities. The following is a summary of the inputs used, as of April 30, 2018, in valuing the Funds’ assets carried at fair value:
Emerging Markets Fund Level 1 Level 2 Level 3* Total Investments Common Stocks
Brazil $ 2,163,165 $ - $ - $ 2,163,165Chile 422,716 - - 422,716 China 1,843,349 9,647,777 - 11,491,126Colombia 311,803 - - 311,803 Czech Republic - 39,075 - 39,075Egypt 151,713 - - 151,713Greece 49,106 106,680 - 155,786Hungary - 38,797 - 38,797India 581,207 2,708,430 - 3,289,637Indonesia 320,771 597,314 - 618,085Malaysia 125,141 923,841 - 1,048,982Mexico 1,042,648 - - 1,042,648Peru 93,107 - - 93,107 Philippines 253,212 177,721 - 430,933Poland - 392,922 - 392,922Qatar 71,204 78,143 - 149,347Russia 47,952 1,114,553 - 1,162,505South Africa 653,759 1,787,503 - 2,441,262South Korea 618,610 5,019,338 - 5,637,948Taiwan 1,037,046 3,421,339 - 4,458,385Thailand 156,511 683,201 - 839,712Turkey 60,551 365,810 - 426,361United Arab Emirates 242,246 32,626 - 274,872
Preferred Stocks Brazil 736,524 - - 736,524 South Korea - 362,666 - 362,666Warrants** 353 - - 353Receipt** 12,621 - - 12,621Short-Term Investments 186,843 - - 186,843Total Investments $ 11,202,158 $ 27,497,736 $ - $ 38,699,894
* The Fund held level 3 securities valued at zero at period end.** All warrants and receipts held in the Fund are level 1 securities.
49

Segall Bryant & Hamill Funds NOTES TO FINANCIAL STATEMENTS – Continued April 30, 2018 (Unaudited)
International Small Cap Fund Level 1 Level 2 Level 3* Total Investments Common Stocks Australia $ 486,710 $ 23,121,903 $ - $ 23,608,613 Austria 1,683,551 3,637,118 - 5,320,669 Belgium 2,872,596 2,995,899 - 5,868,495 Denmark 1,713,436 2,656,672 - 4,370,108 Finland - 8,102,111 - 8,102,111 France - 15,904,302 - 15,904,302 Germany - 19,880,486 - 19,880,486 Hong Kong - 8,218,431 - 8,218,431 Ireland 2,051,287 1,596,216 - 3,647,503 Israel - 6,010,078 - 6,010,078 Italy 978,366 17,338,403 - 18,316,769 Japan - 125,047,792 - 125,047,792 Netherlands 947,754 6,705,398 - 7,653,152 New Zealand - 2,919,957 - 2,919,957 Norway 1,738,635 8,050,203 - 9,788,838 Portugal - 2,544,422 - 2,544,422 Singapore 253,282 6,078,075 - 6,331,357 Spain - 9,646,168 - 9,646,168 Sweden 628,628 19,454,497 - 20,083,125 Switzerland 756,981 15,710,972 - 16,467,953 United Kingdom 13,331,244 59,314,462 - 72,645,706 Preferred Stocks Germany 194,376 2,121,253 - 2,315,629 Units** - 3,830,571 - 3,830,571 Short-Term Investments 5,462,438 - - 5,462,438 Total Investments $ 33,099,284 $370,885,389 $ - $ 403,984,673
* The Fund did not hold any Level 3 securities at period end. **All units held in the Fund are level 2 securities. Transfers between Levels 1, 2 or 3 are recognized at the end of the reporting period. Transfers between Level 1 and Level 2 relate to the use of systematic fair valuation. When systematic fair valuation is used, securities whose primary market closes before the NYSE are classified as Level 2. The following is a reconciliation of transfers between Levels for the Funds from October 31, 2017 to April 30, 2018, represented by recognizing the April 30, 2018 market value of securities:
50

Segall Bryant & Hamill Funds NOTES TO FINANCIAL STATEMENTS – Continued April 30, 2018 (Unaudited)
Emerging Markets Fund
International Small Cap Fund
Transfers into Level 1 $ 148,101 $ 194,376 Transfers out of Level 1 (20,291,037) (250,827,945) Net transfers in (out) of Level 1 $ (20,142,936) $ (250,633,569)
Transfers into Level 2 $ 20,191,037 $ 250,827,945 Transfers out of Level 2 (148,101) (194,376) Net transfers in (out) of Level 2 $ 20,142,936 $ 250,633,569
The Emerging Markets Fund held level 3 securities valued at zero at period end. There was no change in valuation from October 31, 2017.
The following table presents additional information about valuation methodologies and inputs used for investments that are measured at fair value and categorized within Level 3 as of April 30, 2018:
Fair Value Valuation Unobservable Impact to
Valuation from an April 30, 2018 Methodologies Input(1) Increase in Input(2)
Common Stock $ - Fair Value PricingAdjusted by
management to reflect current conditions
Increase
(1) The investment advisor considers relevant indications of value that are reasonably and timely available to it indetermining the fair value to be assigned to a particular security, such as the type and cost of the security;contractual or legal restrictions on resale of the security; relevant financial or business developments of theissuer; actively traded related securities; conversion or exchange rights on the security; related corporateactions; significant events occurring after the close of trading in the security; and changes in overall marketconditions. The Fund’s use of fair value pricing may cause the net asset value of Fund shares to differ from thenet asset value that would be calculated using market quotations. Fair value pricing involves subjectivejudgments and it is possible that the fair value determined for a security may be materially different than thevalue that could be realized upon the sale of that security.
(2) This column represents the directional change in the fair value of the Level 3 investments that would resultfrom an increase to the corresponding unobservable input. A decrease to the unobservable input would havethe opposite effect.
Note 11 – Events Subsequent to the Fiscal Period End The Funds have adopted financial reporting rules regarding subsequent events which require an entity to recognize in the financial statements the effects of all subsequent events that provide additional evidence about conditions that existed at the date of the balance sheet. Management has evaluated the Funds’ related events and transactions that occurred through the date of issuance of the Funds’ financial statements. There were no other events or transactions that occurred during this period that materially impacted the amounts or disclosures in the Funds’ financial statements.
51

Segall Bryant & Hamill Funds EXPENSE EXAMPLES For the Six Months Ended April 30, 2018 (Unaudited)
Expense Examples As a shareholder of the Funds, you incur two types of costs: (1) transaction costs, and (2) ongoing costs, including management fees and other Fund expenses. The examples below are intended to help you understand your ongoing costs (in dollars) of investing in the Funds and to compare these costs with the ongoing costs of investing in other mutual funds. These examples are based on an investment of $1,000 invested at the beginning of the period and held for the entire period from November 1, 2017 to April 30, 2018. Actual Expenses The information in the row titled “Actual Performance” of the table below provides actual account values and actual expenses. You may use the information in these columns, together with the amount you invested, to estimate the expenses that you paid over the period. Simply divide your account value by $1,000 (for example, an $8,600 account value divided by $1,000 = 8.6), then multiply the result by the number in the appropriate row under the column titled “Expenses Paid During Period” to estimate the expenses you paid on your account during this period. Hypothetical Example for Comparison Purposes The information in the row titled “Hypothetical (5% annual return before expenses)” of the table below provides hypothetical account values and hypothetical expenses based on the Funds’ actual expense ratios and an assumed rate of return of 5% per year before expenses, which is not the Funds’ actual return. The hypothetical account values and expenses may not be used to estimate the actual ending account balance or expenses you paid for the period. You may use this information to compare the ongoing costs of investing in the Funds and other funds. To do so, compare these 5% hypothetical examples with the 5% hypothetical examples that appear in the shareholder reports of the other funds. Please note that the expenses shown in the table are meant to highlight your ongoing costs only and do not reflect any transaction costs, such as sales charges (load) or contingent deferred sales charges. Therefore, the information in the row titled “Hypothetical (5% annual return before expenses)” is useful in comparing ongoing costs only, and will not help you determine the relative total costs of owning different funds. In addition, if these transactional costs were included, your costs would have been higher.
Emerging Markets Fund
Beginning Account Value
Ending Account Value
Expenses Paid During Period*
11/1/17 4/30/18 11/1/17 – 4/30/18 Class A Actual Performance $ 1,000.00 $ 1,053.60 $ 7.54 Hypothetical (5% annual
return before expenses) 1,000.00 1,017.46 7.40 Class I Actual Performance 1,000.00 1,054.40 6.26 Hypothetical (5% annual
return before expenses) 1,000.00 1,018.70 6.16 * Expenses are equal to the Fund’s annualized expense ratio of 1.48% and 1.23% for Class A and Class I shares, respectively, multiplied by the average account value over the period, multiplied by 181/365 (to reflect the six month period). The expense ratios reflect an expense waiver. Assumes all dividends and distributions were reinvested.
52

Segall Bryant & Hamill Funds EXPENSE EXAMPLES - Continued For the Six Months Ended April 30, 2018 (Unaudited)
International Small Cap Fund
Beginning Account Value
Ending Account Value
Expenses Paid During Period*
11/1/17 4/30/18 11/1/17 – 4/30/18 Class A Actual Performance $ 1,000.00 $ 1,020.50 $ 6.41 Hypothetical (5% annual
return before expenses) 1,000.00 1,018.45 6.41 Class I Actual Performance 1,000.00 1,021.80 5.16 Hypothetical (5% annual
return before expenses) 1,000.00 1,019.69 5.16 * Expenses are equal to the Fund’s annualized expense ratio of 1.28% and 1.03% for Class A and Class I shares, respectively, multiplied by the average account value over the period, multiplied by 181/365 (to reflect the six month period). The expense ratios reflect an expense waiver. Assumes all dividends and distributions were reinvested.
53

This page is intentionally left blank

This page is intentionally left blank

This page is intentionally left blank

Segall Bryant & Hamill Funds Each a series of Investment Managers Series Trust
Investment Advisor Segall Bryant & Hamill
540 West Madison Street, Suite 1900 Chicago, Illinois 60661
Custodian UMB Bank, n.a.
928 Grand Boulevard, 5th Floor Kansas City, Missouri 64106
Fund Co-Administrator Mutual Fund Administration, LLC
2220 E. Route 66, Suite 226 Glendora, California 91740
Fund Co-Administrator, Transfer Agent and Fund Accountant UMB Fund Services, Inc.
235 W. Galena Street Milwaukee, Wisconsin 53212
Distributor
IMST Distributors, LLC 3 Canal Plaza, Suite 100 Portland, Maine 04101
www.foreside.com

FUND INFORMATION
TICKER CUSIP Segall Bryant & Hamill Emerging Markets Fund - Class A SBHEX 46141Q 675 Segall Bryant & Hamill Emerging Markets Fund - Class I SBEMX 46141Q 667 Segall Bryant & Hamill International Small Cap Fund - Class A SBHSX 46141Q 659 Segall Bryant & Hamill International Small Cap Fund - Class I SBSIX 46141Q 642 Privacy Principles of the Segall Bryant & Hamill Funds for Shareholders The Funds are committed to maintaining the privacy of their shareholders and to safeguarding their non-public personal information. The following information is provided to help you understand what personal information the Funds collect, how we protect that information and why, in certain cases, we may share information with select other parties.
Generally, the Funds do not receive any non-public personal information relating to their shareholders, although certain non-public personal information of their shareholders may become available to the Funds. The Funds do not disclose any non-public personal information about their shareholders or former shareholders to anyone, except as permitted by law or as is necessary in order to service shareholder accounts (for example, to a transfer agent or third party administrator).
This report is sent to shareholders of the Segall Bryant & Hamill Funds for their information. It is not a Prospectus, circular or representation intended for use in the purchase or sale of shares of the Funds or of any securities mentioned in this report. Proxy Voting Policies and Procedures A description of the Funds’ proxy voting policies and procedures related to portfolio securities is available without charge, upon request, by calling the Funds at (866) 490-4999, or on the U.S. Securities and Exchange Commission’s (“SEC”) website at www.sec.gov. Proxy Voting Record Information regarding how the Funds voted proxies for portfolio securities, if applicable, during the most recent 12-month period ended June 30, is also available, without charge and upon request by calling (866) 490-4999 or by accessing the Funds’ Form N-PX on the SEC’s website at www.sec.gov. Form N-Q Disclosure The Funds file their complete schedule of portfolio holdings with the SEC for the first and third quarters of each fiscal year on Form N-Q. The Funds’ Form N-Q is available on the SEC website at www.sec.gov or by calling the Funds at (866) 490-4999. The Funds’ Form N-Q may also be viewed and copied at the SEC’s Public Reference Room in Washington, DC. Information on the operation of the Public Reference Section may be obtained by calling (800) SEC-0330. Householding The Funds will mail only one copy of shareholder documents, including prospectuses, annual and semi-annual reports and proxy statements, to shareholders with multiple accounts at the same address. This practice is commonly called “householding” and is intended to reduce expenses and eliminate duplicate mailings of shareholder documents. Mailings of your shareholder documents may be householded indefinitely unless you instruct us otherwise. If you do not want the mailing of these documents to be combined with those for other members of your household, please call the Funds at (866) 490-4999.
Segall Bryant & Hamill Funds P.O. Box 2175
Milwaukee, WI 53201 Toll Free: (866) 490-4999