semi-annual safety review · the annual safety review gives a statistical analysis of the past year...
TRANSCRIPT

2018
Semi-Annual Safety Review

Icelandic Transport Authority: Annual Safety Review for the year 2018
Publisher: Icelandic Transport Authority Ármúli 2
108 Reykjavík Sími: +354 480 6000 Netfang: [email protected] Veffang: www.icetra.is
© August 2018 - Icelandic Transport Authority: Division of Coordination and facilitation, Department of Safety and Promotion. The annual safety review gives a statistical analysis of the past year as well as trends over a longer period. This document is a part of the State Safety Program (SSP) in Iceland. Image on cover by @andre_norway published on Instagram 07/02/2018.
Acknowledgements The author wishes to acknowledge the contribution made by the ITSB, Icelandic aviation industry, Icelandic aviation community and Icetra personnel in the preparation of this report and thanks them for their support. Disclaimer The data presented in this document is strictly for information purposes only. It is obtained from a number of different sources and, whilst every care has been taken to ensure the accuracy of the data and to avoid errors in the content, Icetra makes no warranty as to the accuracy, completeness or currency of the content.

3
Contents
Table of Figures .........................................................................................................................................................................4
1. Iceland Overview .............................................................................................................................................................5
Safety Performance Indicators .......................................................................................................................................6
3.1 Tier 2 Safety Performance Indicators ..................................................................................................................6
Safety Promotion ........................................................................................................................................................... 10
4.1 The Human Factors Dirty Dozen ..................................................................................................................... 10
4.2 Other campaigns .................................................................................................................................................. 14

Table of Figures
Figure 1 - Most frequently reported occurrences in 2018..................................................................................................5
Figure 2 – SPI for LOC-I. ......................................................................................................................................................6
Figure 3 – SPI for CFIT .........................................................................................................................................................7
Figure 4 – SPI for RE. ............................................................................................................................................................7
Figure 5 – SPI for MAC. ........................................................................................................................................................8
Figure 6 – SPI for RI ...............................................................................................................................................................8
Figure 7 – SPI for GCOL .......................................................................................................................................................9
Figure 8 – SPI for SCF ............................................................................................................................................................9
Figure 9 – Lack of Communication and its countermeasures. ...................................................................................... 11
Figure 10 – Complacency and its countermeasures. ........................................................................................................ 11
Figure 11 – Lack of Knowledge and its countermeasures. ............................................................................................. 12
Figure 12 – Distraction and its countermeasures. ............................................................................................................ 12
Figure 13 – Lack of Teamwork and its countermeasures. .............................................................................................. 13
Figure 14 – Fatigue and its countermeasures.................................................................................................................... 13
Figure 15 – Fatigue and its countermeasures.................................................................................................................... 14
Figure 16 – Information letter regarding flying in reservation areas and at nesting season. ..................................... 14
Figure 17 – Information letter regarding take-off and landing on grass and gravel airstrips.................................... 15
Figure 18 – VFR procedures in the vicinity of BIRK – Reykjavik Airport. ............................................................... 15

5
1. Iceland Overview
The growth continues in the first six months of 2018. Last year being the largest year to date in many aspects
of aviation in Iceland, all indications are in the direction that 2018 will succeed 2017. In the first six months
of 2018, Icetra has received 746 occurrence reports from the Icelandic Flight Industry, on average 124
occurrences per month. Depicted in figure one are the most frequently reported occurrences. The occurrence
category mostly assigned is other, which is mostly flight crew and regulatory related occurrences. These are
followed by non-power plant failures of components in various aircraft systems (SCF-NP). Third most
reported occurrences are ground-handling incidents.
Figure 1 - Most frequently reported occurrences in 2018.

Safety Performance Indicators
3.1 Tier 2 Safety Performance Indicators
Safety Performance Indicators is an agreed measure used to express the level of safety performance achieved in a
system. Safety indicators are usually linked to safety performance targets, enable the organization to measure, and
demonstrate the achievement of the set target levels. The safety performance indicators should be easy to measure.
SPI’s constitute a key tool in analysing large quantities of data, helping to identify safety threats. These indicators
often reflect changes in the number of events. Analysing the events themselves and their causes uncovers key
safety threats and unfavourable trends, and helps in finding measures to prevent or mitigate them. The
effectiveness of Safety Performance Indicators is evaluated on an annual basis. In general, Safety Performance
Indicators are presented in terms of the frequency of occurrence of harmful event(s).
Figure two depicts the SPI Loss of Control – inflight. This SPI is made from following tier 3 SPI’s: Excessive roll
attitude or roll rate (Increased roll attitude or rate), Stall warning (stick shaker), Excessive speed/vertical
speed/accelerations (vertical or configuration), Insufficient energy at high altitude (airspeed altitude cannot be
maintained), Low go-around or rejected landing (go-around), High pitch angle and Failure of primary flight
instruments. The orange dashed line is the year’s target, which is five percent lower than the average of the previous
year. The green line is alert level one, triggered by three or more consecutive points above the green line. The
yellow line is alert level two, triggered by two or more consecutive points above the yellow line. The red line is
alert level three, triggered by one single point above the red line.
Figure 2 – A safety performance indicator for loss of control inflight that shows reported occurrences per 1000 flight
hours from all operators. The orange dashed line is the average. The green line is alert level one, yellow is alert level two and red is alert level three.

7
Depicted in figure three is the SPI Controlled Flight into or toward terrain. This SPI is made from following tier
3 SPI’s: EGPWS hard warnings, Descent below MSA and Navigation errors.
Figure 3 – A safety performance indicator for Controlled Flight into or toward terrain, that shows reported occurrences per 1000 flight hours from all operators. The orange dashed line is the average. The green line is alert level one, yellow is alert level two and red is alert level three.
Depicted in figure four is the SPI Runway Excursion. This SPI is made from following tier 3 SPI’s: High speed
rejected take-off, Take-off with abnormal configuration, Insufficient take-off performance, Unstable shortly before
landing, Abnormal attitude or bounce at landing (runway contact), Hard or heavy landing, Aircraft lateral deviation
at high speed on ground (occurrences with crosswind conditions), Low remaining runway length when braking,
Long or fast landings and ATA32 related occurrences.
Figure 4 – A safety performance indicator for runway excursion that shows reported occurrences per 1000 flight hours
from all operators. The orange dashed line is the average. The green line is alert level one, yellow is alert level two and red is alert level three.

Depicted in figure five is the SPI MAC: Airprox/ACAS alert/loss of separation/(near)Mid-Air Collision. This
SPI is made from following tier 3 SPI’s: TCAS/ACAS Resolution Advisory, Losses of separation, Inadequate
separation, Level Busts and Airspace infringements.
Figure 5 – A safety performance indicator for airprox/ACAS alert/loss of separation/(near) mid-air collision, that shows
reported occurrences per 1000 flight hours from all operators. The orange dashed line is the average. The green line is alert level one, yellow is alert level two and red is alert level three.
Figure six illustrates the SPI for Runway Incursions per 10.000 movements from all operators.
Figure 6 – A safety performance indicator for runway incursion that shows reported occurrences per 10000 movements
from all operators. The orange dashed line is the average. The green line is alert level one, yellow is alert level two and red is alert level three.

9
On figure seven the SPI Ground Collision and Ground handling is shown. This SPI is made from the following
tier 3 SPI’s: Taxiway incursions, Avoiding manoeuvres during taxi and Aircraft collisions and collisions with
aircraft.
Figure 7 – A safety performance indicator for Ground Collision and Ground handling that shows reported occurrences
per 1000 flight hours from all operators. The orange dashed line is the average. The green line is alert level one, yellow is alert level two and red is alert level three.
Illustrated in figure eight is the SPI system component failure. This SPI is made from the following tier 3 SPI’s:
Engine failure, Flight control problems and Helicopter tail rotor and main rotor blade failures or malfunctions.
Figure 8 – A safety performance indicator for system component failure that shows reported occurrences per 1000 flight
hours from all operators. The orange dashed line is the average. The green line is alert level one, yellow is alert level two and red is alert level three.

Safety Promotion
Safety promotion is a major component of the SSP and together with the Safety Policy and Safety
Objectives is an important enabler for continuous safety improvement achieved mainly through the two
“operational components” of the SSP: risk management and safety assurance. Safety risk management,
safety assurance and safety promotion provide the means for national authority or an organisation to
control the safety risks and maintain the right balance between production and protection.
Safety promotion sets the tone that predisposes both individual and organisational behaviour and fills in
the blank spaces in the organization’s policies, procedures and processes, providing a sense of purpose
to safety efforts. Through safety promotion, you are able to adopt a culture that goes beyond merely
avoiding accidents or reducing the number of incidents, although these are likely to be the most apparent
measures of success. It is more to do the right thing at the right time in response to normal and
emergency situations.
To further enhance the level of safety in aviation in Iceland as part of the State Safety Program the
Icelandic Transport Authority (Icetra) has published promotional material produced by Icetra on it’s
website under ‘Flug’ (aviation) and ‘öryggi og fræðsla’ (safety and promotion). This is the link:
https://www.samgongustofa.is/flug/oryggi-og-fraedsla/fraedsluefni.
4.1 The Human Factors Dirty Dozen
In 2018 Icetra has been publishing once a month “The Human Factors Dirty Dozen” with a copyright
permission from MARSS – The Maintenance and Ramp Safety Society. It is with great pleasure that this
material made by Icetra is promoted in cooperation with all the aviation unions and organisations in
Iceland and all are represented with their logo at the bottom of the poster. This cooperation is greatly
valued and the author would like to acknowledge and thank the industry especially for their contribution
in the campaign, without their help in promoting the campaign within their companies it would of less
value. Safety is our, and the industry’s, number one priority. Together we make flying safer.
The Dirty Dozen refers to twelve of the most common human error preconditions or conditions that
can act as precursors to accidents or incidents. These twelve elements can influence people to make
mistakes. The Dirty Dozen is a concept that was developed by Gordon Dupont whilst working for
Transport Canada in 1993. It has since become a cornerstone of Human Factors in Maintenance training
worldwide. Although originally designed for maintenance The Dirty Dozen is easily applied to any area
of aviation.
Whilst The Dirty Dozen list of human factors has increased awareness of how humans can contribute
towards accidents and incidents, the aim of the concept was always to focus attention and resources
towards reducing and capturing the human error. Therefore, for each element on The Dirty Dozen list
there are examples of typical countermeasures designed to reduce the possibility of any human error
from causing a problem.
Below in figures nine through fourteen, the first six posters in the campaign are illustrated.

11
Figure 9 – Lack of Communication and its countermeasures.
Figure 10 – Complacency and its countermeasures.

Figure 11 – Lack of Knowledge and its countermeasures.
Figure 12 – Distraction and its countermeasures.

13
Figure 13 – Lack of Teamwork and its countermeasures.
Figure 14 – Fatigue and its countermeasures.

4.2 Other campaigns
A new English version of how to use drones in Iceland, first published in Icelandic in 2016 with permission
from EASA – European Aviation Safety Agency, was published in 2018.
Figure 15 – Fatigue and its countermeasures.
Figure 16 – Information letter regarding flying in reservation areas and at nesting season.
15
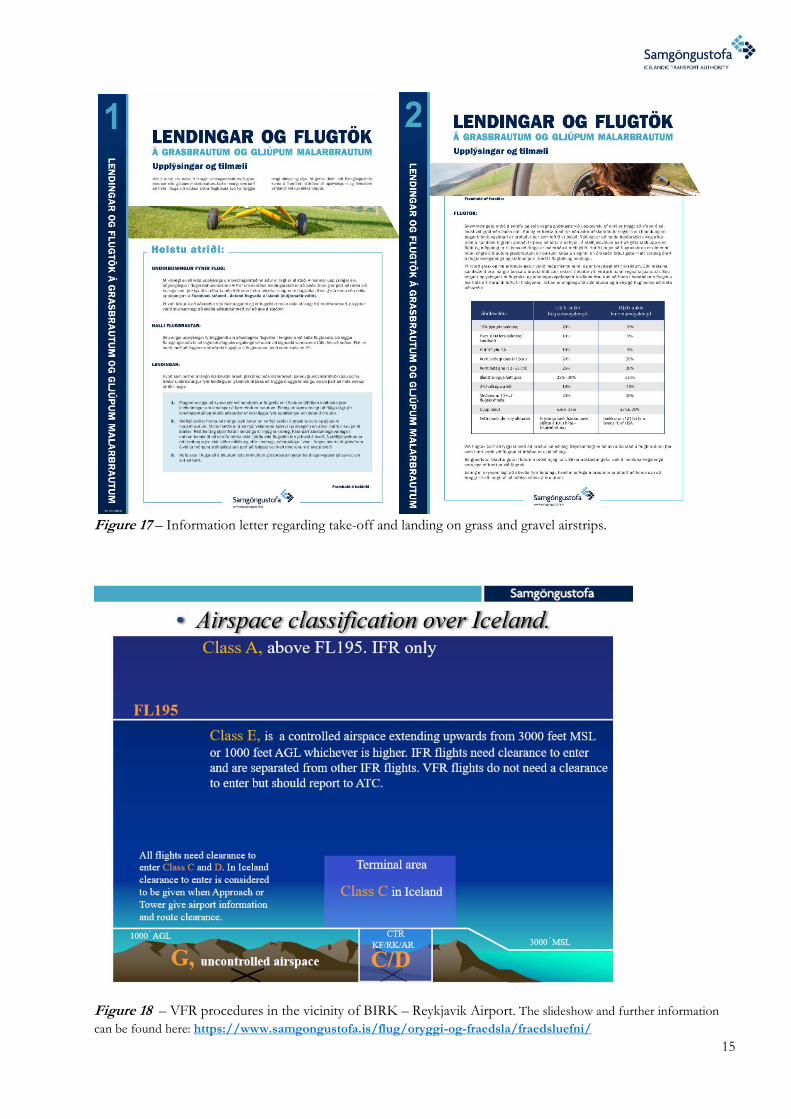
Figure 17 – Information letter regarding take-off and landing on grass and gravel airstrips.
Figure 18 – VFR procedures in the vicinity of BIRK – Reykjavik Airport. The slideshow and further information
can be found here: https://www.samgongustofa.is/flug/oryggi-og-fraedsla/fraedsluefni/

Department of Safety Analysis and Promotion (ICETRA)
The Division of Coordination and Facilitation works on diverse projects involving aviation, maritime and road
traffic. The role of the division is to ensure that transportation prosper, with emphasis on transportation safety
and awareness, their efficiency and environmental issues. Within the division there are three sections: legal;
transportation facilitation; safety analysis and also special projects like education and awareness in relation to
safety programs and supervision of research and developments.
Department of Safety Analysis and Promotion works on projects in aviation safety, road traffic safety, and
maritime safety. Incident and accident registration and analysis is processed within the section with statistical and
analysis outputs for strategic decision processes on transportation matters.
Ármúli 2 108 Reykjavík Ísland
Sími +354 480 6000 Fax +354 480 6003 Netfang [email protected] Veffang www.icetra.is