semiannual reportpacer global cash cows dividend etf percentage of sector (a) net assets consumer,...
TRANSCRIPT

SEMIANNUAL REPORTOctober 31, 2018
Pacer Trendpilot® US Large Cap ETF Ticker: PTLC Pacer Trendpilot® US Mid Cap ETF Ticker: PTMC Pacer Trendpilot® 100 ETF Ticker: PTNQ Pacer Trendpilot® European Index ETF Ticker: PTEU Pacer Global Cash Cows Dividend ETF Ticker: GCOW Pacer US Cash Cows 100 ETF Ticker: COWZ Pacer US Small Cap Cash Cows 100 ETF Ticker: CALF Pacer Developed Markets International Cash Cows 100 ETF Ticker: ICOW Pacer WealthShield ETF Ticker: PWS Pacer Military Times Best Employers ETF Ticker: VETS Pacer Benchmark Retail Real Estate SCTRSM ETF Ticker: RTL Pacer Benchmark Industrial Real Estate SCTRSM ETF Ticker: INDS Pacer Benchmark Data & Infrastructure Real Estate SCTRSM ETF Ticker: SRVR Pacer US Export Leaders ETF Ticker: PEXL Pacer CFRA-Stovall Equal Weight Seasonal Rotation ETF Ticker: SZNE

TABLE OF CONTENTS Page
Portfolio Allocation . . . . . . . . . . . . . . . . . . . . . . . . . . . . . . . . . . . . . . . . . . . . . . . . . . . . . . . . . . . . . . . . . . . . . . . . . . . . . . . . . . . . . . . 1
Performance Summary . . . . . . . . . . . . . . . . . . . . . . . . . . . . . . . . . . . . . . . . . . . . . . . . . . . . . . . . . . . . . . . . . . . . . . . . . . . . . . . . . . . . 5
Expense Example . . . . . . . . . . . . . . . . . . . . . . . . . . . . . . . . . . . . . . . . . . . . . . . . . . . . . . . . . . . . . . . . . . . . . . . . . . . . . . . . . . . . . . . . . 20
Schedules of Investments . . . . . . . . . . . . . . . . . . . . . . . . . . . . . . . . . . . . . . . . . . . . . . . . . . . . . . . . . . . . . . . . . . . . . . . . . . . . . . . . . . . 22
Statements of Assets and Liabilities . . . . . . . . . . . . . . . . . . . . . . . . . . . . . . . . . . . . . . . . . . . . . . . . . . . . . . . . . . . . . . . . . . . . . . . . . . . 52
Statements of Operations . . . . . . . . . . . . . . . . . . . . . . . . . . . . . . . . . . . . . . . . . . . . . . . . . . . . . . . . . . . . . . . . . . . . . . . . . . . . . . . . . . 55
Statements of Changes in Net Assets . . . . . . . . . . . . . . . . . . . . . . . . . . . . . . . . . . . . . . . . . . . . . . . . . . . . . . . . . . . . . . . . . . . . . . . . . . 58
Financial Highlights . . . . . . . . . . . . . . . . . . . . . . . . . . . . . . . . . . . . . . . . . . . . . . . . . . . . . . . . . . . . . . . . . . . . . . . . . . . . . . . . . . . . . . 66
Notes to Financial Statements . . . . . . . . . . . . . . . . . . . . . . . . . . . . . . . . . . . . . . . . . . . . . . . . . . . . . . . . . . . . . . . . . . . . . . . . . . . . . . . 81
Additional Information . . . . . . . . . . . . . . . . . . . . . . . . . . . . . . . . . . . . . . . . . . . . . . . . . . . . . . . . . . . . . . . . . . . . . . . . . . . . . . . . . . . . 94
Pacer Funds

Pacer Trendpilot® US Large Cap ETF
Percentage ofSector(a) Net AssetsShort-Term Investments 0.1%Investments Purchased with Proceeds from Securities Lending 2.0%Other assets in excess of liabilities 97.9% _____Total 100.0% _____ _____(a) The Fund may classify a company in a different category than the The Pacer Trendpilot® US Large Cap Index.
Pacer Trendpilot® US Mid Cap ETF
Percentage ofSector(a) Net AssetsShort-Term Investments 99.7%Investments Purchased with Proceeds from Securities Lending 30.0%Liabilities in excess of other assets -29.7% _____Total 100.0% _____ _____(a) The Fund may classify a company in a different category than the The Pacer Trendpilot® US Mid Cap Index.
Pacer Trendpilot® 100 ETF
Percentage ofSector(a) Net AssetsTechnology 20.4%Communications 18.0%Consumer, Non-Cyclical 7.7%Consumer, Cyclical 3.4%Industrial 0.5%Short-Term Investments 0.1%Investments Purchased with Proceeds from Securities Lending 5.8%Other assets in excess of liabilities 44.1% _____Total 100.0% _____ _____(a) The Fund may classify a company in a different category than the Pacer nasdaq-100 Trendpilot® Index.
Pacer Trendpilot® European Index ETF
Percentage ofCountry(a) Net AssetsGreece 0.0%(b)
Short-Term Investments 99.9%Investments Purchased with Proceeds from Securities Lending 30.0%Liabilities in excess of other assets -29.9% _____Total 100.0% _____ _____(a) The Fund generally classifies a company based on its country of incorporation, but may designate a different country in certain circumstances.(b) Less than 0.05%
Pacer FundsPORTFOLIO ALLOCATION (Unaudited)As of October 31, 2018
1

Pacer Global Cash Cows Dividend ETF
Percentage ofSector(a) Net AssetsConsumer, Non-Cyclical 36.0%Communications 17.3%Consumer, Cyclical 11.2%Basic Materials 9.0%Financial 5.7%Energy 5.6%Technology 4.9%Utilities 4.4%Industrial 4.3%Diversified 1.2%Short-Term Investments 0.1%Investments Purchased with Proceeds from Securities Lending 20.5%Liabilities in excess of other assets -20.2% _____Total 100.0% _____ _____(a) The Fund may classify a company in a different category than the Pacer Global Cash Cows Dividend 100 Index.
Pacer US Cash Cows 100 ETF
Percentage ofSector(a) Net AssetsTechnology 25.2%Consumer, Cyclical 24.5%Consumer, Non-Cyclical 22.3%Communications 7.2%Basic Materials 6.7%Financial 5.3%Energy 4.9%Industrial 3.7%Short-Term Investments 0.2%Investments Purchased with Proceeds from Securities Lending 10.9%Liabilities in excess of other assets -10.9% _____Total 100.0% _____ _____(a) The Fund may classify a company in a different category than the Pacer US Cash Cows 100 Index.
Pacer US Small Cap Cash Cows 100 ETF
Percentage ofSector(a) Net AssetsConsumer, Cyclical 29.8%Consumer, Non-Cyclical 17.3%Industrial 17.0%Technology 12.5%Energy 7.8%Communications 7.0%Financial 5.8%Basic Materials 2.7%Short-Term Investments 0.1%Investments Purchased with Proceeds from Securities Lending 8.6%Liabilities in excess of other assets -8.6% _____Total 100.0% _____ _____(a) The Fund may classify a company in a different category than the Pacer US Small Cap Cash Cows 100 Index.
Pacer FundsPORTFOLIO ALLOCATION (Unaudited) (Continued)As of October 31, 2018
2
Pacer Developed Markets International Cash Cows 100 ETF
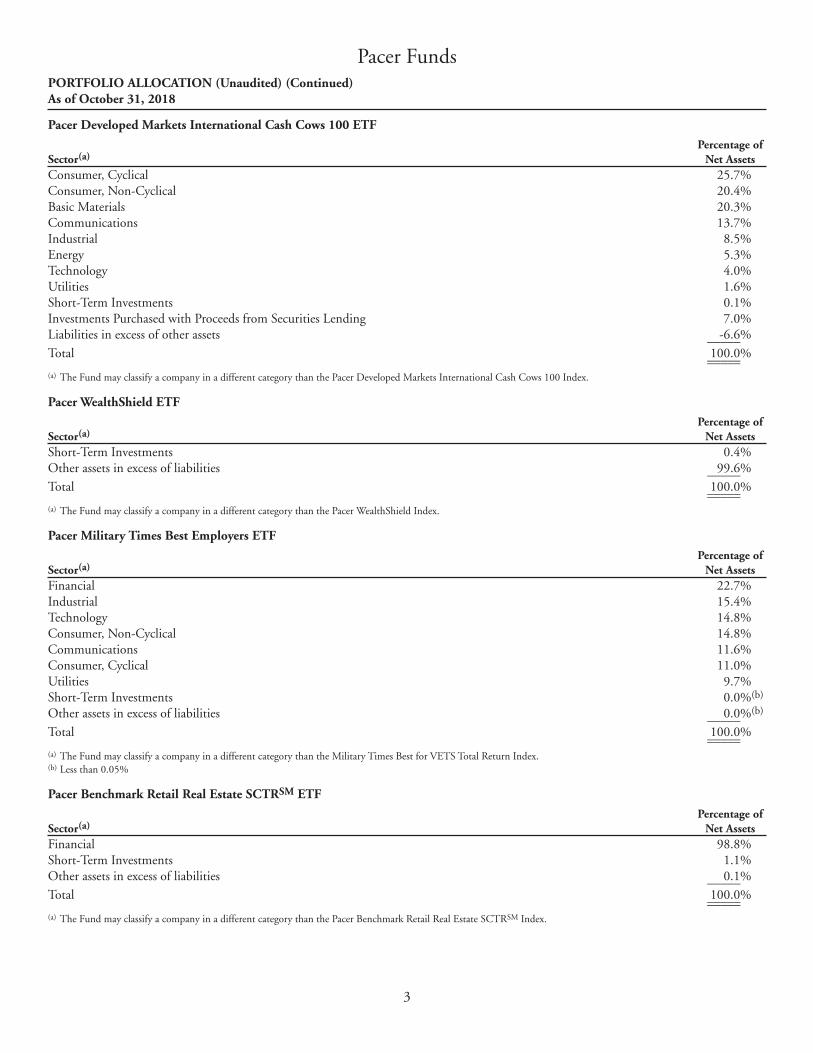
Percentage ofSector(a) Net AssetsConsumer, Cyclical 25.7%Consumer, Non-Cyclical 20.4%Basic Materials 20.3%Communications 13.7%Industrial 8.5%Energy 5.3%Technology 4.0%Utilities 1.6%Short-Term Investments 0.1%Investments Purchased with Proceeds from Securities Lending 7.0%Liabilities in excess of other assets -6.6% _____Total 100.0% _____ _____(a) The Fund may classify a company in a different category than the Pacer Developed Markets International Cash Cows 100 Index.
Pacer WealthShield ETF
Percentage ofSector(a) Net AssetsShort-Term Investments 0.4%Other assets in excess of liabilities 99.6% _____Total 100.0% _____ _____(a) The Fund may classify a company in a different category than the Pacer WealthShield Index.
Pacer Military Times Best Employers ETF
Percentage ofSector(a) Net AssetsFinancial 22.7%Industrial 15.4%Technology 14.8%Consumer, Non-Cyclical 14.8%Communications 11.6%Consumer, Cyclical 11.0%Utilities 9.7%Short-Term Investments 0.0%(b)
Other assets in excess of liabilities 0.0%(b) _____Total 100.0% _____ _____(a) The Fund may classify a company in a different category than the Military Times Best for VETS Total Return Index.(b) Less than 0.05%
Pacer Benchmark Retail Real Estate SCTRSM ETF
Percentage ofSector(a) Net AssetsFinancial 98.8%Short-Term Investments 1.1%Other assets in excess of liabilities 0.1% _____Total 100.0% _____ _____(a) The Fund may classify a company in a different category than the Pacer Benchmark Retail Real Estate SCTRSM Index.
Pacer FundsPORTFOLIO ALLOCATION (Unaudited) (Continued)As of October 31, 2018
3

Pacer Benchmark Industrial Real Estate SCTRSM ETF
Percentage ofSector(a) Net AssetsFinancial 99.9%Short-Term Investments 0.1%Liabilities in excess of other assets 0.0%(b) _____Total 100.0% _____ _____(a) The Fund may classify a company in a different category than the Pacer Benchmark Industrial Real Estate SCTRSM Index.(b) Less than -0.05%
Pacer Benchmark Data & Infrastructure Real Estate SCTRSM ETF
Percentage ofSector(a) Net AssetsFinancial 92.7%Technology 3.9%Communications 2.9%Short-Term Investments 0.2%Other assets in excess of liabilities 0.3% _____Total 100.0% _____ _____(a) The Fund may classify a company in a different category than the Pacer Benchmark Data & Infrastructure Real Estate SCTRSM Index.
Pacer US Export Leaders ETF
Percentage ofSector(a) Net AssetsTechnology 33.3%Consumer, Non-Cyclical 19.6%Industrial 18.2%Consumer, Cyclical 10.4%Basic Materials 7.2%Communications 6.7%Energy 3.6%Financial 0.9%Short-Term Investments 0.1%Liabilities in excess of other assets 0.0%(b) _____Total 100.0% _____ _____(a) The Fund may classify a company in a different category than the Pacer US Export Leaders Index.(b) Less than -0.05%
Pacer CFRA-Stovall Equal Weight Seasonal Rotation ETF
Percentage ofSector(a) Net AssetsIndustrial 26.3%Consumer, Cyclical 25.5%Basic Materials 17.1%Technology 17.1%Consumer, Non-Cyclical 8.5%Communications 4.2%Financial 1.1%Short-Term Investments 1.0%Liabilities in excess of other assets -0.8% _____Total 100.0% _____ _____(a) The Fund may classify a company in a different category than the Pacer CFRA-Stovall Equal Weight Seasonal Rotation Index.
Pacer FundsPORTFOLIO ALLOCATION (Unaudited) (Continued)As of October 31, 2018
4

Growth of $10,000
This chart illustrates the performance of a hypothetical $10,000 investment made on June 11, 2015, and is not intended to imply anyfuture performance. The returns shown do not reflect the deduction of taxes that a shareholder would pay on fund distributions or theredemption of fund shares. The chart assumes reinvestment of capital gains and dividends.
The Pacer Trendpilot® US Large Cap Index uses an objective, rules-based methodology to implement a systematic trend-following strategythat directs exposure (i) 100% to the S&P 500 Index, (ii) 50% to the S&P 500 Total Return Index and 50% to 3-Month US Treasury bills,or (iii) 100% to 3-Month US Treasury bills, depending on the relative performance of the S&P 500 Total Return Index and its200-business day historical simple moving average. The S&P 500 Total Return Index is a total return version of the S&P 500 Index andreflects the reinvestment of dividends paid by the securities in the S&P 500 Index.
The S&P 500 Total Return Index is a total return version of the S&P 500 Index and reflects the reinvestment of dividends paid by thesecurities in the S&P 500 Index. The S&P 500 Index consists of approximately 500 leading U.S.-listed companies representingapproximately 8% of the U.S. equity market capitalization.
Annualized Returns(a)
(For the periods ended October 31, 2018) One Year Since Inception(b) ________ _______________
Pacer Trendpilot® US Large Cap ETF – NAV 5.53% 5.20%Pacer Trendpilot® US Large Cap ETF – Market 5.48% 5.23%Pacer Trendpilot® US Large Cap Index(c)(d) 6.19% 5.85%S&P 500 Total Return Index(d) 7.35% 9.91%(a) The performance data quoted is historical. Past performance is no guarantee of future results. Current performance may be higher or lower than the performance data
quoted. The principal value and investment return of an investment will fluctuate so that investor’s shares, when redeemed, may be worth more or less than the originalcost. The returns shown do not reflect the deduction of taxes that a shareholder would pay on Fund distributions or on redemptions of Fund shares. The total annualoperating expenses as stated in the fee table to the Fund’s prospectus dated August 31, 2018, is 0.60%. For performance information current to the most recent month-end,please call 1-877-337-0500.
(b) Inception date is June 11, 2015.(c) Effective November 1, 2017, the Fund’s investment objective was to track the price and total return performance, before fees and expenses, of the Pacer Trendpilot® US
Large Cap Index. Prior to November 1, 2017, the Fund’s investment objective was to track the price and total return performance, before fees and expenses, of the PacerWilshire US Large-Cap Trendpilot™ Index. Performance shown for periods beginning November 1, 2017 is that of the Pacer Trendpilot® US Large Cap Index, andperformance shown for periods prior to November 1, 2017 is that of the Pacer Wilshire US Large-Cap Trendpilot™ Index.
(d) Indexes are unmanaged statistical composites and their returns do not include fees an investor would pay to purchase the securities they represent. Such costs would lowerperformance. It is not possible to invest directly in an index.
Pacer Trendpilot® US Large Cap ETFPERFORMANCE SUMMARY(Unaudited)
5
$8,000
$9,000
$10,000
$11,000
$12,000
$13,000
$14,000
$15,000
Pacer Trendpilot® US Large Cap ETF – NAV
Pacer Trendpilot® US Large Cap ETF – Market
Pacer Trendpilot® US Large Cap Index
S&P 500 Total Return Index
6/11
/15
7/31
/15
1/31
/16
4/30
/16
7/31
/16
1/31
/17
4/30
/17
$13,782
7/31
/17
1/31
/18
4/30
/18
10/3
1/15
10/3
1/16
10/3
1/17
10/3
1/18
7/31
/18
$11,884$11,873$11,638

Growth of $10,000
This chart illustrates the performance of a hypothetical $10,000 investment made on June 11, 2015, and is not intended to imply anyfuture performance. The returns shown do not reflect the deduction of taxes that a shareholder would pay on fund distributions or theredemption of fund shares. The chart assumes reinvestment of capital gains and dividends.
The Pacer Trendpilot® US Mid Cap Index uses an objective, rules-based methodology to implement a systematic trend-following strategythat directs exposure (i) 100% to the S&P MidCap 400 Index, (ii) 50% to the S&P MidCap 400 Index and 50% to 3-Month US Treasurybills, or (iii) 100% to 3-Month US Treasury bills, depending on the relative performance of the S&P MidCap 400 Total Return Index andits 200-business day historical simple moving average.
The S&P MidCap 400 Total Return Index is a total return version of the S&P MidCap 400 Index and reflects the reinvestment ofdividends paid by the securities in the S&P MidCap 400 Index. The S&P Midcap 400 measures the performance of mid-capitalizationstocks in the United States.
Annualized Returns(a)
(For the periods ended October 31, 2018) One Year Since Inception(b) ________ _______________
Pacer Trendpilot® US Mid Cap ETF – NAV 3.61% 7.02%Pacer Trendpilot® US Mid Cap ETF – Market 3.40% 7.04%Pacer Trendpilot® US Mid Cap Index(c)(d) 4.02% 7.66%S&P MidCap 400 Total Return Index(d) 1.02% 6.87%(a) The performance data quoted is historical. Past performance is no guarantee of future results. Current performance may be higher or lower than the performance data
quoted. The principal value and investment return of an investment will fluctuate so that investor’s shares, when redeemed, may be worth more or less than the originalcost. The returns shown do not reflect the deduction of taxes that a shareholder would pay on Fund distributions or on redemptions of Fund shares. The total annualoperating expenses as stated in the fee table to the Fund’s prospectus dated August 31, 2018, is 0.62%. For performance information current to the most recent month-end,please call 1-877-337-0500.
(b) Inception date is June 11, 2015.(c) Effective November 1, 2017, the Fund’s investment objective was to track the price and total return performance, before fees and expenses, of the Pacer Trendpilot® US
Mid Cap Index. Prior to November 1, 2017, the Fund’s investment objective was to track the price and total return performance, before fees and expenses, of the PacerWilshire US Mind-Cap Trendpilot™ Index. Performance shown for periods beginning November 1, 2017 is that of the Pacer Trendpilot® US Mid Cap Index, andperformance shown for periods prior to November 1, 2017 is that of the Pacer Wilshire US Mid-Cap Trendpilot™ Index.
(d) Indexes are unmanaged statistical composites and their returns do not include fees an investor would pay to purchase the securities they represent. Such costs would lowerperformance. It is not possible to invest directly in an index.
Pacer Trendpilot® US Mid Cap ETFPERFORMANCE SUMMARY(Unaudited)
6
$8,000
$9,000
$10,000
$11,000
$12,000
$13,000
$14,000
$15,000
Pacer Trendpilot® US Mid Cap ETF – NAV
Pacer Trendpilot® US Mid Cap ETF – Market
Pacer Trendpilot® US Mid Cap Index
S&P MidCap 400 Total Return Index
6/11
/15
7/31
/15
1/31
/16
4/30
/16
7/31
/16
1/31
/17
4/30
/17
$12,687
7/31
/17
1/31
/18
4/30
/18
10/3
1/15
10/3
1/16
10/3
1/17
10/3
1/18
7/31
/18
$12,598
$12,526$12,580

Growth of $10,000
This chart illustrates the performance of a hypothetical $10,000 investment made on June 11, 2015, and is not intended to imply anyfuture performance. The returns shown do not reflect the deduction of taxes that a shareholder would pay on fund distributions or theredemption of fund shares. The chart assumes reinvestment of capital gains and dividends.
Pacer Nasdaq-100 Trendpilot® Index uses an objective, rules-based methodology to implement a systematic trend-following strategy thatdirects exposure (i) 100% to the Nasdaq-100 Index, (ii) 50% to the Nasdaq-100 Index and 50% to 3-Month US Treasury bills, or(iii) 100% to 3-Month US Treasury bills, depending on the relative performance of the Nasdaq-100 Total Return Index and its200-business day historical simple moving average. The Nasdaq-100 Total Return Index is a total return version of the Nasdaq-100 Indexand reflects the reinvestment of dividends paid by the securities in the Nasdaq-100 Index.
The Nasdaq-100 Index includes approximately 100 of the largest non-financial securities listed on The Nasdaq Stock Market based onmarket capitalization. The Nasdaq-100 Index comprises securities of companies across major industry groups, including computer,biotechnology, healthcare, telecommunications and transportation. However, it does not contain securities of financial companies,including investment companies. The Nasdaq 100 Index was developed by Nasdaq OMX. There is no minimum market capitalizationrequirement for inclusion in the Nasdaq-100 Index. Inclusion is determined based on the top 100 largest issuers based on marketcapitalization meeting all other eligibility requirements.
Annualized Returns(a)
(For the periods ended October 31, 2018) One Year Since Inception(b) ________ _______________
Pacer Trendpilot® 100 ETF – NAV 12.07% 8.77%Pacer Trendpilot® 100 ETF – Market 12.25% 8.85%Pacer Nasdaq-100 Trendpilot® Index(c) 12.67% 9.48%Nasdaq-100 Index(c) 12.67% 15.16%(a) The performance data quoted is historical. Past performance is no guarantee of future results. Current performance may be higher or lower than the performance data
quoted. The principal value and investment return of an investment will fluctuate so that investor’s shares, when redeemed, may be worth more or less than the originalcost. The returns shown do not reflect the deduction of taxes that a shareholder would pay on Fund distributions or on redemptions of Fund shares. The total annualoperating expenses as stated in the fee table to the Fund’s prospectus dated August 31, 2018, is 0.65%. For performance information current to the most recent month-end,please call 1-877-337-0500.
(b) Inception date is June 11, 2015.(c) Indexes are unmanaged statistical composites and their returns do not include fees an investor would pay to purchase the securities they represent. Such costs would lower
performance. It is not possible to invest directly in an index.
Pacer Trendpilot® 100 ETFPERFORMANCE SUMMARY(Unaudited)
7
$8,000$9,000
$10,000$11,000$12,000$13,000$14,000$15,000$16,000$17,000$18,000
Pacer Trendpilot® 100 ETF – NAV
Pacer Trendpilot® 100 ETF – Market
Pacer Nasdaq-100 Trendpilot® Index
Nasdaq-100 Index
6/11
/15
7/31
/15
1/31
/16
4/30
/16
7/31
/16
1/31
/17
4/30
/17
$16,137
7/31
/17
1/31
/18
4/30
/18
10/3
1/15
10/3
1/16
10/3
1/17
10/3
1/18
7/31
/18
$13,600$13,326$13,293

Growth of $10,000
This chart illustrates the performance of a hypothetical $10,000 investment made on December 14, 2015, and is not intended to imply anyfuture performance. The returns shown do not reflect the deduction of taxes that a shareholder would pay on fund distributions or theredemption of fund shares. The chart assumes reinvestment of capital gains and dividends.
The Pacer Trendpilot® European Index uses an objective, rules-based methodology to implement a systematic trend-following strategy thatdirects exposure (i) 100% to the FTSE Eurozone Index, (ii) 50% to the FTSE Eurozone Index and 50% to 3-Month US Treasury bills, or(iii) 100% to 3-Month US Treasury bills, depending on the relative performance of the FTSE Eurozone Total Return Index and its200-business day historical simple moving average.
The FTSE Eurozone Index is a rules-based, float-adjusted, market capitalization-weighted index comprised of large- and mid-capitalizationstocks providing coverage of the developed markets in the euro zone, including primarily France, Germany, Spain, the Netherlands, andItaly. The FTSE Eurozone Index is a subset of the FTSE Global Equity Index Series, which covers 98% of the world’s investable marketcapitalization. The FTSE Eurozone Total Return Index is a total return version of the FTSE Eurozone Index and reflects the reinvestment ofdividend paid by the securities in the FTSE Eurozone Index.
Annualized Returns(a)
(For the periods ended October 31, 2018) One Year Since Inception(b) ________ _______________
Pacer Trendpilot® European Index ETF – NAV -16.19% 0.84%Pacer Trendpilot® European Index ETF – Market -17.15% 0.84%Pacer Trendpilot® European Index(c) -14.64% 2.25%FTSE Eurozone Index (USD)(c) -10.67% 6.89%(a) The performance data quoted is historical. Past performance is no guarantee of future results. Current performance may be higher or lower than the performance data
quoted. The principal value and investment return of an investment will fluctuate so that investor’s shares, when redeemed, may be worth more or less than the originalcost. The returns shown do not reflect the deduction of taxes that a shareholder would pay on Fund distributions or on redemptions of Fund shares. The total annualoperating expenses as stated in the fee table to the Fund’s prospectus dated August 31, 2018, is 0.66%. For performance information current to the most recent month-end,please call 1-877-337-0500.
(b) Inception date is December 14, 2015.(c) Indexes are unmanaged statistical composites and their returns do not include fees an investor would pay to purchase the securities they represent. Such costs would lower
performance. It is not possible to invest directly in an index.
Pacer Trendpilot® European Index ETFPERFORMANCE SUMMARY(Unaudited)
8
$8,000
$9,000
$10,000
$11,000
$12,000
$13,000
$14,000
$15,000
Pacer Trendpilot® European Index ETF – NAV
Pacer Trendpilot® European Index ETF – Market
Pacer Trendpilot® European Index
FTSE Eurozone Index (USD)
12/1
4/15
1/31
/16
4/30
/16
7/31
/16
1/31
/17
4/30
/17
$12,117
7/31
/17
1/31
/18
4/30
/18
10/3
1/16
10/3
1/17
10/3
1/18
7/31
/18
$10,661$10,248$10,247

Growth of $10,000
This chart illustrates the performance of a hypothetical $10,000 investment made on February 22, 2016, and is not intended to imply anyfuture performance. The returns shown do not reflect the deduction of taxes that a shareholder would pay on fund distributions or theredemption of fund shares. The chart assumes reinvestment of capital gains and dividends.
The Pacer Global Cash Cows Dividend Index uses an objective, rules-based methodology to provide exposure to global companies with highdividend yield backed by a high free cash flow yield. The initial index universe is derived from the component companies of the FTSEDeveloped Large Cap Index. The initial universe of companies is screened based on their average projected free cash flows and earnings overeach of the next two fiscal years. Companies with negative average projected free cash flows or earnings are removed from the Index universe.Additionally, financial companies, other than real estate investment trusts, are excluded from the Index universe. The remaining companiesare ranked by their free cash flow yield for the trailing twelve month period. The 300 companies with the highest free cash flow yield are thenranked by their dividend yield. The equity securities of the 100 companies with the highest dividend yield are included in the Index.
The FTSE Developed Large-Cap Index is a market-capitalization weighted index representing the performance of large-cap stocks indeveloped markets. The FTSE Developed Large-Cap Total Return Index is a total return version of the FTSE Developed Large-Cap Indexand reflects the reinvestment of dividends paid by the securities in the FTSE Developed Large-Cap Index.
Annualized Returns(a)
(For the periods ended October 31, 2018) One Year Since Inception(b) ________ _______________
Pacer Global Cash Cows Dividend ETF – NAV 0.57% 9.12%Pacer Global Cash Cows Dividend ETF – Market 0.01% 9.18%Pacer Global Cash Cows Dividend Index(c) 1.57% 10.12%FTSE Developed Large-Cap Index(c) 1.74% 13.28%(a) The performance data quoted is historical. Past performance is no guarantee of future results. Current performance may be higher or lower than the performance data
quoted. The principal value and investment return of an investment will fluctuate so that investor’s shares, when redeemed, may be worth more or less than the originalcost. The returns shown do not reflect the deduction of taxes that a shareholder would pay on Fund distributions or on redemptions of Fund shares. The total annualoperating expenses as stated in the fee table to the Fund’s prospectus dated August 31, 2018, is 0.60%. For performance information current to the most recent month-end,please call 1-877-337-0500.
(b) Inception date is February 22, 2016.(c) Indexes are unmanaged statistical composites and their returns do not include fees an investor would pay to purchase the securities they represent. Such costs would lower
performance. It is not possible to invest directly in an index.
Pacer Global Cash Cows Dividend ETFPERFORMANCE SUMMARY(Unaudited)
9
$9,000
$10,000
$11,000
$12,000
$13,000
$14,000
$15,000
$16,000
Pacer Global Cash Cows Dividend ETF – NAV
Pacer Global Cash Cows Dividend ETF – Market
Pacer Global Cash Cows Dividend Index
FTSE Developed Large-Cap Index
2/22
/16
4/30
/16
7/31
/16
1/31
/17
4/30
/17
$13,986
7/31
/17
1/31
/18
4/30
/18
10/3
1/16
10/3
1/17
10/3
1/18
7/31
/18
$12,668$12,931
$12,646

Growth of $10,000
This chart illustrates the performance of a hypothetical $10,000 investment made on December 16, 2016, and is not intended to imply anyfuture performance. The returns shown do not reflect the deduction of taxes that a shareholder would pay on fund distributions or theredemption of fund shares. The chart assumes reinvestment of capital gains and dividends.
The Pacer US Cash Cows 100 Index uses an objective, rules-based methodology to provide exposure to large and mid-capitalization U.S.companies with high free cash flow yields. The initial index universe is derived from the component companies of the Russell 1000 Index.The initial universe of companies is screened based on their average projected free cash flows and earnings over each of the next two fiscalyears. Companies with no forward year estimates available for free cash flows or earnings will remain in the Index universe. Companies withnegative average projected free cash flows or earnings are removed from the Index universe. Additionally, financial companies, other thanreal estate investment trusts, are excluded from the Index universe. The remaining companies are ranked by their free cash flow yield for thetrailing twelve month period. The equity securities of the 100 companies with the highest free cash flow yield are included in the Index.
The Russell 1000 Index is a market-capitalization weighted index representing the top 1,000 large-cap stocks in the Russell 3000 Index.The Russell 1000 Total Return Index is a total return version of the Russell 1000 Index that reflects the reinvestment of dividends paid bythe securities in the Russell 1000 Index.
Annualized Returns(a)
(For the periods ended October 31, 2018) One Year Since Inception(b) ________ _______________
Pacer US Cash Cows 100 ETF – NAV 5.92% 8.43%Pacer US Cash Cows 100 ETF – Market 5.97% 8.53%Pacer US Cash Cows 100 Index(c) 6.51% 8.89%Russell 1000 Index(c) 6.98% 12.15%(a) The performance data quoted is historical. Past performance is no guarantee of future results. Current performance may be higher or lower than the performance data
quoted. The principal value and investment return of an investment will fluctuate so that investor’s shares, when redeemed, may be worth more or less than the originalcost. The returns shown do not reflect the deduction of taxes that a shareholder would pay on Fund distributions or on redemptions of Fund shares. The total annualoperating expenses as stated in the fee table to the Fund’s prospectus dated August 31, 2018, is 0.49%. For performance information current to the most recent month-end,please call 1-877-337-0500.
(b) Inception date is December 16, 2016.(c) Indexes are unmanaged statistical composites and their returns do not include fees an investor would pay to purchase the securities they represent. Such costs would lower
performance. It is not possible to invest directly in an index.
Pacer US Cash Cows 100 ETFPERFORMANCE SUMMARY(Unaudited)
10
$9,000
$10,000
$11,000
$12,000
$13,000
$14,000
Pacer US Cash Cows 100 ETF – NAV
Pacer US Cash Cows 100 ETF – Market
Pacer US Cash Cows 100 Index
Russell 1000 Index
12/1
6/16
1/31
/17
4/30
/17
$12,396
7/31
/17
1/31
/18
4/30
/18
10/3
1/17
10/3
1/18
7/31
/18
$11,656$11,730
$11,639

Growth of $10,000
This chart illustrates the performance of a hypothetical $10,000 investment made on June 16, 2017, and is not intended to imply anyfuture performance. The returns shown do not reflect the deduction of taxes that a shareholder would pay on fund distributions or theredemption of fund shares. The chart assumes reinvestment of capital gains and dividends.
The Pacer US Small Cap Cash Cows Index uses an objective, rules-based methodology to provide exposure to small-capitalization U.S.companies with high free cash flow yields. The initial index universe is derived from the component companies of the S&P Small Cap 600Index. The initial universe of companies is screened based on their average projected free cash flows and earnings over each of the next twofiscal years. Companies with no forward year estimates available for free cash flows or earnings will remain in the Index universe.Companies with negative average projected free cash flows or earnings are removed from the Index universe. Additionally, financialcompanies, other than real estate investment trusts, are excluded from the Index universe. The remaining companies are ranked by their freecash flow yield for the trailing twelve month period. The equity securities of the 100 companies with the highest free cash flow yield areincluded in the Index.
The S&P SmallCap 600 Index measures the performance of 600 small sized companies in the US equity market, with market capitalizationranging from $450 million to $2.1 billion USD. The Index does not overlap holdings with the S&P 500 or S&P MidCap 400.
Annualized Returns(a)
(For the period ended October 31, 2018) One Year Since Inception(b) ________ _______________
Pacer US Small Cap Cash Cows 100 ETF – NAV 7.02% 4.96%Pacer US Small Cap Cash Cows 100 ETF – Market 7.49% 5.34%Pacer US Small Cap Cash Cows Index(c) 7.13% 5.07%S&P SmallCap 600 Index(c) 5.60% 9.61%(a) The performance data quoted is historical. Past performance is no guarantee of future results. Current performance may be higher or lower than the performance data
quoted. The principal value and investment return of an investment will fluctuate so that investor’s shares, when redeemed, may be worth more or less than the originalcost. The returns shown do not reflect the deduction of taxes that a shareholder would pay on Fund distributions or on redemptions of Fund shares. The total annualoperating expenses as stated in the fee table to the Fund’s prospectus dated August 31, 2018, is 0.59%. For performance information current to the most recent month-end,please call 1-877-337-0500.
(b) Inception date is June 16, 2017.(c) Indexes are unmanaged statistical composites and their returns do not include fees an investor would pay to purchase the securities they represent. Such costs would lower
performance. It is not possible to invest directly in an index.
Pacer US Small Cap Cash Cows 100 ETFPERFORMANCE SUMMARY(Unaudited)
11
$9,000
$10,000
$11,000
$12,000
$13,000
$14,000
Pacer US Small Cap Cash Cows 100 ETF – NAV
Pacer US Small Cap Cash Cows 100 ETF – Market
Pacer US Small Cap Cash Cows Index
S&P SmallCap 600 Index
6/16
/17
$11,426
7/31
/17
1/31
/18
4/30
/18
10/3
1/17
10/3
1/18
7/31
/18
$10,742$10,751
$10,380

Growth of $10,000
This chart illustrates the performance of a hypothetical $10,000 investment made on June 16, 2017, and is not intended to imply anyfuture performance. The returns shown do not reflect the deduction of taxes that a shareholder would pay on fund distributions or theredemption of fund shares. The chart assumes reinvestment of capital gains and dividends.
The Pacer Developed Markets International Cash Cows 100 Index uses an objective, rules-based methodology to provide exposure to largeand mid-capitalization non-U.S. companies in developed markets with high free cash flow yields. The initial index universe is derived fromthe component companies of the FTSE Developed ex US Index. The initial universe of companies is screened based on their averageprojected free cash flows and earnings over each of the next two fiscal years. Companies with no forward year estimates available for freecash flows or earnings will remain in the Index universe. Companies with negative average projected free cash flows or earnings are removedfrom the Index universe. Additionally, financial companies, other than real estate investment trusts, and companies with a marketcapitalization of less than $3 billion are excluded from the Index universe. The remaining companies are ranked by their average dailytrading value (“ADTV”) for the prior three months. The 500 companies with the highest ADTV are then ranked by their free cash flowyield for the trailing twelve month period. The equity securities of the 100 companies with the highest free cash flow yield are included inthe Index.
The FTSE Developed ex-US Index is comprised of Large (85%) and Mid (15%) cap stocks providing coverage of Developed markets(24 countries) excluding the US. The index is derived from the FTSE Global Equity Index Series, which covers 98% of the world’sinvestable market capitalization.
Annualized Returns(a)
(For the period ended October 31, 2018) One Year Since Inception(b) ________ _______________
Pacer Developed Markets International Cash Cows 100 ETF – NAV -7.45% 2.57%Pacer Developed Markets International Cash Cows 100 ETF – Market -8.96% 2.41%Pacer Developed Markets International Cash Cows 100 Index(c) -6.47% 3.39%FTSE Developed ex-US Index(c) -7.37% -0.53%(a) The performance data quoted is historical. Past performance is no guarantee of future results. Current performance may be higher or lower than the performance data
quoted. The principal value and investment return of an investment will fluctuate so that investor’s shares, when redeemed, may be worth more or less than the originalcost. The returns shown do not reflect the deduction of taxes that a shareholder would pay on Fund distributions or on redemptions of Fund shares. The total annualoperating expenses as stated in the fee table to the Fund’s prospectus dated August 31, 2017, is 0.65%. For performance information current to the most recent month-end,please call 1-877-337-0500.
(b) Inception date is June 16, 2017.(c) Indexes are unmanaged statistical composites and their returns do not include fees an investor would pay to purchase the securities they represent. Such costs would lower
performance. It is not possible to invest directly in an index.
Pacer Developed Markets International Cash Cows 100 ETFPERFORMANCE SUMMARY(Unaudited)
12
$9,500
$10,000
$10,500
$11,000
$11,500
$12,000
$12,500
6/16
/17
$10,496
7/31
/17
1/31
/18
4/30
/18
10/3
1/17
10/3
1/18
7/31
/18
$10,353$10,334
$9,671
Pacer Developed Markets International Cash Cows ETF – NAV
Pacer Developed Markets International Cash Cows ETF – Market
Pacer Developed Markets International Cash Cows 100 Index
FTSE Developed ex-US Index
Growth of $10,000
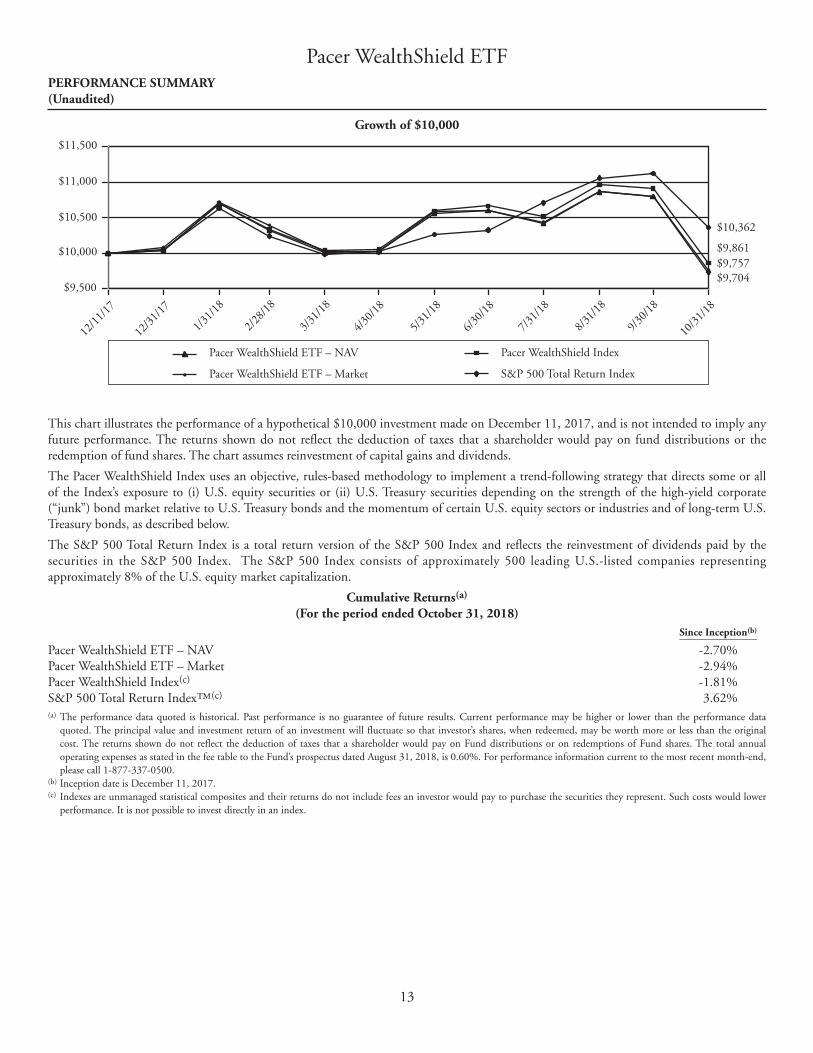
This chart illustrates the performance of a hypothetical $10,000 investment made on December 11, 2017, and is not intended to imply anyfuture performance. The returns shown do not reflect the deduction of taxes that a shareholder would pay on fund distributions or theredemption of fund shares. The chart assumes reinvestment of capital gains and dividends.
The Pacer WealthShield Index uses an objective, rules-based methodology to implement a trend-following strategy that directs some or allof the Index’s exposure to (i) U.S. equity securities or (ii) U.S. Treasury securities depending on the strength of the high-yield corporate(“junk”) bond market relative to U.S. Treasury bonds and the momentum of certain U.S. equity sectors or industries and of long-term U.S.Treasury bonds, as described below.
The S&P 500 Total Return Index is a total return version of the S&P 500 Index and reflects the reinvestment of dividends paid by thesecurities in the S&P 500 Index. The S&P 500 Index consists of approximately 500 leading U.S.-listed companies representingapproximately 8% of the U.S. equity market capitalization.
Cumulative Returns(a)
(For the period ended October 31, 2018) Since Inception(b) _______________
Pacer WealthShield ETF – NAV -2.70%Pacer WealthShield ETF – Market -2.94%Pacer WealthShield Index(c) -1.81%S&P 500 Total Return Index™(c) 3.62%(a) The performance data quoted is historical. Past performance is no guarantee of future results. Current performance may be higher or lower than the performance data
quoted. The principal value and investment return of an investment will fluctuate so that investor’s shares, when redeemed, may be worth more or less than the originalcost. The returns shown do not reflect the deduction of taxes that a shareholder would pay on Fund distributions or on redemptions of Fund shares. The total annualoperating expenses as stated in the fee table to the Fund’s prospectus dated August 31, 2018, is 0.60%. For performance information current to the most recent month-end,please call 1-877-337-0500.
(b) Inception date is December 11, 2017.(c) Indexes are unmanaged statistical composites and their returns do not include fees an investor would pay to purchase the securities they represent. Such costs would lower
performance. It is not possible to invest directly in an index.
Pacer WealthShield ETFPERFORMANCE SUMMARY(Unaudited)
13
$9,500
$10,000
$10,500
$11,000
$11,500
Pacer WealthShield ETF – NAV
Pacer WealthShield ETF – Market
Pacer WealthShield Index
S&P 500 Total Return Index
12/1
1/17
$9,861
1/31
/18
4/30
/18
10/3
1/18
7/31
/18
$10,362
$9,757$9,704
2/28
/18
5/31
/18
8/31
/18
3/31
/18
6/30
/18
9/30
/18
12/3
1/17

Growth of $10,000
This chart illustrates the performance of a hypothetical $10,000 investment made on April 9, 2018, and is not intended to imply any futureperformance. The returns shown do not reflect the deduction of taxes that a shareholder would pay on fund distributions or the redemptionof fund shares. The chart assumes reinvestment of capital gains and dividends.
The Pacer Military Times Best Employers Index is composed of the U.S.-listed stocks of companies that have been included in the Best forVets List for the last three consecutive years, have a minimum market capitalization of $200 million, and meet the Index’s liquiditythreshold. Index components are equally weighted at the time of each annual reconstitution of the Index, which is effective at the close ofbusiness on the third Friday of each September. As of January 11, 2018, the Index was made up of 37 companies and included significantallocations to companies in the financial, industrial, and information technology sectors. Companies previously included in the Index fortwo consecutive years that are no longer on the Best for Vets List may continue to be included in the Index if the reason that they are nolonger on the Best for Vets List is because they did not complete the most recent Best for Vets Survey.
The S&P 500 Total Return Index is a total return version of the S&P 500 Index and reflects the reinvestment of dividends paid by thesecurities in the S&P 500 Index. The S&P 500 Index consists of approximately 500 leading U.S.-listed companies representingapproximately 8% of the U.S. equity market capitalization.
Cumulative Returns(a)
(For the period ended October 31, 2018) Since Inception(b) _______________
Pacer Military Times Best Employers ETF – NAV 5.88%Pacer Military Times Best Employers ETF – Market 7.70%Military Times Best for VETSSM Total Return Index(c) 6.10%S&P 500 Total Return Index(c) 4.83%(a) The performance data quoted is historical. Past performance is no guarantee of future results. Current performance may be higher or lower than the performance data
quoted. The principal value and investment return of an investment will fluctuate so that investor’s shares, when redeemed, may be worth more or less than the originalcost. The returns shown do not reflect the deduction of taxes that a shareholder would pay on Fund distributions or on redemptions of Fund shares. The total annualoperating expenses as stated in the fee table to the Fund’s prospectus dated August 31, 2018, is 0.60%. For performance information current to the most recent month-end,please call 1-877-337-0500.
(b) Inception date is April 9, 2018.(c) Indexes are unmanaged statistical composites and their returns do not include fees an investor would pay to purchase the securities they represent. Such costs would lower
performance. It is not possible to invest directly in an index.
Pacer Military Times Best Employers ETFPERFORMANCE SUMMARY(Unaudited)
14
$9,500
$10,000
$10,500
$11,000
$11,500
$12,000
Pacer Military Times Best Employers ETF – NAV
Pacer Military Times Best Employers ETF – Market
Military Times Best for VETSSM Total Return Index
S&P 500 Total Return Index
4/9/
18
$10,805
4/30
/18
10/3
1/18
7/31
/18
$11,047
$10,629$10,778
5/31
/18
8/31
/18
6/30
/18
9/30
/18
Growth of $10,000
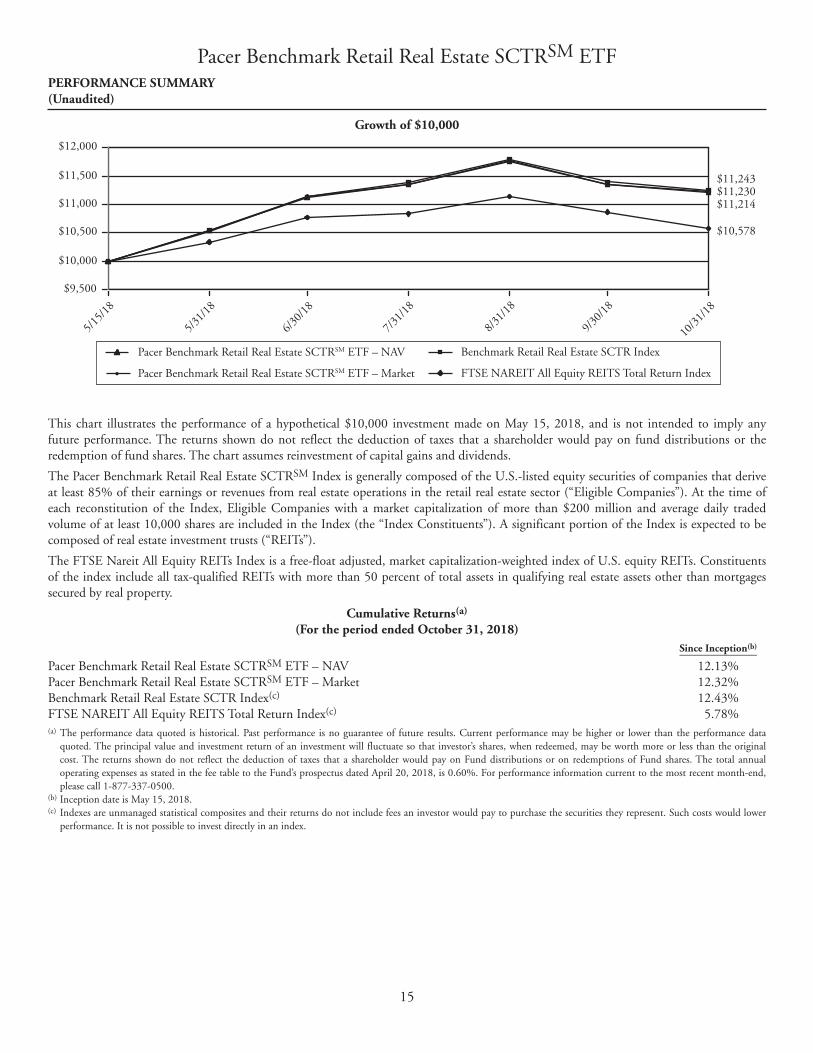
This chart illustrates the performance of a hypothetical $10,000 investment made on May 15, 2018, and is not intended to imply anyfuture performance. The returns shown do not reflect the deduction of taxes that a shareholder would pay on fund distributions or theredemption of fund shares. The chart assumes reinvestment of capital gains and dividends.
The Pacer Benchmark Retail Real Estate SCTRSM Index is generally composed of the U.S.-listed equity securities of companies that deriveat least 85% of their earnings or revenues from real estate operations in the retail real estate sector (“Eligible Companies”). At the time ofeach reconstitution of the Index, Eligible Companies with a market capitalization of more than $200 million and average daily tradedvolume of at least 10,000 shares are included in the Index (the “Index Constituents”). A significant portion of the Index is expected to becomposed of real estate investment trusts (“REITs”).
The FTSE Nareit All Equity REITs Index is a free-float adjusted, market capitalization-weighted index of U.S. equity REITs. Constituentsof the index include all tax-qualified REITs with more than 50 percent of total assets in qualifying real estate assets other than mortgagessecured by real property.
Cumulative Returns(a)
(For the period ended October 31, 2018) Since Inception(b) _______________
Pacer Benchmark Retail Real Estate SCTRSM ETF – NAV 12.13%Pacer Benchmark Retail Real Estate SCTRSM ETF – Market 12.32%Benchmark Retail Real Estate SCTR Index(c) 12.43%FTSE NAREIT All Equity REITS Total Return Index(c) 5.78%(a) The performance data quoted is historical. Past performance is no guarantee of future results. Current performance may be higher or lower than the performance data
quoted. The principal value and investment return of an investment will fluctuate so that investor’s shares, when redeemed, may be worth more or less than the originalcost. The returns shown do not reflect the deduction of taxes that a shareholder would pay on Fund distributions or on redemptions of Fund shares. The total annualoperating expenses as stated in the fee table to the Fund’s prospectus dated April 20, 2018, is 0.60%. For performance information current to the most recent month-end,please call 1-877-337-0500.
(b) Inception date is May 15, 2018.(c) Indexes are unmanaged statistical composites and their returns do not include fees an investor would pay to purchase the securities they represent. Such costs would lower
performance. It is not possible to invest directly in an index.
Pacer Benchmark Retail Real Estate SCTRSM ETFPERFORMANCE SUMMARY(Unaudited)
15
$9,500
$10,000
$10,500
$11,000
$11,500
$12,000
5/15
/18
$11,230
10/3
1/18
7/31
/18
$11,243
$10,578
$11,214
5/31
/18
8/31
/18
6/30
/18
9/30
/18
Pacer Benchmark Retail Real Estate SCTRSM ETF – NAV
Pacer Benchmark Retail Real Estate SCTRSM ETF – Market
Benchmark Retail Real Estate SCTR Index
FTSE NAREIT All Equity REITS Total Return Index

Growth of $10,000
This chart illustrates the performance of a hypothetical $10,000 investment made on May 14, 2018, and is not intended to imply anyfuture performance. The returns shown do not reflect the deduction of taxes that a shareholder would pay on fund distributions or theredemption of fund shares. The chart assumes reinvestment of capital gains and dividends.
The Pacer Benchmark Industrial Real Estate SCTRSM Index is generally composed of the U.S.-listed equity securities of companies thatderive at least 85% of their earnings or revenues from real estate operations in the industrial real estate sector (“Industrial Companies”),including companies that derivate at least 85% of their earnings or revenues from self-storage real estate operations (“Self-StorageCompanies”). At the time of each reconstitution of the Index, Industrial Companies with a market capitalization of more than $200 millionand average daily traded volume of at least 10,000 shares are included in the Index (the “Index Constituents”). A significant portion of theIndex is expected to be composed of real estate investment trusts (“REITs”).
The FTSE Nareit All Equity REITs Index is a free-float adjusted, market capitalization-weighted index of U.S. equity REITs. Constituentsof the index include all tax-qualified REITs with more than 50 percent of total assets in qualifying real estate assets other than mortgagessecured by real property.
Cumulative Returns(a)
(For the period ended October 31, 2018) Since Inception(b) _______________
Pacer Benchmark Industrial Real Estate SCTRSM ETF – NAV 1.05%Pacer Benchmark Industrial Real Estate SCTRSM ETF – Market 1.25%Benchmark Industrial Real Estate SCTR Index(c) 1.23%FTSE NAREIT All Equity REITS Total Return Index(c) 4.08%(a) The performance data quoted is historical. Past performance is no guarantee of future results. Current performance may be higher or lower than the performance data
quoted. The principal value and investment return of an investment will fluctuate so that investor’s shares, when redeemed, may be worth more or less than the originalcost. The returns shown do not reflect the deduction of taxes that a shareholder would pay on Fund distributions or on redemptions of Fund shares. The total annualoperating expenses as stated in the fee table to the Fund’s prospectus dated April 20, 2018, is 0.60%. For performance information current to the most recent month-end,please call 1-877-337-0500.
(b) Inception date is May 14, 2018.(c) Indexes are unmanaged statistical composites and their returns do not include fees an investor would pay to purchase the securities they represent. Such costs would lower
performance. It is not possible to invest directly in an index.
Pacer Benchmark Industrial Real Estate SCTRSM ETFPERFORMANCE SUMMARY(Unaudited)
16
$9,500
$10,000
$10,500
$11,000
5/14
/18
$10,125
10/3
1/18
7/31
/18
$10,408
$10,123$10,105
5/31
/18
8/31
/18
6/30
/18
9/30
/18
Pacer Benchmark Industrial Real Estate SCTRSM ETF – NAV
Pacer Benchmark Industrial Real Estate SCTRSM ETF – Market
Benchmark Industrial Real Estate SCTR Index
FTSE NAREIT All Equity REITS Total Return Index

Growth of $10,000
This chart illustrates the performance of a hypothetical $10,000 investment made on May 15, 2018, and is not intended to imply anyfuture performance. The returns shown do not reflect the deduction of taxes that a shareholder would pay on fund distributions or theredemption of fund shares. The chart assumes reinvestment of capital gains and dividends.
The Pacer Benchmark Data & Infrastructure Real Estate SCTRSM Index is generally composed of the U.S.-listed equity securities ofcompanies that derive at least 85% of their earnings or revenues from real estate operations in the data and infrastructure real estate sectors(“Eligible Companies”). At the time of each reconstitution of the Index, Eligible Companies with a market capitalization of more than $200million and average daily traded volume of at least 10,000 shares are included in the Index (the “Index Constituents”). A significant portionof the Index is expected to be composed of real estate investment trusts (“REITs”).
The FTSE Nareit All Equity REITs Index is a free-float adjusted, market capitalization-weighted index of U.S. equity REITs. Constituentsof the index include all tax-qualified REITs with more than 50 percent of total assets in qualifying real estate assets other than mortgagessecured by real property.
Cumulative Returns(a)
(For the period ended October 31, 2018) Since Inception(b) _______________
Pacer Benchmark Data & Infrastructure Real Estate SCTRSM ETF – NAV -0.38%Pacer Benchmark Data & Infrastructure Real Estate SCTRSM ETF – Market -0.22%Benchmark Data & Infrastructure Real Estate SCTR Index(c) 0.07%FTSE NAREIT All Equity REITS Total Return Index(c) 5.78%(a) The performance data quoted is historical. Past performance is no guarantee of future results. Current performance may be higher or lower than the performance data
quoted. The principal value and investment return of an investment will fluctuate so that investor’s shares, when redeemed, may be worth more or less than the originalcost. The returns shown do not reflect the deduction of taxes that a shareholder would pay on Fund distributions or on redemptions of Fund shares. The total annualoperating expenses as stated in the fee table to the Fund’s prospectus dated April 20, 2018, is 0.60%. For performance information current to the most recent month-end,please call 1-877-337-0500.
(b) Inception date is May 15, 2018.(c) Indexes are unmanaged statistical composites and their returns do not include fees an investor would pay to purchase the securities they represent. Such costs would lower
performance. It is not possible to invest directly in an index.
Pacer Benchmark Data & Infrastructure Real Estate SCTRSM ETFPERFORMANCE SUMMARY(Unaudited)
17
$9,500
$10,000
$10,500
$11,000
$11,500
5/15
/18
$10,007
10/3
1/18
7/31
/18
$10,578
$9,962$9,978
5/31
/18
8/31
/18
6/30
/18
9/30
/18
Pacer Benchmark Data & Infrastructure Real Estate SCTRSM ETF – NAV
Pacer Benchmark Data & Infrastructure Real Estate SCTRSM ETF – Market
Benchmark Data & Infrastructure Real Estate SCTR Index
FTSE NAREIT All Equity REITS Total Return Index

Growth of $10,000
This chart illustrates the performance of a hypothetical $10,000 investment made on July 23, 2018, and is not intended to imply anyfuture performance. The returns shown do not reflect the deduction of taxes that a shareholder would pay on fund distributions or theredemption of fund shares. The chart assumes reinvestment of capital gains and dividends.
The Pacer US Export Leaders Index uses an objective, rules-based methodology to measure the performance of an equal weight portfolio ofapproximately 100 large- and mid-capitalization U.S. companies with a high percentage of foreign sales and high free cash flow growth.Free cash flow is a company’s cash flow from operations minus its capital expenditures. Construction of the Index begins with an initialuniverse of the 200 companies across the S&P 900® Index (which is comprised of the S&P 500® Index (“S&P 500”) and S&P MidCap400® Index (“S&P MidCap 400”)) that have the highest annual foreign sales as a percentage of total sales. The 200 companies are thennarrowed to the 100 companies with the highest change in free cash flow growth over the past five years, and those 100 companies areequally weighted to create the Index. The Index is reconstituted and rebalanced to equal-weight quarterly.
The S&P 900® combines the S&P 500® and the S&P MidCap 400® to form an investable benchmark for the mid- to large-cap segmentof the U.S. equity market.
Cumulative Returns(a)
(For the period ended October 31, 2018) Since Inception(b) _______________
Pacer US Export Leaders ETF – NAV -8.33%Pacer US Export Leaders ETF – Market -8.19%Pacer US Export Leaders Index(c) -8.06%S&P 900 Total Return Index®(c) -3.29%(a) The performance data quoted is historical. Past performance is no guarantee of future results. Current performance may be higher or lower than the performance data
quoted. The principal value and investment return of an investment will fluctuate so that investor’s shares, when redeemed, may be worth more or less than the originalcost. The returns shown do not reflect the deduction of taxes that a shareholder would pay on Fund distributions or on redemptions of Fund shares. The total annualoperating expenses as stated in the fee table to the Fund’s prospectus dated August 31, 2018, is 0.60%. For performance information current to the most recent month-end,please call 1-877-337-0500.
(b) Inception date is July 23, 2018.(c) Indexes are unmanaged statistical composites and their returns do not include fees an investor would pay to purchase the securities they represent. Such costs would lower
performance. It is not possible to invest directly in an index.
Pacer US Export Leaders ETFPERFORMANCE SUMMARY(Unaudited)
18
$9,000
$9,500
$10,000
$10,500
$11,000
7/23
/18
$9,430
10/3
1/18
7/31
/18
$9,989
$9,152$9,161
8/31
/18
9/30
/18
Pacer US Export Leaders ETF – NAV
Pacer US Export Leaders ETF – Market
Pacer US Export Leaders Index
S&P 900 Total Return Index®

Growth of $10,000
This chart illustrates the performance of a hypothetical $10,000 investment made on July 23, 2018, and is not intended to imply anyfuture performance. The returns shown do not reflect the deduction of taxes that a shareholder would pay on fund distributions or theredemption of fund shares. The chart assumes reinvestment of capital gains and dividends.
The Pacer CFRA-Stovall Equal Weight Seasonal Rotation Index uses an objective, rules-based methodology to track the performance of asemi-annual rotation of certain sectors within the S&P 500 Equal Weight Index (“EWI”). The S&P 500 EWI is an equal-weighted versionof the S&P 500, which measures the performance of the large-cap segment of the U.S. equity market.
The S&P 500 Total Return Index is a total return version of the S&P 500 Index and reflects the reinvestment of dividends paid by thesecurities in the S&P 500 Index. The S&P 500 Index consists of approximately 500 leading U.S.-listed companies representingapproximately 8% of the U.S. equity market capitalization.
Cumulative Returns(a)
(For the period ended October 31, 2018) Since Inception(b) _______________
Pacer CFRA-Stovall Equal Weight Seasonal Rotation ETF – NAV 0.39%Pacer CFRA-Stovall Equal Weight Seasonal Rotation ETF – Market 0.46%Pacer CFRA-Stovall Equal Weight Seasonal Rotation Index(c) 0.37%S&P 500 Total Return Index(c) -2.91%(a) The performance data quoted is historical. Past performance is no guarantee of future results. Current performance may be higher or lower than the performance data
quoted. The principal value and investment return of an investment will fluctuate so that investor’s shares, when redeemed, may be worth more or less than the originalcost. The returns shown do not reflect the deduction of taxes that a shareholder would pay on Fund distributions or on redemptions of Fund shares. The total annualoperating expenses as stated in the fee table to the Fund’s prospectus dated July 16, 2018, is 0.60%. For performance information current to the most recent month-end,please call 1-877-337-0500.
(b) Inception date is July 23, 2018.(c) Indexes are unmanaged statistical composites and their returns do not include fees an investor would pay to purchase the securities they represent. Such costs would lower
performance. It is not possible to invest directly in an index.
Pacer CFRA-Stovall Equal Weight Seasonal Rotation ETFPERFORMANCE SUMMARY(Unaudited)
19
$9,000
$9,500
$10,000
$10,500
$11,000
Pacer CFRA-Stovall Equal Weight Seasonal Rotation ETF – NAV
Pacer CFRA-Stovall Equal Weight Seasonal Rotation ETF – Market
Pacer CFRA-Stovall Equal Weight Seasonal Rotation Index
S&P 500 Total Return Index
7/23
/18
$10,034
10/3
1/18
7/31
/18
$10,311
$9,919$9,926
8/31
/18
9/30
/18

As a shareholder of a Fund, you pay ongoing expenses, such as advisory fees, and other fund expenses. The following examples are intendedto help you understand the ongoing cost (in dollars) of investing in a Fund and to compare these costs with the ongoing costs of investingin other funds. Please note, the expenses shown in the tables are meant to highlight ongoing costs only and do not reflect any transactionalcosts. You may pay brokerage commissions on your purchase and sale of Fund shares, which are not reflected in the following examples.Each example is based on an investment of $1,000 invested at the beginning of the period and held for the entire period as indicated below.
Actual Expenses
The columns under the heading entitled “Actual” help you estimate the actual expenses you paid over the period. The “Actual EndingAccount Value” shown is derived from a Fund’s actual return and the “Actual Expenses Paid During Period” show the dollar amount thatwould have been paid by an investor who started with $1,000 in a Fund. To estimate the expenses you paid on your account during thisperiod, simply divide your account value by $1,000 (for example, an $8,600 account value divided by $1,000=8.6), then multiply the resultby the number in the column under the heading untitled “Actual Expenses Paid During Period”.
Hypothetical Example for Comparison Purposes
The columns under the heading entitled “Hypothetical” provide information about hypothetical account value and hypothetical expensesbased on a Fund’s actual expense ratio and an assumed rate of return of 5% per year before expenses, which is not the Fund’s return. Thehypothetical account values and expenses may not be used to estimate the actual ending account balance or expenses you paid for theperiod. You may use this information to compare the ongoing costs of investing in a Fund and other funds. To do so, compare this 5%hypothetical example with the 5% hypothetical examples that appear in the shareholder reports of other funds.
Please note that the expenses shown in the table are meant to highlight your ongoing costs only and do not reflect any transactional costswhich may be applicable to your account. Therefore, the last column of the table (Hypothetical Expenses Paid During Period) is useful incomparing ongoing costs only, and will not help you determine the relative total costs of owning different funds. In addition, if thesetransactional costs were included, your costs would have been higher. Fund’s Annual Beginning Account Ending Account Expenses Paid Expense Ratio Value 05/01/18 Value 10/31/18 During Period(a) ____________ ________________ ______________ ______________
Pacer Trendpilot® US Large Cap ETFActual 0.60% $1,000.00 $1,019.50 $3.05Hypothetical(b) 0.60% $1,000.00 $1,022.18 $3.06
Pacer Trendpilot® US Mid Cap ETFActual 0.60% $1,000.00 $1,010.10 $3.04Hypothetical(b) 0.60% $1,000.00 $1,022.18 $3.06
Pacer Trendpilot® 100 ETFActual 0.65% $1,000.00 $1,057.70 $3.37Hypothetical(b) 0.65% $1,000.00 $1,021.93 $3.21
Pacer Trendpilot® European Index ETFActual 0.65% $1,000.00 $ 858.20 $3.04Hypothetical(b) 0.65% $1,000.00 $1,021.93 $3.31
Pacer Global Cash Cows Dividend ETFActual 0.60% $1,000.00 $ 971.90 $2.98Hypothetical(b) 0.60% $1,000.00 $1,022.18 $3.06
Pacer U.S. Cash Cows 100 ETFActual 0.49% $1,000.00 $ 979.10 $2.44Hypothetical(b) 0.49% $1,000.00 $1,022.74 $2.50
Pacer U.S. Small Cap Cash Cows 100 ETFActual 0.59% $1,000.00 $1,001.90 $2.98Hypothetical(b) 0.59% $1,000.00 $1,022.23 $3.01
Pacer Developed Markets International Cash Cows 100 ETFActual 0.65% $1,000.00 $ 889.00 $3.09Hypothetical(b) 0.65% $1,000.00 $1,021.93 $3.31
Pacer FundsEXPENSE EXAMPLE For the Periods Ended October 31, 2018 (Unaudited)
20
Fund’s Annual Beginning Account Ending Account Expenses Paid Expense Ratio Value 05/01/18 Value 10/31/18 During Period(a) ____________ ________________ ______________ ______________
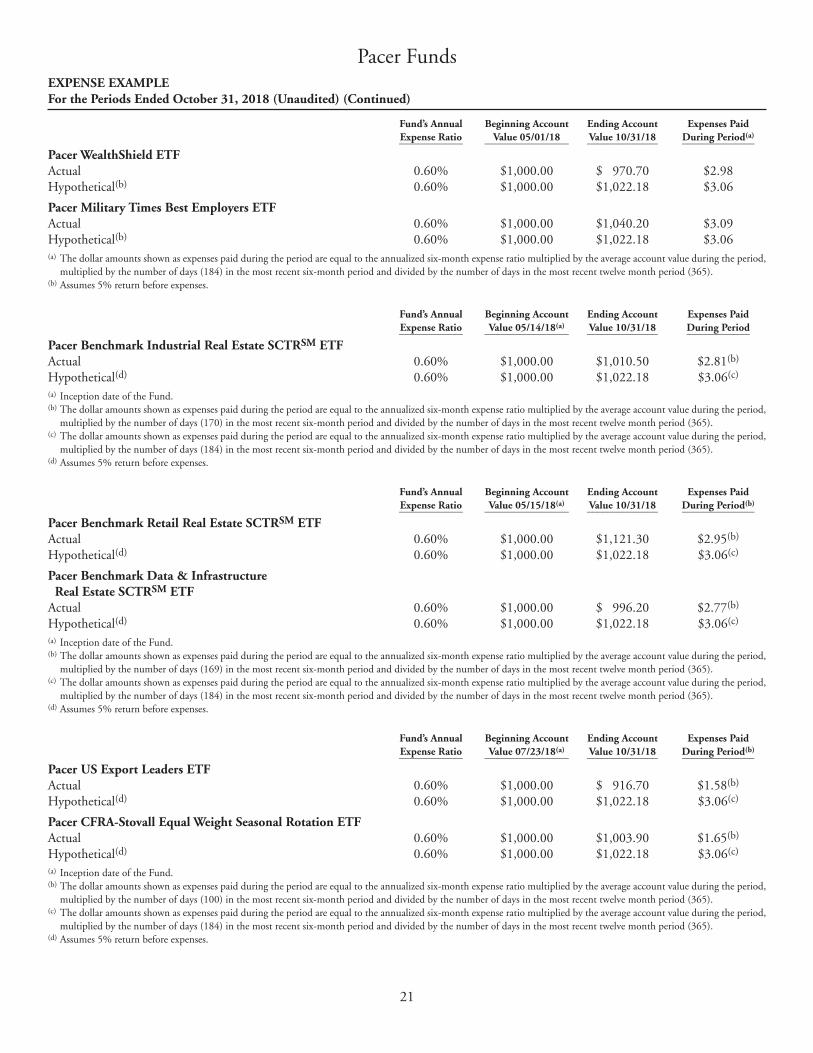
Pacer WealthShield ETFActual 0.60% $1,000.00 $ 970.70 $2.98Hypothetical(b) 0.60% $1,000.00 $1,022.18 $3.06
Pacer Military Times Best Employers ETFActual 0.60% $1,000.00 $1,040.20 $3.09Hypothetical(b) 0.60% $1,000.00 $1,022.18 $3.06(a) The dollar amounts shown as expenses paid during the period are equal to the annualized six-month expense ratio multiplied by the average account value during the period,
multiplied by the number of days (184) in the most recent six-month period and divided by the number of days in the most recent twelve month period (365).(b) Assumes 5% return before expenses.
Fund’s Annual Beginning Account Ending Account Expenses Paid Expense Ratio Value 05/14/18(a) Value 10/31/18 During Period ____________ ________________ ______________ ____________
Pacer Benchmark Industrial Real Estate SCTRSM ETFActual 0.60% $1,000.00 $1,010.50 $2.81(b)
Hypothetical(d) 0.60% $1,000.00 $1,022.18 $3.06(c)
(a) Inception date of the Fund.(b) The dollar amounts shown as expenses paid during the period are equal to the annualized six-month expense ratio multiplied by the average account value during the period,
multiplied by the number of days (170) in the most recent six-month period and divided by the number of days in the most recent twelve month period (365).(c) The dollar amounts shown as expenses paid during the period are equal to the annualized six-month expense ratio multiplied by the average account value during the period,
multiplied by the number of days (184) in the most recent six-month period and divided by the number of days in the most recent twelve month period (365).(d) Assumes 5% return before expenses.
Fund’s Annual Beginning Account Ending Account Expenses Paid Expense Ratio Value 05/15/18(a) Value 10/31/18 During Period(b) ____________ ________________ ______________ ______________
Pacer Benchmark Retail Real Estate SCTRSM ETFActual 0.60% $1,000.00 $1,121.30 $2.95(b)
Hypothetical(d) 0.60% $1,000.00 $1,022.18 $3.06(c)
Pacer Benchmark Data & Infrastructure Real Estate SCTRSM ETF
Actual 0.60% $1,000.00 $ 996.20 $2.77(b)
Hypothetical(d) 0.60% $1,000.00 $1,022.18 $3.06(c)
(a) Inception date of the Fund.(b) The dollar amounts shown as expenses paid during the period are equal to the annualized six-month expense ratio multiplied by the average account value during the period,
multiplied by the number of days (169) in the most recent six-month period and divided by the number of days in the most recent twelve month period (365).(c) The dollar amounts shown as expenses paid during the period are equal to the annualized six-month expense ratio multiplied by the average account value during the period,
multiplied by the number of days (184) in the most recent six-month period and divided by the number of days in the most recent twelve month period (365).(d) Assumes 5% return before expenses.
Fund’s Annual Beginning Account Ending Account Expenses Paid Expense Ratio Value 07/23/18(a) Value 10/31/18 During Period(b) ____________ ________________ ______________ ______________
Pacer US Export Leaders ETFActual 0.60% $1,000.00 $ 916.70 $1.58(b)
Hypothetical(d) 0.60% $1,000.00 $1,022.18 $3.06(c)
Pacer CFRA-Stovall Equal Weight Seasonal Rotation ETFActual 0.60% $1,000.00 $1,003.90 $1.65(b)
Hypothetical(d) 0.60% $1,000.00 $1,022.18 $3.06(c)
(a) Inception date of the Fund.(b) The dollar amounts shown as expenses paid during the period are equal to the annualized six-month expense ratio multiplied by the average account value during the period,
multiplied by the number of days (100) in the most recent six-month period and divided by the number of days in the most recent twelve month period (365).(c) The dollar amounts shown as expenses paid during the period are equal to the annualized six-month expense ratio multiplied by the average account value during the period,
multiplied by the number of days (184) in the most recent six-month period and divided by the number of days in the most recent twelve month period (365).(d) Assumes 5% return before expenses.
Pacer FundsEXPENSE EXAMPLE For the Periods Ended October 31, 2018 (Unaudited) (Continued)
21

Shares Value ______ _____
SHORT-TERM INVESTMENTS – 0.1%
Money Market Funds – 0.1%U.S. Bank Money Market Deposit Account, 2.00% (a) . . . 1,643,709 $ 1,643,709 _____________
TOTAL SHORT-TERM INVESTMENTS (Cost $1,643,709) . . . . . . . . . . . 1,643,709 _____________
INVESTMENTS PURCHASED WITH PROCEEDS FROM SECURITIES LENDING (b) – 2.0%
Mount Vernon Liquid Assets Portfolio, LLC2.39% (a) . . . . . . . . . . . . . . . . . 26,157,581 26,157,581 _____________
TOTAL INVESTMENTS PURCHASED WITH PROCEEDS FROM SECURITIES LENDING (Cost $26,157,581) . . . . . . . . . . 26,157,581 _____________
Total Investments (Cost $27,801,290) – 2.1% . . 27,801,290 _____________
Other Assets in Excess of Liabilities – 97.9% . . . . . . . 1,293,018,431 _____________
TOTAL NET ASSETS – 100.0% . . . . . . . . . . $1,320,819,721 _____________ _____________
Percentages are stated as a percent of net assets.
(a) The rate shown is as of October 31, 2018. (b) See Note 5 and 6.
Categories are shown as a percentage of net assets.
Pacer Trendpilot® US Large Cap ETFSCHEDULE OF INVESTMENTSOctober 31, 2018 (Unaudited)
The accompanying notes are an integral part of these financial statements.
22

Shares Value ______ _____
SHORT-TERM INVESTMENTS – 99.7%
Money Market Funds – 4.9%U.S. Bank Money Market Deposit Account, 2.00% (a) . . . 30,857,552 $ 30,857,552 ____________
U.S. Treasury Bill – 94.8%0.00%, 1/17/19 (b)(c) . . . . . . . . . 605,000,000 602,106,230 ____________TOTAL SHORT-TERM INVESTMENTS (Cost $632,978,393) . . . . . . . . . 632,963,782 ____________
INVESTMENTS PURCHASED WITH PROCEEDS FROM SECURITIES LENDING – 30.0%
Mount Vernon Liquid Assets Portfolio, LLC2.39% (a) . . . . . . . . . . . . . . . . . 190,038,750 190,038,750 ____________
TOTAL INVESTMENTS PURCHASED WITH PROCEEDS FROM SECURITIES LENDING (Cost $190,038,750) . . . . . . . . . 190,038,750 ____________
Total Investments (Cost $823,017,143) – 129.7% . . . . . . . . . . . . . . . . . . . 823,002,532 ____________
Liabilities in Excess of Other Assets – (29.7)% . . . . (188,557,930) ____________
TOTAL NET ASSETS – 100.0% . . . . . . . . . . $ 634,444,602 ____________ ____________
Percentages are stated as a percent of net assets.
(a) The rate shown is as of October 31, 2018. (b) All or portion of this security is on loan as of October 31, 2018. The Total value
of securities on loan is $186,104,270 or 29.3% of net assets. See Note 5 and 6. (c) Non-income producing security.
Categories are shown as a percentage of net assets.
Pacer Trendpilot® US Mid Cap ETFSCHEDULE OF INVESTMENTSOctober 31, 2018 (Unaudited)
The accompanying notes are an integral part of these financial statements.
23

Shares Value ______ _____
COMMON STOCKS – 50.0%
Airlines – 0.1%American Airlines Group, Inc. (a) . . . . . . . . . . . . . 9,322 $ 327,016 ____________
Auto Manufacturers – 0.5%PACCAR, Inc. . . . . . . . . . . . . . . 7,143 408,651Tesla Motors, Inc. (a)(b) . . . . . . . 3,478 1,173,199 ____________ 1,581,850 ____________
Beverages – 1.2%Monster Beverage Corp. (b) . . . . 11,185 591,127PepsiCo, Inc. . . . . . . . . . . . . . . . 28,624 3,216,765 ____________ 3,807,892 ____________
Biotechnology – 3.2%Alexion Pharmaceuticals, Inc. (b) . . . . . . 4,521 506,669
Amgen, Inc. . . . . . . . . . . . . . . . . 13,099 2,525,356Biogen, Inc. (b) . . . . . . . . . . . . . . 4,074 1,239,596BioMarin Pharmaceutical, Inc. (b) . . . . . . 3,566 328,678
Celgene Corp. (b) . . . . . . . . . . . . 14,237 1,019,369Gilead Sciences, Inc. . . . . . . . . . 26,238 1,788,907Illumina, Inc. (b) . . . . . . . . . . . . . 2,973 925,049Incyte Corp. (b) . . . . . . . . . . . . . 4,320 280,022Regeneron Pharmaceuticals, Inc. (b) . . . . . . 2,159 732,419
Shire PLC – ADR . . . . . . . . . . . . 1,397 253,975Vertex Pharmaceuticals, Inc. (b) . . . . . . 5,230 886,276 ____________ 10,486,316 ____________
Commercial Services – 1.3%Automatic Data Processing, Inc. . . . . . . . . . . . . 8,865 1,277,269
Cintas Corp. . . . . . . . . . . . . . . . 2,186 397,568PayPal Holdings, Inc. (b) . . . . . . 23,960 2,017,192Verisk Analytics, Inc. (b) . . . . . . . 3,357 402,303 ____________ 4,094,332 ____________
Computers – 7.1%Apple, Inc. . . . . . . . . . . . . . . . . . 97,754 21,394,441Check Point Software Technologies Ltd. (b) . . . . . . . . 3,161 350,871
Cognizant Technology Solutions Corp. – Class A . . . . . 11,741 810,481
Seagate Technology PLC . . . . . . . 5,819 234,098Western Digital Corp. . . . . . . . . 6,048 260,487 ____________ 23,050,378 ____________
Distribution/Wholesale – 0.1%Fastenal Co. (a) . . . . . . . . . . . . . . 5,856 301,057 ____________
Shares Value ______ _____
Food – 0.8%Mondelez International, Inc. – Class A . . . . . . . . . . . . . . 29,683 $ 1,246,092
The Kraft Heinz Co. . . . . . . . . . 24,677 1,356,495 ____________ 2,602,587 ____________
Healthcare-Products – 0.8%Align Technology, Inc. (b) . . . . . . 1,647 364,316DENTSPLY SIRONA, Inc. . . . . 4,640 160,683Henry Schein, Inc. (b) . . . . . . . . . 3,131 259,873Hologic, Inc. (b) . . . . . . . . . . . . . 5,520 215,225IDEXX Laboratories, Inc. (b) . . . 1,774 376,301Intuitive Surgical, Inc. (b) . . . . . . 2,299 1,198,193 ____________ 2,574,591 ____________
Internet – 13.9%Alphabet, Inc. – Class A (b) . . . . 6,054 6,602,371Alphabet, Inc. – Class C (b) . . . . 7,081 7,624,608Amazon.com, Inc. (b) . . . . . . . . . 9,869 15,770,761Baidu, Inc. – ADR (b) . . . . . . . . . 5,684 1,080,301Booking Holdings, Inc. (b) . . . . . 963 1,805,221Ctrip.com International Ltd. – ADR (b) . . . . . . . . . . . . . 9,443 314,263
eBay, Inc. (b) . . . . . . . . . . . . . . . . 20,030 581,471Expedia Group, Inc. . . . . . . . . . . 2,765 346,814Facebook, Inc. – Class A (b) . . . . 48,808 7,408,566JD.com, Inc. – ADR (b) . . . . . . . 18,921 445,022MercadoLibre, Inc. (a) . . . . . . . . 895 290,428Netflix, Inc. (b) . . . . . . . . . . . . . . 8,816 2,660,493Symantec Corp. . . . . . . . . . . . . . 12,683 230,196 ____________ 45,160,515 ____________
Lodging – 0.3%Marriott International, Inc. – Class A . . . . . . . . . . . . . . 7,020 820,568
Wynn Resorts Ltd. . . . . . . . . . . . 2,230 224,338 ____________ 1,044,906 ____________
Media – 2.4%Charter Communications, Inc. – Class A (b) . . . . . . . . . . . 4,695 1,504,137
Comcast Corp. – Class A . . . . . . 92,543 3,529,590Liberty Global PLC – Class A (b) . . . . . . . . . . . . . . . . 4,350 111,490
Liberty Global PLC – Class C (b) . . . . . . . . . . . . . . . . 11,177 279,872
Sirius XM Holdings, Inc. (a) . . . . 91,996 553,816Twenty First Century Fox, Inc. – Class B . . . . . . . . . . . . . . 16,159 730,064
Twenty-First Century Fox, Inc. – Class A . . . . . . . . . . . . . . 21,334 971,124 ____________ 7,680,093 ____________
Pacer Trendpilot® 100 ETFSCHEDULE OF INVESTMENTSOctober 31, 2018 (Unaudited)
The accompanying notes are an integral part of these financial statements.
24

Shares Value ______ _____
COMMON STOCKS – 50.0% (Continued)
Pharmaceuticals – 0.4%Express Scripts Holding Co. (b) . . . . . . . . . . . . 11,381 $ 1,103,616
Mylan NV (a)(b) . . . . . . . . . . . . . 10,566 330,187 ____________ 1,433,803 ____________
Retail – 2.3%Costco Wholesale Corp. . . . . . . . 8,874 2,028,863Dollar Tree, Inc. (a)(b) . . . . . . . . 4,843 408,265O’Reilly Automotive, Inc. (b) . . . 1,634 524,105Qurate Retail Group, Inc. QVC Group – Class A (b) . . . . . 8,726 191,448
Ross Stores, Inc. . . . . . . . . . . . . . 7,618 754,182Starbucks Corp. . . . . . . . . . . . . . 27,307 1,591,179Ulta Salon Cosmetics & Fragrance, Inc. (b) . . . . . . . . . 1,208 331,620
Walgreens Boots Alliance, Inc. (a) . . . . . . . . . . . . 20,084 1,602,101 ____________ 7,431,763 ____________
Semiconductors – 5.3%Analog Devices, Inc. (a) . . . . . . . 7,601 636,280Applied Materials, Inc. . . . . . . . . 19,893 654,082ASML Holding NV – ADR (a) . . 1,510 260,263Broadcom, Inc. . . . . . . . . . . . . . 8,738 1,952,856Intel Corp. . . . . . . . . . . . . . . . . . 93,323 4,374,982KLA-Tencor Corp. . . . . . . . . . . . 3,176 290,731Lam Research Corp. (a) . . . . . . . . 3,186 451,552Maxim Integrated Products, Inc. (a) . . . . . . . . . . . . 5,694 284,814
Microchip Technology, Inc. (a) . . 4,818 316,928Micron Technology, Inc. (b) . . . . 23,476 885,515NVIDIA Corp. . . . . . . . . . . . . . 12,305 2,594,263QUALCOMM, Inc. (a) . . . . . . . 29,732 1,869,845Skyworks Solutions, Inc. (a) . . . . 3,687 319,884Texas Instruments, Inc. . . . . . . . 19,676 1,826,523Xilinx, Inc. . . . . . . . . . . . . . . . . . 5,122 437,265 ____________ 17,155,783 ____________
Software – 8.0%Activision Blizzard, Inc. . . . . . . . 15,431 1,065,511Adobe Systems, Inc. (b) . . . . . . . . 9,912 2,435,973Autodesk, Inc. (a)(b) . . . . . . . . . . 4,425 571,931CA, Inc. . . . . . . . . . . . . . . . . . . . 8,396 372,447Cadence Design System, Inc. (b) . . . . . . . . . . . . . 5,862 261,269
Cerner Corp. (b) . . . . . . . . . . . . . 6,775 388,072Citrix Systems, Inc. (a)(b) . . . . . . 2,768 283,637Electronic Arts, Inc. (b) . . . . . . . . 6,171 561,438Fiserv, Inc. (b) . . . . . . . . . . . . . . . 8,193 649,705
Shares Value ______ _____
Software – 8.0% (Continued)Intuit, Inc. . . . . . . . . . . . . . . . . . 5,258 $ 1,109,438Microsoft Corp. . . . . . . . . . . . . . 155,204 16,577,339NetEase, Inc. – ADR . . . . . . . . . . 1,569 326,117Paychex, Inc. . . . . . . . . . . . . . . . 7,320 479,387Synopsys, Inc. (b) . . . . . . . . . . . . 2,991 267,784Take-Two Interactive Software, Inc. (b) . . . . . . . . . . . 2,335 300,911
Workday, Inc. – Class A (b) . . . . . 2,991 397,863 ____________ 26,048,822 ____________
Telecommunications – 1.8%Cisco Systems, Inc. . . . . . . . . . . . 95,183 4,354,622T-Mobile US, Inc. (b) . . . . . . . . . 17,145 1,175,290Vodafone Group PLC – ADR . . . 9,544 180,668 ____________ 5,710,580 ____________
Toys/Games/Hobbies – 0.1%Hasbro, Inc. (a) . . . . . . . . . . . . . . 2,513 230,467 ____________
Transportation – 0.4%CSX Corp. . . . . . . . . . . . . . . . . . 17,384 1,197,062JB Hunt Transport Services, Inc. (a) . . . . . . . . . . . . 2,239 247,656 ____________ 1,444,718 ____________TOTAL COMMON STOCKS (Cost $128,692,801) . . . . . . . . . 162,167,469 ____________
SHORT-TERM INVESTMENTS – 0.1%
Money Market Funds – 0.1%U.S. Bank Money Market Deposit Account, 2.00% (c) . . . 460,940 460,940 ____________
TOTAL SHORT-TERM INVESTMENTS (Cost $460,940) . . . . . . . . . . . . 460,940 ____________
Pacer Trendpilot® 100 ETFSCHEDULE OF INVESTMENTSOctober 31, 2018 (Unaudited) (Continued)
The accompanying notes are an integral part of these financial statements.
25

Shares Value ______ _____
INVESTMENTS PURCHASED WITH PROCEEDS FROM SECURITIES LENDING – 5.8%
Mount Vernon Liquid Assets Portfolio, LLC2.39% (c) . . . . . . . . . . . . . . . . . 18,804,517 $ 18,804,517 ____________
TOTAL INVESTMENTS PURCHASED WITH PROCEEDS FROM SECURITIES LENDING (Cost $18,804,517) . . . . . . . . . . 18,804,517 ____________
Total Investments (Cost $147,958,258) – 55.9% . . . . . . . . . . . . . . . . . . . . 181,432,926 ____________
Other Assets in Excess of Liabilities – 44.1% . . . . . . . 143,202,852 ____________
TOTAL NET ASSETS – 100.0% . . . . . . . . . . $324,635,778 ____________ ____________
ADR American Depositary Receipt (a) All or portion of this security is on loan as of October 31, 2018. The Total value
of securities on loan is $18,632,761 or 5.7% of net assets. See Note 5 and 6. (b) Non-income producing security. (c) The rate shown is as of October 31, 2018.
For Fund compliance purposes, the Fund’s industry classificationsrefer to any one or more of the industry sub-classifications used byone or more widely recognized market indexes or ratings groupindexes, and/or they may be defined by Fund management. Thisdefinition does not apply for all purposes of this report, which maycombine sub-classifications for reporting ease. Categories are shownas a percentage of net assets.
Pacer Trendpilot® 100 ETFSCHEDULE OF INVESTMENTSOctober 31, 2018 (Unaudited) (Continued)
The accompanying notes are an integral part of these financial statements.
26

Shares Value ______ _____
COMMON STOCKS – 0.0%
Retail – 0.0% (a)FF Group (b)(c) . . . . . . . . . . . . . 1,259 $ 6,845 ____________TOTAL COMMON STOCKS (Cost $24,367) . . . . . . . . . . . . . 6,845 ____________
SHORT-TERM INVESTMENTS – 99.9%
Money Market Funds – 2.0%U.S. Bank Money Market Deposit Account, 2.00% (d) . . . 3,160,144 3,160,144 ____________
U.S. Treasury Bill – 97.9%0.00%, 1/10/19 (b) . . . . . . . . . . . 156,379,000 155,705,103 ____________TOTAL SHORT-TERM INVESTMENTS (Cost $158,864,070) . . . . . . . . . 158,865,247 ____________
INVESTMENTS PURCHASED WITH PROCEEDS FROM SECURITIES LENDING (e) – 30.0%
Mount Vernon Liquid Assets Portfolio, LLC2.39% (d) . . . . . . . . . . . . . . . . . 47,763,750 47,763,750 ____________
TOTAL INVESTMENTS PURCHASED WITH PROCEEDS FROM SECURITIES LENDING (Cost $47,763,750) . . . . . . . . . . 47,763,750 ____________
Total Investments (Cost $206,652,187) – 129.9% . . . . . . . . . . . . . . . . . . . 206,635,842 ____________
Liabilities in Excess of Other Assets – (29.9)% . . . . (47,531,608) ____________
TOTAL NET ASSETS – 100.0% . . . . . . . . . . $159,104,234 ____________ ____________
(a) Less than 0.05%. (b) Non-income producing security. (c) As of October 31, 2018, the Fund has fair valued this security. This security is
deemed illiquid according to the Fund/s liquidity guidelines. The total valueof this security was $6,845 or 0.0% of net assets.
(d) The rate shown is as of October 31, 2018. (e) See Note 5 and 6.
For Fund compliance purposes, the Fund’s industry classificationsrefer to any one or more of the industry sub-classifications used byone or more widely recognized market indexes or ratings groupindexes, and/or they may be defined by Fund management. Thisdefinition does not apply for all purposes of this report, which maycombine sub-classifications for reporting ease. Categories are shownas a percentage of net assets.
Pacer Trendpilot® European Index ETFSCHEDULE OF INVESTMENTSOctober 31, 2018 (Unaudited)
The accompanying notes are an integral part of these financial statements.
27

Shares Value ______ _____
COMMON STOCKS – 94.6%
Australia – 8.0%AGL Energy Ltd. . . . . . . . . . . . . 44,510 $ 567,356Amcor Ltd. . . . . . . . . . . . . . . . . 66,522 626,530Aurizon Holdings Ltd. . . . . . . . . 151,220 449,763BHP Billiton Ltd. – ADR (a) . . . 79,356 3,664,660Caltex Australia Ltd. . . . . . . . . . 15,061 301,406CIMIC Group Ltd. . . . . . . . . . . 15,280 511,703Fortescue Metals Group Ltd. . . . 345,151 977,675GPT Group . . . . . . . . . . . . . . . . 125,275 457,762Mirvac Group . . . . . . . . . . . . . . . 238,339 366,252South32 Ltd. . . . . . . . . . . . . . . . 336,013 861,370Stockland . . . . . . . . . . . . . . . . . . 216,356 553,097Telstra Corp. Ltd. . . . . . . . . . . . . 1,445,841 3,153,527Wesfarmers Ltd. . . . . . . . . . . . . . 79,640 2,629,232 ____________ 15,120,333 ____________
Canada – 1.4%BCE, Inc. . . . . . . . . . . . . . . . . . . 68,000 2,643,840 ____________
Finland – 1.3%Nokia OYJ – ADR (a) . . . . . . . . . 282,029 1,585,003UPM-Kymmene OYJ . . . . . . . . . 25,995 836,478 ____________ 2,421,481 ____________
France – 4.7%Cie Generale des Etablissements Michelin . . . . . . 7,703 791,684
Engie SA . . . . . . . . . . . . . . . . . . . 167,040 2,227,793Publicis Groupe SA . . . . . . . . . . . 10,240 594,296Sanofi – ADR . . . . . . . . . . . . . . . 100,963 4,515,065Sodexo SA . . . . . . . . . . . . . . . . . . 6,463 659,703 ____________ 8,788,541 ____________
Germany – 1.8%BASF SE . . . . . . . . . . . . . . . . . . . 39,536 3,046,398Deutsche Lufthansa AG . . . . . . . 21,861 439,750 ____________ 3,486,148 ____________
Hong Kong – 6.1%CK Hutchison Holdings Ltd. . . . 174,953 1,761,365CK Infrastructure Holdings Ltd. . . . . . . . . . . . . . . 143,539 1,048,819
CLP Holdings Ltd. . . . . . . . . . . 127,394 1,427,953NWS Holdings Ltd. . . . . . . . . . . 267,098 528,613Power Assets Holdings Ltd. . . . . 565,722 3,776,554Sands China Ltd. . . . . . . . . . . . . 504,271 1,987,003WH Group Ltd. (b) . . . . . . . . . . 698,943 489,317Wynn Macau Ltd. . . . . . . . . . . . 242,297 499,922 ____________ 11,519,546 ____________
Italy – 0.6%Atlantia SpA . . . . . . . . . . . . . . . . 54,525 1,096,812 ____________
Shares Value ______ _____
Japan – 10.7%Bridgestone Corp. . . . . . . . . . . . 35,861 $ 1,386,640Canon, Inc. – ADR (a) . . . . . . . . 64,798 1,826,008Japan Tobacco, Inc. . . . . . . . . . . 119,804 3,086,013KDDI Corp. . . . . . . . . . . . . . . . 101,583 2,533,836Lawson, Inc. . . . . . . . . . . . . . . . . 5,117 323,795Mitsubishi Corp. . . . . . . . . . . . . 69,224 1,950,922Mitsubishi Tanabe Pharma Corp. . . . . . . . . . . . . . 25,556 377,785
Mitsui & Co. Ltd. . . . . . . . . . . . 74,342 1,242,273Nippon Steel & Sumitomo Metal Corp. . . . . . . 39,391 728,577
NTT DOCOMO, Inc. . . . . . . . 12,151 306,319NTT DOCOMO, Inc. – ADR . . 141,652 3,386,899Subaru Corp. . . . . . . . . . . . . . . . 44,971 1,216,790Takeda Pharmaceutical Co Ltd. – ADR (a) . . . . . . . . . . 90,829 1,916,492 ____________ 20,282,349 ____________
Jersey – 0.5%WPP PLC – ADR . . . . . . . . . . . . 16,000 902,560 ____________
Netherlands – 1.0%Koninklijke Ahold Delhaize NV . . . . . . . . . . . . . . . 52,213 1,196,377
Koninklijke KPN NV . . . . . . . . . 266,185 704,287 ____________ 1,900,664 ____________
New Zealand – 0.2%Meridian Energy Ltd. . . . . . . . . . 194,560 398,020 ____________
Norway – 1.2%Norsk Hydro ASA . . . . . . . . . . . . 95,494 495,720Telenor ASA . . . . . . . . . . . . . . . . 100,140 1,837,131 ____________ 2,332,851 ____________
Republic of Korea – 0.8%Kangwon Land, Inc. . . . . . . . . . . 9,990 251,602LG Uplus Corp. . . . . . . . . . . . . . 19,722 279,505SK Telecom Co Ltd. – ADR . . . . 38,931 1,008,702 ____________ 1,539,809 ____________
Singapore – 0.5%Jardine Cycle & Carriage Ltd. . . 18,014 393,664Singapore Technologies Engineering Ltd. . . . . . . . . . . . 184,429 472,673 ____________ 866,337 ____________
South Korea – 0.8%KT&G Corp. . . . . . . . . . . . . . . . 7,030 626,164SK Innovation Co. Ltd. . . . . . . . 5,013 939,209 ____________ 1,565,373 ____________
Pacer Global Cash Cows Dividend ETFSCHEDULE OF INVESTMENTSOctober 31, 2018 (Unaudited)
The accompanying notes are an integral part of these financial statements.
28

Shares Value ______ _____
COMMON STOCKS – 94.6% (Continued)
Spain – 3.1%Aena SME SA (b) . . . . . . . . . . . . 6,589 $ 1,053,401Ferrovial SA . . . . . . . . . . . . . . . . 32,740 656,365Repsol SA . . . . . . . . . . . . . . . . . . 92,024 1,649,446Telefonica SA – ADR . . . . . . . . . 305,323 2,506,702 ____________ 5,865,914 ____________
Sweden – 1.6%Hennes & Mauritz AB (a) . . . . . . 175,339 3,098,991 ____________
Switzerland – 5.6%Novartis AG – ADR (a) . . . . . . . 51,960 4,544,422Roche Holding AG – ADR . . . . . 142,787 4,335,013Swisscom AG . . . . . . . . . . . . . . . 3,618 1,657,494 ____________ 10,536,929 ____________
United Kingdom – 9.7%Anglo American PLC . . . . . . . . . 72,001 1,541,715BAE Systems PLC . . . . . . . . . . . . 8,516 57,234BAE Systems PLC – ADR (a) . . . 33,056 890,859BT Group PLC – ADR (a) . . . . . 204,577 3,117,753GlaxoSmithKline PLC – ADR . . 96,084 3,753,041Imperial Brands PLC – ADR . . . 7,623 258,039Imperial Brands PLC . . . . . . . . . 78,473 2,661,071Rio Tinto PLC – ADR (a) . . . . . . 67,694 3,336,637Vodafone Group PLC – ADR . . . 147,591 2,793,898 ____________ 18,410,247 ____________
United States – 35.0%AbbVie, Inc. . . . . . . . . . . . . . . . . 39,687 3,089,633Altria Group, Inc. . . . . . . . . . . . . 70,780 4,603,531AT&T, Inc. . . . . . . . . . . . . . . . . 120,973 3,711,452Bristol-Myers Squibb Co. . . . . . . 67,245 3,398,562Cummins, Inc. . . . . . . . . . . . . . . 6,650 908,988CVS Health Corp. . . . . . . . . . . . 43,840 3,173,578Eaton Corp. PLC . . . . . . . . . . . . 19,198 1,375,921Equinor ASA – ADR (a) . . . . . . . 149,163 3,833,489Exxon Mobil Corp. . . . . . . . . . . 48,062 3,829,580Ford Motor Co. (a) . . . . . . . . . . . 287,702 2,747,554General Mills, Inc. . . . . . . . . . . . 35,821 1,568,960Gilead Sciences, Inc. . . . . . . . . . 56,513 3,853,056International Business Machines Corp. . . . . . . . . . . . . 27,706 3,198,103
Kellogg Co. (a) . . . . . . . . . . . . . . 15,888 1,040,346Kimberly-Clark Corp. . . . . . . . . 18,673 1,947,594Las Vegas Sands Corp. . . . . . . . . 39,726 2,027,218LyondellBasell Industries NV – Class A . . . . . . . . . . . . . . 17,721 1,581,954
Pfizer, Inc. . . . . . . . . . . . . . . . . . 108,354 4,665,723Philip Morris International, Inc. . . . . . . . . . . 50,196 4,420,762
Shares Value ______ _____
United States – 35.0% (Continued)Procter & Gamble Co. . . . . . . . . 53,504 $ 4,744,735QUALCOMM, Inc. (a) . . . . . . . 67,058 4,217,278Target Corp. . . . . . . . . . . . . . . . . 25,014 2,091,921 ____________ 66,029,938 ____________TOTAL COMMON STOCKS (Cost $189,719,998) . . . . . . . . . 178,806,683 ____________
REAL ESTATE INVESTMENT TRUSTS – 5.0%
Australia – 0.6%Dexus . . . . . . . . . . . . . . . . . . . . . 70,270 507,570Vicinity Centres . . . . . . . . . . . . . 344,319 646,148 ____________ 1,153,718 ____________
United States – 4.4%AvalonBay Communities, Inc. . . 6,457 1,132,429Public Storage (a) . . . . . . . . . . . . 9,039 1,857,243Simon Property Group, Inc. (a) . . 19,671 3,610,022Ventas, Inc. (a) . . . . . . . . . . . . . . 27,898 1,619,200 ____________ 8,218,894 ____________TOTAL REAL ESTATE INVESTMENT TRUSTS (Cost $9,063,646) . . . . . . . . . . . 9,372,612 ____________
SHORT-TERM INVESTMENTS – 0.1%
Money Market Funds – 0.1%U.S. Bank Money Market Deposit Account, 2.00% (c) . . . 145,313 145,313 ____________
TOTAL SHORT-TERM INVESTMENTS (Cost $145,313) . . . . . . . . . . . . 145,313 ____________
Pacer Global Cash Cows Dividend ETFSCHEDULE OF INVESTMENTSOctober 31, 2018 (Unaudited) (Continued)
The accompanying notes are an integral part of these financial statements.
29

Shares Value ______ _____
INVESTMENTS PURCHASED WITH PROCEEDS FROM SECURITIES LENDING – 20.5%
Mount Vernon Liquid Assets Portfolio, LLC2.39% (c) . . . . . . . . . . . . . . . . . 38,789,497 $ 38,789,497 ____________
TOTAL INVESTMENTS PURCHASED WITH PROCEEDS FROM SECURITIES LENDING (Cost $38,789,497) . . . . . . . . . . 38,789,497 ____________
Total Investments (Cost $237,718,454) – 120.2% . . . . . . . . . . . . . . . . . . . 227,114,105 ____________
Liabilities in Excess of Other Assets – (20.2)% . . . . (38,197,914) ____________
TOTAL NET ASSETS – 100.0% . . . . . . . . . . $188,916,191 ____________ ____________
ADR American Depositary Receipt. (a) All or portion of this security is on loan as of October 31, 2018. The Total value
of securities on loan is $37,877,878 or 20.1% of net assets. See Note 5 and 6. (b) Security exempt from registration under Rule 144(a) and Regulation S of the
Securities Act of 1933. Such securities are treated as liquid securities accordingto the Fund’s liquidity guidelines. The value of those securities total$1,542,718 or 0.82% of net assets.
(c) The rate shown is as of October 31, 2018.
For Fund compliance purposes, the Fund’s industry classificationsrefer to any one or more of the industry sub-classifications used byone or more widely recognized market indexes or ratings groupindexes, and/or they may be defined by Fund management. Thisdefinition does not apply for all purposes of this report, which maycombine sub-classifications for reporting ease. Categories are shownas a percentage of net assets.
Pacer Global Cash Cows Dividend ETFSCHEDULE OF INVESTMENTSOctober 31, 2018 (Unaudited) (Continued)
The accompanying notes are an integral part of these financial statements.
30

Shares Value ______ _____
COMMON STOCKS – 96.2%
Advertising – 1.2%Omnicom Group, Inc. . . . . . . . . 28,749 $ 2,136,626 ____________
Aerospace/Defense – 2.2%Boeing Co. . . . . . . . . . . . . . . . . . 10,557 3,746,257 ____________
Airlines – 3.4%Copa Holdings SA – Class A . . . . 6,863 497,087Delta Air Lines, Inc. . . . . . . . . . . 60,251 3,297,537Southwest Airlines Co. . . . . . . . . 41,164 2,021,153 ____________ 5,815,777 ____________
Apparel – 1.0%Michael Kors Holdings Ltd. (b) . . . . . . . . . . . 16,011 887,169
Ralph Lauren Corp. – Class A . . . 6,836 886,014 ____________ 1,773,183 ____________
Auto Manufacturers – 2.2%Ford Motor Co. . . . . . . . . . . . . . 398,022 3,801,110 ____________
Auto Parts & Equipment – 2.1%Allison Transmission Holdings, Inc. . . . . . . . . . . . . . 16,037 706,911
Aptiv PLC . . . . . . . . . . . . . . . . . . 24,841 1,907,789Lear Corp. . . . . . . . . . . . . . . . . . 8,039 1,068,383 ____________ 3,683,083 ____________
Beverages – 1.3%Molson Coors Brewing Co. – Class B . . . . . . . . . . . . . . 34,345 2,198,080 ____________
Biotechnology – 6.4%Amgen, Inc. . . . . . . . . . . . . . . . . 18,788 3,622,139Biogen, Inc. (b) . . . . . . . . . . . . . . 10,867 3,306,502Gilead Sciences, Inc. . . . . . . . . . 51,088 3,483,180United Therapeutics Corp. (b) . . 5,148 570,707 ____________ 10,982,528 ____________
Chemicals – 3.0%Huntsman Corp. . . . . . . . . . . . . 52,501 1,148,722LyondellBasell Industries NV – Class A . . . . . . . . . . . . . . 33,957 3,031,341
Westlake Chemical Corp. . . . . . . 14,034 1,000,624 ____________ 5,180,687 ____________
Commercial Services – 0.8%H&R Block, Inc. . . . . . . . . . . . . 37,624 998,541ManpowerGroup, Inc. . . . . . . . . 5,280 402,811 ____________ 1,401,352 ____________
Computers – 7.8%DXC Technology Co. . . . . . . . . . 32,450 2,363,334HP, Inc. . . . . . . . . . . . . . . . . . . . 150,884 3,642,340
Shares Value ______ _____
Computers – 7.8% (Continued)International Business Machines Corp. . . . . . . . . . . . . 25,375 $ 2,929,036
NetApp, Inc. . . . . . . . . . . . . . . . 20,805 1,632,984Western Digital Corp. . . . . . . . . 63,965 2,754,973 ____________ 13,322,667 ____________
Diversified Financial Services – 1.7%Alliance Data Systems Corp. . . . 14,210 2,929,818 ____________
Electrical Components & Equipment – 0.2%
Acuity Brands, Inc. . . . . . . . . . . . 3,155 396,394 ____________
Electronics – 0.5%Gentex Corp. . . . . . . . . . . . . . . . 22,960 483,308nVent Electric Plc . . . . . . . . . . . . 16,951 413,943 ____________ 897,251 ____________
Entertainment – 0.3%Cinemark Holdings, Inc. . . . . . . 12,364 513,971 ____________
Food – 1.6%Pilgrim’s Pride Corp. (b) . . . . . . . 31,218 551,310Tyson Foods, Inc. – Class A . . . . 37,619 2,254,130 ____________ 2,805,440 ____________
Forest Products & Paper – 0.2%Domtar Corp. . . . . . . . . . . . . . . 7,941 367,748 ____________
Healthcare-Services – 0.2%MEDNAX, Inc. (b) . . . . . . . . . . . 9,620 397,210 ____________
Home Builders – 0.8%PulteGroup, Inc. . . . . . . . . . . . . 45,899 1,127,738Thor Industries, Inc. . . . . . . . . . 3,886 270,621 ____________ 1,398,359 ____________
Internet – 1.3%Expedia Group, Inc. . . . . . . . . . . 11,272 1,413,847F5 Networks, Inc. (b) . . . . . . . . . 4,781 838,014 ____________ 2,251,861 ____________
Iron/Steel – 0.5%Steel Dynamics, Inc. . . . . . . . . . . 19,731 781,348 ____________
Leisure Time – 0.6%Harley-Davidson, Inc. . . . . . . . . 25,641 979,999 ____________
Lodging – 2.2%Las Vegas Sands Corp. . . . . . . . . 61,503 3,138,498Wyndham Destinations, Inc. . . . 15,645 561,343 ____________ 3,699,841 ____________
Machinery-Construction & Mining – 0.2%
Terex Corp. . . . . . . . . . . . . . . . . 8,360 279,140 ____________
Pacer US Cash Cows 100 ETFSCHEDULE OF INVESTMENTSOctober 31, 2018 (Unaudited)
The accompanying notes are an integral part of these financial statements.
31

Shares Value ______ _____
COMMON STOCKS – 96.2% (Continued)
Media – 1.8%AMC Networks, Inc. – Class A (b) . . . . . . . . . . . . . . . . 8,339 $ 488,499
Viacom, Inc. – Class B . . . . . . . . 82,654 2,643,275 ____________ 3,131,774 ____________
Mining – 3.0%Freeport-McMoRan, Inc. . . . . . . 280,059 3,262,688Newmont Mining Corp. . . . . . . 45,972 1,421,454Royal Gold, Inc. . . . . . . . . . . . . . 5,365 411,120 ____________ 5,095,262 ____________
Oil & Gas – 4.9%HollyFrontier Corp. . . . . . . . . . . 16,290 1,098,598Marathon Petroleum Corp. . . . . 44,292 3,120,371PBF Energy, Inc. – Class A . . . . . 18,743 784,395Phillips 66 . . . . . . . . . . . . . . . . . . 32,625 3,354,502 ____________ 8,357,866 ____________
Packaging & Containers – 0.6%Berry Global Group, Inc. (b) . . . . 23,061 1,005,921 ____________
Pharmaceuticals – 12.0%AbbVie, Inc. . . . . . . . . . . . . . . . . 39,478 3,073,362Allergan PLC . . . . . . . . . . . . . . . 19,384 3,062,866AmerisourceBergen Corp. . . . . . 25,193 2,216,984Cardinal Health, Inc. . . . . . . . . . 56,739 2,870,993CVS Health Corp. . . . . . . . . . . . 48,250 3,492,818Express Scripts Holding Co. (b) . . . . . . . . . . . . 41,066 3,982,170
Herbalife Ltd. (b) . . . . . . . . . . . . 13,243 705,322Nektar Therapeutics (b) . . . . . . . 17,591 680,420Premier, Inc. – Class A (b) . . . . . . 11,876 534,420 ____________ 20,619,355 ____________
Retail – 11.9%Best Buy Co., Inc. . . . . . . . . . . . 22,211 1,558,324Dick’s Sporting Goods, Inc. . . . . 15,876 561,534Foot Locker, Inc. . . . . . . . . . . . . 21,606 1,018,507Gap, Inc. . . . . . . . . . . . . . . . . . . 28,478 777,449Kohl’s Corp. . . . . . . . . . . . . . . . . 27,737 2,100,523L Brands, Inc. . . . . . . . . . . . . . . 33,847 1,097,320Macy’s, Inc. . . . . . . . . . . . . . . . . 40,759 1,397,626Nordstrom, Inc. . . . . . . . . . . . . . 14,512 954,454Qurate Retail Group, Inc. QVC Group – Class A (b) . . . . . 71,369 1,565,836
Target Corp. . . . . . . . . . . . . . . . . 42,024 3,514,467Urban Outfitters, Inc. (b) . . . . . . 7,468 294,687Walgreens Boots Alliance, Inc. . . 54,109 4,316,275Williams-Sonoma, Inc. . . . . . . . . 7,116 422,548Yum China Holdings, Inc. . . . . . 25,687 926,787 ____________ 20,506,337 ____________
Shares Value ______ _____
Semiconductors – 11.6%Applied Materials, Inc. . . . . . . . . 88,880 $ 2,922,374Broadcom, Inc. . . . . . . . . . . . . . 15,721 3,513,486Cypress Semiconductor Corp. . . 33,423 432,494KLA-Tencor Corp. . . . . . . . . . . . 13,964 1,278,265Lam Research Corp. . . . . . . . . . . 18,466 2,617,186Micron Technology, Inc. (b) . . . . 82,236 3,101,942MKS Instruments, Inc. . . . . . . . 4,682 345,017Qorvo, Inc. (b) . . . . . . . . . . . . . . 10,618 780,529QUALCOMM, Inc. . . . . . . . . . 51,939 3,266,444Skyworks Solutions, Inc. . . . . . . 15,511 1,345,734Teradyne, Inc. . . . . . . . . . . . . . . 12,141 418,257 ____________ 20,021,728 ____________
Software – 5.8%CA, Inc. . . . . . . . . . . . . . . . . . . . 31,794 1,410,382Citrix Systems, Inc. (b) . . . . . . . . 10,801 1,106,778Oracle Corp. . . . . . . . . . . . . . . . 82,739 4,040,973VMware, Inc. – Class A (b) . . . . . 24,549 3,470,983 ____________ 10,029,116 ____________
Telecommunications – 2.9%Cisco Systems, Inc. . . . . . . . . . . . 78,412 3,587,349Juniper Networks, Inc. . . . . . . . . 31,462 920,893LogMeIn, Inc. . . . . . . . . . . . . . . 4,556 392,362 ____________ 4,900,604 ____________TOTAL COMMON STOCKS (Cost $176,860,001) . . . . . . . . . 165,407,693 ____________
REAL ESTATE INVESTMENT TRUSTS – 3.6%
Annaly Capital Management, Inc. . . . . . . . . . . 351,616 3,470,450
Apple Hospitality REIT, Inc. . . . 22,943 370,988Duke Realty Corp. . . . . . . . . . . . 49,931 1,376,598Rayonier, Inc. . . . . . . . . . . . . . . . 17,577 530,825Taubman Centers, Inc. . . . . . . . . 8,443 464,450 ____________TOTAL REAL ESTATE INVESTMENT TRUSTS (Cost $6,543,993) . . . . . . . . . . . 6,213,311 ____________
SHORT-TERM INVESTMENTS – 0.2%
Money Market Funds – 0.2%U.S. Bank Money Market Deposit Account, 2.00% (c) . . . 266,284 266,284 ____________
TOTAL SHORT-TERM INVESTMENTS (Cost $266,284) . . . . . . . . . . . . 266,284 ____________
Pacer US Cash Cows 100 ETFSCHEDULE OF INVESTMENTSOctober 31, 2018 (Unaudited) (Continued)
The accompanying notes are an integral part of these financial statements.
32

Shares Value ______ _____
INVESTMENTS PURCHASED WITH PROCEEDS FROM SECURITIES LENDING – 10.9%
Mount Vernon Liquid Assets Portfolio, LLC2.39% (c) . . . . . . . . . . . . . . . . . 18,809,270 $ 18,809,270 ____________
TOTAL INVESTMENTS PURCHASED WITH PROCEEDS FROM SECURITIES LENDING (Cost $18,809,270) . . . . . . . . . . 18,809,270 ____________
Total Investments (Cost $202,479,458) – 110.9% . . . . . . . . . . . . . . . . . . . 190,696,558 ____________
Liabilities in Excess of Other Assets – (10.9)% . . . . (18,729,714) ____________
TOTAL NET ASSETS – 100.0% . . . . . . . . . . $171,966,844 ____________ ____________
(a) All or portion of this security is on loan as of October 31, 2018. The Total valueof securities on loan is $18,411,529 or 10.7% of net assets. See Note 5 and 6.
(b) Non-income producing security. (c) The rate shown is as of October 31, 2018.
For Fund compliance purposes, the Fund’s industry classificationsrefer to any one or more of the industry sub-classifications used byone or more widely recognized market indexes or ratings groupindexes, and/or they may be defined by Fund management. Thisdefinition does not apply for all purposes of this report, which maycombine sub-classifications for reporting ease. Categories are shownas a percentage of net assets.
Pacer US Cash Cows 100 ETFSCHEDULE OF INVESTMENTSOctober 31, 2018 (Unaudited) (Continued)
The accompanying notes are an integral part of these financial statements.
33

Shares Value ______ _____
COMMON STOCKS – 95.6%
Aerospace/Defense – 3.9%Aerojet Rocketdyne Holdings, Inc. (a) . . . . . . . . . . . 12,213 $ 431,363
Kaman Corp. . . . . . . . . . . . . . . . 5,838 370,830National Presto Industries, Inc. (b) . . . . . . . . . . . 1,253 156,211 ___________ 958,404 ___________
Apparel – 0.9%Crocs, Inc. (a) . . . . . . . . . . . . . . . 10,680 219,367 ___________
Auto Manufacturers – 0.7%Wabash National Corp. . . . . . . . 11,485 173,424 ___________
Auto Parts & Equipment – 1.2%Cooper-Standard Holdings, Inc. (a) . . . . . . . . . . . 3,155 292,311 ___________
Biotechnology – 3.1%AMAG Pharmaceuticals, Inc. (a) . . . . . . . . . . . . . . . . . . . 13,545 291,217
Innoviva, Inc. (a) . . . . . . . . . . . . . 33,927 473,621 ___________ 764,838 ___________
Building Materials – 3.1%Apogee Enterprises, Inc. . . . . . . . 5,079 183,352Boise Cascade Co. . . . . . . . . . . . 7,989 245,981Patrick Industries, Inc. (a) . . . . . . 5,654 246,006Quanex Building Products Corp. . . . . . . . . . . . . . 7,098 105,192 ___________ 780,531 ___________
Chemicals – 1.8%Aceto Corp. . . . . . . . . . . . . . . . . 56,812 116,464Hawkins, Inc. . . . . . . . . . . . . . . . 1,910 64,291Kraton Corp. (a) . . . . . . . . . . . . . 9,478 261,024 ___________ 441,779 ___________
Coal – 2.2%CONSOL Energy, Inc. (a) . . . . . 13,500 537,840 ___________
Commercial Services – 7.0%American Public Education, Inc. (a) . . . . . . . . . . 3,049 99,794
Cardtronics PLC – Class A (a) . . 10,082 273,827Cross Country Healthcare, Inc. (a) . . . . . . . . . . 9,440 83,355
Heidrick & Struggles International, Inc. . . . . . . . . . . 2,739 94,523
Korn/Ferry International . . . . . . . 8,561 386,443Navigant Consulting, Inc. . . . . . 10,776 232,762Nutrisystem, Inc. . . . . . . . . . . . . 4,514 160,518Rent-A-Center, Inc. TX (a) . . . . . 17,873 254,690
Shares Value ______ _____
Commercial Services – 7.0% (Continued)TrueBlue, Inc. (a) . . . . . . . . . . . . 6,278 $ 146,466 ___________ 1,732,378 ___________
Computers – 1.2%Insight Enterprises, Inc. (a) . . . . . 5,937 306,884 ___________
Distribution/Wholesale – 3.4%Core-Mark Holding Co, Inc. . . . 9,656 370,887Fossil Group, Inc. (a)(b) . . . . . . . 21,413 464,876 ___________ 835,763 ___________
Diversified Financial Services – 1.5%WageWorks, Inc. (a) . . . . . . . . . . 9,607 382,455 ___________
Electronics – 2.1%Brady Corp. – Class A . . . . . . . . . 6,759 272,320Electro Scientific Industries, Inc. (a) . . . . . . . . . . . 8,887 257,723 ___________ 530,043 ___________
Energy-Alternate Sources – 5.1%FutureFuel Corp. . . . . . . . . . . . . 12,041 197,473Renewable Energy Group, Inc. (a) . . . . . . . . . . . . . 20,476 636,394
REX American Resources Corp. (a) . . . . . . . . . . 1,012 75,060
SolarEdge Technologies, Inc. (a)(b) . . . . . . . . . . . . . . . . . 9,343 361,854 ___________ 1,270,781 ___________
Food – 2.3%Cal-Maine Foods, Inc. . . . . . . . . 9,204 447,958John B Sanfilippo & Son, Inc. . . 1,878 118,427 ___________ 566,385 ___________
Forest Products & Paper – 0.9%Schweitzer-Mauduit International, Inc. . . . . . . . . . . 6,823 217,790 ___________
Healthcare-Products – 0.6%MiMedx Group, Inc. (a)(b) . . . . . 27,613 160,708 ___________
Healthcare-Services – 2.1%Magellan Health, Inc. (a) . . . . . . 3,855 250,806Tivity Health, Inc. (a) . . . . . . . . . 7,553 259,899 ___________ 510,705 ___________
Internet – 3.5%New Media Investment Group, Inc. . . . . . . . . . . . . . . . 17,908 251,607
NIC, Inc. . . . . . . . . . . . . . . . . . . 9,316 123,996Stamps.com, Inc. (a) . . . . . . . . . . 2,451 495,519 ___________ 871,122 ___________
Pacer US Small Cap Cash Cows 100 ETFSCHEDULE OF INVESTMENTSOctober 31, 2018 (Unaudited)
The accompanying notes are an integral part of these financial statements.
34

Shares Value ______ _____
COMMON STOCKS – 95.6% (Continued)
Leisure Time – 1.8%Nautilus, Inc. (a) . . . . . . . . . . . . . 4,711 $ 57,616Vista Outdoor, Inc. (a) . . . . . . . . 31,848 398,100 ___________ 455,716 ___________
Machinery-Diversified – 0.4%Ichor Holdings Ltd. (a)(b) . . . . . . 5,762 102,276 ___________
Media – 1.2%Gannett Co., Inc. . . . . . . . . . . . . 31,095 301,622 ___________
Miscellaneous Manufacturing – 5.1%Fabrinet (a) . . . . . . . . . . . . . . . . . 5,731 248,267Hillenbrand, Inc. . . . . . . . . . . . . 10,639 509,608Sturm Ruger & Co, Inc. (b) . . . . 4,473 265,652Tredegar Corp. . . . . . . . . . . . . . . 12,399 230,621 ___________ 1,254,148 ___________
Oil & Gas Services – 0.5%Matrix Service Co. (a) . . . . . . . . . 6,634 134,869 ___________
Pharmaceuticals – 2.3%Anika Therapeutics, Inc. (a) . . . . 1,518 54,284Corcept Therapeutics, Inc. (a)(b) . . . . . . . . . . . . . . . . . 15,331 180,139
Diplomat Pharmacy, Inc. (a) . . . . 16,403 325,435 ___________ 559,858 ___________
Retail – 21.8%Abercrombie & Fitch Co. – Class A . . . . . . . . . . 27,694 545,572
Barnes & Noble Education, Inc. (a) . . . . . . . . . . 20,960 119,682
Caleres, Inc. . . . . . . . . . . . . . . . . 8,610 294,462Chico’s FAS, Inc. . . . . . . . . . . . . 45,075 345,725DSW, Inc. – Class A . . . . . . . . . . 15,989 424,508Express, Inc. (a) . . . . . . . . . . . . . . 17,803 156,844GameStop Corp. – Class A (b) . . 32,449 473,755Genesco, Inc. (a) . . . . . . . . . . . . . 7,739 331,152Haverty Furniture Cos, Inc. . . . . 3,704 75,117Hibbett Sports, Inc. (a) . . . . . . . . 12,797 223,564La-Z-Boy, Inc. . . . . . . . . . . . . . . 8,003 222,483MarineMax, Inc. (a) . . . . . . . . . . 5,528 125,817Movado Group, Inc. . . . . . . . . . . 3,629 139,753Office Depot, Inc. . . . . . . . . . . . 170,308 435,989PetMed Express, Inc. . . . . . . . . . 3,135 87,592Red Robin Gourmet Burgers, Inc. (a) . . . . . . . . . . . . 4,059 122,582
Shoe Carnival, Inc. . . . . . . . . . . . 4,558 185,647Tailored Brands, Inc. . . . . . . . . . 21,601 453,837The Buckle, Inc. (b) . . . . . . . . . . 12,263 250,165The Cato Corp. – Class A . . . . . . 5,249 101,201
Shares Value ______ _____
Retail – 21.8% (Continued)Vera Bradley, Inc. (a) . . . . . . . . . . 8,014 $ 105,705Vitamin Shoppe, Inc. (a) . . . . . . . 8,446 65,625Zumiez, Inc. (a) . . . . . . . . . . . . . 5,181 120,510 ___________ 5,407,287 ___________
Semiconductors – 8.8%Advanced Energy Industries, Inc. (a) . . . . . . . . . . . 7,374 317,303
Axcelis Technologies, Inc. (a) . . . . 4,367 75,375Cabot Microelectronics Corp. . . 3,241 316,387Cohu, Inc. . . . . . . . . . . . . . . . . . 4,918 102,295FormFactor, Inc. (a) . . . . . . . . . . 10,818 132,412Kulicke & Soffa Industries, Inc. . . . . . . . . . . . . . 14,622 297,265
MaxLinear, Inc. (a) . . . . . . . . . . . 13,447 261,006Nanometrics, Inc. (a) . . . . . . . . . 4,355 139,621Rambus, Inc. (a) . . . . . . . . . . . . . 19,248 167,650Rudolph Technologies, Inc. (a) . . 3,756 78,087Xperi Corp. . . . . . . . . . . . . . . . . 22,922 297,986 ___________ 2,185,387 ___________
Software – 2.5%MicroStrategy, Inc. – Class A (a) . . . . . . . . . . . . . . . . . 1,031 129,875
Progress Software Corp. . . . . . . . 6,916 222,280TiVo Corp. . . . . . . . . . . . . . . . . . 24,270 266,970 ___________ 619,125 ___________
Telecommunications – 2.3%CalAmp Corp. (a) . . . . . . . . . . . . 8,930 178,064NETGEAR, Inc. (a) . . . . . . . . . . 4,035 223,862Oclaro, Inc. (a) . . . . . . . . . . . . . . 19,213 157,931 ___________ 559,857 ___________
Transportation – 1.1%ArcBest Corp. . . . . . . . . . . . . . . 7,634 283,374 ___________
Trucking & Leasing – 1.2%The Greenbrier Cos., Inc. . . . . . 6,214 294,854 ___________TOTAL COMMON STOCKS (Cost $26,282,534) . . . . . . . . . . 23,711,881 ___________
REAL ESTATE INVESTMENT TRUSTS – 4.3%
Apollo Commercial Real Estate Finance, Inc. . . . . . . . . . 28,691 536,809
Lexington Realty Trust . . . . . . . . 68,207 529,969 ___________TOTAL REAL ESTATE INVESTMENT TRUSTS (Cost $1,129,302) . . . . . . . . . . . 1,066,778 ___________
Pacer US Small Cap Cash Cows 100 ETFSCHEDULE OF INVESTMENTSOctober 31, 2018 (Unaudited) (Continued)
The accompanying notes are an integral part of these financial statements.
35

Shares Value ______ _____
SHORT-TERM INVESTMENTS – 0.1%
Money Market Funds – 0.1%U.S. Bank Money Market Deposit Account, 2.00% (c) . . . 19,526 $ 19,526 ___________
TOTAL SHORT-TERM INVESTMENTS (Cost $19,526) . . . . . . . . . . . . . 19,526 ___________
INVESTMENTS PURCHASED WITH PROCEEDS FROM SECURITIES LENDING – 8.6%
Mount Vernon Liquid Assets Portfolio, 2.39% (c) . . . . 2,135,082 2,135,082 ___________
TOTAL INVESTMENTS PURCHASED WITH PROCEEDS FROM SECURITIES LENDING (Cost $2,135,082) . . . . . . . . . . . 2,135,082 ___________
Total Investments (Cost $29,566,444) – 108.6% . . . . . . . . . . . . . . . . . . . 26,933,267 ___________
Liabilities in Excess of Other Assets – (8.6)% . . . . . (2,143,724) ___________
TOTAL NET ASSETS – 100.0% . . . . . . . . . . $24,789,543 ___________ ___________
(a) Non-income producing security. (b) All or portion of this security is on loan as of October 31, 2018. The Total value
of securities on loan is $2,034,334 or 8.2% of net assets. See Note 5 and 6. (c) The rate shown is as of October 31, 2018.
For Fund compliance purposes, the Fund’s industry classificationsrefer to any one or more of the industry sub-classifications used byone or more widely recognized market indexes or ratings groupindexes, and/or they may be defined by Fund management. Thisdefinition does not apply for all purposes of this report, which maycombine sub-classifications for reporting ease. Categories are shownas a percentage of net assets.
Pacer US Small Cap Cash Cows 100 ETFSCHEDULE OF INVESTMENTSOctober 31, 2018 (Unaudited) (Continued)
The accompanying notes are an integral part of these financial statements.
36

Shares Value ______ _____
COMMON STOCKS – 99.5%
Australia – 5.2%BHP Billiton Ltd. – ADR (a) . . . 12,599 $ 581,822BlueScope Steel Ltd. . . . . . . . . . . 7,139 72,647Fortescue Metals Group Ltd. . . . 115,862 328,191Qantas Airways Ltd. . . . . . . . . . . 57,179 221,487South32 Ltd. . . . . . . . . . . . . . . . 101,530 260,273 ___________ 1,464,420 ___________Canada – 2.9%Imperial Oil Ltd. (a) . . . . . . . . . . 10,251 320,242Magna International, Inc. . . . . . . 5,201 256,097Teck Resources Ltd. . . . . . . . . . . 11,257 232,682 ___________ 809,021 ___________Denmark – 1.8%Carlsberg A/S . . . . . . . . . . . . . . . 2,302 253,933Pandora A/S . . . . . . . . . . . . . . . . 1,850 115,742Vestas Wind Systems A/S . . . . . . 2,306 144,622 ___________ 514,297 ___________Finland – 2.0%Nokia OYJ – ADR (a) . . . . . . . . . 58,558 329,096UPM-Kymmene OYJ . . . . . . . . . 6,975 224,444 ___________ 553,540 ___________France – 7.2%Air France-KLM (b) . . . . . . . . . . 16,976 164,590Arkema SA . . . . . . . . . . . . . . . . . 1,115 117,172Peugeot SA . . . . . . . . . . . . . . . . . 9,059 215,781Publicis Groupe SA . . . . . . . . . . . 4,489 260,526Sanofi – ADR . . . . . . . . . . . . . . . 16,050 717,756Sodexo SA . . . . . . . . . . . . . . . . . . 2,026 206,802Thales SA . . . . . . . . . . . . . . . . . . 2,568 328,675 ___________ 2,011,302 ___________Germany – 5.1%BASF SE . . . . . . . . . . . . . . . . . . . 6,284 484,206Covestro AG (c) . . . . . . . . . . . . . 5,006 323,871Deutsche Lufthansa AG . . . . . . . 16,764 337,221ProSiebenSat.1 Media SE . . . . . . 12,249 283,302 ___________ 1,428,600 ___________Hong Kong – 2.1%Galaxy Entertainment Group Ltd. . . . . . . . . . . . . . . . . 53,124 287,232
WH Group Ltd (c) . . . . . . . . . . . 202,556 141,806Wynn Macau Ltd. . . . . . . . . . . . 73,776 152,219 ___________ 581,257 ___________Italy – 0.5%Pirelli & C SpA (b)(c) . . . . . . . . . 17,864 131,397 ___________Japan – 29.5%Astellas Pharma, Inc. . . . . . . . . . 26,740 414,010Bandai Namco Holdings, Inc. . . 2,224 79,137
Shares Value ______ _____
Japan – 29.5% (Continued)Bridgestone Corp. . . . . . . . . . . . 9,852 $ 380,948Dentsu, Inc. . . . . . . . . . . . . . . . . 4,358 202,383FamilyMart UNY Holdings Co Ltd. . . . . . . . . . . . 1,733 201,506
FUJIFILM Holdings Corp. . . . . 7,851 340,452Japan Tobacco, Inc. . . . . . . . . . . 23,785 612,674Kajima Corp. . . . . . . . . . . . . . . . 18,518 238,946Konami Holdings Corp. . . . . . . . 1,463 55,883Kubota Corp. . . . . . . . . . . . . . . . 16,752 264,564Mazda Motor Corp. . . . . . . . . . . 13,679 148,386Mitsubishi Chemical Holdings Corp. . . . . . . . . . . . . 41,888 327,093
Mitsui & Co. Ltd. . . . . . . . . . . . 35,908 600,031Nexon Co. Ltd. (b) . . . . . . . . . . . 9,881 112,616Nikon Corp. . . . . . . . . . . . . . . . 8,862 154,487Nippon Telegraph & Telephone Corp. . . . . . . . . . . . . 13,539 569,950
Nitto Denko Corp. . . . . . . . . . . 1,979 124,140NTT DOCOMO, Inc. – ADR . . 24,364 582,543NTT DOCOMO, Inc. . . . . . . . 10 252Persol Holdings Co Ltd. . . . . . . . 2,925 55,682Secom Co Ltd. . . . . . . . . . . . . . . 2,914 238,910Shionogi & Co Ltd. . . . . . . . . . . 3,236 207,407Sony Corp. – ADR . . . . . . . . . . . 13,357 723,014Subaru Corp. . . . . . . . . . . . . . . . 14,603 395,116Suzuki Motor Corp. . . . . . . . . . . 6,469 323,923Taisei Corp. . . . . . . . . . . . . . . . . 7,191 308,136Takeda Pharmaceutical Co Ltd. – ADR (a) . . . . . . . . . . 22,183 468,061
Tosoh Corp. . . . . . . . . . . . . . . . . 8,828 116,810 ___________ 8,247,060 ___________Jersey – 2.5%Shire PLC – ADR . . . . . . . . . . . . 3,812 693,021 ___________Netherlands – 1.8%Koninklijke Ahold Delhaize NV . . . . . . . . . . . . . . . 21,577 494,402 ___________
Norway – 3.3%Aker BP ASA . . . . . . . . . . . . . . . . 6,519 214,985Norsk Hydro ASA . . . . . . . . . . . . 33,497 173,886Telenor ASA . . . . . . . . . . . . . . . . 28,431 521,585 ___________ 910,456 ___________Republic of Korea – 7.6%GS Engineering & Construction Corp. . . . . . . . . . 1,689 61,880
Hyundai Mobis Co. Ltd. . . . . . . 1,276 212,751Kia Motors Corp. . . . . . . . . . . . . 6,383 159,078Lotte Chemical Corp. . . . . . . . . 483 111,261NCSoft Corp. . . . . . . . . . . . . . . 378 142,469POSCO – ADR . . . . . . . . . . . . . 7,930 456,927
Pacer Developed Markets International Cash Cows 100 ETFSCHEDULE OF INVESTMENTSOctober 31, 2018 (Unaudited)
The accompanying notes are an integral part of these financial statements.
37

Shares Value ______ _____
COMMON STOCKS – 99.5% (Continued)
Republic of Korea – 7.6% (Continued)Samsung Electronics Co. Ltd. . . 13,202 $ 491,216Samsung Engineering Co Ltd. (b) . . . . . . . . . . . . . . . . 3,395 54,371
SK Hynix, Inc. . . . . . . . . . . . . . . 7,411 443,535 ___________ 2,133,488 ___________Singapore – 0.6%Genting Singapore Ltd. . . . . . . . 175,919 111,763Venture Corp Ltd. . . . . . . . . . . . 3,958 43,776 ___________ 155,539 ___________South Korea – 1.0%SK Innovation Co. Ltd. . . . . . . . 1,522 285,154 ___________Spain – 3.7%ACS Actividades de Construccion y Servicios SA . . . 6,843 256,625
Enagas SA . . . . . . . . . . . . . . . . . . 9,906 262,996Repsol SA . . . . . . . . . . . . . . . . . . 29,353 526,126 ___________ 1,045,747 ___________Sweden – 0.7%Boliden AB . . . . . . . . . . . . . . . . . 5,287 120,835Electrolux AB . . . . . . . . . . . . . . . 3,588 74,574 ___________ 195,409 ___________Switzerland – 3.7%Roche Holding AG – ADR . . . . . 22,660 687,958Swisscom AG . . . . . . . . . . . . . . . 767 351,381 ___________ 1,039,339 ___________United Kingdom – 18.3%Anglo American PLC . . . . . . . . . 26,151 559,956Antofagasta PLC . . . . . . . . . . . . . 18,208 182,650BAE Systems PLC . . . . . . . . . . . . 34,745 233,513BAE Systems PLC – ADR (a) . . . 899 24,228Barratt Developments PLC . . . . . 14,634 96,145Berkeley Group Holdings PLC . . 3,436 153,760Burberry Group PLC . . . . . . . . . 5,269 121,968Centrica PLC . . . . . . . . . . . . . . . 98,792 185,878Evraz PLC . . . . . . . . . . . . . . . . . . 39,377 273,301Fiat Chrysler Automobiles NV (b) . . . . . . . . . 29,109 443,448
Imperial Brands Plc – ADR . . . . . 3,440 116,444Imperial Brands PLC . . . . . . . . . 13,571 460,202International Consolidated Airlines Group SA . . . . . . . . . . . 52,375 403,951
J Sainsbury PLC . . . . . . . . . . . . . 34,526 137,336KAZ Minerals Plc . . . . . . . . . . . . 9,694 64,284Marks & Spencer Group PLC . . . 35,480 134,238Pearson PLC . . . . . . . . . . . . . . . . 12,162 139,692Persimmon PLC . . . . . . . . . . . . . 5,596 164,085Rio Tinto PLC – ADR (a) . . . . . . 10,722 528,487
Shares Value ______ _____
United Kingdom – 18.3% (Continued)Royal Mail PLC . . . . . . . . . . . . . 14,945 $ 68,579Taylor Wimpey PLC . . . . . . . . . . 62,895 129,834Vodafone Group PLC – ADR . . . 23,351 442,034William Hill Plc . . . . . . . . . . . . . 12,400 33,316 ___________ 5,097,329 ___________TOTAL COMMON STOCKS (Cost $30,991,715) . . . . . . . . . . 27,790,778 ___________
SHORT-TERM INVESTMENTS – 0.1%
Money Market Funds – 0.1%U.S. Bank Money Market Deposit Account, 2.00% (d) . . . 23,065 23,065 ___________
TOTAL SHORT-TERM INVESTMENTS (Cost $23,065) . . . . . . . . . . . . . 23,065 ___________
INVESTMENTS PURCHASED WITH PROCEEDS FROM SECURITIES LENDING – 7.0%
Mount Vernon Liquid Assets Portfolio, LLC 2.39% (d) 1,945,516 1,945,516 ___________
TOTAL INVESTMENTS PURCHASED WITH PROCEEDS FROM SECURITIES LENDING (Cost $1,945,516) . . . . . . . . . . . 1,945,516 ___________
Total Investments (Cost $32,960,296) – 106.6% . . . . . . . . . . . . . . . . . . . 29,759,359
Liabilities in Excess of Other Assets – (6.6)% . . . . . (1,842,329) ___________
TOTAL NET ASSETS – 100.0% . . . . . . . . . . $27,917,030 ___________ ___________
Percentages are stated as a percent of net assets.
ADR American Depositary Receipt. (a) All or portion of this security is on loan as of October 31, 2018. The Total value
of securities on loan is $1,941,188 or 7.0% of net assets. See Note 5 and 6. (b) Non-income producing security. (c) Security exempt from registration under Rule 144(a) and Regulation S of the
Securities Act of 1933. Such securities are treated as liquid securities accordingto the Fund’s liquidity guidelines. The value of those securities total $607,483or 2.2% of net assets.
(d) The rate shown is as of October 31, 2018.
For Fund compliance purposes, the Fund’s industry classificationsrefer to any one or more of the industry sub-classifications used byone or more widely recognized market indexes or ratings groupindexes, and/or they may be defined by Fund management. Thisdefinition does not apply for all purposes of this report, which maycombine sub-classifications for reporting ease. Categories are shownas a percentage of net assets.
Pacer Developed Markets International Cash Cows 100 ETFSCHEDULE OF INVESTMENTSOctober 31, 2018 (Unaudited) (Continued)
The accompanying notes are an integral part of these financial statements.
38
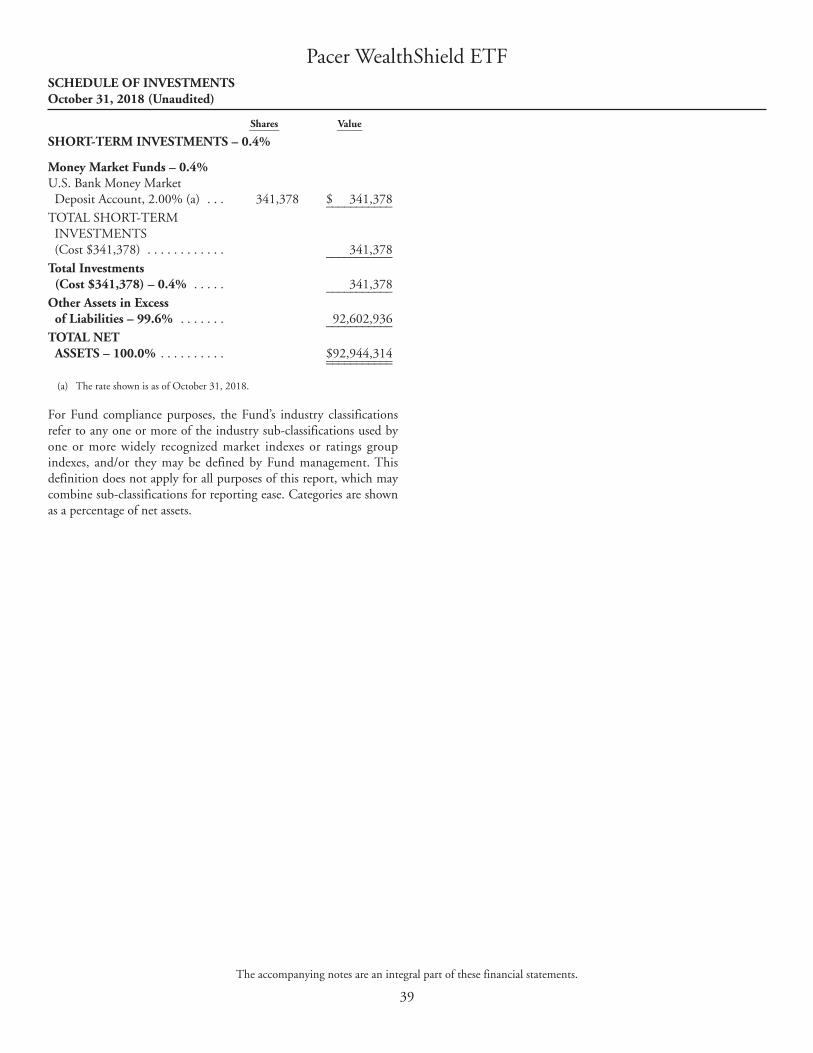
Shares Value ______ _____
SHORT-TERM INVESTMENTS – 0.4%
Money Market Funds – 0.4%U.S. Bank Money Market Deposit Account, 2.00% (a) . . . 341,378 $ 341,378 ___________
TOTAL SHORT-TERM INVESTMENTS (Cost $341,378) . . . . . . . . . . . . 341,378 ___________
Total Investments (Cost $341,378) – 0.4% . . . . . 341,378 ___________
Other Assets in Excess of Liabilities – 99.6% . . . . . . . 92,602,936 ___________
TOTAL NET ASSETS – 100.0% . . . . . . . . . . $92,944,314 ___________ ___________
(a) The rate shown is as of October 31, 2018.
For Fund compliance purposes, the Fund’s industry classificationsrefer to any one or more of the industry sub-classifications used byone or more widely recognized market indexes or ratings groupindexes, and/or they may be defined by Fund management. Thisdefinition does not apply for all purposes of this report, which maycombine sub-classifications for reporting ease. Categories are shownas a percentage of net assets.
Pacer WealthShield ETFSCHEDULE OF INVESTMENTSOctober 31, 2018 (Unaudited)
The accompanying notes are an integral part of these financial statements.
39

Shares Value ______ _____
COMMON STOCKS – 100.0%
Aerospace/Defense – 4.7%Boeing Co. . . . . . . . . . . . . . . . . . 184 $ 65,294Lockheed Martin Corp. . . . . . . . 195 57,301 __________ 122,595 __________
Auto Manufacturers – 2.4%General Motors Co. . . . . . . . . . . 1,710 62,569 __________
Banks – 11.1%Bank of America Corp. . . . . . . . 2,017 55,467Capital One Financial Corp. . . . 629 56,170Citigroup, Inc. . . . . . . . . . . . . . . 876 57,343JPMorgan Chase & Co. . . . . . . . 545 59,416US Bancorp . . . . . . . . . . . . . . . . 1,153 60,267 __________ 288,663 __________
Commercial Services – 2.3%Booz Allen Hamilton Holding Corp. . . . . . . . . . . . . . 1,219 60,389 __________
Computers – 11.0%Accenture PLC – Class A . . . . . . 369 58,162CACI International, Inc. – Class A (a) . . . . . . . . . . . . 321 57,286
DXC Technology Co. . . . . . . . . . 685 49,888Leidos Holdings, Inc. . . . . . . . . . 882 57,136Perspecta, Inc. . . . . . . . . . . . . . . 2,679 65,609 __________ 288,081 __________
Distribution/Wholesale – 1.8%H&E Equipment Services, Inc. . . . . . . . . . . . . . . 1,954 47,072 __________
Diversified Financial Services – 2.2%Charles Schwab Corp. . . . . . . . . 1,229 56,829 __________
Electric – 9.7%Dominion Energy, Inc. . . . . . . . . 882 62,992Exelon Corp. . . . . . . . . . . . . . . . 1,427 62,517Southern Co. . . . . . . . . . . . . . . . 1,425 64,168Xcel Energy, Inc. . . . . . . . . . . . . 1,299 63,664 __________ 253,341 __________
Environmental Control – 2.3%Waste Management, Inc. . . . . . . 686 61,376 __________
Food – 2.7%Hormel Foods Corp. . . . . . . . . . 1,594 69,562 __________
Healthcare-Services – 4.6%DaVita, Inc. (a) . . . . . . . . . . . . . . 900 60,606Humana, Inc. . . . . . . . . . . . . . . . 188 60,237 __________ 120,843 __________
Shares Value ______ _____
Insurance – 9.4%Marsh & McLennan Cos., Inc. . . . . . . . . . . . . . . . . . 741 $ 62,800
Progressive Corp. . . . . . . . . . . . . 924 64,403Prudential Financial, Inc. . . . . . . 635 59,550Travelers Cos., Inc. . . . . . . . . . . . 474 59,312 __________ 246,065 __________
Internet – 4.4%Amazon.com, Inc. (a) . . . . . . . . . 31 49,538CDW Corp. . . . . . . . . . . . . . . . . 712 64,087 __________ 113,625 __________
Lodging – 2.2%Hilton Worldwide Holdings, Inc. . . . . . . . . . . . . . 804 57,221 __________
Media – 2.5%Comcast Corp. – Class A . . . . . . 1,692 64,533 __________
Miscellaneous Manufacturing – 3.9%Eaton Corp. PLC . . . . . . . . . . . . 750 53,753General Electric Co. . . . . . . . . . . 4,820 48,682 __________ 102,435 __________
Pharmaceuticals – 5.2%Express Scripts Holding Co. (a) . . 708 68,655Merck & Co., Inc. . . . . . . . . . . . 910 66,985 __________ 135,640 __________
Retail – 4.6%Home Depot, Inc. . . . . . . . . . . . 311 54,699Walmart, Inc. . . . . . . . . . . . . . . . 651 65,282 __________ 119,981 __________
Software – 3.8%First Data Corp. – Class A (a) . . . 2,426 45,463ManTech International Corp. VA – Class A . . . . . . . . . . 939 53,786 __________ 99,249 __________
Telecommunications – 4.8%AT&T, Inc. . . . . . . . . . . . . . . . . 1,953 59,918Verizon Communications, Inc. . . 1,147 65,482 __________ 125,400 __________
Transportation – 4.4%Union Pacific Corp. . . . . . . . . . . 415 60,681Werner Enterprises, Inc. . . . . . . . 1,684 54,208 __________ 114,889 __________TOTAL COMMON STOCKS (Cost $2,564,813) . . . . . . . . . . . 2,610,358 __________
Pacer Military Times Best Employers ETFSCHEDULE OF INVESTMENTSOctober 31, 2018 (Unaudited)
The accompanying notes are an integral part of these financial statements.
40

Shares Value ______ _____
SHORT-TERM INVESTMENTS – 0.0% (c)
Money Market Funds – 0.0% (c)U.S. Bank Money Market Deposit Account, 2.00% (b) . . . 949 $ 949 __________
TOTAL SHORT-TERM INVESTMENTS (Cost $949) . . . . . . . . . . . . . . . . 949 __________
Total Investments (Cost $2,565,762) – 100.0% . . . . . . . . . . . . . . . . . . . 2,611,307 __________
Other Assets in Excess of Liabilities – 0.0% (c) . . . . . 766 __________
TOTAL NET ASSETS – 100.0% . . . . . . . . . . $2,612,073 __________ __________
(a) Non-income producing security. (b) The rate shown is as of October 31, 2018. (c) Less than 0.05%.
For Fund compliance purposes, the Fund’s industry classificationsrefer to any one or more of the industry sub-classifications used byone or more widely recognized market indexes or ratings groupindexes, and/or they may be defined by Fund management. Thisdefinition does not apply for all purposes of this report, which maycombine sub-classifications for reporting ease. Categories are shownas a percentage of net assets.
Pacer Military Times Best Employers ETFSCHEDULE OF INVESTMENTSOctober 31, 2018 (Unaudited) (Continued)
The accompanying notes are an integral part of these financial statements.
41

Shares Value ______ _____
REAL ESTATE INVESTMENT TRUSTS – 98.8%
Regional Malls – 30.3%Brookfield Property REIT, Inc. – Class A . . . . . . . . . 6,234 $ 120,254
Macerich Co. . . . . . . . . . . . . . . . 2,813 145,207Simon Property Group, Inc. . . . . 2,298 421,729Taubman Centers, Inc. . . . . . . . . 2,271 124,928 __________ 812,118 __________
Shopping Centers – 39.9%Brixmor Property Group, Inc. . . 9,062 146,804Federal Realty Investment Trust . . . . . . . . . . . . 1,284 159,280
Kimco Realty Corp. . . . . . . . . . . 9,180 147,706Regency Centers Corp. . . . . . . . . 4,411 279,481Retail Properties of America, Inc. – Class A . . . . . . . 8,843 108,504
Urban Edge Properties . . . . . . . . 4,539 93,004Weingarten Realty Investors . . . . 4,874 137,057 __________ 1,071,836 __________
Single Tenant – 28.6%Agree Realty Corp. . . . . . . . . . . . 1,226 70,213National Retail Properties, Inc. . . . . . . . . . . . . . 3,326 155,490
Realty Income Corp. . . . . . . . . . 7,018 422,975Spirit Realty Capital, Inc. . . . . . . 15,258 119,318 __________ 767,996 __________TOTAL REAL ESTATE INVESTMENT TRUSTS (Cost $2,649,705) . . . . . . . . . . . 2,651,950 __________
Shares Value ______ _____
SHORT-TERM INVESTMENTS – 1.1%
Money Market Funds – 1.1%U.S. Bank Money Market Deposit Account, 2.00% (a) . . . 28,661 $ 28,661 __________
TOTAL SHORT-TERM INVESTMENTS (Cost $28,661) . . . . . . . . . . . . . 28,661 __________
Total Investments (Cost $2,678,366) – 99.9% . . 2,680,611 __________
Other Assets in Excess of Liabilities – 0.1% . . . . . . . . 1,888 __________
TOTAL NET ASSETS – 100.0% . . . . . . . . . . $2,682,499 __________ __________
(a) The rate shown is as of October 31, 2018.
For Fund compliance purposes, the Fund’s industry classificationsrefer to any one or more of the industry sub-classifications used byone or more widely recognized market indexes or ratings groupindexes, and/or they may be defined by Fund management. Thisdefinition does not apply for all purposes of this report, which maycombine sub-classifications for reporting ease. Categories are shownas a percentage of net assets.
Pacer Benchmark Retail Real Estate SCTRSM ETFSCHEDULE OF INVESTMENTSOctober 31, 2018 (Unaudited)
The accompanying notes are an integral part of these financial statements.
42
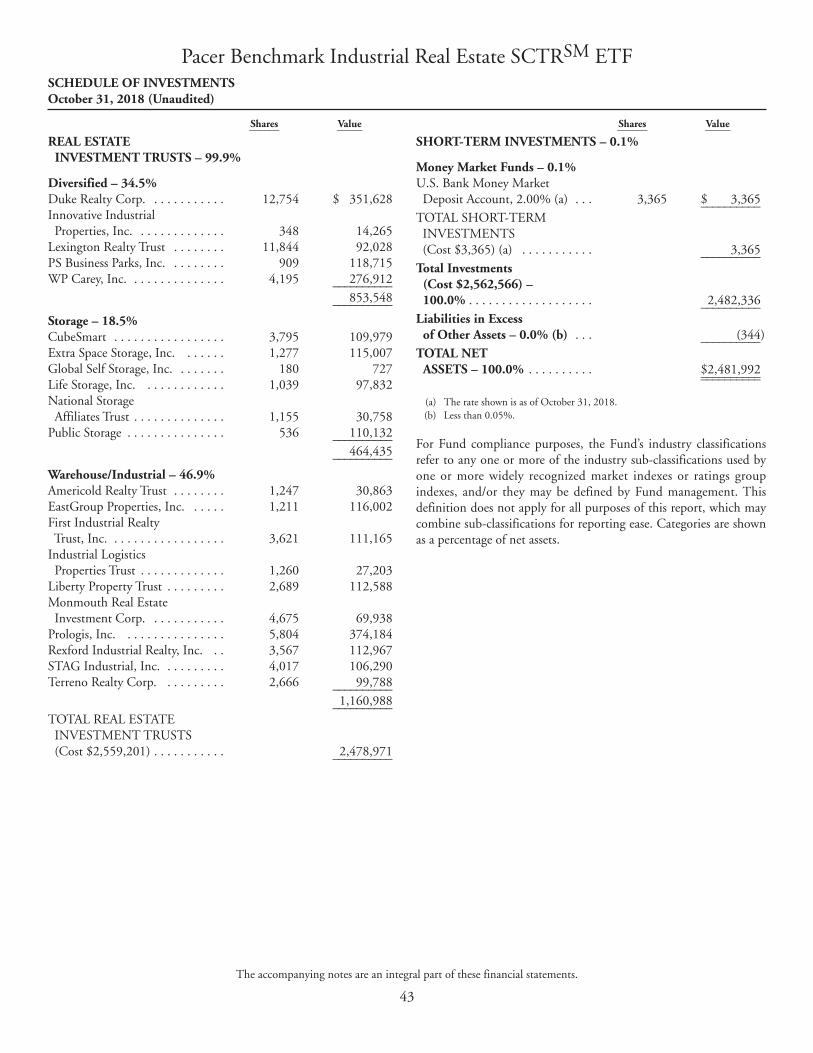
Shares Value ______ _____
REAL ESTATE INVESTMENT TRUSTS – 99.9%
Diversified – 34.5%Duke Realty Corp. . . . . . . . . . . . 12,754 $ 351,628Innovative Industrial Properties, Inc. . . . . . . . . . . . . . 348 14,265
Lexington Realty Trust . . . . . . . . 11,844 92,028PS Business Parks, Inc. . . . . . . . . 909 118,715WP Carey, Inc. . . . . . . . . . . . . . . 4,195 276,912 __________ 853,548 __________
Storage – 18.5%CubeSmart . . . . . . . . . . . . . . . . . 3,795 109,979Extra Space Storage, Inc. . . . . . . 1,277 115,007Global Self Storage, Inc. . . . . . . . 180 727Life Storage, Inc. . . . . . . . . . . . . 1,039 97,832National Storage Affiliates Trust . . . . . . . . . . . . . . 1,155 30,758
Public Storage . . . . . . . . . . . . . . . 536 110,132 __________ 464,435 __________
Warehouse/Industrial – 46.9%Americold Realty Trust . . . . . . . . 1,247 30,863EastGroup Properties, Inc. . . . . . 1,211 116,002First Industrial Realty Trust, Inc. . . . . . . . . . . . . . . . . . 3,621 111,165
Industrial Logistics Properties Trust . . . . . . . . . . . . . 1,260 27,203
Liberty Property Trust . . . . . . . . . 2,689 112,588Monmouth Real Estate Investment Corp. . . . . . . . . . . . 4,675 69,938
Prologis, Inc. . . . . . . . . . . . . . . . 5,804 374,184Rexford Industrial Realty, Inc. . . 3,567 112,967STAG Industrial, Inc. . . . . . . . . . 4,017 106,290Terreno Realty Corp. . . . . . . . . . 2,666 99,788 __________ 1,160,988 __________TOTAL REAL ESTATE INVESTMENT TRUSTS (Cost $2,559,201) . . . . . . . . . . . 2,478,971 __________
Shares Value ______ _____
SHORT-TERM INVESTMENTS – 0.1%
Money Market Funds – 0.1%U.S. Bank Money Market Deposit Account, 2.00% (a) . . . 3,365 $ 3,365 __________
TOTAL SHORT-TERM INVESTMENTS (Cost $3,365) (a) . . . . . . . . . . . 3,365 __________
Total Investments (Cost $2,562,566) – 100.0% . . . . . . . . . . . . . . . . . . . 2,482,336 __________
Liabilities in Excess of Other Assets – 0.0% (b) . . . (344) __________
TOTAL NET ASSETS – 100.0% . . . . . . . . . . $2,481,992 __________ __________
(a) The rate shown is as of October 31, 2018. (b) Less than 0.05%.
For Fund compliance purposes, the Fund’s industry classificationsrefer to any one or more of the industry sub-classifications used byone or more widely recognized market indexes or ratings groupindexes, and/or they may be defined by Fund management. Thisdefinition does not apply for all purposes of this report, which maycombine sub-classifications for reporting ease. Categories are shownas a percentage of net assets.
Pacer Benchmark Industrial Real Estate SCTRSM ETFSCHEDULE OF INVESTMENTSOctober 31, 2018 (Unaudited)
The accompanying notes are an integral part of these financial statements.
43

Shares Value ______ _____
COMMON STOCKS – 7.1%
Computer Software – 3.9%InterXion Holding NV (a) . . . . . 3,205 $ 188,678 __________
Internet Connective Services – 0.2%Internap Corp. (a) . . . . . . . . . . . . 888 7,610 __________
Real Estate Oper/Develop – 0.3%Landmark Infrastructure Partners LP . . . . . . . . . . . . . . . . 899 12,658 __________
Telecom Services – 2.7%GDS Holdings Ltd. – ADR (a) . . 4,868 114,252Switch, Inc. – Class A . . . . . . . . . 2,030 18,006 __________ 132,258 __________TOTAL COMMON STOCKS (Cost $401,700) . . . . . . . . . . . . 341,204 __________
REAL ESTATE INVESTMENT TRUSTS – 92.4%
Diversified – 81.6%American Tower Corp. . . . . . . . . 5,410 842,932CoreCivic, Inc. . . . . . . . . . . . . . . 4,970 111,626CorEnergy Infrastructure Trust, Inc. . . . . . . . . . . . . . . . . . 495 17,884
CoreSite Realty Corp. . . . . . . . . 729 68,424Crown Castle International Corp. . . . . . . . . . 7,073 769,118
Digital Realty Trust, Inc. . . . . . . 1,946 200,944Equinix, Inc. . . . . . . . . . . . . . . . 1,850 700,669Gladstone Land Corp. . . . . . . . . 650 8,132Lamar Advertising Co. – Class A . . . . . . . . . . . . . . 3,140 230,225
Outfront Media, Inc. . . . . . . . . . 5,115 90,638PotlatchDeltic Corp. . . . . . . . . . 2,631 95,374Rayonier, Inc. . . . . . . . . . . . . . . . 4,389 132,548SBA Communications Corp. (a) . . . . . . . . . . . . . . . . . . 1,558 252,661
The GEO Group, Inc. . . . . . . . . 4,417 97,660Uniti Group, Inc. (a) . . . . . . . . . . 7,613 145,713Weyerhaeuser Co. . . . . . . . . . . . 7,484 199,299 __________ 3,963,847 __________
Real Estate Management/Service – 0.2%
Farmland Partners, Inc. . . . . . . . 1,454 9,960 __________
Storage – 4.2%Iron Mountain, Inc. . . . . . . . . . . 6,704 205,209 __________
Shares Value ______ _____
Warehouse/Industrial – 6.4%CyrusOne, Inc. . . . . . . . . . . . . . 3,615 $ 192,426InfraREIT, Inc. (a) . . . . . . . . . . . 1,509 31,719QTS Realty Trust, Inc. – Class A . . . . . . . . . . . . . . 2,210 84,687 __________ 308,832 __________TOTAL REAL ESTATE INVESTMENT TRUSTS (Cost $4,682,397) . . . . . . . . . . . 4,487,848 __________
SHORT-TERM INVESTMENTS – 0.2%
Money Market Funds – 0.2%U.S. Bank Money Market Deposit Account, 2.00% (b) . . . 10,999 10,999 __________
TOTAL SHORT-TERM INVESTMENTS (Cost $10,999) . . . . . . . . . . . . . 10,999 __________
Total Investments (Cost $5,095,096) – 99.7% . . 4,840,051 __________
Other Assets in Excess of Liabilities – 0.3% . . . . . . . . 16,682 __________
TOTAL NET ASSETS – 100.0% . . . . . . . . . . $4,856,733 __________ __________
ADR American Depositary Receipt. (a) Non-income producing security. (b) The rate shown is as of October 31, 2018.
For Fund compliance purposes, the Fund’s industry classificationsrefer to any one or more of the industry sub-classifications used byone or more widely recognized market indexes or ratings groupindexes, and/or they may be defined by Fund management. Thisdefinition does not apply for all purposes of this report, which maycombine sub-classifications for reporting ease. Categories are shownas a percentage of net assets.
Pacer Benchmark Data & Infrastructure Real Estate SCTRSM ETFSCHEDULE OF INVESTMENTSOctober 31, 2018 (Unaudited)
The accompanying notes are an integral part of these financial statements.
44

Shares Value ______ _____
COMMON STOCKS – 99.0%
Aerospace/Defense – 2.2%Boeing Co. . . . . . . . . . . . . . . . . . 68 $ 24,131MSA Safety, Inc. . . . . . . . . . . . . 264 27,572 __________ 51,703 __________
Airlines – 1.3%United Continental Holdings, Inc. (a) . . . . . . . . . . . 358 30,613 __________
Apparel – 2.8%NIKE, Inc. – Class B . . . . . . . . . 276 20,711PVH Corp. . . . . . . . . . . . . . . . . 165 19,931Skechers U.S.A, Inc. – Class A (a) . . . . . . . . . . . . . . . . . 846 24,170 __________ 64,812 __________
Auto Parts & Equipment – 2.6%Aptiv PLC . . . . . . . . . . . . . . . . . . 265 20,352Goodyear Tire & Rubber Co. . . . 990 20,849Visteon Corp. (a) . . . . . . . . . . . . 222 17,547 __________ 58,748 __________
Biotechnology – 0.9%Bio-Rad Laboratories, Inc. – Class A (a) . . . . . . . . . . . . 74 20,191 __________
Chemicals – 4.2%Air Products & Chemicals, Inc. . . . . . . . . . . . . 148 22,844
Eastman Chemical Co. . . . . . . . . 236 18,490International Flavors & Fragrances, Inc. . . . . . . . . . . 198 28,643
Linde Plc . . . . . . . . . . . . . . . . . . . 156 25,813 __________ 95,790 __________
Commercial Services – 2.7%ManpowerGroup, Inc. . . . . . . . . 261 19,912Sabre Corp. . . . . . . . . . . . . . . . . 881 21,716Sotheby’s (a) . . . . . . . . . . . . . . . . 473 19,866 __________ 61,494 __________
Computers – 7.1%Accenture PLC – Class A . . . . . . 154 24,273Apple, Inc. . . . . . . . . . . . . . . . . . 103 22,543DXC Technology Co. . . . . . . . . . 275 20,028Fortinet, Inc. (a) . . . . . . . . . . . . . 400 32,872Lumentum Holdings, Inc. (a) . . . 424 23,172NCR Corp. (a) . . . . . . . . . . . . . . 803 21,561Western Digital Corp. . . . . . . . . 404 17,400 __________ 161,849 __________
Cosmetics/Personal Care – 1.0%Estee Lauder Cos., Inc. – Class A 164 22,540 __________
Shares Value ______ _____
Electrical Components & Equipment – 1.8%
AMETEK, Inc. . . . . . . . . . . . . . 330 $ 22,136Littelfuse, Inc. . . . . . . . . . . . . . . 104 18,841 __________ 40,977 __________
Electronics – 6.2%Coherent, Inc. (a) . . . . . . . . . . . . 139 17,117Gentex Corp. . . . . . . . . . . . . . . . 1,028 21,639Mettler-Toledo International, Inc. (a) . . . . . . . . 42 22,966
National Instruments Corp. . . . . 580 28,403PerkinElmer, Inc. . . . . . . . . . . . . 320 27,674Waters Corp. (a) . . . . . . . . . . . . . 122 23,142 __________ 140,941 __________
Engineering & Construction – 1.1%KBR, Inc. . . . . . . . . . . . . . . . . . . 1,338 26,466 __________
Food – 1.0%Mondelez International, Inc. – Class A . . . . . . . . . . . . . . 526 22,081 __________
Healthcare-Products – 5.5%DENTSPLY SIRONA, Inc. . . . . 662 22,925LivaNova PLC (a) . . . . . . . . . . . . 185 20,718The Cooper Cos., Inc. . . . . . . . . 108 27,898Thermo Fisher Scientific, Inc. . . 116 27,103West Pharmaceutical Services, Inc. . . . . . . . . . . . . . . 258 27,327 __________ 125,971 __________
Healthcare-Services – 5.4%Acadia Healthcare Co., Inc. (a) . . 641 26,602Catalent, Inc. (a) . . . . . . . . . . . . . 536 21,622Charles River Laboratories International, Inc. (a) . . . . . . . . 192 23,389
IQVIA Holdings, Inc. (a) . . . . . . 240 29,503Syneos Health, Inc. (a) . . . . . . . . 473 21,583 __________ 122,699 __________
Internet – 4.0%Alphabet, Inc. – Class A (a) . . . . . 20 21,812Booking Holdings, Inc. (a) . . . . . 12 22,495F5 Networks, Inc. (a) . . . . . . . . . 142 24,890Facebook, Inc. – Class A (a) . . . . 142 21,554 __________ 90,751 __________
Leisure Time – 2.8%Carnival Corp. . . . . . . . . . . . . . . 412 23,088Norwegian Cruise Line Holdings Ltd. (a) . . . . . . . . . . . 458 20,184
Royal Caribbean Cruises Ltd. . . . 197 20,632 __________ 63,904 __________
Pacer US Export Leaders ETFSCHEDULE OF INVESTMENTSOctober 31, 2018 (Unaudited)
The accompanying notes are an integral part of these financial statements.
45

Shares Value ______ _____
COMMON STOCKS – 99.0% (Continued)
Machinery-Diversified – 3.8%Cognex Corp. . . . . . . . . . . . . . . 456 $ 19,535Graco, Inc. . . . . . . . . . . . . . . . . . 522 21,209Nordson Corp. . . . . . . . . . . . . . . 188 23,062Xylem, Inc. . . . . . . . . . . . . . . . . 342 22,428 __________ 86,234 __________
Media – 2.7%Discovery, Inc. – Class A (a) . . . . 1,088 35,240News Corp. – Class A . . . . . . . . . 2,051 27,053 __________ 62,293 __________
Mining – 3.0%Freeport-McMoRan, Inc. . . . . . . 1,682 19,595Newmont Mining Corp. . . . . . . 758 23,438Royal Gold, Inc. . . . . . . . . . . . . . 345 26,437 __________ 69,470 __________
Miscellaneous Manufacturing – 0.9%ITT, Inc. . . . . . . . . . . . . . . . . . . 391 19,746 __________
Office/Business Equipment – 1.1%Zebra Technologies Corp. – Class A (a) . . . . . . . . . . 156 25,943 __________
Oil & Gas – 3.2%Apache Corp. . . . . . . . . . . . . . . . 559 21,147Chevron Corp. . . . . . . . . . . . . . . 221 24,674Murphy Oil Corp. . . . . . . . . . . . 844 26,890 __________ 72,711 __________
Oil & Gas Services – 0.4%McDermott International, Inc. (a) . . . . . . . . 1,252 9,678 __________
Packaging & Containers – 1.3%Ball Corp. . . . . . . . . . . . . . . . . . 666 29,837 __________
Pharmaceuticals – 3.2%Johnson & Johnson . . . . . . . . . . . 202 28,278Mylan NV (a) . . . . . . . . . . . . . . . 614 19,188Zoetis, Inc. . . . . . . . . . . . . . . . . . 288 25,963 __________ 73,429 __________
Retail – 0.9%Tiffany & Co. . . . . . . . . . . . . . . 179 19,923 __________
Semiconductors – 21.2%Advanced Micro Devices, Inc. (a) . . . . . . . . . . . . 1,644 29,937
Analog Devices, Inc. . . . . . . . . . . 249 20,844Applied Materials, Inc. . . . . . . . . 589 19,366Broadcom, Inc. . . . . . . . . . . . . . 107 23,913
Shares Value ______ _____
Semiconductors – 21.2% (Continued)Cirrus Logic, Inc. (a) . . . . . . . . . . 580 $ 21,715Cypress Semiconductor Corp. . . 1,632 21,118Integrated Device Technology, Inc. (a) . . . . . . . . . . 736 34,452
Intel Corp. . . . . . . . . . . . . . . . . . 556 26,065IPG Photonics Corp. (a) . . . . . . . 159 21,235KLA-Tencor Corp. . . . . . . . . . . . 220 20,139Lam Research Corp. . . . . . . . . . . 150 21,260Microchip Technology, Inc. . . . . 245 16,116Micron Technology, Inc. (a) . . . . 520 19,614MKS Instruments, Inc. . . . . . . . 305 22,475Monolithic Power Systems, Inc. . . . . . . . . . . . . . . 167 19,726
NVIDIA Corp. . . . . . . . . . . . . . 96 20,240Qorvo, Inc. (a) . . . . . . . . . . . . . . 304 22,347Silicon Laboratories, Inc. (a) . . . . 243 19,812Skyworks Solutions, Inc. . . . . . . 292 25,334Synaptics, Inc. (a) . . . . . . . . . . . . 501 18,808Teradyne, Inc. . . . . . . . . . . . . . . 613 21,118Texas Instruments, Inc. . . . . . . . 219 20,330 __________ 485,964 __________
Software – 3.8%Adobe Systems, Inc. (a) . . . . . . . . 100 24,576ANSYS, Inc. (a) . . . . . . . . . . . . . 134 20,039Cadence Design System, Inc. (a) . . . . . . . . . . . . . 568 25,316
Electronic Arts, Inc. (a) . . . . . . . . 202 18,378 __________ 88,309 __________
Transportation – 0.9%Expeditors International of Washington, Inc. . . . . . . . . . 305 20,490 __________
TOTAL COMMON STOCKS (Cost $2,469,180) . . . . . . . . . . . 2,265,557 __________
REAL ESTATE INVESTMENT TRUSTS – 0.9%
Rayonier, Inc. . . . . . . . . . . . . . . . 666 20,113 __________TOTAL REAL ESTATE INVESTMENT TRUSTS (Cost $22,611) . . . . . . . . . . . . . 20,113 __________
Pacer US Export Leaders ETFSCHEDULE OF INVESTMENTSOctober 31, 2018 (Unaudited) (Continued)
The accompanying notes are an integral part of these financial statements.
46

Shares Value ______ _____
SHORT-TERM INVESTMENTS – 0.1%
Money Market Funds – 0.1%U.S. Bank Money Market Deposit Account, 2.00% (b) . . . 2,334 $ 2,334 __________
TOTAL SHORT-TERM INVESTMENTS (Cost $2,334) . . . . . . . . . . . . . . 2,334 __________
Total Investments (Cost $2,494,125) – 100.0% . . . . . . . . . . . . . . . . . . . 2,288,004 __________
Liabilities in Excess of Other Assets – 0.0% (c) . . . (53) __________
TOTAL NET ASSETS – 100.0% . . . . . . . . . . $2,287,951 __________ __________
(a) Non-income producing security. (b) The rate shown is as of October 31, 2018. (c) Less than 0.05%.
For Fund compliance purposes, the Fund’s industry classificationsrefer to any one or more of the industry sub-classifications used byone or more widely recognized market indexes or ratings groupindexes, and/or they may be defined by Fund management. Thisdefinition does not apply for all purposes of this report, which maycombine sub-classifications for reporting ease. Categories are shownas a percentage of net assets.
Pacer US Export Leaders ETFSCHEDULE OF INVESTMENTSOctober 31, 2018 (Unaudited) (Continued)
The accompanying notes are an integral part of these financial statements.
47

Shares Value ______ _____
COMMON STOCKS – 99.8%
Aerospace/Defense – 3.9%Arconic, Inc. . . . . . . . . . . . . . . . 444 $ 9,027Boeing Co. . . . . . . . . . . . . . . . . . 28 9,936General Dynamics Corp. . . . . . . 50 8,629Harris Corp. . . . . . . . . . . . . . . . . 61 9,071L3 Technologies, Inc. . . . . . . . . . 47 8,905Lockheed Martin Corp. . . . . . . . 30 8,816Northrop Grumman Corp. . . . . 33 8,644Raytheon Co. . . . . . . . . . . . . . . . 50 8,752Rockwell Collins, Inc. . . . . . . . . 71 9,089TransDigm Group, Inc. (a) . . . . . 27 8,917United Technologies Corp. . . . . . 73 9,067 __________ 98,853 __________
Airlines – 1.8%Alaska Air Group, Inc. . . . . . . . . 146 8,967American Airlines Group, Inc. . . 253 8,875Delta Air Lines, Inc. . . . . . . . . . . 174 9,523Southwest Airlines Co. . . . . . . . . 161 7,905United Continental Holdings, Inc. (a) . . . . . . . . . . . 111 9,492 __________ 44,762 __________
Apparel – 2.7%Hanesbrands, Inc. . . . . . . . . . . . 595 10,210Michael Kors Holdings Ltd. (a) . . 144 7,979NIKE, Inc. – Class B . . . . . . . . . 126 9,455PVH Corp. . . . . . . . . . . . . . . . . 75 9,059Ralph Lauren Corp. – Class A . . . 80 10,369Under Armour, Inc. – Class A (a) . . . . . . . . . . . . 285 6,302
Under Armour, Inc. – Class C (a) . . . . . . . . . . . 289 5,731
VF Corp. . . . . . . . . . . . . . . . . . . 116 9,614 __________ 68,719 __________
Auto Manufacturers – 1.2%Ford Motor Co. . . . . . . . . . . . . . 1,115 10,648General Motors Co. . . . . . . . . . . 304 11,124PACCAR, Inc. . . . . . . . . . . . . . . 143 8,181 __________ 29,953 __________
Auto Parts & Equipment – 1.1%Aptiv PLC . . . . . . . . . . . . . . . . . . 121 9,293BorgWarner, Inc. . . . . . . . . . . . . 235 9,261Goodyear Tire & Rubber Co. . . . 446 9,393 __________ 27,947 __________
Building Materials – 3.0%Fortune Brands Home & Security, Inc. . . . . . . . . . . . . 182 8,159
Shares Value ______ _____
Building Materials – 3.0% (Continued)Johnson Controls International Plc . . . . . . . . . . . . 265 $ 8,472
Martin Marietta Materials, Inc. . . . . . . . . . . . . . 150 25,692
Masco Corp. . . . . . . . . . . . . . . . 264 7,920Vulcan Materials Co. . . . . . . . . . 251 25,386 __________ 75,629 __________
Chemicals – 12.8%Air Products & Chemicals, Inc. . . . . . . . . . . . . 172 26,548
Albemarle Corp. . . . . . . . . . . . . . 288 28,575CF Industries Holdings, Inc. . . . 563 27,041DowDuPont, Inc. . . . . . . . . . . . 423 22,808Eastman Chemical Co. . . . . . . . . 298 23,348FMC Corp. . . . . . . . . . . . . . . . . 340 26,547International Flavors & Fragrances, Inc. . . . . . . . . . . 213 30,813
Linde Plc . . . . . . . . . . . . . . . . . . . 185 30,612LyondellBasell Industries NV – Class A . . . . . . 276 24,639
Mosaic Co. . . . . . . . . . . . . . . . . . 943 29,177PPG Industries, Inc. . . . . . . . . . . 259 27,218Sherwin-Williams Co. . . . . . . . . 59 23,215 __________ 320,541 __________
Commercial Services – 7.5%Automatic Data Processing, Inc. . . . . . . . . . . . . 71 10,230
Cintas Corp. . . . . . . . . . . . . . . . 47 8,548Ecolab, Inc. . . . . . . . . . . . . . . . . 185 28,333Equifax, Inc. . . . . . . . . . . . . . . . . 74 7,506FleetCor Technologies, Inc. (a) . . 48 9,601Gartner, Inc. (a) . . . . . . . . . . . . . 67 9,884Global Payments, Inc. . . . . . . . . 82 9,367H&R Block, Inc. . . . . . . . . . . . . 421 11,173IHS Markit Ltd. (a) . . . . . . . . . . . 183 9,613Nielsen Holdings PLC . . . . . . . . 368 9,561PayPal Holdings, Inc. (a) . . . . . . . 116 9,766Quanta Services, Inc. (a) . . . . . . . 291 9,079Robert Half International, Inc. . . 140 8,474Rollins, Inc. . . . . . . . . . . . . . . . . 163 9,650Total System Services, Inc. . . . . . 106 9,662United Rentals, Inc. (a) . . . . . . . . 60 7,204Verisk Analytics, Inc. (a) . . . . . . . 83 9,947Western Union Co. . . . . . . . . . . 561 10,120 __________ 187,718 __________
Computers – 4.1%Accenture PLC – Class A . . . . . . 61 9,615Apple, Inc. . . . . . . . . . . . . . . . . . 47 10,286
Pacer CFRA-Stovall Equal Weight Seasonal Rotation ETFSCHEDULE OF INVESTMENTSOctober 31, 2018 (Unaudited)
The accompanying notes are an integral part of these financial statements.
48

Shares Value ______ _____
COMMON STOCKS – 99.8% (Continued)
Computers – 4.1% (Continued)Cognizant Technology Solutions Corp. – Class A . . . . . 138 $ 9,526
DXC Technology Co. . . . . . . . . . 114 8,303Fortinet, Inc. (a) . . . . . . . . . . . . . 133 10,930Hewlett Packard Enterprise Co. . . . . . . . . . . . . . 634 9,668
HP, Inc. . . . . . . . . . . . . . . . . . . . 420 10,139International Business Machines Corp. . . . . . . . . . . . . 71 8,196
NetApp, Inc. . . . . . . . . . . . . . . . 123 9,654Seagate Technology PLC . . . . . . . 218 8,770Western Digital Corp. . . . . . . . . 185 7,968 __________ 103,055 __________
Distribution/Wholesale – 1.3%Copart, Inc. (a) . . . . . . . . . . . . . . 155 7,581Fastenal Co. . . . . . . . . . . . . . . . . 174 8,945LKQ Corp. (a) . . . . . . . . . . . . . . 321 8,754WW Grainger, Inc. . . . . . . . . . . 28 7,951 __________ 33,231 __________
Diversified Financial Services – 1.1%Alliance Data Systems Corp. . . . 44 9,072MasterCard, Inc. – Class A . . . . . 48 9,488Visa, Inc. – Class A . . . . . . . . . . . 71 9,787 __________ 28,347 __________
Electrical Components & Equipment – 0.7%
AMETEK, Inc. . . . . . . . . . . . . . 125 8,385Emerson Electric Co. . . . . . . . . . 130 8,824 __________ 17,209 __________
Electronics – 2.9%Allegion PLC . . . . . . . . . . . . . . . 115 9,859Amphenol Corp. – Class A . . . . . 109 9,756Corning, Inc. . . . . . . . . . . . . . . . 298 9,521FLIR Systems, Inc. . . . . . . . . . . . 167 7,734Fortive Corp. . . . . . . . . . . . . . . . 116 8,613Garmin Ltd. . . . . . . . . . . . . . . . . 153 10,122Honeywell International, Inc. . . . 64 9,269TE Connectivity Ltd. . . . . . . . . . 115 8,673 __________ 73,547 __________
Engineering & Construction – 0.7%Fluor Corp. . . . . . . . . . . . . . . . . 174 7,632Jacobs Engineering Group, Inc. . . . . . . . . . . . . . . . 133 9,987 __________ 17,619 __________
Shares Value ______ _____
Environmental Control – 1.5%Pentair PLC . . . . . . . . . . . . . . . . 229 $ 9,195Republic Services, Inc. . . . . . . . . 134 9,739Stericycle, Inc. (a) . . . . . . . . . . . . 163 8,145Waste Management, Inc. . . . . . . 109 9,752 __________ 36,831 __________
Forest Products & Paper – 1.0%International Paper Co. . . . . . . . 545 24,721 __________
Hand/Machine Tools – 0.7%Snap-On, Inc. . . . . . . . . . . . . . . 54 8,313Stanley Black & Decker, Inc. . . . 68 7,923 __________ 16,236 __________
Home Builders – 1.1%DR Horton, Inc. . . . . . . . . . . . . 245 8,810Lennar Corp. – Class A . . . . . . . . 201 8,639PulteGroup, Inc. . . . . . . . . . . . . 390 9,582 __________ 27,031 __________
Home Furnishings – 0.7%Leggett & Platt, Inc. . . . . . . . . . 227 8,242Whirlpool Corp. . . . . . . . . . . . . 85 9,330 __________ 17,572 __________
Household Products/Wares – 1.0%Avery Dennison Corp. . . . . . . . . 266 24,132 __________
Housewares – 0.3%Newell Brands, Inc. . . . . . . . . . . 485 7,702 __________
Internet – 2.6%Amazon.com, Inc. (a) . . . . . . . . . 5 7,990Booking Holdings, Inc. (a) . . . . . 5 9,373eBay, Inc. (a) . . . . . . . . . . . . . . . . 309 8,970Expedia Group, Inc. . . . . . . . . . . 81 10,160F5 Networks, Inc. (a) . . . . . . . . . 54 9,465Symantec Corp. . . . . . . . . . . . . . 525 9,529VeriSign, Inc. (a) . . . . . . . . . . . . . 64 9,123 __________ 64,610 __________
Iron/Steel – 1.1%Nucor Corp. . . . . . . . . . . . . . . . 464 27,432 __________
Leisure Time – 1.4%Carnival Corp. . . . . . . . . . . . . . . 165 9,247Harley-Davidson, Inc. . . . . . . . . 238 9,096Norwegian Cruise Line Holdings Ltd. (a) . . . . . . . . . . . 190 8,373
Royal Caribbean Cruises Ltd. . . . 81 8,483 __________ 35,199 __________
Pacer CFRA-Stovall Equal Weight Seasonal Rotation ETFSCHEDULE OF INVESTMENTSOctober 31, 2018 (Unaudited) (Continued)
The accompanying notes are an integral part of these financial statements.
49

Shares Value ______ _____
COMMON STOCKS – 99.8% (Continued)
Lodging – 1.5%Hilton Worldwide Holdings, Inc. . . . . . . . . . . . . . 132 $ 9,394
Marriott International, Inc. – Class A . . . . . . . . . . . . . . 81 9,468
MGM Resorts International . . . . 381 10,165Wynn Resorts Ltd. . . . . . . . . . . . 78 7,847 __________ 36,874 __________
Machinery-Construction & Mining – 0.3%
Caterpillar, Inc. . . . . . . . . . . . . . 70 8,492 __________
Machinery-Diversified – 2.5%Cummins, Inc. . . . . . . . . . . . . . . 70 9,568Deere & Co. . . . . . . . . . . . . . . . 68 9,210Dover Corp. . . . . . . . . . . . . . . . . 114 9,444Flowserve Corp. . . . . . . . . . . . . . 181 8,308Rockwell Automation, Inc. . . . . . 53 8,730Roper Technologies, Inc. . . . . . . 32 9,053Xylem, Inc. . . . . . . . . . . . . . . . . 124 8,132 __________ 62,445 __________
Mining – 2.2%Freeport-McMoRan, Inc. . . . . . . 2,120 24,698Newmont Mining Corp. . . . . . . 955 29,529 __________ 54,227 __________
Miscellaneous Manufacturing – 2.7%3M Co. . . . . . . . . . . . . . . . . . . . 48 9,133AO Smith Corp. . . . . . . . . . . . . 170 7,740Eaton Corp. PLC . . . . . . . . . . . . 116 8,314General Electric Co. . . . . . . . . . . 794 8,019Illinois Tool Works, Inc. . . . . . . . 70 8,930Ingersoll-Rand PLC . . . . . . . . . . 97 9,306Parker-Hannifin Corp. . . . . . . . . 54 8,188Textron, Inc. . . . . . . . . . . . . . . . 143 7,669 __________ 67,299 __________
Office/Business Equipment – 0.4%Xerox Corp. . . . . . . . . . . . . . . . . 375 10,451 __________
Packaging & Containers – 3.8%Ball Corp. . . . . . . . . . . . . . . . . . 657 29,434Packaging Corp. of America . . . . 254 23,320Sealed Air Corp. . . . . . . . . . . . . . 667 21,584WestRock Co. . . . . . . . . . . . . . . 497 21,356 __________ 95,694 __________
Retail – 11.4%Advance Auto Parts, Inc. . . . . . . 64 10,225AutoZone, Inc. (a) . . . . . . . . . . . 14 10,269
Shares Value ______ _____
Retail – 11.4% (Continued)Best Buy Co., Inc. . . . . . . . . . . . 134 $ 9,401CarMax, Inc. (a) . . . . . . . . . . . . . 131 8,896Chipotle Mexican Grill, Inc. (a) . . . . . . . . . . . . . . . 21 9,667
Darden Restaurants, Inc. . . . . . . 88 9,376Dollar General Corp. . . . . . . . . . 97 10,804Dollar Tree, Inc. (a) . . . . . . . . . . . 125 10,537Foot Locker, Inc. . . . . . . . . . . . . 226 10,654Gap, Inc. . . . . . . . . . . . . . . . . . . 379 10,347Genuine Parts Co. . . . . . . . . . . . 103 10,086Home Depot, Inc. . . . . . . . . . . . 50 8,794Kohl’s Corp. . . . . . . . . . . . . . . . . 130 9,845L Brands, Inc. . . . . . . . . . . . . . . 364 11,801Lowe’s Cos., Inc. . . . . . . . . . . . . 92 8,760Macy’s, Inc. . . . . . . . . . . . . . . . . 290 9,944McDonald’s Corp. . . . . . . . . . . . 65 11,498Nordstrom, Inc. . . . . . . . . . . . . . 161 10,589O’Reilly Automotive, Inc. (a) . . . 31 9,943Ross Stores, Inc. . . . . . . . . . . . . . 109 10,791Starbucks Corp. . . . . . . . . . . . . . 192 11,188Tapestry, Inc. . . . . . . . . . . . . . . . 211 8,927Target Corp. . . . . . . . . . . . . . . . . 120 10,036Tiffany & Co. . . . . . . . . . . . . . . 82 9,127TJX Cos., Inc. . . . . . . . . . . . . . . 97 10,658Tractor Supply Co. . . . . . . . . . . . 121 11,119Ulta Salon Cosmetics & Fragrance, Inc. (a) . . . . . . . . . 38 10,432
Yum! Brands, Inc. . . . . . . . . . . . . 120 10,849 __________ 284,563 __________
Semiconductors – 5.9%Advanced Micro Devices, Inc. (a) . . . . . . . . . . . . 321 5,845
Analog Devices, Inc. . . . . . . . . . . 114 9,543Applied Materials, Inc. . . . . . . . . 269 8,845Broadcom, Inc. . . . . . . . . . . . . . 44 9,834Intel Corp. . . . . . . . . . . . . . . . . . 231 10,829IPG Photonics Corp. (a) . . . . . . . 66 8,814KLA-Tencor Corp. . . . . . . . . . . . 101 9,246Lam Research Corp. . . . . . . . . . . 69 9,779Microchip Technology, Inc. . . . . 126 8,288Micron Technology, Inc. (a) . . . . 237 8,940NVIDIA Corp. . . . . . . . . . . . . . 38 8,012Qorvo, Inc. (a) . . . . . . . . . . . . . . 139 10,218QUALCOMM, Inc. . . . . . . . . . 140 8,805Skyworks Solutions, Inc. . . . . . . 120 10,411Texas Instruments, Inc. . . . . . . . 100 9,283Xilinx, Inc. . . . . . . . . . . . . . . . . . 136 11,610 __________ 148,302 __________
Pacer CFRA-Stovall Equal Weight Seasonal Rotation ETFSCHEDULE OF INVESTMENTSOctober 31, 2018 (Unaudited) (Continued)
The accompanying notes are an integral part of these financial statements.
50

Shares Value ______ _____
COMMON STOCKS – 99.8% (Continued)
Shipbuilding – 0.4%Huntington Ingalls Industries, Inc. . . . . . . . . . . . . . 40 $ 8,739 __________
Software – 6.6%Adobe Systems, Inc. (a) . . . . . . . . 38 9,339Akamai Technologies, Inc. (a) . . . 139 10,043ANSYS, Inc. (a) . . . . . . . . . . . . . 55 8,225Autodesk, Inc. (a) . . . . . . . . . . . . 69 8,918Broadridge Financial Solutions, Inc. . . . . . . . . . . . . . 76 8,888
CA, Inc. . . . . . . . . . . . . . . . . . . . 239 10,602Cadence Design System, Inc. (a) . . . . . . . . . . . . . 227 10,117
Citrix Systems, Inc. (a) . . . . . . . . 94 9,632Fidelity National Information Services, Inc. . . . . 95 9,890
Fiserv, Inc. (a) . . . . . . . . . . . . . . . 129 10,230Intuit, Inc. . . . . . . . . . . . . . . . . . 46 9,706Microsoft Corp. . . . . . . . . . . . . . 93 9,933Oracle Corp. . . . . . . . . . . . . . . . 214 10,452Paychex, Inc. . . . . . . . . . . . . . . . 141 9,234Red Hat, Inc. (a) . . . . . . . . . . . . . 71 12,186Salesforce.com, Inc. (a) . . . . . . . . 67 9,195Synopsys, Inc. (a) . . . . . . . . . . . . 102 9,132 __________ 165,722 __________
Telecommunications – 1.6%Arista Networks, Inc. (a) . . . . . . . 39 8,984Cisco Systems, Inc. . . . . . . . . . . . 222 10,156Juniper Networks, Inc. . . . . . . . . 377 11,035Motorola Solutions, Inc. . . . . . . 83 10,172 __________ 40,347 __________
Textiles – 0.3%Mohawk Industries, Inc. (a) . . . . 56 6,985 __________
Toys/Games/Hobbies – 0.7%Hasbro, Inc. . . . . . . . . . . . . . . . . 100 9,171Mattel, Inc. (a) . . . . . . . . . . . . . . 644 8,746 __________ 17,917 __________
Transportation – 3.3%CH Robinson Worldwide, Inc. . . . . . . . . . . . . 101 8,992
CSX Corp. . . . . . . . . . . . . . . . . . 137 9,434Expeditors International of Washington, Inc. . . . . . . . . . 134 9,002
FedEx Corp. . . . . . . . . . . . . . . . . 39 8,593JB Hunt Transport Services, Inc. . . . . . . . . . . . . . . 81 8,959
Kansas City Southern . . . . . . . . . 86 8,769
Shares Value ______ _____
Transportation – 3.3% (Continued)Norfolk Southern Corp. . . . . . . . 56 $ 9,399Union Pacific Corp. . . . . . . . . . . 64 9,358United Parcel Service, Inc. – Class B . . . . . . . . . . . . . . 84 8,949 __________ 81,455 __________TOTAL COMMON STOCKS (Cost $2,498,961) . . . . . . . . . . . 2,498,108 __________
SHORT-TERM INVESTMENTS – 1.0%
Money Market Funds – 1.0%U.S. Bank Money Market Deposit Account, 2.00% (b) . . . 26,131 26,131 __________
TOTAL SHORT-TERM INVESTMENTS (Cost $26,131) . . . . . . . . . . . . . 26,131 __________
Total Investments (Cost $2,525,092) – 100.8% . . . . . . . . . . . . . . . . . . . 2,524,239 __________
Liabilities in Excess of Other Assets – (0.8)% . . . . . (19,630) __________
TOTAL NET ASSETS – 100.0% . . . . . . . . . . $2,504,609 __________ __________
(a) Non-income producing security. (b) The rate shown is as of October 31, 2018.
For Fund compliance purposes, the Fund’s industry classificationsrefer to any one or more of the industry sub-classifications used byone or more widely recognized market indexes or ratings groupindexes, and/or they may be defined by Fund management. Thisdefinition does not apply for all purposes of this report, which maycombine sub-classifications for reporting ease. Categories are shownas a percentage of net assets.
Pacer CFRA-Stovall Equal Weight Seasonal Rotation ETFSCHEDULE OF INVESTMENTSOctober 31, 2018 (Unaudited) (Continued)
The accompanying notes are an integral part of these financial statements.
51

Pacer Pacer Pacer Pacer Trendpilot® Trendpilot® Pacer Trendpilot® Global US Large US Mid Trendpilot® European Cash Cows Cap ETF Cap ETF 100 ETF Index ETF Dividend ETF __________ __________ __________ __________ ____________ASSETSInvestments in Securities, at Value*^ . . . . . . . . . . . . $ 27,801,290 $ 823,002,532 $ 181,432,926 $ 206,635,842 $ 227,114,105Cash . . . . . . . . . . . . . . . . . . . . . . . . . . . . . . . . . . . . . 7,992 51,364 — — —Foreign Currency at Value* . . . . . . . . . . . . . . . . . . . . — — — — 622Interest and Dividends Receivable . . . . . . . . . . . . . . 1,102,451 236,325 46,896 319,668 667,673Receivable for Investment Securities Sold . . . . . . . . . 1,318,723,615 — 186,885,116 674 —Receivable for Fund Shares Sold . . . . . . . . . . . . . . . . 2,897,280 3,102,250 24,163,350 — —Securities Lending Income Receivable . . . . . . . . . . . 7,987 15,701 2,801 1,982 22,054 ______________ ______________ ______________ ______________ ______________ Total Assets . . . . . . . . . . . . . . . . . . . . . . . . . . . . . . 1,350,540,615 826,408,172 392,531,089 206,958,166 227,804,454 ______________ ______________ ______________ ______________ ______________
LIABILITIESManagement Fees Payable . . . . . . . . . . . . . . . . . . . . 667,431 322,538 178,758 90,182 98,766Payable for Fund Shares Redeemed . . . . . . . . . . . . . . — — 24,720,900 — —Payable for Investment Securities Purchased . . . . . . . 2,895,882 1,602,282 24,191,136 — —Collateral Received for Securities Loaned (See Note 5) . . . . . . . . . . . . . . . . 26,157,581 190,038,750 18,804,517 47,763,750 38,789,497 ______________ ______________ ______________ ______________ ______________ Total Liabilities . . . . . . . . . . . . . . . . . . . . . . . . . . . 29,720,894 191,963,570 67,895,311 47,853,932 38,888,263 ______________ ______________ ______________ ______________ ______________NET ASSETS . . . . . . . . . . . . . . . . . . . . . . . . . . . . . $ 1,320,819,721 $ 634,444,602 $ 324,635,778 $ 159,104,234 $ 188,916,191 ______________ ______________ ______________ ______________ ______________ ______________ ______________ ______________ ______________ ______________
NET ASSETS CONSIST OF:Paid-in Capital . . . . . . . . . . . . . . . . . . . . . . . . . . . . . $ 1,247,278,777 $ 613,200,274 $ 297,630,300 $ 192,097,603 $ 199,674,983Total Distributable Earnings/(Accumulated Deficit) . . . . . . . . . . . . . . . . . . . . . . 73,540,944 21,244,328 27,005,478 (32,993,369) (10,758,792) ______________ ______________ ______________ ______________ ______________ Net Assets . . . . . . . . . . . . . . . . . . . . . . . . . . . . . . . $ 1,320,819,721 $ 634,444,602 $ 324,635,778 $ 159,104,234 $ 188,916,191 ______________ ______________ ______________ ______________ ______________ ______________ ______________ ______________ ______________ ______________* Identified Cost: Investments in Securities . . . . . . . . . . . . . . . . . . . $ 27,801,290 $ 823,017,143 $ 147,958,258 $ 206,652,187 $ 237,718,454 Foreign Currencies . . . . . . . . . . . . . . . . . . . . . . . . — — — — 632^ Includes Loaned securities with a value of
(See Note 5) . . . . . . . . . . . . . . . . . . . . . . . . . . . . . 25,727,957 186,104,270 18,632,761 46,796,960 37,877,878 ______________ ______________ ______________ ______________ ______________
Net Asset Value (unlimited shares authorized):Net Assets . . . . . . . . . . . . . . . . . . . . . . . . . . . . . . . . . $ 1,320,819,721 $ 634,444,602 $ 324,635,778 $ 159,104,234 $ 188,916,191Shares Outstanding (No Par Value) . . . . . . . . . . . . . 45,600,000 20,450,000 9,850,000 6,250,000 6,450,000 ______________ ______________ ______________ ______________ ______________Net Asset Value, Offering and Redemption Price per Share . . . . . . . . . . . . . . . . . . $ 28.97 $ 31.02 $ 32.96 $ 25.46 $ 29.29 ______________ ______________ ______________ ______________ ______________
Pacer FundsSTATEMENTS OF ASSETS & LIABILITIES October 31, 2018 (Unaudited)
The accompanying notes are an integral part of these financial statements.
52

Pacer Pacer Developed Pacer US Small Markets Pacer US Cap Cash International Pacer Military Times Cash Cows Cows Cash Cows WealthShield Best Employers 100 ETF 100 ETF 100 ETF ETF ETF __________ _________ ___________ ___________ _____________ASSETSInvestments in Securities, at Value*^ . . . . . . . . . . . . $ 190,696,558 $ 26,933,267 $ 29,759,359 $ 341,378 $ 2,611,307Cash . . . . . . . . . . . . . . . . . . . . . . . . . . . . . . . . . . . . . 341 — — 650 —Foreign Currency at Value* . . . . . . . . . . . . . . . . . . . . — — 120 — —Interest and Dividends Receivable . . . . . . . . . . . . . . 138,270 1,627 116,813 50,937 1,406Receivable for Investment Securities Sold . . . . . . . . . — — — 92,600,347 47,124Receivable for Fund Shares Sold . . . . . . . . . . . . . . . . 4,220,935 — — — —Securities Lending Income Receivable . . . . . . . . . . . 1,528 1,948 2,121 — — ______________ ______________ ______________ ______________ ______________ Total Assets . . . . . . . . . . . . . . . . . . . . . . . . . . . . . . 195,057,632 26,936,842 29,878,413 92,993,312 2,659,837 ______________ ______________ ______________ ______________ ______________
LIABILITIESPayable for Investment Securities Purchased . . . . . . . 4,215,214 — — 639 47,022Management Fees Payable . . . . . . . . . . . . . . . . . . . . 66,304 12,217 15,867 48,359 742Collateral Received for Securities Loaned (See Note 5) . . . . . . . . . . . . . . . . 18,809,270 2,135,082 1,945,516 — — ______________ ______________ ______________ ______________ ______________ Total Liabilities . . . . . . . . . . . . . . . . . . . . . . . . . . . 23,090,788 2,147,299 1,961,383 48,998 47,764 ______________ ______________ ______________ ______________ ______________NET ASSETS . . . . . . . . . . . . . . . . . . . . . . . . . . . . . $ 171,966,844 $ 24,789,543 $ 27,917,030 $ 92,944,314 $ 2,612,073 ______________ ______________ ______________ ______________ ______________ ______________ ______________ ______________ ______________ ______________
NET ASSETS CONSIST OF:Paid-in Capital . . . . . . . . . . . . . . . . . . . . . . . . . . . . . $ 182,657,096 $ 27,026,808 $ 31,299,707 $ 100,504,873 $ 2,383,855Total Distributable Earnings/ (Accumulated Deficit) . . . . . . . . . . . . . . . . . . . . . . (10,690,252) (2,237,265) (3,382,677) (7,560,559) 228,218 ______________ ______________ ______________ ______________ ______________ Net Assets . . . . . . . . . . . . . . . . . . . . . . . . . . . . . . . $ 171,966,844 $ 24,789,543 $ 27,917,030 $ 92,944,314 $ 2,612,073 ______________ ______________ ______________ ______________ ______________ ______________ ______________ ______________ ______________ ______________* Identified Cost: Investments in Securities . . . . . . . . . . . . . . . . . . . $ 202,479,548 $ 29,566,444 $ 32,960,296 $ 341,378 $ 2,565,762 Foreign Currencies . . . . . . . . . . . . . . . . . . . . . . . . — — 121 — —^ Includes loaned securities with a value of . . . . . . . . 18,411,529 2,034,334 1,941,188 — — ______________ ______________ ______________ ______________ ______________
Net Asset Value (unlimited shares authorized):Net Assets . . . . . . . . . . . . . . . . . . . . . . . . . . . . . . . . . $ 171,966,844 $ 24,789,543 $ 27,917,030 $ 92,944,314 $ 2,612,073Shares Outstanding (No Par Value) . . . . . . . . . . . . . 6,100,000 950,000 1,100,000 3,850,000 100,000 ______________ ______________ ______________ ______________ ______________Net Asset Value, Offering and Redemption Price per Share . . . . . . . . . . . . . . . . . . $ 28.19 $ 26.09 $ 25.38 $ 24.14 $ 26.12 ______________ ______________ ______________ ______________ ______________
Pacer FundsSTATEMENTS OF ASSETS & LIABILITIES October 31, 2018 (Unaudited)
The accompanying notes are an integral part of these financial statements.
53

Pacer Benchmark Pacer Pacer Pacer Data & CFRA-Stovall Benchmark Benchmark Infrastructure Pacer Equal Weight Retail Real Industrial Real Real Estate US Export Seasonal Estate ETF Estate ETF ETF Leaders ETF Rotation ETF __________ _____________ ____________ ___________ ____________ASSETSInvestments in Securities, at Value*^ . . . . . . . . . . . . $ 2,680,611 $ 2,482,336 $ 4,840,051 $ 2,288,004 $ 2,524,239Cash . . . . . . . . . . . . . . . . . . . . . . . . . . . . . . . . . . . . . — — 22 — —Interest and Dividends Receivable . . . . . . . . . . . . . . 3,228 908 10,180 1,153 2,358Receivable for Investment Securities Sold . . . . . . . . . — — 13,624 — 3,719,255Receivable for Fund Shares Sold . . . . . . . . . . . . . . . . — — 1,214,160 — 1,255,180 ______________ ______________ ______________ ______________ ______________ Total Assets . . . . . . . . . . . . . . . . . . . . . . . . . . . . . . 2,683,839 2,483,244 6,078,037 2,289,157 7,501,032 ______________ ______________ ______________ ______________ ______________
LIABILITIESPayable for Investment Securities Purchased . . . . . . . — — 1,219,566 — 3,742,027Payable for Fund Shares Redeemed . . . . . . . . . . . . . . — — — — 1,253,100Management Fees Payable . . . . . . . . . . . . . . . . . . . . 1,340 1,252 1,738 1,206 1,296 ______________ ______________ ______________ ______________ ______________ Total Liabilities . . . . . . . . . . . . . . . . . . . . . . . . . . . 1,340 1,252 1,221,304 1,206 4,996,423 ______________ ______________ ______________ ______________ ______________NET ASSETS . . . . . . . . . . . . . . . . . . . . . . . . . . . . . $ 2,682,499 $ 2,481,992 $ 4,856,733 $ 2,287,951 $ 2,504,609 ______________ ______________ ______________ ______________ ______________ ______________ ______________ ______________ ______________ ______________
NET ASSETS CONSIST OF:Paid-in Capital . . . . . . . . . . . . . . . . . . . . . . . . . . . . . $ 2,461,340 $ 2,523,485 $ 4,971,745 $ 2,498,000 $ 2,503,080Total Distributable Earnings/ (Accumulated Deficit) . . . . . . . . . . . . . . . . . . . . . . 221,159 (41,493) (115,012) (210,049) 1,529 ______________ ______________ ______________ ______________ ______________ Net Assets . . . . . . . . . . . . . . . . . . . . . . . . . . . . . . . $ 2,682,499 $ 2,481,992 $ 4,856,733 $ 2,287,951 $ 2,504,609 ______________ ______________ ______________ ______________ ______________ ______________ ______________ ______________ ______________ ______________* Identified Cost: Investments in Securities . . . . . . . . . . . . . . . . . . . $ 2,678,366 $ 2,562,566 $ 5,095,096 $ 2,494,125 $ 2,525,092 ______________ ______________ ______________ ______________ ______________
Net Asset Value (unlimited shares authorized):Net Assets . . . . . . . . . . . . . . . . . . . . . . . . . . . . . . . . . $ 2,682,499 $ 2,481,992 $ 4,856,733 $ 2,287,951 $ 2,504,609Shares Outstanding (No Par Value) . . . . . . . . . . . . . 100,000 100,000 200,000 100,000 100,000Net Asset Value, Offering and Redemption Price per Share . . . . . . . . . . . . . . . . . . $ 26.82 $ 24.82 $ 24.28 $ 22.88 $ 25.05 ______________ ______________ ______________ ______________ ______________
Pacer FundsSTATEMENTS OF ASSETS & LIABILITIES October 31, 2018 (Unaudited)
The accompanying notes are an integral part of these financial statements.
54

Pacer Pacer Pacer Pacer Trendpilot® Trendpilot® Pacer Trendpilot® Global US Large US Mid Trendpilot® European Cash Cows Cap ETF Cap ETF 100 ETF Index ETF Dividend ETF __________ __________ __________ __________ ____________INVESTMENT INCOMEIncome: Dividends (net of fees and foreign withholding tax of $18, $1,841, $0, $467,653, and $189,139, respectively) . . . . . . . . . . . . . . . . . . . . $ 11,147,478 $ 4,707,253 $ 1,415,930 $ 2,697,551 $ 4,037,877 Interest . . . . . . . . . . . . . . . . . . . . . . . . . . . . . . . . . 18,926 387,489 2,761 434,661 3,599 Securities Lending Income . . . . . . . . . . . . . . . . . . 72,531 159,514 32,296 7,167 100,257 ______________ ______________ ______________ ______________ ______________ Total Investment Income . . . . . . . . . . . . . . . . . 11,238,935 5,254,256 1,450,987 3,139,379 4,141,733 ______________ ______________ ______________ ______________ ______________
Expenses: Management Fees . . . . . . . . . . . . . . . . . . . . . . . . . 3,496,032 1,785,596 935,833 567,522 575,272 ______________ ______________ ______________ ______________ ______________ Total Expenses . . . . . . . . . . . . . . . . . . . . . . . . . 3,496,032 1,785,596 935,833 567,522 575,272 ______________ ______________ ______________ ______________ ______________Net Investment Income . . . . . . . . . . . . . . . . . . . . . 7,742,903 3,468,660 515,154 2,571,857 3,566,461 ______________ ______________ ______________ ______________ ______________
REALIZED & UNREALIZED GAIN (LOSS) ON INVESTMENTS
Net Realized Gain (Loss) on: Investment Securities . . . . . . . . . . . . . . . . . . . . . . (100,484,152) (43,699,433) (10,280,595) (30,030,830) (2,559,825) In-Kind Redemptions . . . . . . . . . . . . . . . . . . . . . . 201,588,315 63,665,254 15,178,162 2,953 4,696,548 Foreign Currencies . . . . . . . . . . . . . . . . . . . . . . . . — — — (1,490,317) (86,585) ______________ ______________ ______________ ______________ ______________Total . . . . . . . . . . . . . . . . . . . . . . . . . . . . . . . . . . . . . 101,104,163 19,965,821 4,897,567 (31,518,194) 2,050,138 ______________ ______________ ______________ ______________ ______________Net Change in Unrealized Appreciation (Depreciation) of: Investments Securities . . . . . . . . . . . . . . . . . . . . . . (101,117,977) (25,657,540) 3,263,874 2,446,127 (11,376,485) Foreign Currencies . . . . . . . . . . . . . . . . . . . . . . . . — — — (7,203) (1,531) ______________ ______________ ______________ ______________ ______________Total . . . . . . . . . . . . . . . . . . . . . . . . . . . . . . . . . . . . . (101,117,977) (25,657,540) 3,263,874 2,438,924 (11,378,016) ______________ ______________ ______________ ______________ ______________Net Realized and Unrealized Gain on Investments . . . . . . . . . . . . . . . . . . . . . . . (13,814) (5,691,719) 8,161,441 (29,079,270) (9,327,878) ______________ ______________ ______________ ______________ ______________
NET INCREASE (DECREASE) IN NET ASSETS RESULTING FROM OPERATIONS . . . . . . . . . $ 7,729,089 $ (2,223,059) $ 8,676,595 $ (26,507,413) $ (5,761,417) ______________ ______________ ______________ ______________ ______________ ______________ ______________ ______________ ______________ ______________
Pacer FundsSTATEMENTS OF OPERATIONSFor the Period Ended October 31, 2018 (Unaudited)
The accompanying notes are an integral part of these financial statements.
55
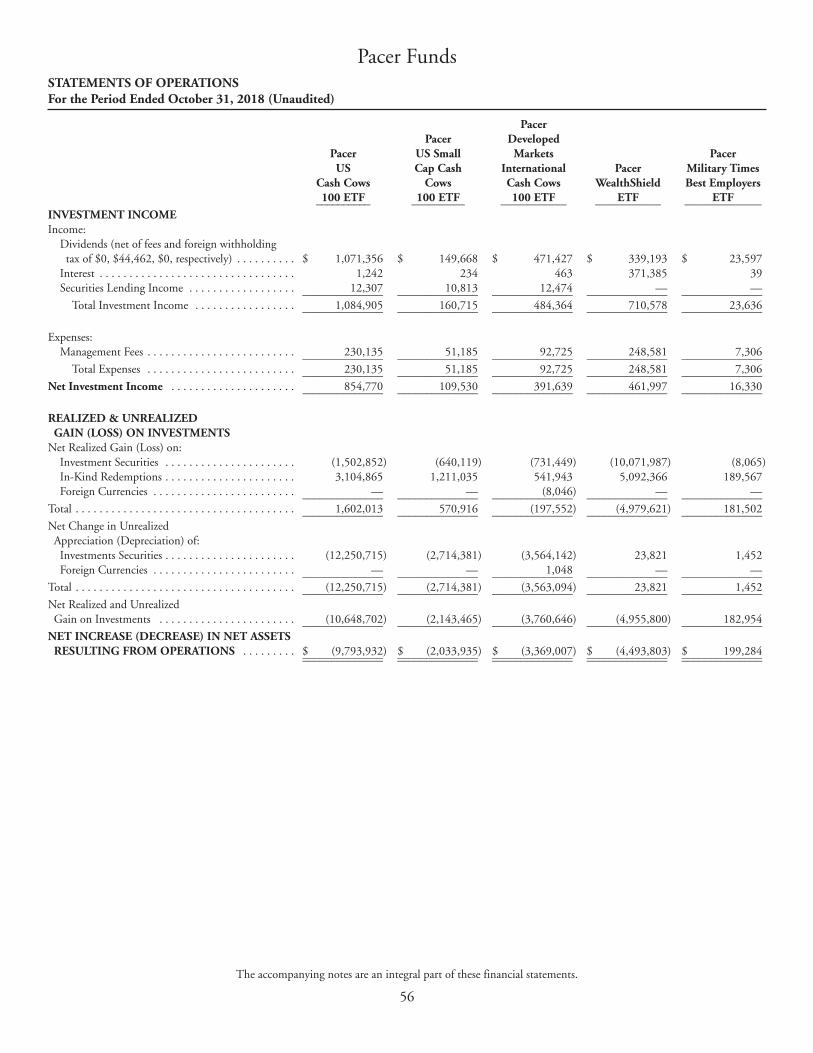
Pacer Pacer Developed Pacer US Small Markets Pacer US Cap Cash International Pacer Military Times Cash Cows Cows Cash Cows WealthShield Best Employers 100 ETF 100 ETF 100 ETF ETF ETF __________ _________ ___________ ___________ _____________INVESTMENT INCOMEIncome: Dividends (net of fees and foreign withholding tax of $0, $44,462, $0, respectively) . . . . . . . . . . $ 1,071,356 $ 149,668 $ 471,427 $ 339,193 $ 23,597 Interest . . . . . . . . . . . . . . . . . . . . . . . . . . . . . . . . . 1,242 234 463 371,385 39 Securities Lending Income . . . . . . . . . . . . . . . . . . 12,307 10,813 12,474 — — ______________ ______________ ______________ ______________ ______________ Total Investment Income . . . . . . . . . . . . . . . . . 1,084,905 160,715 484,364 710,578 23,636 ______________ ______________ ______________ ______________ ______________
Expenses: Management Fees . . . . . . . . . . . . . . . . . . . . . . . . . 230,135 51,185 92,725 248,581 7,306 ______________ ______________ ______________ ______________ ______________ Total Expenses . . . . . . . . . . . . . . . . . . . . . . . . . 230,135 51,185 92,725 248,581 7,306 ______________ ______________ ______________ ______________ ______________Net Investment Income . . . . . . . . . . . . . . . . . . . . . 854,770 109,530 391,639 461,997 16,330 ______________ ______________ ______________ ______________ ______________
REALIZED & UNREALIZED GAIN (LOSS) ON INVESTMENTS
Net Realized Gain (Loss) on: Investment Securities . . . . . . . . . . . . . . . . . . . . . . (1,502,852) (640,119) (731,449) (10,071,987) (8,065) In-Kind Redemptions . . . . . . . . . . . . . . . . . . . . . . 3,104,865 1,211,035 541,943 5,092,366 189,567 Foreign Currencies . . . . . . . . . . . . . . . . . . . . . . . . — — (8,046) — — ______________ ______________ ______________ ______________ ______________Total . . . . . . . . . . . . . . . . . . . . . . . . . . . . . . . . . . . . . 1,602,013 570,916 (197,552) (4,979,621) 181,502 ______________ ______________ ______________ ______________ ______________Net Change in Unrealized Appreciation (Depreciation) of: Investments Securities . . . . . . . . . . . . . . . . . . . . . . (12,250,715) (2,714,381) (3,564,142) 23,821 1,452 Foreign Currencies . . . . . . . . . . . . . . . . . . . . . . . . — — 1,048 — — ______________ ______________ ______________ ______________ ______________Total . . . . . . . . . . . . . . . . . . . . . . . . . . . . . . . . . . . . . (12,250,715) (2,714,381) (3,563,094) 23,821 1,452 ______________ ______________ ______________ ______________ ______________Net Realized and Unrealized Gain on Investments . . . . . . . . . . . . . . . . . . . . . . . (10,648,702) (2,143,465) (3,760,646) (4,955,800) 182,954 ______________ ______________ ______________ ______________ ______________
NET INCREASE (DECREASE) IN NET ASSETS RESULTING FROM OPERATIONS . . . . . . . . . $ (9,793,932) $ (2,033,935) $ (3,369,007) $ (4,493,803) $ 199,284 ______________ ______________ ______________ ______________ ______________ ______________ ______________ ______________ ______________ ______________
Pacer FundsSTATEMENTS OF OPERATIONSFor the Period Ended October 31, 2018 (Unaudited)
The accompanying notes are an integral part of these financial statements.
56
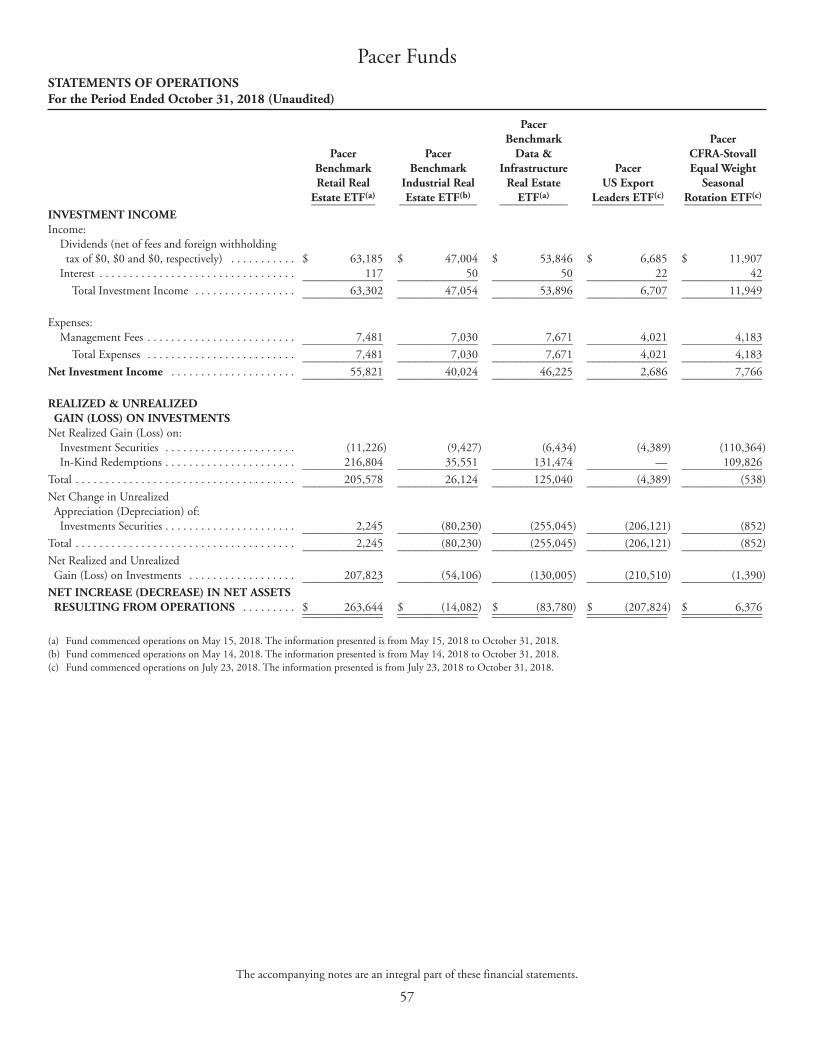
Pacer Benchmark Pacer Pacer Pacer Data & CFRA-Stovall Benchmark Benchmark Infrastructure Pacer Equal Weight Retail Real Industrial Real Real Estate US Export Seasonal Estate ETF(a) Estate ETF(b) ETF(a) Leaders ETF(c) Rotation ETF(c) ___________ _____________ ____________ ____________ _____________INVESTMENT INCOMEIncome: Dividends (net of fees and foreign withholding tax of $0, $0 and $0, respectively) . . . . . . . . . . . $ 63,185 $ 47,004 $ 53,846 $ 6,685 $ 11,907 Interest . . . . . . . . . . . . . . . . . . . . . . . . . . . . . . . . . 117 50 50 22 42 ______________ ______________ ______________ ______________ ______________ Total Investment Income . . . . . . . . . . . . . . . . . 63,302 47,054 53,896 6,707 11,949 ______________ ______________ ______________ ______________ ______________
Expenses: Management Fees . . . . . . . . . . . . . . . . . . . . . . . . . 7,481 7,030 7,671 4,021 4,183 ______________ ______________ ______________ ______________ ______________ Total Expenses . . . . . . . . . . . . . . . . . . . . . . . . . 7,481 7,030 7,671 4,021 4,183 ______________ ______________ ______________ ______________ ______________Net Investment Income . . . . . . . . . . . . . . . . . . . . . 55,821 40,024 46,225 2,686 7,766 ______________ ______________ ______________ ______________ ______________
REALIZED & UNREALIZED GAIN (LOSS) ON INVESTMENTS
Net Realized Gain (Loss) on: Investment Securities . . . . . . . . . . . . . . . . . . . . . . (11,226) (9,427) (6,434) (4,389) (110,364) In-Kind Redemptions . . . . . . . . . . . . . . . . . . . . . . 216,804 35,551 131,474 — 109,826 ______________ ______________ ______________ ______________ ______________Total . . . . . . . . . . . . . . . . . . . . . . . . . . . . . . . . . . . . . 205,578 26,124 125,040 (4,389) (538) ______________ ______________ ______________ ______________ ______________Net Change in Unrealized Appreciation (Depreciation) of: Investments Securities . . . . . . . . . . . . . . . . . . . . . . 2,245 (80,230) (255,045) (206,121) (852) ______________ ______________ ______________ ______________ ______________Total . . . . . . . . . . . . . . . . . . . . . . . . . . . . . . . . . . . . . 2,245 (80,230) (255,045) (206,121) (852) ______________ ______________ ______________ ______________ ______________Net Realized and Unrealized Gain (Loss) on Investments . . . . . . . . . . . . . . . . . . 207,823 (54,106) (130,005) (210,510) (1,390) ______________ ______________ ______________ ______________ ______________
NET INCREASE (DECREASE) IN NET ASSETSRESULTING FROM OPERATIONS . . . . . . . . . $ 263,644 $ (14,082) $ (83,780) $ (207,824) $ 6,376 ______________ ______________ ______________ ______________ ______________ ______________ ______________ ______________ ______________ ______________
(a) Fund commenced operations on May 15, 2018. The information presented is from May 15, 2018 to October 31, 2018.(b) Fund commenced operations on May 14, 2018. The information presented is from May 14, 2018 to October 31, 2018.(c) Fund commenced operations on July 23, 2018. The information presented is from July 23, 2018 to October 31, 2018.
Pacer FundsSTATEMENTS OF OPERATIONSFor the Period Ended October 31, 2018 (Unaudited)
The accompanying notes are an integral part of these financial statements.
57

Pacer Trendpilot® Pacer Trendpilot®
US Large Cap ETF US Mid Cap ETF ___________________________ ___________________________ For the For the Period Ended For the Period Ended For the October 31, Year Ended October 31, Year Ended 2018 April 30, 2018 April 30, (Unaudited) 2018 (Unaudited) 2018 ___________ __________ ___________ __________OPERATIONS Net Investment Income . . . . . . . . . . . . . . . . . . . . . . . . . . . . . . . . . . $ 7,742,903 $ 8,578,628 $ 3,468,660 $ 3,464,938 Net Realized Gain on Investments . . . . . . . . . . . . . . . . . . . . . . . . . . 101,104,163 9,083,487 19,965,821 33,031,547 Change in Unrealized Appreciation of Investments . . . . . . . . . . . . . . (101,117,977) 45,094,752 (25,657,540) (2,103,852) _____________ ___________ ___________ ___________ Net Increase in Net Assets Resulting from Operations . . . . . . . . . 7,729,089 62,756,867 (2,223,059) 34,392,633 _____________ ___________ ___________ ___________
DISTRIBUTIONS TO SHAREHOLDERS Dividends and Distributions(a) . . . . . . . . . . . . . . . . . . . . . . . . . . . . . — (7,017,355) — (2,882,696) _____________ ___________ ___________ ___________ Total Distributions to Shareholders . . . . . . . . . . . . . . . . . . . . . . . . — (7,017,355) — (2,882,696) _____________ ___________ ___________ ___________
CAPITAL SHARE TRANSACTIONS Proceeds from Shares Sold . . . . . . . . . . . . . . . . . . . . . . . . . . . . . . . . . 637,384,525 433,608,925 362,547,990 278,026,940 Payments for Shares Redeemed . . . . . . . . . . . . . . . . . . . . . . . . . . . . . (246,268,800) (23,553,530) (223,470,590) (93,376,700) _____________ ___________ ___________ ___________ Net Increase in Net Assets Derived from Capital Share Transactions(b) . . . . . . . . . . . . . . . . . . . . . . . . 391,115,725 410,055,395 139,077,400 184,650,240 _____________ ___________ ___________ ___________Net Increase in Net Assets . . . . . . . . . . . . . . . . . . . . . . . . . . . . . . . . . . $ 398,844,814 $465,794,907 $136,854,341 $216,160,177 _____________ ___________ ___________ ___________ _____________ ___________ ___________ ___________
NET ASSETS Beginning of Period . . . . . . . . . . . . . . . . . . . . . . . . . . . . . . . . . . . . . $ 921,974,907 $456,180,000 $497,590,261 $281,430,084 _____________ ___________ ___________ ___________ End of Period . . . . . . . . . . . . . . . . . . . . . . . . . . . . . . . . . . . . . . . . . . $1,320,819,721 $921,974,907(c) $634,444,602 $497,590,261(c) _____________ ___________ ___________ ___________ _____________ ___________ ___________ ___________
(a) These amounts are comprised of only net investment income.(b)Summary of capital share transactions is as follows:
Shares Shares Shares Shares ______ ______ ______ ______ Subscriptions . . . . . . . . . . . . . . . . . . . . . . . . . . . . . . . . . . . . . . . . . . 21,650,000 15,400,000 11,350,000 9,250,000 Redemptions . . . . . . . . . . . . . . . . . . . . . . . . . . . . . . . . . . . . . . . . . . . (8,500,000) (850,000) (7,100,000) (3,100,000) _________ _________ _________ _________ Net Increase . . . . . . . . . . . . . . . . . . . . . . . . . . . . . . . . . . . . . . . . . . . 13,150,000 14,550,000 4,250,000 6,150,000 _________ _________ _________ _________ _________ _________ _________ _________
(c) Includes undistributed accumulated net investment income of $3,159,758 and $1,152,697, respectively.
Pacer FundsSTATEMENTS OF CHANGES IN NET ASSETS
The accompanying notes are an integral part of these financial statements.
58

Pacer Trendpilot®
Pacer Trendpilot® 100 ETF European Index ETF ___________________________ ___________________________ For the For the Period Ended For the Period Ended For the October 31, Year Ended October 31, Year Ended 2018 April 30, 2018 April 30, (Unaudited) 2018 (Unaudited) 2018 ___________ __________ ___________ __________OPERATIONS Net Investment Income . . . . . . . . . . . . . . . . . . . . . . . . . . . . . . . . . . $ 515,154 $ 493,443 $ 2,571,857 $ 1,341,548 Net Realized Gain (Loss) on Investments . . . . . . . . . . . . . . . . . . . . . 4,897,567 (156,453) (31,518,194) 4,836,398 Change in Unrealized Appreciation of Investments . . . . . . . . . . . . . . 3,263,874 17,873,120 2,438,924 (6,253,723) ___________ ___________ ___________ ___________ Net Increase in Net Assets Resulting from Operations . . . . . . . . . 8,676,595 18,210,110 (26,507,413) (75,777) ___________ ___________ ___________ ___________
DISTRIBUTIONS TO SHAREHOLDERS Dividends and Distributions(a) . . . . . . . . . . . . . . . . . . . . . . . . . . . . . — (466,293) — (538,237) ___________ ___________ ___________ ___________ Total Distributions to Shareholders . . . . . . . . . . . . . . . . . . . . . . . . — (466,293) — (538,237) ___________ ___________ ___________ ___________
CAPITAL SHARE TRANSACTIONS Proceeds from Shares Sold . . . . . . . . . . . . . . . . . . . . . . . . . . . . . . . . . 134,129,390 120,466,075 34,541,700 174,437,090 Payments for Shares Redeemed . . . . . . . . . . . . . . . . . . . . . . . . . . . . . (30,076,575) — (7,632,915) (46,201,745) Transaction Fees (See Note 1) . . . . . . . . . . . . . . . . . . . . . . . . . . . . . . — — 67 — ___________ ___________ ___________ ___________ Net Increase (Decrease) in Net Assets Derived from Capital Share Transactions(b) . . . . . . . . . . . . . . . . . . . . . . . . 104,052,815 120,466,075 26,908,852 128,235,345 ___________ ___________ ___________ ___________Net Increase in Net Assets . . . . . . . . . . . . . . . . . . . . . . . . . . . . . . . . . . $112,729,410 $138,209,892 $ 401,439 $127,621,331 ___________ ___________ ___________ ___________ ___________ ___________ ___________ ___________
NET ASSETS Beginning of Period . . . . . . . . . . . . . . . . . . . . . . . . . . . . . . . . . . . . . $211,906,368 $ 73,696,476 $158,702,795 $ 31,081,464 ___________ ___________ ___________ ___________ End of Period . . . . . . . . . . . . . . . . . . . . . . . . . . . . . . . . . . . . . . . . . . $324,635,778 $211,906,368(c) $159,104,234 $158,702,795(c) ___________ ___________ ___________ ___________ ___________ ___________ ___________ ___________
(a) These amounts are comprised of only net investment income.(b)Summary of capital share transactions is as follows:
Shares Shares Shares Shares ______ ______ ______ ______ Subscriptions . . . . . . . . . . . . . . . . . . . . . . . . . . . . . . . . . . . . . . . . . . 3,950,000 4,000,000 1,200,000 5,750,000 Redemptions . . . . . . . . . . . . . . . . . . . . . . . . . . . . . . . . . . . . . . . . . . . (900,000) — (300,000) (1,550,000) ________ ________ ________ _________ Net Increase (Decrease) . . . . . . . . . . . . . . . . . . . . . . . . . . . . . . . . . . . 3,050,000 4,000,000 900,000 4,200,000 ________ ________ ________ _________ ________ ________ ________ _________
(c) Includes undistributed accumulated net investment income of $99,202 and $827,950, respectively.
Pacer FundsSTATEMENTS OF CHANGES IN NET ASSETS
The accompanying notes are an integral part of these financial statements.
59

Pacer Global Cash Cows Dividend ETF Pacer US Cash Cows 100 ETF ___________________________ ___________________________ For the For the Period Ended For the Period Ended For the October 31, Year Ended October 31, Year Ended 2018 April 30, 2018 April 30, (Unaudited) 2018 (Unaudited) 2018 ___________ __________ ___________ __________OPERATIONS Net Investment Income . . . . . . . . . . . . . . . . . . . . . . . . . . . . . . . . . . $ 3,566,461 $ 4,087,911 $ 854,770 $ 349,496 Net Realized Gain on Investments . . . . . . . . . . . . . . . . . . . . . . . . . . 2,050,138 6,709,257 1,602,013 1,042,948 Change in Unrealized Appreciation of Investments . . . . . . . . . . . . . . (11,378,016) (1,913,304) (12,250,715) 328,507 ___________ ___________ ___________ __________ Net Increase in Net Assets Resulting from Operations . . . . . . . . . (5,761,417) 8,883,864 (9,793,932) 1,720,951 ___________ ___________ ___________ __________
DISTRIBUTIONS TO SHAREHOLDERS Dividends and Distributions(a) . . . . . . . . . . . . . . . . . . . . . . . . . . . . . (3,879,656) (3,669,616) (696,950) (319,520) ___________ ___________ ___________ __________ Total Distributions to Shareholders . . . . . . . . . . . . . . . . . . . . . . . . (3,879,656) (3,669,616) (696,950) (319,520) ___________ ___________ ___________ __________
CAPITAL SHARE TRANSACTIONS Proceeds from Shares Sold . . . . . . . . . . . . . . . . . . . . . . . . . . . . . . . . . 49,804,635 157,190,990 172,181,740 29,991,055 Payments for Shares Redeemed . . . . . . . . . . . . . . . . . . . . . . . . . . . . . (24,957,850) (58,760,010) (18,705,315) (14,169,800) Transaction Fees (Note 1) . . . . . . . . . . . . . . . . . . . . . . . . . . . . . . . . . 353 5,956 17 — ___________ ___________ ___________ __________ Net Increase in Net Assets Derived from Capital Share Transactions(b) . . . . . . . . . . . . . . . . . . . . . . . . 24,847,138 98,436,936 153,476,442 15,821,255 ___________ ___________ ___________ __________Net Increase in Net Assets . . . . . . . . . . . . . . . . . . . . . . . . . . . . . . . . . . $15,206,065 $103,651,184 $142,985,560 $17,222,686 ___________ ___________ ___________ __________ ___________ ___________ ___________ __________
NET ASSETS Beginning of Period . . . . . . . . . . . . . . . . . . . . . . . . . . . . . . . . . . . . . $173,710,126 $ 70,058,942 $ 28,981,284 $11,758,598 ___________ ___________ ___________ __________ End of Period . . . . . . . . . . . . . . . . . . . . . . . . . . . . . . . . . . . . . . . . . . $188,916,191 $173,710,126(c) $171,966,844 $28,981,284(c) ___________ ___________ ___________ __________ ___________ ___________ ___________ __________
(a) These amounts are comprised of only net investment income.(b) Summary of capital share transactions is as follows:
Shares Shares Shares Shares ______ ______ ______ ______ Subscriptions . . . . . . . . . . . . . . . . . . . . . . . . . . . . . . . . . . . . . . . . . . 1,600,000 5,150,000 5,700,000 1,050,000 Redemptions . . . . . . . . . . . . . . . . . . . . . . . . . . . . . . . . . . . . . . . . . . . (800,000) (1,950,000) (600,000) (500,000) ________ _________ ________ ________ Net Increase . . . . . . . . . . . . . . . . . . . . . . . . . . . . . . . . . . . . . . . . . . . 800,000 3,200,000 5,100,000 550,000 ________ _________ ________ ________ ________ _________ ________ ________
(c) Includes undistributed accumulated net investment income of $672,131 and $38,618, respectively.
Pacer FundsSTATEMENTS OF CHANGES IN NET ASSETS
The accompanying notes are an integral part of these financial statements.
60

Pacer US Small Cap Pacer Developed Markets Cash Cows 100 ETF International Cash Cows 100 ETF ___________________________ _____________________________ For the For the Period Ended For the Period Ended For the October 31, Period Ended October 31, Period Ended 2018 April 30, 2018 April 30, (Unaudited) 2018(a) (Unaudited) 2018(a) ___________ ___________ ___________ ___________OPERATIONS Net Investment Income . . . . . . . . . . . . . . . . . . . . . . . . . . . . . . . . . . $ 109,530 $ 36,151 $ 391,639 $ 131,487 Net Realized Gain on Investments . . . . . . . . . . . . . . . . . . . . . . . . . . 570,916 175,820 (197,552) 53,481 Change in Unrealized Appreciation (Depreciation) of Investments . . (2,714,381) 82,238 (3,563,094) 360,524 __________ _________ __________ __________ Net Increase in Net Assets Resulting from Operations . . . . . . . . . (2,033,935) 294,209 (3,369,007) 545,492 __________ _________ __________ __________
DISTRIBUTIONS TO SHAREHOLDERS Dividends and Distributions(b) . . . . . . . . . . . . . . . . . . . . . . . . . . . . . (90,512) (34,114) (374,484) (70,528) __________ _________ __________ __________ Total Distributions to Shareholders . . . . . . . . . . . . . . . . . . . . . . . . (90,512) (34,114) (374,484) (70,528) __________ _________ __________ __________
CAPITAL SHARE TRANSACTIONS Proceeds from Shares Sold . . . . . . . . . . . . . . . . . . . . . . . . . . . . . . . . . 27,554,925 8,898,460 15,678,420 21,155,825 Payments for Shares Redeemed . . . . . . . . . . . . . . . . . . . . . . . . . . . . . (5,874,080) (3,925,410) (4,254,830) (1,402,765) Transaction Fees (Note 1) . . . . . . . . . . . . . . . . . . . . . . . . . . . . . . . . . — — 2,285 6,622 __________ _________ __________ __________ Net Increase in Net Assets Derived from Capital Share Transactions(c) . . . . . . . . . . . . . . . . . . . . . . . . 21,680,845 4,973,050 11,425,875 19,759,682 __________ _________ __________ __________Net Increase in Net Assets . . . . . . . . . . . . . . . . . . . . . . . . . . . . . . . . . . $19,556,398 $5,233,145 $ 7,682,384 $20,234,646 __________ _________ __________ __________ __________ _________ __________ __________
NET ASSETS Beginning of Period . . . . . . . . . . . . . . . . . . . . . . . . . . . . . . . . . . . . . $ 5,233,145 $ — $20,234,646 $ — __________ _________ __________ __________ End of Period . . . . . . . . . . . . . . . . . . . . . . . . . . . . . . . . . . . . . . . . . . $24,789,543 $5,233,145(d) $27,917,030 $20,234,646(d) __________ _________ __________ __________ __________ _________ __________ __________
(a) Fund commenced operations on June 16, 2017. The information presented is from June 16, 2017 to April 30, 2018.(b) These amounts are comprised of only net investment income.(c) Summary of capital share transactions is as follows:
Shares Shares Shares Shares ______ ______ ______ ______ Subscriptions . . . . . . . . . . . . . . . . . . . . . . . . . . . . . . . . . . . . . . . . . . 950,000 350,000 550,000 750,000 Redemptions . . . . . . . . . . . . . . . . . . . . . . . . . . . . . . . . . . . . . . . . . . . (200,000) (150,000) (150,000) (50,000) _______ _______ _______ _______ Net Increase . . . . . . . . . . . . . . . . . . . . . . . . . . . . . . . . . . . . . . . . . . . 750,000 200,000 400,000 700,000 _______ _______ _______ _______ _______ _______ _______ _______
(d) Includes undistributed accumulated net investment income of $2,037 and $60,172, respectively.
Pacer FundsSTATEMENTS OF CHANGES IN NET ASSETS
The accompanying notes are an integral part of these financial statements.
61
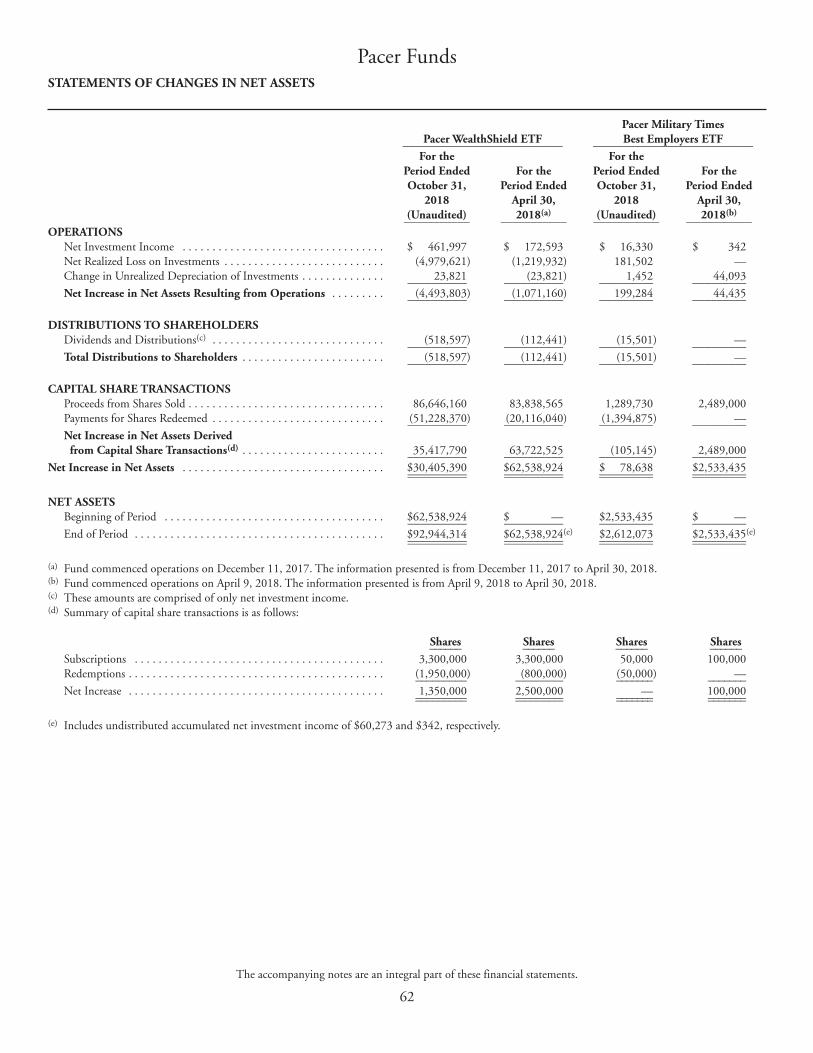
Pacer Military Times Pacer WealthShield ETF Best Employers ETF ___________________________ ___________________________ For the For the Period Ended For the Period Ended For the October 31, Period Ended October 31, Period Ended 2018 April 30, 2018 April 30, (Unaudited) 2018(a) (Unaudited) 2018(b) ___________ ___________ ___________ ___________OPERATIONS Net Investment Income . . . . . . . . . . . . . . . . . . . . . . . . . . . . . . . . . . $ 461,997 $ 172,593 $ 16,330 $ 342 Net Realized Loss on Investments . . . . . . . . . . . . . . . . . . . . . . . . . . . (4,979,621) (1,219,932) 181,502 — Change in Unrealized Depreciation of Investments . . . . . . . . . . . . . . 23,821 (23,821) 1,452 44,093 __________ __________ _________ _________ Net Increase in Net Assets Resulting from Operations . . . . . . . . . (4,493,803) (1,071,160) 199,284 44,435 __________ __________ _________ _________
DISTRIBUTIONS TO SHAREHOLDERS Dividends and Distributions(c) . . . . . . . . . . . . . . . . . . . . . . . . . . . . . (518,597) (112,441) (15,501) — __________ __________ _________ _________ Total Distributions to Shareholders . . . . . . . . . . . . . . . . . . . . . . . . (518,597) (112,441) (15,501) — __________ __________ _________ _________
CAPITAL SHARE TRANSACTIONS Proceeds from Shares Sold . . . . . . . . . . . . . . . . . . . . . . . . . . . . . . . . . 86,646,160 83,838,565 1,289,730 2,489,000 Payments for Shares Redeemed . . . . . . . . . . . . . . . . . . . . . . . . . . . . . (51,228,370) (20,116,040) (1,394,875) — __________ __________ _________ _________ Net Increase in Net Assets Derived from Capital Share Transactions(d) . . . . . . . . . . . . . . . . . . . . . . . . 35,417,790 63,722,525 (105,145) 2,489,000 __________ __________ _________ _________Net Increase in Net Assets . . . . . . . . . . . . . . . . . . . . . . . . . . . . . . . . . . $30,405,390 $62,538,924 $ 78,638 $2,533,435 __________ __________ _________ _________ __________ __________ _________ _________
NET ASSETS Beginning of Period . . . . . . . . . . . . . . . . . . . . . . . . . . . . . . . . . . . . . $62,538,924 $ — $2,533,435 $ — __________ __________ _________ _________ End of Period . . . . . . . . . . . . . . . . . . . . . . . . . . . . . . . . . . . . . . . . . . $92,944,314 $62,538,924(e) $2,612,073 $2,533,435(e) __________ __________ _________ _________ __________ __________ _________ _________
(a) Fund commenced operations on December 11, 2017. The information presented is from December 11, 2017 to April 30, 2018.(b) Fund commenced operations on April 9, 2018. The information presented is from April 9, 2018 to April 30, 2018.(c) These amounts are comprised of only net investment income.(d) Summary of capital share transactions is as follows:
Shares Shares Shares Shares ______ ______ ______ ______ Subscriptions . . . . . . . . . . . . . . . . . . . . . . . . . . . . . . . . . . . . . . . . . . 3,300,000 3,300,000 50,000 100,000 Redemptions . . . . . . . . . . . . . . . . . . . . . . . . . . . . . . . . . . . . . . . . . . . (1,950,000) (800,000) (50,000) — _________ ________ _______ _______ Net Increase . . . . . . . . . . . . . . . . . . . . . . . . . . . . . . . . . . . . . . . . . . . 1,350,000 2,500,000 — 100,000 _________ ________ _______ _______ _________ ________ _______ _______
(e) Includes undistributed accumulated net investment income of $60,273 and $342, respectively.
Pacer FundsSTATEMENTS OF CHANGES IN NET ASSETS
The accompanying notes are an integral part of these financial statements.
62

Pacer Benchmark Pacer Benchmark Retail Real Estate ETF Industrial Real Estate ETF ___________________ ______________________ For the For the Period Ended Period Ended October 31, October 31, 2018(a) 2018(b)
(Unaudited) (Unaudited) ___________ ___________OPERATIONS Net Investment Income . . . . . . . . . . . . . . . . . . . . . . . . . . . . . . . . . . . . . . . . . . . . . . . . $ 55,821 $ 40,024 Net Realized Loss on Investments . . . . . . . . . . . . . . . . . . . . . . . . . . . . . . . . . . . . . . . . 205,578 26,124 Change in Unrealized Appreciation of Investments . . . . . . . . . . . . . . . . . . . . . . . . . . . 2,245 (80,230) _________ __________ Net Increase in Net Assets Resulting from Operations . . . . . . . . . . . . . . . . . . . . . . 263,644 (14,082) _________ __________
DISTRIBUTIONS TO SHAREHOLDERS Dividends and Distributions . . . . . . . . . . . . . . . . . . . . . . . . . . . . . . . . . . . . . . . . . . . . (42,485) (27,411) _________ __________ Total Distributions to Shareholders . . . . . . . . . . . . . . . . . . . . . . . . . . . . . . . . . . . . . (42,485) (27,411) _________ __________
CAPITAL SHARE TRANSACTIONS Proceeds from Shares Sold . . . . . . . . . . . . . . . . . . . . . . . . . . . . . . . . . . . . . . . . . . . . . . 5,126,240 7,494,230 Payments for Shares Redeemed . . . . . . . . . . . . . . . . . . . . . . . . . . . . . . . . . . . . . . . . . . (2,664,900) (4,970,745) _________ __________ Net Increase in Net Assets Derived from Capital Share Transactions(c) . . . . . . . . . 2,461,340 2,523,485 _________ __________Net Increase in Net Assets . . . . . . . . . . . . . . . . . . . . . . . . . . . . . . . . . . . . . . . . . . . . . . . . $2,682,499 $ 2,481,992 _________ __________ _________ __________
NET ASSETS Beginning of Period . . . . . . . . . . . . . . . . . . . . . . . . . . . . . . . . . . . . . . . . . . . . . . . . . . . $ — $ — _________ __________ End of Period . . . . . . . . . . . . . . . . . . . . . . . . . . . . . . . . . . . . . . . . . . . . . . . . . . . . . . . $2,682,499 $ 2,481,992 _________ __________ _________ __________
(a) Fund commenced operations on May 15, 2018. The information presented is from May 15, 2018 to October 31, 2018.(b) Fund commenced operations on May 14, 2018. The information presented is from May 14, 2018 to October 31, 2018.(c) Summary of capital share transactions is as follows:
Shares Shares ______ ______ Subscriptions . . . . . . . . . . . . . . . . . . . . . . . . . . . . . . . . . . . . . . . . . . . . . . . . . . . . . . . . 200,000 300,000 Redemptions . . . . . . . . . . . . . . . . . . . . . . . . . . . . . . . . . . . . . . . . . . . . . . . . . . . . . . . . (100,000) (200,000) _______ _______ Net Increase . . . . . . . . . . . . . . . . . . . . . . . . . . . . . . . . . . . . . . . . . . . . . . . . . . . . . . . . 100,000 100,000 _______ _______ _______ _______
Pacer FundsSTATEMENTS OF CHANGES IN NET ASSETS
The accompanying notes are an integral part of these financial statements.
63
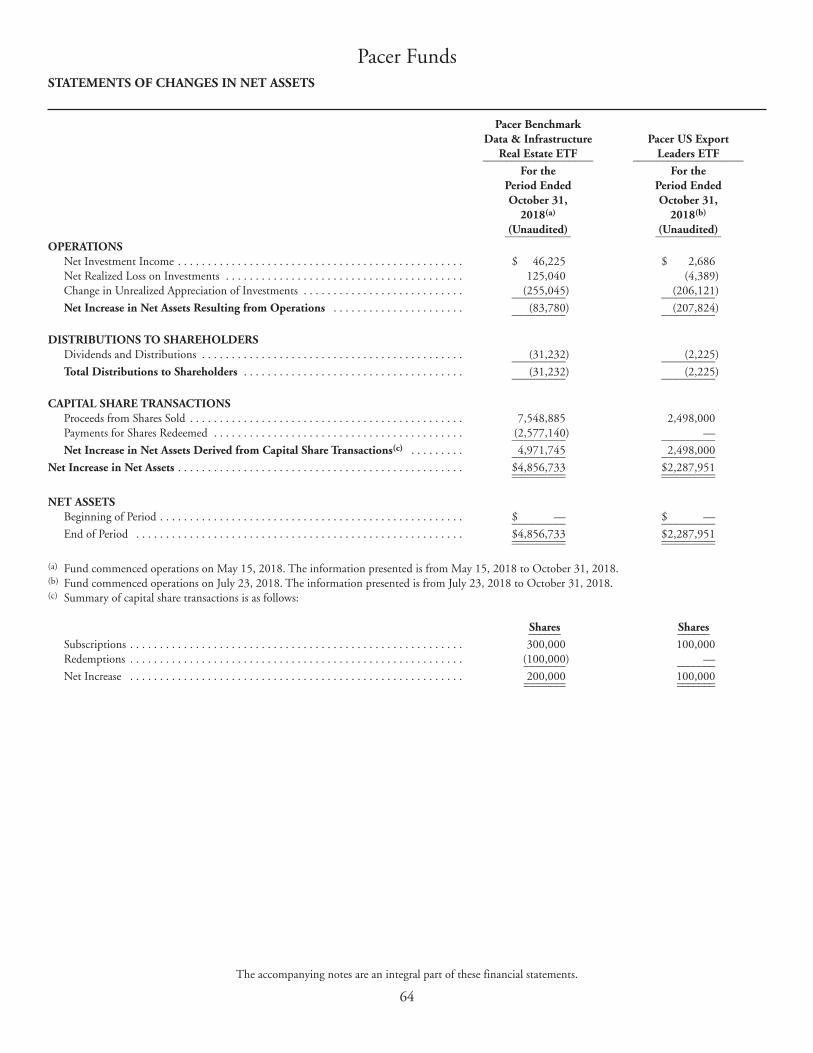
Pacer Benchmark Data & Infrastructure Pacer US Export Real Estate ETF Leaders ETF ___________________ ___________________ For the For the Period Ended Period Ended October 31, October 31, 2018(a) 2018(b)
(Unaudited) (Unaudited) ___________ ___________OPERATIONS Net Investment Income . . . . . . . . . . . . . . . . . . . . . . . . . . . . . . . . . . . . . . . . . . . . . . . . $ 46,225 $ 2,686 Net Realized Loss on Investments . . . . . . . . . . . . . . . . . . . . . . . . . . . . . . . . . . . . . . . . 125,040 (4,389) Change in Unrealized Appreciation of Investments . . . . . . . . . . . . . . . . . . . . . . . . . . . (255,045) (206,121) _________ _________ Net Increase in Net Assets Resulting from Operations . . . . . . . . . . . . . . . . . . . . . . (83,780) (207,824) _________ _________
DISTRIBUTIONS TO SHAREHOLDERS Dividends and Distributions . . . . . . . . . . . . . . . . . . . . . . . . . . . . . . . . . . . . . . . . . . . . (31,232) (2,225) _________ _________ Total Distributions to Shareholders . . . . . . . . . . . . . . . . . . . . . . . . . . . . . . . . . . . . . (31,232) (2,225) _________ _________
CAPITAL SHARE TRANSACTIONS Proceeds from Shares Sold . . . . . . . . . . . . . . . . . . . . . . . . . . . . . . . . . . . . . . . . . . . . . . 7,548,885 2,498,000 Payments for Shares Redeemed . . . . . . . . . . . . . . . . . . . . . . . . . . . . . . . . . . . . . . . . . . (2,577,140) — _________ _________ Net Increase in Net Assets Derived from Capital Share Transactions(c) . . . . . . . . . 4,971,745 2,498,000 _________ _________Net Increase in Net Assets . . . . . . . . . . . . . . . . . . . . . . . . . . . . . . . . . . . . . . . . . . . . . . . . $4,856,733 $2,287,951 _________ _________ _________ _________
NET ASSETS Beginning of Period . . . . . . . . . . . . . . . . . . . . . . . . . . . . . . . . . . . . . . . . . . . . . . . . . . . $ — $ — _________ _________ End of Period . . . . . . . . . . . . . . . . . . . . . . . . . . . . . . . . . . . . . . . . . . . . . . . . . . . . . . . $4,856,733 $2,287,951 _________ _________ _________ _________
(a) Fund commenced operations on May 15, 2018. The information presented is from May 15, 2018 to October 31, 2018.(b) Fund commenced operations on July 23, 2018. The information presented is from July 23, 2018 to October 31, 2018.(c) Summary of capital share transactions is as follows:
Shares Shares ______ ______ Subscriptions . . . . . . . . . . . . . . . . . . . . . . . . . . . . . . . . . . . . . . . . . . . . . . . . . . . . . . . . 300,000 100,000 Redemptions . . . . . . . . . . . . . . . . . . . . . . . . . . . . . . . . . . . . . . . . . . . . . . . . . . . . . . . . (100,000) — _______ _______ Net Increase . . . . . . . . . . . . . . . . . . . . . . . . . . . . . . . . . . . . . . . . . . . . . . . . . . . . . . . . 200,000 100,000 _______ _______ _______ _______
Pacer FundsSTATEMENTS OF CHANGES IN NET ASSETS
The accompanying notes are an integral part of these financial statements.
64

Pacer CFRA-Stovall Equal Weight Seasonal Rotation ETF __________________________ For the Period Ended October 31, 2018(a)
(Unaudited) ___________OPERATIONS Net Investment Income . . . . . . . . . . . . . . . . . . . . . . . . . . . . . . . . . . . . . . . . . . . . . . . . . . . . . . . . . . . . . . . . . . . . . $ 7,766 Net Realized Loss on Investments . . . . . . . . . . . . . . . . . . . . . . . . . . . . . . . . . . . . . . . . . . . . . . . . . . . . . . . . . . . . . . (538) Change in Unrealized Appreciation of Investments . . . . . . . . . . . . . . . . . . . . . . . . . . . . . . . . . . . . . . . . . . . . . . . . . (852) __________ Net Increase in Net Assets Resulting from Operations . . . . . . . . . . . . . . . . . . . . . . . . . . . . . . . . . . . . . . . . . . . . 6,376 __________
DISTRIBUTIONS TO SHAREHOLDERS Dividends and Distributions . . . . . . . . . . . . . . . . . . . . . . . . . . . . . . . . . . . . . . . . . . . . . . . . . . . . . . . . . . . . . . . . . (4,847) __________ Total Distributions to Shareholders . . . . . . . . . . . . . . . . . . . . . . . . . . . . . . . . . . . . . . . . . . . . . . . . . . . . . . . . . . . (4,847) __________
CAPITAL SHARE TRANSACTIONS Proceeds from Shares Sold . . . . . . . . . . . . . . . . . . . . . . . . . . . . . . . . . . . . . . . . . . . . . . . . . . . . . . . . . . . . . . . . . . . 3,756,180 Payments for Shares Redeemed . . . . . . . . . . . . . . . . . . . . . . . . . . . . . . . . . . . . . . . . . . . . . . . . . . . . . . . . . . . . . . . . (1,253,100) __________ Net Increase in Net Assets Derived from Capital Share Transactions(b) . . . . . . . . . . . . . . . . . . . . . . . . . . . . . . . 2,503,080 __________Net Increase in Net Assets . . . . . . . . . . . . . . . . . . . . . . . . . . . . . . . . . . . . . . . . . . . . . . . . . . . . . . . . . . . . . . . . . . . . . $ 2,504,609 __________ __________
NET ASSETS Beginning of Period . . . . . . . . . . . . . . . . . . . . . . . . . . . . . . . . . . . . . . . . . . . . . . . . . . . . . . . . . . . . . . . . . . . . . . . . $ — __________ End of Period . . . . . . . . . . . . . . . . . . . . . . . . . . . . . . . . . . . . . . . . . . . . . . . . . . . . . . . . . . . . . . . . . . . . . . . . . . . . . $ 2,504,609 __________ __________
(a) Fund commenced operations on July 23, 2018. The information presented is from July 23, 2018 to October 31, 2018.(b) Summary of capital share transactions is as follows:
Shares ______ Subscriptions . . . . . . . . . . . . . . . . . . . . . . . . . . . . . . . . . . . . . . . . . . . . . . . . . . . . . . . . . . . . . . . . . . . . . . . . . . . . . 150,000 Redemptions . . . . . . . . . . . . . . . . . . . . . . . . . . . . . . . . . . . . . . . . . . . . . . . . . . . . . . . . . . . . . . . . . . . . . . . . . . . . . (50,000) _______ Net Increase . . . . . . . . . . . . . . . . . . . . . . . . . . . . . . . . . . . . . . . . . . . . . . . . . . . . . . . . . . . . . . . . . . . . . . . . . . . . . . 100,000 _______ _______
Pacer FundsSTATEMENTS OF CHANGES IN NET ASSETS
The accompanying notes are an integral part of these financial statements.
65

For the Period Ended For the For the For the October 31, 2018 Year Ended Year Ended Period Ended (Unaudited) April 30, 2018 April 30, 2017 April 30, 2016(1) _______________ _____________ _____________ ______________Net Asset Value, Beginning of Period . . . . . . . . . . . . . . . . . . . . . . . . . . . $28.41 $25.48 $21.88 $25.00 ______ ______ ______ ______
INCOME (LOSS) FROM INVESTMENT OPERATIONS:Net Investment Income(2) . . . . . . . . . . . . . . . . . . . . . . . . . . . . . . . . . . . 0.20 0.37 0.34 0.13Net Realized and Unrealized Gain (Loss) on Investments . . . . . . . . . . . . 0.36(6) 2.83 3.52 (3.15) ______ ______ ______ ______ Total from Investment Operations . . . . . . . . . . . . . . . . . . . . . . . . . . 0.56 3.21 3.86 (3.02) ______ ______ ______ ______
LESS DISTRIBUTIONS:Distributions from Net Investment Income . . . . . . . . . . . . . . . . . . . . . . — (0.28) (0.26) (0.10) ______ ______ ______ ______ Total Distributions . . . . . . . . . . . . . . . . . . . . . . . . . . . . . . . . . . . . . . — (0.28) (0.26) (0.10) ______ ______ ______ ______Net Asset Value, End of Period . . . . . . . . . . . . . . . . . . . . . . . . . . . . . . . . $28.97 $28.41 $25.48 $21.88 ______ ______ ______ ______ ______ ______ ______ ______Total Return . . . . . . . . . . . . . . . . . . . . . . . . . . . . . . . . . . . . . . . . . . . . . . 1.95%(3) 12.56% 17.72% -12.10%(3)
SUPPLEMENTAL DATA:Net Assets at End of Period (000’s) . . . . . . . . . . . . . . . . . . . . . . . . . . . . . $1,320,820 $921,975 $456,180 $365,448
RATIOS TO AVERAGE NET ASSETS: Expenses to Average Net Assets . . . . . . . . . . . . . . . . . . . . . . . . . . . . . 0.60%(4) 0.60% 0.60% 0.60%(4)
Net Investment Income to Average Net Assets . . . . . . . . . . . . . . . . . 1.33%(4) 1.32% 1.44% 0.62%(4)
Portfolio Turnover Rate(5) . . . . . . . . . . . . . . . . . . . . . . . . . . . . . . . . . . . 2%(3) 12% 7% 317%(3)
(1) Commencement of operations on June 11, 2015.(2) Calculated based on average shares outstanding during the period.(3) Not annualized.(4) Annualized.(5) Excluded impact of in-kind transactions.(6) Realized and unrealized gains and losses per share in this caption are balancing amounts necessary to reconcile to the change in net asset value for the period and may reconcile
with the aggregate gains and losses in the statement of operations due to share transactions for the period.
Pacer Trendpilot® US Large Cap ETFFINANCIAL HIGHLIGHTSFor a capital share outstanding throughout the period
The accompanying notes are an integral part of these financial statements.
66

For the Period Ended For the For the For the October 31, 2018 Year Ended Year Ended Period Ended (Unaudited) April 30, 2018 April 30, 2017 April 30, 2016(1) _______________ _____________ _____________ ______________Net Asset Value, Beginning of Period . . . . . . . . . . . . . . . . . . . . . . . . . . . $30.72 $28.00 $23.78 $25.00 ______ ______ ______ ______
INCOME (LOSS) FROM INVESTMENT OPERATIONS:Net Investment Income (Loss)(2) . . . . . . . . . . . . . . . . . . . . . . . . . . . . . . 0.19 0.27 0.27 (0.04)Net Realized and Unrealized Gain (Loss) on Investments . . . . . . . . . . . . 0.11(6) 2.66 4.13 (1.16) ______ ______ ______ ______ Total from Investment Operations . . . . . . . . . . . . . . . . . . . . . . . . . . 0.30 2.93 4.40 (1.20) ______ ______ ______ ______
LESS DISTRIBUTIONS:Distributions from Net Investment Income . . . . . . . . . . . . . . . . . . . . . . — (0.21) (0.18) —Distributions from Return of Capital . . . . . . . . . . . . . . . . . . . . . . . . . . . — — — (0.02) ______ ______ ______ ______ Total Distributions . . . . . . . . . . . . . . . . . . . . . . . . . . . . . . . . . . . . . . — (0.21) (0.18) (0.02) ______ ______ ______ ______Net Asset Value, End of Period . . . . . . . . . . . . . . . . . . . . . . . . . . . . . . . . $31.02 $30.72 $28.00 $23.78 ______ ______ ______ ______ ______ ______ ______ ______Total Return . . . . . . . . . . . . . . . . . . . . . . . . . . . . . . . . . . . . . . . . . . . . . . 1.01%(3) 10.42% 18.54% -4.82%(3)
SUPPLEMENTAL DATA:Net Assets at End of Period (000’s) . . . . . . . . . . . . . . . . . . . . . . . . . . . . . $634,445 $497,590 $281,430 $149,808
RATIOS TO AVERAGE NET ASSETS: Expenses to Average Net Assets . . . . . . . . . . . . . . . . . . . . . . . . . . . . . 0.60%(4) 0.60% 0.60% 0.60%(4)
Net Investment Income to Average Net Assets . . . . . . . . . . . . . . . . . 1.17%(4) 0.91% 1.02% -0.17%(4)
Portfolio Turnover Rate(5) . . . . . . . . . . . . . . . . . . . . . . . . . . . . . . . . . . . 11%(3) 66% 27% 379%(3)
(1) Commencement of operations on June 11, 2015.(2) Calculated based on average shares outstanding during the period.(3) Not annualized.(4) Annualized.(5) Excluded impact of in-kind transactions.(6) Realized and unrealized gains and losses per share in this caption are balancing amounts necessary to reconcile to the change in net asset value for the period and may reconcile
with the aggregate gains and losses in the statement of operations due to share transactions for the period.
Pacer Trendpilot® US Mid Cap ETFFINANCIAL HIGHLIGHTSFor a capital share outstanding throughout the period
The accompanying notes are an integral part of these financial statements.
67

For the Period Ended For the For the For the October 31, 2018 Year Ended Year Ended Period Ended (Unaudited) April 30, 2018 April 30, 2017 April 30, 2016(1) _______________ _____________ _____________ ______________Net Asset Value, Beginning of Period . . . . . . . . . . . . . . . . . . . . . . . . . . . $31.17 $26.32 $21.44 $25.00 ______ ______ ______ ______
INCOME (LOSS) FROM INVESTMENT OPERATIONS:Net Investment Income(2) . . . . . . . . . . . . . . . . . . . . . . . . . . . . . . . . . . . 0.06 0.11 0.11 0.04Net Realized and Unrealized Gain (Loss) on Investments . . . . . . . . . . . . 1.74 4.83 4.84 (3.55) ______ ______ ______ ______ Total from Investment Operations . . . . . . . . . . . . . . . . . . . . . . . . . . 1.80 4.94 4.95 (3.51) ______ ______ ______ ______
LESS DISTRIBUTIONS:Distributions from Net Investment Income . . . . . . . . . . . . . . . . . . . . . . — (0.10) (0.07) (0.05) ______ ______ ______ ______ Total Distributions . . . . . . . . . . . . . . . . . . . . . . . . . . . . . . . . . . . . . . — (0.10) (0.07) (0.05) ______ ______ ______ ______Net Asset Value, End of Period . . . . . . . . . . . . . . . . . . . . . . . . . . . . . . . . $32.97 $31.17 $26.32 $21.44 ______ ______ ______ ______ ______ ______ ______ ______Total Return . . . . . . . . . . . . . . . . . . . . . . . . . . . . . . . . . . . . . . . . . . . . . . 5.77%(3) 18.78% 23.11% -14.04%(3)
SUPPLEMENTAL DATA:Net Assets at End of Period (000’s) . . . . . . . . . . . . . . . . . . . . . . . . . . . . . $324,636 $211,906 $73,696 $69,689
RATIOS TO AVERAGE NET ASSETS: Expenses to Average Net Assets . . . . . . . . . . . . . . . . . . . . . . . . . . . . . 0.65%(4) 0.65% 0.65% 0.65%(4)
Net Investment Income to Average Net Assets . . . . . . . . . . . . . . . . . 0.36%(4) 0.38% 0.46% 0.18%(4)
Portfolio Turnover Rate(5) . . . . . . . . . . . . . . . . . . . . . . . . . . . . . . . . . . . 3%(3) 3% 125% 295%(3)
(1) Commencement of operations on June 11, 2015.(2) Calculated based on average shares outstanding during the period.(3) Not annualized.(4) Annualized.(5) Excluded impact of in-kind transactions.
Pacer Trendpilot® 100 ETFFINANCIAL HIGHLIGHTSFor a capital share outstanding throughout the period
The accompanying notes are an integral part of these financial statements.
68

For the Period Ended For the For the For the October 31, 2018 Year Ended Year Ended Period Ended (Unaudited) April 30, 2018 April 30, 2017 April 30, 2016(1) _______________ _____________ _____________ ______________Net Asset Value, Beginning of Period . . . . . . . . . . . . . . . . . . . . . . . . . . . $29.66 $27.03 $24.97 $25.00 ______ ______ ______ ______
INCOME (LOSS) FROM INVESTMENT OPERATIONS:Net Investment Gain (Loss)(2) . . . . . . . . . . . . . . . . . . . . . . . . . . . . . . . . 0.41 0.51 0.18 (0.04)Net Realized and Unrealized Gain (Loss) on Investments . . . . . . . . . . . . (4.61) 2.31 1.88(3) 0.01 ______ ______ ______ ______ Total from Investment Operations . . . . . . . . . . . . . . . . . . . . . . . . . . (4.20) 2.82 2.06 (0.03) ______ ______ ______ ______
LESS DISTRIBUTIONS:Distributions from Net Investment Income . . . . . . . . . . . . . . . . . . . . . . — (0.19) — —Distributions from net realized gain . . . . . . . . . . . . . . . . . . . . . . . . . . . . — — — — ______ ______ ______ ______ Total Distributions . . . . . . . . . . . . . . . . . . . . . . . . . . . . . . . . . . . . . . — (0.19) — — ______ ______ ______ ______Net Asset Value, End of Period . . . . . . . . . . . . . . . . . . . . . . . . . . . . . . . . $25.46 $29.66 $27.03 $24.97 ______ ______ ______ ______ ______ ______ ______ ______Total Return . . . . . . . . . . . . . . . . . . . . . . . . . . . . . . . . . . . . . . . . . . . . . . -14.18%(4) 10.43% 8.25%(5) -0.13%(4)
SUPPLEMENTAL DATA:Net Assets at End of Period (000’s) . . . . . . . . . . . . . . . . . . . . . . . . . . . . . $159,104 $158,703 $31,081 $22,470
RATIOS TO AVERAGE NET ASSETS: Expenses to Average Net Assets . . . . . . . . . . . . . . . . . . . . . . . . . . . . . 0.65%(6) 0.65% 0.65% 0.65%(6)
Net Investment Income (Loss) to Average Net Assets . . . . . . . . . . . . 2.95%(6) 1.69% 0.77% -0.39%(6)
Portfolio Turnover Rate(7) . . . . . . . . . . . . . . . . . . . . . . . . . . . . . . . . . . . 59%(4) 228% 143% 0%(4)
(1) Commencement of operations on December 14, 2015.(2) Calculated based on average shares outstanding during the period.(3) Includes $0.41 gain derived from contribution from a settlement. See Note 5.(4) Not annualized.(5) Before the contribution from a settlement, the total return for the year would have been 6.60%. See Note 8.(6) Annualized.(7) Excluded impact of in-kind transactions.
Pacer Trendpilot® European Index ETFFINANCIAL HIGHLIGHTSFor a capital share outstanding throughout the period
The accompanying notes are an integral part of these financial statements.
69

For the Period Ended For the For the For the October 31, 2018 Year Ended Year Ended Period Ended (Unaudited) April 30, 2018 April 30, 2017 April 30, 2016(1) _______________ _____________ _____________ ______________Net Asset Value, Beginning of Period . . . . . . . . . . . . . . . . . . . . . . . . . . . $30.75 $28.60 $27.16 $25.00 ______ ______ ______ ______
INCOME FROM INVESTMENT OPERATIONS:Net Investment Income(2) . . . . . . . . . . . . . . . . . . . . . . . . . . . . . . . . . . . 0.58 1.07 0.88 0.23Net Realized and Unrealized Gain (Loss) on Investments . . . . . . . . . . . . (1.42) 2.01 1.26 1.93 ______ ______ ______ ______ Total from Investment Operations . . . . . . . . . . . . . . . . . . . . . . . . . . (0.84) 3.08 2.14 2.16 ______ ______ ______ ______
LESS DISTRIBUTIONS:Distributions from Net Investment Income . . . . . . . . . . . . . . . . . . . . . . (0.62) (0.93) (0.70) — ______ ______ ______ ______ Total Distributions . . . . . . . . . . . . . . . . . . . . . . . . . . . . . . . . . . . . . . (0.62) (0.93) (0.70) — ______ ______ ______ ______Net Asset Value, End of Period . . . . . . . . . . . . . . . . . . . . . . . . . . . . . . . . $29.29 $30.75 $28.60 $27.16 ______ ______ ______ ______ ______ ______ ______ ______Total Return . . . . . . . . . . . . . . . . . . . . . . . . . . . . . . . . . . . . . . . . . . . . . . -2.81%(3) 10.86% 8.03% 8.64%(3)
SUPPLEMENTAL DATA:Net Assets at End of Period (000’s) . . . . . . . . . . . . . . . . . . . . . . . . . . . . . $188,916 $173,710 $70,059 $5,432
RATIOS TO AVERAGE NET ASSETS: Expenses to Average Net Assets . . . . . . . . . . . . . . . . . . . . . . . . . . . . . 0.60%(4) 0.60% 0.60% 0.60%(4)
Net Investment Income to Average Net Assets . . . . . . . . . . . . . . . . . 3.72%(4) 3.50% 3.19% 4.63%(4)
Portfolio Turnover Rate(5) . . . . . . . . . . . . . . . . . . . . . . . . . . . . . . . . . . . 35%(3) 76% 44% 0%(3)
(1) Commencement of operations on February 22, 2016.(2) Calculated based on average shares outstanding during the period.(3) Not annualized.(4) Annualized.(5) Excluded impact of in-kind transactions.
Pacer Global Cash Cows Dividend ETFFINANCIAL HIGHLIGHTSFor a capital share outstanding throughout the period
The accompanying notes are an integral part of these financial statements.
70

For the Period Ended For the For the October 31, 2018 Year Ended Period Ended (Unaudited) April 30, 2018 April 30, 2017(1) _______________ _____________ ______________Net Asset Value, Beginning of Period . . . . . . . . . . . . . . . . . . . . . . . . . . . . . . . . . . . . . . . . . . . $28.98 $26.13 $25.00 ______ ______ ______
INCOME FROM INVESTMENT OPERATIONS:Net Investment Income(2) . . . . . . . . . . . . . . . . . . . . . . . . . . . . . . . . . . . . . . . . . . . . . . . . . . . 0.28 0.61 0.13Net Realized and Unrealized Gain on Investments . . . . . . . . . . . . . . . . . . . . . . . . . . . . . . . . . (0.87)(6) 2.84 1.09 ______ ______ ______ Total from Investment Operations . . . . . . . . . . . . . . . . . . . . . . . . . . . . . . . . . . . . . . . . . . (0.59) 3.45 1.22 ______ ______ ______
LESS DISTRIBUTIONS:Distributions from Net Investment Income . . . . . . . . . . . . . . . . . . . . . . . . . . . . . . . . . . . . . . (0.20) (0.60) (0.09) ______ ______ ______ Total Distributions . . . . . . . . . . . . . . . . . . . . . . . . . . . . . . . . . . . . . . . . . . . . . . . . . . . . . . (0.20) (0.60) (0.09) ______ ______ ______Net Asset Value, End of Period . . . . . . . . . . . . . . . . . . . . . . . . . . . . . . . . . . . . . . . . . . . . . . . . $28.19 $28.98 $26.13 ______ ______ ______ ______ ______ ______Total Return . . . . . . . . . . . . . . . . . . . . . . . . . . . . . . . . . . . . . . . . . . . . . . . . . . . . . . . . . . . . . . -2.09%(3) 13.35% 4.87%(3)
SUPPLEMENTAL DATA:Net Assets at End of Period (000’s) . . . . . . . . . . . . . . . . . . . . . . . . . . . . . . . . . . . . . . . . . . . . . $171,967 $28,981 $11,759
RATIOS TO AVERAGE NET ASSETS: Expenses to Average Net Assets . . . . . . . . . . . . . . . . . . . . . . . . . . . . . . . . . . . . . . . . . . . . . 0.49%(4) 0.49% 0.49%(4)
Net Investment Income to Average Net Assets . . . . . . . . . . . . . . . . . . . . . . . . . . . . . . . . . 1.82%(4) 2.16% 1.37%(4)
Portfolio Turnover Rate(5) . . . . . . . . . . . . . . . . . . . . . . . . . . . . . . . . . . . . . . . . . . . . . . . . . . . 60%(3) 101% 36%(3)
(1) Commencement of operations on December 16, 2016.(2) Calculated based on average shares outstanding during the period.(3) Not annualized.(4) Annualized.(5) Excluded impact of in-kind transactions.(6) Realized and unrealized gains and losses per share in this caption are balancing amounts necessary to reconcile to the change in net asset value for the period and may reconcile
with the aggregate gains and losses in the statement of operations due to share transactions for the period.
Pacer US Cash Cows 100 ETFFINANCIAL HIGHLIGHTSFor a capital share outstanding throughout the period
The accompanying notes are an integral part of these financial statements.
71

For the Period Ended For the October 31, 2018 Period Ended (Unaudited) April 30, 2018(1) _______________ ______________Net Asset Value, Beginning of Period . . . . . . . . . . . . . . . . . . . . . . . . . . . . . . . . . . . . . . . . . . . . . . . . . . . . . . . . . . . $26.17 $24.78 ______ ______
INCOME (LOSS) FROM INVESTMENT OPERATIONS:Net Investment Income(2) . . . . . . . . . . . . . . . . . . . . . . . . . . . . . . . . . . . . . . . . . . . . . . . . . . . . . . . . . . . . . . . . . . . 0.83 0.28Net Realized and Unrealized Gain on Investments . . . . . . . . . . . . . . . . . . . . . . . . . . . . . . . . . . . . . . . . . . . . . . . . . (0.78)(6) 1.38 ______ ______ Total from Investment Operations . . . . . . . . . . . . . . . . . . . . . . . . . . . . . . . . . . . . . . . . . . . . . . . . . . . . . . . . . . 0.05 1.66 ______ ______
LESS DISTRIBUTIONS:Distributions from Net Investment Income . . . . . . . . . . . . . . . . . . . . . . . . . . . . . . . . . . . . . . . . . . . . . . . . . . . . . . (0.13) (0.27) ______ ______ Total Distributions . . . . . . . . . . . . . . . . . . . . . . . . . . . . . . . . . . . . . . . . . . . . . . . . . . . . . . . . . . . . . . . . . . . . . . (0.13) (0.27) ______ ______Net Asset Value, End of Period . . . . . . . . . . . . . . . . . . . . . . . . . . . . . . . . . . . . . . . . . . . . . . . . . . . . . . . . . . . . . . . . $26.09 $26.17 ______ ______ ______ ______Total Return . . . . . . . . . . . . . . . . . . . . . . . . . . . . . . . . . . . . . . . . . . . . . . . . . . . . . . . . . . . . . . . . . . . . . . . . . . . . . . 0.19%(3) 6.69%(3)
SUPPLEMENTAL DATA:Net Assets at End of Period (000’s) . . . . . . . . . . . . . . . . . . . . . . . . . . . . . . . . . . . . . . . . . . . . . . . . . . . . . . . . . . . . . $24,790 $5,233
RATIOS TO AVERAGE NET ASSETS: Expenses to Average Net Assets . . . . . . . . . . . . . . . . . . . . . . . . . . . . . . . . . . . . . . . . . . . . . . . . . . . . . . . . . . . . . 0.59%(4) 0.59%(4)
Net Investment Income to Average Net Assets . . . . . . . . . . . . . . . . . . . . . . . . . . . . . . . . . . . . . . . . . . . . . . . . . 1.26%(4) 1.25%(4)
Portfolio Turnover Rate(5) . . . . . . . . . . . . . . . . . . . . . . . . . . . . . . . . . . . . . . . . . . . . . . . . . . . . . . . . . . . . . . . . . . . 60%(3) 97%(3)
(1) Commencement of operations on June 16, 2017.(2) Calculated based on average shares outstanding during the period.(3) Not annualized.(4) Annualized.(5) Excluded impact of in-kind transactions.(6 )Realized and unrealized gains and losses per share in this caption are balancing amounts necessary to reconcile to the change in net asset value for the period and may
reconcile with the aggregate gains and losses in the statement of operations due to share transactions for the period.
Pacer US Small Cap Cash Cows 100 ETFFINANCIAL HIGHLIGHTSFor a capital share outstanding throughout the period
The accompanying notes are an integral part of these financial statements.
72

For the Period Ended For the October 31, 2018 Period Ended (Unaudited) April 30, 2018(1) _______________ ______________Net Asset Value, Beginning of Period . . . . . . . . . . . . . . . . . . . . . . . . . . . . . . . . . . . . . . . . . . . . . . . . . . . . . . . . . . . $28.91 $25.09 ______ ______
INCOME FROM INVESTMENT OPERATIONS:Net Investment Income(2) . . . . . . . . . . . . . . . . . . . . . . . . . . . . . . . . . . . . . . . . . . . . . . . . . . . . . . . . . . . . . . . . . . . 0.38 0.60Net Realized and Unrealized Gain on Investments . . . . . . . . . . . . . . . . . . . . . . . . . . . . . . . . . . . . . . . . . . . . . . . . . (3.56) 3.53 ______ ______ Total from Investment Operations . . . . . . . . . . . . . . . . . . . . . . . . . . . . . . . . . . . . . . . . . . . . . . . . . . . . . . . . . . (3.18) 4.13 ______ ______
LESS DISTRIBUTIONS:Distributions from Net Investment Income . . . . . . . . . . . . . . . . . . . . . . . . . . . . . . . . . . . . . . . . . . . . . . . . . . . . . . (0.35) (0.31) ______ ______ Total Distributions . . . . . . . . . . . . . . . . . . . . . . . . . . . . . . . . . . . . . . . . . . . . . . . . . . . . . . . . . . . . . . . . . . . . . . (0.35) (0.31) ______ ______Net Asset Value, End of Period . . . . . . . . . . . . . . . . . . . . . . . . . . . . . . . . . . . . . . . . . . . . . . . . . . . . . . . . . . . . . . . . $25.38 $28.91 ______ ______ ______ ______Total Return . . . . . . . . . . . . . . . . . . . . . . . . . . . . . . . . . . . . . . . . . . . . . . . . . . . . . . . . . . . . . . . . . . . . . . . . . . . . . . -11.10%(3) 16.48%(3)
SUPPLEMENTAL DATA:Net Assets at End of Period (000’s) . . . . . . . . . . . . . . . . . . . . . . . . . . . . . . . . . . . . . . . . . . . . . . . . . . . . . . . . . . . . . $27,917 $20,235
RATIOS TO AVERAGE NET ASSETS: Expenses to Average Net Assets . . . . . . . . . . . . . . . . . . . . . . . . . . . . . . . . . . . . . . . . . . . . . . . . . . . . . . . . . . . . . 0.65%(4) 0.65%(4)
Net Investment Income to Average Net Assets . . . . . . . . . . . . . . . . . . . . . . . . . . . . . . . . . . . . . . . . . . . . . . . . . 2.75%(4) 2.42%(4)
Portfolio Turnover Rate(5) . . . . . . . . . . . . . . . . . . . . . . . . . . . . . . . . . . . . . . . . . . . . . . . . . . . . . . . . . . . . . . . . . . . 41%(3) 25%(3)
(1) Commencement of operations on June 16, 2017.(2) Calculated based on average shares outstanding during the period.(3) Not annualized.(4) Annualized.(5) Excluded impact of in-kind transactions.
Pacer Developed Markets International Cash Cows 100 ETFFINANCIAL HIGHLIGHTSFor a capital share outstanding throughout the period
The accompanying notes are an integral part of these financial statements.
73

For the Period Ended For the October 31, 2018 Period Ended (Unaudited) April 30, 2018(1) _______________ ______________Net Asset Value, Beginning of Period . . . . . . . . . . . . . . . . . . . . . . . . . . . . . . . . . . . . . . . . . . . . . . . . . . . . . . . . . . . $25.02 $25.02 ______ ______
INCOME FROM INVESTMENT OPERATIONS:Net Investment Income(2) . . . . . . . . . . . . . . . . . . . . . . . . . . . . . . . . . . . . . . . . . . . . . . . . . . . . . . . . . . . . . . . . . . . 0.15 0.10Net Realized and Unrealized Loss on Investments . . . . . . . . . . . . . . . . . . . . . . . . . . . . . . . . . . . . . . . . . . . . . . . . . (0.87)(6) (0.05) ______ ______ Total from Investment Operations . . . . . . . . . . . . . . . . . . . . . . . . . . . . . . . . . . . . . . . . . . . . . . . . . . . . . . . . . . (0.72) 0.05 ______ ______
LESS DISTRIBUTIONS:Distributions from Net Investment Income . . . . . . . . . . . . . . . . . . . . . . . . . . . . . . . . . . . . . . . . . . . . . . . . . . . . . . (0.16) (0.05) ______ ______ Total Distributions . . . . . . . . . . . . . . . . . . . . . . . . . . . . . . . . . . . . . . . . . . . . . . . . . . . . . . . . . . . . . . . . . . . . . . (0.16) (0.05) ______ ______Net Asset Value, End of Period . . . . . . . . . . . . . . . . . . . . . . . . . . . . . . . . . . . . . . . . . . . . . . . . . . . . . . . . . . . . . . . . $24.14 $25.02 ______ ______ ______ ______Total Return . . . . . . . . . . . . . . . . . . . . . . . . . . . . . . . . . . . . . . . . . . . . . . . . . . . . . . . . . . . . . . . . . . . . . . . . . . . . . . -2.93%(3) 0.23%(3)
SUPPLEMENTAL DATA:Net Assets at End of Period (000’s) . . . . . . . . . . . . . . . . . . . . . . . . . . . . . . . . . . . . . . . . . . . . . . . . . . . . . . . . . . . . . $92,944 $62,539
RATIOS TO AVERAGE NET ASSETS: Expenses to Average Net Assets . . . . . . . . . . . . . . . . . . . . . . . . . . . . . . . . . . . . . . . . . . . . . . . . . . . . . . . . . . . . . 0.60%(4) 0.60%(4)
Net Investment Income to Average Net Assets . . . . . . . . . . . . . . . . . . . . . . . . . . . . . . . . . . . . . . . . . . . . . . . . . 1.12%(4) 1.04%(4)
Portfolio Turnover Rate(5) . . . . . . . . . . . . . . . . . . . . . . . . . . . . . . . . . . . . . . . . . . . . . . . . . . . . . . . . . . . . . . . . . . . 205%(3) 131%(3)
(1) Commencement of operations on December 11, 2017.(2) Calculated based on average shares outstanding during the period.(3) Not annualized.(4) Annualized.(5) Excluded impact of in-kind transactions.(6) Realized and unrealized gains and losses per share in this caption are balancing amounts necessary to reconcile to the change in net asset value for the period and may reconcile
with the aggregate gains and losses in the statement of operations due to share transactions for the period.
Pacer WealthShield ETFFINANCIAL HIGHLIGHTSFor a capital share outstanding throughout the period
The accompanying notes are an integral part of these financial statements.
74

For the Period Ended For the October 31, 2018 Period Ended (Unaudited) April 30, 2018(1) _______________ ______________Net Asset Value, Beginning of Period . . . . . . . . . . . . . . . . . . . . . . . . . . . . . . . . . . . . . . . . . . . . . . . . . . . . . . . . . . . $25.33 $24.89 ______ ______
INCOME FROM INVESTMENT OPERATIONS:Net Investment Income(2) . . . . . . . . . . . . . . . . . . . . . . . . . . . . . . . . . . . . . . . . . . . . . . . . . . . . . . . . . . . . . . . . . . . 0.18(3) —(3)
Net Realized and Unrealized Gain on Investments . . . . . . . . . . . . . . . . . . . . . . . . . . . . . . . . . . . . . . . . . . . . . . . . . 0.85 0.44 ______ ______ Total from Investment Operations . . . . . . . . . . . . . . . . . . . . . . . . . . . . . . . . . . . . . . . . . . . . . . . . . . . . . . . . . . 1.03 0.44 ______ ______
LESS DISTRIBUTIONS:Distributions from Net Investment Income . . . . . . . . . . . . . . . . . . . . . . . . . . . . . . . . . . . . . . . . . . . . . . . . . . . . . . (0.24) — ______ ______ Total Distributions . . . . . . . . . . . . . . . . . . . . . . . . . . . . . . . . . . . . . . . . . . . . . . . . . . . . . . . . . . . . . . . . . . . . . . (0.24) — ______ ______Net Asset Value, End of Period . . . . . . . . . . . . . . . . . . . . . . . . . . . . . . . . . . . . . . . . . . . . . . . . . . . . . . . . . . . . . . . . $26.12 $25.33 ______ ______ ______ ______Total Return . . . . . . . . . . . . . . . . . . . . . . . . . . . . . . . . . . . . . . . . . . . . . . . . . . . . . . . . . . . . . . . . . . . . . . . . . . . . . . 4.02%(4) 1.79%(4)
SUPPLEMENTAL DATA:Net Assets at End of Period (000’s) . . . . . . . . . . . . . . . . . . . . . . . . . . . . . . . . . . . . . . . . . . . . . . . . . . . . . . . . . . . . . $2,612 $2,533
RATIOS TO AVERAGE NET ASSETS: Expenses to Average Net Assets . . . . . . . . . . . . . . . . . . . . . . . . . . . . . . . . . . . . . . . . . . . . . . . . . . . . . . . . . . . . . 0.60%(5) 0.60%(5)
Net Investment Income to Average Net Assets . . . . . . . . . . . . . . . . . . . . . . . . . . . . . . . . . . . . . . . . . . . . . . . . . 1.34%(5) 0.25%(5)
Portfolio Turnover Rate(6) . . . . . . . . . . . . . . . . . . . . . . . . . . . . . . . . . . . . . . . . . . . . . . . . . . . . . . . . . . . . . . . . . . . 0%(4) 0%(4)
(1) Commencement of operations on April 9, 2018.(2) Calculated based on average shares outstanding during the period.(3) Less than $0.005.(4) Not annualized.(5) Annualized.(6) Excluded impact of in-kind transactions.
Pacer Military Times Best Employers ETFFINANCIAL HIGHLIGHTSFor a capital share outstanding throughout the period
The accompanying notes are an integral part of these financial statements.
75

For the Period Ended October 31, 2018(1) _________________Net Asset Value, Beginning of Period . . . . . . . . . . . . . . . . . . . . . . . . . . . . . . . . . . . . . . . . . . . . . . . . . . . . . . . . . . . . . . . . . . . . . . . . . $24.30 ______
INCOME FROM INVESTMENT OPERATIONS:Net Investment Income(2) . . . . . . . . . . . . . . . . . . . . . . . . . . . . . . . . . . . . . . . . . . . . . . . . . . . . . . . . . . . . . . . . . . . . . . . . . . . . . . . . . 0.56Net Realized and Unrealized Gain on Investments . . . . . . . . . . . . . . . . . . . . . . . . . . . . . . . . . . . . . . . . . . . . . . . . . . . . . . . . . . . . . . . 2.39 ______ Total from Investment Operations . . . . . . . . . . . . . . . . . . . . . . . . . . . . . . . . . . . . . . . . . . . . . . . . . . . . . . . . . . . . . . . . . . . . . . . . 2.95 ______
LESS DISTRIBUTIONS:Distributions from Net Investment Income . . . . . . . . . . . . . . . . . . . . . . . . . . . . . . . . . . . . . . . . . . . . . . . . . . . . . . . . . . . . . . . . . . . . (0.43) ______ Total Distributions . . . . . . . . . . . . . . . . . . . . . . . . . . . . . . . . . . . . . . . . . . . . . . . . . . . . . . . . . . . . . . . . . . . . . . . . . . . . . . . . . . . . (0.43) ______Net Asset Value, End of Period . . . . . . . . . . . . . . . . . . . . . . . . . . . . . . . . . . . . . . . . . . . . . . . . . . . . . . . . . . . . . . . . . . . . . . . . . . . . . . $26.82 ______ ______Total Return . . . . . . . . . . . . . . . . . . . . . . . . . . . . . . . . . . . . . . . . . . . . . . . . . . . . . . . . . . . . . . . . . . . . . . . . . . . . . . . . . . . . . . . . . . . . 12.13%(4)
SUPPLEMENTAL DATA:Net Assets at End of Period (000’s) . . . . . . . . . . . . . . . . . . . . . . . . . . . . . . . . . . . . . . . . . . . . . . . . . . . . . . . . . . . . . . . . . . . . . . . . . . . $2,682
RATIOS TO AVERAGE NET ASSETS: Expenses to Average Net Assets . . . . . . . . . . . . . . . . . . . . . . . . . . . . . . . . . . . . . . . . . . . . . . . . . . . . . . . . . . . . . . . . . . . . . . . . . . . 0.60%(5)
Net Investment Income to Average Net Assets . . . . . . . . . . . . . . . . . . . . . . . . . . . . . . . . . . . . . . . . . . . . . . . . . . . . . . . . . . . . . . . 0.00%(3)(5)
Portfolio Turnover Rate(6) . . . . . . . . . . . . . . . . . . . . . . . . . . . . . . . . . . . . . . . . . . . . . . . . . . . . . . . . . . . . . . . . . . . . . . . . . . . . . . . . . 35%(4)
(1) Commencement of operations on May 15, 2018.(2) Calculated based on average shares outstanding during the period.(3) Less than 0.5%.(4) Not annualized.(5) Annualized.(6) Excluded impact of in-kind transactions.
Pacer Benchmark Retail Real Estate SCTRSM ETFFINANCIAL HIGHLIGHTSFor a capital share outstanding throughout the period
The accompanying notes are an integral part of these financial statements.
76
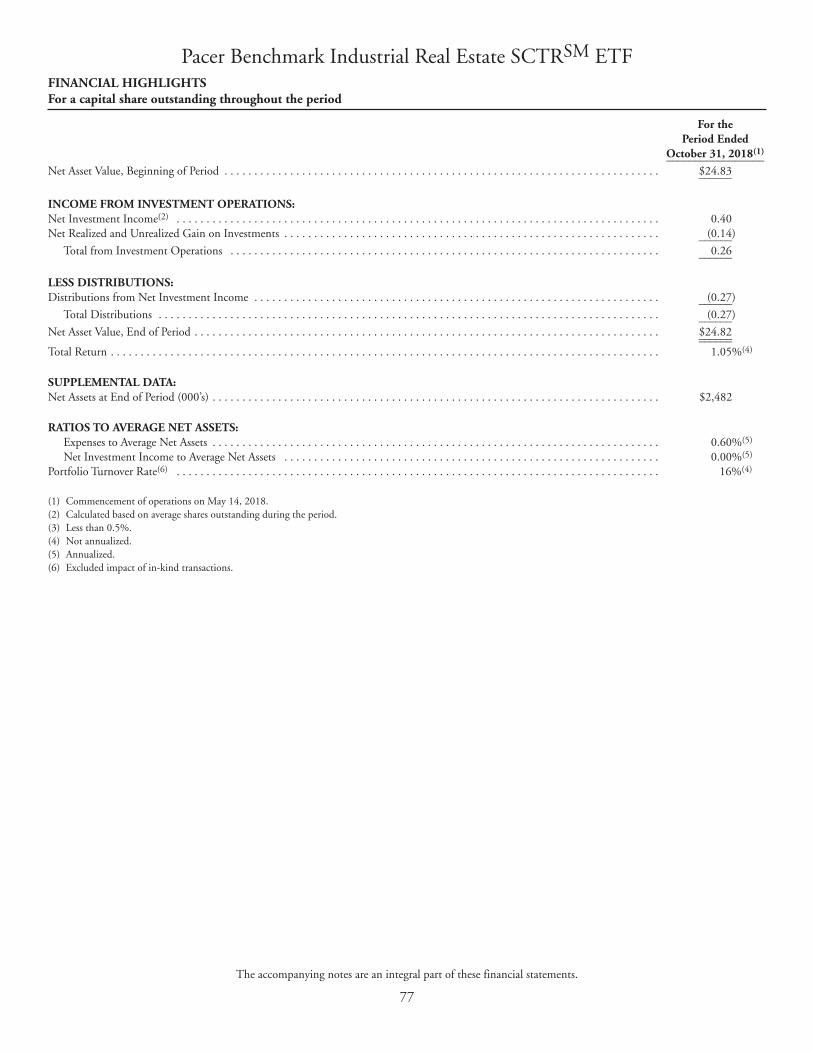
For the Period Ended October 31, 2018(1) _________________Net Asset Value, Beginning of Period . . . . . . . . . . . . . . . . . . . . . . . . . . . . . . . . . . . . . . . . . . . . . . . . . . . . . . . . . . . . . . . . . . . . . . . . . $24.83 ______
INCOME FROM INVESTMENT OPERATIONS:Net Investment Income(2) . . . . . . . . . . . . . . . . . . . . . . . . . . . . . . . . . . . . . . . . . . . . . . . . . . . . . . . . . . . . . . . . . . . . . . . . . . . . . . . . . 0.40Net Realized and Unrealized Gain on Investments . . . . . . . . . . . . . . . . . . . . . . . . . . . . . . . . . . . . . . . . . . . . . . . . . . . . . . . . . . . . . . . (0.14) ______ Total from Investment Operations . . . . . . . . . . . . . . . . . . . . . . . . . . . . . . . . . . . . . . . . . . . . . . . . . . . . . . . . . . . . . . . . . . . . . . . . 0.26 ______
LESS DISTRIBUTIONS:Distributions from Net Investment Income . . . . . . . . . . . . . . . . . . . . . . . . . . . . . . . . . . . . . . . . . . . . . . . . . . . . . . . . . . . . . . . . . . . . (0.27) ______ Total Distributions . . . . . . . . . . . . . . . . . . . . . . . . . . . . . . . . . . . . . . . . . . . . . . . . . . . . . . . . . . . . . . . . . . . . . . . . . . . . . . . . . . . . (0.27) ______Net Asset Value, End of Period . . . . . . . . . . . . . . . . . . . . . . . . . . . . . . . . . . . . . . . . . . . . . . . . . . . . . . . . . . . . . . . . . . . . . . . . . . . . . . $24.82 ______ ______Total Return . . . . . . . . . . . . . . . . . . . . . . . . . . . . . . . . . . . . . . . . . . . . . . . . . . . . . . . . . . . . . . . . . . . . . . . . . . . . . . . . . . . . . . . . . . . . 1.05%(4)
SUPPLEMENTAL DATA:Net Assets at End of Period (000’s) . . . . . . . . . . . . . . . . . . . . . . . . . . . . . . . . . . . . . . . . . . . . . . . . . . . . . . . . . . . . . . . . . . . . . . . . . . . $2,482
RATIOS TO AVERAGE NET ASSETS: Expenses to Average Net Assets . . . . . . . . . . . . . . . . . . . . . . . . . . . . . . . . . . . . . . . . . . . . . . . . . . . . . . . . . . . . . . . . . . . . . . . . . . . 0.60%(5)
Net Investment Income to Average Net Assets . . . . . . . . . . . . . . . . . . . . . . . . . . . . . . . . . . . . . . . . . . . . . . . . . . . . . . . . . . . . . . . 0.00%(5)
Portfolio Turnover Rate(6) . . . . . . . . . . . . . . . . . . . . . . . . . . . . . . . . . . . . . . . . . . . . . . . . . . . . . . . . . . . . . . . . . . . . . . . . . . . . . . . . . 16%(4)
(1) Commencement of operations on May 14, 2018.(2) Calculated based on average shares outstanding during the period.(3) Less than 0.5%.(4) Not annualized.(5) Annualized.(6) Excluded impact of in-kind transactions.
Pacer Benchmark Industrial Real Estate SCTRSM ETFFINANCIAL HIGHLIGHTSFor a capital share outstanding throughout the period
The accompanying notes are an integral part of these financial statements.
77

For the Period Ended October 31, 2018(1) _________________Net Asset Value, Beginning of Period . . . . . . . . . . . . . . . . . . . . . . . . . . . . . . . . . . . . . . . . . . . . . . . . . . . . . . . . . . . . . . . . . . . . . . . . . $24.67 ______
INCOME FROM INVESTMENT OPERATIONS:Net Investment Income(2) . . . . . . . . . . . . . . . . . . . . . . . . . . . . . . . . . . . . . . . . . . . . . . . . . . . . . . . . . . . . . . . . . . . . . . . . . . . . . . . . . 0.43Net Realized and Unrealized Gain on Investments . . . . . . . . . . . . . . . . . . . . . . . . . . . . . . . . . . . . . . . . . . . . . . . . . . . . . . . . . . . . . . . (0.51) ______ Total from Investment Operations . . . . . . . . . . . . . . . . . . . . . . . . . . . . . . . . . . . . . . . . . . . . . . . . . . . . . . . . . . . . . . . . . . . . . . . . (0.08) ______
LESS DISTRIBUTIONS:Distributions from Net Investment Income . . . . . . . . . . . . . . . . . . . . . . . . . . . . . . . . . . . . . . . . . . . . . . . . . . . . . . . . . . . . . . . . . . . . (0.31) ______ Total Distributions . . . . . . . . . . . . . . . . . . . . . . . . . . . . . . . . . . . . . . . . . . . . . . . . . . . . . . . . . . . . . . . . . . . . . . . . . . . . . . . . . . . . (0.31) ______Net Asset Value, End of Period . . . . . . . . . . . . . . . . . . . . . . . . . . . . . . . . . . . . . . . . . . . . . . . . . . . . . . . . . . . . . . . . . . . . . . . . . . . . . . $24.28 ______ ______Total Return . . . . . . . . . . . . . . . . . . . . . . . . . . . . . . . . . . . . . . . . . . . . . . . . . . . . . . . . . . . . . . . . . . . . . . . . . . . . . . . . . . . . . . . . . . . . -0.38%(4)
SUPPLEMENTAL DATA:Net Assets at End of Period (000’s) . . . . . . . . . . . . . . . . . . . . . . . . . . . . . . . . . . . . . . . . . . . . . . . . . . . . . . . . . . . . . . . . . . . . . . . . . . . $4,857
RATIOS TO AVERAGE NET ASSETS: Expenses to Average Net Assets . . . . . . . . . . . . . . . . . . . . . . . . . . . . . . . . . . . . . . . . . . . . . . . . . . . . . . . . . . . . . . . . . . . . . . . . . . . 0.60%(5)
Net Investment Income to Average Net Assets . . . . . . . . . . . . . . . . . . . . . . . . . . . . . . . . . . . . . . . . . . . . . . . . . . . . . . . . . . . . . . . 0.00%(3)(5)
Portfolio Turnover Rate(6) . . . . . . . . . . . . . . . . . . . . . . . . . . . . . . . . . . . . . . . . . . . . . . . . . . . . . . . . . . . . . . . . . . . . . . . . . . . . . . . . . 9%(4)
(1) Commencement of operations on May 15, 2018.(2) Calculated based on average shares outstanding during the period.(3) Less than 0.5%.(4) Not annualized.(5) Annualized.(6) Excluded impact of in-kind transactions.
Pacer Benchmark Data & Infrastructure Real Estate SCTRSM ETFFINANCIAL HIGHLIGHTSFor a capital share outstanding throughout the period
The accompanying notes are an integral part of these financial statements.
78
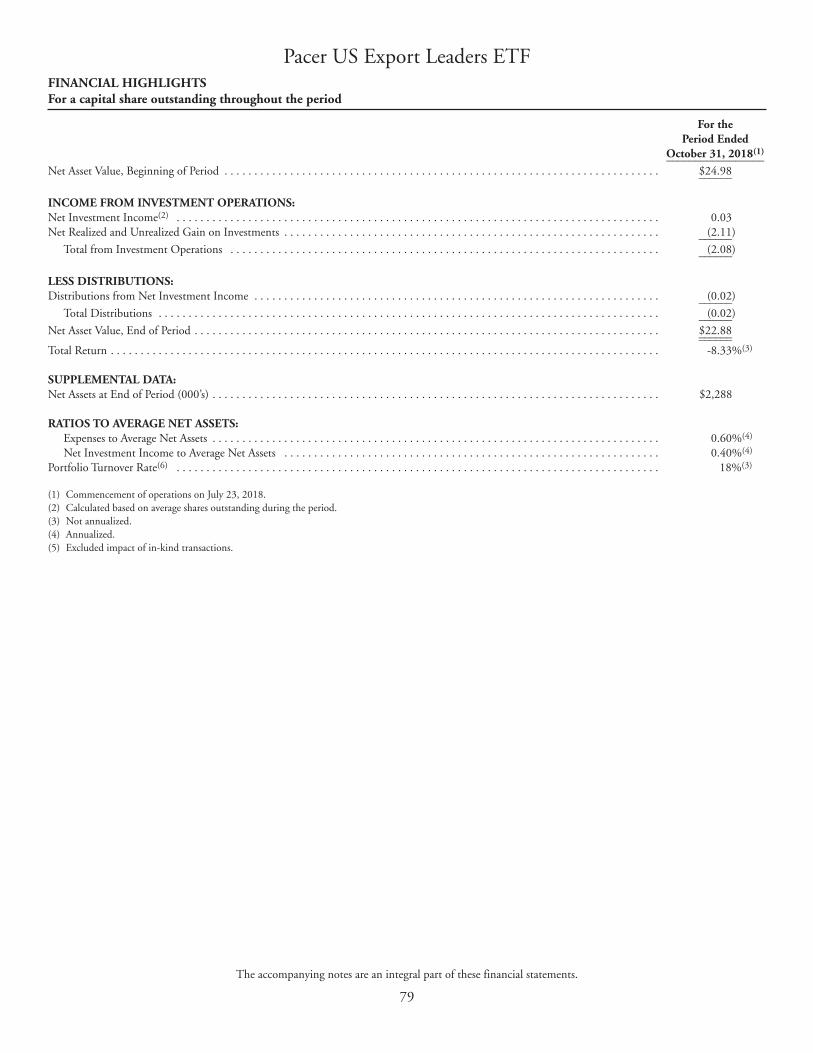
For the Period Ended October 31, 2018(1) _________________Net Asset Value, Beginning of Period . . . . . . . . . . . . . . . . . . . . . . . . . . . . . . . . . . . . . . . . . . . . . . . . . . . . . . . . . . . . . . . . . . . . . . . . . $24.98 ______
INCOME FROM INVESTMENT OPERATIONS:Net Investment Income(2) . . . . . . . . . . . . . . . . . . . . . . . . . . . . . . . . . . . . . . . . . . . . . . . . . . . . . . . . . . . . . . . . . . . . . . . . . . . . . . . . . 0.03Net Realized and Unrealized Gain on Investments . . . . . . . . . . . . . . . . . . . . . . . . . . . . . . . . . . . . . . . . . . . . . . . . . . . . . . . . . . . . . . . (2.11) ______ Total from Investment Operations . . . . . . . . . . . . . . . . . . . . . . . . . . . . . . . . . . . . . . . . . . . . . . . . . . . . . . . . . . . . . . . . . . . . . . . . (2.08) ______
LESS DISTRIBUTIONS:Distributions from Net Investment Income . . . . . . . . . . . . . . . . . . . . . . . . . . . . . . . . . . . . . . . . . . . . . . . . . . . . . . . . . . . . . . . . . . . . (0.02) ______ Total Distributions . . . . . . . . . . . . . . . . . . . . . . . . . . . . . . . . . . . . . . . . . . . . . . . . . . . . . . . . . . . . . . . . . . . . . . . . . . . . . . . . . . . . (0.02) ______Net Asset Value, End of Period . . . . . . . . . . . . . . . . . . . . . . . . . . . . . . . . . . . . . . . . . . . . . . . . . . . . . . . . . . . . . . . . . . . . . . . . . . . . . . $22.88 ______ ______Total Return . . . . . . . . . . . . . . . . . . . . . . . . . . . . . . . . . . . . . . . . . . . . . . . . . . . . . . . . . . . . . . . . . . . . . . . . . . . . . . . . . . . . . . . . . . . . -8.33%(3)
SUPPLEMENTAL DATA:Net Assets at End of Period (000’s) . . . . . . . . . . . . . . . . . . . . . . . . . . . . . . . . . . . . . . . . . . . . . . . . . . . . . . . . . . . . . . . . . . . . . . . . . . . $2,288
RATIOS TO AVERAGE NET ASSETS: Expenses to Average Net Assets . . . . . . . . . . . . . . . . . . . . . . . . . . . . . . . . . . . . . . . . . . . . . . . . . . . . . . . . . . . . . . . . . . . . . . . . . . . 0.60%(4)
Net Investment Income to Average Net Assets . . . . . . . . . . . . . . . . . . . . . . . . . . . . . . . . . . . . . . . . . . . . . . . . . . . . . . . . . . . . . . . 0.40%(4)
Portfolio Turnover Rate(6) . . . . . . . . . . . . . . . . . . . . . . . . . . . . . . . . . . . . . . . . . . . . . . . . . . . . . . . . . . . . . . . . . . . . . . . . . . . . . . . . . 18%(3)
(1) Commencement of operations on July 23, 2018.(2) Calculated based on average shares outstanding during the period.(3) Not annualized.(4) Annualized.(5) Excluded impact of in-kind transactions.
Pacer US Export Leaders ETFFINANCIAL HIGHLIGHTSFor a capital share outstanding throughout the period
The accompanying notes are an integral part of these financial statements.
79

For the Period Ended October 31, 2018(1) _________________Net Asset Value, Beginning of Period . . . . . . . . . . . . . . . . . . . . . . . . . . . . . . . . . . . . . . . . . . . . . . . . . . . . . . . . . . . . . . . . . . . . . . . . . $25.01 ______
INCOME FROM INVESTMENT OPERATIONS:Net Investment Income(2) . . . . . . . . . . . . . . . . . . . . . . . . . . . . . . . . . . . . . . . . . . . . . . . . . . . . . . . . . . . . . . . . . . . . . . . . . . . . . . . . . 0.08Net Realized and Unrealized Gain on Investments . . . . . . . . . . . . . . . . . . . . . . . . . . . . . . . . . . . . . . . . . . . . . . . . . . . . . . . . . . . . . . . 0.01 ______ Total from Investment Operations . . . . . . . . . . . . . . . . . . . . . . . . . . . . . . . . . . . . . . . . . . . . . . . . . . . . . . . . . . . . . . . . . . . . . . . . 0.09 ______
LESS DISTRIBUTIONS:Distributions from Net Investment Income . . . . . . . . . . . . . . . . . . . . . . . . . . . . . . . . . . . . . . . . . . . . . . . . . . . . . . . . . . . . . . . . . . . . (0.05) ______ Total Distributions . . . . . . . . . . . . . . . . . . . . . . . . . . . . . . . . . . . . . . . . . . . . . . . . . . . . . . . . . . . . . . . . . . . . . . . . . . . . . . . . . . . . (0.05) ______Net Asset Value, End of Period . . . . . . . . . . . . . . . . . . . . . . . . . . . . . . . . . . . . . . . . . . . . . . . . . . . . . . . . . . . . . . . . . . . . . . . . . . . . . . $25.05 ______ ______Total Return . . . . . . . . . . . . . . . . . . . . . . . . . . . . . . . . . . . . . . . . . . . . . . . . . . . . . . . . . . . . . . . . . . . . . . . . . . . . . . . . . . . . . . . . . . . . 0.39%(3)
SUPPLEMENTAL DATA:Net Assets at End of Period (000’s) . . . . . . . . . . . . . . . . . . . . . . . . . . . . . . . . . . . . . . . . . . . . . . . . . . . . . . . . . . . . . . . . . . . . . . . . . . . $2,505
RATIOS TO AVERAGE NET ASSETS: Expenses to Average Net Assets . . . . . . . . . . . . . . . . . . . . . . . . . . . . . . . . . . . . . . . . . . . . . . . . . . . . . . . . . . . . . . . . . . . . . . . . . . . 0.60%(4)
Net Investment Income to Average Net Assets . . . . . . . . . . . . . . . . . . . . . . . . . . . . . . . . . . . . . . . . . . . . . . . . . . . . . . . . . . . . . . . 1.11%(4)
Portfolio Turnover Rate(6) . . . . . . . . . . . . . . . . . . . . . . . . . . . . . . . . . . . . . . . . . . . . . . . . . . . . . . . . . . . . . . . . . . . . . . . . . . . . . . . . . 0%(3)
(1) Commencement of operations on July 23, 2018.(2) Calculated based on average shares outstanding during the period.(3) Not annualized.(4) Annualized.(5) Excluded impact of in-kind transactions.
Pacer CFRA-Stovall Equal Weight Seasonal Rotation ETFFINANCIAL HIGHLIGHTSFor a capital share outstanding throughout the period
The accompanying notes are an integral part of these financial statements.
80

NOTE 1 – ORGANIZATION
Pacer Trendpilot® US Large Cap ETF, Pacer Trendpilot® US Mid Cap ETF, Pacer Trendpilot® 100 ETF, Pacer Trendpilot® EuropeanIndex ETF, Pacer Global Cash Cows Dividend ETF, Pacer US Cash Cows 100 ETF, Pacer US Small Cap Cash Cows 100 ETF, PacerDeveloped Markets International Cash Cows 100 ETF, Pacer WealthShield ETF, Pacer Military Times Best Employers ETF, PacerBenchmark Industrial Real Estate SCTRSM ETF, Pacer Benchmark Retail Real Estate SCTRSM ETF, Pacer Benchmark Data &Infrastructure Real Estate SCTRSM, Pacer US Export Leaders ETF, and Pacer CFRA-Stovall Equal Weight Seasonal Rotation Index ETF(individually the “Fund” or collectively the “Funds”) are series of Pacer Funds Trust (the “Trust”), a Delaware statutory trust organized onAugust 12, 2014. The Trust is registered with the Securities and Exchange Commission (the “SEC”) under the Investment Company Act of1940, as amended (the “1940 Act”), as an open-end management investment company and the offering of the Funds’ shares (“Shares”) isregistered under the Securities Act of 1933, as amended (the “Securities Act”). The investment objectives of the Funds are to seek to trackthe total return performance, before fees and expenses, of the Pacer Trendpilot® US Large Cap Index, the Pacer Trendpilot® US Mid-CapIndex, the Pacer NASDAQ-100 Trendpilot® Index, the Pacer Trendpilot® European Index, the Pacer Global Cash Cows High Dividends100 Index, the Pacer US Cash Cows 100 Index, the Pacer US Small Cap Cash Cows Index, the Pacer Developed Markets InternationalCash Cows 100 Index, the Pacer WealthShield Index, the Military Times Best for VETSSM Index, the Benchmark Industrial Real EstateSCTRSM Index, the Benchmark Retail Real Estate SCTRSM Index, the Benchmark Data & Infrastructure Real Estate SCTRSM Index, thePacer US Export Leaders ETF and the Pacer CFRA-Stovall Equal Weight Seasonal Rotation Index. Pacer Trendpilot® US Large Cap ETF,Pacer Trendpilot® US Mid Cap ETF, and Pacer Trendpilot® 100 ETF commenced operations on June 11, 2015. Pacer Trendpilot®
European Index ETF commenced operations on December 14, 2015. Pacer Global Cash Cows Dividend ETF commenced operations onFebruary 22, 2016. Pacer US Cash Cows 100 ETF commenced operations on December 16, 2016. Pacer US Small Cap Cash Cows 100ETF and Pacer Developed Markets International Cash Cows 100 ETF commenced operations on June 16, 2017. Pacer WealthShield ETFcommenced operations on December 11, 2017. Pacer Military Times Best Employers ETF commenced operations on April 9, 2018. PacerBenchmark Industrial Real Estate SCTRSM ETF commenced operations on May 14, 2018. Pacer Benchmark Retail Real Estate SCTRSM
ETF and Pacer Benchmark Data & Infrastructure Real Estate SCTRSM ETF commenced operations on May 15, 2018. Pacer US ExportLeaders ETF, and Pacer CFRA-Stovall Equal Weight Seasonal Rotation Index ETF commenced operations on July 23, 2018. Each of theFunds are non-diversified series of the Trust.
Shares of the Funds are listed and traded on the Cboe BZX Exchange, Inc. (“Cboe”) with the exceptions of Pacer Military Times BestEmployers ETF, which is listed and traded on the Nasdaq Stock Market LLC. (“Nasdaq”) and Pacer Benchmark Industrial Real EstateSCTRSM ETF, Pacer Benchmark Retail Real Estate SCTRSM ETF, Pacer Benchmark Data & Infrastructure Real Estate SCTRSM, Pacer USExport Leaders ETF, and Pacer CFRA-Stovall Equal Weight Seasonal Rotation Index ETF, which are listed and traded on the NYSE Arca,Inc. (“NYSE”). Market prices for the shares may be different from their net asset value (“NAV”). The Funds issue and redeem shares on acontinuous basis at NAV only in large blocks of shares, called “Creation Units,” which generally consist of 50,000 shares. Creation Unitsare issued and redeemed principally in-kind for securities included in a specified universe. Once created, Shares generally trade in thesecondary market at market prices that change throughout the day in amounts less than a Creation Unit. Except when aggregated inCreation Units, Shares are not redeemable securities of a Fund. Shares of a Fund may only be purchased directly from or redeemed directlyto a Fund by certain financial institutions (“Authorized Participants”). An Authorized Participant is either (i) a broker-dealer or otherparticipant in the clearing process through the Continuous Net Settlement System of the National Securities Clearing Corporation or (ii) aDTC participant and, in each case, must have executed a Participant Agreement with Pacer Financial, Inc. (the “Distributor”). Most retailinvestors do not qualify as Authorized Participants nor have the resources to buy and sell whole Creation Units. Therefore, they are unableto purchase or redeem the shares directly from a Fund. Rather, most retail investors may purchase Shares in the secondary market with theassistance of a broker and are subject to customary brokerage commissions or fees.
The Funds each currently offer one class of Shares, which have no front end sales loads, no deferred sales charges, and no redemption fees.A purchase (i.e., creation) transaction fee is imposed for the transfer and other transaction costs associated with the purchase of CreationUnits. Pacer Trendpilot® US Large Cap ETF charges $500, Pacer Trendpilot® US Mid Cap ETF charges $500, Pacer Trendpilot® 100 ETFcharges $250, Pacer Trendpilot® European Index ETF charges $2,000, Pacer Global Cash Cows Dividend ETF charges $1,500, Pacer USCash Cows 100 ETF charges $250, Pacer US Small Cap Cash Cows 100 ETF charges $250, Pacer Developed Markets International CashCows 100 ETF charges $1,500, Pacer WealthShield ETF charges $250, Pacer Military Times Best Employers ETF charges $250, PacerBenchmark Industrial Real Estate SCTRSM ETF charges $250, Pacer Benchmark Retail Real Estate SCTRSM ETF charges $250, PacerBenchmark Data & Infrastructure Real Estate SCTRSM charges, Pacer US Export Leaders ETF charges, and Pacer CFRA-Stovall EqualWeight Seasonal Rotation Index ETF charges $500 for the standard fixed creation fee. For the Pacer Trendpilot® US Large Cap ETF, PacerTrendpilot® US Mid Cap ETF, Pacer Trendpilot® 100 ETF, and the Pacer Trendpilot® European Index ETF, the standard fixed creationtransaction fee is $200 when the Deposit Securities include only U.S. Treasury bills. In addition, a variable fee may be charged on all cash
Pacer FundsNOTES TO FINANCIAL STATEMENTSOctober 31, 2018 (Unaudited)
81

transactions or substitutes for Creation Units of up to a maximum of 2% as a percentage of the value of the Creation Units subject to thetransaction. Variable fees received by each Fund are displayed in the Capital Share Transaction section of the Statement of Changes in NetAssets. Each Fund may issue an unlimited number of shares of beneficial interest, with no par value. Shares of each Fund have equal rightsand privileges with respect to such Fund.
NOTE 2 – SIGNIFICANT ACCOUNTING POLICIES
The following is a summary of significant accounting policies consistently followed by the Funds in the preparation of the financialstatements. The financial statements have been prepared in conformity with accounting principles generally accepted in the United States ofAmerica (“GAAP”). The Funds are investment companies that follow the accounting and reporting guidelines of Accounting StandardsCodification Topic 946 applicable to investment companies.
A. Investment Valuation. Securities listed on a securities exchange, market or automated quotation system for which quotations are readilyavailable, are valued at the last quoted sale price on the primary exchange or market (foreign or domestic) on which they are traded,except for securities listed on Nasdaq Global Market (“Nasdaq”). If, on a particular day, there is no such reported sale, then the mostrecent quoted bid price will be used. For securities traded on Nasdaq, the Nasdaq Official Closing Price (“NOCP”) will be used. If aFund holds foreign shares of a security for which there is no reported volume, and there is an actively trading local version of thesecurity, the last quoted sale price of the local security shall be used. Prices denominated in foreign currencies are converted to U.S.dollar equivalents at the current exchange rate.
Investments in other open-end investment companies, including money market funds, are valued at the investment company’s net assetvalue per share, with the exception of exchange-traded open-end investment companies, which are priced as equity securities describedabove.
Fixed-income securities are normally valued on the basis of quotes obtained from independent pricing services in accordance with theprocedures adopted by the Board of Trustees (the “Board”). The independent pricing services may employ methodologies that utilizemarket transactions (if the security is actively traded), broker-dealer supplied valuations, or matrix pricing. Short-term securities thathave maturities of less than 60 days, at the time of purchase, are valued at amortized cost, which, when combined with accruedinterest, approximates market value.
Any securities for which there are no readily available market quotations and other assets will be valued at their fair value as determinedin good faith by the Fair Value Pricing Committee using the Fair Value Procedures approved by the Board.
As described above, the Funds utilize various methods to measure the fair value of their investments on a recurring basis. GAAPestablishes a hierarchy that prioritizes inputs to valuations methods. The three levels of inputs are:
Level 1 – Unadjusted quoted prices in active markets for identical assets or liabilities that the Funds have the ability to access.
Level 2 – Observable inputs other than quoted prices included in Level 1 that are observable for the asset or liability, either directly orindirectly. These inputs may include quoted prices for the identical instrument on an inactive market, prices for similarinstruments, interest rates, prepayment speeds, credit risk, yield curves, default rates and similar data.
Level 3 – Unobservable inputs for the asset or liability, to the extent relevant observable inputs are not available; representing theFunds’ own assumptions about the assumptions a market participant would use in valuing the asset or liability, and would bebased on the best information available.
The availability of observable inputs can vary from security to security and is affected by a wide variety of factors, including, forexample, the type of security, whether the security is new and not yet established in the marketplace, the liquidity of markets, and othercharacteristics particular to the security. To the extent that valuation is based on models or inputs that are less observable orunobservable in the market, the determination of fair value requires more judgment. Accordingly, the degree of judgment exercised indetermining fair value is greatest for instruments categorized in Level 3.
The inputs used to measure fair value may fall into different levels of the fair value hierarchy. In such cases, for disclosure purposes, thelevel in the fair value hierarchy within which the fair value measurement falls in its entirety, is determined based on the lowest levelinput that is significant to the fair value measurement in its entirety.
Pacer FundsNOTES TO FINANCIAL STATEMENTSOctober 31, 2018 (Unaudited) (Continued)
82

The following is a summary of the inputs used to value the Funds’ investments as of October 31, 2018:
Pacer Trendpilot® US Large Cap ETF Investments Measured at Description Level 1 Level 2 Level 3 Net Asset Value Total __________ ______ ______ ______ ______________ _____
Short-Term Investments $ — $ 1,643,709 $ — $ — $ 1,643,709 Investments Purchased with Proceeds from Securities Lending — — — 26,157,581 26,157,581 ___________ ___________ ______ ___________ ___________ Total Investments in Securities $ — $ 1,643,709 $ — $ 26,157,581 $ 27,801,290 ___________ ___________ ______ ___________ ___________ ___________ ___________ ______ ___________ ___________
Pacer Trendpilot® US Mid Cap ETF Investments Measured at Description Level 1 Level 2 Level 3 Net Asset Value Total __________ ______ ______ ______ ______________ _____
Short-Term Investments $ — $632,963,782 $ — $ — $632,963,782 Investments Purchased with Proceeds from Securities Lending — — — 190,038,750 190,038,750 ___________ ___________ ______ ___________ ___________ Total Investments in Securities $ — $632,963,782 $ — $190,038,750 $823,002,532 ___________ ___________ ______ ___________ ___________ ___________ ___________ ______ ___________ ___________
Pacer Trendpilot® 100 ETF Investments Measured at Description^ Level 1 Level 2 Level 3 Net Asset Value Total ___________ ______ ______ ______ ______________ _____
Common Stocks $162,167,469 $ — $ — $ — $162,167,469 Short-Term Investments — 460,940 — — 460,940 Investments Purchased with Proceeds from Securities Lending — — — 18,804,517 18,804,517 ___________ ___________ ______ ___________ ___________ Total Investments in Securities $162,167,469 $ 460,940 $ — $ 18,804,517 $181,432,926 ___________ ___________ ______ ___________ ___________ ___________ ___________ ______ ___________ ___________ ^ See Schedule of Investments for industry breakouts.
Pacer Trendpilot® European Index ETF Investments Measured at Description^ Level 1 Level 2 Level 3 Net Asset Value Total ___________ ______ ______ ______ ______________ _____
Common Stocks $ — $ — $6,845 $ — $ 6,845 Short-Term Investments — 158,865,247 — — 158,865,247 Investments Purchased with Proceeds from Securities Lending — — — 47,763,750 47,763,750 ___________ ___________ ______ ___________ ___________ Total Investments in Securities $ — $158,865,247 $6,845 $ 47,763,750 $206,635,842 ___________ ___________ ______ ___________ ___________ ___________ ___________ ______ ___________ ___________ ^ See Schedule of Investments for industry breakouts.
Pacer Global Cash Cows Dividend ETF Investments Measured at Description^ Level 1 Level 2 Level 3 Net Asset Value Total ___________ ______ ______ ______ ______________ _____
Common Stocks $178,806,683 $ — $ — $ — $178,806,683 Real Estate Investment Trusts 9,372,612 — — — 9,372,612 Short-Term Investments — 145,313 — — 145,313 Investments Purchased with Proceeds from Securities Lending — — — 38,789,497 38,789,497 ___________ ___________ ______ ___________ ___________ Total $188,179,295 $ 145,313 $ — $ 38,789,497 $227,114,105 ___________ ___________ ______ ___________ ___________ ___________ ___________ ______ ___________ ___________ ^ See Schedule of Investments for country breakouts.
Pacer FundsNOTES TO FINANCIAL STATEMENTSOctober 31, 2018 (Unaudited) (Continued)
83

Pacer US Cash Cows 100 ETF Investments Measured at Description^ Level 1 Level 2 Level 3 Net Asset Value Total ___________ ______ ______ ______ ______________ _____
Common Stocks $165,407,693 $ — $ — $ — $165,407,693 Real Estate Investment Trusts 6,213,311 — — — 6,213,311 Short-Term Investments — 266,284 — — 266,284 Investments Purchased with Proceeds from Securities Lending — — — 18,809,270 18,809,270 ___________ ___________ ______ ___________ ___________ Total Investments in Securities $171,621,004 $ 266,284 $ — $ 18,809,270 $190,696,558 ___________ ___________ ______ ___________ ___________ ___________ ___________ ______ ___________ ___________ ^ See Schedule of Investments for industry breakouts.
Pacer US Small Cap Cash Cows 100 ETF Investments Measured at Description^ Level 1 Level 2 Level 3 Net Asset Value Total ___________ ______ ______ ______ ______________ _____
Common Stocks $ 23,711,881 $ — $ — $ — $ 23,711,881 Real Estate Investment Trusts 1,066,778 — — — 1,066,778 Short-Term Investments — 19,526 — — 19,526 Investments Purchased with Proceeds from Securities Lending — — — 2,135,082 2,135,082 ___________ ___________ ______ ___________ ___________ Total $ 24,778,659 $ 19,526 $ — $ 2,135,082 $ 26,933,267 ___________ ___________ ______ ___________ ___________ ___________ ___________ ______ ___________ ___________ ^ See Schedule of Investments for industry breakouts.
Pacer Developed Markets International Cash Cows 100 ETF Investments Measured at Description^ Level 1 Level 2 Level 3 Net Asset Value Total ___________ ______ ______ ______ ______________ _____
Common Stocks $ 27,790,778 $ — $ — $ — $ 27,790,778 Short-Term Investments — 23,065 — — 23,065 Investments Purchased with Proceeds from Securities Lending — — — 1,945,516 1,945,516 ___________ ___________ ______ ___________ ___________ Total Investments in Securities $ 27,790,778 $ 23,065 $ — $ 1,945,516 $ 29,759,359 ___________ ___________ ______ ___________ ___________ ___________ ___________ ______ ___________ ___________ ^ See Schedule of Investments for country breakouts.
Pacer WealthShield ETF Investments Measured at Description Level 1 Level 2 Level 3 Net Asset Value Total __________ ______ ______ ______ ______________ _____
Short-Term Investments $ — $ 341,378 $ — $ — $ 341,378 ___________ ___________ ______ ___________ ___________ Total Investments in Securities $ — $ 341,378 $ — $ — $ 341,378 ___________ ___________ ______ ___________ ___________ ___________ ___________ ______ ___________ ___________
Pacer Military Times Best Employers ETF Investments Measured at Description^ Level 1 Level 2 Level 3 Net Asset Value Total ___________ ______ ______ ______ ______________ _____
Common Stocks $ 2,610,358 $ — $ — $ — $ 2,610,358 Short-Term Investments — 949 — — 949 ___________ ___________ ______ ___________ ___________ Total Investments in Securities $ 2,610,358 $ 949 $ — $ — $ 2,611,307 ___________ ___________ ______ ___________ ___________ ___________ ___________ ______ ___________ ___________ ^ See Schedule of Investments for industry breakouts.
Pacer FundsNOTES TO FINANCIAL STATEMENTSOctober 31, 2018 (Unaudited) (Continued)
84

Pacer Benchmark Retail Real Estate SCTRSM ETF Investments Measured at Description^ Level 1 Level 2 Level 3 Net Asset Value Total ___________ ______ ______ ______ ______________ _____
Real Estate Investment Trusts $ 2,651,950 $ — $ — $ — $ 2,651,950 Short-Term Investments — 28,661 — — 28,661 ___________ ___________ ______ ___________ ___________ Total Investments in Securities $ 2,651,950 $ 28,661 $ — $ — $ 2,680,611 ___________ ___________ ______ ___________ ___________ ___________ ___________ ______ ___________ ___________ ^ See Schedule of Investments for industry breakouts.
Pacer Benchmark Industrial Real Estate SCTRSM ETF Investments Measured at Description^ Level 1 Level 2 Level 3 Net Asset Value Total ___________ ______ ______ ______ ______________ _____
Real Estate Investment Trusts $ 2,478,971 $ — $ — $ — $ 2,478,971 Short-Term Investments — 3,365 — — 3,365 ___________ ___________ ______ ___________ ___________ Total Investments in Securities $ 2,478,971 $ 3,365 $ — $ — $ 2,482,336 ___________ ___________ ______ ___________ ___________ ___________ ___________ ______ ___________ ___________ ^ See Schedule of Investments for industry breakouts.
Pacer Benchmark Data & Infrastructure Real Estate SCTRSM ETF Investments Measured at Description^ Level 1 Level 2 Level 3 Net Asset Value Total ___________ ______ ______ ______ ______________ _____
Common Stocks $ 341,204 $ — $ — $ — $ 341,204 Real Estate Investment Trusts 4,487,848 — — — 4,487,848 Short-Term Investments — 10,999 — — 10,999 ___________ ___________ ______ ___________ ___________ Total Investments in Securities $ 4,829,052 $ 10,999 $ — $ — $ 4,840,051 ___________ ___________ ______ ___________ ___________ ___________ ___________ ______ ___________ ___________ ^ See Schedule of Investments for industry breakouts.
Pacer US Export Leaders ETF Investments Measured at Description^ Level 1 Level 2 Level 3 Net Asset Value Total ___________ ______ ______ ______ ______________ _____
Common Stocks $ 2,265,557 $ — $ — $ — $ 2,265,557 Real Estate Investment Trusts 20,113 — — — 20,113 Short-Term Investments — 2,334 — — 2,334 ___________ ___________ ______ ___________ ___________ Total Investments in Securities $ 2,285,670 $ 2,334 $ — $ — $ 2,288,004 ___________ ___________ ______ ___________ ___________ ___________ ___________ ______ ___________ ___________ ^ See Schedule of Investments for industry breakouts.
Pacer CFRA-Stovall Equal Weight Seasonal Rotation ETF Investments Measured at Description^ Level 1 Level 2 Level 3 Net Asset Value Total ___________ ______ ______ ______ ______________ _____
Common Stocks $ 2,498,108 $ — $ — $ — $ 2,498,108 Short-Term Investments — 26,131 — — 26,131 ___________ ___________ ______ ___________ ___________ Total Investments in Securities $ 2,498,108 $ 26,131 $ — $ — $ 2,524,239 ___________ ___________ ______ ___________ ___________ ___________ ___________ ______ ___________ ___________ ^ See Schedule of Investments for industry breakouts.
The following is a reconciliation of investments in which significant unobservable inputs (Level 3) were used in determining fair value: Net Change in Unrealized Change in Net Appreciation Balance Unrealized Transfers Transfers Balance (Depreciation) on Pacer Trendpilot as of Net Realized Appreciation Into Out of as of securities held at European Index ETF 4/30/2018 Gain (Loss) (Depreciation) Purchases Sales Level 3 Level 3 10/31/2018 10/31/2018 __________________ _________ ___________ ____________ ________ ____ ________ ________ __________ _______________
Common Stocks $ — $ — $ — $ — $ — $6,845 $ — $6,845 $(17,523)
Pacer FundsNOTES TO FINANCIAL STATEMENTSOctober 31, 2018 (Unaudited) (Continued)
85

The following is a summary of quantitative information about Level 3 Fair Value Measurements: Pacer Trendpilot Fair Value as Valuation Unobservable Input European Index ETF of 10/31/2018 Techniques Input Values Impact to valuation from an increase to input __________________ ____________ __________ ___________ ______ ______________________________________
Significant changes in the information surrounding Last Trade the company would result in direct and proportional Common Stocks $ 6,845 Price Stale Data 4.80 EUR changes in the fair value of the security.
Transfers between levels are recognized at the end of the reporting period. During the period ended October 31, 2018, the Funds’recognized no transfers to or from Level 3, except Pacer Trendpilot European Index ETF.
B. Foreign Currency. Investment securities and other assets and liabilities denominated in foreign currencies are translated into U.S. dollaramounts at the date of valuation. Purchases and sales of investment securities and income and expense items denominated in foreigncurrencies are translated into U.S. dollar amounts on the respective dates of such transactions. The Funds do not isolate that portion ofthe results of operations resulting from changes in foreign exchange rates on investments from fluctuations arising from changes inmarket prices of securities held. Such fluctuations are included with the net realized and unrealized gain or loss from investments. TheFunds report net realized foreign exchange gains or losses that arise from sales of foreign currencies, currency gains or losses realizedbetween the trade and settlement dates on securities transactions, and the differences between the amounts of dividends, interest andforeign withholding taxes recorded on the Funds’ books and the U.S. dollar equivalent gains and losses arise from changes in the fairvalues of assets and liabilities, other than investments in securities at fiscal period end, resulting from changes in exchange rates.
C. Federal Income Taxes. The Funds comply with the requirements of subchapter M of the Internal Revenue Code of 1986, as amended,necessary to qualify as regulated investment companies and distribute substantially all net taxable investment income and netrealized gains to shareholders in a manner which results in no tax cost to the Funds. Therefore, no federal income tax provision isrequired. As of and during the fiscal period/year ended April 30, 2018, the Funds did not have any tax positions that did not meetthe “more-likely-than-not” threshold of being sustained by the applicable tax authority. As of and during the fiscal period/year endedApril 30, 2018, the Funds did not have liabilities for any unrecognized tax benefits on uncertain tax positions as income tax expensein the Statement of Operations. The Funds are subject to examination by U.S. taxing authorities for the tax periods since eachFund’s commencement of operations.
D. Security Transactions and Investment Income. Investment securities transactions are accounted for on the trade date. Gains and lossesrealized on sales of securities are computed on the basis of highest amortized cost. Dividend income is recorded on the ex-dividenddate. Interest income is recorded on an accrual basis. Discounts and premiums on securities purchased are accreted and amortized overthe lives of the respective securities. Withholding taxes on foreign dividends have been provided for in accordance with the Funds’understanding of the applicable tax rules and regulations.
E. Distributions to Shareholders. Distributions to shareholders from net investment income for the Pacer Global Cash Cows DividendETF, Pacer US Cash Cows 100 ETF, Pacer US Small Cap Cash Cows 100 ETF, Pacer Developed Markets International Cash Cows100 ETF, Pacer WealthShield ETF, Pacer Military Times Best Employers ETF, Pacer US Export Leaders ETF, Pacer BenchmarkIndustrial Real Estate SCTRSM ETF, Pacer Benchmark Retail Real Estate SCTRSM ETF, Pacer Benchmark Data & Infrastructure RealEstate SCTRSM and Pacer CFRA-Stovall Equal Weight Seasonal Rotation Index ETF are declared and paid on a quarterly basis. ThePacer Trendpilot® US Large Cap ETF, Pacer Trendpilot® Mid Cap ETF, Pacer Trendpilot® 100 ETF, and the Pacer Trendpilot®
European Index, are declared and paid on an annual basis. The net realized gains on securities normally are declared and paid on anannual basis for all Funds. Distributions are recorded on the ex-dividend date.
F. Use of Estimates. The preparation of financial statements in conformity with GAAP requires management to make estimates andassumptions that affect the reported amounts of assets and liabilities and disclosure of contingent assets and liabilities at the date of thefinancial statements, and the reported amounts of increases and decreases in net assets from operations during the reporting period.Actual results could differ from those estimates.
G. Share Valuation. The NAV per share of each Fund is calculated by dividing the sum of the value of the securities held by the Fund, pluscash and other assets, minus all liabilities (including estimated accrued expenses) by the total number of shares outstanding for theFund, rounded to the nearest cent. The Funds’ shares will not be priced on the days on which the Cboe and/or Nasdaq is closed fortrading. The offering and redemption price per share for each Fund is equal to the Fund’s net asset value per share.
H. Guarantees and Indemnifications. In the normal course of business, the Funds enter into contracts with service providers that containgeneral indemnification clauses. Each Fund’s maximum exposure under these arrangements is unknown as this would involve futureclaims that may be against the Funds that have not yet occurred.
Pacer FundsNOTES TO FINANCIAL STATEMENTSOctober 31, 2018 (Unaudited) (Continued)
86
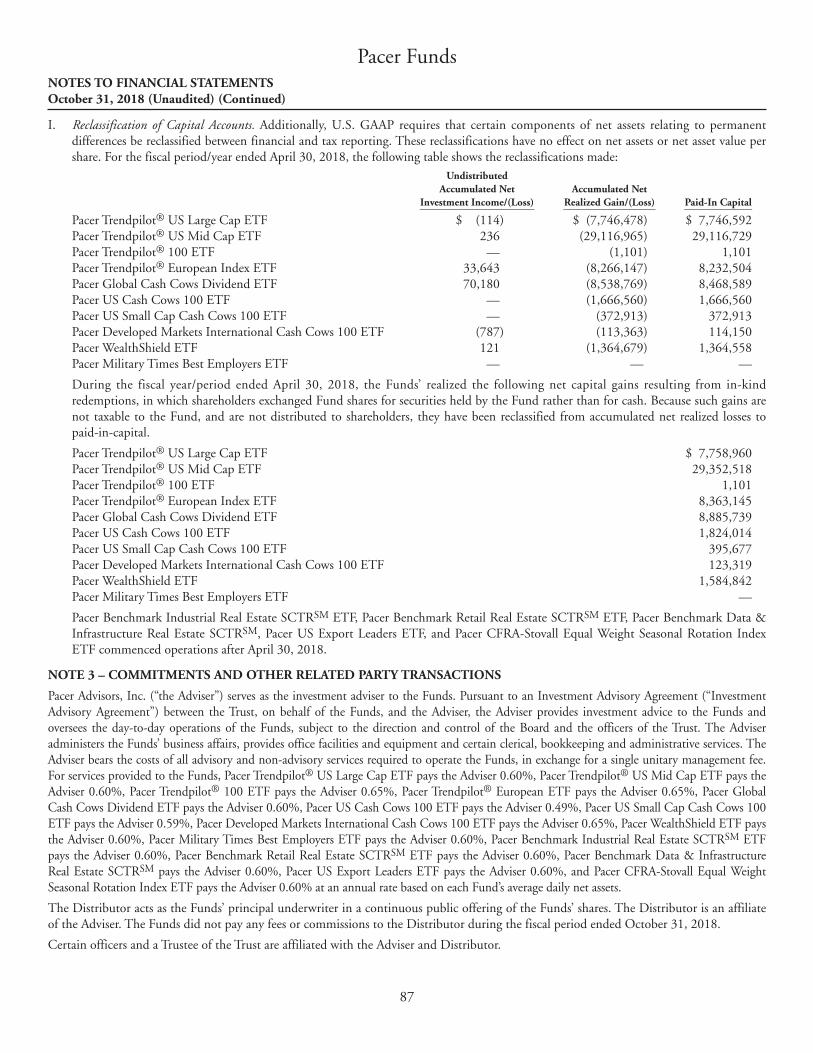
I. Reclassification of Capital Accounts. Additionally, U.S. GAAP requires that certain components of net assets relating to permanentdifferences be reclassified between financial and tax reporting. These reclassifications have no effect on net assets or net asset value pershare. For the fiscal period/year ended April 30, 2018, the following table shows the reclassifications made:
Undistributed Accumulated Net Accumulated Net Investment Income/(Loss) Realized Gain/(Loss) Paid-In Capital ______________________ __________________ _____________
Pacer Trendpilot® US Large Cap ETF $ (114) $ (7,746,478) $ 7,746,592 Pacer Trendpilot® US Mid Cap ETF 236 (29,116,965) 29,116,729 Pacer Trendpilot® 100 ETF — (1,101) 1,101 Pacer Trendpilot® European Index ETF 33,643 (8,266,147) 8,232,504 Pacer Global Cash Cows Dividend ETF 70,180 (8,538,769) 8,468,589 Pacer US Cash Cows 100 ETF — (1,666,560) 1,666,560 Pacer US Small Cap Cash Cows 100 ETF — (372,913) 372,913 Pacer Developed Markets International Cash Cows 100 ETF (787) (113,363) 114,150 Pacer WealthShield ETF 121 (1,364,679) 1,364,558 Pacer Military Times Best Employers ETF — — —
During the fiscal year/period ended April 30, 2018, the Funds’ realized the following net capital gains resulting from in-kindredemptions, in which shareholders exchanged Fund shares for securities held by the Fund rather than for cash. Because such gains arenot taxable to the Fund, and are not distributed to shareholders, they have been reclassified from accumulated net realized losses topaid-in-capital.
Pacer Trendpilot® US Large Cap ETF $ 7,758,960 Pacer Trendpilot® US Mid Cap ETF 29,352,518 Pacer Trendpilot® 100 ETF 1,101 Pacer Trendpilot® European Index ETF 8,363,145 Pacer Global Cash Cows Dividend ETF 8,885,739 Pacer US Cash Cows 100 ETF 1,824,014 Pacer US Small Cap Cash Cows 100 ETF 395,677 Pacer Developed Markets International Cash Cows 100 ETF 123,319 Pacer WealthShield ETF 1,584,842 Pacer Military Times Best Employers ETF —
Pacer Benchmark Industrial Real Estate SCTRSM ETF, Pacer Benchmark Retail Real Estate SCTRSM ETF, Pacer Benchmark Data &Infrastructure Real Estate SCTRSM, Pacer US Export Leaders ETF, and Pacer CFRA-Stovall Equal Weight Seasonal Rotation IndexETF commenced operations after April 30, 2018.
NOTE 3 – COMMITMENTS AND OTHER RELATED PARTY TRANSACTIONS
Pacer Advisors, Inc. (“the Adviser”) serves as the investment adviser to the Funds. Pursuant to an Investment Advisory Agreement (“InvestmentAdvisory Agreement”) between the Trust, on behalf of the Funds, and the Adviser, the Adviser provides investment advice to the Funds andoversees the day-to-day operations of the Funds, subject to the direction and control of the Board and the officers of the Trust. The Adviseradministers the Funds’ business affairs, provides office facilities and equipment and certain clerical, bookkeeping and administrative services. TheAdviser bears the costs of all advisory and non-advisory services required to operate the Funds, in exchange for a single unitary management fee.For services provided to the Funds, Pacer Trendpilot® US Large Cap ETF pays the Adviser 0.60%, Pacer Trendpilot® US Mid Cap ETF pays theAdviser 0.60%, Pacer Trendpilot® 100 ETF pays the Adviser 0.65%, Pacer Trendpilot® European ETF pays the Adviser 0.65%, Pacer GlobalCash Cows Dividend ETF pays the Adviser 0.60%, Pacer US Cash Cows 100 ETF pays the Adviser 0.49%, Pacer US Small Cap Cash Cows 100ETF pays the Adviser 0.59%, Pacer Developed Markets International Cash Cows 100 ETF pays the Adviser 0.65%, Pacer WealthShield ETF paysthe Adviser 0.60%, Pacer Military Times Best Employers ETF pays the Adviser 0.60%, Pacer Benchmark Industrial Real Estate SCTRSM ETFpays the Adviser 0.60%, Pacer Benchmark Retail Real Estate SCTRSM ETF pays the Adviser 0.60%, Pacer Benchmark Data & InfrastructureReal Estate SCTRSM pays the Adviser 0.60%, Pacer US Export Leaders ETF pays the Adviser 0.60%, and Pacer CFRA-Stovall Equal WeightSeasonal Rotation Index ETF pays the Adviser 0.60% at an annual rate based on each Fund’s average daily net assets.
The Distributor acts as the Funds’ principal underwriter in a continuous public offering of the Funds’ shares. The Distributor is an affiliateof the Adviser. The Funds did not pay any fees or commissions to the Distributor during the fiscal period ended October 31, 2018.
Certain officers and a Trustee of the Trust are affiliated with the Adviser and Distributor.
Pacer FundsNOTES TO FINANCIAL STATEMENTSOctober 31, 2018 (Unaudited) (Continued)
87

NOTE 4 – SERVICE AND CUSTODY AGREEMENTS
The Funds have entered into Service Agreements with U.S. Bancorp Fund Services, LLC (“Fund Services” or “Administrator”) doingbusiness as U.S. Global Fund Services and a Custody Agreement with U.S. Bank, N.A., an affiliate of Fund Services. Under theseagreements, Fund Services and U.S. Bank, N.A. provide certain transfer agency, administrative, accounting and custody services.
NOTE 5 – SECURITIES LENDING
Pacer ETF’s may lend up to 33 1/3% of the value of the securities in their portfolios to brokers, dealers and financial institutions (but notindividuals) under terms of participation in a securities lending program administered by the Securities Lending Agent. The securitieslending agreement requires that loans are collateralized at all times in an amount equal to at least 102% of the value of any domestic loanedsecurities at the time of the loan, plus accrued interest. The use of loans of foreign securities, which are denominated and payable in U.S.dollars, shall be collateralized in an amount equal to 105% of the value of any loaned securities at the time of the loan plus accrued interest.The Funds receive compensation in the form of fees and earn interest on the cash collateral. Due to timing issues of when a security isrecalled from loan, the financial statements may differ in presentation. The amount of fees depends on a number of factors including thetype of security and length of the loan. The Funds continue to receive interest payments or dividends on the securities loaned during theborrowing period. Gain or loss in the value of securities loaned that may occur during the term of the loan will be for the account of theFunds. The Funds have the right under the terms of the securities lending agreements to recall the securities from the borrower on demand.
As of October 31, 2018, the Funds had loaned securities and received cash collateral for the loans. The cash collateral is invested in theMount Vernon Liquid Assets Portfolio, LLC of which the investment objective is to seek to maximize income to the extent consistent withthe preservation of capital and liquidity and maintain a stable Net Asset Value (“NAV”) of $1.00. Although risk is mitigated by thecollateral, the Funds could experience a delay in recovering their securities and possible loss of income or value if the borrower fails to returnthe borrowed securities. In addition, the Funds bear the risk of loss associated with the investment of cash collateral received.
During the period ended October 31, 2018, the Funds (excluding Pacer WealthShield ETF, Pacer Military Times Best Employers ETF,Pacer Benchmark Industrial Real Estate SCTRSM ETF, Pacer Benchmark Retail Real Estate SCTRSM ETF, Pacer Benchmark Data &Infrastructure Real Estate SCTRSM, Pacer US Export Leaders ETF, and Pacer CFRA-Stovall Equal Weight Seasonal Rotation Index ETF)had loaned securities that were collateralized by cash. The cash collateral received was invested in securities as listed in each Fund’s Scheduleof Investments. Income earned from these investments is allocated to each Fund based on each Fund’s portion of total cash collateralreceived. Securities lending income is disclosed in each Fund’s Statement of Operations as a securities lending credit.
As of October 31, 2018, the Pacer Trendpilot® US Large Cap ETF and Pacer Trendpilot® European Index ETF were still in the process ofincluding the securities out to loan which resulted in collateral still held on the books.
NOTE 6 – SECURED BORROWINGS
The following represents gross obligations for secured borrowings by remaining time to maturity as of October 31, 2018.
Securities Lending Transactions Investments Purchased with Proceeds Overnight and Continuous from Securities Lending Collateral*_______________________ _______________________________
Pacer Trendpilot® US Large Cap ETF $ 26,157,581Pacer Trendpilot® US Mid Cap ETF 190,038,750Pacer Trendpilot® 100 ETF 18,804,517Pacer Trendpilot® European Index ETF 47,763,750Pacer Global Cash Cows Dividend ETF 38,789,497Pacer US Cash Cows 100 ETF 18,809,270Pacer US Small Cap Cash Cows 100 ETF 2,135,082Pacer Developed Markets International Cash Cows 100 ETF 1,945,516Pacer WealthShield ETF —Pacer Military Times Best Employers ETF —Pacer Benchmark Retail Real Estate SCTRSM ETF —Pacer Benchmark Industrial Real Estate SCTRSM ETF —Pacer Benchmark Data & Infrastructure Real Estate SCTRSM ETF —Pacer US Export Leaders ETF —Pacer CFRA-Stovall Equal Weight Seasonal Rotation ETF —* Proceeds from securities lending (Investments Purchased with Proceeds from Securities Lending Collateral).
Pacer FundsNOTES TO FINANCIAL STATEMENTSOctober 31, 2018 (Unaudited) (Continued)
88

Due to the absence of a master netting agreement related to the Funds’ participation in securities lending, no additional offsettingdisclosures have been made on behalf of the Funds for the total borrowings listed above.
NOTE 7 – OFFSETTING ASSETS AND LIABILITIES
The following is a summary of the Assets and Liabilities for each Fund subject to offsets as of October 31, 2018:
Liabilities Gross Amounts Net Offset
in the Statements of Gross Amounts Net Amounts Assets and Liabilities Gross Offset in the Presented in the ________________________
Amounts of Statement Statements Collateral Recognized of Assets of Assets Financial Pledged NetDescription Liabilities and Liabilities and Liabilities Instruments (Received) Amount__________ __________ _____________ _____________ __________ _________ _______
Pacer Trendpilot® US Large Cap ETFSecurities Lending $ 26,157,581 $ — $ 26,157,581 $ 26,157,581 $ — $ —
Pacer Trendpilot® US Mid Cap ETFSecurities Lending 190,038,750 — 190,038,750 190,038,750 — —
Pacer Trendpilot® 100 ETFSecurities Lending 18,804,517 — 18,804,517 18,804,517 — —
Pacer Trendpilot® European Index ETFSecurities Lending 47,763,750 — 47,763,750 47,763,750 — —
Pacer Global Cash Cows Dividend ETFSecurities Lending 38,789,497 — 38,789,497 38,789,497 — —
Pacer US Cash Cows 100 ETFSecurities Lending 18,809,270 — 18,809,270 18,809,270 — —
Pacer US Small Cap Cash Cows 100 ETFSecurities Lending 2,135,082 — 2,135,082 2,135,082 — —
Pacer Developed Markets International Cash Cows 100 ETFSecurities Lending 1,945,516 — 1,945,516 1,945,516 — —
Pacer WealthShield ETFSecurities Lending — — — — — —
Pacer Military Times Best Employers ETFSecurities Lending — — — — — —
Pacer Benchmark Retail Real Estate SCTRSM ETFSecurities Lending — — — — — —
Pacer Benchmark Industrial Real Estate SCTRSM ETFSecurities Lending — — — — — —
Pacer Benchmark Data & Infrastructure Real Estate SCTRSM ETFSecurities Lending — — — — — —
Pacer US Export Leaders ETFSecurities Lending — — — — — —
Pacer CFRA-Stovall Equal Weight Seasonal Rotation ETFSecurities Lending — — — — — —
Pacer FundsNOTES TO FINANCIAL STATEMENTSOctober 31, 2018 (Unaudited) (Continued)
89

NOTE 8 – INVESTMENT TRANSACTIONS
For the period ended October 31, 2018, the aggregate purchases and sales of securities by the Funds, excluding short-term securities andin-kind transactions, were as follows: Purchases Sales ________ ____
Pacer Trendpilot® US Large Cap ETF $ 28,869,276 $ 18,217,280Pacer Trendpilot® US Mid Cap ETF 58,075,576 54,477,223Pacer Trendpilot® 100 ETF 7,800,766 7,471,245Pacer Trendpilot® European Index ETF 263,085,746 86,451,948Pacer Global Cash Cows Dividend ETF 88,313,451 64,601,127Pacer US Cash Cows 100 ETF 56,303,092 55,953,819Pacer US Small Cap Cash Cows 100 ETF 10,068,235 10,105,955Pacer Developed Markets International Cash Cows 100 ETF 12,164,179 11,296,643Pacer WealthShield ETF 248,687,297 177,573,891Pacer Military Times Best Employers ETF 245,153 5,350Pacer Benchmark Retail Real Estate SCTRSM ETF 3,811,946 925,137Pacer Benchmark Industrial Real Estate SCTRSM ETF 2,914,187 412,362Pacer Benchmark Data & Infrastructure Real Estate SCTRSM ETF 2,852,447 260,143Pacer US Export Leaders ETF 436,860 434,676Pacer CFRA-Stovall Equal Weight Seasonal Rotation ETF — 20,608
For the period ended October 31, 2018, in-kind transactions associated with creations and redemptions are as follows: Purchases Sales ________ ____
Pacer Trendpilot® US Large Cap ETF $641,726,215 $ —Pacer Trendpilot® US Mid Cap ETF 288,686,166 30,826,630Pacer Trendpilot® 100 ETF 135,625,405 5,348,680Pacer Trendpilot® European Index ETF 27,693,254 —Pacer Global Cash Cows Dividend ETF 26,035,944 24,777,821Pacer US Cash Cows 100 ETF 168,892,102 18,710,340Pacer US Small Cap Cash Cows 100 ETF 27,497,530 5,765,947Pacer Developed Markets International Cash Cows 100 ETF 14,682,170 4,075,427Pacer WealthShield ETF 77,728,996 51,216,810Pacer Military Times Best Employers ETF 1,291,087 1,634,795Pacer Benchmark Retail Real Estate SCTRSM ETF 2,426,406 2,657,556Pacer Benchmark Industrial Real Estate SCTRSM ETF 4,988,372 4,957,120Pacer Benchmark Data & Infrastructure Real Estate SCTRSM ETF 3,720,209 2,559,334Pacer US Export Leaders ETF 2,493,995 —Pacer CFRA-Stovall Equal Weight Seasonal Rotation ETF 3,740,401 —
For the period ended October 31, 2018, there were no long-term purchases or sales of U.S. Government Securities for the Funds.
During the fiscal year ended April 30, 2017, Pacer Trendpilot® European Index ETF accepted a cash contribution in the amount of$409,837 to reimburse the Fund from prior securities transactions.
Pacer FundsNOTES TO FINANCIAL STATEMENTSOctober 31, 2018 (Unaudited) (Continued)
90
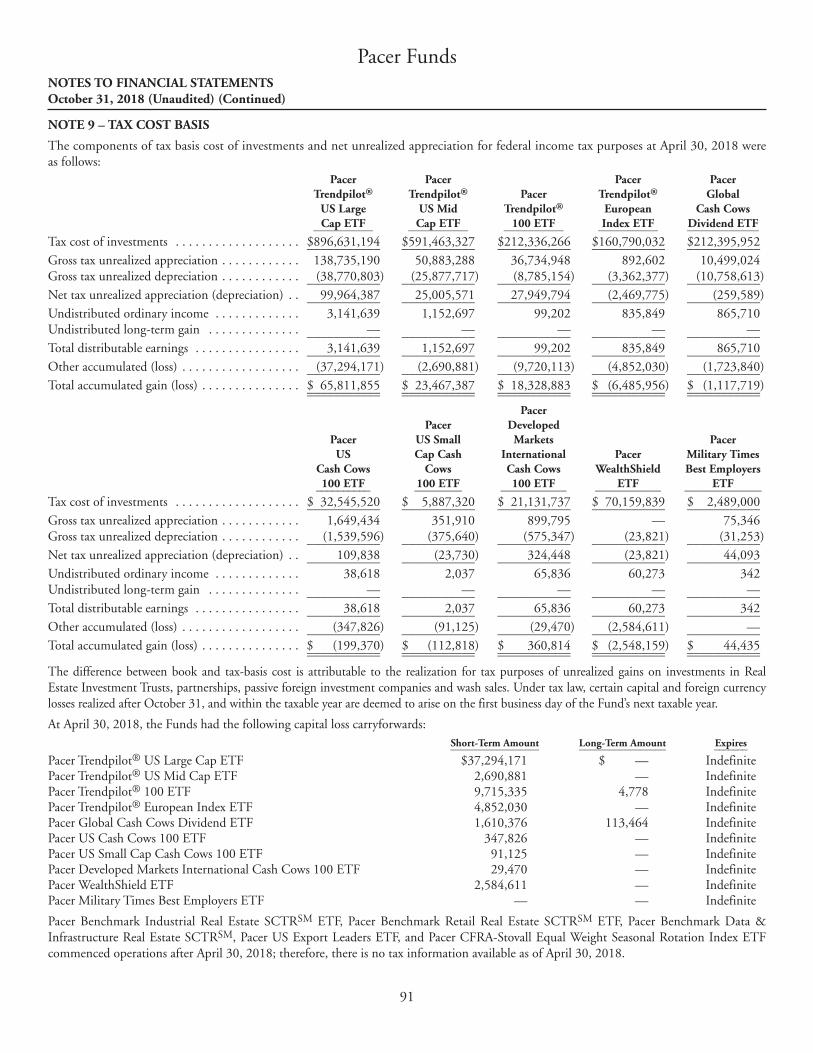
NOTE 9 – TAX COST BASIS
The components of tax basis cost of investments and net unrealized appreciation for federal income tax purposes at April 30, 2018 wereas follows: Pacer Pacer Pacer Pacer Trendpilot® Trendpilot® Pacer Trendpilot® Global US Large US Mid Trendpilot® European Cash Cows Cap ETF Cap ETF 100 ETF Index ETF Dividend ETF __________ __________ __________ __________ ____________Tax cost of investments . . . . . . . . . . . . . . . . . . . $896,631,194 $591,463,327 $212,336,266 $160,790,032 $212,395,952 ___________ ___________ ___________ ___________ ___________Gross tax unrealized appreciation . . . . . . . . . . . . 138,735,190 50,883,288 36,734,948 892,602 10,499,024Gross tax unrealized depreciation . . . . . . . . . . . . (38,770,803) (25,877,717) (8,785,154) (3,362,377) (10,758,613) ___________ ___________ ___________ ___________ ___________Net tax unrealized appreciation (depreciation) . . 99,964,387 25,005,571 27,949,794 (2,469,775) (259,589) ___________ ___________ ___________ ___________ ___________Undistributed ordinary income . . . . . . . . . . . . . 3,141,639 1,152,697 99,202 835,849 865,710Undistributed long-term gain . . . . . . . . . . . . . . — — — — — ___________ ___________ ___________ ___________ ___________Total distributable earnings . . . . . . . . . . . . . . . . 3,141,639 1,152,697 99,202 835,849 865,710 ___________ ___________ ___________ ___________ ___________Other accumulated (loss) . . . . . . . . . . . . . . . . . . (37,294,171) (2,690,881) (9,720,113) (4,852,030) (1,723,840) ___________ ___________ ___________ ___________ ___________Total accumulated gain (loss) . . . . . . . . . . . . . . . $ 65,811,855 $ 23,467,387 $ 18,328,883 $ (6,485,956) $ (1,117,719) ___________ ___________ ___________ ___________ ___________ ___________ ___________ ___________ ___________ ___________
Pacer Pacer Developed Pacer US Small Markets Pacer US Cap Cash International Pacer Military Times Cash Cows Cows Cash Cows WealthShield Best Employers 100 ETF 100 ETF 100 ETF ETF ETF __________ ________ ___________ ___________ _____________Tax cost of investments . . . . . . . . . . . . . . . . . . . $ 32,545,520 $ 5,887,320 $ 21,131,737 $ 70,159,839 $ 2,489,000 ___________ ___________ ___________ ___________ ___________Gross tax unrealized appreciation . . . . . . . . . . . . 1,649,434 351,910 899,795 — 75,346Gross tax unrealized depreciation . . . . . . . . . . . . (1,539,596) (375,640) (575,347) (23,821) (31,253) ___________ ___________ ___________ ___________ ___________Net tax unrealized appreciation (depreciation) . . 109,838 (23,730) 324,448 (23,821) 44,093 ___________ ___________ ___________ ___________ ___________Undistributed ordinary income . . . . . . . . . . . . . 38,618 2,037 65,836 60,273 342Undistributed long-term gain . . . . . . . . . . . . . . — — — — — ___________ ___________ ___________ ___________ ___________Total distributable earnings . . . . . . . . . . . . . . . . 38,618 2,037 65,836 60,273 342 ___________ ___________ ___________ ___________ ___________Other accumulated (loss) . . . . . . . . . . . . . . . . . . (347,826) (91,125) (29,470) (2,584,611) — ___________ ___________ ___________ ___________ ___________Total accumulated gain (loss) . . . . . . . . . . . . . . . $ (199,370) $ (112,818) $ 360,814 $ (2,548,159) $ 44,435 ___________ ___________ ___________ ___________ ___________ ___________ ___________ ___________ ___________ ___________
The difference between book and tax-basis cost is attributable to the realization for tax purposes of unrealized gains on investments in RealEstate Investment Trusts, partnerships, passive foreign investment companies and wash sales. Under tax law, certain capital and foreign currencylosses realized after October 31, and within the taxable year are deemed to arise on the first business day of the Fund’s next taxable year.
At April 30, 2018, the Funds had the following capital loss carryforwards: Short-Term Amount Long-Term Amount Expires _________________ _________________ _______
Pacer Trendpilot® US Large Cap ETF $37,294,171 $ — IndefinitePacer Trendpilot® US Mid Cap ETF 2,690,881 — IndefinitePacer Trendpilot® 100 ETF 9,715,335 4,778 IndefinitePacer Trendpilot® European Index ETF 4,852,030 — IndefinitePacer Global Cash Cows Dividend ETF 1,610,376 113,464 IndefinitePacer US Cash Cows 100 ETF 347,826 — IndefinitePacer US Small Cap Cash Cows 100 ETF 91,125 — IndefinitePacer Developed Markets International Cash Cows 100 ETF 29,470 — IndefinitePacer WealthShield ETF 2,584,611 — IndefinitePacer Military Times Best Employers ETF — — Indefinite
Pacer Benchmark Industrial Real Estate SCTRSM ETF, Pacer Benchmark Retail Real Estate SCTRSM ETF, Pacer Benchmark Data &Infrastructure Real Estate SCTRSM, Pacer US Export Leaders ETF, and Pacer CFRA-Stovall Equal Weight Seasonal Rotation Index ETFcommenced operations after April 30, 2018; therefore, there is no tax information available as of April 30, 2018.
Pacer FundsNOTES TO FINANCIAL STATEMENTSOctober 31, 2018 (Unaudited) (Continued)
91

NOTE 10 – DISTRIBUTIONS TO SHAREHOLDERS
The tax character of distributions paid by the Funds during the fiscal year/period ended October 31, 2018 was as follows: Ordinary Income Capital Gains Return of Capital _______________ ____________ _________________
Pacer Trendpilot® US Large Cap ETF $ — $ — $ —Pacer Trendpilot® US Mid Cap ETF — — —Pacer Trendpilot® 100 ETF — — —Pacer Trendpilot® European Index ETF — — —Pacer Global Cash Cows Dividend ETF 3,879,656 — —Pacer US Cash Cows 100 ETF 696,950 — —Pacer US Small Cap Cash Cows 100 ETF 90,512 — —Pacer Developed Markets International Cash Cows 100 ETF 374,484 — —Pacer WealthShield ETF 518,596 — —Pacer Military Times Best Employers ETF 15,501 — —Pacer Benchmark Retail Real Estate SCTRSM ETF 42,486 — —Pacer Benchmark Industrial Real Estate SCTRSM ETF 27,411 — —Pacer Benchmark Data & Infrastructure Real Estate SCTRSM ETF 31,232 — —Pacer US Export Leaders ETF 2,225 — —Pacer CFRA-Stovall Equal Weight Seasonal Rotation ETF 4,847 — —
The tax character of distributions paid by the Funds during the fiscal year/period ended April 30, 2018 was as follows: Ordinary Income Capital Gains Return of Capital _______________ ____________ _________________
Pacer Trendpilot® US Large Cap ETF $7,017,355 $ — $ —Pacer Trendpilot® US Mid Cap ETF 2,882,696 — —Pacer Trendpilot® 100 ETF 466,293 — —Pacer Trendpilot® European Index ETF 538,237 — —Pacer Global Cash Cows Dividend ETF 3,669,616 — —Pacer US Cash Cows 100 ETF 319,520 — —Pacer US Small Cap Cash Cows 100 ETF 34,114 — —Pacer Developed Markets International Cash Cows 100 ETF 70,528 — —Pacer WealthShield ETF 112,441 — —Pacer Military Times Best Employers ETF — — —
NOTE 11 – NEW ACCOUNTING PRONOUNCEMENTS
In August 2018, FASB issued ASU 2018-13, Fair Value Measurement (Topic 820): Disclosure Framework—Changes to the DisclosureRequirements for Fair Value Measurement (“ASU 2018-13”). The primary focus of ASU 2018-13 is to improve the effectiveness of thedisclosure requirements for fair value measurements. The changes affect all companies that are required to include fair value measurementdisclosures. In general, the amendments in ASU 2018-13 are effective for all entities for fiscal years and interim periods within those fiscalyears, beginning after December 15, 2019. An entity is permitted to early adopt the removed or modified disclosures upon the issuance ofASU 2018-13 and may delay adoption of the additional disclosures, which are required for public companies only, until their effective date.Management has evaluated the ASU 2018-13 and has adopted the disclosure framework.
NOTE 12 – SUBSEQUENT EVENT
Management of the Funds has evaluated the need for disclosures and/or adjustments resulting from subsequent events through the datethese financial statements were issued. The evaluation did not result in any subsequent events that necessitated disclosures and/oradjustments other than below.
Pacer FundsNOTES TO FINANCIAL STATEMENTSOctober 31, 2018 (Unaudited) (Continued)
92

On December 21, 2018, the following Funds declared distributions from ordinary income to shareholders of record as of December 26,2018 payable December 27, 2018, as follows: Ordinary Income Per Share Amount _______________ __________________
Pacer Trendpilot® US Large Cap ETF $14,704,858 $0.28664441Pacer Trendpilot® US Mid Cap ETF $ 5,930,872 $0.27521448Pacer Trendpilot® 100 ETF $ 1,575,175 $0.14790376Pacer Trendpilot® European Index ETF $ 2,870,463 $0.46674195Pacer Global Cash Cows Dividend ETF $ 1,694,789 $0.25678622Pacer US Cash Cows 100 ETF $ 949,756 $0.14500092Pacer US Small Cap Cash Cows 100 ETF $ 78,657 $0.10487600Pacer Developed Markets International Cash Cows 100 ETF $ 216,964 $0.20663238Pacer WealthShield ETF $ 255,793 $0.06821150Pacer Military Times Best Employers ETF $ 9,372 $0.09372000Pacer Benchmark Retail Real Estate SCTRSM ETF $ 34,528 $0.34528000Pacer Benchmark Industrial Real Estate SCTRSM ETF $ 15,970 $0.15970000Pacer Benchmark Data & Infrastructure Real Estate SCTRSM ETF $ 37,013 $0.18506500Pacer US Export Leaders ETF $ 3,779 $0.03779000Pacer CFRA-Stovall Equal Weight Seasonal Rotation ETF $ 10,983 $0.10983000
Pacer FundsNOTES TO FINANCIAL STATEMENTSOctober 31, 2018 (Unaudited) (Continued)
93

NOTE 1 – FREQUENCY DISTRIBUTION OF PREMIUMS AND DISCOUNTS
Information regarding how often shares of each other Fund traded on the Exchange at a price above (i.e., at a premium) or below (i.e., at adiscount) the NAV of the Fund is available on the Funds’ website at www.PacerETFs.com.
NOTE 2 – FEDERAL TAX INFORMATION
Qualified Dividend Income/Dividends Received Deduction
For the fiscal year/period ended April 30, 2018, certain dividends paid by the Funds may be subject to a maximum tax rate of 15%, asprovided for by the Jobs and Growth Tax Relief Reconciliation Act of 2003.
The percentage of dividends declared from ordinary income designated as qualified dividend income was as follows:
Pacer Trendpilot® US Large Cap ETF 100.00%Pacer Trendpilot® US Mid Cap ETF 100.00%Pacer Trendpilot® 100 ETF 100.00%Pacer Trendpilot® European Index ETF 96.34%Pacer Global Cash Cows Dividend ETF 92.40%Pacer US Cash Cows 100 ETF 95.7%Pacer US Small Cap Cash Cows 100 ETF 100.00%Pacer Developed Markets International Cash Cows 100 ETF 100.00%Pacer WealthShield ETF 72.06%Pacer Military Times Best Employers ETF 0.00%
For corporate shareholders, the percent of ordinary income distributions qualifying for the corporate dividends received deduction for thefiscal year/period ended April 30, 2018 was as follows:
Pacer Trendpilot® US Large Cap ETF 100.00%Pacer Trendpilot® US Mid Cap ETF 100.00%Pacer Trendpilot® 100 ETF 100.00%Pacer Trendpilot® European Index ETF 0.00%Pacer Global Cash Cows Dividend ETF 29.78%Pacer US Cash Cows 100 ETF 96.20%Pacer US Small Cap Cash Cows 100 ETF 100.00%Pacer Developed Markets International Cash Cows 100 ETF 0.00%Pacer WealthShield ETF 72.06%Pacer Military Times Best Employers ETF 0.00%
Short Term Capital Gains
The percentage of taxable ordinary income distributions that are designated as short-term capital gain distributions under Internal RevenueSection 871(k)(2)(C) for each fund were as follows:
Pacer Trendpilot™ 750 ETF 0.00%Pacer Trendpilot™ 450 ETF 0.00%Pacer Trendpilot™ 100 ETF 0.00%Pacer Trendpilot™ European ETF 0.00%Pacer Global Cash Cows Dividend ETF 0.00%Pacer US Cash Cows 100 ETF 0.00%Pacer US Small Cap Cash Cows 100 ETF 0.00%Pacer Developed Markets International Cash Cows 100 ETF 0.00%Pacer WealthShield ETF 0.00%Pacer Military Times Best Employers ETF 0.00%
NOTE 3 – DISCLOSURE OF PORTFOLIO HOLDINGS
The Funds file their complete schedule of portfolio holdings for their first and third fiscal quarters with the Securities and ExchangeCommission (“SEC”) on Form N-Q. The Funds’ Form N-Q is available on the website of the SEC at http://www.sec.gov. Each Fund’sportfolio holdings are posted on their website at www.paceretfs.com daily.
Pacer FundsADDITIONAL INFORMATION(Unaudited)
94

NOTE 4 – PROXY VOTING POLICIES AND PROCEDURES
A description of the policies and procedures the Funds use to determine how to vote proxies relating to portfolio securities is provided inthe Statement of Additional Information (“SAI”). The SAI is available without charge upon request by calling toll-free at (800) 617-0004,by accessing the SEC’s website at http://www.sec.gov, or by accessing the Funds’ website at www.paceretfs.com. Information on how theFund voted proxies relating to portfolio securities during the year ended June 30 is available without charge, upon request, by calling(800) 617-0004 or by accessing the website of the SEC.
NOTE 5 – BOARD CONSIDERATIONS IN APPROVING THE INVESTMENT ADVISORY AGREEMENT FOR THE FUNDS
Pacer US Export Leaders ETF and Pacer CFRA-Stovall Equal Weight Seasonal Rotation ETF
The Board of Trustees (the “Board”) of Pacer Funds Trust (the “Trust”), including the Trustees who are not “interested persons,” as definedby the Investment Company Act of 1940, as amended, of the Trust (the “Independent Trustees”), at in-person meetings held on March 12,2018 and June 18, 2018 (each a “Meeting”), called for the purpose of, among other things, considering and voting on the investmentadvisory agreement (the “Investment Advisory Agreement”) between the Trust and Pacer Advisors, Inc. (the “Advisor”) relating to the PacerUS Export Leaders ETF (“Export ETF”) and the Pacer CFRA-Stovall Equal Weight Seasonal Rotation ETF (“Stovall ETF”), respectively(each a “Fund” and, collectively, the “Funds”). At each Meeting, the Board, including all of the Trust’s Independent Trustees votingseparately, unanimously approved the Investment Advisory Agreement as to the subject Fund based on its review of qualitative andquantitative information provided by the Advisor and the Trust’s other service providers.
Prior to approving the Investment Advisory Agreement as to each Fund, the Independent Trustees requested and obtained from the Advisorsuch information as the Independent Trustees deemed reasonably necessary to evaluate the terms of the Investment Advisory Agreement.The Independent Trustees received assistance and advice from and met separately with independent counsel. In addition, the IndependentTrustees received a memorandum from independent counsel regarding the responsibilities of the Board with respect to the approval ofinvestment advisory agreements. Prior to each Meeting, the Board obtained and reviewed a variety of information, including certaincomparative information regarding each Fund’s proposed expenses relative to the expenses of other comparable funds.
At each Meeting, the Board, including the Independent Trustees, evaluated a number of factors and various materials, including: (1) a copyof the Investment Advisory Agreement; (2) the Advisor’s responses to a questionnaire designed to provide the Board with informationreasonably necessary to evaluate the terms of the Investment Advisory Agreement as to the subject Fund; (3) the Advisor’s Form ADVdisclosures; (4) information describing the nature, quality and extent of services that the Advisor is prepared in the future to provide to thesubject Fund, and the advisory fees payable to the Advisor for its services with respect to that Fund; (5) certain comparative informationregarding each Fund’s expenses relative to the expenses of other funds; (6) a copy of the Trust’s registration statement; and (7) informationregarding the financial condition of the Advisor. Representatives from the Advisor presented additional information and participated inquestion and answer sessions at each Meeting to help the Board evaluate the Advisor’s services, fees and other aspects of the InvestmentAdvisory Agreement.
In considering whether to approve the Investment Advisory Agreement as to each Fund, the Board considered various factors that itdetermined were relevant, including: (i) the nature, extent and quality of the services to be provided by the Advisor; (ii) the fee to be paid tothe Advisor; and (iii) potential economies of scale, as discussed in further detail below.
• Nature, Extent and Quality of Services to be Provided by the Advisor. The Board reviewed the scope of services provided bythe Advisor under the Investment Advisory Agreement and determined that the Advisor has been providing and is capable ofproviding in the future all necessary advisory services required by each Fund, as indicated by the firm’s management capabilitiesand the professional qualifications and experience of its portfolio management personnel. The Board also considered otherservices to be provided to each Fund by the Advisor, such as selecting broker-dealers for executing portfolio transactions,monitoring adherence to the Fund’s investment restrictions, and monitoring compliance with various policies and procedures andwith applicable securities regulations. Based on the factors above, as well as those discussed below, the Board concluded, withinthe context of its full deliberations, that it was satisfied with the nature, extent and quality of the services to be provided to eachFund by the Advisor.
• Costs of Services to be Provided to the Funds and Profitability. In considering the advisory fees payable by each Fund to theAdvisor and each Fund’s expense ratio, the Board reviewed data compiled by the Advisor from an unaffiliated third partyproprietary database comparing the expense ratios and performance of each Fund with the expense ratios and performance ofother ETFs having similar investment objectives (each Fund’s “Peer Group”). The Board compared each Fund’s expense ratio tothe expense ratios of ETFs in the Fund’s Peer Group, and noted that the Advisor had contractually agreed to pay all operatingexpenses of each Fund, including the cost of transfer agency, custody, fund administration, legal, audit and other services, exceptinterest, taxes, brokerage commissions and other expenses in connection with the execution of portfolio transactions, and
Pacer FundsADDITIONAL INFORMATION(Unaudited) (Continued)
95

extraordinary and non-routine expenses. It was noted that this contractual agreement cannot be changed without shareholderapproval. The Board also evaluated the compensation and benefits received by the Advisor from its relationship with each Fund,taking into account assessments of the Advisor’s anticipated profitability at different asset levels. Based on the factors above, aswell as those discussed below, the Board concluded, within the context of its full deliberations at each Meeting, that each Fund’sadvisory fee was reasonable in light of the nature and quality of the services expected to be rendered by the Advisor.
• Economies of Scale. The Board also reviewed and considered the extent to which economies of scale would be realized by theAdvisor as the assets of each Fund grew or may grow in the future.
Based on its deliberations and its evaluation of the information described above at each Meeting, the Board, including the IndependentTrustees, unanimously: (a) concluded that the terms of the Investment Advisory Agreement with respect to each Fund were fair andreasonable; (b) concluded that the Advisor’s fees are reasonable in light of the nature and quality of the services expected to be rendered bythe Advisor to each Fund; and (c) agreed to approve the Investment Advisory Agreement as to each Fund for an initial term of two years.In its deliberations, the Board did not identify any particular factor (or conclusion with respect thereto) or single piece of information thatwas all-important, controlling or determinative of its decision, but considered all of the factors together, and each Trustee may haveattributed different weights to the various factors (and conclusions with respect thereto) and information.
Pacer Benchmark Retail Real Estate SCTRSM ETF, Industrial Real Estate SCTRSM ETF, and Data & Infrastructure Real EstateSCTRSM ETF
The Board of Trustees (the “Board”) of Pacer Funds Trust (the “Trust”), including the Trustees who are not “interested persons,” as definedby the Investment Company Act of 1940, of the Trust (the “Independent Trustees”), held an in-person meeting on March 12, 2018 (the“Meeting”) for the purpose of, among other things, the consideration of, and voting on, the proposed approval of the Investment AdvisoryAgreement between the Trust and the Advisor relating to the Pacer Benchmark Retail Real Estate SCTRSM ETF, Industrial Real EstateSCTRSM ETF, and Data & Infrastructure Real Estate SCTRSM ETF (together, the “New Pacer Funds”). The Board, including all of theTrust’s Independent Trustees voting separately, unanimously approved the Investment Advisory Agreement based on its review of qualitativeand quantitative information provided by the Advisor and the Trust’s other service providers.
Prior to deciding to approve or renew, as applicable, the Investment Advisory Agreement, the Independent Trustees requested and obtainedfrom the Advisor such information as the Independent Trustees deemed reasonably necessary to evaluate the terms of the InvestmentAdvisory Agreement. The Independent Trustees received assistance and advice from and met separately with independent counsel. Inaddition, the Independent Trustees received a memorandum from independent counsel regarding the responsibilities of the Board withrespect to the approval or renewal of the Investment Advisory Agreement. Prior to the Meeting, the Board obtained and reviewed a varietyof information, including certain comparative information regarding the Fund’s expenses (both actual and, where relevant, proposed),relative to the expenses of other comparable funds.
At the Meeting, the Board, including the Independent Trustees, evaluated a number of factors and various materials in connection with theapproval process, including: (1) a copy of the Investment Advisory Agreement; (2) the Advisor’s responses to questionnaires designed toprovide the Board with information reasonably necessary to evaluate the terms of the Investment Advisory Agreement; (3) the Advisor’sForm ADV disclosures;(4) information describing the nature, quality and extent of services that the Advisor, where relevant, has providedand is prepared in the future to provide to each Fund, and the advisory fees payable to the Advisor for its services; (5) certain comparativeinformation regarding the Funds’ expenses relative to the expenses of other funds; (6) a copy of the Trust’s registration statement; and(7) information regarding the financial condition of the Advisor. Representatives from the Advisor presented additional information andparticipated in question and answer sessions at the Meeting to help the Board evaluate the Advisor’s services, fees and other aspects of theInvestment Advisory Agreement.
In considering the continuation and/or approval, respectively, of the Investment Advisory Agreement, the Board considered various factorsthat they determined were relevant, including: (i) the nature, extent and quality of the services to be provided by the Advisor; (ii) the fee tobe paid to the Advisor; and (iii) potential economies of scale, as discussed in further detail below.
• Nature, Extent and Quality of Services to be Provided by the Advisor. The Board reviewed the scope of services provided bythe Advisor under the Investment Advisory Agreement and determined that the Advisor has been providing, where relevant, and iscapable of providing in the future all necessary advisory services required by the Funds, as indicated by the firm’s managementcapabilities and the professional qualifications and experience of its portfolio management personnel. The Board also consideredother services provided or to be provided to the Funds by the Advisor, such as selecting broker-dealers for executing portfoliotransactions, monitoring adherence to the Fund’s investment restrictions, and monitoring compliance with various policies andprocedures and with applicable securities regulations. Based on the factors above, as well as those discussed below, the Boardconcluded, within the context of its full deliberations, that it was satisfied with the nature, extent and quality of the servicesprovided and to be provided to the Funds by the Advisor.
Pacer FundsADDITIONAL INFORMATION(Unaudited) (Continued)
96
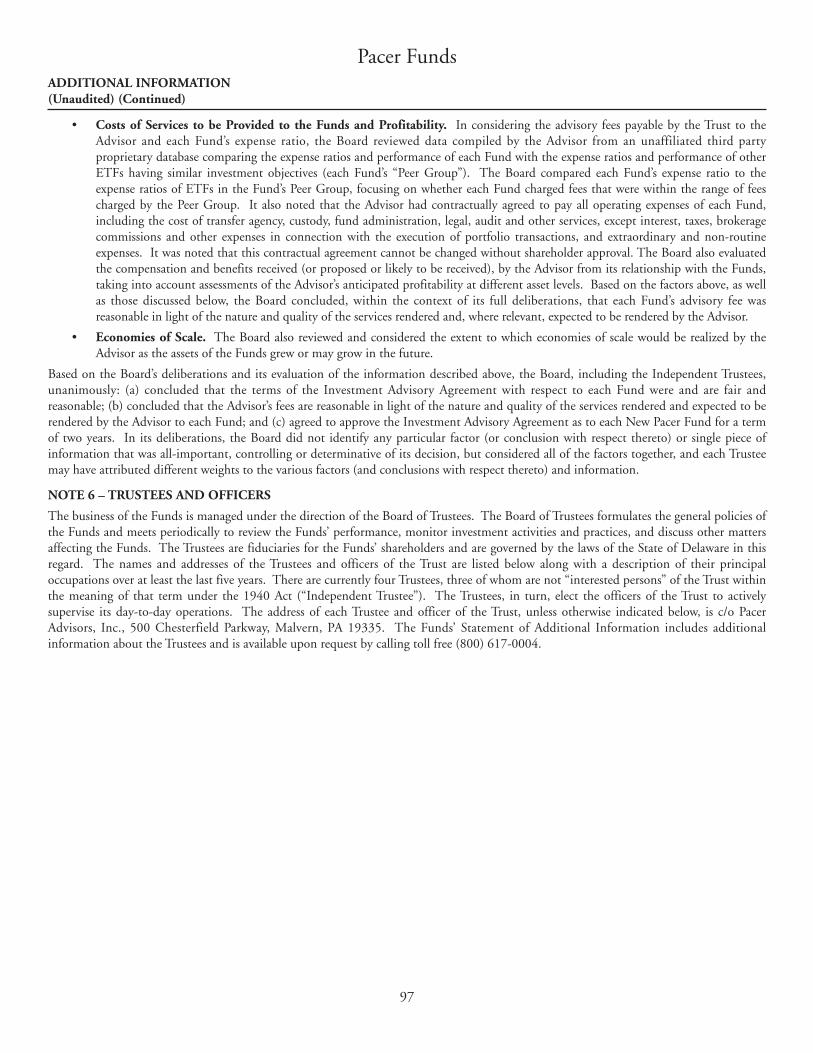
• Costs of Services to be Provided to the Funds and Profitability. In considering the advisory fees payable by the Trust to theAdvisor and each Fund’s expense ratio, the Board reviewed data compiled by the Advisor from an unaffiliated third partyproprietary database comparing the expense ratios and performance of each Fund with the expense ratios and performance of otherETFs having similar investment objectives (each Fund’s “Peer Group”). The Board compared each Fund’s expense ratio to theexpense ratios of ETFs in the Fund’s Peer Group, focusing on whether each Fund charged fees that were within the range of feescharged by the Peer Group. It also noted that the Advisor had contractually agreed to pay all operating expenses of each Fund,including the cost of transfer agency, custody, fund administration, legal, audit and other services, except interest, taxes, brokeragecommissions and other expenses in connection with the execution of portfolio transactions, and extraordinary and non-routineexpenses. It was noted that this contractual agreement cannot be changed without shareholder approval. The Board also evaluatedthe compensation and benefits received (or proposed or likely to be received), by the Advisor from its relationship with the Funds,taking into account assessments of the Advisor’s anticipated profitability at different asset levels. Based on the factors above, as wellas those discussed below, the Board concluded, within the context of its full deliberations, that each Fund’s advisory fee wasreasonable in light of the nature and quality of the services rendered and, where relevant, expected to be rendered by the Advisor.
• Economies of Scale. The Board also reviewed and considered the extent to which economies of scale would be realized by theAdvisor as the assets of the Funds grew or may grow in the future.
Based on the Board’s deliberations and its evaluation of the information described above, the Board, including the Independent Trustees,unanimously: (a) concluded that the terms of the Investment Advisory Agreement with respect to each Fund were and are fair andreasonable; (b) concluded that the Advisor’s fees are reasonable in light of the nature and quality of the services rendered and expected to berendered by the Advisor to each Fund; and (c) agreed to approve the Investment Advisory Agreement as to each New Pacer Fund for a termof two years. In its deliberations, the Board did not identify any particular factor (or conclusion with respect thereto) or single piece ofinformation that was all-important, controlling or determinative of its decision, but considered all of the factors together, and each Trusteemay have attributed different weights to the various factors (and conclusions with respect thereto) and information.
NOTE 6 – TRUSTEES AND OFFICERS
The business of the Funds is managed under the direction of the Board of Trustees. The Board of Trustees formulates the general policies ofthe Funds and meets periodically to review the Funds’ performance, monitor investment activities and practices, and discuss other mattersaffecting the Funds. The Trustees are fiduciaries for the Funds’ shareholders and are governed by the laws of the State of Delaware in thisregard. The names and addresses of the Trustees and officers of the Trust are listed below along with a description of their principaloccupations over at least the last five years. There are currently four Trustees, three of whom are not “interested persons” of the Trust withinthe meaning of that term under the 1940 Act (“Independent Trustee”). The Trustees, in turn, elect the officers of the Trust to activelysupervise its day-to-day operations. The address of each Trustee and officer of the Trust, unless otherwise indicated below, is c/o PacerAdvisors, Inc., 500 Chesterfield Parkway, Malvern, PA 19335. The Funds’ Statement of Additional Information includes additionalinformation about the Trustees and is available upon request by calling toll free (800) 617-0004.
Pacer FundsADDITIONAL INFORMATION(Unaudited) (Continued)
97

Number of Portfolios Other Term of in Fund Directorships Position(s) Office and Complex held by Held with Length of Principal Occupation(s) Overseen Trustee During Name and Year of Birth the Trust Time Served During Past 5 Years By Trustee Past Five Years____________________ _________ ___________ ____________________ _________ _____________
Interested Trustee
Joe M. Thomson Trustee , Indefinite Term; Founder/President at Pacer Advisors, 15 Director, First Born: 1944 Chairman, since 2014 Inc. (since 2005); President and Chief Cornerstone Bank President and Compliance Officer, Pacer Financial, (2000-2016) Principal Inc. (since 2004) Executive Officer
Independent Trustees
Deborah G. Wolk Lead Indefinite Term; Self-employed providing accounting 15 NoneBorn: 1950 Independent since 2015 services and computer modeling Trustee (since 1997)
Jonathan H. Newman, Sr. Trustee Indefinite Term; CEO and Chairman, Newman Wine 15 NoneBorn: 1962 since 2015 & Spirits (since 2007)
Dennis J. Ryan Trustee Indefinite Term; Principal/Owner, Brendan Abstract 15 NoneBorn: 1947 since 2017 Company, Inc. (title insurance) (since 1999)
Officers who are not Trustees:
Sean E. O’Hara Treasurer Indefinite Term; Director, Index Design Group (since N/A NoneBorn: 1962 and since 2014 2015); Director, Pacer Financial, Inc. Principal (since 2007); Director, Pacer Advisors, Financial Inc. (since 2007) Officer
Bruce Kavanaugh Secretary Indefinite Term; Vice President, Pacer Advisors, Inc. N/A NoneBorn: 1964 since 2016 (since 2004), Vice President, Pacer Financial, Inc. (since 2004)
Perpetua Seidenberg Chief Indefinite Term; Compliance Director, Vigilant N/A NoneGateway Corporate Compliance since 2018 Compliance, LLC (an investment Center, Suite 216 Officer management services company) (since
223 Wilmington and AML 2014); Auditor, PricewaterhouseCoopers West Chester Pike Officer (since 2012)
Chadds Ford, PA 19317Born: 1990
Mr. Thomson is an “Interested Person” by reason of his relationship with the Adviser.
Each Trustee shall serve during the lifetime of the Trust until he or she: (a) dies; (b) resigns; (c) has reached the mandatory retirement age, ifany, as set by the Trustees; (d) is declared incompetent by a court of appropriate jurisdiction; or (e) is removed, or, if sooner, until the nextmeeting of shareholders called for the purpose of electing Trustees and until the election and qualification of his or her successor inaccordance with the Trust’s Declaration of Trust and By-laws. Each officer holds office at the pleasure of the Board and services for a periodof one year, or until his or her successor is duly elected and qualified.
The Statement of Additional Information includes additional information, including compensation, about the Funds’ Trustees.
Pacer FundsADDITIONAL INFORMATION(Unaudited) (Continued)
98

(This Page Intentionally Left Blank.)


AdvisorPacer Advisors, Inc.500 Chesterfield ParkwayMalvern, PA 19355
Index ProviderIndex Design Group, LLC 500 Chesterfield ParkwayMalvern, PA 19355
Nasdaq Global IndexesOne Liberty Plaza165 BroadwayNew York, NY 10006
S&P Dow Jones Indices, LLC55 Water StreetNew York, NY 10041
DistributorPacer Financial, Inc.500 Chesterfield ParkwayMalvern, PA 19355
CustodianU.S. Bank National Association Custody Operations1555 North Rivercenter Drive Milwaukee, WI 53212
Transfer AgentU.S. Bancorp Fund Services, LLC 615 East Michigan Street Milwaukee, WI 53202
Independent RegisteredPublic Accounting FirmSanville & Company1514 Old York Rd.Abington, PA 19001
Legal CounselDLA Piper LLP1650 Market St., Suite 4900 Philadelphia, PA 19103-7300
PACER US PACER US SMALL PACER DEVELOPED PACER PACER MILITARYCASH COWS CAP CASH COWS MARKETS INTERNATIONAL WEALTHSHIELD TIMES BEST100 ETF 100 ETF CASH COWS 100 ETF ETF EMPLOYERS ETF
COWZ CALF ICOW PWS VETSCUSIP CUSIP CUSIP CUSIP CUSIP 69374H881 69374H857 69374H873 69374H840 69374H832
PACER PACER PACER PACER PACER GLOBALTRENDPILOT® TRENDPILOT® TRENDPILOT® TRENDPILOT® CASH COWSUS LARGE CAP ETF US MID CAP ETF 100 ETF EUROPEAN INDEX ETF DIVIDEND ETF
PTLC PTMC PTNQ PTEU GCOWCUSIP CUSIP CUSIP CUSIP CUSIP 69374H105 69374H204 69374H303 69374H808 69374H709
PACER BENCHMARK PACER BENCHMARK PACER BENCHMARK PACER US PACER CFRA-STOVALLRETAIL REAL INDUSTRIAL REAL DATA & INFRASTRUCTURE EXPORT LEADERS EQUAL WEIGHT ESTATE SCTRSM ETF ESTATE SCTRSM ETF REAL ESTATE SCTRSM ETF ETF SEASONAL ROTATION ETF
RTL INDS SRVR PEXL SZNECUSIP CUSIP CUSIP CUSIP CUSIP 69374H782 69374H766 69374H741 69374H402 69374H691