semiconductor integrated circuit manufacturing: very complex process hundreds of operations several...
TRANSCRIPT


Semiconductor integrated circuit manufacturing: Very complex process Hundreds of operations Several hundred sets of tools Price of tools is very high
($1- $10 million) Accurate capacity planning is
very critical

Chemical Clean Oxidation Photolithography Chemical Etch Ion Implant Metal/Insulator
Deposition Anneal

Need to plan capacity one year in advance of the expected demand
Find the best product mix with existing capacity
Assessing tool capacity by product mix (a complex process)
Current planning approach not very efficient (spreadsheets, simulations)

Helps identify tool capacity required to meet the demand
Helps volume mix of products to maximize profit

Solver: IBM Optimization Solutions and Library (OSL) on a Unix server
Graphical User Interface on a PC client Input data automatically formatted and
downloaded from tool-planning database Variables: 3,500 – 5,500 Constraints: 1,600 – 2,400 Products: 1 – 40 Solution time: 18 – 30 seconds

Many scenarios can be analysed in hours versus days
10s of millions of Dollars in savings Comprehensive reports enabling
analysis Enables a quick utilization of
scenarios to maximum capacity

50 Products, each 400 to 600 operations Tools; same operations, different speeds 100s Tool Groups (identical tools) Parallel, unrelated T.G. T.G. with common operations: Cascade T.G. w/o common operations: NonCascade Identify bottlenecks or gating T.G. Preferred order of T.G. in C.G.

TG 1
TG 2
TG 3
1, 2
, 7, 8
1, 2, 5, 6
1, 2, 3, 4
9, 10
11
12

TG 4
13, 15, 18, 19 14, 16,
17
TG 5


ti iCt
innp
pp fZfZQw ˆˆ0
Pp gTt tsg
tttsgsgpp R
ANfUw
,,,,,, mgggSs ,......2,1,
gTtg gSs
tsgt ff:
,,ˆ
TCt
nnp
nnpp ANfVw ˆ, NCn
ppp XwM
Maxs.t.

# Cascade Tool Groups = 3 # Operations in C.G. = 12 (1,…, 12) # Non-Cascade Tools = 2 # Operation in N-C.G = 7 (13,…, 19) # Products = 3 Available time = 480 Min./Day # Variables = 306 # Constraints = 109 Solution Time < 1.0 Sec.

Cascade Gr. Index
Operation Cascade Gr.
Tool Cascade Gr.
1 1, 2 T1, T2, T3
2 3, 4 T1, T2
3 5, 6 T1, T3
4 7, 8 T2, T3
5 9, 10 T1
6 11 T2
7 12 T3

Operation Group index
TG 1 ratio
TG 2 ratio
TG 3ratio
1 1 1 1.8 2
2 1 1 1.5 2.25
3 2 1 0.5
4 2 1 2
5 3 1 1.5
6 3 1 0.75
7 4 1 1.67
8 4 1 1.25
9 5 1
10 5 1
11 6 1
12 7 1

Operation Product 1 Product 2 Product 3
1 10 - -
2 12 8 20
3 - 7 14
4 - 5 18
5 15 10 -
6 - 8 -
7 6 - -
8 4 - 9
9 - 11 6
10 - 8 -
11 - - 10

Operation Product 1 Product 2 Product 3
13 7 - 10
14 8 6 10
15 - 4 2
16 10 12 16
17 - 5 -
18 9 - -
19 - - 8

Tool 1
Tool 2
Tool 3
Tool 4
Tool 5
No. 3 6 13 7 5
Opt.No.
3 6 13 7 5
Forecast Demand
24 40 20 Total
Min. Demand
16 30 18 -
Max. Demand
50 80 40 -
Optimal Demand
16 68 18 -
Forecast Profit
192 360 120 672
Opt. Profit
128 612 108 848
Tool Util. Comparison
1.00
0
1.00
0
0.24
0
0.28
1
0.83
0
1.00
0
1.00
0
0.55
8
0.26
4
1.00
0
0
0.2
0.4
0.6
0.8
1
1.2
Tool1 Tool 2 Tool 3 Tool 4 Tool 5
Tool Groups
Utili
lizat
ion
First Run Optimum

Tool 1
Tool 2
Tool 3
Tool 4
Tool 5
No. 3 6 13 7 5
Rq.No.
6 6 13 7 8
Forecast Demand
34 64 50 Total
Min. Demand
25 48 34 -
Max. Demand
45 80 65 -
Optimal Demand
45 80 37 -
Forecast Profit
272 576 300 1148
Opt. Profit
360 720 223 1303
Tool Util. Comparison
1.75
9
1.00
1
1.00
1
0.53
6
1.48
1
1.00
0
1.00
0
0.51
6
0.53
6
0.92
6
1.00
0
1.00
0
0.66
0
0.53
0
1.00
0
0
0.2
0.4
0.6
0.8
1
1.2
1.4
1.6
1.8
2
Tool1 Tool 2 Tool 3 Tool 4 Tool 5
Tool Groups
Utilil
izatio
n
First Run Second Run Optimum

Tool 1
Tool 2
Tool 3
Tool 4
Tool 5
No. 3 6 13 7 5
Opt.No.
3 6 13 7 6
Forecast Demand
25 48 34 Total
Min. Demand
20 43 30 -
Max. Demand
60 80 65 -
Optimal Demand
24.99 66.32 30 -
Forecast Profit
200 432 204 836
Opt. Profit
199.9 596.8 180 976.7
Tool Util. Comparison
1.00
0
1.00
0
0.70
6
0.37
9
1.06
8
1.00
0
1.00
0
0.71
0
0.37
9
0.89
01.00
0
1.00
0
0.95
3
0.37
7
1.00
0
0
0.2
0.4
0.6
0.8
1
1.2
Tool1 Tool 2 Tool 3 Tool 4 Tool 5
Tool Groups
Utilil
izatio
n
First Run Second Run Optimum

Tool 1
Tool 2
Tool 3
Tool 4
Tool 5
No. 3 6 13 7 5
Opt.No.
4 6 13 7 7
Forecast Demand
30 55 40 Total
Min. Demand
30 55 40 -
Max. Demand
60 100 80 -
Optimal Demand
30 91.7 40 -
Forecast Profit
240 495 240 975
Opt. Profit
240 825 240 1305
Tool Util. Comparison
1.07
8
1.00
1
1.00
1
0.44
6
1.24
8
1.00
0
1.00
0
0.18
8
0.44
6
0.78
0
1.00
0
1.00
0
0.66
8
0.49
0
1.00
0
0
0.2
0.4
0.6
0.8
1
1.2
1.4
Tool1 Tool 2 Tool 3 Tool 4 Tool 5
Tool Groups
Utilil
izatio
n
First Run Second Run Optimum
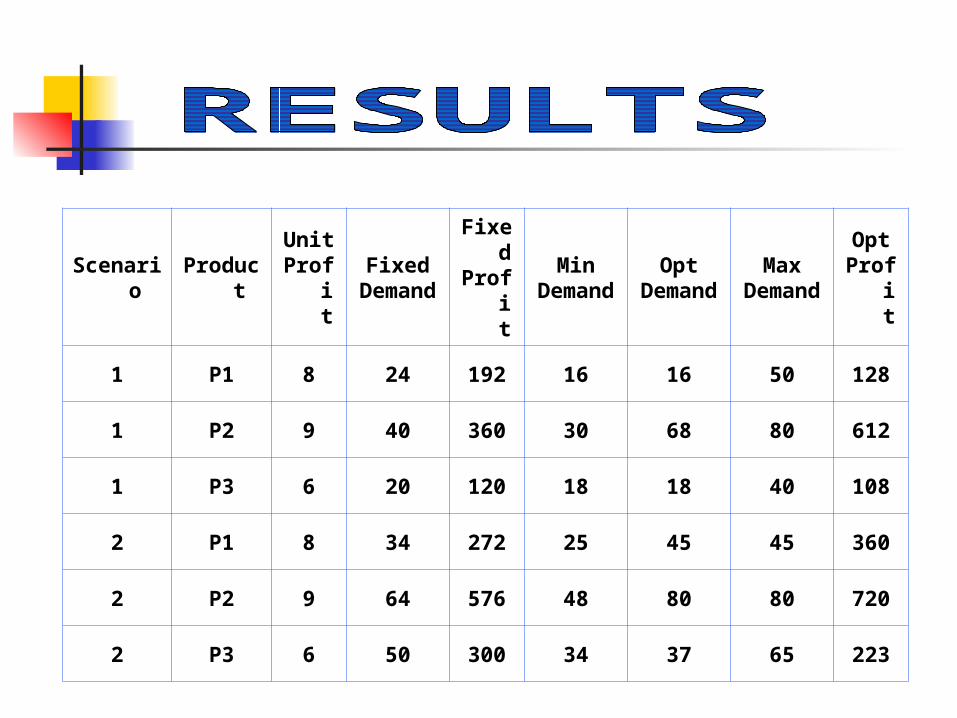
Scenario ProductUnit
ProfitFixed
DemandFixedProfit
MinDemand
OptDemand
MaxDemand
OptProfit
1 P1 8 24 192 16 16 50 128
1 P2 9 40 360 30 68 80 612
1 P3 6 20 120 18 18 40 108
2 P1 8 34 272 25 45 45 360
2 P2 9 64 576 48 80 80 720
2 P3 6 50 300 34 37 65 223

Scenario ProductUnit
ProfitFixed
DemandFixedProfit
MinDemand
OptDemand
MaxDemand
OptProfit
3 P1 8 25 200 20 24.99 60 199.9
3 P2 9 48 432 43 66.32 80 596.8
3 P3 6 34 204 30 30 65 180
4 P1 8 30 240 30 30 60 240
4 P2 9 55 495 55 91.7 100 825
4 P3 6 40 240 40 40 80 240

Does not consider: Inventory Stochastic demand
