seminar on current trends and global scenario in higher ... · pdf fileseminar on current...
TRANSCRIPT

Seminar on Current Trends and Global Scenario in Higher
Education Series 1/2014
Dr. Mohd Gazali bin Abas
Economic Planning Unit
Human Capital Development Section
Prime Minister's Department
New Direction in Government Planning:
A Focus on Higher Education
23 Jun 2014 (Monday)
Content
Economic Trajectory: Achieving High Income Economy
Human Capital Development in Supporting High Income Economy
Higher Education as One of the Main Levers: Challenges and Way Forward
Conclusion
3
4
5
2
Introduction – EPU and Planning 1
2
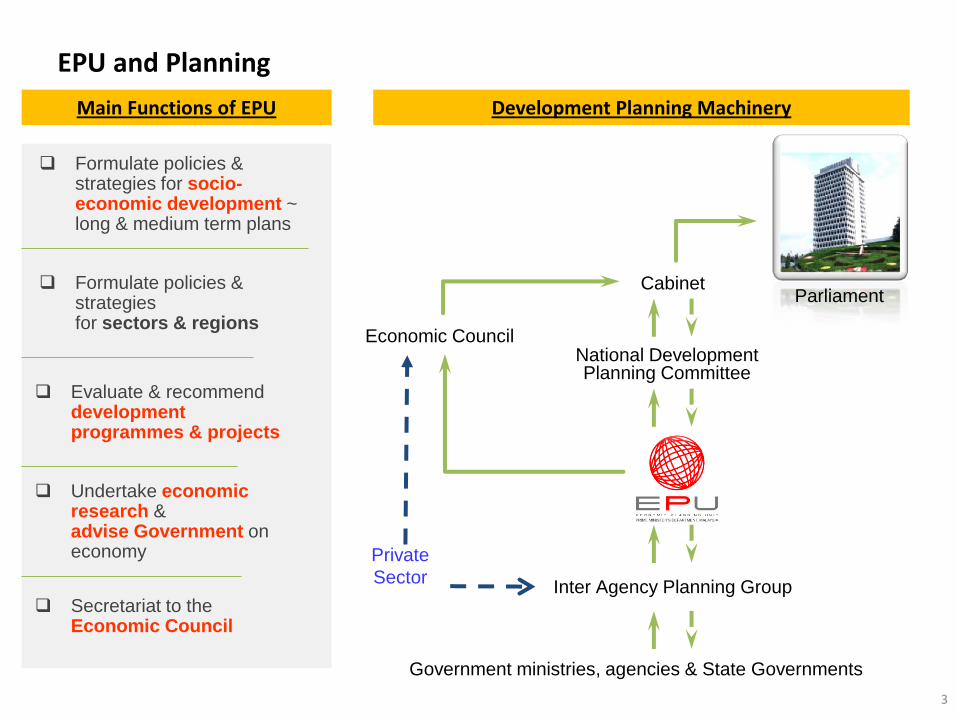
EPU and Planning
3
National Development Planning Committee
Economic Council
Cabinet
Government ministries, agencies & State Governments
Private
Sector Inter Agency Planning Group
Parliament
Secretariat to the Economic Council
Formulate policies & strategies for socio-economic development ~ long & medium term plans
Formulate policies & strategies for sectors & regions
Undertake economic research & advise Government on economy
Evaluate & recommend development programmes & projects
Main Functions of EPU Development Planning Machinery
Content
Economic Trajectory: Achieving High Income Economy
Human Capital Development in Supporting High Income Economy
Higher Education as One of the Main Levers: Challenges and Way Forward
Conclusion
3
4
5
4
Introduction – EPU and Planning 1
2
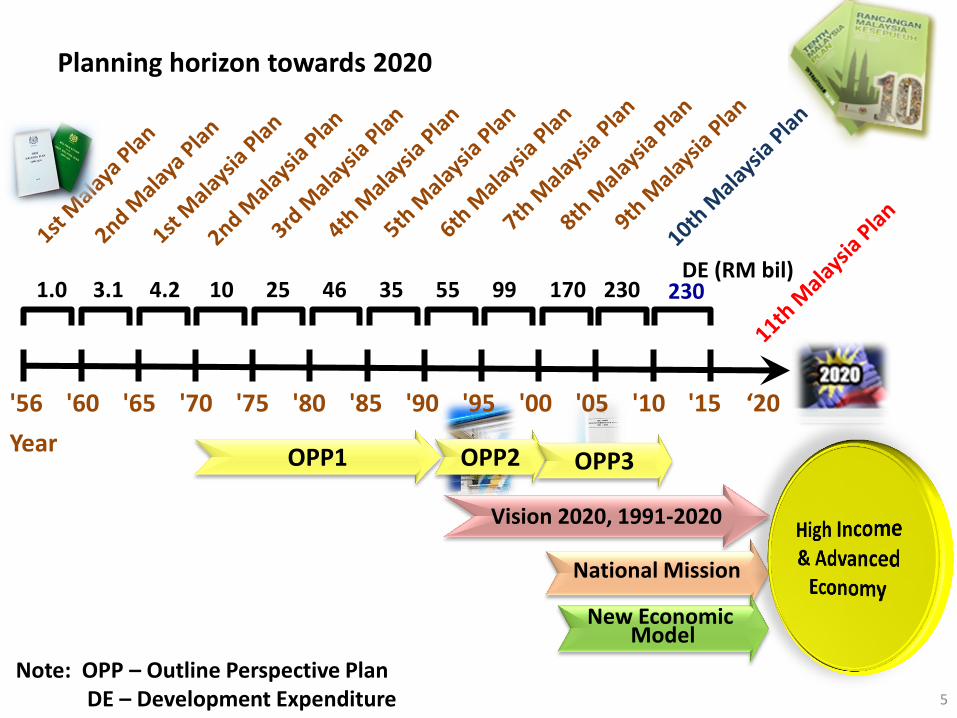
Planning horizon towards 2020
5
Year
'56 '60 '65 '70 '75 '80 '85 '90 '95 '00 '05 '10 ‘20
OPP2 OPP3 OPP1
Vision 2020, 1991-2020
National Mission
Note: OPP – Outline Perspective Plan DE – Development Expenditure
'15
DE (RM bil) 1.0 3.1 4.2 10 25 46 35 55 99 170 230 230
New Economic Model
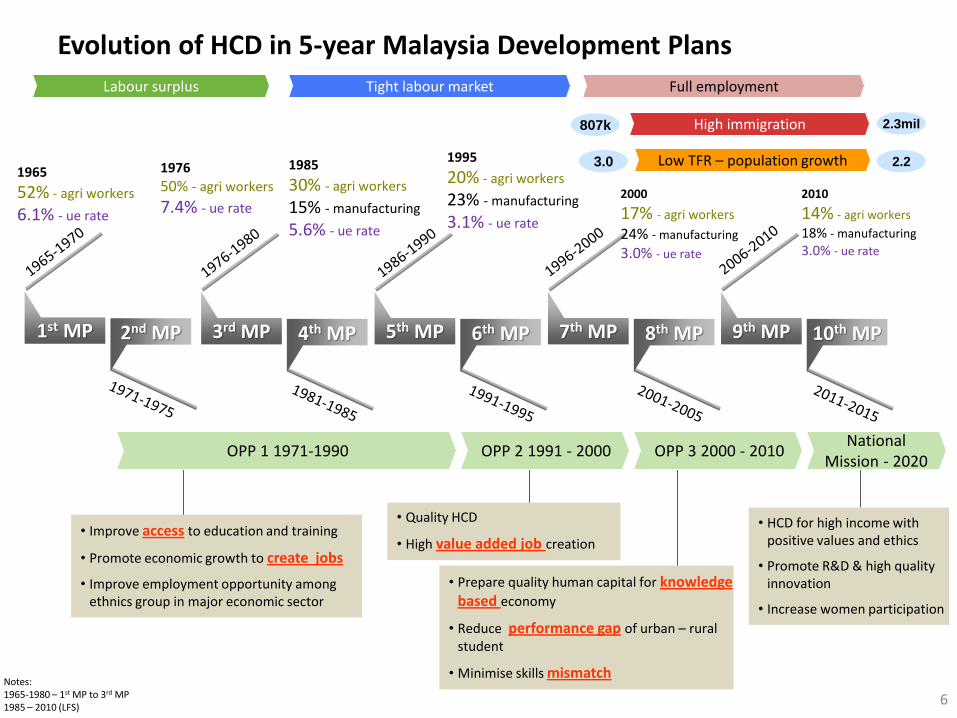
Evolution of HCD in 5-year Malaysia Development Plans
6
• Improve access to education and training
• Promote economic growth to create jobs
• Improve employment opportunity among ethnics group in major economic sector
1st MP
1st MP
2nd MP
3rd MP 4th MP
5th MP 6th MP
7th MP 8th MP
9th MP 10th MP
Labour surplus Tight labour market Full employment
OPP 1 1971-1990 OPP 2 1991 - 2000 OPP 3 2000 - 2010 National
Mission - 2020
1965
52% - agri workers
6.1% - ue rate
1976
50% - agri workers
7.4% - ue rate
• Quality HCD
• High value added job creation
• Prepare quality human capital for knowledge based economy
• Reduce performance gap of urban – rural student
• Minimise skills mismatch
• HCD for high income with positive values and ethics
• Promote R&D & high quality innovation
• Increase women participation
High immigration
Low TFR – population growth
807k 2.3mil
2.2 3.0 1985
30% - agri workers
15% - manufacturing
5.6% - ue rate
1995
20% - agri workers
23% - manufacturing
3.1% - ue rate
2000
17% - agri workers
24% - manufacturing
3.0% - ue rate
2010
14% - agri workers
18% - manufacturing
3.0% - ue rate
Notes: 1965-1980 – 1st MP to 3rd MP 1985 – 2010 (LFS)

Education and training development expenditure
7
3rd MP
4th MP
2nd MP
5th MP
6th MP
7th MP
8th MP
9th MP
10th MP
Razak Report 1956
Education Ordinan 1957
Rahman Talib Report &
Education Act 1961
Cabinet Report 1979
New Primary School Curriculum (KBSR) 1983
Integrated Primary School Curriculum (KBSR) 1993
National Education Philosophy 1988
1st MP
Education Blueprint - 2025
Private Higher Education Institution Act 1996,
National Higher Education Fund Corporation Act
(PTPTN) 1997
1&2 MP
Share to total DE (Development Expenditure)
National Council on Higher Education Act 1996
Exclude 2015
HRDF PTPK
SLDN
8% 8%
16%
7%
10%
13%
26%
19% 20%
14%
7,7605,8124,840
2,152763391
43,295
20,185
25,615
43,729
PFI & 2015
Merger of MOE & MOHE
DE (RM mil)

Sustainable real GDP growth: averaging 6.3% p.a. ~ economy doubled in every 11.4 years
-10.0
-5.0
0.0
5.0
10.0
15.0
'71 '76 '81 '86 '91 '96 '01 '06 '11
6.3% p.a (1970-2013)
East Asian Financial
Crisis 97/98
Prod. E&E drop
% growth
US$2 to US$15 (per barrel) US$15 to US$40
(per barrel)
Advanced economies
Global Financial Crisis & Recession
08/09
Collapse of Bear Stearns and
Lehman Brothers
8

Registered low unemployment rate – full employment (below 4%) since 1995
9
Notes: Labour Force Survey EPU - GDP
3.73.2
2.5
7.4
-1.5
0.5
10.0
2
10
6
12
-2 1990
8
-8
2005
4
0
1995
3.0
-7.4
8.9
Unemployment rate
GDP growth
(%)
3.5
-1.1
US$15 to US$40 (per barrel) ‘85
East Asian Financial Crisis 97/98
Prod. E&E Drop ‘01
Global Financial Crisis & Recession 08/09
Economic Stimulus Package
• 1st – RM 7b (~RM 1b to address unemployment)
• 2nd – RM60b (~RM2b for unemployment programmes)
High unemployment period average rate ~ 6%
Low unemployment period average rate ~ 3%
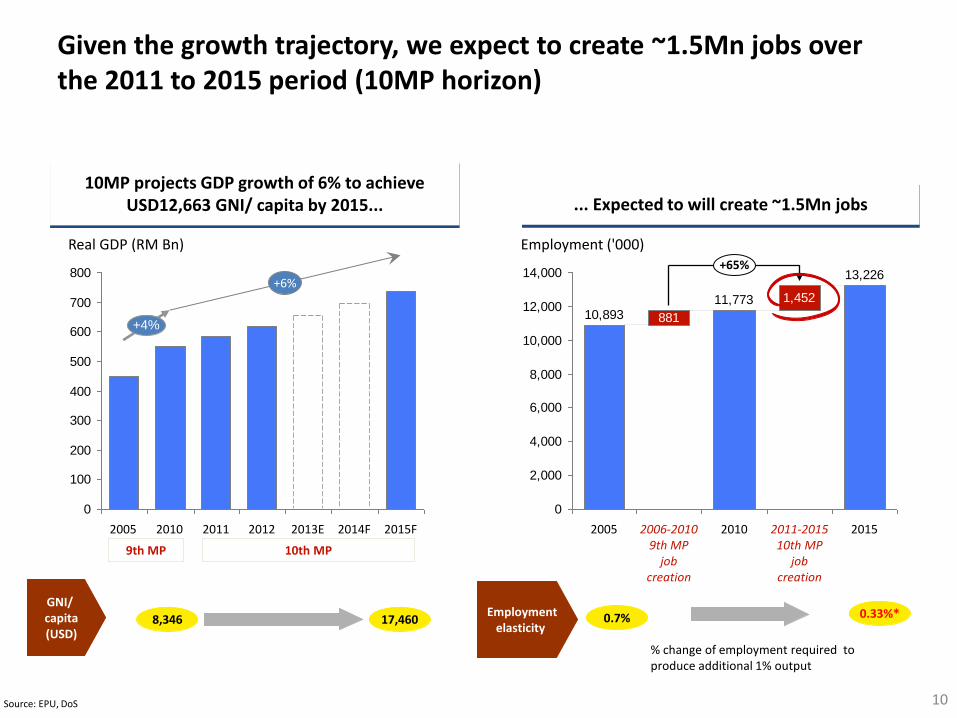
Given the growth trajectory, we expect to create ~1.5Mn jobs over the 2011 to 2015 period (10MP horizon)
10 Source: EPU, DoS
10MP projects GDP growth of 6% to achieve USD12,663 GNI/ capita by 2015... ... Expected to will create ~1.5Mn jobs
0
100
200
300
400
500
600
700
800
Real GDP (RM Bn)
+6%
2015F 2014F 2013E 2012 2011 2010 2005
+4%
9th MP 10th MP
GNI/ capita (USD)
8,346 17,460
13,226
11,77310,893
1,452
881
0
2,000
4,000
6,000
8,000
10,000
12,000
14,000
Employment ('000) +65%
2015 2011-2015 10th MP
job creation
2010 2006-2010 9th MP
job creation
2005
0.7% 0.33%* Employment elasticity
% change of employment required to produce additional 1% output

11
Transformed from agriculture into a manufacturing & services-based economy
Services
2%
Total
35%
25%
27%
11%
Mining
Agriculture
Construction
Manufacturing
100%
55%
8%
4%
7%
100%
25%
59%
7%
5%
6%
100%
23%
1970: 2013:
2020*:
• More food-based agriculture
• Producing high value-added goods
• Capital deepening in industries
• Dynamic manufacturing with more K-
intensive industries
• Modern services – finance, business, ICT,
and manufacturing-related services
US$19.0b US$249.7b
US$378.5b
Notes: * 2020 EPU target

...and tertiary industries contributed most to the new job creation (74%) in 10 MP and also to the creation of skilled jobs
12
128
604
128
194
371
1,452
13,200
12,800
0
12,000
12,400
13,600
Manufac-turing
Agriculture, Forestry,
Livestock & Fishing
5
11
Construction
7
Electricity, Gas & Water
Wholesale & Retail Trade,
Hotels & Restaurants
Finance, Insurance, Real Estate & Business
Services
15
Government Services
13,226
Employment ('000)
Transport, Storage &
Comms
11,773
Other Services
2010 base
11,773
Mining & Quarrying
Total
1
-0.1% 0.3% 1.3% 3.5% 5.0% 2.9% 0.2% 2.9% 2.4% 2.2% 0.3%
Primary industries (-0.3%)
Secondary industries (27%)
Tertiary industries (74%)
CAGR
2011-2015 jobs created
Source: EPU 10MP forecast
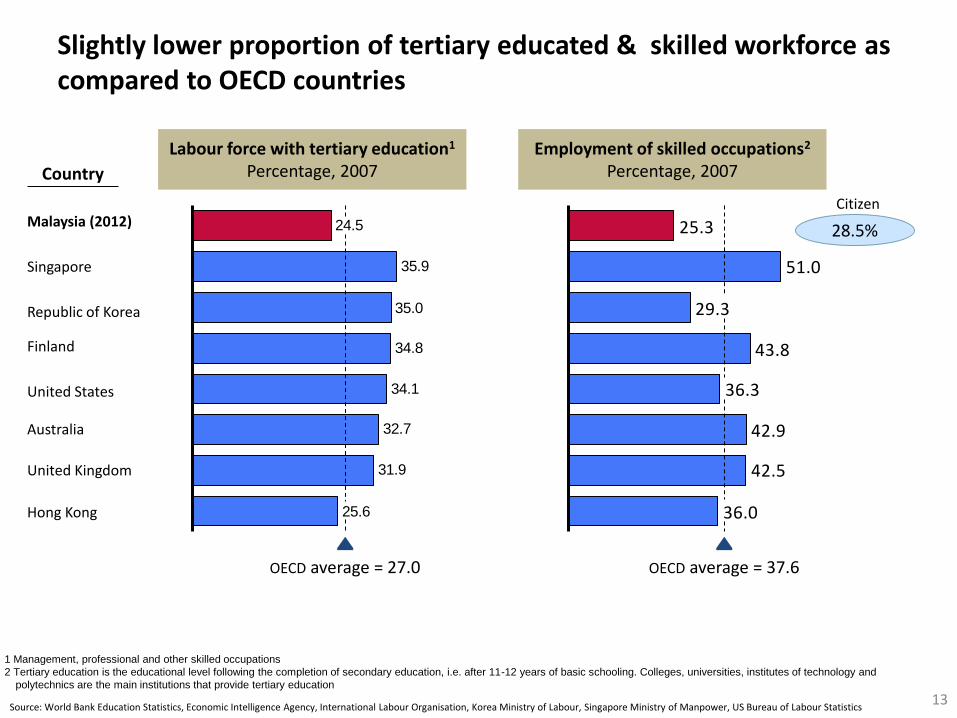
Slightly lower proportion of tertiary educated & skilled workforce as compared to OECD countries
13 Source: World Bank Education Statistics, Economic Intelligence Agency, International Labour Organisation, Korea Ministry of Labour, Singapore Ministry of Manpower, US Bureau of Labour Statistics
1 Management, professional and other skilled occupations
2 Tertiary education is the educational level following the completion of secondary education, i.e. after 11-12 years of basic schooling. Colleges, universities, institutes of technology and
polytechnics are the main institutions that provide tertiary education
Country
Labour force with tertiary education1
Percentage, 2007
25.6
31.9
32.7
34.1
34.8
35.0
35.9
24.5
OECD average = 27.0
36.0
42.5
42.9
36.3
43.8
29.3
51.0
25.3
OECD average = 37.6
Employment of skilled occupations2
Percentage, 2007
Malaysia (2012)
Singapore
Republic of Korea
Finland
United States
Australia
United Kingdom
Hong Kong
28.5%
Citizen
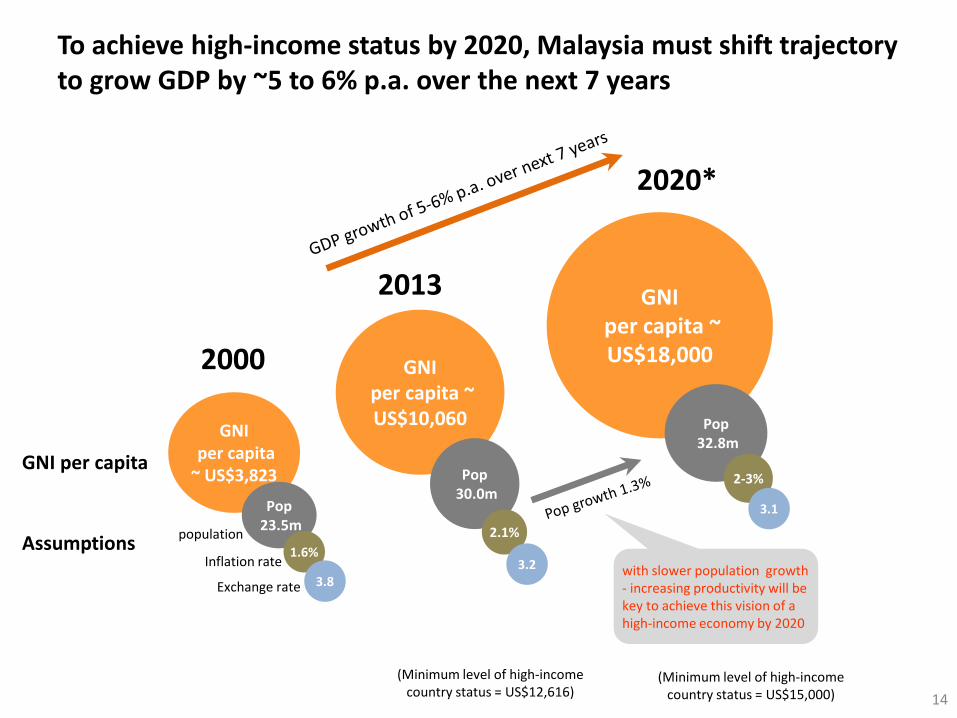
To achieve high-income status by 2020, Malaysia must shift trajectory to grow GDP by ~5 to 6% p.a. over the next 7 years
14
2000
2013
2020*
GNI
per capita ~ US$3,823
GNI
per capita ~ US$10,060
GNI
per capita ~ US$18,000
Pop
23.5m
Pop
30.0m
Pop
32.8m
1.6%
2.1%
2-3%
3.8 3.2
3.1
GNI per capita
Assumptions Inflation rate
Exchange rate
(Minimum level of high-income country status = US$15,000)
(Minimum level of high-income country status = US$12,616)
with slower population growth - increasing productivity will be key to achieve this vision of a high-income economy by 2020
population

Malaysia is on track towards a High Income Country
15
0
2
4
6
8
10
12
14
16
18
20
1990 1992 1994 1996 1998 2000 2002 2004 2006 2008 2010 2012 2014 2016 2018 2020
USD
$ (
Tho
usa
nd
)
Malaysia
Minimum HIC
-68.9%
GNI per capita income (USD$)
Note: Minimun HIC year 2020, estimates: USD$15,300 Sources: World Bank, IHS Global Insight & EPU
2018 USD$15,398
2000 USD$3,420
2010 USD$8,346
2020 USD$17,378
1990 USD$2,370
2013 USD$10,687
1990 USD$7,621
2000 USD$9,266
2010 USD$12,276
-63.1%
-32.0%
2013 USD$13,172
-18.9%
2020 USD$15,280
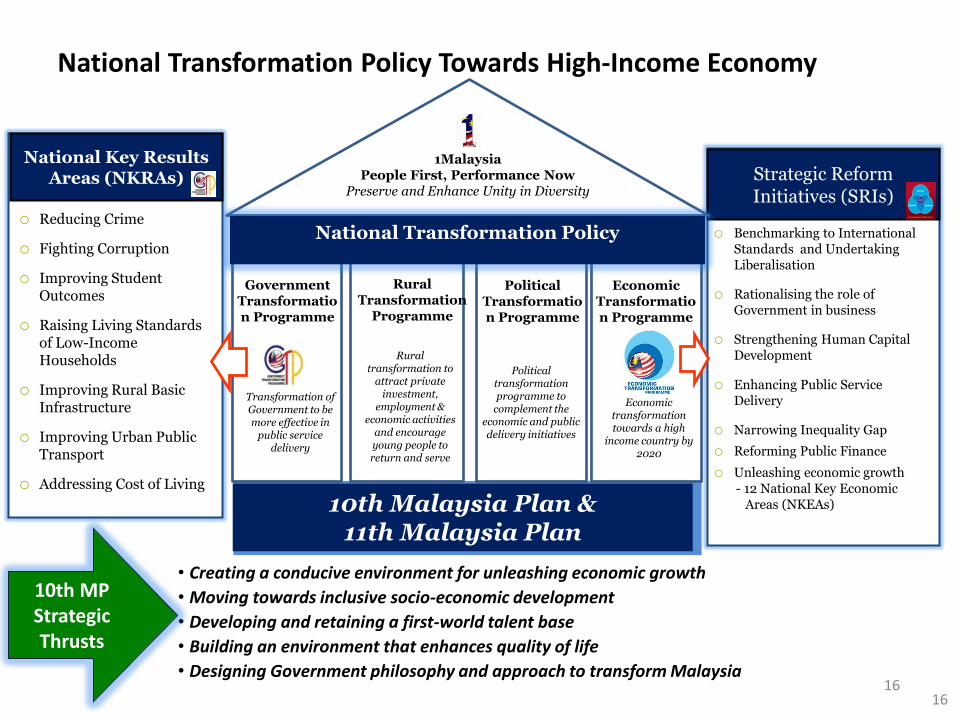
National Transformation Policy Towards High-Income Economy
16
o Reducing Crime
o Fighting Corruption
o Improving Student Outcomes
o Raising Living Standards of Low-Income Households
o Improving Rural Basic Infrastructure
o Improving Urban Public Transport
o Addressing Cost of Living
National Key Results Areas (NKRAs)
o Benchmarking to International Standards and Undertaking Liberalisation
o Rationalising the role of Government in business
o Strengthening Human Capital Development
o Enhancing Public Service Delivery
o Narrowing Inequality Gap
o Reforming Public Finance
o Unleashing economic growth - 12 National Key Economic Areas (NKEAs)
Strategic Reform Initiatives (SRIs)
• Creating a conducive environment for unleashing economic growth
• Moving towards inclusive socio-economic development
• Developing and retaining a first-world talent base
• Building an environment that enhances quality of life
• Designing Government philosophy and approach to transform Malaysia
1Malaysia People First, Performance Now
Preserve and Enhance Unity in Diversity
Transformation of Government to be more effective in
public service delivery
10th Malaysia Plan & 11th Malaysia Plan
Rural transformation to
attract private investment,
employment & economic activities
and encourage young people to return and serve
Government Transformation Programme
Rural Transformation
Programme
Economic transformation towards a high
income country by 2020
Economic Transformation Programme
Political Transformation Programme
National Transformation Policy
Political transformation programme to
complement the economic and public delivery initiatives
16
10th MP Strategic Thrusts

Content
Economic Trajectory: Achieving High Income Economy
Human Capital Development in Supporting High Income Economy
Higher Education as One of the Main Levers: Challenges and Way Forward
Conclusion
2
4
5
17
Introduction – EPU and Planning 1
3
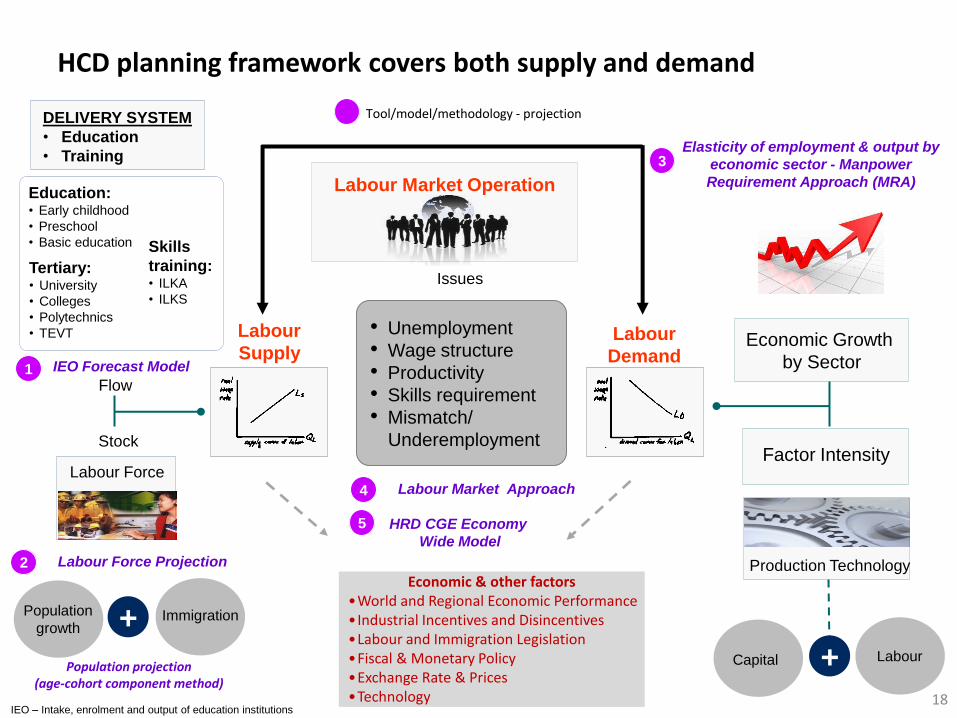
HCD planning framework covers both supply and demand
18
Labour
Supply Labour
Demand
DELIVERY SYSTEM
• Education
• Training
Labour Market Operation
Population
growth + Immigration
Labour Force
Issues
Economic Growth
by Sector
Factor Intensity
+ Capital Labour
Tertiary: • University
• Colleges
• Polytechnics
• TEVT
Education: • Early childhood
• Preschool
• Basic education
• Unemployment
• Wage structure
• Productivity
• Skills requirement
• Mismatch/
Underemployment Stock
Flow
Production Technology
Elasticity of employment & output by
economic sector - Manpower
Requirement Approach (MRA)
IEO Forecast Model
Labour Force Projection
Labour Market Approach
HRD CGE Economy
Wide Model
1
2
3
5
4
Population projection (age-cohort component method)
IEO – Intake, enrolment and output of education institutions
Skills
training: • ILKA
• ILKS
Economic & other factors •World and Regional Economic Performance • Industrial Incentives and Disincentives •Labour and Immigration Legislation •Fiscal & Monetary Policy •Exchange Rate & Prices •Technology
Tool/model/methodology - projection

Integrated Talent Development Framework: Addressing entire education & professional cycle, seamless co-ordination & implementation
19
Early
childhood
Pre-
school
Basic
education
Tertiary education • University / college
• Polytechnic
• Community college
• Technical Education &
Vocational Training Institution
Professional
working life
Retiree/
Second
career
Ensuring Every Child Can Succeed
Holding Schools Accountable for Changes in
Student Outcomes
Investing in Great Leaders for Every School
Attracting and Developing Top Talent in
Teaching
Transforming the Effectiveness of Delivery
Mainstreaming and
Broadening Access to
Quality Technical Education
and Vocational Training
Enhancing the Competency
of Tertiary Graduates to
Prepare Them
for Entering the Labour
Market
Making the Labour Market More Flexible
Upgrading the Skills and Capabilities of the Existing
Workforce
Attracting and Retaining Talent Initiatives
(12)
Cluster
Attract, Develop and Retain
Top Talent in the Public
Service
Strengthening Academia-
Industry Cooperation and
Research Capacity
91
70
83 82
92
76
81
82
85
85
85
Status update Q4/2013 - Initiatives Monitoring System (%)
Revamping education system to
significantly raise student outcomes Raising skills to increase
employability
Reforming labour market to
transform Malaysia into a
high-income nation
0+ 4+ 6+ 17+ 20+ Age
1 2 3
82

Major Human Capital Policy Documents in the 10th MP period
20
Education Blueprint 2013-2025
Talent Roadmap 2020
Graduate Employability Blueprint
2012-2017
Higher Education Strategic Plan – 2020
(revisited)
Pelan Induk Latihan & Pembangunan Kemahiran
Pekerjaan Malaysia 2008-2015 (revisited)
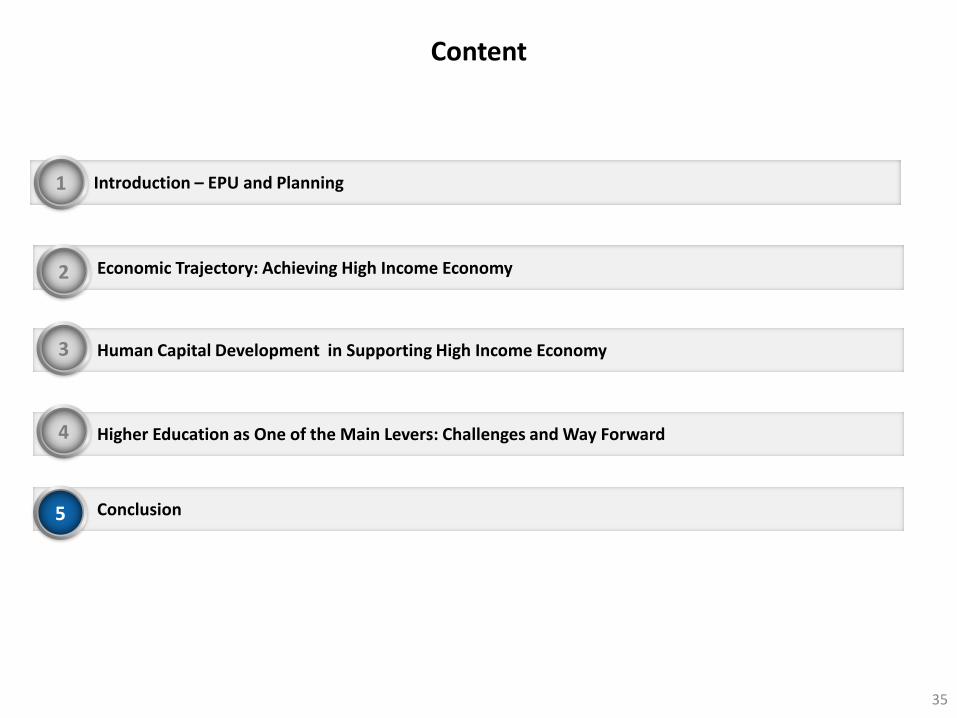
Content
Economic Trajectory: Achieving High Income Economy
Human Capital Development in Supporting High Income Economy
Higher Education as One of the Main Levers: Challenges and Way Forward
Conclusion
2
3
5
21
Introduction – EPU and Planning 1
4

Higher education in up-skilling of workforce to ensure quality flow and stock to support economic growth and industry demand
22
Meet industry demand
Stock approach (existing workforce)
Skilled
(25%)
Semi-
Skilled
(63%)
Low
Skilled
(12%)
33% • Legislators, senior officials and managers
• Professionals • Technicians and associate
professionals
• Clerical workers • Service workers and shop and
market sales workers • Skilled agricultural and fishery
workers • Craft and related trade workers • Plant and machine operators and
assemblers
• Elementary occupations
Qu
alif
icat
ion
Up
grad
ing
Skills Upgrading
2012 2015
Flow approach (new entry to workforce)
Output from Education Institutions
Bridging Programme
Occupational breakdown
28.5% Citizen
HE

Competition among education institutions for shrinking pool of supply
23
2000 2005 2010 2015 2020 2025 2030
4,200
4,000
3,800
3,600
3,400
3,200
0
(‘0
00
pe
rso
n)
-95.7 2.8%
-0.4%
3,722
3,953 4,049
3,061
Notes: 2000-2009 – inter census estimate 2001-2009, 2010-2030 – population projection based on population census 2010 Vital Statistics – 2012 preliminary
Historical growth 2000-2010
Projection growth 2000-2040
1
2
1
2
2000 2005 2010 2015 2020 2025 2030
3,800
3,600
3,400
3,000
3,200
2,800 (‘
00
0 p
erso
n)
+81.8 2.4%
-0.2%
3,436
3,649 3,567
2,821
Tertiary education cohort’ of 17-23 years is expected to reduce overtime
1
2
Total population 17-23 years old Citizen population 17-23 years old
TFR drop from 3.0 in2000 to replacement level fertility at 2.1 in 2012
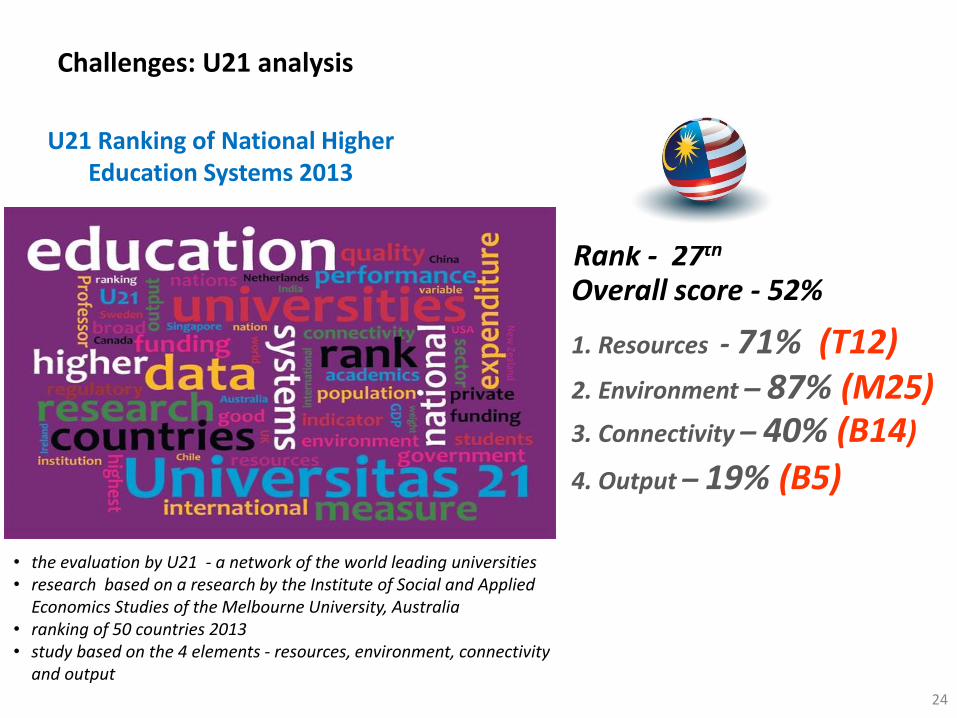
Challenges: U21 analysis
24
1. Resources - 71% (T12)
• the evaluation by U21 - a network of the world leading universities • research based on a research by the Institute of Social and Applied
Economics Studies of the Melbourne University, Australia • ranking of 50 countries 2013 • study based on the 4 elements - resources, environment, connectivity
and output
U21 Ranking of National Higher Education Systems 2013
3. Connectivity – 40% (B14)
4. Output – 19% (B5)
Rank - 27th Overall score - 52%
2. Environment – 87% (M25)
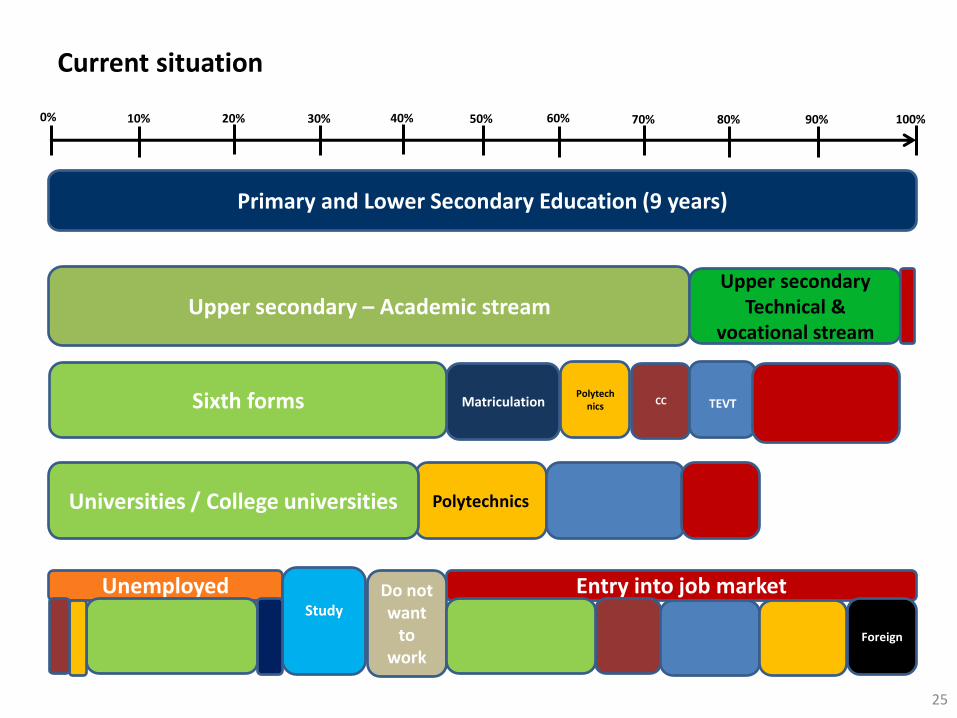
Current situation
25
Unemployed
Polytechnics
Primary and Lower Secondary Education (9 years)
Upper secondary – Academic stream Upper secondary
Technical & vocational stream
CC
Universities / College universities
Matriculation Sixth forms Polytechnics TEVT
Entry into job market Do not want
to work
Study
Foreign
0% 10% 20% 30% 40% 90% 80% 100% 70% 60% 50%

Desired Outcome
26
Unemployed
Polytechnics
Primary and Lower Secondary Education (11 – 12 years)
Upper secondary – Academic stream
Upper secondary Technical & vocational stream
Community colleges
Universities / College universities
Matriculation Sixth forms Polytechnics TEVT
0% 10% 20% 30% 40% 90% 80% 100% 70% 60% 50%
Entry into job market Do not want
to work
Study
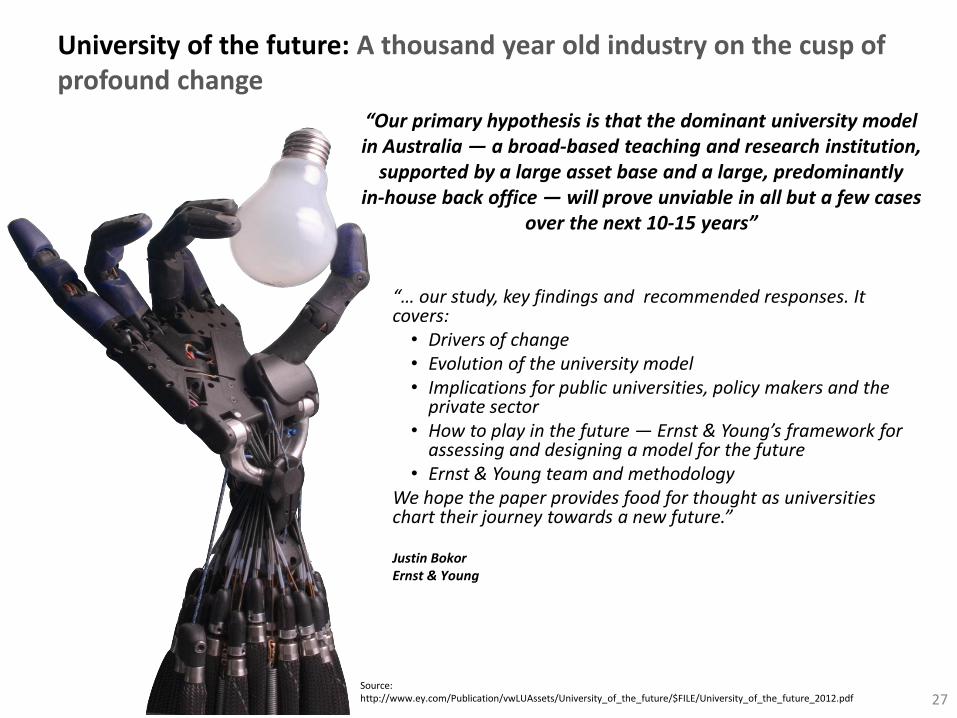
University of the future: A thousand year old industry on the cusp of profound change
27 Source: http://www.ey.com/Publication/vwLUAssets/University_of_the_future/$FILE/University_of_the_future_2012.pdf
“… our study, key findings and recommended responses. It covers: • Drivers of change • Evolution of the university model • Implications for public universities, policy makers and the
private sector • How to play in the future — Ernst & Young’s framework for
assessing and designing a model for the future • Ernst & Young team and methodology
We hope the paper provides food for thought as universities chart their journey towards a new future.” Justin Bokor Ernst & Young
“Our primary hypothesis is that the dominant university model in Australia — a broad-based teaching and research institution,
supported by a large asset base and a large, predominantly in-house back office — will prove unviable in all but a few cases
over the next 10-15 years”
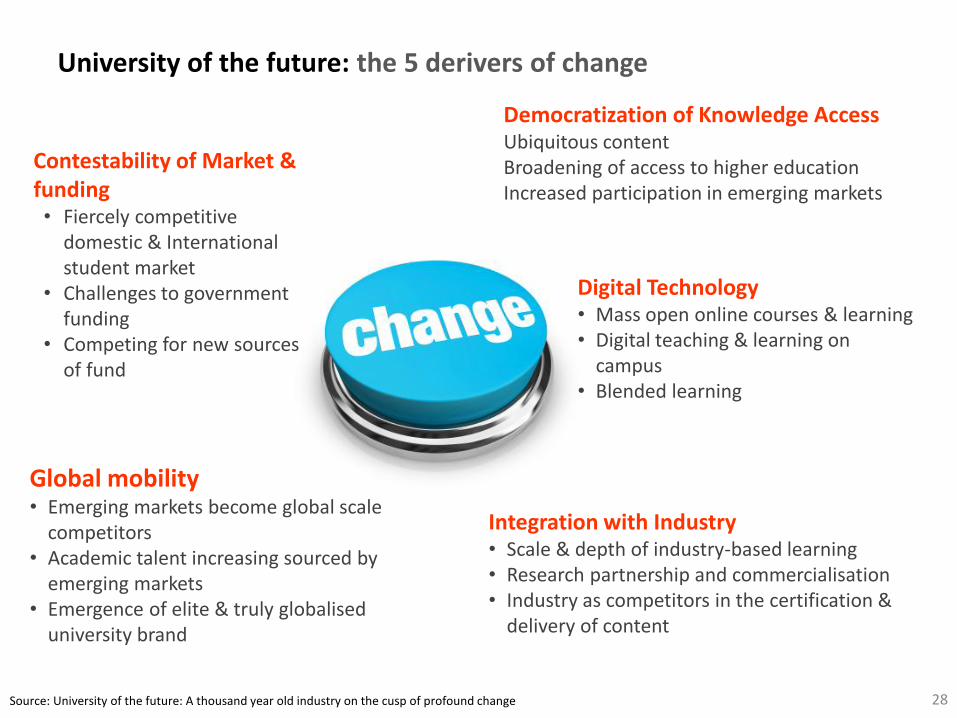
University of the future: the 5 derivers of change
28
Democratization of Knowledge Access Ubiquitous content Broadening of access to higher education Increased participation in emerging markets
Digital Technology • Mass open online courses & learning • Digital teaching & learning on
campus • Blended learning
Global mobility • Emerging markets become global scale
competitors • Academic talent increasing sourced by
emerging markets • Emergence of elite & truly globalised
university brand
Integration with Industry • Scale & depth of industry-based learning • Research partnership and commercialisation • Industry as competitors in the certification &
delivery of content
Contestability of Market & funding • Fiercely competitive
domestic & International student market
• Challenges to government funding
• Competing for new sources of fund
Source: University of the future: A thousand year old industry on the cusp of profound change

Current typical university model
29

Typical university model + ICT
30

Blue ocean university model
31

Future university model
32

Higher Education
11th Malaysia Plan: What are we doing
33 to survive and excel
FG 1, 6, 7, 10 INTENSIFYING & RATIONALIZING
CAPACITY
Strengthening HIEs (RU, MTUN,
New Uni)
Soft programmes training
Affirmative intervention for targeted group
(gender)
ICT support (MOOC)
FG 9 & 16 CORPORATE & GOVERNANCE
REFORM
Empowering governance for
HIEs
Financial & sustainability
Independence
Productivity & cost
Remuneration & reward
FG 11, 12 & 17 MARKET DRIVEN & RESULT BASED PERFORMANCE
Marketing and competitiveness
Product & services
Investment & asset
management
Graduate employability &
KPIs
FG 9 & 16
BRANDING & GLOBALIZATION
Malaysia as regional
education hub
Attracting world renown HIEs to
M’sia
Niche specialization
To become world top rank HIEs
FG 3, 5, 8, & 15 EXCELLENCE
INNOVATION & VALUE CREATION
Curriculum & pedagogy
Pre-sch; primary; secondary;
tertiary outcome monitor
R, D & C
Soft skills & industry
relevance
FG 2 & 13
PRIVATE – PUBLIC HIES &
ACADEMIA – INDUSTRY
Private HIEs investment
Industry input & intervention
Resource sharing & knowledge
transfer
Collaboration programmes
T3/C5: Harnessing Talent Demand Supply
Public Private Knowledge Base
High Income
Creative & Innovative
Sustainable & Inclusive
Accessible, Equitable, Affordable & Quality

….11th Malaysia Plan: What are we doing
34
FG 1, 6, 7, 10 INTENSIFYING & RATIONALIZING
CAPACITY
Strengthening HIEs (RU, MTUN, New Uni)
Soft programmes training
Affirmative intervention for targeted group
(gender)
ICT support (MOOC)
FG 9 & 16
CORPORATE & GOVERNANCE REFORM
Empowering governance for HIEs
Financial & sustainability
Independence
Productivity & cost
Remuneration & reward
FG 11, 12 & 17
MARKET DRIVEN & RESULT BASED
PERFORMANCE
Marketing and competitiveness
Product & services
Investment & asset management
Graduate employability & KPIs
Content
Economic Trajectory: Achieving High Income Economy
Human Capital Development in Supporting High Income Economy
Higher Education as One of the Main Levers: Challenges and Way Forward
Conclusion
2
3
4
35
Introduction – EPU and Planning 1
5

Goals: Where do we want to go?
36
…as the best university in Malaysia? …as world top 100 university? …as top choice industry preferred technology partner? …as Malaysian student’s top choice university? …to secure 30% private endowment by 2020? …to generate 10% profit growth per annum? …to expand its’ business income growth from …international market by 10% per annum? …to enhance R,D&C by 10% per annum?
Conclusion
37
“You can't change the past. You can only change the present which programs the future. That's where your
power is.” Tara Brach
““Today's pain is tomorrow's power. The more you suffer today, the stronger you are tomorrow."
“Stop waiting for the 'right time.' Success is a numbers game: the number of times you take a shot.“
“That time is now….Take enough shots and over time you'll grow more skilled, more experienced, and more connected. And that will mean a greater percentage of your efforts will succeed. Take enough
shots, learn from what didn't work, and in time you'll have all the skills, experience, and connections you need.”
ECONOMIC PLANNING UNIT PRIME MINISTER’S DEPARTMENT
MALAYSIA http://www.epu.gov.my
38