senior biology - web viewwork in small groups to develop a 5-6 minute documentary on the results...
TRANSCRIPT

Senior Biology
Student Name: _____________________________________
587 Chapel Hill RoadSackville North NSW 2756
Phone: 4579 1136 Fax: 4579 1072
www.brewongle-e.schools.nsw.edu.au
1
Ecosystem Dynamics Depth Study
Senior Biology
Health and Safety Issues As you are working out in the field you need to be aware that:
Ground material is often covered in moss and can be very slippery. Vines and dense undergrowth can trip. Fallen trees can be rotten and weak. Some animals can deliver painful or venomous bites. On slopes, rocks can be easily dislodged. Edges of wetlands can be quite deep and muddy.
Inquiry Question
"What effect can one species have on the other species in a community?"
Students: ● investigate and determine relationships between biotic and abiotic factors in an ecosystem, including: (ACSBL019) – the impact of abiotic factors (ACSBL021, ACSBL022, ACSBL025) – the impact of biotic factors, including predation, competition and symbiotic relationships (ACSBL024) – the ecological niches occupied by species (ACSBL023) – predicting consequences for populations in ecosystems due to predation, competition, symbiosis and disease (ACSBL019, ACSBL020) – measuring populations of organisms using sampling techniques (ACSBL003, ACSBL015)
Student Tasks To create a specific inquiry question relating to the inter-relationship of foxes and quolls Predict/hypothesise the outcome of your field study based on your research of fox/quoll population
dynamics Complete a firsthand investigation as part of a field trip to collect primary and secondary data. Process and analyse the data to help solve the problem presented by your inquiry question. Communicate your scientific findings using a medium of your choice.
2

Senior Biology
Before the excursion: Visit https://brewongleeec.com/student-learning/secondary/stage-6/ecosystem-dynamics/
Complete your pre-excursion research in a separate book/document by addressing the following questions:
Population Dynamics: Create an abbreviated list of important terms to your research and define them using the definition
of terms list provided on our website. Describe the 4 main processes that can influence population density in a particular species Outline some sampling methods ecologist use to estimate population density in both plants and
animal populations.
The Target Species Spotted tailed quoll (Dasyurus maculatus) and Red fox (Vulpes vulpes).
We are interested in the relationship between these two species in an ecological community. Complete some research into each species to answer the following: (helpful links provided on our website)
Distribution, diet, habitat, breeding, threats, ecological niche Describe known facts about the inter-relationship between foxes and quolls. Research the vegetation associations for both species and discuss how sampling vegetation will be
important to your research. (think about how this might relate to the target species).
The Study Site Describe the major land use patterns around Brewongle EEC at Sackville North (utilise the Google
Map on our website or Six Maps) The study site is ‘remnant bushland’ – what does this mean and what might be the implications for
native flora and fauna? What is a ‘vegetation corridor’ and why are they important for native wildlife? Is Brewongle EEC linked to other remnant bushland areas by a vegetation corridor? Identify some factors that would influence the distribution and abundance of quolls and foxes
around Brewongle EEC and Sackville North:
The Field study/excursion
Overall inquiry question "What effect can one species have on the other species in a community?" Create your own inquiry question specific to the proposed excursion to Brewongle EEC and the
target species. What type of data do you need to collect and what first hand investigation methods could you use in
the field to answer this question? (Hint think about relationships – Abiotic/vegetation/animals/target species)
Hypothesise an outcome of your investigation based on your prior research. We have provided a scaffold and various activities that will help you collect primary data during
your excursion on both vegetation and the target species.
3

Senior Biology
1 2 3 4 Mean Range
Temperature
Colour
Texture
Leaf Litter Depth
Temperature
Slope
Elevation
Lithology
Method
Soil
See notes on pink laminated sheet
Place trowel into leaf litter. Take measurement from centre of trowel
pH
Remove the cover from the thermometer and place probe in soil.
Rub fore fingers on ground & colour in the worksheet section
Step 1-Place soil on white tray with spoon
Step 2-Place 2-3 drops of universal indicator over the sample
Step 3-Sprinkle barium sulphate on sample
Step 4-Use colour chart to assess pH level
Air
Use the temperature meter
Use hygrometer.
Step 1-Read dry bulb temperature
Step 2-Read wet bulb temperature
Step 3-Calculate difference between wet & dry bulb temperatures
Use chart in centre to assess relative humidity
Use lux meter. 1 lux = light of one candle per square meter.
Light Intensity
Aspect
Turn on to x100 & take a reading from waist height (add two zeros to your reading)
% Moisture
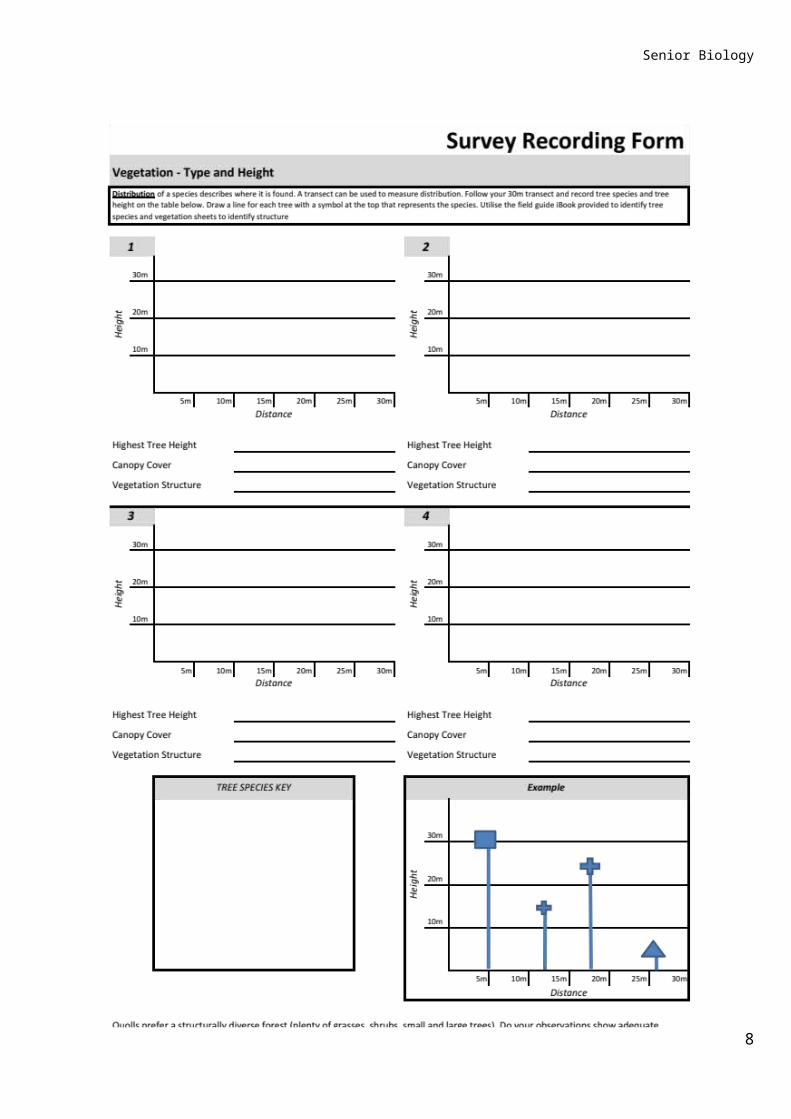
Survey Recording FormAbiotic Components - Physical & Chemical Characteristics Along the Transect
Geo
grap
hy
Use clinometer. (blue colour) (in degrees)
Use compass.Step 1-Assess where north is
Step 2-Assess direction of transect line
Will be given to you
Assess the rock type observed
4

Senior Biology
Temperature
pH 5.5 – 8 = healthy
Texture
Leaf Litter Depth
2 – 3cm = adequate
Temperature
% Moisture
Slope
Aspect
Elevation
Lithology
Survey Recording FormAbiotic Results – interpretation sheet
Soil
H=Healthy U=Unhealthy
How does your result compare to the average for Sackville North for this time of year?
Air
What would soil temperature influence?
How would the texture influence vegetation?
<100 lux = very dark day Full daylight = ~10,000 lux Bright sunlight = ~100,000 lux
What factors contribute to a variation in lux readings?
<1cm = unhealthy
3cm & above = healthy
1 – 5.5 = unhealthy
8 – 12 = unhealthy
How would the humidity infuence vegetation?
H=Healthy U=Unhealthy
Geo
grap
hy
Light Intensity
How would the slope influence vegetation?
How would the aspect of the slope change the type of vegetation?
Would the vegetation change as you move between the gully and ridge? Explain differences.
Why are we interested in the type of rock observed?
5

Senior Biology
6

Habitat Element 1 2 3 4 Mean Range
Trees
One or more trees native to Australia 2
A variety of 4 or more plant species 2
Healthy Tree Canopy /P lant Foliage
Healthy 2
Moderately Healthy
1
Defoliation Evident
0
Evidence of Dieback
0
Shrubs None 0
Some 1
Many 2
Native Shrubs None 0
Some 1
Most 2
Ground Cover None 0
Some 1
Most 2
Native Grasses or Spreading Plants 2
HollowsButt
Hollows 1
Limb Hollows
1
Fallen Log Hollows
1
Rocks & Crevices None 0
Some 1
Most 2
Leaf Litter None 0
Some 1
Most 2
Loose Bark (attached or shed)
None 0
Some 1
Most 2
Logs & Fallen Branches None 0
Some 1
Most 2
WAT
ER
Pond/Water Yes 1
No 0
FOOD Plants with Fruits /
SeedsNone
0Some
1Most
2
Plants of Different Ages
None 0
Some 1
Most 2
J oined or Located to Other Gardens / Bush
by Gardens / Bush
Yes 1
No 0
HABITAT ASSESSMENT
TOTAL SCORE / 33
1 - 3 large trees (> 6m) 1
More than 5 large trees 2
TREE
SSH
RUBS
GROU
ND C
OVER
SSH
ELTE
R
A LOW SCORE WILL INDICATE THE ZONE IS POOR HABITAT. This may be because it has been disturbed or requires additional habitat parameters to better
support the amazing variety of living things. A quoll requires a minimum score of 20 to survive
7
INTERPRETING THE HABITAT ASSESSMENTAREA - the higher the score the better. Larger animals and those higher up the food chain require more territory/range in which to support themselves. Wildlife corridors play an important role in sustaining and conserving plant and animal species.
TREES - provide nesting sites and food for nectar and fruit eaters.
HEALTHY TREE CANOPY – a healthy canopy will indicate the site is relatively free of human disturbances (eg; erosion, compaction) or natural disturbances (storm damage, major presence of mistletoe)
SHRUBS – dense native shrubs allow small native animals and birds to shelter and to hide from predators such as feral cats.
HERBS & GROUND COVERS – provide the food for finches, lyrebirds, lizards, frogs and wallabies, and also provide habitats for small mammals, insects and spiders.
NATIVE PLANTS – native plants are adapted to the Australian environment. They require less watering, little or no fertiliser and provide the right food at the right time for the native animals that have evolved with them.
HOLLOWS – are important homes for native wildlife. It can take over a hundred years for hollows to develop in forests. Hollows also provide nesting sites for birds, possums and bats.
ROCKS & CREVICES – provide habitat for many animals to live and feed and for certain species of plants to grow – they are valuable habitat. Bush rock collection has had a significant impact on our wildlife and degraded many areas.
LEAF LITTER – provides habitat for smaller animals like lizards, geckos, frogs and invertebrates. Leaf litter, when broken down, provides humus – a rich source of nutrients for trees and shrubs.
LOOSE BARK – provides habitat for invertebrates, spiders and lizards.
LOGS OR FALLEN BRANCHES – 20% of native mammals need logs to nest in. They provide habitat for invertebrates and reptiles. When they decay they provide nutrients for the ecosystem.
POND / WATER – provides homes for frogs, native fish, dragonfly nymphs and other invertebrates. Also drinking water for birds and animals.
PLANTS WITH FRUIT / SEEDS – an important source of food for birds, bats, possums and invertebrates.
PLANTS OF DIFFERENT AGES – indicates that an area has more habitat spaces for a variety of plants and animals.
JOINED OR LOCATED TO OTHER GARDENS / BUSH – a variety of vegetation, vegetation density and landscapes will allow a greater range of animal species to find food and nesting sites.
References – Rumbulara EEC CRAM Project – CMA,Windsor
8

Nest Box Camera SurveyList any wildlife or evidence of wildlife that you found.
Box Species How many?
behaviour/comments
Camera Trap ResultsList any wildlife or evidence of wildlife that you found after reviewing camera trap footage.
9

Camera
Species How many?
behaviour/comments
1
2
3
4
5
6
7
8
9
10
Human Impacts on a Vegetation CommunityThere are many ways in which a vegetation community can be disturbed and each disturbance can have a varying degree of impact.
Observe the vegetation community around you to complete the following checklist.
1. Has the soil been disturbed by;
10

None (o) minor (1) major (2)erosion (sheet, rill, gully) mining of soil, clay or sand dumping of rubbish/garden waste bushrock collection access roads, paths or tracks
2. Has the vegetation been disturbed by;None (o) minor (1) major (2)
weed invasion logging past clearing off road vehicle use nutrient/sewage seepage from adjacent farmland
3. Is the site;No (0) Yes (2)
adjacent to an urban area adjacent to recreational facilities showing evidence of feral animals
Score:Poor = 21 - 30 Recorded score: Average = 11 - 20Good = 0 - 10
Observe as many alterations to the vegetation community at the study site.Alteration Environmental Impact
Post Visit task 1 - Processing the DataIt is important to collect a full data set by sharing primary data with your fellow students. Ensure that your tables have all data to enable you to calculate means and ranges.
Represent your data in your separate document using an appropriate graphical form (not all data can be represented in a graph) or using some of the options below.
11
NB: the spotted-tailed quoll requires a score of 0-10 to survive.

o Using ICT software, use a topographic map or satellite image as a base map, locate Brewongle and identify locations of nest boxes, camera traps and survey areas.
o Collate data from your field study into a table/or graph to summarise your findings.o Create flowcharts to demonstrate your understanding of the ways abiotic data is linked to biotic
and relationships between the target species.o Assemble and annotate photographs to provide a visual representation of the site. Analyse
and label interconnections.o Develop consequences charts to explain human impacts and relationships between foxes and
quolls (positive and negative). Show the impacts on Google Tour Builder. o Summarise each section of data and note any areas of concern or possible issues for the target
species (ie is there habitat elements missing, abiotic concerns, vegetation structure missing etc?)
Post Visit task 2 - Analysing the Data This is where you evaluate and relate your findings to your inquiry question. Remember to relate to
your data and prior research. Answer the following in your data analysis – this also called a ‘Discussion”.
Utilise links on the Brewongle website to see historical biodiversity data on the Atlas of Living Australia website
How does the abiotic data effect the biotic data? Ie how does the soil, air and geography influence vegetation and can you then relate to the animal population?
Is their sufficient habitat elements for quolls or foxes? Have you found any direct evidence of the target species?
Is there structural diversity evident in the vegetation that may support a wide range of food for the quoll?
Are there enough habitat space requirements for small mammals and birds that make up the food supply of the quoll?
Are there potentially enough habitat space requirements for spotted-tailed quoll or red fox?
Did you find adequate food sources or evidence of food for quolls and foxes?
If you found no evidence of quolls, discuss the reasons for this? (Lack of habitat? Competition? Predation? Human impacts? Other threats?)
Post Visit task 3 – Problem Solving Use some of the documents provided on our website like the Fox Threat Abatement Plan and the
Recovery Plan for the spotted tailed quoll to help you. Predict some consequences for quoll and fox populations in Australia due to predation, competition,
symbiosis and disease. Outline your recommendations to improve or manage the site as habitat for the spotted-tailed quoll. How can we as a nation, reduce the extinction rates of our native animals? Why is it important (or not important) to ensure that native animals survive in the Australian landscape?
Use evidence to support your argument
Post Visit task 4 – CommunicatingChoose one of the following options to communicate your depth study findings.
12

Work in small groups to develop a 5-6 minute documentary on the results of your field study. Include all your research, findings and recommendations. Please share with us at Brewongle EEC
Write a scientific report to communicating your findings Choose an appropriate ICT visual communication form to present your findings (eg Powerpoint, Prezi,
Google Slide)
13

14