sensing international journal of remote · results. this approach is applied to the modis image in...
TRANSCRIPT

This article was downloaded by: [Indiana University Libraries], [Dengsheng Lu]On: 01 August 2011, At: 10:21Publisher: Taylor & FrancisInforma Ltd Registered in England and Wales Registered Number: 1072954 Registeredoffice: Mortimer House, 37-41 Mortimer Street, London W1T 3JH, UK
International Journal of RemoteSensingPublication details, including instructions for authors andsubscription information:http://www.tandfonline.com/loi/tres20
Fractional forest cover mapping in theBrazilian Amazon with a combination ofMODIS and TM imagesDengsheng Lu a , Mateus Batistella b , Emilio Moran a , ScottHetrick a , Diogenes Alves c & Eduardo Brondizio aa Anthropological Center for Training and Research on GlobalEnvironmental Change (ACT), Indiana University, Bloomington, IN,47405, USAb Brazilian Agricultural Research Corporation, EMBRAPA SatelliteMonitoring, Campinas, São Paulo, Brazilc Instituto Nacional de Pesquisas Espaciais (INPE), Divisao deProcessamento de Imagens (DPI), Sao Jose dos Campos, Brazil
Available online: 01 Aug 2011
To cite this article: Dengsheng Lu, Mateus Batistella, Emilio Moran, Scott Hetrick, DiogenesAlves & Eduardo Brondizio (2011): Fractional forest cover mapping in the Brazilian Amazonwith a combination of MODIS and TM images, International Journal of Remote Sensing,DOI:10.1080/01431161.2010.519004
To link to this article: http://dx.doi.org/10.1080/01431161.2010.519004
PLEASE SCROLL DOWN FOR ARTICLE
Full terms and conditions of use: http://www.tandfonline.com/page/terms-and-conditions
This article may be used for research, teaching and private study purposes. Anysubstantial or systematic reproduction, re-distribution, re-selling, loan, sub-licensing,systematic supply or distribution in any form to anyone is expressly forbidden.
The publisher does not give any warranty express or implied or make any representationthat the contents will be complete or accurate or up to date. The accuracy of anyinstructions, formulae and drug doses should be independently verified with primary

sources. The publisher shall not be liable for any loss, actions, claims, proceedings,demand or costs or damages whatsoever or howsoever caused arising directly orindirectly in connection with or arising out of the use of this material.
Dow
nloa
ded
by [
Indi
ana
Uni
vers
ity L
ibra
ries
], [
Den
gshe
ng L
u] a
t 10:
21 0
1 A
ugus
t 201
1

International Journal of Remote SensingiFirst, 2011, 1–19
Fractional forest cover mapping in the Brazilian Amazon with acombination of MODIS and TM images
DENGSHENG LU*†, MATEUS BATISTELLA‡, EMILIO MORAN†, SCOTTHETRICK†, DIOGENES ALVES§ and EDUARDO BRONDIZIO†
†Anthropological Center for Training and Research on Global Environmental Change(ACT), Indiana University, Bloomington, IN 47405, USA
‡Brazilian Agricultural Research Corporation, EMBRAPA Satellite Monitoring,Campinas, São Paulo, Brazil
§Instituto Nacional de Pesquisas Espaciais (INPE), Divisao de Processamento deImagens (DPI), Sao Jose dos Campos, Brazil
(Received 27 March 2009; in final form 5 July 2010)
High deforestation rates in Amazonia have motivated considerable efforts to mon-itor forest changes with satellite images, but mapping forest distribution andmonitoring change at a regional scale remain a challenge. This article proposesa new approach based on the integrated use of Moderate Resolution ImagingSpectroradiometer (MODIS) and Landsat Thematic Mapper (TM) images torapidly map forest distribution in Rondônia, Brazil. The TM images are used todifferentiate forest and non-forest areas and the MODIS images are used to extractthree fraction images (vegetation, shade and soil) with linear spectral mixture anal-ysis (LSMA). A regression model is built to calibrate the MODIS-derived forestresults. This approach is applied to the MODIS image in 2004 and is then trans-ferred to other MODIS images. Compared to INPE PRODES (Brazil’s InstitutoNacional de Pesquisas Espaciais – Programme for the Estimation of Deforestationin the Brazilian Amazon) data, the errors for total forest area estimates in 2000,2004 and 2006 are −0.97%, 0.81% and −1.92%, respectively. This research pro-vides a promising approach for mapping fractional forest (proportion of forestcover area in a pixel) distribution at a regional scale. The major advantage is thatthis procedure can rapidly provide the spatial and temporal patterns of fractionalforest cover distribution at a regional scale by the integrated use of MODIS imagesand a limited number of Landsat images.
1. Introduction
The increasing world population and associated urbanization and environmentaldegradation have resulted in a continuous decrease in the world’s forest area, espe-cially primary forest (FAO 2006, 2007). Providing timely forest resource informationat regional and global scales is important for addressing biodiversity, climate change,desertification and environmental problems (FAO 2006). Deforestation has beenrecognized as an important contributor to carbon emissions, climate change andloss of biodiversity (Skole et al. 1994, Fearnside 1996, 2005, Tian et al. 1998,
*Corresponding author. Email: [email protected]
International Journal of Remote SensingISSN 0143-1161 print/ISSN 1366-5901 online © 2011 Taylor & Francis
http://www.tandf.co.uk/journalsDOI: 10.1080/01431161.2010.519004
Dow
nloa
ded
by [
Indi
ana
Uni
vers
ity L
ibra
ries
], [
Den
gshe
ng L
u] a
t 10:
21 0
1 A
ugus
t 201
1

2 D. Lu et al.
Hirsch et al. 2004). The Brazilian Amazon basin contains the largest continu-ous rainforest in the world. Its vast areas of tropical forest represent a potentiallylarge source of carbon/greenhouse gases emissions if deforested. Since the 1970s,deforestation in this region has increased from 152 000 km2 in 1978 to 718 550km2 in 2007 (Alves 2007, INPE 2008). To monitor the deforestation rate, Brazil’sInstituto Nacional de Pesquisas Espaciais (INPE) has developed two systems: theProgramme for the Estimation of Deforestation in the Brazilian Amazon (PRODES;www.obt.inpe.br/prodes/) and the Real Time Deforestation Monitoring System(DETER; www.obt.inpe.br/deter/). PRODES uses Landsat Thematic Mapper (TM)images mostly acquired during the dry season (May–September for regions south ofthe equator, November–March for northern parts of the basin) for detection of newlydeforested areas and estimation of annual deforestation rates in the Legal Amazon(The Legal Amazon is the largest socio-geographic division of the South Americannation of Brazil, containing all of its territory in the Amazon Basin, encompass-ing all seven states of the north region (Acre, Amapá, Amazonas, Pará, Rondônia,Roraima and Tocantins), the centre-west region of Mato Grosso state and the north-east region of Maranhão state) and requires a few months of work to complete anentire survey (Hansen et al. 2008b). Cloud cover in the Amazon often makes it diffi-cult to obtain cloud-free TM images (Asner 2001). DETER uses Moderate ResolutionImaging Spectroradiometer (MODIS) data to identify new clearing hotspots in areasgreater than 25 ha, but does not produce estimates of deforestation.
Remotely sensed data have become a primary data source for mapping landuse/cover distribution and monitoring its changes at different scales (Franklin andWulder 2002). Many approaches have been developed for land-cover classifica-tion (Lu and Weng 2007) but most of them are based on the spectral features ofremotely sensed data, where each pixel is classified into one class, even using coarsespatial resolution data from, for example, the National Oceanic and AtmosphericAdministration (NOAA) Advanced Very High Resolution Radiometer (AVHRR),Satellite Pour l’Observation de la Terre (SPOT) VEGETATION and MODIS(DeFries and Townshend 1994, DeFries et al. 1998, Hansen et al. 2000, Friedl et al.2002, Latifovic et al. 2004, Giri et al. 2005, Lowry et al. 2007). Landsat images areprobably the most common data source used for land use/cover classification (Adamset al. 1995, Roberts et al. 2002, Vieira et al. 2003, Lu et al. 2004, 2008) because oftheir suitable spectral and spatial resolutions (Franklin and Wulder 2002). However,for regional or global land-cover assessments, the relatively small-scene footprint ofmedium spatial resolution images such as Landsat TM require huge volumes of data,making their use difficult due to prohibitive amounts of processing time and labour.An additional difficulty is data acquisition in conditions of low revisit time becauseof cloud cover over large areas, especially in the moist tropical regions. Hence, coarsespatial resolution images such as AVHRR, SPOT VEGETATION and MODIS areoften used for regional or global land-cover mapping (Latifovic et al. 2004, Wesselset al. 2004, Giri et al. 2005).
Different approaches have been used for land-cover mapping using coarse spatialresolution images at regional and global scales (e.g. Sedano et al. 2005, Carreiraset al. 2006a). Although pixel-based classification approaches are frequently used forregional or global land-cover mapping, land-cover estimations show large uncertain-ties (Wang and Tenhunen 2004, Waser and Schwarz 2006, Sivanpillai et al. 2007)because of the mixed pixel problem. In traditional per-pixel classifications, selec-tion of training samples for image classifications and selection of test samples for
Dow
nloa
ded
by [
Indi
ana
Uni
vers
ity L
ibra
ries
], [
Den
gshe
ng L
u] a
t 10:
21 0
1 A
ugus
t 201
1

Forest cover mapping 3
accuracy assessment are often very difficult with coarse spatial resolution images(McIver and Friedl 2001). An alternative solution is to develop approaches to estimatethe fraction of land cover within each pixel by linking coarse spatial resolution withmedium spatial resolution images (Hansen and DeFries 2004, Latifovic and Olthof2004). Considerable efforts have been made to reduce the mixed pixel problem andmany techniques have been explored (Shimabukuro and Smith 1991, 1995, Iversonet al. 1994, Zhu and Evans 1994, Mayaux and Lambin 1995, DeFries et al. 1997,2000, Foody et al. 1997, Hagen et al. 2002, Hansen et al. 2002a,b, 2003, Braswellet al. 2003, Hansen and DeFries 2004, Haertel and Shimabukuro 2005, Schwarzand Zimmermann 2005, Carreiras et al. 2006b, Olthof and Fraser 2007, Tottrupet al. 2007), including regression trees, regression models and linear spectral mixturealgorithms.
Previous research has been mainly site specific, and therefore transferability of thedeveloped models to different data sets for estimation of fractional land cover has notbeen examined. The main reason is that the previous approaches are based on theuse of spectral responses which are often influenced by the variation of biophysicalenvironments. The objectives of the current research were to test a new approach totimely and accurately map fractional forest area (i.e. the proportion of primary forestaccounted for in a pixel) at a regional scale with the integration of coarse and mediumspatial resolution images in the moist tropical region in the Brazilian Amazon, and toexplore the model transferability among different image datasets in Rondônia, Brazil.The proposed method can rapidly update forest change data sets with limited time andlabour, in comparison with the PRODES, which requires intensive labour and time indeveloping forest data using Landsat TM data and has difficulty in collecting cloud-free images, and DETER, which only detects hotspots with deforestation areas greaterthan 25 ha. Another advantage of the proposed method lies in its model transfer inimproving forest area estimation accuracy without the use of Landsat images after thecalibration model is established.
2. Method
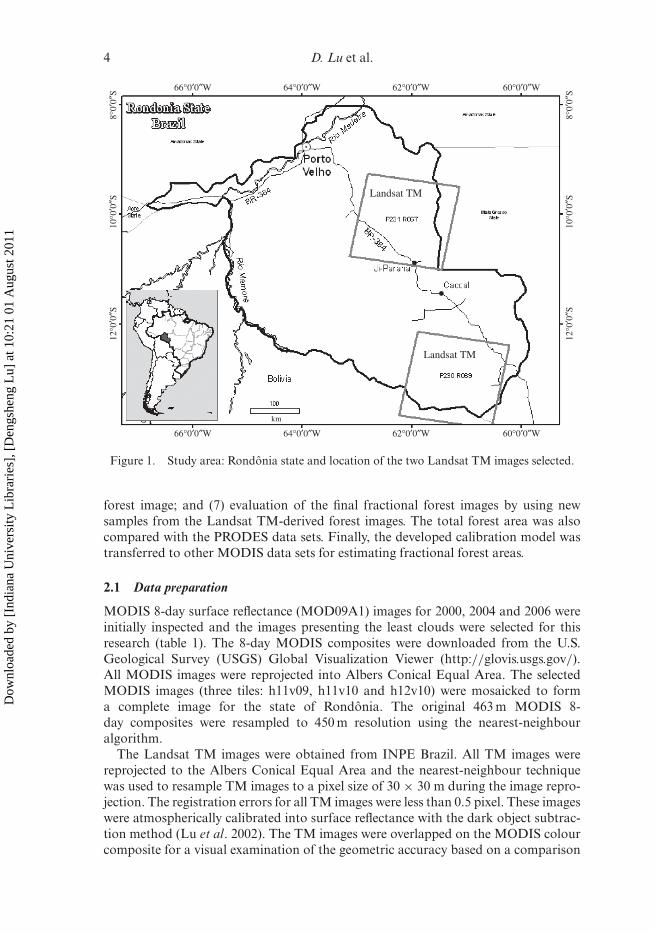
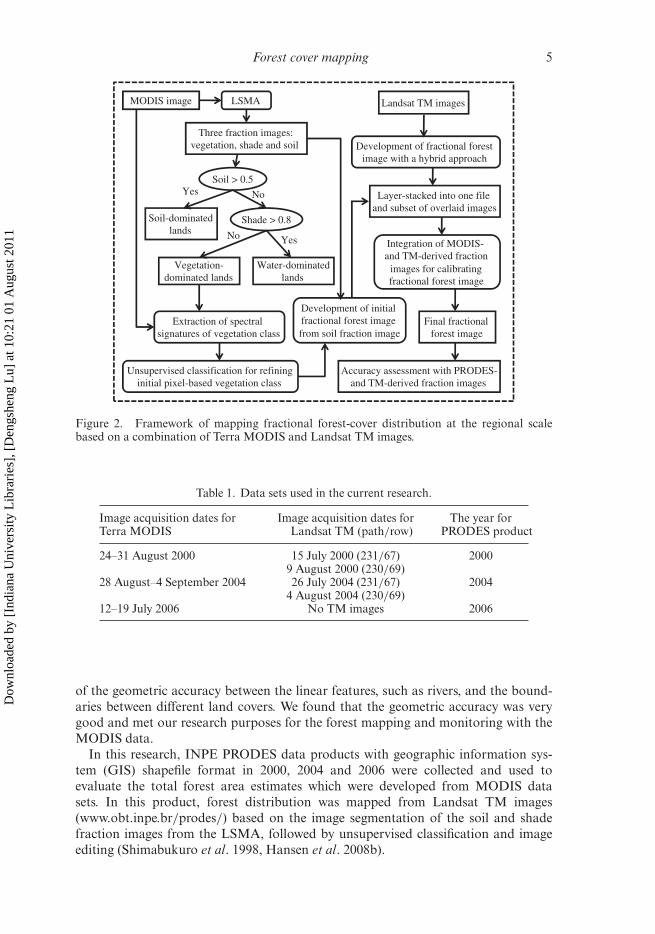
Rondônia is located in the northwest region of the Brazil Amazon and was selected asthe study area in this research (figure 1). Rondônia ranks third in the largest deforesta-tion percentages over time in the Brazilian Amazon (the first two largest deforestationstates are Mato Grosso and Pará) (INPE 2008). To improve area estimation accuracyand the spatial patterns of forest distribution, the development of new approachesfor mapping fractional forest cover distribution is necessary. Figure 2 illustrates theframework for estimating fractional forest cover at a regional scale. Fractional for-est cover means the proportion of primary forest accounted for in a pixel (e.g. in aMODIS pixel). The major steps include (1) development of green vegetation, shadeand soil fraction images with linear spectral mixture analysis (LSMA) of the MODISmultispectral image; (2) extraction of an initial vegetation class using a thresholdingapproach based on the fraction images; (3) extraction of MODIS spectral signaturesbased on the initial vegetation class and MODIS surface reflectance images; (4) refine-ment of the initial vegetation class to produce a pixel-based forest image; (5) extractionof an initial fractional forest image by combining the soil fraction and the pixel-basedforest image; (6) development of a calibration model for calibrating the initial frac-tional forest image based on the selected samples from the overlapped areas betweenMODIS-derived initial fractional forest image and the Landsat TM-derived fractional
Dow
nloa
ded
by [
Indi
ana
Uni
vers
ity L
ibra
ries
], [
Den
gshe
ng L
u] a
t 10:
21 0
1 A
ugus
t 201
1
4 D. Lu et al.
Landsat TM
66°0′0″W 64°0′0″W 62°0′0″W 60°0′0″W
66°0′0″W 64°0′0″W 62°0′0″W 60°0′0″W
8°0′
0″S
10°0
′0″S
12°0
′0″S
8°0′
0″S
10°0
′0″S
12°0
′0″S
Landsat TM
km
Figure 1. Study area: Rondônia state and location of the two Landsat TM images selected.
forest image; and (7) evaluation of the final fractional forest images by using newsamples from the Landsat TM-derived forest images. The total forest area was alsocompared with the PRODES data sets. Finally, the developed calibration model wastransferred to other MODIS data sets for estimating fractional forest areas.
2.1 Data preparation
MODIS 8-day surface reflectance (MOD09A1) images for 2000, 2004 and 2006 wereinitially inspected and the images presenting the least clouds were selected for thisresearch (table 1). The 8-day MODIS composites were downloaded from the U.S.Geological Survey (USGS) Global Visualization Viewer (http://glovis.usgs.gov/).All MODIS images were reprojected into Albers Conical Equal Area. The selectedMODIS images (three tiles: h11v09, h11v10 and h12v10) were mosaicked to forma complete image for the state of Rondônia. The original 463 m MODIS 8-day composites were resampled to 450 m resolution using the nearest-neighbouralgorithm.
The Landsat TM images were obtained from INPE Brazil. All TM images werereprojected to the Albers Conical Equal Area and the nearest-neighbour techniquewas used to resample TM images to a pixel size of 30 × 30 m during the image repro-jection. The registration errors for all TM images were less than 0.5 pixel. These imageswere atmospherically calibrated into surface reflectance with the dark object subtrac-tion method (Lu et al. 2002). The TM images were overlapped on the MODIS colourcomposite for a visual examination of the geometric accuracy based on a comparison
Dow
nloa
ded
by [
Indi
ana
Uni
vers
ity L
ibra
ries
], [
Den
gshe
ng L
u] a
t 10:
21 0
1 A
ugus
t 201
1
Forest cover mapping 5
MODIS image LSMA
Three fraction images:vegetation, shade and soil
Extraction of spectral signatures of vegetation class
Unsupervised classification for refininginitial pixel-based vegetation class
Integration of MODIS-and TM-derived fraction
images for calibrating fractional forest image
Soil-dominatedlands
Soil > 0.5
Shade > 0.8
Water-dominatedlands
Vegetation-dominated lands
Development of initial fractional forest image from soil fraction image
Landsat TM images
Layer-stacked into one file and subset of overlaid images
Final fractional forest image
Accuracy assessment with PRODES- and TM-derived fraction images
Development of fractional forest image with a hybrid approach
Yes
Yes
No
No
Figure 2. Framework of mapping fractional forest-cover distribution at the regional scalebased on a combination of Terra MODIS and Landsat TM images.
Table 1. Data sets used in the current research.
Image acquisition dates forTerra MODIS
Image acquisition dates forLandsat TM (path/row)
The year forPRODES product
24–31 August 2000 15 July 2000 (231/67) 20009 August 2000 (230/69)
28 August–4 September 2004 26 July 2004 (231/67) 20044 August 2004 (230/69)
12–19 July 2006 No TM images 2006
of the geometric accuracy between the linear features, such as rivers, and the bound-aries between different land covers. We found that the geometric accuracy was verygood and met our research purposes for the forest mapping and monitoring with theMODIS data.
In this research, INPE PRODES data products with geographic information sys-tem (GIS) shapefile format in 2000, 2004 and 2006 were collected and used toevaluate the total forest area estimates which were developed from MODIS datasets. In this product, forest distribution was mapped from Landsat TM images(www.obt.inpe.br/prodes/) based on the image segmentation of the soil and shadefraction images from the LSMA, followed by unsupervised classification and imageediting (Shimabukuro et al. 1998, Hansen et al. 2008b).
Dow
nloa
ded
by [
Indi
ana
Uni
vers
ity L
ibra
ries
], [
Den
gshe
ng L
u] a
t 10:
21 0
1 A
ugus
t 201
1
6 D. Lu et al.
2.2 Mapping forest cover distribution from Landsat images
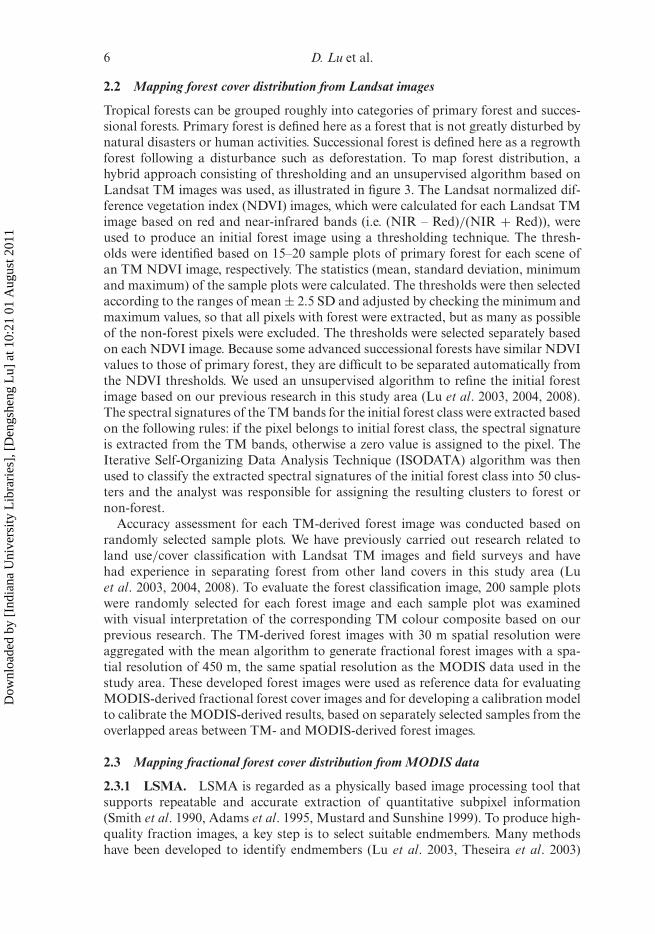
Tropical forests can be grouped roughly into categories of primary forest and succes-sional forests. Primary forest is defined here as a forest that is not greatly disturbed bynatural disasters or human activities. Successional forest is defined here as a regrowthforest following a disturbance such as deforestation. To map forest distribution, ahybrid approach consisting of thresholding and an unsupervised algorithm based onLandsat TM images was used, as illustrated in figure 3. The Landsat normalized dif-ference vegetation index (NDVI) images, which were calculated for each Landsat TMimage based on red and near-infrared bands (i.e. (NIR – Red)/(NIR + Red)), wereused to produce an initial forest image using a thresholding technique. The thresh-olds were identified based on 15–20 sample plots of primary forest for each scene ofan TM NDVI image, respectively. The statistics (mean, standard deviation, minimumand maximum) of the sample plots were calculated. The thresholds were then selectedaccording to the ranges of mean ± 2.5 SD and adjusted by checking the minimum andmaximum values, so that all pixels with forest were extracted, but as many as possibleof the non-forest pixels were excluded. The thresholds were selected separately basedon each NDVI image. Because some advanced successional forests have similar NDVIvalues to those of primary forest, they are difficult to be separated automatically fromthe NDVI thresholds. We used an unsupervised algorithm to refine the initial forestimage based on our previous research in this study area (Lu et al. 2003, 2004, 2008).The spectral signatures of the TM bands for the initial forest class were extracted basedon the following rules: if the pixel belongs to initial forest class, the spectral signatureis extracted from the TM bands, otherwise a zero value is assigned to the pixel. TheIterative Self-Organizing Data Analysis Technique (ISODATA) algorithm was thenused to classify the extracted spectral signatures of the initial forest class into 50 clus-ters and the analyst was responsible for assigning the resulting clusters to forest ornon-forest.
Accuracy assessment for each TM-derived forest image was conducted based onrandomly selected sample plots. We have previously carried out research related toland use/cover classification with Landsat TM images and field surveys and havehad experience in separating forest from other land covers in this study area (Luet al. 2003, 2004, 2008). To evaluate the forest classification image, 200 sample plotswere randomly selected for each forest image and each sample plot was examinedwith visual interpretation of the corresponding TM colour composite based on ourprevious research. The TM-derived forest images with 30 m spatial resolution wereaggregated with the mean algorithm to generate fractional forest images with a spa-tial resolution of 450 m, the same spatial resolution as the MODIS data used in thestudy area. These developed forest images were used as reference data for evaluatingMODIS-derived fractional forest cover images and for developing a calibration modelto calibrate the MODIS-derived results, based on separately selected samples from theoverlapped areas between TM- and MODIS-derived forest images.
2.3 Mapping fractional forest cover distribution from MODIS data
2.3.1 LSMA. LSMA is regarded as a physically based image processing tool thatsupports repeatable and accurate extraction of quantitative subpixel information(Smith et al. 1990, Adams et al. 1995, Mustard and Sunshine 1999). To produce high-quality fraction images, a key step is to select suitable endmembers. Many methodshave been developed to identify endmembers (Lu et al. 2003, Theseira et al. 2003)
Dow
nloa
ded
by [
Indi
ana
Uni
vers
ity L
ibra
ries
], [
Den
gshe
ng L
u] a
t 10:
21 0
1 A
ugus
t 201
1
Forest cover mapping 7
Landsat TM images
Image preprocessing(image registration and atmospheric calibration)
Calibrated TM imagesNDVI
(TM4 – TM3)/(TM4 + TM3)
Develop initial forest imagewith thresholding approach
Extraction of spectral signaturesfor initial forest image
Refining the initial forest image with unsupervised classification
Final forest image with 30 m spatial resolution
Produce fractional forest image byresampling 30 – 450 m
Figure 3. Strategy of mapping forest distribution at the local scale from Landsat TM imageswith a hybrid approach. TM4 and TM3 represent the spectral bands 4 (near-infrared) and 3(red wavelength) in Landsat TM imagery.
and image-based endmember selection approaches are often used. Previous studieshave shown that the use of a minimum noise fraction (MNF) transform can improvethe quality of fraction images (Cochrane and Souza 1998, van der Meer and de Jong2000). In this research, the MNF procedure was applied to transform the six MODISspectral bands into a new coordinate set, of which the first three MNF componentsaccounted for the majority of the information (approximately 99%) in the MODISdata. During endmember selection, it is important to consider the spatial scale of thedata sets used and to avoid outliers when endmembers are determined from the imageitself (Lu et al. 2003, 2004). In this research, three endmembers (vegetation, shade andsoil) were selected from the MNF components with the assistance of the Landsat TMimages. The shade endmember is usually difficult to identify from the MODIS image,but clear and deep water can be used as a proxy (Shimabukuro and Smith 1995). Bylinking MODIS colour composite and corresponding TM images, the vegetation end-member was initially selected from the areas of dense secondary forests and the soilendmember was initially selected from bare soils in agricultural lands. These initialendmembers were compared with those endmembers selected from the scatterplot ofthe first and second MNF components and the scatterplot of the first and third MNFcomponents. The endmembers whose curves were similar but located at the extremevertices of the scatterplot were finally selected. In this way, the impact of cloud or
Dow
nloa
ded
by [
Indi
ana
Uni
vers
ity L
ibra
ries
], [
Den
gshe
ng L
u] a
t 10:
21 0
1 A
ugus
t 201
1
8 D. Lu et al.
shadow contamination on the MODIS images was avoided. After selection of the end-members, a constrained least-squares solution was applied to unmix the six MODISspectral bands (MODIS band 5 was not used due to the striping problem) into frac-tion images. The same procedure was used separately to develop fraction images fromeach MODIS image.
2.3.2 Extraction of pixel-based forest images from MODIS images. Three majorland covers (a soil-dominated class, a water-dominated class and a vegetation-dominated class) were first classified using thresholds based on soil and shade fractionimages, as shown in figure 2. A comparative analysis between Landsat TM images andthe MODIS-derived fraction images indicated that urban areas, pasture and someinitial successional vegetation in the dry season had high values in the soil fractionimages, and water or wetland with less vegetation cover had high values in the shadefraction image. After these non-forest land covers with high values in the soil andshade fraction images were masked out with a thresholding technique, the remain-ing pixels were the vegetation-dominated class, including primary forest and advancedsuccessional forest. To further refine the vegetation-dominated class, MODIS surfacereflectance for the vegetation-dominated class was extracted and the ISODATA algo-rithm was used to classify the extracted MODIS reflectance image into 60 clusters.The analyst was then responsible for assigning the clusters into forest and non-forestclasses with the assistance of the Landsat TM images.
2.3.3 Extraction of the initial fraction forest image from the soil fraction image.Previous research has indicated that vegetation and shade fractions are good param-eters reflecting forest stand structures (Sabol et al. 2002, Lu et al. 2003). However,the vegetation and shade fractions are more sensitive to seasonal variation than thesoil fraction (Lu et al. 2003). By contrast, the soil fraction has proven to be reliablefor detecting forest changes in the Amazon (Anderson et al. 2005). From the view ofremote sensing spectral signatures, the components of forested lands can be assumedto be composed of green vegetation, canopy shade, non-photosynthetic vegetation(NPV; i.e. branches and stems) and soil. For dense forest lands, the soil fraction isclose to zero. Forest may be mixed with other land covers when the forested land isless than 25 ha. This is especially true in the boundaries between forest and other landcovers and the forest remnants. To improve the forest estimation accuracy and thespatial pattern of forest distribution, excluding the non-forest proportion in the mixedpixels is necessary. When only three endmembers are used, the proportion of forestarea in a pixel includes green vegetation and canopy-cast shadow. The sum of vegeta-tion, shade and soil fractions should be unity if the error is ignored. Considering thereliability of the soil fraction in multitemporal MODIS images, the fractional forestcover area in a pixel is thus defined as:
fforest = 1 − fsoil (1)
where f forest and f soil are the proportion of forest and soil cover in a pixel, respectively,and their values are between 0 and 1. As the pixel-based forest image had alreadybeen developed using the combination of the thresholding technique and unsuper-vised classification, the linkage of the pixel-based forest image and the f forest image was
Dow
nloa
ded
by [
Indi
ana
Uni
vers
ity L
ibra
ries
], [
Den
gshe
ng L
u] a
t 10:
21 0
1 A
ugus
t 201
1
Forest cover mapping 9
used to produce the fractional forest image by excluding the non-forest pixels with thefollowing rule: if the pixel belongs to the forest class in the pixel-based forest image,the pixel value is extracted from the f forest image, otherwise a value of zero is assignedto the pixel. This hybrid approach based on LSMA, thresholding and unsupervisedclassification for mapping fractional forest cover distribution was first examined in the2004 MODIS image, and then applied to f forest and 2006 MODIS data.
2.4 Development of a calibration model and its application at a regional scale
Evaluation of the MODIS-derived fraction forest image with the Landsat-derivedfractional forest images indicated that a systematic underestimation occurred for thepixels with a relatively small proportion of forest area in a pixel. Therefore, developinga calibration model for modifying the MODIS-based fractional forest images was nec-essary. A calibration model was first developed with the regression analysis based onthe 2004 TM- and MODIS-derived fractional forest images. The TM- and MODIS-derived fractional forest images were stacked into one file and the overlapping areaswere then cut out for further analysis. Pixel samples were selected on the overlappedTM- and MODIS-derived fraction images at every five pixels, considering the sizeof sample population and the correlation between neighbouring pixels. The selectedsamples were used to develop a regression model in which the TM-derived fractionimage was used as the dependent variable and the MODIS-derived fraction imageas the independent variable. Analysis of the scatterplot between the two variablesfrom the TM- and MODIS-derived fractional forest images indicated a linear rela-tionship between these two variables. Thus, a linear regression model was developedand then used to calibrate the MODIS-derived fraction images. The correlation coef-ficients between the reference data and the MODIS estimates were also calculated tofurther evaluate the quality of model fit. The developed model based on the 2004 TMand MODIS data was transferred to other MODIS-derived fractional forest imagesrespectively, to calibrate the fractional forest areas and to examine the feasibility ofmodel transferability.
2.5 Accuracy assessment
Accuracy assessment is important in evaluating model performance and the reliabilityof the results. The overall accuracy, kappa coefficient, and the producer’s and user’saccuracy are often used to evaluate the land-cover classification accuracy (Congalton1991, Foody 2002). However, they are valid only for pixel-based classification images.In this research we used the root mean square error (RMSE) and system error (SE)to evaluate the MODIS-derived fractional forest images. In general, lower values ofthe RSME and SE indicate higher accuracy of the results. Use of SE also indicateswhether the results are underestimated or overestimated within error ranges.
Three levels of window sizes (one pixel, nine pixels (3 × 3) and 25 pixels (5 × 5))were selected to examine how the estimation errors changed as selected window sizesvaried. The samples were independently selected from the overlapping areas betweenthe selected TM- and MODIS-images. The stacked file including TM and MODISoverlapped areas with 450 m spatial resolution was further aggregated into 1350 m(i.e. 3 × 3 window size) and 2250 m (i.e. 5 × 5 window size) with a mean algorithm.The sampling intervals of 10, 5 and 3 on the MODIS-derived images with a spatialresolution of 450, 1350 and 2250 m, respectively, were used to select sample plots forthe accuracy assessment.
Dow
nloa
ded
by [
Indi
ana
Uni
vers
ity L
ibra
ries
], [
Den
gshe
ng L
u] a
t 10:
21 0
1 A
ugus
t 201
1

10 D. Lu et al.
In addition to the accuracy assessment based on samples, the total forest area devel-oped from the MODIS data sets was compared with the INPE PRODES data set,which was developed from Landsat TM images (Hansen et al. 2008b, INPE 2008).Because the PRODES data set is only available in a GIS shapefile (vector format)with geographic projection, it cannot be used directly for comparison with MODIS-derived results (raster format) at the pixel level. Therefore, the total forest areas fromthe PRODES products for 2000, 2004 and 2006 were calculated and compared tothe corresponding MODIS-derived total forest areas. The overall error of forest area(OEF) for each year was calculated with following equation:
OEF = (EMODIS − EPRODES)
EPRODES× 100 (2)
where EMODIS and EPRODES are the total forest areas estimated from the MODIS-derived fractional forest image and the reference forest area calculated from thePRODES product.
3. Results
3.1 Evaluation of Landsat-derived forest images
Accurate extraction of forest areas from the Landsat TM images was required becausethe extracted forest images were used as reference data for developing the models forcalibrating the MODIS-derived results. According to the accuracy assessment results,an overall accuracy of more than 97% for each Landsat-derived forest image wasachieved. In this research, the developed per-pixel based forest images with 30 m spa-tial resolution were aggregated to 450 m spatial resolution to produce the fractionalforest images. These fractional forest images were then used for developing a calibra-tion model and for conducting the accuracy assessment of the MODIS-derived forestproducts separately with independently selected samples.
3.2 Accuracy assessment of the MODIS-derived products
The accuracy assessment indicated that, before calibration, the forest areas derivedfrom the MODIS data were underestimated and had high errors. Table 2 summarizesthe errors with three levels of window sizes based on two Landsat-derived fractionalforest images for both 2000 and 2004. The percentages of RMSE and SE are 26.6%and −11.1% at the single pixel level, and 15.6% and −9.4% for 5 × 5 window sizes,respectively. As the window size increased, RMSE and SE were reduced, and the cor-relation coefficient between the reference and estimate increased. This implies thatthe MODIS-derived fractional forest estimates may have high errors for single pixels,but these errors would be gradually decreased in a large area; thus MODIS data aresuitable for mapping forest distribution in a large area.
Examining the scatterplots between the samples from the MODIS- and TM-derivedfraction images confirmed the underestimation as shown in table 2. Figure 4 providesan example of the scatterplot between the MODIS- and TM-derived forest samplesin 2004, indicating that a very good linear relationship existed between the TM- andMODIS-derived fractions, and the underestimation was prevalent when the propor-tion of forest cover in a pixel was relatively small. The linear relationship illustratedin figure 4 indicates that a linear regression model can be developed to improve the
Dow
nloa
ded
by [
Indi
ana
Uni
vers
ity L
ibra
ries
], [
Den
gshe
ng L
u] a
t 10:
21 0
1 A
ugus
t 201
1
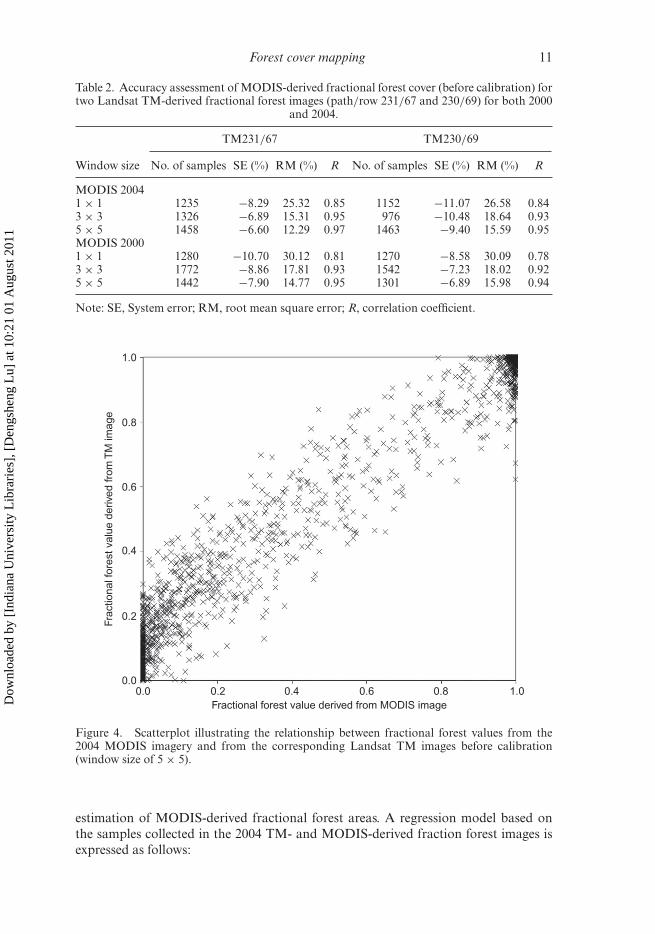
Forest cover mapping 11
Table 2. Accuracy assessment of MODIS-derived fractional forest cover (before calibration) fortwo Landsat TM-derived fractional forest images (path/row 231/67 and 230/69) for both 2000
and 2004.
TM231/67 TM230/69
Window size No. of samples SE (%) RM (%) R No. of samples SE (%) RM (%) R
MODIS 20041 × 1 1235 −8.29 25.32 0.85 1152 −11.07 26.58 0.843 × 3 1326 −6.89 15.31 0.95 976 −10.48 18.64 0.935 × 5 1458 −6.60 12.29 0.97 1463 −9.40 15.59 0.95MODIS 20001 × 1 1280 −10.70 30.12 0.81 1270 −8.58 30.09 0.783 × 3 1772 −8.86 17.81 0.93 1542 −7.23 18.02 0.925 × 5 1442 −7.90 14.77 0.95 1301 −6.89 15.98 0.94
Note: SE, System error; RM, root mean square error; R, correlation coefficient.
1.0
0.8
0.6
Fra
ction
al fo
rest valu
e d
erive
d fro
m T
M im
age
0.4
0.2
0.00.0 0.2 0.4
Fractional forest value derived from MODIS image
0.6 0.8 1.0
Figure 4. Scatterplot illustrating the relationship between fractional forest values from the2004 MODIS imagery and from the corresponding Landsat TM images before calibration(window size of 5 × 5).
estimation of MODIS-derived fractional forest areas. A regression model based onthe samples collected in the 2004 TM- and MODIS-derived fraction forest images isexpressed as follows:
Dow
nloa
ded
by [
Indi
ana
Uni
vers
ity L
ibra
ries
], [
Den
gshe
ng L
u] a
t 10:
21 0
1 A
ugus
t 201
1
12 D. Lu et al.
y = 0.8611x + 0.1262 when x > 0 (3)
otherwise, y = 0 when x = 0 (4)
where y is the calibrated fractional forest value and x is the MODIS-derived frac-tional forest value. The R2 value for this regression model is 0.945. This model wasfirst applied to calibrate the fractional forest area from the 2004 MODIS-derivedimage, and then transferred to the 2000 and 2006 MODIS-derived products. Aftercalibration, the SE and RMSE at the per-pixel level were, respectively, 1.56% and4.19% in 2004, and 2.37% and 5.58% in 2000. The accuracy assessment also indicatedthat errors after calibration were reduced, implying that calibration is necessary forimproving the MODIS-derived fraction images.
An alternative accuracy assessment involved comparing the total forest areasbetween the MODIS-derived forest images and INPE PRODES product. The forestareas for 2000, 2004 and 2006 were calculated based on the PRODES shapefile imagesand the corresponding MODIS-derived forest images. The evaluation results are sum-marized in table 3, which shows that the total forest areas derived from the MODISimages in 2000, 2004 and 2006 are very close to the INPE PRODES results, with anaccuracy as high as 98%. These results indicate that MODIS data can be successfullyused for forest mapping at a regional scale.
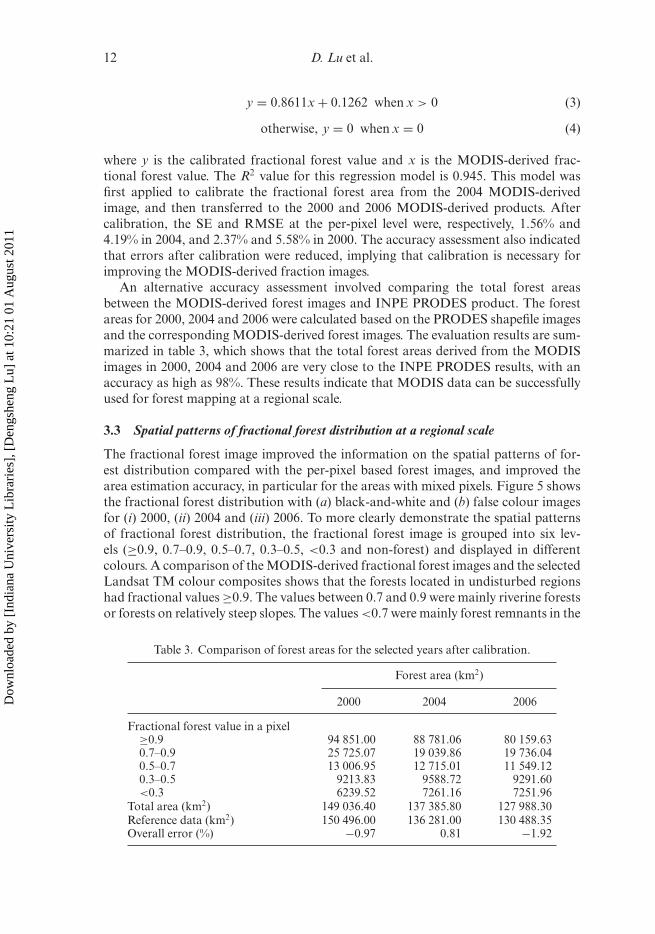
3.3 Spatial patterns of fractional forest distribution at a regional scale
The fractional forest image improved the information on the spatial patterns of for-est distribution compared with the per-pixel based forest images, and improved thearea estimation accuracy, in particular for the areas with mixed pixels. Figure 5 showsthe fractional forest distribution with (a) black-and-white and (b) false colour imagesfor (i) 2000, (ii) 2004 and (iii) 2006. To more clearly demonstrate the spatial patternsof fractional forest distribution, the fractional forest image is grouped into six lev-els (≥0.9, 0.7–0.9, 0.5–0.7, 0.3–0.5, <0.3 and non-forest) and displayed in differentcolours. A comparison of the MODIS-derived fractional forest images and the selectedLandsat TM colour composites shows that the forests located in undisturbed regionshad fractional values ≥0.9. The values between 0.7 and 0.9 were mainly riverine forestsor forests on relatively steep slopes. The values <0.7 were mainly forest remnants in the
Table 3. Comparison of forest areas for the selected years after calibration.
Forest area (km2)
2000 2004 2006
Fractional forest value in a pixel≥0.9 94 851.00 88 781.06 80 159.630.7–0.9 25 725.07 19 039.86 19 736.040.5–0.7 13 006.95 12 715.01 11 549.120.3–0.5 9213.83 9588.72 9291.60<0.3 6239.52 7261.16 7251.96
Total area (km2) 149 036.40 137 385.80 127 988.30Reference data (km2) 150 496.00 136 281.00 130 488.35Overall error (%) −0.97 0.81 −1.92
Dow
nloa
ded
by [
Indi
ana
Uni
vers
ity L
ibra
ries
], [
Den
gshe
ng L
u] a
t 10:
21 0
1 A
ugus
t 201
1

Forest cover mapping 13
(i) Fractional forest
cover in 2000
(a)
(i)
(ii)
(iii)
Legend
Non-forest≥0.9
0.7−0.90.5−0.70.3−0.5<0.3
Ν
(b)
(ii) Fractional forest
cover in 2004
(iii) Fractional forest
cover in 2006
0 100
km
200
Figure 5. The estimated fractional forest cover images from (a) MODIS surface reflectanceimages in (i) 2000, (ii) 2004 and (ii) 2006 and (b) the corresponding sliced false colour imagesin Rondônia. The black-and-white images show forest cover distribution with white as the highproportion of forest cover in a pixel and black as no or a very small proportion of forest cover ina pixel. To better express the spatial patterns of forest distribution, the fraction value (propor-tion of forest cover in a pixel) was grouped into five levels and assigned a colour correspondingto each level.
Dow
nloa
ded
by [
Indi
ana
Uni
vers
ity L
ibra
ries
], [
Den
gshe
ng L
u] a
t 10:
21 0
1 A
ugus
t 201
1
14 D. Lu et al.
deforested regions. As shown in table 3, the deforestation in Rondônia was obvious.The total forest area decreased from 149 036 km2 in 2000 to 137 386 km2 in 2004, andto 127 988 km2 in 2006. During the 6 years, 21 048 km2 forested areas were deforestedaccording to the MODIS-derived results, comparing with 20 008 km2 according to theINPE PRODES product for the same time period.
4. Discussion
This research indicates that the combination of MODIS images and a limited numberof TM images can be successfully used to map forest distribution and monitor forestchange at a regional scale. This approach can rapidly update the spatial database offorest distribution with limited time and labour. Without calibration with the TM-derived results, the MODIS-based forest estimates underestimated the forest areas,especially when the forest cover accounted for a relatively small proportion in a pixel.In the coarse spatial resolution image, when forest is mixed with other land cover,especially soil-dominated lands such as pastures and agricultural lands in the dry sea-son, other land-cover information may be highlighted in the spectral signatures, andthus the soil fraction may be overestimated in the LSMA approach. NPV (e.g. stemsand branches) has a similar spectral signature to that of soil (Roberts et al. 1998).When NPV is not used in the LSMA, the soil fraction is often overestimated, and thusforest fraction in a pixel is underestimated. Therefore, calibration is necessary to miti-gate this underestimation. The scatterplot between the MODIS-derived fraction forestvalues and the reference data indicated that there is an SE, resulting in underestima-tion of the fractional forest areas. The linear relationship indicated that it is possibleto develop a regression model to calibrate the MODIS-derived fraction images. Theimproved results after calibration have confirmed that use of the combined MODISand TM images is feasible to rapidly map forest distribution at a regional scale.
One objective of developing models is to apply them to large areas or to differentdata sets. Many factors can affect the model transferability, such as the explanatoryvariables used, the samples collected, and the effects of the biophysical environmenton the explanatory variables. Previous research on fractional forest estimation wasmainly directed at specific sites or data sets (DeFries et al. 2000, Hansen et al. 2002a,b,Tottrup et al. 2007). To our knowledge, no research has explored the transferability ofthe established models to different data sets. The major problem is that the variablesused in these models are dependent on the spectral responses, such as the MODISsurface reflectance and vegetation indices (Iverson et al. 1994, DeFries et al. 1997,Haertel and Shimabukuro 2005, Olthof and Fraser 2007, Tottrup et al. 2007), whichare influenced by the differences in biophysical environments. This research used thesoil fraction image to infer the fractional forest areas and has shown its reliabilitybecause the soil fraction was relatively insensitive to the effects of different biophysicalenvironments when comparing green vegetation and shade fraction images, spectralresponses and vegetation indices for the forested lands (Lu et al. 2003). Examinationof model transferability in different data sets in this research has proven that the samemodel can be used successfully for calibrating MODIS-based estimation results. Thisapproach can reduce considerably the time and labour in mapping forest distributionand monitoring its change at a regional scale with coarse spatial resolution images.
With regard to regional and global land-cover classifications, MODIS data havebecome a major data source. The per-pixel based classification method is still com-mon for land-cover classification on coarse spatial resolution images (Friedl et al.
Dow
nloa
ded
by [
Indi
ana
Uni
vers
ity L
ibra
ries
], [
Den
gshe
ng L
u] a
t 10:
21 0
1 A
ugus
t 201
1
Forest cover mapping 15
2002, Latifovic et al. 2004, Wessels et al. 2004, Giri et al. 2005, Lowry et al. 2007,Hansen et al. 2008b, Potapov et al. 2008). However, large uncertainty often existsdue to the mixed pixel problem in the coarse spatial resolution images (Wang andTenhunen 2004, Waser and Schwarz 2006, Sivanpillai et al. 2007, Hansen et al. 2008b).Therefore, different methods such as LSMA, neural networks and regression tree mod-els have been used to reduce the mixed pixel problem (DeFries et al. 2000, Foodyet al. 1997, Hagen et al. 2002, Carreiras et al. 2006b, Tottrup et al. 2007). In par-ticular, MODIS images have been used to map vegetation continuous fields (VCFs)with the regression tree algorithm (Hansen et al. 2002a,b, 2003), and then the VCFproduct is further used for other applications such as forest mapping and monitor-ing by combining Landsat images (Hansen et al. 2008a). MODIS data are valuablefor coarse land-cover classification such as forest and non-forest separation (Wesselset al. 2004, Tottrup et al. 2007), but difficult for detailed land-cover classification. Toimprove land-cover classification performance, a combination of MODIS and Landsatimages is often adopted (Hansen et al. 2008a, Potapov et al. 2008). This research hasproven the importance of reducing the mixed pixel problem by the use of LSMA andthe necessity of calibrating the MODIS-derived results by the established regressionmodel based on the combination of MODIS- and TM-derived results.
5. Conclusions
Fractional forest cover mapping at a regional scale using coarse spatial resolutionremotely sensed data is a challenge because of the mixed pixel problem. Pixel-basedclassification approaches for regional forest cover mapping from coarse spatial res-olution data can generate large uncertainties. The current research proposes a newapproach to mapping fractional forest areas based on the combined use of mediumand coarse spatial resolution images and indicates that a combination of Landsatimages and MODIS data can be successfully used to map fractional forest areas ata regional scale. The developed model can be transferred to different data sets forcalibrating MODIS-derived fractional forest images. This approach can improve thespatial pattern of fractional forest distribution compared to the pixel-based approach,and can rapidly extract forest cover information with limited time and labour, com-pared with the use of medium spatial resolution images in a large area such asthose used in INPE PRODES. This is especially valuable for timely and accuratelymonitoring forest change in a large area, such as the Amazon region.
AcknowledgementsWe thank the National Aeronautics and Space Administration (NASA) for fundingthe research project entitled ‘Human and Physical Dimensions of Land Use/CoverChange in Amazonia: Towards Sustainability’ (NASA LBA-ECO project no.NNG06GD86A). This project is part of the Large-Scale Biosphere AtmosphereExperiment in Amazônia (LBA) Programme, LC-34, which aims to examine thehuman and physical dimensions of land-cover change.
ReferencesADAMS, J.B., SABOL, D.E., KAPOS, V., FILHO, R.A., ROBERTS, D.A., SMITH, M.O. and
GILLESPIE, A.R., 1995, Classification of multispectral images based on fractions of end-members: application to land-cover change in the Brazilian Amazon. Remote Sensingof Environment, 52, pp. 137–154.
Dow
nloa
ded
by [
Indi
ana
Uni
vers
ity L
ibra
ries
], [
Den
gshe
ng L
u] a
t 10:
21 0
1 A
ugus
t 201
1

16 D. Lu et al.
ALVES, D.S., 2007, Science and technology and sustainable development in the BrazilianAmazon. In The Stability of Tropical Rainforest Margins: Linking Ecological, Economicand Social Constraints of Land Use and Conservation, T. Tscharntke, C. Leuschner, M.Zeller, E. Guhardja and A. Bidin (Eds.), pp. 493–512 (Berlin: Springer-Verlag).
ANDERSON, L., SHIMABUKURO, Y.E., DEFRIES, R.S. and MORTON, D., 2005, Assessment ofdeforestation in near real time over the Brazilian Amazon using multitemporal fractionimages derived from Terra MODIS. IEEE Geoscience and Remote Sensing Letters, 2,pp. 315–318.
ASNER, G.P., 2001, Cloud cover in Landsat observations of the Brazilian Amazon. InternationalJournal of Remote Sensing, 22, pp. 3855–3862.
BRASWELL, B.H., HAGEN, S.C., FROLKING, S. and SALAS, W.A., 2003, A multivariableapproach for mapping subpixel land cover distributions using MISR and MOIDS:application in the Brazilian Amazon region. Remote Sensing of Environment, 87, pp.243–256.
CARREIRAS, J.M.B., PEREIRA, J.M.C., CAMPAGNOLO, M.L. and SHIMABUKURO, Y.E., 2006a,Assessing the extent of agriculture/pasture and secondary succession forest in theBrazilian Legal Amazon using SPOT VEGETATION data. Remote Sensing ofEnvironment, 101, pp. 283–298.
CARREIRAS, J.M.B., PEREIRA, J.M.C. and SHIMABUKURO, Y.E., 2006b, Land cover mappingin the Brazilian Amazon using SPOT-4 VEGETATION data and machine learn-ing classification methods. Photogrammetric Engineering and Remote Sensing, 72, pp.897–910.
COCHRANE, M.A. and SOUZA, C.M., JR., 1998, Linear mixture model classification of burnedforests in the eastern Amazon. International Journal of Remote Sensing, 19, pp.3433–3440.
CONGALTON, R.G., 1991, A review of assessing the accuracy of classification of remotely senseddata. Remote Sensing of Environment, 37, pp. 35–46.
DEFRIES, R.S., HANSEN, M., STEININGER, M., DUBAYAH, R., SOHLBERG, R. and TOWNSHEND,J., 1997, Subpixel forest cover in central Africa from multisensor, multitemporal data.Remote Sensing of Environment, 60, pp. 228–246.
DEFRIES, R., HANSEN, M. and TOWNSHEND, J., 2000, Global continuous fields of vegeta-tion characteristics: a linear mixture model applied to multiyear 8 km AVHRR data.International Journal of Remote Sensing, 21, pp. 1389–1414.
DEFRIES, R.S., HANSEN, M., TOWNSHEND, J.R.G. and SOHLBERG, R., 1998, Global land coverclassifications at 8 km spatial resolution: the use of training data derived from Landsatimagery in decision tree classifiers. International Journal of Remote Sensing, 19, pp.3141–3168.
DEFRIES, R.S. and TOWNSHEND, J.R.G., 1994, NDVI-derived land cover classification at globalscales. International Journal of Remote Sensing, 15, pp. 3567–3586.
FAO, 2006, Global Forest Resources Assessment 2005: Progress Towards Sustainable ForestManagement. Forest Resources Assessment (FRA) Report. FAO Forestry Paper 147(Rome: Food and Agriculture Organization).
FAO, 2007, State of the World’s Forest 2007 (Rome: Food and Agriculture Organization).FEARNSIDE, P.M., 1996, Amazonian deforestation and global warming: carbon stocks in veg-
etation replacing Brazil’s Amazon forest. Forest Ecology and Management, 80, pp.21–34.
FEARNSIDE, P.M., 2005, Deforestation in Brazilian Amazonia: history, rates, and consequences.Conservation Biology, 19, pp. 680–688.
FOODY, G.M., 2002, Status of land cover classification accuracy assessment. Remote Sensing ofEnvironment, 80, pp. 185–201.
FOODY, G.M., LUCAS, R.M., CURRAN, P.J. and HONZAK, M., 1997, Mapping tropical forestfractional cover from coarse spatial resolution remote sensing imagery. Plant Ecology,131, pp. 143–154.
Dow
nloa
ded
by [
Indi
ana
Uni
vers
ity L
ibra
ries
], [
Den
gshe
ng L
u] a
t 10:
21 0
1 A
ugus
t 201
1
Forest cover mapping 17
FRANKLIN, S.E. and WULDER, M.A., 2002, Remote sensing methods in medium spatial resolu-tion satellite data land cover classification of large areas. Progress in Physical Geography,26, pp. 173–205.
FRIEDL, M.A., MCIVER, D.K., HODGES, J.C.F., ZHANG, X.Y., MUCHONEY, D., STRAHLER,A.H., WOODCOCK, C.E., GOPAL, S., SCHNEIDER, A., COOPER, A., BACCINI, A., GAO,F. and SCHAAF, C., 2002, Global land cover mapping from MODIS: algorithms andearly results. Remote Sensing of Environment, 83, pp. 287–302.
GIRI, C., ZHU, Z. and REED, B., 2005, A comparative analysis of the global land cover 2000and MODIS land cover data sets. Remote Sensing of Environment, 94, pp. 123–132.
HAERTEL, V.F. and SHIMABUKURO, Y.E., 2005, Spectral linear mixing model in low spatialresolution image data. IEEE Transactions on Geoscience and Remote Sensing, 43, pp.2555–2562.
HAGEN, S.C., BRASWELL, B.H., FROLKING, S., SALAS, W.A. and XIAO, X., 2002, Determinationof subpixel fractions of nonforested area in the Amazon using multiresolution satellitesensor data. Journal of Geophysical Research, 107, 8049, doi:10.1029/2000JD000255.
HANSEN, M.C. and DEFRIES, R.S., 2004, Detecting long-term global forest change using con-tinuous fields of tree-cover maps from 8-km advanced very high resolution radiometer(AVHRR) data for the years 1982-99. Ecosystems, 7, pp. 695–716.
HANSEN, M.C., DEFRIES, R.S., TOWNSHEND, J.R.G., CARROLL, M., DIMICELI, C. andSOHLBERG, R.A., 2003, Global percent tree cover at a spatial resolution of 500 meters:first results of the MODIS vegetation continuous fields algorithm. Earth Interactions, 7,pp. 1–15.
HANSEN, M.C., DEFRIES, R.S., TOWNSHEND, J.R.G., MARUFU, L. and SOHLBERG, R., 2002a,Development of a MODIS tree cover validation data set for Western Province, Zambia.Remote Sensing of Environment, 83, pp. 320–335.
HANSEN, M.C., DEFRIES, R.S., TOWNSHEND, J.R.G. and SOHLBERG, R., 2000, Global landcover classification at 1 km spatial resolution using a classification tree approach.International Journal of Remote Sensing, 21, pp. 1331–1364.
HANSEN, M.C., DEFRIES, R.S., TOWNSHEND, J.R.G., SOHLBERG, R., DIMICELI, C. andCARROLL, M., 2002b, Towards an operational MODIS continuous field of percenttree cover algorithm: examples using AVHRR and MODIS data. Remote Sensing ofEnvironment, 83, pp. 303–319.
HANSEN, M.C., ROY, D.P., LINDQUIST, E., ADUSEI, B., JUSTICE, C.O. and ALTSTATT, A., 2008a,A method for integrating MODIS and Landsat data for systematic monitoring of for-est cover and change in the Congo Basin. Remote Sensing of Environment, 112, pp.2495–2513.
HANSEN, M.C., SHIMABUKURO, Y.E., POTAPOV, P. and PITTMAN, K., 2008b, Comparing annualMODIS and PRODES forest cover change data for advancing monitoring of Brazilianforest cover. Remote Sensing of Environment, 112, pp. 3783–3793.
HIRSCH, A.I., LITTLE, W.S., HOUGHTON, R.A., SCOTT, N.A. and WHITE, J.D., 2004, The netcarbon flux due to deforestation and forest re-growth in the Brazilian Amazon: analysisusing a process-based model. Global Change Biology, 10, pp. 908–924.
INPE, 2008, PRODES Project: Satellite Monitoring of the Brazilian Amazon Forest. InstitutoNacional de Pesquisas Espaciais. Available online at: www.obt.inpe.br/prodes/(accessed 10 June 2009).
IVERSON, L.R., COOK, E.A. and GRAHAM, R.L., 1994, Regional forest cover estimation viaremote sensing: the calibration center concept. Landscape Ecology, 9, pp. 159–174.
LATIFOVIC, R. and OLTHOF, I., 2004, Accuracy assessment using sub-pixel fraction errormatrices of global land cover products derived from satellite data. Remote Sensing ofEnvironment, 90, pp. 153–165.
LATIFOVIC, R., ZHU, Z., CIHLAR, J., GIRI, C. and OLTHOF, I., 2004, Land cover mapping ofNorth and Central America – global land cover 2000. Remote Sensing of Environment,89, pp. 116–127.
Dow
nloa
ded
by [
Indi
ana
Uni
vers
ity L
ibra
ries
], [
Den
gshe
ng L
u] a
t 10:
21 0
1 A
ugus
t 201
1
18 D. Lu et al.
LOWRY, J., RAMSEY, R.D., THOMAS, K., SCHRUPP, D., SAJWAJ, T., KIRBY, J., WALLER, E.,SCRADER, S., FALZARANO, S., LANGS, L., MANIS, G., WALACE, C., SCHULZ, K.,COMER, P., POHS, K., RIETH, W., VELASQUEZ, S., WOLK, B., KEPNER, W., BOYKIN,K., O’BRIEN, L., BRADFORD, D., THOMPSON, B. and PRIOR-MAGEE, J., 2007, Mappingmoderate-scale land-cover over very large geographic areas within a collaborativeframework: a case study of the Southwest Regional Gap Analysis Project (SWReGAP).Remote Sensing of Environment, 108, pp. 59–73.
LU, D., BATISTELLA, M., MORAN, E. and DE MIRANDA, E.E., 2008, A comparative studyof Landsat TM and SPOT HRG images for vegetation classification in the BrazilianAmazon. Photogrammetric Engineering and Remote Sensing, 70, pp. 311–321.
LU, D., MAUSEL, P., BATISTELLA, M. and MORAN, E., 2004, Comparison of land-cover clas-sification methods in the Brazilian Amazon basin. Photogrammetric Engineering andRemote Sensing, 70, pp. 723–731.
LU, D., MAUSEL, P., BRONDÍZIO, E.S. and MORAN, E., 2002, Assessment of atmospheric cor-rection methods for Landsat TM data applicable to Amazon basin LBA research.International Journal of Remote Sensing, 23, pp. 2651–2671.
LU, D., MORAN, E. and BATISTELLA, M., 2003, Linear mixture model applied to Amazonianvegetation classification. Remote Sensing of Environment, 87, pp. 456–469.
LU, D. and WENG, Q., 2007, A survey of image classification methods and techniques forimproving classification performance. International Journal of Remote Sensing, 28, pp.823–870.
MAYAUX, P. and LAMBIN, E.F., 1995, Estimation of tropical forest area from coarse spatialresolution data: a two-step correction function for proportional errors due to spatialaggregation. Remote Sensing of Environment, 53, pp. 1–15.
MCIVER, D.K. and FRIEDL, M.A., 2001, Estimating pixel-scale land cover classificationconfidence using nonparametric machine learning methods. IEEE Transactions onGeoscience and Remote Sensing, 39, pp. 1959–1968.
MUSTARD, J.F. and SUNSHINE, J.M., 1999, Spectral analysis for earth science: investigationsusing remote sensing data. In Remote Sensing for the Earth Sciences: Manual of RemoteSensing, 3rd edn, vol. 3, A.N. Rencz (Ed.), pp. 251–307 (New York, NY: John Wileyand Sons).
OLTHOF, I. and FRASER, R.H., 2007, Mapping northern land cover fractions using LandsatETM+. Remote Sensing of Environment, 107, pp. 496–509.
POTAPOV, P., HANSEN, M.C., STEHMAN, S.V., LOVELAND, T.R. and PITTMAN, K., 2008,Combining MODIS and Landsat imagery to estimate and map boreal forest cover loss.Remote Sensing of the Environment, 112, pp. 3708–3719.
ROBERTS, D.A., BATISTA, G.T., PEREIRA, J.L.G., WALLER, E.K. and NELSON, B.W., 1998,Change identification using multitemporal spectral mixture analysis: applications ineastern Amazônia. In Remote Sensing Change Detection: Environmental MonitoringMethods and Applications, R.S. Lunetta and C.D. Elvidge (Eds.), pp. 137–161 (AnnArbor, MI: Ann Arbor Press).
ROBERTS, D.A., NUMATA, I., HOLMES, K., BATISTA, G., KRUG, T., MONTEIRO, A., POWELL,B. and CHADWICK, O.A., 2002, Large area mapping of land-cover change inRondônia using decision tree classifiers. Journal of Geophysical Research, 107, 8073,doi:10.1029/2001JD000374.
SABOL, D.E., JR., GILLESPIE, A.R., ADAMS, J.B., SMITH, M.O. and TUCKER, C.J., 2002,Structural stage in Pacific Northwest forests estimated using simple mixing models ofmultispectral images. Remote Sensing of Environment, 80, pp. 1–16.
SCHWARZ, M. and ZIMMERMANN, N.E., 2005, A new GLM-based method for mapping treecover continuous fields using regional MODIS reflectance data. Remote Sensing ofEnvironment, 95, pp. 428–443.
SEDANO, F., GONG, P. and FERRAO, M., 2005, Land cover assessment with MODIS imagery insouthern African Miombo ecosystems. Remote Sensing of Environment, 98, pp. 429–441.
Dow
nloa
ded
by [
Indi
ana
Uni
vers
ity L
ibra
ries
], [
Den
gshe
ng L
u] a
t 10:
21 0
1 A
ugus
t 201
1
Forest cover mapping 19
SHIMABUKURO, Y.E., BATISTA, G.T., MELLO, E.M.K., MOREIRA, J.C. and DUARTE, V., 1998,Using shade fraction image segmentation to evaluate deforestation in Landsat thematicmapper images of the Amazon region. International Journal of Remote Sensing, 19, pp.535–541.
SHIMABUKURO, Y.E. and SMITH, J.A., 1991, The least-squares mixing models to generate frac-tion images derived from remote sensing multispectral data. IEEE Transactions onGeoscience and Remote Sensing, 29, pp. 16–20.
SHIMABUKURO, Y.E. and SMITH, J.A., 1995, Fraction images derived from Landsat TM andMSS data for monitoring reforested areas. Canadian Journal of Remote Sensing, 21, pp.67–74.
SIVANPILLAI, R., SRINIVASAN, R., SMITH, C.T., MESSINA, M.G. and WU, X.B., 2007,Estimating regional forest cover in East Texas using Advanced Very High ResolutionRadiometer (AVHRR) data. International Journal of Applied Earth Observation andGeoinformation, 9, pp. 41–49.
SKOLE, D.L., CHOMENTOWSKI, W.H., SALAS, W.A. and NOBRE, A.D., 1994, Physical andhuman dimension of deforestation in Amazonia. BioScience, 44, pp. 314–328.
SMITH, M.O., USTIN, S.L., ADAMS, J.B. and GILLESPIE, A.R., 1990, Vegetation in deserts:a regional measure of abundance from multispectral images. Remote Sensing ofEnvironment, 31, pp. 1–26.
THESEIRA, M.A., THOMAS, G., TAYLOR, J.C., GEMMELL, F. and VARJO, J., 2003, Sensitivity ofmixture modeling to endmember selection. International Journal of Remote Sensing, 24,pp. 1559–1575.
TIAN, H., MELILLO, J.M., KICKLIGHTER, D.W., MCGUIRE, A.D., HELFRICH, J., MOORE, III,B. and VÖRÖSMARTY, C.J., 1998, Effect of interannual climate variability on carbonstorage in Amazonian ecosystems. Nature, 396, pp. 664–667.
TOTTRUP, C., RASMUSSEN, M.S., EKLUNDH, L. and JONSSON, P., 2007, Mapping fractionalforest cover across the highlands of mainland Southeast Asia using MODIS data andregression tree modeling. International Journal of Remote Sensing, 28, pp. 23–46.
VAN DER MEER, F. and DE JONG, S.M., 2000, Improving the results of spectral unmixing ofLandsat thematic mapper imagery by enhancing the orthogonality of end-members.International Journal of Remote Sensing, 21, pp. 2781–2797.
VIEIRA, I.C.G., DE ALMEIDA, A.S., DAVIDSON, E.A., STONE, T.A., DE CARVALHO, C.J.R. andGUERRERO, J.B., 2003, Classifying successional forests using Landsat spectral proper-ties and ecological characteristics in eastern Amazonia. Remote Sensing of Environment,87, pp. 470–481.
WANG, Q. and TENHUNEN, J.D., 2004, Vegetation mapping with multitemporal NDVI in NorthEastern China Transect (NECT). International Journal of Applied Earth Observation andGeoinformation, 6, pp. 17–31.
WASER, L.T. and SCHWARZ, M., 2006, Comparison of large-area land cover products withnational forest inventories and CORINE land cover in the European Alps. InternationalJournal of Applied Earth Observation and Geoinformation, 8, pp. 196–207.
WESSELS, K.J., DEFRIES, R.S., DEMPEWOLF, J., ANDERSON, L.O., HANSEN, A.J., POWELL, S.L.and MORAN, E.F., 2004, Mapping regional land cover with MODIS data for biologicalconservation: examples from the Greater Yellowstone Ecosystem, USA and Pará State,Brazil. Remote Sensing of Environment, 92, pp. 67–83.
ZHU, Z. and EVANS, D.L., 1994, US forest types and predicted percent forest cover fromAVHRR data. Photogrammetric Engineering and Remote Sensing, 60, pp. 525–532.
Dow
nloa
ded
by [
Indi
ana
Uni
vers
ity L
ibra
ries
], [
Den
gshe
ng L
u] a
t 10:
21 0
1 A
ugus
t 201
1