september 2017 report on housing prices and the … 2017 report on housing prices and the situation...
TRANSCRIPT
September 2017
Report on housing prices and the situation in the residential and commercial real estate market in Poland in 2017 Q2.
Economic Analysis Department
Jacek Łaszek
Hanna Augustyniak
Krzysztof Olszewski
Joanna Waszczuk
Marzena Zaczek

The Report has been prepared at the Economic Analysis Department for the purposes of NBP au-
thorities. Opinions expressed in this report are opinions of the authors and do not present the point
of view of the authorities of Narodowy Bank Polski.
Report on housing prices and the situation in the residential and commercial real estate market in Poland in 2017 Q2.
Narodowy Bank Polski
3
The analysis of situation in the property market in Poland in
2017 Q21 leads to the following conclusions:
In 2017 Q2 home sales on the primary market in the six largest cities exceeded the peak from the
previous cycle. This activity has not generated excessive tensions in the property market so far, yet
there are signs likely to indicate growing imbalance between demand and supply in favour of the
former. Only slight increases in prices have been observed, but the hedonic housing price indices
grew somewhat quicker. Transactions continued to be financed with a significant share of buyers’
own funds, yet a slight increase in the financing of purchase by loan was simultaneously noticeable.
The supply of housing has adjusted to the increase in demand for another quarter – real estate
developers started new investment projects and continued the existing ones. The adjustment of the
structure of housing offered to the structure of demand was well done. The number of completed
dwellings on offer declined, so did the number of homes under construction adjusted for the cur-
rent sales. The estimated prices of building land increased. Maintaining flexible supply is the main
challenge in the current situation and the condition to keep prices stable.
The average offer and transaction prices per square metre of housing in the primary and secondary
markets increased slightly in the analysed cities over the period in question with the exception of
the secondary market in Warsaw where average prices fell slightly (there were more transactions
involving housing of inferior quality). The observed price hikes in the primary market were due to
the fact that a larger number of better quality dwellings in better location were put on the market
and sold. Prices calculated with the use of the hedonic index2 increased, which entails an actual
rise in prices per square metre of similar type of housing as compared to last year. In all the ana-
lysed groups of cities (Warsaw, 6M, 10M) prices in the primary market were higher than in the
secondary market. Average rents (both offer and transaction rents) per square metre of housing
generally stabilised in Warsaw and in 10M in the analysed period. A slight drop in the average rent
in 6M was due to the change in the location within the cities and a change in terms of the area of
dwellings rented and the year of construction.
The index of the estimated availability of housing in big cities fell slightly in the analysed quar-
ter to 0.86 square metres but was still 0.4 square metre higher than the record low observed in
1 The analysis carried out in the present Report is based on data available till 2017 Q2. On account of delays in access to data, some
figures include data until 2016 Q4 (inclusive). Data series with average prices per square metre of housing, commercial rents
and transaction prices per square metre of office space reflect the available pool of data and may be subject to revision according
to the new data coming. These series are being constantly updated so as to reflect the full pool of data available at any given
moment. Historic data are also subject to change due to revision of data for errors. Such an approach is used by other central
banks and statistical offices.
2 The hedonic index of housing prices is adjusted for differences in various attributes of dwellings (e.g. location, usable area,
standard of finishing) sold in particular periods. The hedonic index is calculated with the use of the imputation method. A
hedonic price is an average transaction price from the base period multiplied by the hedonic index. More information in the
article by M. Widłak (2010) „Metody wyznaczania hedonicznych indeksów cen jako sposób kontroli zmian jakości dóbr”
[“Methods of computing hedonic price indices as the way to control changes in goods quality”], Wiadomości Statystyczne no.
9.

Report on housing prices and the situation in the residential and commercial real estate market in Poland in 2017 Q2.
Narodowy Bank Polski 4
2007 Q3 (as a result of a slight increase in housing prices). The index of the estimated maximum
availability of a housing loan3 to average households in Warsaw and in 6M remained almost stable.
Housing investment (excluding transaction costs) continued to be profitable in the short term.
Assuming the average rent possible to be negotiated in the Warsaw market and in the market of
6M, the profitability of housing investment was higher than the interest on banking deposits and
yields on 10-year government bonds, and was close to the return likely to be achieved in the com-
mercial property market. The relation of the housing debt servicing costs to rent still enables to
finance the cost of credit with income from rent.
The value of newly granted loans4 PLN (excluding renegotiated agreements) increased5 in the
analysed quarter by PLN 11.8 billion, i.e. by 8.5% as compared with figures from the previous
quarter and by 1.8% as compared with 2016 Q2 figures. The results of NBP survey concerning the
situation in the credit market6 indicate that the surveyed banks observed an increase in demand
for housing loans and lending terms and criteria in 2017 Q2 were slightly tightened, which included
a rise in margins on riskier loans. In 2017 Q3 individual banks envisage a drop in demand and
announce an easing of lending policy. The estimated profitability of housing loans for banks is
growing due to increasing margins and diminishing write-offs. The share of impaired loans re-
mained constant and stood at approx. 2.5% at the end of 2017.
Since 2012 the share of FX denominated loans has decreased considerably7 in the structure of
housing loans in banks, which is favourable for financial and macroeconomic stability. The de-
creasing share of FX loans is due to the fact that banks ceased to grant such loans to person not
being in receipt of a regular income in this currency, systemic amortization, earlier repayments and
refinancing those loans with PLN denominated loans. The quality of FX housing loans is still high
- the share of impaired loans increased slightly and stood at 3.4% at the end of 2017 Q2.
The estimated profitability of housing investment projects fell slightly, although it was still
high. This was related to high demand for housing and an elevated ratio of home prices to building
materials and construction costs, those latter having remained low for a few years and favouring
3 The maximum housing loan available in a particular market is a measure expressed in PLN thousand, taking into account banks’
lending requirements and loan parameters (i.e. interest rate, amortization period, minimum wage understood as the minimum
income after the repayment of loan instalments). The assessment does not take into consideration changes in banks’ lending
policy, including lending terms and criteria.
4 Data concerning new loans prepared by NBP are available on the NBP internet site: http://www.nbp.pl/home.aspx?f=/stat-
ystyka/pieniezna_i_bankowa/oprocentowanie_n.html, in the "4 OPN2PLN" tab. It should be remembered that a housing loan
frequently compliments the financing of housing, in the housing market in cities part of financing comes from the sales of
another property, while in other markets houses are built by owner themselves, often on their own land.
5 According to BIK data, in 2017 Q1 there was a 5.7% increase in the number of housing loans extended by banks and their total
value increased by 12.7%. The average amount of a housing loan granted stood at PLN 220.8 thousand and was 6.6% higher as
compared with PLN 207.2 thousand in the first half of 2016. The largest increase, 22.2%, was seen in the number of loans ranging
between PLN 250 and 500 thousand, and then among loans between PLN 0.5 and 1.0 million. The number of small loans
amounting up to PLN 100 thousand decreased considerably, in this group of loans the decrease was 16.2%.
6 '”Situation in the credit market - results of the senior loan officer opinion survey in 2017 Q3”, NBP, August 2017.
7 The share of FX denominated loans in the structure of housing loans extended by banks until the end of 2017 Q2 stood at 63%
and was twice as high as the minimum of 29% recorded in 2009 Q1.

Report on housing prices and the situation in the residential and commercial real estate market in Poland in 2017 Q2.
Narodowy Bank Polski
5
real estate developers. Availability of land for residential development, already owned by real es-
tate developers, also plays a role8. Financial data of real estate developers usually indicate low
profitability of their operations, a claim not corroborated by the analysis carried out on average
investment projects in the largest markets. It shows the contrary, a very high level of estimated
profitability of developer projects in housing construction as compared to other branches of indus-
try. The estimate results are confirmed by a high number of new and finalised investment projects
and the purchase of rental housing by professional external investors9. According to Coface ex-
perts, the analysed period saw an increasing number of bankruptcies in the construction indus-
try10. A difficult situation in construction persists despite increased growth in construction and
assembly production.
The pool of unsold housing in Poland’s six largest markets11 shrank slightly in the analysed
quarter and stood at 50.0 thousand. At the same time the number of dwellings whose construc-
tion had been launched increased12. High demand for housing exceeded the increase in supply.
The index of home selling time13 in 6M decreased to less than 3 quarters in the analysed period.
The number of homes under construction and the number of projects under construction weighted
by sales volume as well as the number of completed dwellings put up for sale decreased. This may
indicate that supply ceases to meet demand and the risk of price increase is growing. Real estate
developers have so far managed to adjust the structure of home size to demand, in contrast to the
secondary market, where supply is the result of the structure of the housing stock. In the segment
of popular dwellings, price continues to be the basic criterion for home purchase, thus compact
housings, i.e. small two-room homes are in highest demand. There is also continued demand for
bigger homes, over 60 square metres, often with higher standard.
8 The pool of land owned by real estate developers must be replenished constantly due to high production and sales. The Act of
14 April 2016 on the suspension of the sale of Agricultural Property owned by the State Treasury and on the amendment of
certain acts (Journal of Laws 2016, item 585, as amended) may hamper this process. Soon, real estate developers will be building
in cities only, on land which have been defined as intended for housing construction in local area development plans, which
may impact both costs and prices.
9 For example, a big foreign real estate fund managing a portfolio of a joint value of EUR 6 billion bought the second housing
project in Poland. Buildings bought in Warsaw and Krakow serve as rental housing.
10 In 2016 a new restructuring law was introduced. At present restructuring procedure applies both to insolvent companies and
to companies threatened with insolvency. According to Coface experts the increase in the number of bankruptcies among con-
struction companies in 2017 Q1 was driven by two fundamental factors: a markedly delayed recovery in investment (investment
was assumed to rebound at the end of 2016, but the situation has not changed significantly until now) and the introduction of
VAT reverse charge on building materials. Demand for building materials, steel and construction services is gradually rising,
which testifies to a slight recovery in the investment market. However, it was not sufficient to save numerous companies, which
waiting in vain for this recovery had to start restructuring. The VAT reverse charge leads to a situation where many service
companies face considerable liquidity problems: they have to buy VAT-charged goods being simultaneously forced to sell them
net of tax, which slows down cash flow so much that the normal settlement of liabilities becomes problematic. Experts expect a
slight improvement in construction in the second half of the year, while anticipating further liquidity problems experienced by
the sector.
11 According to the REAS company report entitled "The housing market in Poland in 2017 Q2".
12 According to GUS data in 2017 Q2 in Poland the construction of 61.8 thousand homes was started, i.e. by 9.8 thousand more
in comparison with 2016 Q2 and by 17.6 thousand as compared to the previous quarter.
13 The index of home sales in the primary market calculated by REAS is the ratio of the number of homes on offer at the end of a
quarter to the average sales from the previous year.

Report on housing prices and the situation in the residential and commercial real estate market in Poland in 2017 Q2.
Narodowy Bank Polski 6
2017 Q2 saw an increase in the number of new home building permits, including those in exist-
ing projects. The estimated high margins on developers' profits as well as rates of return on hous-
ing projects and high demand contributed to the increase in the number of issued home building
permits14 and the number of dwellings ready for occupancy15. High home sales make it necessary
to replenish land banks. Despite rising prices of land for construction, demand has remained high,
particularly in city districts with good communication links, well-developed urban infrastructure
and retail and service facilities.
Under the gradually phased out MDM government-subsidised scheme in 2017 Q2 the total of
2 970 applications were filed and subsidies in the total amount of approx. PLN 1.0 billion were paid
to 4 072 borrowers. Altogether, since 2014 the total of PLN 2.2 million worth of subsidies have been
paid to 79 213 borrowers16. On 8 August 2017, BGK started to accept applications for subsidies for
the purchase of housing17; as the initiative did not enjoy considerable interest, BGK discontinued
to accept applications on the very next day. In January 2018 the bank will start to accept the last
applications for subsidies under the MDM government-subsidized scheme. Buyers' considerable
interest in disbursement of subsidies in 2016 may be attributed to the scheduled discontinuation of
the scheme after 201818. Given a strong demand, the government's withdrawal of fiscal stimulus
provided to this market may be considered a positive phenomenon. In 2017 Q3 Gdańsk was the
only city to see a slight increase in the limit of maximum prices per square metre of dwelling eligi-
ble under the MDM scheme. However, as the funds available for subsidies in 2017 have been ex-
hausted, this should not affect the housing market.
In 2017 several initiatives were launched as part of the National Housing Programme 19 adopted
by the government in September 2016 (see Table no. 1).
14 According to GUS data, in 2017 Q2 70.5 thousand home building permits were issued, i.e. approx. 14.5 thousand more than in
2016 Q2 and approx. 10.2 thousand more as compared with the previous quarter.
15 According to GUS data, in 2017 Q2 the total of 37.9 thousand homes were completed and made ready for occupancy which is
approx. 1.5 thousand more as compared to 2016 Q2 and approx. 10.0 thousand less as compared to the previous period.
16 According to the post-audit conclusions of the Supreme Audit Office, as the draft Act and its amendment did not provide for
the income criterion, approximately 20% of beneficiaries benefited from the MDM government-subsidized housing scheme in
the years 2014-2016 despite being able to take out a mortgage loan and purchasing housing without the government’s assistance.
There was no data available at the Ministry of Infrastructure and Construction which would allow to determine which part of
the housing investment benefiting from the MDM housing scheme would not have been carried out in the absence of the MDM
scheme. The Ministry also did not have the means to assess the extent of the achievement of the demographic objective.
Throughout the scheme implementation period, the majority of beneficiaries were couples without children (77% - before the
amendment of the Act and 72% after the amendment of the Act).
17 In accordance with the Act of 7 July 2017 (Journal of Laws No.1413), as not all the funds available under the current disburse-
ment limit were used (95% of the value of submitted applications), 100% applications were accepted. According to the estimates
of the Ministry of Infrastructure and Construction, this will provide additional funding to 4000 households.
18 Identification in the NBP database of transactions concluded in the period 2016 Q3 – 2017 Q2 involving housing whose area
and price meet the conditions of the "Housing for Young" scheme, taking into account the breakdown into the primary and
secondary market, allowed to determine the possibility of benefiting from the programme in 16M. The largest number of trans-
actions in the primary market meeting the conditions of the programme in the discussed quarter were recorded in Zielona Góra
and Kielce, while the largest number of transactions in the secondary market were recorded in Zielona Góra, Kielce and Byd-
goszcz. The lowest availability of housing in the primary market in Poland was recorded in Łódź and Warsaw, and in the
secondary market in Warsaw and Kraków.
19 On 7 September 2016, the Council of Ministers approved resolution No. 115/2016 on the adoption of the National Housing
Programme. The main objective of the National Housing Programme is to make housing more accessible for low- and middle-

Report on housing prices and the situation in the residential and commercial real estate market in Poland in 2017 Q2.
Narodowy Bank Polski
7
Table 1 Government’s initiatives concerning residential real estate
On 20 July 2017, after a few changes20, the Senate adopted the Act on the National Real Estate
Resources (KZN)21, which introduces a system of affordable rental housing, under the Housing
income persons and to improve the technical condition of the housing stock while, at the same time, increasing its energy
efficiency. A more detailed description of the assumptions of the National Housing Programme in the Information on home prices
and the situation in the housing and commercial real estate market in Poland in 2016 Q3 (NBP, December 2016).
20 The title of the draft Act on the National Housing Fund and the transfer of real estate for housing purposes to the State Treasury
has changed twice. For the first time at the stage of presenting the draft Act for debate before the Committee of the Council of
Ministers held on 11 May 2017 – the draft Act on the State Treasury Land Fund. The next change took place before the next
referral of the bill for debate before the Committee of the Council of Ministers held on 29 June 2017 – the draft Act on the
National Real Estate Resources. The change of the title resulted from the decision of the management of the Ministry of Infra-
structure and Construction (Journal of Laws of 20 July 2017, item 1529).
21 The Act on the National Real Estate Resources also amends several other legal acts. At the same time, an amendment was made
to the Law on the Protection of Tenants' Rights, namely a new type of rental housing was introduced - institutional lease in which
Programme Legal basis
Commencem
ent of the
programme
Expected
expenditure
Excepted
effectsCurrent effects
National Housing Programme
1)Housing Plus scheme
1.1)Programme supporting social housing,
sheltered housing, shelters and homes for
the homeless
Journal of
Laws of
2015, item
833 as
amended
2007
PLN 6 210
million in
2018-2025
1 375 projects were deemed eligible
for financing under the scheme (the
total value of projects exceeding
PLN 2.8 billion) concerning the
creation of night shelters
1.2)Programme supporting the
construction of municipal housing
Journal of
Laws of
10.09.2015,
item 1582
2016
PLN 4.5
billion during
10 years
30 thousand
dwellings
during 10
years
99 applications for the total amount
of PLN 563 million concerning the
construction of 4619 dwellings
1.3) Housing Plus – funding from (BGK
Real Estate)
Resolution of
the Council
of Ministers
no. 115/2016
of 27
September
2016
2016
1.2 thousand dwellings under
construction. 10 thousand being
prepared for construction (under
investment contracts)
2)Individual Housing Accounts Programme in
preparation
Premium pay-
outs in the
amount of
PLN 4.41 in
2021-2025
Other scheme (outside the National
Housing Programme)
Housing for the Young
Journal of
Laws of 2017
od
27.09.2013,
item 1184 as
amended
2014
PLN 3.45
billion in 2014-
2018
On a cumulative basis since
01.01.2014 the total of 96.4
thousand beneficiaries benefited
from the programme; subsidies
amounted to PLN 2.5 billion,
including PLN 0.7 billion to the
secondary market housing
Borrowers’ Support Fund
Journal of
Laws of
09.10.2015,
item 1925
19.02.2016 PLN 593.8
million
On a cumulative basis since
19.02.2016 the total of 637 subsidy
contracts were concluded for the
amount of PLN 14.1 million and
subsidies in the amount of PLN 6.6
million were paid
Rental Housing FundOwn initiative
of BGK 2014
Contracts for the construction of 3.3
thousand dwellings were signed.
1371 dwellings were made available
for sale on a commercial basis

Report on housing prices and the situation in the residential and commercial real estate market in Poland in 2017 Q2.
Narodowy Bank Polski 8
Plus scheme. The project concerning Individual Housing Accounts (IKM)22 was supposed to be
submitted to the Parliament in the first half of 2017. The Ministry of Finance assumes that it will be
possible to open Individual Housing Accounts in 2018 and bonus payments will start in 2019 when
the majority of commitments under the MDM housing scheme have expired. Under the first two
editions of the Programme supporting the construction of rental housing23, BGK received appli-
cations for preferential loans for the financing of over 4 600 dwellings. The procedure of receiving
applications under the third edition of the programme is scheduled for September 2017. Under the
existing Programme of financial support for social housing, sheltered dwellings, night shelters
and homes for the homeless in the first half of 2017 the total of 88 applications were accepted for
the total amount of support of PLN 90 731.54 thousand (for the creation of 1 622 social dwellings,
municipal dwellings and sheltered housing). The Borrowers’ Support Fund24, has been operating
since February 2016, offering refundable assistance on preferential terms to borrowers facing tem-
porary problems with loan repayment. According to the announcement of the Deputy Minister of
Family, Labour and Social Policy, Elżbieta Bojanowska, a pilot project aimed to co-finance activi-
ties of sheltered dwellings run conducted by local governments (used by the elderly and the
disabled) was scheduled to be launched in mid-2017. The total of PLN 20 million was allocated
for this purpose. However, the cities where this pilot programme will be implemented have not
been identified yet.
The commercial real estate market continued to see growing imbalance resulting from oversup-
ply of rental space as compared to fairly stable demand. This concerned in particular the rental
the tenant agrees to voluntarily leave the dwelling, which means they will be deprived of the right to social housing. Under the
Act, the State-Owned Forests will have to transfer to the real estate stock approx. 600 thousand hectares of land resources located
in cities and their outskirts, i.e. ecological land and landscape parks.
22 According to the information on the website of the National Housing Programme, the government plans to set aside PLN 4.44
billion for the payment of premiums under Individual Housing Accounts in the years 2021-2025.
23 The provisions of the Act (Journal of Laws of 12.01.2017, item 79) enable BGK to grant loans to social housing societies TBS,
municipal companies and housing cooperatives, which, under current conditions, would bear interest at the rate of approx.
1.7% (3M WIBOR). A 1.3 percentage point margin is financed by the state budget. The scheme is spread over 10 years during
which BGK should lend PLN 4.5 billion worth of loans for the construction of social housing for rent (the construction of mini-
mum 30 thousand dwellings is assumed). In 2016 BGK signed the first loan contracts. In accordance with the provisions of the
Act, it will not be possible to repurchase dwellings built with the use of BGK's preferential loans. There are restrictions in access
to home rental depending on tenants’ income. The Act provides for income verification every two years. The rent rate may not
exceed 5% of the replacement value of the dwelling on an annual basis. The first dwellings financed under the scheme should
be completed and made ready for occupancy at the turn of 2017 and 2018. Under the third edition of the scheme, BGK will
provide preferential financing in the total amount of at least PLN 880 million.
24 In accordance with the Act (Journal of Laws of 9 October 2015 item 1925), on 19 February 2016 the Borrowers’ Support Fund
(FWK) started granting refundable assistance, on preferential terms, to borrowers facing difficult situation. Those borrowers
are eligible for assistance who, on the day of submitting a subsidy application, have an unemployed status or if their monthly
mortgage instalment exceeds 60% of the monthly income earned by the borrower’s household. The interest-free, but refundable
assistance in the amount of up to PLN 1.5 thousand will be available for a maximum period of 18 months. It is possible to apply
for financial support in bank branches which granted housing loans. Repayment starts two years after the assistance was
granted and may take up to eight years. Decisions concerning granting subsidies to borrowers are taken by the lending bank.
Persons being owners of another house or dwelling are not eligible for this form of assistance. Money from the Fund is not
transferred directly to the borrower, the instalments are paid by the Fund directly to the credit account of the lending bank.
This amount originates from contributions of lending banks or credit unions SKOK, proportionally to the size of the portfolio
of housing loans for households whose delay in the repayment of the capital or the interest exceeds 90 days. If necessary, the
Rental Housing Fund (FWM) will be replenished with further funds, e.g. if its amount falls below PLN 100 million, the fund
replenishment will amount to PLN 300 million.

Report on housing prices and the situation in the residential and commercial real estate market in Poland in 2017 Q2.
Narodowy Bank Polski
9
of office space and retail and service premises. The continued high availability of foreign financing
contributed to the rapid growth in fixed assets. This can be largely attributed to low interest rates
in developed countries, and thus low opportunity cost. The value of transactions in 2017 Q1
amounted to over PLN 500 million, half of which was invested in hotels.
The level of corporate loans for real estate investment slightly decreased from PLN 53 billion in the
previous quarter to PLN 51.3 billion. The quality of loans to developers has improved somewhat,
and the high rate of impaired loans (22%) is mainly due to the fact that banks’ loan portfolios in-
clude loans from previous years25. The portfolio of loans for office space remained stable at PLN 15
billion at the end of the analysed quarter, and the share of impaired loans remained at around 5%.
Rents for A class office space in Warsaw slightly increased, and vacancy ratios in the whole of
Warsaw dropped by 0.1 p.p. to reach 13.9% at the end of 2017 Q226 which was mainly the result of
growing number of rental transactions. However, the level of vacancies remains at a high level and
rents quoted in EUR per square metre per month in class B office buildings are on a steady down-
ward trend. This situation may be unfavourable for investors being owners of older office buildings
or office buildings in poorer locations.
Rents for retail space in shopping centres across the country show a slight downward trend. On
the other hand, in large cities rents for retail space of 100-500 square metres in shopping centres
located in economically important parts of cities remain stable. As regards the sale of small retail
and commercial real estate, the median of the offer price all over Poland shows a downward trend,
yet has remained at a stable level in large cities.
The figures below describe the key developments in the housing market in Poland’s major cities in 2017
Q3. Charts and figures present:
1) home prices (Figures 1–14),
2) housing availability, loan availability, availability of loan-financed housing, profitability of housing
investment (Figures 15−20),
3) mortgage loan disbursements and interest rates (Figures 21−28),
4) operating profitability of housing and real estate development projects, costs of construction and
assembly output and economic situation of real estate developers in Poland (Figures 29-46),
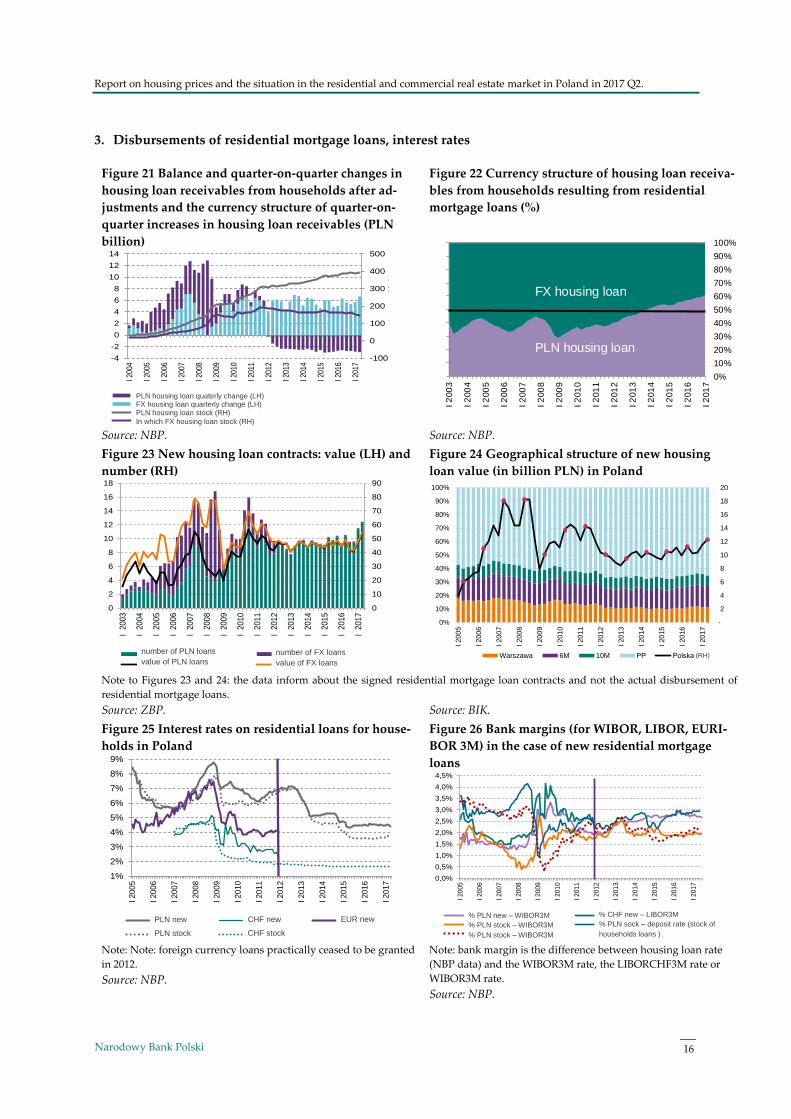
5) housing construction and the residential market in Poland's selected cities (Figures 47−59),
6) housing policy (Figures 60-71),
7) commercial real estate (Figures 72-76).
25 See: Financial Stability Report, NBP, July 2017.
26 See: Colliers International Report: Market Insights, 1st half of 2017, Poland.

Report on housing prices and the situation in the residential and commercial real estate market in Poland in 2017 Q2.
Narodowy Bank Polski 10
The analysis of housing prices, offer prices, transaction prices and hedonic prices in the primary and
secondary markets as well as housing rents relies on the data acquired from the housing market survey
of the Real Estate Market Database (BaRN)27. On the other hand, as part of the survey of the commercial
real estate market, the Commercial Real Estate Market Database (BaNK) data on rent, offer prices and
transaction prices of commercial real estate are collected and analysed.
In addition, data from PONT Info Nieruchomości, AMRON and SARFIN Polish Banks’ Association and
Comparables.pl were used in the analyses. The authors drew on the reports issued by REAS, the Polish
Financial Supervision Authority (KNF) as well as aggregate credit data released the Credit Information
Bureau (BIK). The statistical data published by the Central Statistical Office (GUS) and analyses includ-
ing sectorial data have been used in the structural analysis.
27 Schedule to the Regulation of the Council of Ministers of 27 August 2014 concerning the Programme of statistical research of
public statistics for 2015 (Journal of Laws of 2014, item 1330, number 1.26.09(073). The obligation to submit statistical data results
from Article 30 item 3 of the Act of 29 June 1995 on public statistics (Journal of Laws of 2012 item 591) and from the Decree of
the Council of Ministers referred to above. The reporting forms for 2017 were announced in the Decree of the Prime Minister of
14 March 2017 on reporting forms, completion instructions and statistical questionnaires and questionnaire forms used in sur-
veys of public statistics for 2017 (Journal of Laws of 2017 item 837). Since the survey is carried out by NBP, the Bank publishes
the surveys on its website. In listings related to 2017 Q2, approx. 113.4 thousand records were collected, including approx. 25.9%
of records concerning transactions and 74.1% of records concerning offers. Altogether approx. 2.5 million records were collected
in the base, including 21.5% of records concerning transactions and 78.5% of records concerning offers.

Report on housing prices and the situation in the residential and commercial real estate market in Poland in 2017 Q2.
Narodowy Bank Polski
11
List of abbreviations
5M 5 cities: Gdańsk, Kraków, Łódź, Poznań, Wrocław
6M 6 cities: Gdańsk, Gdynia, Kraków, Łódź, Poznań, Wrocław
7M 7 cities: Gdańsk, Gdynia, Kraków, Łódź, Poznań, Warsaw, Wrocław
10M 10 cities: Białystok, Bydgoszcz, Katowice, Kielce, Lublin, Olsztyn, Opole, Rzeszów,
Szczecin, Zielona Góra
BaNK Commercial Real Estate Market Database
BaRN Real Estate Market Database
BIK Credit Information Bureau
CPI Consumer Price Index
DFD Large real estate development company
EURIBOR Euro Interbank Offer Rate
GD Households
GUS Central Statistical Office
IRFS International Financial Reporting Standards
IRR Internal Rate of Return
KNF Polish Financial Supervision Authority
KRS National Court Register
LH Left hand axis
LIBOR London Interbank Offered Rate
LTV Loan-to-Value ratio
MDM Government-subsidized housing scheme Mieszkanie dla Młodych [Housing for the
Young]
NBP Narodowy Bank Polski
NPM Rental Housing Fund
PAS Polish Accounting Standards
PONT PONT Info Nieruchomości
PP Rest of Poland
REAS Real Estate Advisory System
RNS Government-subsidized housing scheme Rodzina na Swoim [Family on their own]
RPO/T Primary housing market (offer/transaction)
RWO/T Secondary housing market (offer/transaction)
RH Right hand axis
RW Secondary housing market
ROE Return on Equity
WIBOR Reference interest rate of loans in the Warsaw Interbank Offered Rate
WIG20 Index including top 20 companies listed on the Warsaw Stock Exchange with the high-
est value of publicly traded shares
ZBP Polish Bank Association
ZKPK Accumulated index of changes in banks’ credit policy criteria

Report on housing prices and the situation in the residential and commercial real estate market in Poland in 2017 Q2.
Narodowy Bank Polski 12
1. Transaction, hedonic and offer prices of housing in the primary market (PM) and in the second-
ary market (SM)
Figure 1 Transaction prices per square metre of hous-
ing in the primary market (PLN/sq. m)
Figure 2 Transaction prices per square metre of hous-
ing in the secondary market (PLN/sq. m)
Note: the home price database of NBP (BaRN) has existed since 2006 Q3; description of the database may be found in the “Report on
home prices and the situation in housing and commercial real estate market in Poland in 2014” available on the
bank’s website.
Source: NBP. Source: NBP.
Figure 3 Weighted average price per square metre of
housing, offers and transactions in the primary market
(PLN/sq. m)
Figure 4 Weighted average price per square metre of
housing, offers and transactions in the secondary mar-
ket (PLN/sq. m)
Note to Figures 3-14: the price weighted with the share of housing in the market stock, the average price for Warsaw; 6M are the following
cities: Gdańsk, Gdynia, Kraków, Łódź, Poznań, Wrocław; 10M are the following cities: Białystok, Bydgoszcz, Katowice, Kielce, Lublin,
Olsztyn, Opole, Rzeszów, Szczecin, Zielona Góra
Source: NBP. Source: NBP.
Figure 5 Ratio of the average weighted transaction
prices per square metre of housing - the primary market
to the secondary market (PLN/sq. m)
Figure 6 Ratio of the average weighted transaction
price to offer price per square metre of housing in the
primary and the secondary market
Source: NBP. Source: NBP.
2000
3000
4000
5000
6000
7000
8000
9000
10000
III
200
6
III
200
7
III
200
8
III
200
9
III
201
0
III
201
1
III
201
2
III
201
3
III
201
4
III
201
5
III
201
6
Gdańsk Gdynia Kraków Łódź
Poznań Wrocław Warszawa
2000
3000
4000
5000
6000
7000
8000
9000
10000
III
200
6
III
200
7
III
200
8
III
200
9
III
201
0
III
201
1
III
201
2
III
201
3
III
201
4
III
201
5
III
201
6
Gdańsk Gdynia Kraków Łódź
Poznań Wrocław Warszawa
2000
3000
4000
5000
6000
7000
8000
9000
10000
III
200
6
III
200
7
III
200
8
III
200
9
III
201
0
III
201
1
III
201
2
III
201
3
III
201
4
III
201
5
III
201
6
Warszawa RPT 6M RPT 10M RPT
Warszawa RPO 6M RPO 10M RPO
2000
3000
4000
5000
6000
7000
8000
9000
10000
III
200
6
III
200
7
III
200
8
III
200
9
III
201
0
III
201
1
III
201
2
III
201
3
III
201
4
III
201
5
III
201
6
Warszawa RWT 6M RWT 10M RWT
Warszawa RWO 6M RWO 10M RWO
Warszawa hed. 5M hed. 10M hed.
0,80
0,85
0,90
0,95
1,00
1,05
1,10
1,15
1,20
1,25
III
200
6
III
200
7
III
200
8
III
200
9
III
201
0
III
201
1
III
201
2
III
201
3
III
201
4
III
201
5
III
201
6
Warszawa 6M 10M
0,0
0,2
0,4
0,6
0,8
1,0
1,2
1,4
0,95
1,00
1,05
1,10
1,15
1,20
1,25
1,30
1,35
III
200
6
III
200
7
III
200
8
III
200
9
III
201
0
III
201
1
III
201
2
III
201
3
III
201
4
III
201
5
III
201
6
Warszawa RP 6M RP 10M RP
Warszawa RW 6M RW 10M RW
O/T Warszawa (P.oś) O/T 6M (P.oś) O/T 10M (P.oś)(RH) (RH) (RH)

Report on housing prices and the situation in the residential and commercial real estate market in Poland in 2017 Q2.
Narodowy Bank Polski
13
Figure 7 Index of the average weighted transaction
price per square metre of housing in the primary mar-
ket and the real price to CPI ratio (2006 Q3 =100)
Figure 8 Index of the average weighted transaction
price per square metre of housing in the secondary
market and the real price to CPI ratio (2006 Q3 =100)
Source: NBP, ZBP (AMRON), GUS. Source :NBP, ZBP (AMRON), GUS.
Figure 9 Weighted average transaction price per
square metre of housing in the secondary market and
the price adjusted by the hedonic price index
Figure 10 Weighted average transaction price per
square metre of housing in the secondary market and
the price adjusted by the hedonic price index in 6M
Source: NBP. Source: NBP.
Figure 11 Average offer prices per square metre of
housing in the primary market in selected markets
(PLN/sq.m)
Figure 12 Average offer prices per square metre of
housing in the primary market in the largest cities
(PLN/sq.m)
Note to Figures 11-12: prices collected from all available sources.
Source: PONT Info Nieruchomości Source: PONT Info Nieruchomości
80
90
100
110
120
130
140
150
160
170
180
190
III
200
6
III
200
7
III
200
8
III
200
9
III
201
0
III
201
1
III
201
2
III
201
3
III
201
4
III
201
5
III
201
6
Warszawa RP T Warszawa RP T defl. CPI
6M RP T 6M RP T defl. CPI.
10M RP T 10M RP T defl. CPI
80
90
100
110
120
130
140
150
160
170
180
190
III
200
6
III
200
7
III
200
8
III
200
9
III
201
0
III
201
1
III
201
2
III
201
3
III
201
4
III
201
5
III
201
6
Warszawa RW T Warszawa RW T defl. CPI
6M RW T 6M RW T defl. CPI.
10M RW T 10M RW T defl. CPI
2 000
3 000
4 000
5 000
6 000
7 000
8 000
9 000
10 000
III
200
6
III
200
7
III
200
8
III
200
9
III
201
0
III
201
1
III
201
2
III
201
3
III
201
4
III
201
5
III
201
6
Warszawa hed. 6M hed. 10M hed.
Warszawa RW 6M RW 10M RW
2 000
3 000
4 000
5 000
6 000
7 000
8 000
9 000
10 000II
I 2
00
6
III
200
7
III
200
8
III
200
9
III
201
0
III
201
1
III
201
2
III
201
3
III
201
4
III
201
5
III
201
6
Gdańsk hed. Kraków hed. Łódź hed.
Poznań hed. Warszawa hed. Wrocław hed.
6M hed.
2000
3000
4000
5000
6000
7000
8000
9000
10000
III 2
006
III 2
007
III 2
008
III 2
009
III 2
010
III 2
011
III 2
012
III 2
013
III 2
014
III 2
015
III 2
016
Warszawa 5M 10M
3000
4000
5000
6000
7000
8000
9000
10000
III 2
006
III 2
007
III 2
008
III 2
009
III 2
010
III 2
011
III 20
12
III 2
013
III 2
014
III 2
015
III 2
016
Wrocław Łódź Kraków Warszawa
Gdańsk Gdynia Poznań

Report on housing prices and the situation in the residential and commercial real estate market in Poland in 2017 Q2.
Narodowy Bank Polski 14
Figure 13 Average offer prices per square metre of
newly launched housing contracts in the primary mar-
ket in selected markets (PLN/sq.m)
Figure 14 Average rent rates (offers and transactions)
per square metre of housing in the secondary market
in selected cities ( (PLN/sq.m)
Note: prices refer only to new contracts put on the market for the
first time.
Source: REAS.
Source: NBP.
2. Affordability of loan-financed housing, loan availability, profitability of housing investment
Figure15 Estimate of affordability of loan-financed hous-
ing, average for 7M
Figure 16 Quarterly changes in the estimated afforda-
bility of loan-financed housing, average for 7M, and
the strength and directions of the impact of particular
components
Available housing loan – a measure specifying the potential maximum housing loan; expressed in PLN thousand in a particular market,
taking into account banks’ lending requirements and loan parameters (i.e. interest rate, amortization period, minimum wage, as the mini-
mum income after payment of loan instalments).
Affordability of loan-financed housing– measure specifying how many square metres of housing which may be purchased for a mortgage
loan obtained based on the average monthly wage in the enterprises sector in a particular market (GUS), in view of loan parametres (interest
rate, depreciation period, minimum wages understood as the minimum income after repayment of loan instalments) given the average
transaction price of housing (40% from the primary market and 60% from the secondary market) in a particular market (BaRN). Index
growth rate and spreads between particular markets also provide important information.
ZKPK Index− accumulated index of changes in banks’ lending policy criteria; positive values mean the easing, and negative values the
tightening of lending policy as compared to the initial period i.e. 2003 Q4. Computing methods of the index are described in the Financial
Stability Report, December 2012, NBP.
Source: NBP, GUS. Source: NBP, GUS.
4000
5000
6000
7000
8000
9000
10000
11000
I 20
07
I 20
08
I 200
9
I 20
10
I 201
1
I 20
12
I 201
3
I 20
14
I 20
15
I 20
16
I 20
17
Warszawa Kraków Wrocław Poznań
Trójmiasto Łódź śr.6M
15
20
25
30
35
40
45
50
55
I 2
006
I 2
007
I 2
008
I 2
009
I 2
010
I 2
011
I 2
012
I 2
013
I 2
014
I 2
015
I 2
016
I 2
017
Warszawa 10M śr.waż.zasobem 6M śr.waż.zasobem
40
50
60
70
80
90
100
110
120
130
140
I 2
006
I 2
007
I 2
008
I 2
009
I 2
010
I 2
011
I 2
012
I 2
013
I 2
014
I 2
015
I 2
016
I 2
017
Gdańsk Gdynia Kraków Łódź
Poznań Warszawa Wrocław śr.7M
-20%
-15%
-10%
-5%
0%
5%
10%
15%
I 2
006
I 2
007
I 2
008
I 2
009
I 2
010
I 2
011
I 2
012
I 2
013
I 2
014
I 2
015
I 2
016
I 2
017
zm
iana
w
%
cena (śr.RP i RW)
wynagrodzenia
maks.udział dochodu przezn.na spłatę
stopa procentowa
kredytowa dostępność mieszkania
Avg. 6M
Avg. 6M, stock weighted Avg. 10M, stock weighted
Avg. 7M, avg. price RP i RW income max. share of income for loan repayment interest rate
loan housing availability

Report on housing prices and the situation in the residential and commercial real estate market in Poland in 2017 Q2.
Narodowy Bank Polski
15
Figure 17 Estimates of available mortgage loans and
accumulated index of changes in banks’ lending pol-
icy criteria (ZKPK, right-hand axis)
Figure 18 Costs of a PLN housing loan for consumer as
deflated with CPI or wage growth in the enterprise
sector
Housing availability – – a measure of potential availability to pur-
chase housing space at the transaction price for an average wage in
a particular city. It expresses the number of square metres of housing
that can be purchased for an average wage in the enterprise sector
in a particular city (GUS), at an average transaction price in a partic-
ular market (40% from the primary market and 60% from the sec-
ondary markets) (NBP). Corrected data concerning wages in Gdy-
nia.
Note: values below 0 denote negative real interest rate for the bor-
rower; red lines separate the one-year period of the absence of the
government subsidized housing scheme, i.e. RNS (operating in the
years 2007-2012) and MDM (operating in the years 2014-2018).
Source: NBP, GUS. Source: NBP, GUS, BGK.
Figure 19 Profitability of home rental (average in War-
saw and in 6M) as compared to alternative investment
of households
Figure 20 Estimate of housing demand in the primary
market in 6M and its components
Note to Figure 19: values exceeding 1 denote higher profitability of purchasing property to be rented to other persons than other capital
investment. This analysis does not take into account high transaction costs in the housing market and potentially long payback periods .
Note to Figure 20: aggregate estimated demand consists in 60% of consumer demand (loan affordability), in 30% of profitability of home
rental and in 10% of speculative investor’s profit; weights were estimated by experts; the index presents the moving average of the two
last consecutive quarters.
Source : NBP, GUS. Source : NBP, GUS.
-10
-8
-6
-4
-2
0
2
100
150
200
250
300
350
400
450
500
I 20
06
I 20
07
I 20
08
I 20
09
I 20
10
I 20
11
I 20
12
I 20
13
I 20
14
I 20
15
I 20
16
I 20
17
tys.
zł
Gdańsk Gdynia Kraków
Łódź Poznań Warszawa
Wrocław śr.7M waż.bud. ZKPK P. oś
-8%
-6%
-4%
-2%
0%
2%
4%
6%
8%
I 20
05
I 20
06
I 20
07
I 20
08
I 20
09
I 20
10
I 20
11
I 20
12
I 20
13
I 20
14
I 20
15
I 20
16
I 20
17
nom.st.proc.kred.mieszk.PLN
real.st.proc.kred.mieszk.PLN def. CPI
real.st.proc.kred.mieszk.PLN dla kred.RNS / MDM def.CPI
real.st.proc.kred.mieszk.PLN dla kred.RNS / MDM def.dyn.wynagr.(wyrówn.)
real.st.proc.kred.mieszk.PLN def. dyn.wynagr.(wyrówn.)
0,5
1,0
1,5
2,0
2,5
3,0
3,5
4,0
4,5
5,0
5,5
I 20
06
I 20
07
I 20
08
I 20
09
I 20
10
I 20
11
I 20
12
I 20
13
I 20
14
I 20
15
I 20
16
I 20
17
najem do st.kred.mieszk.GD najem do st.obl.10l.najem do st.kap.nier.kom. najem do inw.finans.GDnajem do st.dep.stan GD
- 200
- 100
0
100
200
300
400
500
600
-300
-250
-200
-150
-100
-50
0
50
100
150
200
250
I 20
07
I 20
08
I 20
09
I 20
10
I 20
11
I 20
12
I 20
13
I 201
4
I 20
15
I 20
16
I 20
17
popyt całkowity szacowany popyt całkowity rzeczywisty
popyt konsumpcyjny (p.oś) popyt inwestycyjny (p.oś)
popyt spekulacyjny (p.oś)
(RH) avg. 7M weigthed by
new housings Nominal interest rate, housing loan
Real interest rate, housing loan CPI defl.
Real interest rate, RNS/ MDM housing loan CPI defl.
Real interest rate, RNS/MDM housing loan CPI defl. by earnings
Real interest rate, housing loan CPI defl. by earnings
rental to household housing loan
rental as to commercial property cap. rate
rental to household deposits
rental to 10-y. bonds
rental to households fin. investment real total demand
investment demand (RH)
estimated total demand
consumer demand (RH)
speculative demand (RH)
Report on housing prices and the situation in the residential and commercial real estate market in Poland in 2017 Q2.
Narodowy Bank Polski 16
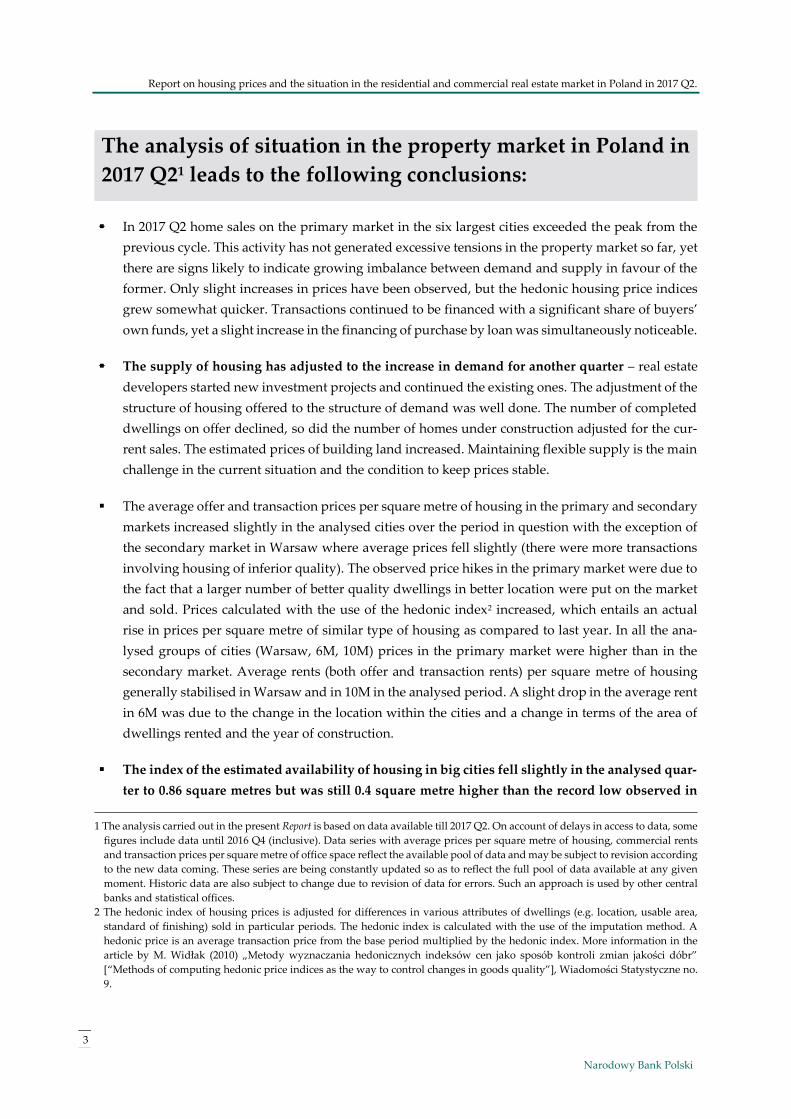
3. Disbursements of residential mortgage loans, interest rates
Figure 21 Balance and quarter-on-quarter changes in
housing loan receivables from households after ad-
justments and the currency structure of quarter-on-
quarter increases in housing loan receivables (PLN
billion)
Figure 22 Currency structure of housing loan receiva-
bles from households resulting from residential
mortgage loans (%)
Source: NBP. Source: NBP.
Figure 23 New housing loan contracts: value (LH) and
number (RH)
Figure 24 Geographical structure of new housing
loan value (in billion PLN) in Poland
Note to Figures 23 and 24: the data inform about the signed residential mortgage loan contracts and not the actual disbursement of
residential mortgage loans. Source: ZBP. Source: BIK.
Figure 25 Interest rates on residential loans for house-
holds in Poland
Figure 26 Bank margins (for WIBOR, LIBOR, EURI-
BOR 3M) in the case of new residential mortgage
loans
Note: Note: foreign currency loans practically ceased to be granted
in 2012.
Source: NBP.
Note: bank margin is the difference between housing loan rate
(NBP data) and the WIBOR3M rate, the LIBORCHF3M rate or
WIBOR3M rate.
Source: NBP.
-100
0
100
200
300
400
500
-4
-2
0
2
4
6
8
10
12
14
I 200
4
I 200
5
I 200
6
I 200
7
I 200
8
I 200
9
I 201
0
I 201
1
I 201
2
I 201
3
I 201
4
I 201
5
I 201
6
I 201
7
stan
w m
ld z
ł
zmia
ny k
war
taln
e w
mld
zł
mieszkaniowe kredyty walutowe po korektach (zm.kw.) (L oś)mieszkaniowe kredyty złotowe (zm.kw) (L oś)stan kredytu mieszkaniowego (P oś)w tym stan kredytu walutowego (P oś)
0%
10%
20%
30%
40%
50%
60%
70%
80%
90%
100%
I 2
00
3
I 2
00
4
I 2
00
5
I 2
00
6
I 2
00
7
I 2
00
8
I 2
00
9
I 2
01
0
I 2
01
1
I 2
01
2
I 2
01
3
I 2
01
4
I 2
01
5
I 2
01
6
I 2
01
7
FX housing loan
PLN housing loan
0
10
20
30
40
50
60
70
80
90
0
2
4
6
8
10
12
14
16
18
I 2
00
3
I 2
00
4
I 2
00
5
I 2
00
6
I 2
00
7
I 2
00
8
I 2
00
9
I 2
01
0
I 2
01
1
I 2
01
2
I 2
01
3
I 2
01
4
I 2
01
5
I 2
01
6
I 2
01
7
liczb
a w
tys
.
wart
ość
w m
ld z
ł
wartość PLN w tym wartość walutowe
liczba PLN w tym liczba walutowe
-
2
4
6
8
10
12
14
16
18
20
0%
10%
20%
30%
40%
50%
60%
70%
80%
90%
100%
I 20
05
I 20
06
I 20
07
I 20
08
I 20
09
I 20
10
I 20
11
I 20
12
I 20
13
I 20
14
I 20
15
I 20
16
I 20
17
mld
zł
Warszawa 6M 10M PP Polska (P.oś)
1%
2%
3%
4%
5%
6%
7%
8%
9%
I 20
05
I 20
06
I 20
07
I 20
08
I 200
9
I 201
0
I 20
11
I 20
12
I 20
13
I 20
14
I 20
15
I 20
16
I 20
17
PLN nowe CHF nowe EUR nowe
PLN stany CHF stany
0,0%
0,5%
1,0%
1,5%
2,0%
2,5%
3,0%
3,5%
4,0%
4,5%
I 20
05
I 20
06
I 20
07
I 20
08
I 20
09
I 20
10
I 20
11
I 20
12
I 20
13
I 20
14
I 20
15
I 20
16
I 20
17
%PLNnowe - WIBOR3M %CHFnowe-LIBOR3M
%PLNstan - WIBOR3M %PLNnowe-st.dep.GD stany
%PLNstan-st.dep.GD stany
PLN housing loan quaterly change (LH) FX housing loan quarterly change (LH) PLN housing loan stock (RH)
In which FX housing loan stock (RH)
(RH) number of PLN loans
value of PLN loans
number of FX loans
value of FX loans
CHF new
CHF stock
EUR new PLN new
PLN stock
% CHF new – LIBOR3M
% PLN sock – deposit rate (stock of
households loans )
% PLN new – WIBOR3M
% PLN stock – WIBOR3M
% PLN stock – WIBOR3M

Report on housing prices and the situation in the residential and commercial real estate market in Poland in 2017 Q2.
Narodowy Bank Polski
17
Table 2 Estimated gross housing loan disbursement to households in Poland and estimated purchases of devel-
oper housing financed both with cash and with loans in the primary market in 7M (in PLN million)
Date
Estimated value of disbursed mort-
gage loans in Po-land
Estimated value of housing transaction in
the PM in 7M
Estimated disburse-ments of loans with own contribution for housing purchase in the primary market
in 7M
Estimated value of home purchases
in the PM in
in 7M
Estimated share of cash home pur-
chases in the RP in 7M
2013 Q1 6295 2705 1121 1584 59%
2013 Q2 7867 3047 1428 1620 53%
2013 Q3 9140 3599 1690 1908 53%
2013 Q4 9084 4095 1773 2321 57%
2014 Q1 7571 3852 1478 2374 62%
2014 Q2 8899 3671 1737 1934 53%
2014 Q3 8894 3649 1736 1913 52%
2014 Q4 8122 3802 1585 2217 58%
2015 Q1 8996 4020 1756 2264 56%
2015 Q2 10640 4442 2077 2365 53%
2015 Q3 10341 4606 2019 2587 56%
2015 Q4 11237 4967 2194 2773 56%
2016 Q1 9742 5039 1902 3138 62%
2016 Q2 11661 5345 2276 3069 57%
2016 Q3 9632 5041 1880 3161 63%
2016 Q4 9933 6404 1939 4465 70%
2017 Q1 10945 6503 2137 4367 67%
2017 Q2 11872 6274 2317 3957 63%
Note: The estimates are based on the following assumptions:
In the period 2012 Q4-2014 Q4, the estimates of newly granted loans in Poland in individual quarters were based on increases in loans to
households adjusted for loan amortization and flows between the foreign currency and PLN portfolio, available in NBP reporting. The
entire banking system and credit unions were taken into account. Starting as of 2015 Q1, the estimated value of loan disbursements is
based on the data collected from banks.
The estimated value of transactions in the primary market of 7 cities (Gdańsk, Gdynia, Kraków, Łódź, Poznań, Warsaw, Wrocław) was
calculated by multiplying the average price of dwelling by its average size in square metres and the number of dwellings sold (based on
the REAS data). On the basis of ZBP data it was assumed that the value of newly granted loans for the purchase of housing in the primary
markets of 7M in 2012 accounted for 50% of the value of housing loans in those cities, whereas at the end of 2013 this share amounted to
approx. 57%. The estimated value of cash transactions constitutes the difference between the value of transactions in the market of 7 cities
and loan disbursements, including own contribution. The home price and area data for all periods have been updated.
Source: NBP, REAS, ZBP, GUS.

Report on housing prices and the situation in the residential and commercial real estate market in Poland in 2017 Q2.
Narodowy Bank Polski 18
Figure 27 Loans to households for residential real es-
tate and the share of loans classified as impaired
loans
Figure 28 Estimated ROE on residential mortgage
loans denominated in PLN for banks in Poland
Note: receivables (loans) with determined loss of value – receiva-
bles from portfolio B, in relation to which objective premises of
loss in value were observed and a decrease in the expected value
of future cash flows (in banks using the IFRS) or which were
deemed as doubtful receivables in accordance with the Ordinance
of the Minister of Finance on establishing provisions against the
risk associated with banking activities (in banks using the PAS).
Source: NBP.
Note: Income and costs related to the mortgage loan portfolio do
not take into account banks' operating costs and taxes. The esti-
mated ROE is calculated as the adjusted interest margin on mort-
gage loans with respect to the minimum required down-payment
(buyer’s own contribution). Calculation based on KNF publica-
tion, Solvency ratio - until 2014, Total capital ratio - as of 2014. The
adjusted interest margin is the result of all income being added
and all costs being deducted. The effective cost of financing was
computed based on the WIBOR rates by adding estimative costs
related to bank's own financing.
Source: NBP, KNF.
4. Operating profitability of housing development projects, costs of construction and assembly
output and economic situation of real estate developers in Poland
Figure 29 Rescaled stock exchange indices: WIG20 for
real estate and construction companies (2007 Q2 =100)
Figure 30 Number of bankruptcies in particular sectors
(as at the end of December)
Note: harmonized data, 2007 Q2 = 100. The WIG index for real es-
tate developers has been recorded since 2007 Q2; 2017 Q 3 – infor-
mation as at 20 February 2017.
Source: Warsaw Stock Exchange.
Note: breakdown according to the first entry into the KRS.
Source: Coface Poland.
Note to Figure 30: as of 1 January 2016, the former provisions in the bankruptcy law were amended - the new restructuring law entered
into force. The main goal of the restructuring proceedings, in addition to satisfying creditors, is to avoid debtor’s bankruptcy by allowing
debtor’s restructuring through entering into an arrangement with creditors, and in the event of the recovery proceedings - also by under-
taking recovery measures, while safeguarding the legitimate rights of creditors. A major change is the fact that under the currently appli-
cable law not only insolvent companies are subject to restructuring proceedings but also companies threatened with insolvency; thus, new
statistics show not only the number of bankrupts but also the number of companies facing bankruptcy. Previously, the applicable law
allowed to declare bankruptcy under composition or arrangement scheme only if the company was actually insolvent.
0%
1%
2%
3%
4%
5%
6%
7%
8%
9%
10%
0
50
100
150
200
250
300
350
400
I 2
009
I 2
010
I 2
011
I 2
012
I 2
013
I 2
014
I 2
015
I 2
016
I 2
017
Kredyty hipoteczne mieszkaniowe (L. oś)
Wskaźnik kredytów zagrożonych na nier. mieszk. (P oś)
Wskaźnik kredytów zagrożonych na nier. mieszk. złotowych (P oś)
Wskaźnik kredytów zagrożonych na nier. mieszk. walutowych (P oś)
-20%
-15%
-10%
-5%
0%
5%
10%
15%
20%
-8%
-6%
-4%
-2%
0%
2%
4%
6%
8%
I 2
009
I 2
010
I 2
011
I 2
012
I 2
013
I 2
014
I 2
015
I 2
016
I 2
017
Obciążenie kredytów odpisamiEfektywny koszt finansowania kredytówEfektywne oprocentowanie kredytówSkorygowana marża odsetkowa na kredytachROE (P oś)
0
20
40
60
80
100
120
I 2
004
I 2
005
I 2
006
I 2
007
I 2
008
I 2
009
I 2
010
I 2
011
I 2
012
I 2
013
I 2
014
I 2
015
I 2
016
I 2
017
II 2
007 =
100
WIG20 WIG-NIER. WIG-BUD.
0
50
100
150
200
250
300
350
400
I-VI 2015 I-VI 2016 I-VI 2017
Budownictwo Obsługa rynku nieruchomości Pozostałe
Housing mortgage loans (LH)
Impaired housing loan rate (RH)
Impaired PLN housing loan rate (RH)
Impaired FX housing loan rate (RH)
Loan write-offs
Effective cost of loan funding
Effective interest rate on loans
Adjusted interest margin on loans
ROE (RH)
real estate activities other sectors new housing

Report on housing prices and the situation in the residential and commercial real estate market in Poland in 2017 Q2.
Narodowy Bank Polski
19
Figure 31 Estimated share of direct costs of construc-
tion per square metre of usable area of a residential
building (type 1122-30228) in the transaction price in
the primary market
Figure 32 Estimated ROE from housing projects
(building type 1122-30228/) in the largest cities and the
reported rate of return for DFD*
Note to Figure 32 : the estimated rate of return on equity from typical new housing projects, under the assumption of the currently appli-
cable interest rates, banks’ requirements, production costs and net price; calculation based on the diagram included in Annex 3 of the
Report on the situation of the Polish market of residential and commercial real estate in 2011. Since 2015 NBP has been using its own prices of land
under multi-family residential construction which has changed the existing estimates. */DFD – ROE of an average large real development com-
pany according to GUS data (employment size =>50 persons). Source: NBP based on Sekocenbud. Source: NBP based on Sekocenbud, GUS (F01).
Figure 33 Expected changes in prices of construction
and assembly production (+3M) and growth rate of
construction cost of usable area of a residential build-
ing (type 1122-302 28/)
Figure 34 Average construction cost of square metre of
usable area of a residential building (type 1122-302 28/)
in selected markets (PLN/sqm.)
Source: NBP based on GUS data (business conditions survey),
Sekocenbud.
Source: NBP based on Sekocenbud.
28 Half of the building (type 1122-302 building) monitored by NBP as of the second half of 2016 based on Sekocenbud data: an
average residential multi-family building, five-storey, with an underground garage; construction technology: continuous foot-
ing, construction walls and ceilings – reinforced concrete, monolithic, masonry curtain walls made from ceramic hollow brick
units (MAX); change in the type of the building analysed is associated with closing of cost estimation for facility 1121. Analytical
assumptions related to building 1121 have been maintained.
0%
5%
10%
15%
20%
25%
30%
35%
40%
45%
50%
55%
60%
65%
70%
75%
I 20
07
I 20
08
I 20
09
I 20
10
I 20
11
I 20
12
I 20
13
I 20
14
I 20
15
I 20
16
I 20
17
Gdańsk KrakówŁodź PoznańWrocław Warszawaziemia śr.7M waż.bud.(p.oś)
0%
5%
10%
15%
20%
25%
30%
35%
40%
45%
I 20
07
I 20
08
I 20
09
I 20
10
I 20
11
I 20
12
I 20
13
I 20
14
I 20
15
I 20
16
I 20
17
Gdańsk Kraków Łodź
Poznań Wrocław Warszawa
DFD 6M waż.bud.
-30%
-20%
-10%
0%
10%
20%
30%
40%
50%
60%
I 20
07
I 20
08
I 20
09
I 20
10
I 20
11
I 20
12
I 20
13
I 20
14
I 20
15
I 20
16
I 20
17
Przewidywane zmiany cen robót bud.-montaż. (+3M) wg ankiety GUS
Dynamika kw/kw faktycznych kosztów budowy wg Sekocenbud
2400
2500
2600
2700
2800
2900
3000
3100
3200
3300
3400
3500
3600
I 2
007
I 2
008
I 2
009
I 2
010
I 2
011
I 2
012
I 2
013
I 2
014
I 2
015
I 2
016
I 2
017
Warszawa 6M 10M Polska
land, avg. 7M weighted by new
housing (RH)
6M, weighted by
new housings
expected changes of prices of construction costs
dynamic of real construction costs

Report on housing prices and the situation in the residential and commercial real estate market in Poland in 2017 Q2.
Narodowy Bank Polski 20
Figure 35 Warsaw − estimated structure of price per
square metre of housing usable area in the PM (type
1122-302 28/ building) for consumers.
Figure 36 Kraków − estimated structure of price per
square metre of housing usable area in the PM (type
1122-302 28/ building) for consumers.
Source: NBP based on Sekocenbud, REAS. Source: NBP based on Sekocenbud, REAS.
Figure 37 Gdańsk − estimated structure of price per
square metre of housing usable area in the PM (type
1122-302 28/ building) for consumers.
Figure 38 Poznań − estimated structure of price per
square metre of housing usable area in the PM (type
1122-302 28/ building) for consumers.
Source: NBP based on Sekocenbud, REAS. Source: NBP based on Sekocenbud, REAS.
Figure 39 Wrocław − estimated structure of price per
square metre of housing usable area in the PM (type
1122-302 28/ building) for consumers.
Figure 40 Łódź − estimated structure of price per
square metre of housing usable area in the PM (type
1122-302 28/ building) for consumers.
Source: NBP based on Sekocenbud, REAS. Source: NBP based on Sekocenbud, REAS.
0
1000
2000
3000
4000
5000
6000
7000
8000
I 20
07
I 20
08
I 20
09
I 20
10
I 20
11
I 20
12
I 201
3
I 20
14
I 20
15
I 20
16
I 20
17
ziemia + zagosp.terenu projekt koszty budowy
koszt kredytu koszty ogólne zysk deweloperski
0
1000
2000
3000
4000
5000
6000
7000
8000
I 20
07
I 20
08
I 20
09
I 20
10
I 20
11
I 20
12
I 20
13
I 20
14
I 20
15
I 20
16
I 20
17
ziemia + zagosp.terenu projekt koszty budowy
koszt kredytu koszty ogólne zysk deweloperski
0
1000
2000
3000
4000
5000
6000
7000
I 20
07
I 20
08
I 20
09
I 20
10
I 20
11
I 20
12
I 20
13
I 20
14
I 20
15
I 20
16
I 201
7
ziemia + zagosp.terenu projekt koszty budowy
koszt kredytu koszty ogólne zysk deweloperski
0
1000
2000
3000
4000
5000
6000
7000I
20
07
I 20
08
I 20
09
I 20
10
I 20
11
I 20
12
I 20
13
I 20
14
I 20
15
I 20
16
I 20
17
ziemia + zagosp.terenu projekt koszty budowy
koszt kredytu koszty ogólne zysk deweloperski
0
1000
2000
3000
4000
5000
6000
I 20
07
I 20
08
I 20
09
I 20
10
I 20
11
I 20
12
I 201
3
I 20
14
I 20
15
I 20
16
I 20
17
ziemia + zagosp.terenu projekt koszty budowy
koszt kredytu koszty ogólne zysk deweloperski
0
500
1000
1500
2000
2500
3000
3500
4000
4500
5000
I 20
07
I 20
08
I 20
09
I 20
10
I 20
11
I 20
12
I 20
13
I 20
14
I 20
15
I 20
16
I 20
17
ziemia + zagosp.terenu projekt koszty budowy
koszt kredytu koszty ogólne zysk deweloperski
construction costs
developers’ profit
design
overheads
design
overheads
construction costs
developers’ profit
land + development
loan cost
land + development
loan cost
land + development
loan cost
design
overheads
design
overheads
land + development
loan cost
land + development
loan cost
construction costs
developers’ profit
design
overheads
construction
costs
developers’ profit
construction costs
developers’ profit
design
overheads
construction costs
developers’ profit
land + development
loan cost

Report on housing prices and the situation in the residential and commercial real estate market in Poland in 2017 Q2.
Narodowy Bank Polski
21
Figure 41 Economic indicators of an average large real
estate developer (DFD)
Figure 42 Situation of an average large real estate
developer (DFD)
Note to Figures 41 - 43: DFD - a large developer employs over 50 persons according to GUS.
Source: NBP based on GUS (F01). Source: NBP based on GUS (F01).
Figure 43 Costs of an average DFD
Figure 44 Residential projects and dwellings under
construction and dwellings put on sale in 7M.
Source: NBP based on GUS (F01).
Note: Projects under construction are building permits minus
completed dwellings ready for occupancy; dwellings under con-
struction are dwellings whose construction started minus com-
pleted dwellings; figures divided by sales in a particular period.
Source: NBP based on GUS.
Figure 45 Loans to corporations for real estate purchases
(in PLN billion, left-hand scale) and the share of loans
classified as impaired loans (in % right-hand scale)
Figure 46 Value of investment transactions in the
commercial real estate market (in EUR billion)
Data exclusive of BGK.
Source: NBP. Source: Comparables.pl.
-5
0
5
10
15
20
25
30
35
40
45
50
I 2
005
I 2
006
I 2
007
I 2
008
I 2
009
I 2
010
I 2
011
I 2
012
I 2
013
I 2
014
I 2
015
I 2
016
I 2
017
mln
zł
przychody koszty ogółem wynik netto
0
1
2
3
4
5
6
7
0102030405060708090
100110120130
I 20
05
I 20
06
I 20
07
I 20
08
I 20
09
I 20
10
I 20
11
I 20
12
I 20
13
I 20
14
I 20
15
I 20
16
I 20
17
lata
mln
zł
bank ziemi mieszkania
projekty w toku bank ziemi w latach prod. (P oś)
0%
20%
40%
60%
80%
100%
120%
-10
4 990
9 990
14 990
19 990
24 990
I 20
05
I 20
06
I 20
07
I 20
08
I 20
09
I 20
10
I 20
11
I 20
12
I 20
13
I 20
14
I 201
5
I 201
6
I 201
7
tys.
zł
zużycie materiałów i energii usługi obce
wynagrodzenia inne
wsk.poz.kosztów (P oś)
0%
5%
10%
15%
20%
25%
30%
35%
40%
-2,0-1,00,01,02,03,04,05,06,07,08,09,0
I 20
07
I 20
08
I 20
09
I 20
10
I 20
11
I 20
12
I 20
13
I 201
4
I 20
15
I 20
16
I 20
17
Oferta na rynku/1000M.gotowe w ofercie sprzedaży (p.oś)Projekty w toku (śr.ruch.3 okr.)Budowa mieszkań w toku (śr.ruch.3 okr.)
0%
5%
10%
15%
20%
25%
30%
35%
40%
45%
50%
0
10
20
30
40
50
60
I 2
009
I 2
010
I 2
011
I 2
012
I 2
013
I 2
014
I 2
015
I 2
016
I 2
017
Kredyty na powierzchnię biurową
Kredyty na nieruchomości mieszkaniowe
Kredyty na nieruchomości pozostałe
Wskaźnik kredytów zagrożonych na nieruchomości mieszkaniowe
Wskaźnik kredytów zagrożonych na powierzchnię biurową
Wskaźnik kredytów zagrożonych na pozostałe nieruchomości
0
1
2
3
4
5
19
97
19
98
19
99
20
00
20
01
20
02
20
03
20
04
20
05
20
06
20
07
20
08
20
09
20
10
20
11
20
12
20
13
20
14
20
15
20
16
II2
01
7
Biura Handlowe Magazyny Pozostałe
use of materials and energy wages index of cost level (RH)
Office
Warehouse
outsourcing
other
Office space loans Housing loans Other real property loans Impaired housing loan ratio Impaired office space loan ratio
Impaired other real property loan ratio
net profit/loss income total costs housing units
land bank in production years (RH)
land bank
projects in progress
dwellings offered/1000 completed dwellings (RH) dwellings projects (moving avg.) dwellings under construction (moving avg.)
Warehouse Others Retail
Report on housing prices and the situation in the residential and commercial real estate market in Poland in 2017 Q2.
Narodowy Bank Polski 22
5. Residential construction and the housing market in Poland’s selected cities
Figure 47 Structure of residential construction inves-
tors in Poland in two quarters of the years 2014-2017
Figure 48 Completed dwellings in Poland, in quarter-
on-quarter terms
Source: GUS. Note to Figures 48-50: in violet colour only fourth quarters have
been marked.
Source: GUS.
Figure 49 Dwellings under construction in Poland , in
quarter-on-quarter terms
Figure 50 Issued building permits in Poland, in quar-
ter-on-quarter terms
Source: GUS. Source: GUS.
Figure 51 Housing construction in Poland (thousand
dwellings) and home construction indicator in Poland
(dwellings under construction minus completed
dwellings)
Figure 52 Number of dwellings put on the market,
both sold and offered for sale in Poland’s 6 largest
markets*
Note: rolling averages for the last four quarters
Source: NBP based on Sekocenbud, REAS.
*Warsaw, Kraków, Tri-City Agglomeration of Gdańsk, Sopot and
Gdynia, Wrocław, Poznań, Łódź.
Source: REAS.
010 00020 00030 00040 00050 00060 00070 00080 00090 000
100 000110 000120 000130 000140 000
20
14
20
15
20
16
20
17
20
14
20
15
20
16
20
17
20
14
20
15
20
16
20
17
dwellings completed dwellings in which
construction has
begun
dwellings for which
permits have been
granted
for sale or rent private construction housing cooperatives other
0
10 000
20 000
30 000
40 000
50 000
60 000
I 2
005
I 2
006
I 2
007
I 2
008
I 2
009
I 2
010
I 2
011
I 2
012
I 2
013
I 2
014
I 2
015
I 2
016
I 2
017
mie
szka
nia
w k
wa
rta
le
7 miast pozostała Polska
0
10 000
20 000
30 000
40 000
50 000
60 000
I 200
5
I 200
6
I 200
7
I 200
8
I 200
9
I 201
0
I 201
1
I 201
2
I 201
3
I 201
4
I 201
5
I 201
6
I 201
7
mie
szka
nia
w k
war
tale
7 miast pozostała Polska
0
10 000
20 000
30 000
40 000
50 000
60 000
70 000
I 200
5
I 200
6
I 200
7
I 200
8
I 200
9
I 201
0
I 201
1
I 201
2
I 201
3
I 201
4
I 201
5
I 201
6
I 201
7
mie
szka
nia
w
kwar
tale
7 miast pozostała Polska
-100
0
100
200
300
400
500
0
50
100
150
200
250
300
I 2
00
6
I 2
00
7
I 2
008
I 2
00
9
I 2
010
I 2
01
1
I 2
01
2
I 2
01
3
I 2
01
4
I 2
01
5
I 2
01
6
I 2
01
7
Tys
iąc
e
Mieszkania rozpoczęteMieszkania oddanePozwolenia na budowę mieszkańWskaźnik koniunktury (p.oś)Wskaźnik projektów w toku (p.oś)
0
10000
20000
30000
40000
50000
60000
I 2
00
7
I 2
00
8
I 2
00
9
I 2
01
0
I 2
01
1
I 2
01
2
I 2
01
3
I 2
01
4
I 2
01
5
I 2
01
6
I 2
01
7
wprowadzone w kwartale sprzedane w kwartale
oferta na koniec kwartału
rest of Poland 7M
rest of Poland 7M rest of Poland 7M
dwellings under construction dwellings completed building permits housing production index (RH) index of housing projects (RH)
sold dwellings launched dwellings
offered dwellings

Report on housing prices and the situation in the residential and commercial real estate market in Poland in 2017 Q2.
Narodowy Bank Polski
23
Figure 53 Housing supply and estimated rate of return
on housing investment in PM in 7M
Source: NBP, GUS, REAS, Sekocenbud.
Wykres 54 Measure of adjustment of dwellings on of-
fer to demand* in terms of area ≤ 50 sq. m, PM in Po-
land’s selected cities
Figure 55 Measure of adjustment of dwellings on of-
fer to demand* in terms of area > 50 sq. m, PM in Po-
land’s selected cities
Note: Figure 54 shows the percentage, short-term mismatch between supply (housing offers by real estate developers) and estimated
demand (transactions) with regard to the housing unit area in the primary market, according to the data from the BaRN database. The
mismatch is calculated as the ratio of the share of housing units with usable area of up to 50 square metres offered for sale to the number
of transactions involving housing units with a total area of up to 50 square metres (the average figure for the last four quarters). A positive
result (above the black line) indicates the surplus of dwellings of a particular size, a negative result – their deficit. Figure 55 is parallel for
the primary market, figures 56-57 - are parallel for the secondary market.
Source: NBP. Source: NBP.
Figure 56 Supply and demand mismatch*; dwellings
with an area ≤ 50 square metres – secondary market in
selected cities of Poland
Figure 57 Supply and demand mismatch*; dwellings
with an area > 50 square metres – secondary market in
selected cities of Poland
Source: NBP. Source: NBP.
0%
5%
10%
15%
20%
25%
30%
35%
0
2 000
4 000
6 000
8 000
10 000
12 000
14 000
16 000
18 000
20 000
I 20
07
I 20
08
I 20
09
I 20
10
I 20
11
I 20
12
I 20
13
I 20
14
I 20
15
I 20
16
I 20
17
cena mieszk.T RP
koszt bud.mieszk.+ziemia
stopa zwrotu (P oś)
3 okr.śr.ruch.(mieszk.rozpoczęte(+1500))
-80%
-60%
-40%
-20%
0%
20%
40%
60%
I 2
00
7
I 2
00
8
I 2
00
9
I 2
01
0
I 2
01
1
I 2
01
2
I 2
01
3
I 2
01
4
I 2
01
5
I 2
016
I 2
017
Warszawa 6M 10M
-10%
-5%
0%
5%
10%
15%
20%
25%
30%
35%
I 2
00
7
I 2
00
8
I 2
00
9
I 2
01
0
I 2
01
1
I 2
01
2
I 2
01
3
I 2
01
4
I 2
01
5
I 2
016
I 2
017
Warszawa 6M 10M
-60%
-50%
-40%
-30%
-20%
-10%
0%
I 2
007
I 2
008
I 2
009
I 2
010
I 2
011
I 2
012
I 2
013
I 2
014
I 2
015
I 2
016
I 2
017
Warszawa 6M 10M
0%
10%
20%
30%
40%
50%
60%
70%
80%
I 2
007
I 2
008
I 2
009
I 2
010
I 2
011
I 2
012
I 2
013
I 2
014
I 2
015
I 2
016
I 2
017
Warszawa 6M 10M
price RPT
construction costs+land
return rate (RH)
housings started (moving avg. + 1500)

Report on housing prices and the situation in the residential and commercial real estate market in Poland in 2017 Q2.
Narodowy Bank Polski 24
Figure 58 Selling time of dwellings on offer in the pri-
mary market in selected cities (number of quarters)
Figure 59 Selling time of dwellings on offer in the
secondary market in selected cities (number of quar-
ters)
Note: home selling time in the primary market is the ratio of the
number of dwellings being on offer at the end of the current quarter
to the number of dwellings sold in the last four quarters.
Source: NBP based on REAS.
Note: the actual average home selling time from the last four
quarters; data not comparable with Figure 58. Home selling time
in the secondary real estate markets takes into account sale trans-
actions only. Underestimated data as they are exclusive of entered
offers which have not been sold yet.
Source: NBP.
6. Housing policy
Figure 60 Price caps per square metre of housing in the
primary market in the government-subsidized hous-
ing scheme in Poland’s largest cities (in PLN)
Figure 61 Price caps per square metre of housing in the
primary market in the government-subsidized hous-
ing scheme in Poland’s largest cities (in PLN)
Note to Figures 60 - 65: The red vertical lines section off the period without government housing-subsidy schemes
Source: BGK. Source: BGK.
Figure 62 Price caps per square metre of housing in the
primary market in the government-subsidized hous-
ing scheme in Poland’s largest cities (in PLN)
Figure 63 Price caps per square metre of housing in the
primary market in the government-subsidized hous-
ing scheme in Poland’s largest cities (in PLN)
Source: BGK. Source: BGK.
2
3
4
5
6
7
8
9
I 2
012
III
201
2
I 2
013
III
201
3
I 2
014
III
201
4
I 2
015
III
201
5
I 2
016
III
201
6
I 2
017
Łódź Kraków Poznań Trójmiasto
Warszawa Wrocław 6 rynków
0,0
0,5
1,0
1,5
2,0
2,5
3,0
I 200
7
I 200
8
I 200
9
I 201
0
I 201
1
I 20
12
I 20
13
I 20
14
I 20
15
I 20
16
I 20
17
Warszawa śr. 6M śr. 10M
2000
3000
4000
5000
6000
7000
8000
9000
10000
I 2
007
I 2
008
I 2
009
I 2
010
I 2
011
I 2
012
I 2
013
I 2
014
I 2
015
I 2
016
I 2
017
Warszawa 6M 10M
2000
3000
4000
5000
6000
7000
8000
9000
10000
I 2
007
I 2
008
I 2
009
I 2
010
I 2
011
I 2
012
I 2
013
I 2
014
I 2
015
I 2
016
I 2
017
Warszawa Kraków Wrocław
Poznań Gdańsk Łódź
2000
3000
4000
5000
6000
7000
8000
9000
10000
I 2
007
I 2
008
I 2
009
I 2
010
I 2
011
I 2
012
I 2
013
I 2
014
I 2
015
I 2
016
I 2
017
Warszawa 6M 10M
2000
3000
4000
5000
6000
7000
8000
9000
10000
I 2
007
I 2
008
I 2
009
I 2
010
I 2
011
I 2
012
I 2
013
I 2
014
I 2
015
I 2
016
I 2
017
Warszawa Kraków Wrocław
Poznań Gdańsk Łódź
6M avg.
10M avg.
6M avg.

Report on housing prices and the situation in the residential and commercial real estate market in Poland in 2017 Q2.
Narodowy Bank Polski
25
Figure 64 Gap in the limit of government-subsidized
housing schemes as compared to the median of trans-
action price per square metre of housing in the PM
Figure 65 Gap in the limit of government-subsidized
housing schemes as compared to the median of trans-
action price per square metre of housing in the SM
Note to Figures 64-65: the gap is calculated as the difference of the maximum price (upper limit) in the RNS/MDM government-subsi-
dized housing scheme in the primary market in relation to the median of transaction price. The positive difference means that the
scheme finances housing with prices exceeding the median, the negative difference means the opposite. Source: NBP, BGK. Source: NBP, BGK.
Figure 66 Transactions involving dwellings, including
those meeting the eligibility criteria under the MDM
housing scheme* in Gdańsk according to BaRN data-
base
Figure 67 Transactions involving dwellings, including
those meeting the eligibility criteria under the MDM
housing scheme in Kraków according to BaRN data-
base
Note to Figures 66-71: the share of dwellings in the PM and SM meeting the eligibility criteria of the MDM housing scheme in 2017 Q3
have been calculated on the basis of transactions involving dwellings with an area below 75 sq. m., concluded in the period 2016 Q3 -
2016 Q2, according to BaRN database. Source: NBP. Source: NBP.
-60%
-50%
-40%
-30%
-20%
-10%
0%
10%
20%
30%
40%
I 20
07
I 20
08
I 20
09
I 20
10
I 20
11
I 20
12
I 20
13
I 20
14
I 2
01
5
I 2
01
6
I 2
01
7
Warszawa 6M 10M
-60%-50%-40%-30%-20%-10%
0%10%20%30%40%
I 20
07
I 20
08
I 20
09
I 20
10
I 20
11
I 20
12
I 20
13
I 20
14
I 20
15
I 20
16
I 20
17
Warszawa 6M 10M
0
4000
8000
12000
16000
1 501 1001 1501 2001 2501 3001 3501 4001 4501 5001 5501
RP ceny RP limit RW ceny RW limit
35,9%
16,2%
0
4000
8000
12000
16000
1 1001 2001 3001 4001 5001 6001 7001 8001
RP ceny RP limit RW ceny RW limit
21,1%
7,8%
RP price
RW price
RW price
RP price

Report on housing prices and the situation in the residential and commercial real estate market in Poland in 2017 Q2.
Narodowy Bank Polski 26
Figure 68 Transactions involving dwellings, including
those meeting the eligibility criteria under the MDM
housing scheme in Łódź according to BaRN database
Figure 69 Transactions involving dwellings, including
those meeting the eligibility criteria under the MDM
housing scheme in Poznań according to BaRN data-
base
Source: NBP. Source: NBP.
Figure 70 Transactions involving dwellings, including
those meeting the eligibility criteria under the MDM
housing scheme in Warsaw according to BaRN data-
base
Figure 71 Transactions involving dwellings, including
those meeting the eligibility criteria under the MDM
housing scheme in Wrocław according to BaRN data-
base
Source: NBP. Source: NBP.
0
2000
4000
6000
8000
1 201 401 601 801
RP ceny RP limit RW ceny RW limit
1,6%
45,5%
0
4000
8000
12000
16000
1 501 1001 1501 2001 2501 3001 3501 4001
RP ceny RP limit RW ceny RW limit
24,7%
27%
0
4000
8000
12000
16000
1 501 10011501200125013001350140014501500155016001
RP ceny RP limit RW ceny RW limit
26,3%
16%
RW price
RP price RW price
RP price
RW price
RP price
RW price
RP price
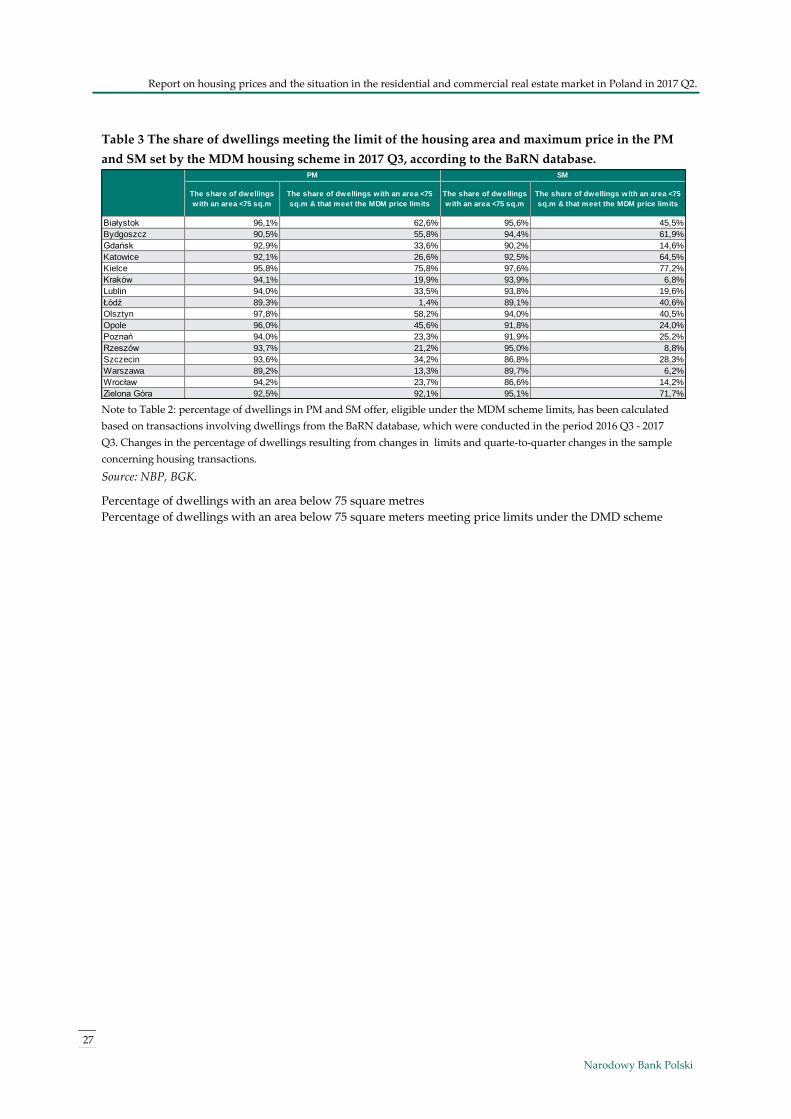
Report on housing prices and the situation in the residential and commercial real estate market in Poland in 2017 Q2.
Narodowy Bank Polski
27
Table 3 The share of dwellings meeting the limit of the housing area and maximum price in the PM
and SM set by the MDM housing scheme in 2017 Q3, according to the BaRN database.
Note to Table 2: percentage of dwellings in PM and SM offer, eligible under the MDM scheme limits, has been calculated
based on transactions involving dwellings from the BaRN database, which were conducted in the period 2016 Q3 - 2017
Q3. Changes in the percentage of dwellings resulting from changes in limits and quarte-to-quarter changes in the sample
concerning housing transactions.
Source: NBP, BGK.
Percentage of dwellings with an area below 75 square metres
Percentage of dwellings with an area below 75 square meters meeting price limits under the DMD scheme
The share of dwellings
with an area <75 sq.m
The share of dwellings with an area <75
sq.m & that meet the MDM price limits
The share of dwellings
with an area <75 sq.m
The share of dwellings with an area <75
sq.m & that meet the MDM price limits
Białystok 96,1% 62,6% 95,6% 45,5%
Bydgoszcz 90,5% 55,8% 94,4% 61,9%
Gdańsk 92,9% 33,6% 90,2% 14,6%
Katowice 92,1% 26,6% 92,5% 64,5%
Kielce 95,8% 75,8% 97,6% 77,2%
Kraków 94,1% 19,9% 93,9% 6,8%
Lublin 94,0% 33,5% 93,8% 19,6%
Łódź 89,3% 1,4% 89,1% 40,6%
Olsztyn 97,8% 58,2% 94,0% 40,5%
Opole 96,0% 45,6% 91,8% 24,0%
Poznań 94,0% 23,3% 91,9% 25,2%
Rzeszów 93,7% 21,2% 95,0% 8,8%
Szczecin 93,6% 34,2% 86,8% 28,3%
Warszawa 89,2% 13,3% 89,7% 6,2%
Wrocław 94,2% 23,7% 86,6% 14,2%
Zielona Góra 92,5% 92,1% 95,1% 71,7%
SMPM

Report on housing prices and the situation in the residential and commercial real estate market in Poland in 2017 Q2.
Narodowy Bank Polski 28
7. Transaction rents of commercial real estate
Figure 72 Transaction rents for A class office space (av-
erage EUR price/ sq.m./month)
Figure 73 Transaction rents for B class office premises
(average prices in EUR/sq.m./month)
Note: Warsaw - A class office buildings, Warsaw – B class office
buildings
Source: NBP.
Note: Gdańsk, Gdynia, Kraków, Łódź, Poznań, Wrocław
Source NBP.
Figure 74 Transaction rents for retail space in shop-
ping centres (shopping malls) with an area ranging
from 100 to 500 sq. m (EUR/sq.m./month)
Note to Figures 72-74: since 2015 Q4 the number of records
and respondents has increased considerably, thus changing
the size of the sample. We analysed rents for retail space lo-
cated in economically important parts of the city.
Source: NBP.
Figure 75 Median of the offer selling price of small re-
tail and commercial premises in the secondary market
(PLN/sq.m.)
Figure 76 Median of offer selling price of small office
premises in the secondary market (PLN/sq.m.)
Source: PONT, NBP material Source: PONT, NBP material
10
15
20
25
II 2013 IV 2013 II 2014 IV 2014 II 2015 IV 2015 II 2016 IV 2016
Gdańsk Katowice Kraków
Łódź Poznań Warszawa A
Warszawa B Wrocław pozostała Polska
30,0
35,0
40,0
45,0
50,0
55,0
60,0
II 2013 IV 2013 II 2014 IV 2014 II 2015 IV 2015 II 2016 IV 2016
10 miast 6 miast Warszawa
20
25
30
35
40
45
50
55
60
II 2013 IV 2013 II 2014 IV 2014 II 2015 IV 2015 II 2016 IV 2016Trójmiasto Katowice Kraków
Poznań Warszawa Wrocław
pozostała Polska Łódź
2000
3000
4000
5000
6000
7000
8000
9000
10000
I 20
13
II 2
013
III 2
013
IV 2
01
3
I 20
14
II 2
014
III 2
014
IV 2
01
4
I 20
15
II 2
015
III 2
015
IV 2
01
5
I 20
16
II 2
016
III 2
016
IV 2
01
6
I 20
17
Polska Wrocław Łódź Warszawa
Gdańsk Katowice Kielce Poznań
0
2000
4000
6000
8000
10000
12000
I 20
13
II 2
013
III 2
013
IV 2
01
3
I 20
14
II 2
014
III 2
014
IV 2
01
4
I 20
15
II 2
015
III 2
015
IV 2
01
5
I 20
16
II 2
016
III 2
016
IV 2
01
6
I 20
17
Polska Wrocław Łódź Warszawa
Gdańsk Katowice Kielce Poznań
rest of Poland 10M 6M
rest of Poland

Report on housing prices and the situation in the residential and commercial real estate market in Poland in 2017 Q2.
Narodowy Bank Polski
29
Table 4 Average prices of housing per square metre in the primary market in Gdańsk
Source: NBP.
Figure 5 Average prices of housing per square metre in the secondary market in Gdańsk
Source: NBP.
of f er trans. of f er trans. of f er trans. of f er trans. of f er trans.
av erage price (PLN/sq.m.) 6 581 6 185 6 536 6 283 6 550 6 481 6 462 6 430 6 775 6 501
growth (q-o-q) 99,2 95,9 99,3 101,6 100,2 103,1 98,7 99,2 104,9 101,1
growth (y -o-y ) 98,7 107,6 101,9 103,2 100,9 107,5 97,4 99,7 102,9 105,1
dwellings price range 3 619 1 549 3 584 1 313 3 517 1 647 3 600 1 951 4 211 1 655
<=4 000 PLN/sq.m 68 93 70 37 41 50 45 58 28 61
( 4 001; 6 000] PLN/sq.m 1 675 815 1 553 651 1 535 649 1 609 853 1 572 691
( 6 001; 8 000] PLN/sq.m 1 181 432 1 322 461 1 298 684 1 385 699 1 446 604
(8 001; 10 000] PLN/sq.m 487 109 501 95 493 215 431 257 1 054 231
>10 001 PLN/sq.m 208 100 138 69 150 49 130 84 111 68
dwellings space range 3 619 1 549 3 584 1 313 3 517 1 647 3 600 1 951 4 211 1 655
<= 40 sq.m 622 382 611 353 487 480 610 536 828 444
(40,1; 60] sq.m 1716 771 1721 641 1649 799 1702 917 1865 784
(60,1; 80] sq.m 1010 297 1018 242 1105 308 1075 387 1243 345
> 80,1 sq.m 271 99 234 77 276 60 213 111 275 82
av erage price of 1 sq.m.
of dwelling6 581 6 185 6 536 6 283 6 550 6 481 6 462 6 430 6 775 6 501
<=4 000 sq.m 6 774 5 796 6 884 6 026 6 715 6 747 6 954 6 509 7 301 6 798
(40,1; 60] sq.m 6 324 6 144 6 275 6 177 6 331 6 371 6 232 6 334 6 583 6 441
(60,1; 80] sq.m 6 562 6 303 6 485 6 581 6 505 6 163 6 326 6 368 6 518 6 186
> 80,1 sq.m 7 840 7 651 7 760 7 418 7 740 7 457 7 572 7 062 7 660 6 787
av erage of f er price dev iation 6,4% x 4,0% x 1,1% x 0,5% x 4,2% x
<= 40 sq.m 16,9% x 14,2% x -0,5% x 6,8% x 7,4% x
(40,1; 60] sq.m 2,9% x 1,6% x -0,6% x -1,6% x 2,2% x
(60,1; 80] sq.m 4,1% x -1,5% x 5,6% x -0,7% x 5,4% x
> 80,1 sq.m 2,5% x 4,6% x 3,8% x 7,2% x 12,9% x
II Q 2016 III Q 2016 IV Q 2016 I Q 2017 II Q 2017 r.specif ication
of f er trans. of f er trans. of f er trans. of f er trans. of f er trans.
av erage price (PLN/sq.m.) 6 319 5 521 6 226 5 555 6 455 5 610 6 566 5 778 6 970 6 030
growth (q-o-q) 102,0 102,9 98,5 100,6 103,7 101,0 101,7 103,0 106,2 104,4
growth (y -o-y ) 106,2 108,0 103,9 108,6 105,3 103,1 106,0 107,7 110,3 109,2
dwellings price range 2 114 1 089 1 726 966 1 719 929 1 308 628 1 207 747
<=4 000 PLN/sq.m 81 133 122 93 90 88 77 67 44 53
( 4 001; 6 000] PLN/sq.m 1 113 694 876 606 867 574 640 338 502 391
( 6 001; 8 000] PLN/sq.m 641 190 490 205 487 195 363 166 408 218
(8 001; 10 000] PLN/sq.m 153 45 137 36 139 38 112 36 116 57
>10 001 PLN/sq.m 126 27 101 26 136 34 116 21 137 28
dwellings space range 2 114 1 089 1 726 966 1 719 929 1 308 628 1 207 747
<= 40 sq.m 308 236 250 246 274 234 204 151 167 184
(40,1; 60] sq.m 746 517 560 435 543 414 432 253 404 342
(60,1; 80] sq.m 666 237 554 227 546 212 383 155 353 179
> 80,1 sq.m 394 99 362 58 356 69 289 69 283 42
av erage price of 1 sq.m.
of dwelling6 319 5 521 6 226 5 555 6 455 5 610 6 566 5 778 6 970 6 030
<=4 000 sq.m 6 801 5 895 6 756 5 955 6 879 6 298 6 995 6 244 7 629 6 642
(40,1; 60] sq.m 6 198 5 364 6 237 5 466 6 454 5 436 6 523 5 829 6 929 5 943
(60,1; 80] sq.m 6 066 5 178 6 084 5 159 6 355 5 160 6 438 5 332 6 876 5 762
> 80,1 sq.m 6 599 6 270 6 061 6 088 6 285 5 699 6 496 5 579 6 755 5 209
av erage of f er price dev iation 14,5% x 12,1% x 15,1% x 13,6% x 15,6% x
<= 40 sq.m 15,4% x 13,5% x 9,2% x 12,0% x 14,9% x
(40,1; 60] sq.m 15,5% x 14,1% x 18,7% x 11,9% x 16,6% x
(60,1; 80] sq.m 17,1% x 17,9% x 23,2% x 20,7% x 19,3% x
> 80,1 sq.m 5,2% x -0,4% x 10,3% x 16,4% x 29,7% x
II Q 2016 III Q 2016 IV Q 2016 I Q 2017 II Q 2017 r.specif ication

Report on housing prices and the situation in the residential and commercial real estate market in Poland in 2017 Q2.
Narodowy Bank Polski 30
Table 6 Average prices of housing per square metre in the primary market in Kraków
Source: NBP.
Figure 7 Average prices of housing per square metre in the secondary market in Kraków
Source: NBP.
of f er trans. of f er trans. of f er trans. of f er trans. of f er trans.
av erage price (PLN/sq.m.) 6 670 6 343 6 526 6 298 6 711 6 451 6 619 6 373 6 746 6 583
growth (q-o-q) 102,2 101,7 97,8 99,3 102,8 102,4 98,6 98,8 101,9 103,3
growth (y -o-y ) 99,3 107,6 98,0 99,8 102,9 101,5 101,5 102,1 101,1 103,8
dwellings price range 6 478 2 002 7 299 1 686 6 236 2 156 7 194 2 269 6 210 2 225
<=4 000 PLN/sq.m 15 1 12 4 8 2 12 2 11 4
( 4 001; 6 000] PLN/sq.m 2 076 841 2 768 752 2 233 779 2 193 1 000 1 741 815
( 6 001; 8 000] PLN/sq.m 3 665 1 001 3 785 813 3 053 1 180 4 094 1 018 3 508 1 063
(8 001; 10 000] PLN/sq.m 534 125 557 90 761 156 796 226 844 311
>10 001 PLN/sq.m 188 34 177 27 181 39 99 23 106 32
dwellings space range 6 478 2 002 7 299 1 686 6 236 2 156 7 194 2 269 6 210 2 225
<= 40 sq.m 1329 607 1490 534 1116 676 1161 673 938 619
(40,1; 60] sq.m 3444 984 3985 824 3452 1038 4083 1171 3480 1177
(60,1; 80] sq.m 1345 336 1378 261 1219 356 1518 329 1370 342
> 80,1 sq.m 360 75 446 67 449 86 432 96 422 87
av erage price of 1 sq.m.
of dwelling6 670 6 343 6 526 6 298 6 711 6 451 6 619 6 373 6 746 6 583
<=4 000 sq.m 6647 6485 6494 6261 6923 6554 6888 6605 7166 6883
(40,1; 60] sq.m 6469 6133 6329 6084 6470 6224 6430 6170 6513 6405
(60,1; 80] sq.m 6892 6500 6759 6656 6838 6560 6672 6412 6821 6505
> 80,1 sq.m 7855 7249 7670 7840 7685 7922 7502 7084 7491 7177
av erage of f er price dev iation 5,2% x 3,6% x 4,0% x 3,9% x 2,5% x
<= 40 sq.m 2,5% x 3,7% x 5,6% x 4,3% x 4,1% x
(40,1; 60] sq.m 5,5% x 4,0% x 4,0% x 4,2% x 1,7% x
(60,1; 80] sq.m 6,0% x 1,5% x 4,2% x 4,1% x 4,9% x
> 80,1 sq.m 8,4% x -2,2% x -3,0% x 5,9% x 4,4% x
II Q 2016 III Q 2016 IV Q 2016 I Q 2017 II Q 2017 r.specif ication
of f er trans. of f er trans. of f er trans. of f er trans. of f er trans.
av erage price (PLN/sq.m.) 6 756 5 740 6 837 5 820 6 910 5 951 6 859 5 979 6 992 6 038
growth (q-o-q) 99,0 97,6 101,2 101,4 101,1 102,3 99,3 100,5 101,9 101,0
growth (y -o-y ) 96,8 93,2 98,4 95,5 101,7 100,2 100,5 101,6 103,5 105,2
dwellings price range 1 475 312 1 537 321 1 464 391 1 160 452 1 301 486
<=4 000 PLN/sq.m 2 4 4 8 4 6 3 11 3 5
( 4 001; 6 000] PLN/sq.m 548 205 557 184 493 216 390 243 399 263
( 6 001; 8 000] PLN/sq.m 674 85 690 111 677 143 553 168 631 176
(8 001; 10 000] PLN/sq.m 189 13 203 16 200 19 155 26 192 36
>10 001 PLN/sq.m 62 5 83 2 90 7 59 4 76 6
dwellings space range 1 475 312 1 537 321 1 464 391 1 160 452 1 301 486
<= 40 sq.m 284 120 292 128 277 156 217 177 266 183
(40,1; 60] sq.m 626 128 640 134 608 180 511 195 559 213
(60,1; 80] sq.m 345 52 355 44 365 44 278 59 304 65
> 80,1 sq.m 220 12 250 15 214 11 154 21 172 25
av erage price of 1 sq.m.
of dwelling6 756 5 740 6 837 5 820 6 910 5 951 6 859 5 979 6 992 6 038
<=4 000 sq.m 7 056 5 787 7 250 6 035 7 445 6 363 7 480 6 423 7 645 6 384
(40,1; 60] sq.m 6 565 5 696 6 547 5 692 6 737 5 722 6 709 5 739 6 799 5 788
(60,1; 80] sq.m 6 723 5 618 6 762 5 602 6 759 5 455 6 742 5 642 6 781 5 776
> 80,1 sq.m 6 967 6 264 7 205 5 763 6 970 5 845 6 694 5 421 6 987 6 314
av erage of f er price dev iation 17,7% x 17,5% x 16,1% x 14,7% x 15,8% x
<= 40 sq.m 21,9% x 20,1% x 17,0% x 16,5% x 19,8% x
(40,1; 60] sq.m 15,2% x 15,0% x 17,7% x 16,9% x 17,5% x
(60,1; 80] sq.m 19,7% x 20,7% x 23,9% x 19,5% x 17,4% x
> 80,1 sq.m 11,2% x 25,0% x 19,2% x 23,5% x 10,7% x
II Q 2016 III Q 2016 IV Q 2016 I Q 2017 II Q 2017 r.specif ication

Report on housing prices and the situation in the residential and commercial real estate market in Poland in 2017 Q2.
Narodowy Bank Polski
31
Table 8 Average prices of housing per square metre in the primary market in Łódź
Source: NBP.
Figure 9 Average prices of housing per square metre in the secondary market in Łódź
Source: NBP.
of f er trans. of f er trans. of f er trans. of f er trans. of f er trans.
av erage price (PLN/sq.m.) 4 894 4 646 4 900 4 727 5 110 4 850 4 943 4 792 5 180 4 940
growth (q-o-q) 102,5 98,1 100,1 101,7 104,3 102,6 96,7 98,8 104,8 103,1
growth (y -o-y ) 99,8 99,1 100,4 101,1 105,8 103,3 103,6 101,1 105,8 106,3
dwellings price range 1 475 262 1 306 165 1 794 233 1 138 316 1 394 237
<=4 000 PLN/sq.m 11 15 1 3 1 4 3 4 2 0
( 4 001; 4 500] PLN/sq.m 270 96 365 63 170 66 151 77 141 43
(4 501; 5 000] PLN/sq.m 559 100 424 55 742 83 509 127 418 95
(5 001; 5 500] PLN/sq.m 570 39 460 29 543 50 310 91 467 63
(5 501; 6 000] PLN/sq.m 55 9 47 15 214 21 140 15 257 31
> 6 001 PLN/sq.m 10 3 9 0 124 9 25 2 109 5
dwellings space range 1 475 262 1 306 165 1 794 233 1 138 316 1 394 237
<= 40 sq.m 130 28 124 26 158 38 87 38 143 51
(40,1; 60] sq.m 679 115 614 85 830 109 508 174 658 118
(60,1; 80] sq.m 536 94 448 41 641 73 404 83 459 50
> 80,1 sq.m 130 25 120 13 165 13 139 21 134 18
av erage price of 1 sq.m.
of dwelling4 894 4 646 4 900 4 727 5 110 4 850 4 943 4 792 5 180 4 940
<=4 000 sq.m 4 904 4 907 4 822 4 961 5 042 4 934 4 942 4 851 5 284 5 069
(40,1; 60] sq.m 4 939 4 776 4 929 4 755 5 107 4 789 4 942 4 780 5 189 4 884
(60,1; 80] sq.m 4 829 4 462 4 857 4 581 5 089 4 935 4 914 4 791 5 142 4 829
> 80,1 sq.m 4 922 4 445 4 992 4 534 5 271 4 640 5 028 4 782 5 157 5 248
av erage of f er price dev iation 5,3% x 3,7% x 5,4% x 3,2% x 4,9% x
<= 40 sq.m -0,1% x -2,8% x 2,2% x 1,9% x 4,2% x
(40,1; 60] sq.m 3,4% x 3,7% x 6,6% x 3,4% x 6,3% x
(60,1; 80] sq.m 8,2% x 6,0% x 3,1% x 2,6% x 6,5% x
> 80,1 sq.m 10,7% x 10,1% x 13,6% x 5,1% x -1,7% x
III Q 2016 IV Q 2016 I Q 2017 II Q 2017 r.II Q 2016 specif ication
of f er trans. of f er trans. of f er trans. of f er trans. of f er trans.
av erage price (PLN/sq.m.) 4 009 3 347 4 036 3 284 4 096 3 417 4 149 3 509 4 203 3 582
growth (q-o-q) 101,8 102,1 100,7 98,1 101,5 104,0 101,3 102,7 102,6 104,8
growth (y -o-y ) 103,7 97,2 104,2 97,3 106,4 102,3 105,3 107,1 106,7 109,3
dwellings price range 1 197 110 968 86 1 006 95 932 127 842 131
<= 3 000 PLN/sq.m 182 24 131 25 115 27 107 30 84 27
(3 001; 3 500] PLN/sq.m 219 53 175 30 174 28 141 46 109 33
(3 501; 4 000] PLN/sq.m 318 23 251 19 251 22 226 28 210 38
(4 001; 4 500] PLN/sq.m 208 5 187 7 198 12 196 13 177 20
(4 500; 5 000] PLN/sq.m. 115 4 90 3 119 0 114 3 111 4
>j 5 001 PLN/sq.m 155 1 134 2 149 6 148 7 151 9
dwellings space range 1 197 110 968 86 1 006 95 932 127 842 131
<= 40 sq.m 215 44 168 30 170 27 149 40 123 39
(40,1; 60] sq.m 437 50 356 37 386 44 332 64 313 65
(60,1; 80] sq.m 253 9 195 9 207 12 201 16 167 15
> 80,1 sq.m 292 7 249 10 243 12 250 7 239 12
av erage price of 1 sq.m.
of dwelling4 009 3 347 4 036 3 284 4 096 3 417 4 149 3 509 4 203 3 588
<=4 000 sq.m 3 716 3 330 3 800 3 270 3 939 3 539 4 121 3 546 4 067 3 594
(40,1; 60] sq.m 3 974 3 462 4 004 3 257 4 087 3 496 4 077 3 581 4 138 3 607
(60,1; 80] sq.m 4 209 3 231 4 181 3 711 4 232 3 375 4 296 3 501 4 403 3 809
> 80,1 sq.m 4 104 2 777 4 127 3 045 4 106 2 892 4 144 2 653 4 220 3 193
av erage of f er price dev iation 19,8% x 22,9% x 19,9% x 18,2% x 17,3% x
<= 40 sq.m 11,6% x 16,2% x 11,3% x 16,2% x 13,2% x
(40,1; 60] sq.m 14,8% x 22,9% x 16,9% x 13,8% x 14,7% x
(60,1; 80] sq.m 30,3% x 12,7% x 25,4% x 22,7% x 15,6% x
> 80,1 sq.m 47,8% x 35,5% x 42,0% x 56,2% x 32,2% x
II Q 2016 III Q 2016 IV Q 2016 I Q 2017 II Q 2017 r.specif ication

Report on housing prices and the situation in the residential and commercial real estate market in Poland in 2017 Q2.
Narodowy Bank Polski 32
Table 10 Average prices of housing per square metre in the primary market in Poznań
Source: NBP.
Figure 11 Average prices of housing per square metre in the secondary market in Poznań
Source: NBP.
of f er trans. of f er trans. of f er trans. of f er trans. of f er trans.
av erage price (PLN/sq.m.) 6 458 6 298 6 453 6 195 6 403 6 304 6 428 6 266 6 435 6 261
growth (q-o-q) 100,5 100,8 99,9 98,4 99,2 101,8 100,4 99,40 100,1 99,9
growth (y -o-y ) 98,9 101,4 99,5 99,5 98,3 101,1 100,1 100,3 99,7 99,4
dwellings price range 4 308 889 4 366 935 4 462 1 236 4 432 1 115 4 338 1 376
<=4 000 PLN/sq.m 3 3 1 3 2 11 1 11
( 4 001; 6 000] PLN/sq.m 1 448 423 1 588 516 1 560 566 1 554 529 1 522 603
( 6 001; 8 000] PLN/sq.m 2 547 418 2 488 369 2 654 616 2 601 543 2 578 746
(8 001; 10 000] PLN/sq.m 272 44 230 46 192 48 222 38 185 23
>10 001 PLN/sq.m 38 1 59 1 54 6 44 4 42 4
dwellings space range 4 308 889 4 366 935 4 462 1 236 4 432 1 115 4 338 1 376
<= 40 sq.m 782 234 826 248 799 391 664 325 644 332
(40,1; 60] sq.m 2352 452 2367 485 2475 568 2532 571 2551 755
(60,1; 80] sq.m 905 141 938 154 936 223 944 175 875 231
> 80,1 sq.m 269 62 235 48 252 54 292 44 268 58
av erage price of 1 sq.m.
of dwelling6 458 6 298 6 453 6 195 6 403 6 304 6 428 6 266 6 435 6 261
<=4 000 sq.m 6 587 6 290 6 738 6 203 6 692 6 441 6 700 6 313 6 704 6 479
(40,1; 60] sq.m 6 412 6 311 6 391 6 209 6 332 6 258 6 366 6 236 6 380 6 206
(60,1; 80] sq.m 6 386 6 352 6 327 6 110 6 306 6 157 6 380 6 229 6 385 6 152
> 80,1 sq.m 6 719 6 103 6 578 6 290 6 536 6 398 6 511 6 469 6 481 6 168
av erage of f er price dev iation 2,5% x 4,2% x 1,6% x 2,6% x 2,8% x
<= 40 sq.m 4,7% x 8,6% x 3,9% x 6,1% x 3,5% x
(40,1; 60] sq.m 1,6% x 2,9% x 1,2% x 2,1% x 2,8% x
(60,1; 80] sq.m 0,5% x 3,5% x 2,4% x 2,4% x 3,8% x
> 80,1 sq.m 10,1% x 4,6% x 2,2% x 0,6% x 5,1% x
III Q 2016 IV Q 2016 I Q 2017 II Q 2017 r.II Q 2016 specif ication
of f er trans. of f er trans. of f er trans. of f er trans. of f er trans.
av erage price (PLN/sq.m.) 6 040 5 177 6 093 5 236 6 123 5 282 5 966 5 158 6 081 5 266
growth (q-o-q) 101,7 102,2 100,9 101,2 100,5 100,9 97,4 97,7 101,9 102,1
growth (y -o-y ) 103,6 103,8 112,6 102,7 106,9 104,4 100,5 101,8 100,7 101,7
dwellings price range 619 956 865 939 950 839 654 753 742 429
<=4 000 PLN/sq.m 35 98 41 86 38 98 37 81 35 30
( 4 001; 6 000] PLN/sq.m 332 674 467 658 498 559 359 530 403 314
( 6 001; 8 000] PLN/sq.m 189 174 262 185 315 166 191 123 221 81
(8 001; 10 000] PLN/sq.m 48 7 69 10 77 15 56 17 63 4
>10 001 PLN/sq.m 15 3 26 22 1 11 2 20 0
dwellings space range 619 956 865 939 950 840 651 753 742 429
<= 40 sq.m 113 257 151 294 172 252 99 205 113 133
(40,1; 60] sq.m 214 436 299 430 348 369 237 336 278 187
(60,1; 80] sq.m 161 197 222 158 240 164 169 160 182 95
> 80,1 sq.m 131 66 193 57 190 55 146 52 169 14
av erage price of 1 sq.m.
of dwelling 6040 5177 6093 5236 6123 5282 5966 5158 6081 5266
<=4 000 sq.m 6405 5672 6686 5575 6665 5755 6599 5579 6690 5728
(40,1; 60] sq.m 6163 5159 6240 5222 6240 5303 6151 5263 6176 5205
(60,1; 80] sq.m 5732 4777 5785 4854 5785 4820 5638 4650 5799 4842
> 80,1 sq.m 5906 4559 5754 4663 5843 4345 5615 4385 5821 4564
av erage of f er price dev iation 16,7% x 16,4% x 15,9% x 15,7% x 15,5% x
<= 40 sq.m 12,9% x 19,9% x 15,8% x 18,3% x 16,8% x
(40,1; 60] sq.m 19,5% x 19,5% x 17,7% x 16,9% x 18,7% x
(60,1; 80] sq.m 20,0% x 19,2% x 20,0% x 21,3% x 19,8% x
> 80,1 sq.m 29,5% x 23,4% x 34,5% x 28,0% x 27,5% x
II Q 2016 III Q 2016 IV Q 2016 I Q 2017 II Q 2017 r.specif ication
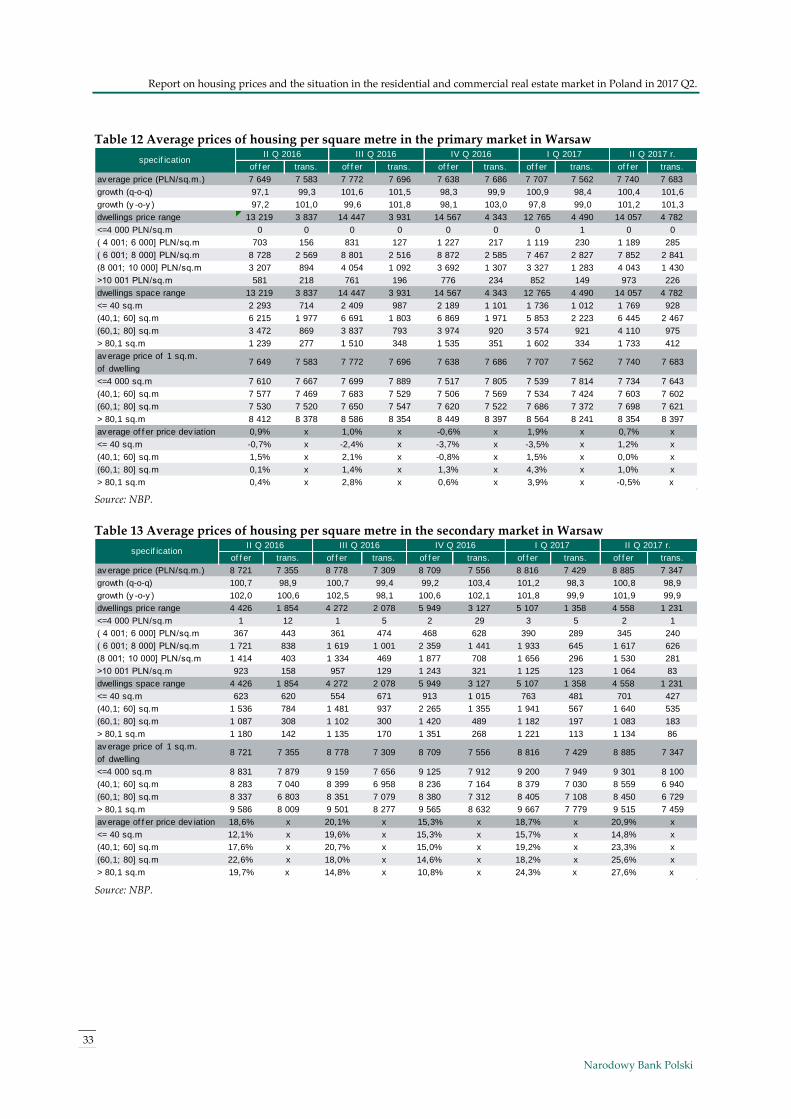
Report on housing prices and the situation in the residential and commercial real estate market in Poland in 2017 Q2.
Narodowy Bank Polski
33
Table 12 Average prices of housing per square metre in the primary market in Warsaw
Source: NBP.
Table 13 Average prices of housing per square metre in the secondary market in Warsaw
Source: NBP.
of f er trans. of f er trans. of f er trans. of f er trans. of f er trans.
av erage price (PLN/sq.m.) 7 649 7 583 7 772 7 696 7 638 7 686 7 707 7 562 7 740 7 683
growth (q-o-q) 97,1 99,3 101,6 101,5 98,3 99,9 100,9 98,4 100,4 101,6
growth (y -o-y ) 97,2 101,0 99,6 101,8 98,1 103,0 97,8 99,0 101,2 101,3
dwellings price range 13 219 3 837 14 447 3 931 14 567 4 343 12 765 4 490 14 057 4 782
<=4 000 PLN/sq.m 0 0 0 0 0 0 0 1 0 0
( 4 001; 6 000] PLN/sq.m 703 156 831 127 1 227 217 1 119 230 1 189 285
( 6 001; 8 000] PLN/sq.m 8 728 2 569 8 801 2 516 8 872 2 585 7 467 2 827 7 852 2 841
(8 001; 10 000] PLN/sq.m 3 207 894 4 054 1 092 3 692 1 307 3 327 1 283 4 043 1 430
>10 001 PLN/sq.m 581 218 761 196 776 234 852 149 973 226
dwellings space range 13 219 3 837 14 447 3 931 14 567 4 343 12 765 4 490 14 057 4 782
<= 40 sq.m 2 293 714 2 409 987 2 189 1 101 1 736 1 012 1 769 928
(40,1; 60] sq.m 6 215 1 977 6 691 1 803 6 869 1 971 5 853 2 223 6 445 2 467
(60,1; 80] sq.m 3 472 869 3 837 793 3 974 920 3 574 921 4 110 975
> 80,1 sq.m 1 239 277 1 510 348 1 535 351 1 602 334 1 733 412
av erage price of 1 sq.m.
of dwelling7 649 7 583 7 772 7 696 7 638 7 686 7 707 7 562 7 740 7 683
<=4 000 sq.m 7 610 7 667 7 699 7 889 7 517 7 805 7 539 7 814 7 734 7 643
(40,1; 60] sq.m 7 577 7 469 7 683 7 529 7 506 7 569 7 534 7 424 7 603 7 602
(60,1; 80] sq.m 7 530 7 520 7 650 7 547 7 620 7 522 7 686 7 372 7 698 7 621
> 80,1 sq.m 8 412 8 378 8 586 8 354 8 449 8 397 8 564 8 241 8 354 8 397
av erage of f er price dev iation 0,9% x 1,0% x -0,6% x 1,9% x 0,7% x
<= 40 sq.m -0,7% x -2,4% x -3,7% x -3,5% x 1,2% x
(40,1; 60] sq.m 1,5% x 2,1% x -0,8% x 1,5% x 0,0% x
(60,1; 80] sq.m 0,1% x 1,4% x 1,3% x 4,3% x 1,0% x
> 80,1 sq.m 0,4% x 2,8% x 0,6% x 3,9% x -0,5% x
II Q 2016 specif ication
III Q 2016 IV Q 2016 I Q 2017 II Q 2017 r.
of f er trans. of f er trans. of f er trans. of f er trans. of f er trans.
av erage price (PLN/sq.m.) 8 721 7 355 8 778 7 309 8 709 7 556 8 816 7 429 8 885 7 347
growth (q-o-q) 100,7 98,9 100,7 99,4 99,2 103,4 101,2 98,3 100,8 98,9
growth (y -o-y ) 102,0 100,6 102,5 98,1 100,6 102,1 101,8 99,9 101,9 99,9
dwellings price range 4 426 1 854 4 272 2 078 5 949 3 127 5 107 1 358 4 558 1 231
<=4 000 PLN/sq.m 1 12 1 5 2 29 3 5 2 1
( 4 001; 6 000] PLN/sq.m 367 443 361 474 468 628 390 289 345 240
( 6 001; 8 000] PLN/sq.m 1 721 838 1 619 1 001 2 359 1 441 1 933 645 1 617 626
(8 001; 10 000] PLN/sq.m 1 414 403 1 334 469 1 877 708 1 656 296 1 530 281
>10 001 PLN/sq.m 923 158 957 129 1 243 321 1 125 123 1 064 83
dwellings space range 4 426 1 854 4 272 2 078 5 949 3 127 5 107 1 358 4 558 1 231
<= 40 sq.m 623 620 554 671 913 1 015 763 481 701 427
(40,1; 60] sq.m 1 536 784 1 481 937 2 265 1 355 1 941 567 1 640 535
(60,1; 80] sq.m 1 087 308 1 102 300 1 420 489 1 182 197 1 083 183
> 80,1 sq.m 1 180 142 1 135 170 1 351 268 1 221 113 1 134 86
av erage price of 1 sq.m.
of dwelling8 721 7 355 8 778 7 309 8 709 7 556 8 816 7 429 8 885 7 347
<=4 000 sq.m 8 831 7 879 9 159 7 656 9 125 7 912 9 200 7 949 9 301 8 100
(40,1; 60] sq.m 8 283 7 040 8 399 6 958 8 236 7 164 8 379 7 030 8 559 6 940
(60,1; 80] sq.m 8 337 6 803 8 351 7 079 8 380 7 312 8 405 7 108 8 450 6 729
> 80,1 sq.m 9 586 8 009 9 501 8 277 9 565 8 632 9 667 7 779 9 515 7 459
av erage of f er price dev iation 18,6% x 20,1% x 15,3% x 18,7% x 20,9% x
<= 40 sq.m 12,1% x 19,6% x 15,3% x 15,7% x 14,8% x
(40,1; 60] sq.m 17,6% x 20,7% x 15,0% x 19,2% x 23,3% x
(60,1; 80] sq.m 22,6% x 18,0% x 14,6% x 18,2% x 25,6% x
> 80,1 sq.m 19,7% x 14,8% x 10,8% x 24,3% x 27,6% x
specif ication II Q 2016 III Q 2016 IV Q 2016 I Q 2017 II Q 2017 r.

Report on housing prices and the situation in the residential and commercial real estate market in Poland in 2017 Q2.
Narodowy Bank Polski 34
Figure 14 Average prices of housing per square metre in the primary market in Wrocław
Source: NBP.
Table 15 Average prices of housing per square metre in the secondary market in Wrocław
Source: NBP
of f er trans. of f er trans. of f er trans. of f er trans. of f er trans.
av erage price (PLN/sq.m.) 6 201 6 228 6 335 6 162 6 443 6 163 6 460 6 136 6 461 6 314
growth (q-o-q) 100,2 103,3 102,2 98,9 101,7 100,0 100,3 99,6 100,0 102,9
growth (y -o-y ) 102,0 102,6 103,3 102,0 103,2 100,7 104,4 101,8 104,2 101,4
dwellings price range 5 097 1 306 5 570 1 355 5 266 1 719 5 296 1 585 5 584 1 850
<=4 000 PLN/sq.m 0 10 0 28 0 15 0 0 2 3
( 4 001; 6 000] 2 292 646 2 380 567 2 161 809 2 370 756 2 431 817
( 6 001; 8 000] 2 504 526 2 645 693 2 505 773 2 259 736 2 501 868
(8 001; 10 000] 274 101 442 62 393 98 431 64 415 110
>10 001 PLN/sq.m 27 23 103 5 207 24 236 29 235 52
dwellings space range 5 097 1 306 5 570 1 355 5 266 1 719 5 296 1 585 5 584 1 850
<= 40 sq.m 629 275 678 366 597 360 735 270 734 428
(40,1; 60] sq.m 2703 753 2948 673 2837 939 2750 919 2884 980
(60,1; 80] sq.m 1414 237 1568 252 1474 366 1491 330 1626 363
> 80,1 sq.m 351 41 376 64 358 54 320 66 340 79
av erage price of 1 sq.m.
of dwelling6 201 6 228 6 335 6 162 6 443 6 163 6 460 6 136 6 461 6 314
<=4 000 sq.m 6374 6867 6671 6469 7027 6642 7190 6351 7431 6718
(40,1; 60] sq.m 6106 6096 6231 6027 6337 6038 6304 6112 6387 6192
(60,1; 80] sq.m 6180 5938 6271 6041 6296 5951 6293 5910 6133 6103
> 80,1 sq.m 6711 6054 6807 6304 6923 6581 6901 6715 6559 6620
av erage of f er price -0,4% x 2,8% x 4,5% x 5,3% x 2,3% x
<= 40 sq.m -7,2% x 3,1% x 5,8% x 13,2% x 10,6% x
(40,1; 60] sq.m 0,2% x 3,4% x 4,9% x 3,1% x 3,2% x
(60,1; 80] sq.m 4,1% x 3,8% x 5,8% x 6,5% x 0,5% x
> 80,1 sq.m 10,8% x 8,0% x 5,2% x 2,8% x -0,9% x
specif ication II Q 2016 III Q 2016 IV Q 2016 I Q 2017 II Q 2017 r.
of f er trans. of f er trans. of f er trans. of f er trans. of f er trans.
av erage price (PLN/sq.m.) 5 984 5 201 6 062 5 332 6 165 5 480 6 253 5 390 6 267 5 445
growth (q-o-q) 100,6 99,7 101,3 102,5 101,7 102,8 101,4 98,4 100,2 101,0
growth (y -o-y ) 103,0 101,7 102,2 101,3 104,2 105,9 105,1 103,3 104,7 104,7
dwellings price range 1 524 529 1 098 481 1 128 374 1 221 321 1 501 267
<=4 000 PLN/sq.m 44 65 29 44 23 27 25 29 33 23
( 4 001; 6 000] PLN/sq.m 827 354 585 323 569 239 591 197 745 167
( 6 001; 8 000] PLN/sq.m 554 101 398 104 438 97 488 89 572 73
(8 001; 10 000] PLN/sq.m 68 8 61 7 69 10 79 6 99 3
>10 001 PLN/sq.m 31 1 25 3 29 1 38 52 1
dwellings space range 1 524 992 1 443 647 1 128 374 1 221 321 1 501 267
<= 40 sq.m 218 565 481 260 171 77 176 61 208 47
(40,1; 60] sq.m 565 240 423 231 442 169 478 149 580 117
(60,1; 80] sq.m 481 146 335 115 326 87 363 80 452 69
> 80,1 sq.m 260 41 204 41 189 41 204 31 261 34
av erage price of 1 sq.m.
of dwelling5 984 5 542 6 284 5 530 6 165 5 480 6 253 5 390 6 267 5 445
<=4 000 sq.m 6 802 5 931 6 989 6 105 7 069 6 171 7 260 5 814 7 182 6 371
(40,1; 60] sq.m 6 105 5 244 6 118 5 335 6 171 5 355 6 254 5 455 6 341 5 379
(60,1; 80] sq.m 5 767 4 830 5 898 5 001 5 902 5 317 5 979 5 118 6 013 5 196
> 80,1 sq.m 5 434 4 453 5 600 4 473 5 786 5 045 5 871 4 953 5 812 4 895
av erage of f er price 15,1% x 13,7% x 12,5% x 16,0% x 15,1% x
<= 40 sq.m 14,7% x 14,5% x 14,6% x 24,9% x 12,7% x
(40,1; 60] sq.m 16,4% x 14,7% x 15,2% x 14,7% x 17,9% x
(60,1; 80] sq.m 19,4% x 17,9% x 11,0% x 16,8% x 15,7% x
> 80,1 sq.m 22,0% x 25,2% x 14,7% x 18,5% x 18,7% x
II Q 2016 specif ication
III Q 2016 IV Q 2016 I Q 2017 II Q 2017 r.

www.nbp.pl