september 26, 2012 - national transportation safety board
TRANSCRIPT
NTSB General
Aviation Focus
Earl F. Weener, Ph.D.
Board Member
17th Annual General
Aviation Air Safety
Investigator Technical
Workshop
September 26, 2012

2
NTSB “Air Force”
• Built/Restored or Building/Restoring* • Sheryl Chappell: Cessna 180 Floatplane
• John Clark (EAA #603773): Schreder RS-15, Vans RV-9A, Vans RV-12
• Paul Cox: Beech Bonanza G33, Vans RV-8a (Building)
• Dennis Crider (EAA #1041658): Vans RV-12
• Dennis Diaz (EAA #1047382): Vans RV-7a
• Craig Hatch (EAA #659495): Vans RV-8a, Cessna 140
• Tom Haueter (EAA #251921): 1943 Stearman, 1934 Lockheed Altair
• Tim LeBaron (EAA #454270): Piper J-3, Breezy (experimental), Pober Jr. Ace,
1941 Piper J5A, 1946 Cessna 120, 1975 Cessna 150, 1946 Ercoupe, Vans RV-4,
1947 Piper PA-11 Cub Special
• Larry Lewis (EAA #751909): Varga Kachina 2150A, Vans RV-8
• Ron Price: 1972 McCollough J2, Long EZ
• Eliott Simpson: Vans RV-7, Pietenpol Aircamper
• Bob Swaim (EAA #221919): 1974 Beech Sport, 1947 Cessna 140, 1967 Cessna
150, 1941 Stinson 10A, Kitfox
• * At least one airplane listed was built/restored or is in the process of being
built/restored.

3
NTSB “Air Force”
• Own (Not Built/Restored) • Member Earl Weener (EAA #727429): Beech Bonanza B36TC
• Kurt Anderson: Navion, Aeronca 11AC, Cessna 170A
• Tim Burtch (EAA #1078661): Cessna 172
• John Brannen: Sonerai IIL
• Evan Byrne: Cessna 172
• Jill Demko: PA-22-108 Piper Colt
• J. Michael Duncan: Beech Bonanza V35B
• Kristi Dunks (EAA #689578): 1955 Piper Super Cub
• Catherine Gagne (EAA #646357): 1956 Beech Bonanza G35
• Craig Hatch: Cessna 170a
• Mike Huhn: Cessna 182
• Judge William Mullins: Vans RV-8a
• Jose Obregon: Cessna 172
• Jim Ritter: Piper Comanche
• Chris Stephens (EAA #689593): Piper Comanche
4
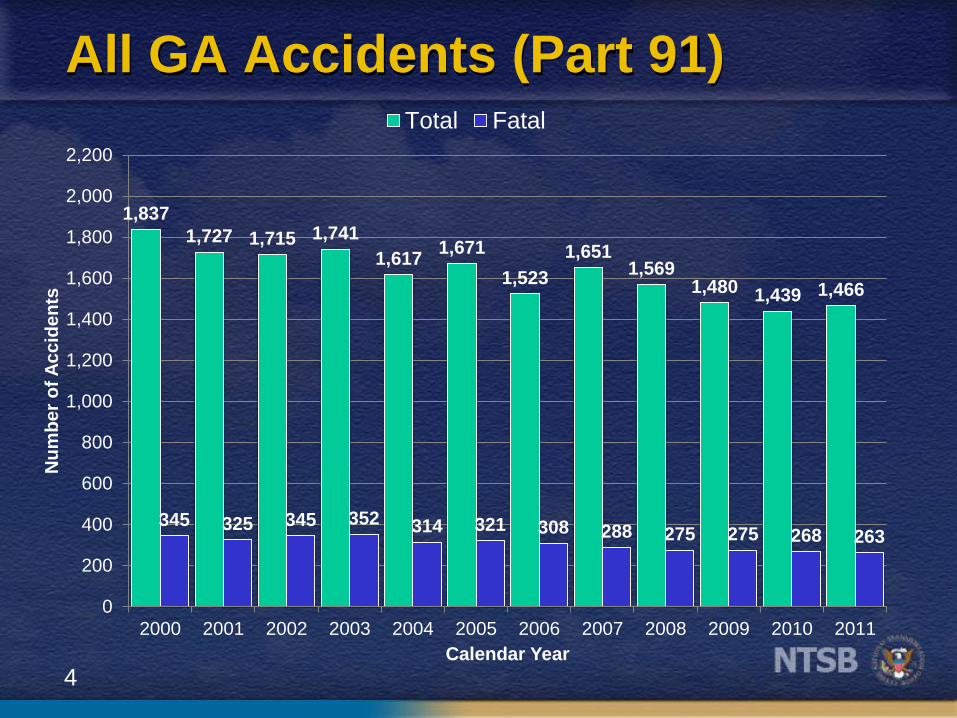
All GA Accidents (Part 91)
1,837
1,727 1,715 1,741
1,617 1,671
1,523
1,651 1,569
1,480 1,439 1,466
345 325 345 352 314 321 308 288 275 275 268 263
0
200
400
600
800
1,000
1,200
1,400
1,600
1,800
2,000
2,200
2000 2001 2002 2003 2004 2005 2006 2007 2008 2009 2010 2011
Nu
mb
er
of
Ac
cid
en
ts
Calendar Year
Total Fatal

5
GA Accident-involved Fatalities
0
100
200
300
400
500
600
700
800
2000 2001 2002 2003 2004 2005 2006 2007 2008 2009 2010 2011
To
tal F
ata
liti
es
Calendar Year
GA Accident-Involved Fatalities

6
GA Accident Rates
0
1
2
3
4
5
6
7
8
2000 2001 2002 2003 2004 2005 2006 2007 2008 2009 2010 2011
Ac
cid
en
ts p
er
10
0,0
00
Fli
gh
t H
ou
rs
Calendar Year
Total Fatal
7
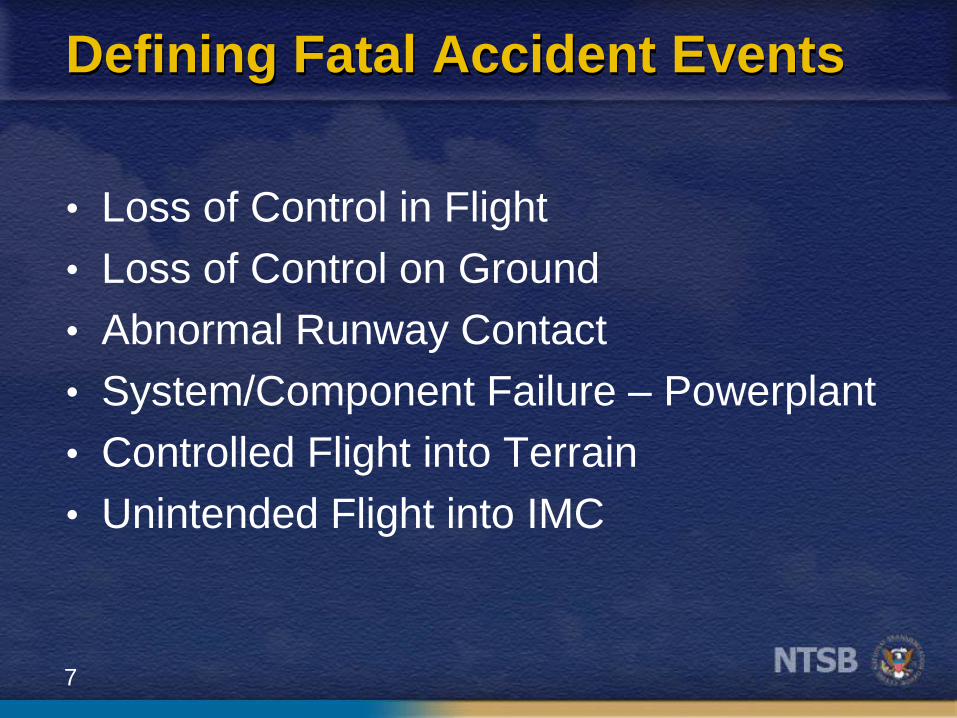
Defining Fatal Accident Events
• Loss of Control in Flight
• Loss of Control on Ground
• Abnormal Runway Contact
• System/Component Failure – Powerplant
• Controlled Flight into Terrain
• Unintended Flight into IMC

8
Accident Rates per 100k Flight Hours
0.00
2.00
4.00
6.00
8.00
10.00
12.00
14.00
2000 2001 2002 2003 2004 2005 2006 2007 2008 2009 2010
Ac
cid
en
t R
ate
s p
er
10
0k
ho
urs
Accident Rates per 100k Flight Hours 2000-2010
All GA
Corporate
Business
Instructional
Personal

9
Fatal Accident Rates per 100k Flight Hours
0
1
2
3
2000 2001 2002 2003 2004 2005 2006 2007 2008 2009 2010
Fa
tal A
cc
ide
nts
pe
r 1
00
k h
ou
rs
Fatal Accident Rates per 100k Flight Hours 2000-2010
All GA
Corporate
Business
Instructional
Personal

10
Business Flying, 2007-2009 All accidents – Loss of control (in-flight or on the ground) accounted for the
largest portion, followed by system/component failures.
Fatal accidents - Loss of control in-flight, followed by controlled flight into
terrain, CFIT.
0
0
1
2
4
5
12
0 2 4 6 8 10 12 14
Loss of Control on Ground
System/Component Failure - Non-Powerplant
Fuel Management
System/Component Failure - Powerplant
Collision on Takeoff or Landing
Controlled Flight into Terrain
Loss of Control in Flight
Number of Fatal Accidents

11
25
25
78
88
116
122
0 20 40 60 80 100 120 140
Collision on Takeoff or Landing
System/Component Failure - Non-Powerplant
System/Component Failure - Powerplant
Loss of Control in Flight
Abnormal Runway Contact
Loss of Control on Ground
Number of Fatal Accidents
All Accidents - Loss of control on the ground or in-flight and abnormal runway
contact accounted for the great majority of defining accident events.
Fatal Accidents – Loss of Control on Ground, followed by Abnormal Runway
Contact
Instructional Flying, 2007-2009
12
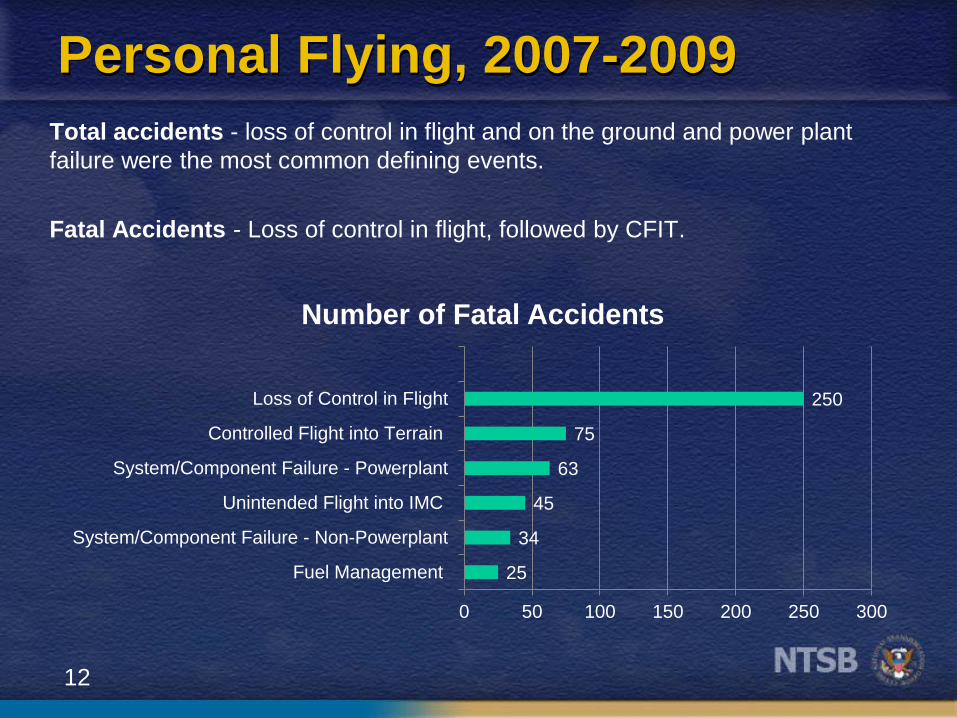
Personal Flying, 2007-2009
25
34
45
63
75
250
0 50 100 150 200 250 300
Fuel Management
System/Component Failure - Non-Powerplant
Unintended Flight into IMC
System/Component Failure - Powerplant
Controlled Flight into Terrain
Loss of Control in Flight
Number of Fatal Accidents
Total accidents - loss of control in flight and on the ground and power plant
failure were the most common defining events.
Fatal Accidents - Loss of control in flight, followed by CFIT.
13
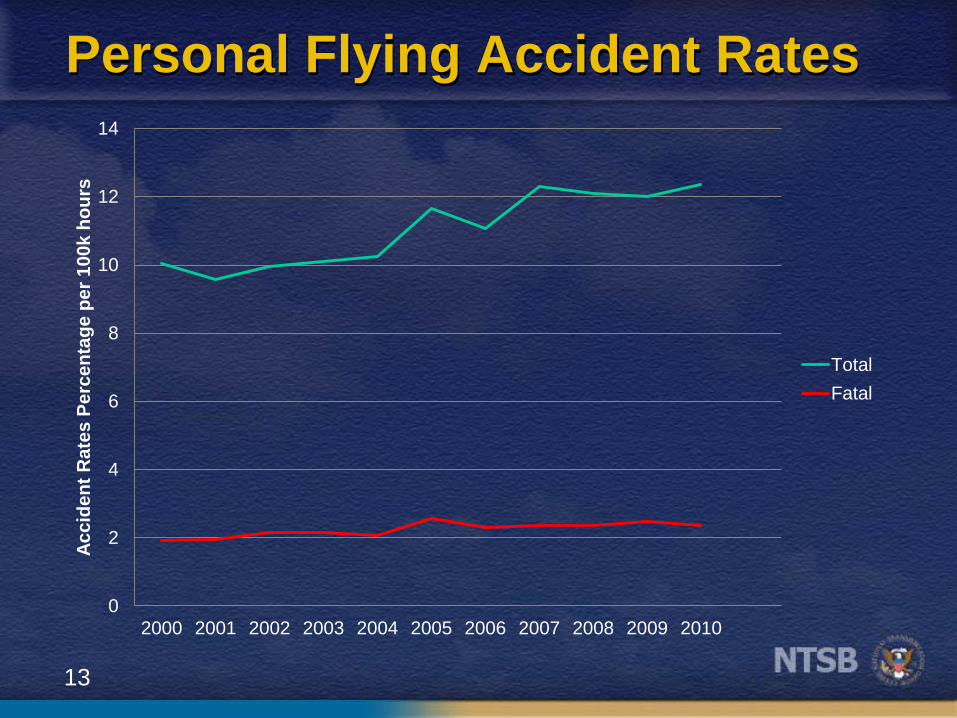
Personal Flying Accident Rates
0
2
4
6
8
10
12
14
2000 2001 2002 2003 2004 2005 2006 2007 2008 2009 2010
Ac
cid
en
t R
ate
s P
erc
en
tag
e p
er
10
0k
ho
urs
Total
Fatal

14
NTSB Outreach
• NTSB Most Wanted List
• EAA AirVenture - Oshkosh 2011
• EAA AirVenture - Oshkosh 2012
• Sun ‘n Fun 2012
• GA JSC Participation
• EAA Sport Aviation Magazine Article on NTSB
• AirVenture - Association Presidents Meeting 2011 &
2012
• Forum - GA Safety – Climbing to the Next Level
• Forum - GA Search & Rescue
• Experimental Amateur Built Safety Study
Take safety messages to pilots and industry
15
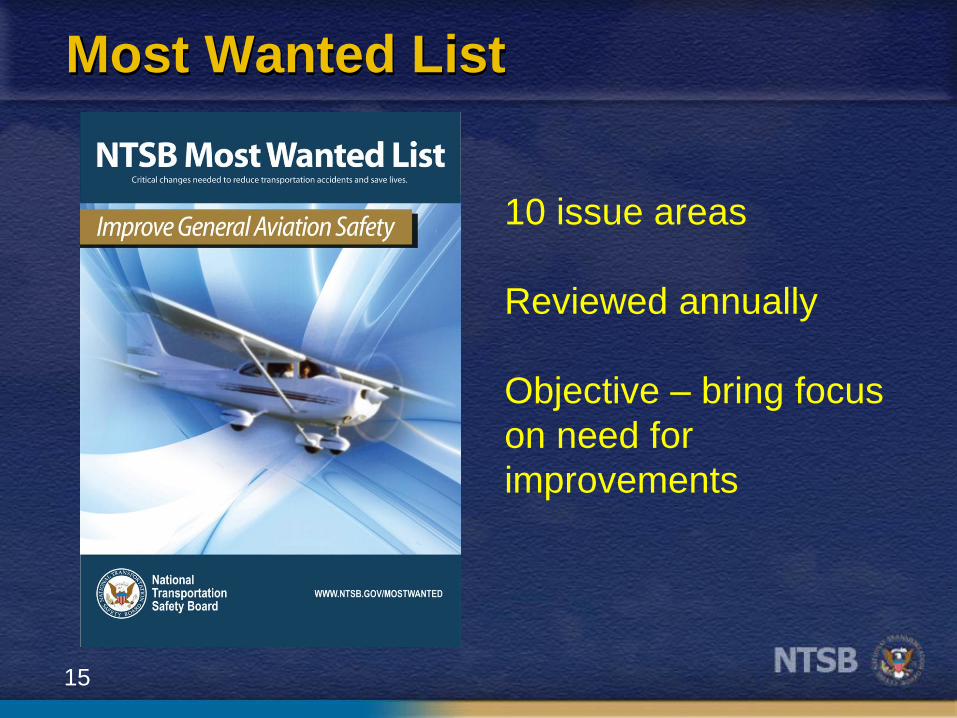
Most Wanted List
10 issue areas
Reviewed annually
Objective – bring focus
on need for
improvements

16
NTSB Most Wanted List
• General Aviation Safety
• Runway Safety
• Bus Occupant Safety
• Safety Management Systems
• Recorders
• Teen Driver Safety
• Human Fatigue
• Alcohol-Impaired Driving
• Motorcycle Safety
• Pilot and Air Traffic Controller Professionalism

17
Why GA on the Most Wanted List?
• NTSB investigates approximately 1500 GA
accidents per year
• Overall GA accident rate flat
– Has not improved over the last ten years
– Air carrier accident rate decreased almost 80%
• Personal flying accident rate
– Increased 20% over last 10 years
– Fatal rate increased 25% over that period
• GA Personal flying safety needs attention
18

19
Safety Forum Agenda
• Panel 1 – Safety Priorities
– NASA, GA-JSC, FAA
• Panel 2 – Safety Programs
– ABS, AVEMCO Insurance, AOPA, FAA (Wings
Program)
• Panel 3 – Role of the Flight Instructor
– SAFE, NAFI, FAA, UND, IAFTP
• Panel 4 – Content, Quality & Consistency
of Pilot Training
– FAA, ASA, Red Bird Simulators, SAFE, ERAU
20
Safety Forum Agenda (cont’d)
• Panel 5 – Weather Related Decision-Making
– FAA, Baron Services, ERAU, CAMI, Independent
Aviation Safety Speaker, FAA
• Panel 6 – Aircraft Maintenance and
Modification
– FAA, EAA/VAA, Middle TSU, PAMA
• Panel 7 – New Aircraft Design and
Certification
– FAA, GAMA, Cirrus, AOPA, ICON Aircraft
• Panel 8 – Advanced Avionics and
Handhelds
– GAMA, AOPA, NASA, ERAU
21
22
SAR Forum Agenda
• Panel 1 – National SAR System Overview
– NOAA, NSARC, USCG
• Panel 2 – National SAR Policy
– FAA, FCC, AOPA
• Panel 3 – Operational Issues
– FAA, AFRCC, CAP, State SAR Coordinators
Council

23
SAR Forum Agenda (cont’d)
• Panel 4 – Technical Issues
– AEA, FCC, ACR Electronics, EBC, ACK, FAA
• Panel 5 – Emerging Technologies
– RTCM, DeLorme, Globalstar, Spidertracks, FAA,
USFS, CTIA
• Panel 6 – The Future of GA SAR
– USAF, USCG, Equipped to Survive Foundation,
AFRCC

Special Study
The Safety of Experimental Amateur-
Built Aircraft (E-AB)

25
Accident rates of E-AB aircraft
21.17
9.49
0
5
10
15
20
25
30
Accid
en
ts p
er
10
0,0
00
Flig
ht H
ou
rs
Calendar Year
Accident Rate per 100,000 Flight Hours, 2001-2010
E-AB total Non-E-AB total

26
5.27
1.56
0
1
2
3
4
5
6
7
8
9
10
Accid
en
ts p
er
10
0,0
00
Flig
ht
Ho
urs
Calendar Year
Fatal Accident Rates per 100,000 Flight Hours, 2001-2010
E-AB fatal Non-E-AB fatal
Accident rates of E-AB aircraft

27
E-AB Kits
Quick-Build Kit Standard Kit

28
The Research Questions
• What are the circumstances and causes of E-
AB accidents?
• What are the characteristics of the population
of E-AB builders, pilots and aircraft?
• Are There Ways to Mitigate the E-AB Accident
Risk?

29
The Data Sources
• Retrospective E-AB & Non-EAB Accident and Exposure Data: 2001 – 2010
• Prospective In-Depth Accident Data: 2011
• The EAA Survey of E-AB Owners and Builders: 2011
• Interviews/discussions with EAA officials, FAA officials, manufacturers, type clubs, and builders.

30
The Major Issues Identified
• Accidents Early in the Life of the
Aircraft and on the First Flight
• Power-Plant Failures and Loss of
Control In Flight
• Aircraft Registry and Accident
Records

31
Most Frequent Kit Makes and Models
0 50 100 150 200 250 300
Van's RV-3Van's RV-4Van's RV-6
Van's RV-6A
Van's RV-7Van's RV-7A
Van's RV-8Van's RV-8A
Van's RV-9
Van's RV-9AVan's RV-10Van's RV-12
Lancair 200/235/320/360
Lancair ESLancair LegacyLancair IV/IV-P
Lancair EvolutionGlasair I
Glasair IIGlasair III
GlaStarZenith Zodiac CH601/650
Zenith STOL CH701/750/801
Respondents
32
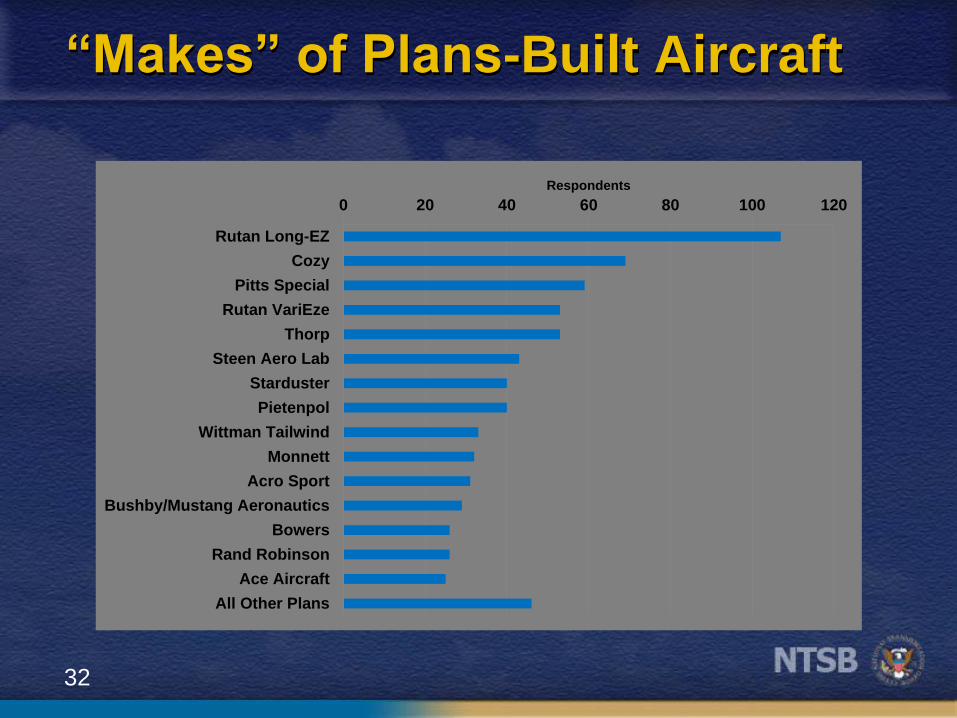
“Makes” of Plans-Built Aircraft
0 20 40 60 80 100 120
Rutan Long-EZ
Cozy
Pitts Special
Rutan VariEze
Thorp
Steen Aero Lab
Starduster
Pietenpol
Wittman Tailwind
Monnett
Acro Sport
Bushby/Mustang Aeronautics
Bowers
Rand Robinson
Ace Aircraft
All Other Plans
Respondents

33
E-AB Aircraft Accidents During
2011
• Most accident aircraft were
airplanes
– 212 airplanes, 2 gliders
4 helicopters, 9 gyroplanes
• Most were built from kits
– 166 kit-built, 58 plans-built,
3 original design

34
2011 Similar to Previous Decade
• Powerplant failures and loss of
control in flight most common
occurrences
• Loss of control most common fatal
accident occurrence
35
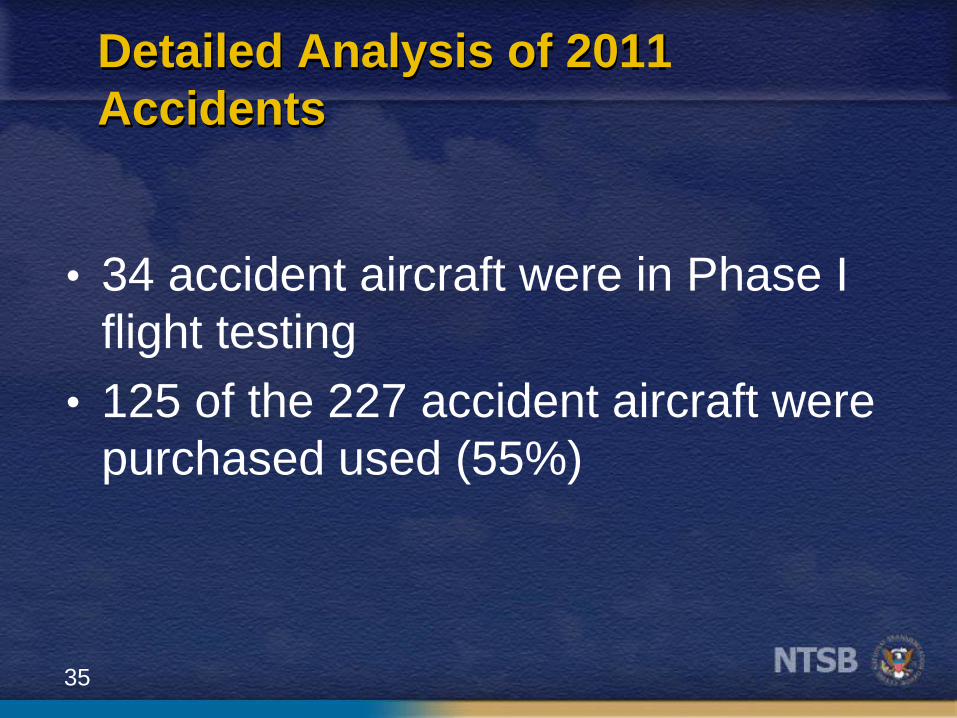
Detailed Analysis of 2011
Accidents
• 34 accident aircraft were in Phase I
flight testing
• 125 of the 227 accident aircraft were
purchased used (55%)

36

37
First Flight Accidents - 2011
• 10 of 102 accidents in newly-built
aircraft occurred during the first
flight
• 14 of 125 accidents in used aircraft
occurred during first flight after
being purchased

38